Next Issue
Volume 10, July
Previous Issue
Volume 10, May
 
 
remotesensing-logo

Journal Browser

Journal Browser

Remote Sens., Volume 10, Issue 6 (June 2018) – 171 articles

Cover Story (view full-size image): 
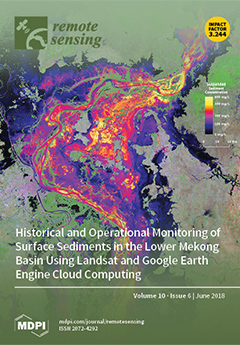
Land use change and reservoir construction alter sediment transport within rivers. These changes can impact river morphology and aquatic ecosystems. The integrity of the Lower Mekong Basin is crucial to surrounding countries for transportation, energy production, sustainable water supply, and food production. In response to this need, countries have developed regional scale water quality programs, but they are limited by point-based measurements. To augment in situ surface sediment concentrations (SSSC) data from the current monitoring program, an empirical model to estimate SSSC across the Lower Mekong Basin using decades of Landsat observations was developed. This operational model was implemented in Google Earth Engine and Google App Engine, allowing users, without any prior knowledge of remote sensing, to freely access and interpret sediment data across the region. View this paper.
  • Issues are regarded as officially published after their release is announced to the table of contents alert mailing list.
  • You may sign up for e-mail alerts to receive table of contents of newly released issues.
  • PDF is the official format for papers published in both, html and pdf forms. To view the papers in pdf format, click on the "PDF Full-text" link, and use the free Adobe Reader to open them.
Order results
Result details
Section
Select all
Export citation of selected articles as:

Research

Jump to: Review, Other

21 pages, 10751 KiB  
Article
Using Spatial Features to Reduce the Impact of Seasonality for Detecting Tropical Forest Changes from Landsat Time Series
by Eduarda M. O. Silveira, Inácio T. Bueno, Fausto W. Acerbi-Junior, José M. Mello, José Roberto S. Scolforo and Michael A. Wulder
Remote Sens. 2018, 10(6), 808; https://doi.org/10.3390/rs10060808 - 23 May 2018
Cited by 26 | Viewed by 6485
Abstract
In forested areas that experience strong seasonality and are undergoing rapid land cover conversion (e.g., Brazilian savannas), the accuracy of remote sensing change detection is affected by seasonal changes that are erroneously classified as having changed. To improve the quality and consistency of [...] Read more.
In forested areas that experience strong seasonality and are undergoing rapid land cover conversion (e.g., Brazilian savannas), the accuracy of remote sensing change detection is affected by seasonal changes that are erroneously classified as having changed. To improve the quality and consistency of regionally important forest change maps, we aim to separate process related change (for example, spectral variability due to phenology) from changes related to deforestations or fires. Seasonal models are typically used to account for seasonality, but fitting a model is difficult when there are insufficient data points in the time series. In this research, we utilize remotely sensed data and related spectral trends and the spatial context at the object level to evaluate the performance of geostatistical features to reduce the impact of seasonality from the NDVI (Normalized Difference Vegetation Index) of Landsat time series. The study area is the São Romão municipality, totaling 2440 km2, and is part of the Brazilian savannas biome. We first create image objects via multiresolution segmentation, basing the objects on the characteristics found in the first image (2003) of the 13-year time series. We intersected the objects with the NDVI images in order to extract semivariogram indices, the RVF (Ratio Variance—First lag) and AFM (Area First lag—First Maximum), and spectral information (average and standard deviation of NDVI values) to generate the time series from these features and to derive Spatio-Temporal Metrics (change and trend) to train a Random Forest (RF) algorithm. The NDVI spatial variability, captured by the AFM semivariogram index time series produced the best result, reaching 96.53% of the overall accuracy (OA) to separate no-change from forest change, while the greatest inter-class confusion occurred using the average of the NDVI values time series (OA = 63.72%). The spatial context approach we presented is a novel approach for the detection of forest change events that are subject to seasonality (and possible miss-classification of change) and mitigating the effects of forest phenology without the need for specific de-seasoning models. Full article
(This article belongs to the Section Forest Remote Sensing)
Show Figures

Graphical abstract

19 pages, 3382 KiB  
Article
Time-Series Multispectral Indices from Unmanned Aerial Vehicle Imagery Reveal Senescence Rate in Bread Wheat
by Muhammad Adeel Hassan, Mengjiao Yang, Awais Rasheed, Xiuliang Jin, Xianchun Xia, Yonggui Xiao and Zhonghu He
Remote Sens. 2018, 10(6), 809; https://doi.org/10.3390/rs10060809 - 23 May 2018
Cited by 140 | Viewed by 10606
Abstract
Detection of senescence’s dynamics in crop breeding is time consuming and needs considerable details regarding its rate of progression and intensity. Normalized difference red-edge index (NDREI) along with four other spectral vegetative indices (SVIs) derived from unmanned aerial vehicle (UAV) based spatial imagery, [...] Read more.
Detection of senescence’s dynamics in crop breeding is time consuming and needs considerable details regarding its rate of progression and intensity. Normalized difference red-edge index (NDREI) along with four other spectral vegetative indices (SVIs) derived from unmanned aerial vehicle (UAV) based spatial imagery, were evaluated for rapid and accurate prediction of senescence. For this, 32 selected winter wheat genotypes were planted under full and limited irrigation treatments. Significant variations for all five SVIs: green normalize difference vegetation index (GNDVI), simple ratio (SR), green chlorophyll index (GCI), red-edge chlorophyll index (RECI), and normalized difference red-edge index (NDREI) among genotypes and between treatments, were observed from heading to late grain filling stages. The SVIs showed strong relationship (R2 = 0.69 to 0.78) with handheld measurements of chlorophyll and leaf area index (LAI), while negatively correlated (R2 = 0.75 to 0.77) with canopy temperature (CT) across the treatments. NDREI as a new SVI showed higher correlations with ground data under both treatments, similarly as exhibited by other four SVIs. There were medium to strong correlations (r = 0.23–0.63) among SVIs, thousand grain weight (TGW) and grain yield (GY) under both treatments. Senescence rate was calculated by decreasing values of SVIs from their peak values at heading stage, while variance for senescence rate among genotypes and between treatments could be explained by SVIs variations. Under limited irrigation, 10% to 15% higher senescence rate was detected as compared with full irrigation. Principle component analysis corroborated the negative association of high senescence rate with TGW and GY. Some genotypes, such as Beijing 0045, Nongda 5181, and Zhongmai 175, were selected with low senescence rate, stable TGW and GY in both full and limited irrigation treatments, nearly in accordance with the actual performance of these cultivars in field. Thus, SVIs derived from UAV appeared as a promising tool for rapid and precise estimation of senescence rate at maturation stages. Full article
Show Figures

Graphical abstract

19 pages, 3760 KiB  
Article
Terrestrial Laser Scanning to Detect Liana Impact on Forest Structure
by Sruthi M. Krishna Moorthy, Kim Calders, Manfredo Di Porcia e Brugnera, Stefan A. Schnitzer and Hans Verbeeck
Remote Sens. 2018, 10(6), 810; https://doi.org/10.3390/rs10060810 - 23 May 2018
Cited by 12 | Viewed by 7337
Abstract
Tropical forests are currently experiencing large-scale structural changes, including an increase in liana abundance and biomass. Higher liana abundance results in reduced tree growth and increased tree mortality, possibly playing an important role in the global carbon cycle. Despite the large amount of [...] Read more.
Tropical forests are currently experiencing large-scale structural changes, including an increase in liana abundance and biomass. Higher liana abundance results in reduced tree growth and increased tree mortality, possibly playing an important role in the global carbon cycle. Despite the large amount of data currently available on lianas, there are not many quantitative studies on the influence of lianas on the vertical structure of the forest. We study the potential of terrestrial laser scanning (TLS) in detecting and quantifying changes in forest structure after liana cutting using a small scale removal experiment in two plots (removal plot and non-manipulated control plot) in a secondary forest in Panama. We assess the structural changes by comparing the vertical plant profiles and Canopy Height Models (CHMs) between pre-cut and post-cut scans in the removal plot. We show that TLS is able to detect the local structural changes in all the vertical strata of the plot caused by liana removal. Our study demonstrates the reproducibility of the TLS derived metrics for the same location confirming the applicability of TLS for continuous monitoring of liana removal plots to study the long-term impacts of lianas on forest structure. We therefore recommend to use TLS when implementing new large scale liana removal experiments, as the impact of lianas on forest structure will determine the aboveground competition for light between trees and lianas, which has important implications for the global carbon cycle. Full article
(This article belongs to the Special Issue Remote Sensing to Assess Canopy Structure and Function)
Show Figures

Graphical abstract

23 pages, 3201 KiB  
Article
Rain Microstructure Parameters Vary with Large-Scale Weather Conditions in Lausanne, Switzerland
by Wael Ghada, Allan Buras, Marvin Lüpke, Christian Schunk and Annette Menzel
Remote Sens. 2018, 10(6), 811; https://doi.org/10.3390/rs10060811 - 23 May 2018
Cited by 18 | Viewed by 6131
Abstract
Rain properties vary spatially and temporally for several reasons. In particular, rain types (convective and stratiform) affect the rain drop size distribution (DSD). It has also been established that local weather conditions are influenced by large-scale circulations. However, the effect of these circulations [...] Read more.
Rain properties vary spatially and temporally for several reasons. In particular, rain types (convective and stratiform) affect the rain drop size distribution (DSD). It has also been established that local weather conditions are influenced by large-scale circulations. However, the effect of these circulations on rain microstructures has not been sufficiently addressed. Based on DSD measurements from 16 disdrometers located in Lausanne, Switzerland, we present evidence that rain DSD differs among general weather patterns (GWLs). GWLs were successfully linked to significant variations in the rain microstructure characterized by the most important rain properties: rain intensity (R), mass weighted rain drop diameter (Dm), and rain drop concentration (N), as well as Z = ARb parameters. Our results highlight the potential to improve radar-based estimations of rain intensity, which is crucial for several hydrological and environmental applications. Full article
(This article belongs to the Special Issue Remote Sensing of Precipitation)
Show Figures

Graphical abstract

22 pages, 11813 KiB  
Article
Cloud Classification in Wide-Swath Passive Sensor Images Aided by Narrow-Swath Active Sensor Data
by Hongxia Wang and Xiaojian Xu
Remote Sens. 2018, 10(6), 812; https://doi.org/10.3390/rs10060812 - 23 May 2018
Cited by 4 | Viewed by 5186
Abstract
It is a challenge to distinguish between different cloud types because of the complexity and diversity of cloud coverage, which is a significant clutter source that impacts on target detection and identification from the images of space-based infrared sensors. In this paper, a [...] Read more.
It is a challenge to distinguish between different cloud types because of the complexity and diversity of cloud coverage, which is a significant clutter source that impacts on target detection and identification from the images of space-based infrared sensors. In this paper, a novel strategy for cloud classification in wide-swath passive sensor images is developed, which is aided by narrow-swath active sensor data. The strategy consists of three steps, that is, the orbit registration, most matching donor pixel selection, and cloud type assignment for each recipient pixel. A new criterion for orbit registration is proposed so as to improve the matching accuracy. The most matching donor pixel is selected via the Euclidean distance and the square sum of the radiance relative differences between the recipient and the potential donor pixels. Each recipient pixel is then assigned a cloud type that corresponds to the most matching donor. The cloud classification of the Moderate Resolution Imaging Spectroradiometer (MODIS) images is performed with the aid of the data from Cloud Profiling Radar (CPR). The results are compared with the CloudSat product 2B-CLDCLASS, as well as those that are obtained using the method of the International Satellite Cloud Climatology Project (ISCCP), which demonstrates the superior classification performance of the proposed strategy. Full article
(This article belongs to the Section Atmospheric Remote Sensing)
Show Figures

Graphical abstract

23 pages, 16267 KiB  
Article
InSAR Reveals Land Deformation at Guangzhou and Foshan, China between 2011 and 2017 with COSMO-SkyMed Data
by Alex Hay-Man Ng, Hua Wang, Yiwei Dai, Carolina Pagli, Wenbin Chen, Linlin Ge, Zheyuan Du and Kui Zhang
Remote Sens. 2018, 10(6), 813; https://doi.org/10.3390/rs10060813 - 24 May 2018
Cited by 43 | Viewed by 6255
Abstract
Subsidence from groundwater extraction and underground tunnel excavation has been known for more than a decade in Guangzhou and Foshan, but past studies have only monitored the subsidence patterns as far as 2011 using InSAR. In this study, the deformation occurring during the [...] Read more.
Subsidence from groundwater extraction and underground tunnel excavation has been known for more than a decade in Guangzhou and Foshan, but past studies have only monitored the subsidence patterns as far as 2011 using InSAR. In this study, the deformation occurring during the most recent time-period between 2011 and 2017 has been measured using COSMO-SkyMed (CSK) to understand if changes in temporal and spatial patterns of subsidence rates occurred. Using InSAR time-series analysis (TS-InSAR), we found that significant surface displacement rates occurred in the study area varying from −35 mm/year (subsidence) to 10 mm/year (uplift). The 2011–2017 TS-InSAR results were compared to two separate TS-InSAR analyses (2011–2013, and 2013–2017). Our CSK TS-InSAR results are in broad agreement with previous ENVISAT results and levelling data, strengthening our conclusion that localised subsidence phenomena occurs at different locations in Guangzhou and Foshan. A comparison between temporal and spatial patterns of deformations from our TS-InSAR measurements and different land use types in Guangzhou shows that there is no clear relationship between them. Many local scale deformation zones have been identified related to different phenomena. The majority of deformations is related to excessive groundwater extraction for agricultural and industrial purposes but subsidence in areas of subway construction also occurred. Furthermore, a detailed analysis on the sinkhole collapse in early 2018 has been conducted, suggesting that surface loading may be a controlling factor of the subsidence, especially along the road and highway. Roads and highways with similar subsidence phenomenon are identified. Continuous monitoring of the deforming areas identified by our analysis is important to measure the magnitude and spatial pattern of the evolving deformations in order to minimise the risk and hazards of land subsidence. Full article
Show Figures

Graphical abstract

19 pages, 1982 KiB  
Article
Application of Thermal and Phenological Land Surface Parameters for Improving Ecological Niche Models of Betula utilis in the Himalayan Region
by Maria Bobrowski, Benjamin Bechtel, Jürgen Böhner, Jens Oldeland, Johannes Weidinger and Udo Schickhoff
Remote Sens. 2018, 10(6), 814; https://doi.org/10.3390/rs10060814 - 24 May 2018
Cited by 24 | Viewed by 5746
Abstract
Modelling ecological niches across vast distribution ranges in remote, high mountain regions like the Himalayas faces several data limitations, in particular nonavailability of species occurrence data and fine-scale environmental information of sufficiently high quality. Remotely sensed data provide key advantages such as frequent, [...] Read more.
Modelling ecological niches across vast distribution ranges in remote, high mountain regions like the Himalayas faces several data limitations, in particular nonavailability of species occurrence data and fine-scale environmental information of sufficiently high quality. Remotely sensed data provide key advantages such as frequent, complete, and long-term observations of land surface parameters with full spatial coverage. The objective of this study is to evaluate modelled climate data as well as remotely sensed data for modelling the ecological niche of Betula utilis in the subalpine and alpine belts of the Himalayan region covering the entire Himalayan arc. Using generalized linear models (GLM), we aim at testing factors controlling the species distribution under current climate conditions. We evaluate the additional predictive capacity of remotely sensed variables, namely remotely sensed topography and vegetation phenology data (phenological traits), as well as the capability to substitute bioclimatic variables from downscaled numerical models by remotely sensed annual land surface temperature parameters. The best performing model utilized bioclimatic variables, topography, and phenological traits, and explained over 69% of variance, while models exclusively based on remotely sensed data reached 65% of explained variance. In summary, models based on bioclimatic variables and topography combined with phenological traits led to a refined prediction of the current niche of B. utilis, whereas models using solely climate data consistently resulted in overpredictions. Our results suggest that remotely sensed phenological traits can be applied beneficially as supplements to improve model accuracy and to refine the prediction of the species niche. We conclude that the combination of remotely sensed land surface temperature parameters is promising, in particular in regions where sufficient fine-scale climate data are not available. Full article
Show Figures

Graphical abstract

21 pages, 2563 KiB  
Article
Assessment of Forest Above-Ground Biomass Estimation from PolInSAR in the Presence of Temporal Decorrelation
by Nafiseh Ghasemi, Valentyn Tolpekin and Alfred Stein
Remote Sens. 2018, 10(6), 815; https://doi.org/10.3390/rs10060815 - 24 May 2018
Cited by 12 | Viewed by 4487
Abstract
In forestry studies, remote sensing has been widely used to monitor deforestation and estimate biomass, and it has contributed to forest carbon stock management. A major problem when estimating biomass from optical and SAR remote sensing images is the saturation effect. As a [...] Read more.
In forestry studies, remote sensing has been widely used to monitor deforestation and estimate biomass, and it has contributed to forest carbon stock management. A major problem when estimating biomass from optical and SAR remote sensing images is the saturation effect. As a solution, PolInSAR offers a high coverage height map that can be transformed into a biomass map. Temporal decorrelation may affect the accuracy of PolInSAR and may also have an effect on the accuracy of the biomass estimates. In this study, we compared three different height estimation models: the Random-Volume-over-Ground (RVoG), Random-Motion-over-Ground (RMoG), and Random-Motion-over-Ground-Legendre (RMoG L ) models. The RVoG model does not take into account the temporal decorrelation, while the other two compensate for temporal decorrelation but differ in structure function. The comparison was done on 214 field plots of the 10 m radius of the BioSAR2010 campaign. Different models relating PolInSAR height and biomass were developed by using polynomial, exponential, power series, and piece-wise linear regression. Different strategies for training and test subset selection were followed to obtain the best possible regression models. The study showed that the RMoG L model provided the most accurate biomass predictions. The relation between RMoG L height and biomass is well expressed by the exponential model with an average RMSE equal to 48 ton ha 1 and R 2 value equal to 0.62. The relative errors for estimated biomass were equal to 46% for the RVoG model, to 37% for the RMoG, and to 30% for the RMoG L model. We concluded that taking the temporal decorrelation into account for estimating tree height has a significant effect on providing accurate biomass estimates. Full article
(This article belongs to the Section Forest Remote Sensing)
Show Figures

Graphical abstract

22 pages, 8345 KiB  
Article
Bilateral Filter Regularized L2 Sparse Nonnegative Matrix Factorization for Hyperspectral Unmixing
by Zuoyu Zhang, Shouyi Liao, Hexin Zhang, Shicheng Wang and Yongchao Wang
Remote Sens. 2018, 10(6), 816; https://doi.org/10.3390/rs10060816 - 24 May 2018
Cited by 19 | Viewed by 4228
Abstract
Hyperspectral unmixing (HU) is one of the most active hyperspectral image (HSI) processing research fields, which aims to identify the materials and their corresponding proportions in each HSI pixel. The extensions of the nonnegative matrix factorization (NMF) have been proved effective for HU, [...] Read more.
Hyperspectral unmixing (HU) is one of the most active hyperspectral image (HSI) processing research fields, which aims to identify the materials and their corresponding proportions in each HSI pixel. The extensions of the nonnegative matrix factorization (NMF) have been proved effective for HU, which usually uses the sparsity of abundances and the correlation between the pixels to alleviate the non-convex problem. However, the commonly used L 1 / 2 sparse constraint will introduce an additional local minima because of the non-convexity, and the correlation between the pixels is not fully utilized because of the separation of the spatial and structural information. To overcome these limitations, a novel bilateral filter regularized L 2 sparse NMF is proposed for HU. Firstly, the L 2 -norm is utilized in order to improve the sparsity of the abundance matrix. Secondly, a bilateral filter regularizer is adopted so as to explore both the spatial information and the manifold structure of the abundance maps. In addition, NeNMF is used to solve the object function in order to improve the convergence rate. The results of the simulated and real data experiments have demonstrated the advantage of the proposed method. Full article
Show Figures

Graphical abstract

26 pages, 1313 KiB  
Article
Classification of Hyperspectral Images with Robust Regularized Block Low-Rank Discriminant Analysis
by Baokai Zu, Kewen Xia, Wei Du, Yafang Li, Ahmad Ali and Sagnik Chakraborty
Remote Sens. 2018, 10(6), 817; https://doi.org/10.3390/rs10060817 - 24 May 2018
Cited by 8 | Viewed by 3739
Abstract
Classification of Hyperspectral Images (HSIs) has gained attention for the past few decades. In remote sensing image classification, the labeled samples are insufficient or hard to obtain; however, the unlabeled ones are frequently rich and of a vast number. When there are no [...] Read more.
Classification of Hyperspectral Images (HSIs) has gained attention for the past few decades. In remote sensing image classification, the labeled samples are insufficient or hard to obtain; however, the unlabeled ones are frequently rich and of a vast number. When there are no sufficient labeled samples, overfitting may occur. To resolve the overfitting issue, in this present work, we proposed a novel approach for HSI feature extraction, called robust regularized Block Low-Rank Discriminant Analysis (BLRDA), which is a robust and efficient feature extraction method to improve the HSIs’ classification accuracy with few labeled samples. To reduce the exponentially growing computational complexity of the low-rank method, we divide the entire image into blocks and implement the low-rank representation for each block respectively. Due to the symmetric matrix requirements for the regularized graph of discriminant analysis, the k-nearest neighbor is applied to handle the whole low-rank graph integrally. The low-rank representation and the kNN can maximally capture and preserve the global and local geometry of the data, respectively, and the performance of regularized discriminant analysis feature extraction can be apparently improved. Extensive experiments on multi-class hyperspectral images show that the proposed BLRDA is a very robust and efficient feature extraction method. Even with simple supervised and semi-supervised classifiers (nearest neighbor and SVM) and randomly given parameters, the feature extraction method achieves significant results with few labeled samples, which shows better performance than similar feature extraction methods. Full article
(This article belongs to the Section Remote Sensing Image Processing)
Show Figures

Graphical abstract

17 pages, 2676 KiB  
Article
Experimental Study of the Thermal Infrared Emissivity Variation of Loaded Rock and Its Significance
by Jianwei Huang, Shanjun Liu, Xiang Gao, Zhengcang Yang, Qiang Ni and Lixin Wu
Remote Sens. 2018, 10(6), 818; https://doi.org/10.3390/rs10060818 - 24 May 2018
Cited by 26 | Viewed by 5354
Abstract
Previous studies have shown that thermal infrared radiation (TIR) changes with stress for loaded rocks. TIR changes were mainly attributed to temperature change without considering the change in surface emissivity. And it remains unclear whether there was a change in emissivity during the [...] Read more.
Previous studies have shown that thermal infrared radiation (TIR) changes with stress for loaded rocks. TIR changes were mainly attributed to temperature change without considering the change in surface emissivity. And it remains unclear whether there was a change in emissivity during the rock loading process. Therefore, based on the spectral radiance observations in this paper, an experimental study involving the emissivity variation in the 8.0–13.0 μm range for elastic loaded quartz sandstone under outdoor conditions was conducted. The experiments yield the following results. First, a variation in the stress condition led to the emissivity change in addition to the temperature change. The spectral radiance change was the combined result of the temperature changes and emissivity changes. Second, the emissivity changes linearly with the stress change, and the amplitude is relatively large in the 8.0–10.0 μm range. The waveband features of emissivity variation are the main factor leading to the waveband features of stress-induced radiance change. Third, the explanations for the changes in temperature and emissivity during loading process are analyzed. And the significance and difficulty for further satellite remote sensing purpose is discussed. The experimental results provide an experimental foundation for crustal stress field monitoring. Full article
(This article belongs to the Special Issue Remote Sensing of Tectonic Deformation)
Show Figures

Graphical abstract

21 pages, 3410 KiB  
Article
Hierarchical Fusion of Convolutional Neural Networks and Attributed Scattering Centers with Application to Robust SAR ATR
by Chuanjin Jiang and Yuan Zhou
Remote Sens. 2018, 10(6), 819; https://doi.org/10.3390/rs10060819 - 24 May 2018
Cited by 36 | Viewed by 3800
Abstract
This paper proposes a synthetic aperture radar (SAR) automatic target recognition (ATR) method via hierarchical fusion of two classification schemes, i.e., convolutional neural networks (CNN) and attributed scattering center (ASC) matching. CNN can work with notably high effectiveness under the standard operating condition [...] Read more.
This paper proposes a synthetic aperture radar (SAR) automatic target recognition (ATR) method via hierarchical fusion of two classification schemes, i.e., convolutional neural networks (CNN) and attributed scattering center (ASC) matching. CNN can work with notably high effectiveness under the standard operating condition (SOC). However, it can hardly cope with various extended operating conditions (EOCs), which are not covered by the training samples. In contrast, the ASC matching can handle many EOCs related to the local variations of the target by building a one-to-one correspondence between two ASC sets. Therefore, it is promising that both effectiveness and efficiency of the ATR method can be improved by combining the merits of the two classification schemes. The test sample is first classified by CNN. A reliability level calculated based on the outputs from CNN. Once there is a notably reliable decision, the whole recognition process terminates. Otherwise, the test sample will be further identified by ASC matching. To evaluate the performance of the proposed method, extensive experiments are conducted on the Moving and Stationary Target Acquisition and Recognition (MSTAR) dataset under SOC and various EOCs. The results demonstrate the superior effectiveness and robustness of the proposed method compared with several state-of-the-art SAR ATR methods. Full article
(This article belongs to the Section Remote Sensing Image Processing)
Show Figures

Graphical abstract

21 pages, 3856 KiB  
Article
Geospatial Object Detection in Remote Sensing Imagery Based on Multiscale Single-Shot Detector with Activated Semantics
by Shiqi Chen, Ronghui Zhan and Jun Zhang
Remote Sens. 2018, 10(6), 820; https://doi.org/10.3390/rs10060820 - 24 May 2018
Cited by 57 | Viewed by 8738
Abstract
Geospatial object detection from high spatial resolution (HSR) remote sensing imagery is a heated and challenging problem in the field of automatic image interpretation. Despite convolutional neural networks (CNNs) having facilitated the development in this domain, the computation efficiency under real-time application and [...] Read more.
Geospatial object detection from high spatial resolution (HSR) remote sensing imagery is a heated and challenging problem in the field of automatic image interpretation. Despite convolutional neural networks (CNNs) having facilitated the development in this domain, the computation efficiency under real-time application and the accurate positioning on relatively small objects in HSR images are two noticeable obstacles which have largely restricted the performance of detection methods. To tackle the above issues, we first introduce semantic segmentation-aware CNN features to activate the detection feature maps from the lowest level layer. In conjunction with this segmentation branch, another module which consists of several global activation blocks is proposed to enrich the semantic information of feature maps from higher level layers. Then, these two parts are integrated and deployed into the original single shot detection framework. Finally, we use the modified multi-scale feature maps with enriched semantics and multi-task training strategy to achieve end-to-end detection with high efficiency. Extensive experiments and comprehensive evaluations on a publicly available 10-class object detection dataset have demonstrated the superiority of the presented method. Full article
(This article belongs to the Special Issue Deep Learning for Remote Sensing)
Show Figures

Graphical abstract

16 pages, 37702 KiB  
Article
Optimal Seamline Detection for Orthoimage Mosaicking Based on DSM and Improved JPS Algorithm
by Gang Chen, Song Chen, Xianju Li, Ping Zhou and Zhou Zhou
Remote Sens. 2018, 10(6), 821; https://doi.org/10.3390/rs10060821 - 25 May 2018
Cited by 14 | Viewed by 4985
Abstract
Based on the digital surface model (DSM) and jump point search (JPS) algorithm, this study proposed a novel approach to detect the optimal seamline for orthoimage mosaicking. By threshold segmentation, DSM was first identified as ground regions and obstacle regions (e.g., buildings, trees, [...] Read more.
Based on the digital surface model (DSM) and jump point search (JPS) algorithm, this study proposed a novel approach to detect the optimal seamline for orthoimage mosaicking. By threshold segmentation, DSM was first identified as ground regions and obstacle regions (e.g., buildings, trees, and cars). Then, the mathematical morphology method was used to make the edge of obstacles more prominent. Subsequently, the processed DSM was considered as a uniform-cost grid map, and the JPS algorithm was improved and employed to search for key jump points in the map. Meanwhile, the jump points would be evaluated according to an optimized function, finally generating a minimum cost path as the optimal seamline. Furthermore, the search strategy was modified to avoid search failure when the search map was completely blocked by obstacles in the search direction. Comparison of the proposed method and the Dijkstra’s algorithm was carried out based on two groups of image data with different characteristics. Results showed the following: (1) the proposed method could detect better seamlines near the centerlines of the overlap regions, crossing far fewer ground objects; (2) the efficiency and resource consumption were greatly improved since the improved JPS algorithm skips many image pixels without them being explicitly evaluated. In general, based on DSM, the proposed method combining threshold segmentation, mathematical morphology, and improved JPS algorithms was helpful for detecting the optimal seamline for orthoimage mosaicking. Full article
Show Figures

Figure 1

15 pages, 1054 KiB  
Article
Multimodal Ground-Based Cloud Classification Using Joint Fusion Convolutional Neural Network
by Shuang Liu, Mei Li, Zhong Zhang, Baihua Xiao and Xiaozhong Cao
Remote Sens. 2018, 10(6), 822; https://doi.org/10.3390/rs10060822 - 25 May 2018
Cited by 44 | Viewed by 5212
Abstract
The accurate ground-based cloud classification is a challenging task and still under development. The most current methods are limited to only taking the cloud visual features into consideration, which is not robust to the environmental factors. In this paper, we present the novel [...] Read more.
The accurate ground-based cloud classification is a challenging task and still under development. The most current methods are limited to only taking the cloud visual features into consideration, which is not robust to the environmental factors. In this paper, we present the novel joint fusion convolutional neural network (JFCNN) to integrate the multimodal information for ground-based cloud classification. To learn the heterogeneous features (visual features and multimodal features) from the ground-based cloud data, we designed the proposed JFCNN as a two-stream structure which contains the vision subnetwork and multimodal subnetwork. We also proposed a novel layer named joint fusion layer to jointly learn two kinds of cloud features under one framework. After training the proposed JFCNN, we extracted the visual and multimodal features from the two subnetworks and integrated them using a weighted strategy. The proposed JFCNN was validated on the multimodal ground-based cloud (MGC) dataset and achieved remarkable performance, demonstrating its effectiveness for ground-based cloud classification task. Full article
(This article belongs to the Special Issue Recent Advances in Neural Networks for Remote Sensing)
Show Figures

Graphical abstract

18 pages, 5655 KiB  
Article
How Well Does the ‘Small Fire Boost’ Methodology Used within the GFED4.1s Fire Emissions Database Represent the Timing, Location and Magnitude of Agricultural Burning?
by Tianran Zhang, Martin J. Wooster, Mark C. De Jong and Weidong Xu
Remote Sens. 2018, 10(6), 823; https://doi.org/10.3390/rs10060823 - 25 May 2018
Cited by 45 | Viewed by 6072
Abstract
The Global Fire Emissions Database (GFED)—currently by far the most widely used global fire emissions inventory—is primarily driven by the 500 m MODIS MCD64A1 burned area (BA) product. This product is unable to detect many smaller fires, and the new v4.1s of GFED [...] Read more.
The Global Fire Emissions Database (GFED)—currently by far the most widely used global fire emissions inventory—is primarily driven by the 500 m MODIS MCD64A1 burned area (BA) product. This product is unable to detect many smaller fires, and the new v4.1s of GFED addresses this deficiency by using a ‘small fire boost’ (SFB) methodology that estimates the ‘small fire’ burned area from MODIS active fire (AF) detections. We evaluate the performance of this approach in two globally significant agricultural burning regions dominated by small fires, eastern China and north-western India. We find the GFED4.1s SFB can affect the burned area and fire emissions data reported by GFED very significantly, and the approach shows some potential for reducing low biases in GFED’s fire emissions estimates of agricultural burning regions. However, it also introduces several significant errors. In north-western India, the SFB slightly improves the temporal distribution of agricultural burning, but the magnitude of the additional burned area added by the SFB is far too low. In eastern China, the SFB appears to have some positive effects on the magnitude of agricultural burning reported in June and October, but significant errors are introduced in the summer months via false alarms in the MODIS AF product. This results in a completely inaccurate ‘August’ burning period in GFED4.1s, where false fires are erroneously stated to be responsible for roughly the same amount of dry matter fuel consumption as fires in June and October. Even without the SFB, we also find problems with some of the burns detected by the MCD64A1 burned area product in these agricultural regions. Overall, we conclude that the SFB methodology requires further optimisation and that the efficacy of GFED4.1s’ ‘boosted’ BA and resulting fire emissions estimates require careful consideration by users focusing in areas where small fires dominate. Full article
(This article belongs to the Section Atmospheric Remote Sensing)
Show Figures

Graphical abstract

17 pages, 9519 KiB  
Article
Evaluation of RGB, Color-Infrared and Multispectral Images Acquired from Unmanned Aerial Systems for the Estimation of Nitrogen Accumulation in Rice
by Hengbiao Zheng, Tao Cheng, Dong Li, Xiang Zhou, Xia Yao, Yongchao Tian, Weixing Cao and Yan Zhu
Remote Sens. 2018, 10(6), 824; https://doi.org/10.3390/rs10060824 - 25 May 2018
Cited by 162 | Viewed by 11095
Abstract
Unmanned aerial system (UAS)-based remote sensing is one promising technique for precision crop management, but few studies have reported the applications of such systems on nitrogen (N) estimation with multiple sensors in rice (Oryza sativa L.). This study aims to evaluate three [...] Read more.
Unmanned aerial system (UAS)-based remote sensing is one promising technique for precision crop management, but few studies have reported the applications of such systems on nitrogen (N) estimation with multiple sensors in rice (Oryza sativa L.). This study aims to evaluate three sensors (RGB, color-infrared (CIR) and multispectral (MS) cameras) onboard UAS for the estimation of N status at individual stages and their combination with the field data collected from a two-year rice experiment. The experiments were conducted in 2015 and 2016, involving different N rates, planting densities and rice cultivars, with three replicates. An Oktokopter UAS was used to acquire aerial photography at early growth stages (from tillering to booting) and field samplings were taken at a near date. Two color indices (normalized excess green index (NExG), and normalized green red difference index (NGRDI)), two near infrared vegetation indices (green normalized difference vegetation index (GNDVI), and enhanced NDVI (ENDVI)) and two red edge vegetation indices (red edge chlorophyll index (CIred edge), and DATT) were used to evaluate the capability of these three sensors in estimating leaf nitrogen accumulation (LNA) and plant nitrogen accumulation (PNA) in rice. The results demonstrated that the red edge vegetation indices derived from MS images produced the highest estimation accuracy for LNA (R2: 0.79–0.81, root mean squared error (RMSE): 1.43–1.45 g m−2) and PNA (R2: 0.81–0.84, RMSE: 2.27–2.38 g m−2). The GNDVI from CIR images yielded a moderate estimation accuracy with an all-stage model. Color indices from RGB images exhibited satisfactory performance for the pooled dataset of the tillering and jointing stages. Compared with the counterpart indices from the RGB and CIR images, the indices from the MS images performed better in most cases. These results may set strong foundations for the development of UAS-based rice growth monitoring systems, providing useful information for the real-time decision making on crop N management. Full article
(This article belongs to the Special Issue Remote Sensing for Precision Nitrogen Management)
Show Figures

Graphical abstract

15 pages, 9436 KiB  
Article
Airborne Doppler Wind Lidar Observations of the Tropical Cyclone Boundary Layer
by Jun A. Zhang, Robert Atlas, G. David Emmitt, Lisa Bucci and Kelly Ryan
Remote Sens. 2018, 10(6), 825; https://doi.org/10.3390/rs10060825 - 25 May 2018
Cited by 28 | Viewed by 7878
Abstract
This study presents a verification and an analysis of wind profile data collected during Tropical Storm Erika (2015) by a Doppler Wind Lidar (DWL) instrument aboard a P3 Hurricane Hunter aircraft of the National Oceanic and Atmospheric Administration (NOAA). DWL-measured winds are compared [...] Read more.
This study presents a verification and an analysis of wind profile data collected during Tropical Storm Erika (2015) by a Doppler Wind Lidar (DWL) instrument aboard a P3 Hurricane Hunter aircraft of the National Oceanic and Atmospheric Administration (NOAA). DWL-measured winds are compared to those from nearly collocated GPS dropsondes, and show good agreement in terms of both the wind magnitude and asymmetric distribution of the wind field. A comparison of the DWL-measured wind speeds versus dropsonde-measured wind speeds yields a reasonably good correlation (r2 = 0.95), with a root mean square error (RMSE) of 1.58 m s−1 and a bias of −0.023 m s−1. Our analysis shows that the DWL complements the existing P3 Doppler radar, in that it collects wind data in rain-free and low-rain regions where Doppler radar is limited for wind observations. The DWL observations also complement dropsonde measurements by significantly enlarging the sampling size and spatial coverage of the boundary layer winds. An analysis of the DWL wind data shows that the boundary layer of Erika was much deeper than that of a typical hurricane-strength storm. Streamline and vorticity analyses based on DWL wind observations explain why Erika maintained intensity in a sheared environment. This study suggests that DWL wind data are valuable for real-time intensity forecasts, basic understanding of the boundary layer structure and dynamics, and offshore wind energy applications under tropical cyclone conditions. Full article
(This article belongs to the Special Issue Remote Sensing of Atmospheric Conditions for Wind Energy Applications)
Show Figures

Graphical abstract

19 pages, 3416 KiB  
Article
A New Single-Band Pixel-by-Pixel Atmospheric Correction Method to Improve the Accuracy in Remote Sensing Estimates of LST. Application to Landsat 7-ETM+
by Joan M. Galve, Juan M. Sánchez, César Coll and Julio Villodre
Remote Sens. 2018, 10(6), 826; https://doi.org/10.3390/rs10060826 - 25 May 2018
Cited by 16 | Viewed by 5007
Abstract
Monitoring Land Surface Temperature (LST) from satellite remote sensing requires an accurate correction of the atmospheric effects. Although thermal remote sensing techniques have advanced significantly over the past few decades, to date, single-band pixel-by-pixel atmospheric correction of full thermal images is unsolved. In [...] Read more.
Monitoring Land Surface Temperature (LST) from satellite remote sensing requires an accurate correction of the atmospheric effects. Although thermal remote sensing techniques have advanced significantly over the past few decades, to date, single-band pixel-by-pixel atmospheric correction of full thermal images is unsolved. In this work, we introduce a new Single-Band Atmospheric Correction (SBAC) tool that provides pixel-by-pixel atmospheric correction parameters regardless of the pixel size. The SBAC tool uses National Centers of Environmental Prediction (NCEP) profiles as inputs and, as a novelty, it also accounts for pixel elevation through a Digital Elevation Model (DEM). Application of SBAC to 19 Landsat 7-ETM+ scenes shows the potential of the proposed pixel-by-pixel atmospheric correction to capture terrain orography or atmospheric variability within the scene. LST estimation yields negligible bias and an RMSE of ±1.6 K for the full dataset. The Landsat Atmospheric Correction Tool (ACT) is also considered for comparison. SBAC-ACT LST deviations are analyzed in terms of distance to the image center, surface elevation, and spatial distribution of the atmospheric water content. Differences within 3 K are observed. These results give us the first insight of the potential of SBAC for the operational pixel-by-pixel atmospheric correction of full thermal images. The SBAC tool is expected to help users of satellite single-channel thermal sensors to improve their LST estimates due to its simplicity and robustness. Full article
Show Figures

Graphical abstract

20 pages, 6689 KiB  
Article
The Impact of Hurricane Maria on the Vegetation of Dominica and Puerto Rico Using Multispectral Remote Sensing
by Tangao Hu and Ronald B. Smith
Remote Sens. 2018, 10(6), 827; https://doi.org/10.3390/rs10060827 - 25 May 2018
Cited by 100 | Viewed by 16534
Abstract
As the worst natural disaster on record in Dominica and Puerto Rico, Hurricane Maria in September 2017 had a large impact on the vegetation of these islands. In this paper, multitemporal Landsat 8 OLI and Sentinel-2 data are used to investigate vegetation damage [...] Read more.
As the worst natural disaster on record in Dominica and Puerto Rico, Hurricane Maria in September 2017 had a large impact on the vegetation of these islands. In this paper, multitemporal Landsat 8 OLI and Sentinel-2 data are used to investigate vegetation damage on Dominica and Puerto Rico by Hurricane Maria, and related influencing factors are analyzed. Moreover, the changes in the normalized difference vegetation index (NDVI) in the year 2017 are compared to reference years (2015 and 2016). The results show that (1) there is a sudden drop in NDVI values after Hurricane Maria’s landfall (decreased about 0.2) which returns to near normal vegetation after 1.5 months; (2) different land cover types have different sensitivities to Hurricane Maria, whereby forest is the most sensitive type, then followed by wetland, built-up, and natural grassland; and (3) for Puerto Rico, the vegetation damage is highly correlated with distance from the storm center and elevation. For Dominica, where the whole island is within Hurricane Maria’s radius of maximum wind, the vegetation damage has no obvious relationship to elevation or distance. The study provides insight into the sensitivity and recovery of vegetation after a major land-falling hurricane, and may lead to improved vegetation protection strategies. Full article
(This article belongs to the Section Remote Sensing in Agriculture and Vegetation)
Show Figures

Graphical abstract

32 pages, 10824 KiB  
Article
Inter-Comparison of Gauge-Corrected Global Satellite Rainfall Estimates and Their Applicability for Effective Water Resource Management in a Transboundary River Basin: The Case of the Meghna River Basin
by Islam M. Khairul, Nikolaos Mastrantonas, Mohamed Rasmy, Toshio Koike and Kuniyoshi Takeuchi
Remote Sens. 2018, 10(6), 828; https://doi.org/10.3390/rs10060828 - 25 May 2018
Cited by 20 | Viewed by 5718
Abstract
The Meghna River basin is a transboundary basin that lies in Bangladesh (~40%) and India (~60%). Due to its terrain structure, the Bangladesh portion of the basin experiences frequent floods that cause severe human and economic losses. Bangladesh, as the downstream nation in [...] Read more.
The Meghna River basin is a transboundary basin that lies in Bangladesh (~40%) and India (~60%). Due to its terrain structure, the Bangladesh portion of the basin experiences frequent floods that cause severe human and economic losses. Bangladesh, as the downstream nation in the basin, faces challenges in receiving hydro-meteorological and water use data from India for effective water resource management. To address such issue, satellite rainfall products are recognized as an alternative. However, they are affected by biases and, thus, must be calibrated and verified using ground observations. This research compares the performance of four widely available gauge-adjusted satellite rainfall products (GSRPs) against ground rainfall observations in the Meghna basin within Bangladesh. Further biases in the GSRPs are then identified. The GSRPs have both similarities and differences in terms of producing biases. To maximize the usage of the GSRPs and to further improve their accuracy, several bias correction and merging techniques are applied to correct them. Correction factors and merging weights are calculated at the local gauge stations and are spatially distributed by adopting an interpolation method to improve the GSRPs, both inside and outside Bangladesh. Of the four bias correction methods, modified linear correction (MLC) has performed better, and partially removed the GSRPs’ systematic biases. In addition, of the three merging techniques, inverse error-variance weighting (IEVW) has provided better results than the individual GSRPs and removed significantly more biases than the MLC correction method for three of the five validation stations, whereas the two other stations that experienced heavy rainfall events, showed better results for the MLC method. Hence, the combined use of IEVW merging and MLC correction is explored. The combined method has provided the best results, thus creating an improved dataset. The applicability of this dataset is then investigated using a hydrological model to simulated streamflows at two critical locations. The results show that the dataset reproduces the hydrological responses of the basin well, as compared with the observed streamflows. Together, these results indicate that the improved dataset can overcome the limitations of poor data availability in the basin and can serve as a reference rainfall dataset for wide range of applications (e.g., flood modelling and forecasting, irrigation planning, damage and risk assessment, and climate change adaptation planning). In addition, the proposed methodology of creating a reference rainfall dataset based on the GSRPs could also be applicable to other poorly-gauged and inaccessible transboundary river basins, thus providing reliable rainfall information and effective water resource management for sustainable development. Full article
Show Figures

Graphical abstract

17 pages, 3770 KiB  
Article
The On-Orbit Non-Uniformity Correction Method with Modulated Internal Calibration Sources for Infrared Remote Sensing Systems
by Yicheng Sheng, Xiong Dun, Weiqi Jin, Feng Zhou, Xia Wang, Fengwen Mi and Si Xiao
Remote Sens. 2018, 10(6), 830; https://doi.org/10.3390/rs10060830 - 25 May 2018
Cited by 8 | Viewed by 5166
Abstract
The scanning infrared focal plane array (IRFPA) suffers from stripe-like non-uniformity due to the usage of many detectors, especially when working with a large time scale. Typical calibration systems tend to block the sensor aperture and expose the detectors to an on-board blackbody [...] Read more.
The scanning infrared focal plane array (IRFPA) suffers from stripe-like non-uniformity due to the usage of many detectors, especially when working with a large time scale. Typical calibration systems tend to block the sensor aperture and expose the detectors to an on-board blackbody calibration source. They may also point at deep space. Full aperture calibration sources of this type tend to be large and expensive. To address these problems, a dynamic non-uniformity correction (NUC) method is proposed based on a modulated internal calibration device. By employing the on-board calibration device to generate a dynamic scene and fully integrating the system characteristics of the scanning IRFPA into the scene-based non-uniformity correction (SBNUC) algorithm, on-orbit high dynamic range NUC is achieved without blocking the field of view. Here we simulate an internal calibration system alternative, where a dynamic calibration signal is superimposed on the normal imagery, thus requiring no mechanisms and a smaller size. This method using this type of calibrator shows that when the sensor is pointing at deep space for calibration, it provides an effective non-uniformity correction of the imagery. After performing the proposed method, the NU of the two evaluation images was reduced from the initial 12.99% and 8.72% to less than 2%. Compared to other on-board NUC methods that require an extended reference blackbody source, this proposed approach has the advantages of miniaturization, a short calibration time, and strong adaptability. Full article
(This article belongs to the Section Remote Sensing Image Processing)
Show Figures

Graphical abstract

22 pages, 2958 KiB  
Article
SAR-Based Estimation of Above-Ground Biomass and Its Changes in Tropical Forests of Kalimantan Using L- and C-Band
by Anna Berninger, Sandra Lohberger, Matthias Stängel and Florian Siegert
Remote Sens. 2018, 10(6), 831; https://doi.org/10.3390/rs10060831 - 25 May 2018
Cited by 67 | Viewed by 11880
Abstract
Kalimantan poses one of the highest carbon emissions worldwide since its landscape is strongly endangered by deforestation and degradation and, thus, carbon release. The goal of this study is to conduct large-scale monitoring of above-ground biomass (AGB) from space and create more accurate [...] Read more.
Kalimantan poses one of the highest carbon emissions worldwide since its landscape is strongly endangered by deforestation and degradation and, thus, carbon release. The goal of this study is to conduct large-scale monitoring of above-ground biomass (AGB) from space and create more accurate biomass maps of Kalimantan than currently available. AGB was estimated for 2007, 2009, and 2016 in order to give an overview of ongoing forest loss and to estimate changes between the three time steps in a more precise manner. Extensive field inventory and LiDAR data were used as reference AGB. A multivariate linear regression model (MLR) based on backscatter values, ratios, and Haralick textures derived from Sentinel-1 (C-band), ALOS PALSAR (Advanced Land Observing Satellite’s Phased Array-type L-band Synthetic Aperture Radar), and ALOS-2 PALSAR-2 polarizations was used to estimate AGB across the country. The selection of the most suitable model parameters was accomplished considering VIF (variable inflation factor), p-value, R2, and RMSE (root mean square error). The final AGB maps were validated by calculating bias, RMSE, R2, and NSE (Nash-Sutcliffe efficiency). The results show a correlation (R2) between the reference biomass and the estimated biomass varying from 0.69 in 2016 to 0.77 in 2007, and a model performance (NSE) in a range of 0.70 in 2016 to 0.76 in 2007. Modelling three different years with a consistent method allows a more accurate estimation of the change than using available biomass maps based on different models. All final biomass products have a resolution of 100 m, which is much finer than other existing maps of this region (>500 m). These high-resolution maps enable identification of even small-scaled biomass variability and changes and can be used for more precise carbon modelling, as well as forest monitoring or risk managing systems under REDD+ (Reducing Emissions from Deforestation, forest Degradation, and the role of conservation, sustainable management of forests, and enhancement of forest carbon stocks) and other programs, protecting forests and analyzing carbon release. Full article
(This article belongs to the Special Issue Remote Sensing of Forest Cover Change)
Show Figures

Graphical abstract

18 pages, 20606 KiB  
Article
Using InSAR Coherence for Investigating the Interplay of Fluvial and Aeolian Features in Arid Lands: Implications for Groundwater Potential in Egypt
by Ahmed Gaber, Mohamed Abdelkareem, Ismail S. Abdelsadek, Magaly Koch and Farouk El-Baz
Remote Sens. 2018, 10(6), 832; https://doi.org/10.3390/rs10060832 - 25 May 2018
Cited by 35 | Viewed by 7290
Abstract
Despite the fact that the Sahara is considered the most arid region on Earth, it has witnessed prolonged fluvial and aeolian depositional history, and might harbor substantial fresh groundwater resources. Its ancient fluvial surfaces are, however, often concealed by aeolian deposits, inhibiting the [...] Read more.
Despite the fact that the Sahara is considered the most arid region on Earth, it has witnessed prolonged fluvial and aeolian depositional history, and might harbor substantial fresh groundwater resources. Its ancient fluvial surfaces are, however, often concealed by aeolian deposits, inhibiting the discovery and mapping of potential groundwater recharge areas. However, recent advances in synthetic aperture radar (SAR) imaging offer a novel approach for detecting partially hidden and dynamic landscape features. Interferometry SAR coherence change detection (CCD) is a fairly recent technique that allows the mapping of very slight surface changes between multidate SAR images. Thus, this work explores the use of the CCD method to investigate the fluvial and aeolian morphodynamics along two paleochannels in Egypt. The results show that during wetter climates, runoff caused the erosion of solid rocks and the rounding of sand-sized grains, which were subsequently deposited in depressions further downstream. As an alternating dry climate prevailed, the sand deposits were reshaped into migrating linear dunes. These highly dynamic features are depicted on the CCD image with very low coherence values close to 0 (high change), while the deposits within the associated ephemeral wadis show low to moderate coherence values ranging from 0.2 to 0.4 (high to moderate change), and the country rocks show a relative absence of change with high coherence values close to 1. These linear dunes crossed their parent’s stream courses and dammed the runoff to form lakes during rainy seasons. Part of the dammed surface water would have infiltrated the ground to recharge the permeable wadi deposits. The alternation of fluvial and aeolian depositional environments produced unique hydromorphometrically trapped lakes that are very rare in arid regions, but of great interest because of their significance to groundwater recharge. Full article
(This article belongs to the Special Issue Remote Sensing of Arid/Semiarid Lands)
Show Figures

Graphical abstract

27 pages, 7043 KiB  
Article
Evolution of the Performances of Radar Altimetry Missions from ERS-2 to Sentinel-3A over the Inner Niger Delta
by Cassandra Normandin, Frédéric Frappart, Adama Telly Diepkilé, Vincent Marieu, Eric Mougin, Fabien Blarel, Bertrand Lubac, Nadine Braquet and Abdramane Ba
Remote Sens. 2018, 10(6), 833; https://doi.org/10.3390/rs10060833 - 25 May 2018
Cited by 76 | Viewed by 8762
Abstract
Radar altimetry provides unique information on water stages of inland hydro-systems. In this study, the performance of seven altimetry missions, among the most commonly used in land hydrology (i.e., European Remote-Sensing Satellite-2 (ERS-2), ENVIronment SATellite (ENVISAT), Satellite with Argos and ALtika (SARAL), Jason-1, [...] Read more.
Radar altimetry provides unique information on water stages of inland hydro-systems. In this study, the performance of seven altimetry missions, among the most commonly used in land hydrology (i.e., European Remote-Sensing Satellite-2 (ERS-2), ENVIronment SATellite (ENVISAT), Satellite with Argos and ALtika (SARAL), Jason-1, Jason-2, Jason-3 and Sentinel-3A), are assessed using records from a dense in situ network composed of 19 gauge stations in the Inner Niger Delta (IND) from 1995 to 2017. Results show an overall very good agreement between altimetry-based and in situ water levels with correlation coefficient (R) greater than 0.8 in 80% of the cases and Root Mean Square Error (RMSE) lower than 0.4 m in 48% of cases. Better agreement is found for the recently launched missions such as SARAL, Jason-3 and Sentinel-3A than for former missions, indicating the advance of the use of the Ka-band for SARAL and of the Synthetic-aperture Radar (SAR) mode for Sentinel-3A. Cross-correlation analysis performed between water levels from the same altimetry mission leads to time-lags between the upstream and the downstream part of the Inner Niger Delta of around two months that can be related to the time residence of water in the drainage area. Full article
(This article belongs to the Special Issue Satellite Altimetry for Earth Sciences)
Show Figures

Graphical abstract

23 pages, 5888 KiB  
Article
Phytoplankton Size Structure in Association with Mesoscale Eddies off Central-Southern Chile: The Satellite Application of a Phytoplankton Size-Class Model
by Andrea Corredor-Acosta, Carmen E. Morales, Robert J. W. Brewin, Pierre-Amaël Auger, Oscar Pizarro, Samuel Hormazabal and Valeria Anabalón
Remote Sens. 2018, 10(6), 834; https://doi.org/10.3390/rs10060834 - 25 May 2018
Cited by 24 | Viewed by 7853
Abstract
Understanding the influence of mesoscale and submesoscale features on the structure of phytoplankton is a key aspect in the assessment of their influence on marine biogeochemical cycling and cross-shore exchanges of plankton in Eastern Boundary Current Systems (EBCS). In this study, the spatio-temporal [...] Read more.
Understanding the influence of mesoscale and submesoscale features on the structure of phytoplankton is a key aspect in the assessment of their influence on marine biogeochemical cycling and cross-shore exchanges of plankton in Eastern Boundary Current Systems (EBCS). In this study, the spatio-temporal evolution of phytoplankton size classes (PSC) in surface waters associated with mesoscale eddies in the EBCS off central-southern Chile was analyzed. Chlorophyll-a (Chl-a) size-fractionated filtration (SFF) data from in situ samplings in coastal and coastal transition waters were used to tune a three-component (micro-, nano-, and pico-phytoplankton) model, which was then applied to total Chl-a satellite data (ESA OC-CCI product) in order to retrieve the Chl-a concentration of each PSC. A sea surface, height-based eddy-tracking algorithm was used to identify and track one cyclonic (sC) and three anticyclonic (ssAC1, ssAC2, sAC) mesoscale eddies between January 2014 and October 2015. Satellite estimates of PSC and in situ SFF Chl-a data were highly correlated (0.64 < r < 0.87), although uncertainty values for the microplankton fraction were moderate to high (50 to 100% depending on the metric used). The largest changes in size structure took place during the early life of eddies (~2 months), and no major differences in PSC between eddy center and periphery were found. The contribution of the microplankton fraction was ~50% (~30%) in sC and ssAC1 (ssAC2 and sAC) eddies when they were located close to the coast, while nanoplankton was dominant (~60–70%) and picoplankton almost constant (<20%) throughout the lifetime of eddies. These results suggest that the three-component model, which has been mostly applied in oceanic waters, is also applicable to highly productive coastal upwelling systems. Additionally, the PSC changes within mesoscale eddies obtained by this satellite approach are in agreement with results on phytoplankton size distribution in mesoscale and submesoscale features in this region, and are most likely triggered by variations in nutrient concentrations and/or ratios during the eddies’ lifetimes. Full article
(This article belongs to the Special Issue Remote Sensing of Ocean Colour)
Show Figures

Graphical abstract

18 pages, 7638 KiB  
Article
Is Ocean Reflectance Acquired by Citizen Scientists Robust for Science Applications?
by Yuyan Yang, Laura L.E. Cowen and Maycira Costa
Remote Sens. 2018, 10(6), 835; https://doi.org/10.3390/rs10060835 - 26 May 2018
Cited by 14 | Viewed by 4962
Abstract
Monitoring the dynamics of the productivity of ocean water and how it affects fisheries is essential for management. It requires data on proper spatial and temporal scales, which can be provided by operational ocean colour satellites. However, accurate productivity data from ocean colour [...] Read more.
Monitoring the dynamics of the productivity of ocean water and how it affects fisheries is essential for management. It requires data on proper spatial and temporal scales, which can be provided by operational ocean colour satellites. However, accurate productivity data from ocean colour imagery is only possible with proper validation of, for instance, the atmospheric correction applied to the images. In situ water reflectance data are of great value due to the requirements for validation and reflectance is traditionally measured with the Surface Acquisition System (SAS) solar tracker system. Recently, an application for mobile devices, “HydroColor”, was developed to acquire water reflectance data. We examined the accuracy of the water reflectance measures acquired by HydroColor with the help of both trained and untrained citizens, under different environmental conditions. We used water reflectance data acquired by SAS solar tracker and by HydroColor onboard the BC ferry Queen of Oak Bay from July to September 2016. Monte Carlo permutation F tests were used to assess whether the differences between measurements collected by SAS solar tracker and HydroColor with citizens were significant. Results showed that citizen HydroColor measurements were accurate in red, green, and blue bands, as well as red/green and red/blue ratios under different environmental conditions. In addition, we found that a trained citizen obtained higher quality HydroColor data especially under clear skies at noon. Full article
(This article belongs to the Special Issue Citizen Science and Earth Observation II)
Show Figures

Graphical abstract

15 pages, 395 KiB  
Article
Discriminant Analysis with Graph Learning for Hyperspectral Image Classification
by Mulin Chen, Qi Wang and Xuelong Li
Remote Sens. 2018, 10(6), 836; https://doi.org/10.3390/rs10060836 - 27 May 2018
Cited by 42 | Viewed by 6069
Abstract
Linear Discriminant Analysis (LDA) is a widely-used technique for dimensionality reduction, and has been applied in many practical applications, such as hyperspectral image classification. Traditional LDA assumes that the data obeys the Gaussian distribution. However, in real-world situations, the high-dimensional data may be [...] Read more.
Linear Discriminant Analysis (LDA) is a widely-used technique for dimensionality reduction, and has been applied in many practical applications, such as hyperspectral image classification. Traditional LDA assumes that the data obeys the Gaussian distribution. However, in real-world situations, the high-dimensional data may be with various kinds of distributions, which restricts the performance of LDA. To reduce this problem, we propose the Discriminant Analysis with Graph Learning (DAGL) method in this paper. Without any assumption on the data distribution, the proposed method learns the local data relationship adaptively during the optimization. The main contributions of this research are threefold: (1) the local data manifold is captured by learning the data graph adaptively in the subspace; (2) the spatial information within the hyperspectral image is utilized with a regularization term; and (3) an efficient algorithm is designed to optimize the proposed problem with proved convergence. Experimental results on hyperspectral image datasets show that promising performance of the proposed method, and validates its superiority over the state-of-the-art. Full article
Show Figures

Figure 1

22 pages, 3910 KiB  
Article
Canopy Reflectance Modeling of Aquatic Vegetation for Algorithm Development: Global Sensitivity Analysis
by Guanhua Zhou, Zhongqi Ma, Shubha Sathyendranath, Trevor Platt, Cheng Jiang and Kang Sun
Remote Sens. 2018, 10(6), 837; https://doi.org/10.3390/rs10060837 - 27 May 2018
Cited by 24 | Viewed by 7291
Abstract
Optical remote sensing of aquatic vegetation in shallow water is an essential aid to ecosystem protection, but it is difficult because the spectral characteristics of the vegetation are sensitive to external features such as water background effects, atmospheric effects, and the structural properties [...] Read more.
Optical remote sensing of aquatic vegetation in shallow water is an essential aid to ecosystem protection, but it is difficult because the spectral characteristics of the vegetation are sensitive to external features such as water background effects, atmospheric effects, and the structural properties of the canopy. A global sensitivity analysis of an aquatic vegetation radiative transfer model provides invaluable background for algorithm development for use in optical remote sensing. Here, we use the extended Fourier Amplitude Sensitivity Test (EFAST) method for the modelling. Four different cases were identified by subdividing the ranges of water depth and leaf area index (LAI) involved. The results indicate that the reflectance of emergent vegetation is affected mainly by the concentrations of chlorophyll a + b in leaves (Cab), leaf inclination distribution function parameter (LIDFa) and LAI. The parameter LAI is influential in sparse vegetation cases whereas Cab and LIDFa are influential in dense vegetation cases. Canopy reflectance for submerged vegetation is dominated by water parameters. Relatively, LAI and Cab are highly sensitive vegetation parameters. The analysis is extended to vegetation index as well, which takes the Sentinel-2A as the reference sensor. It shows that NDAVI (Normalized Difference Aquatic Vegetation Index) is suitable for retrieving LAI in all cases except deep-sparse for emergent vegetation, whereas NDVI (Normalized Difference Vegetation Index) would be better in the deep-sparse case. NDVI, NDAVI and WAVI (Water Adjusted Vegetation Index), respectively, are suitable for retrieving Cab, Car and LIDFa in dense cases. For submerged vegetation, the sensitivity of LAI to NDAVI is relatively high only in the shallow-sparse case. The adjustment factor L in SAVI and WAVI fails to suppress the sensitivity to water constituent parameters. The sensitivity of LAI and Cab to NDVI in deep cases is relatively higher than that to the other indices, which may provide clues for the construction of inversion algorithms in macrophyte remote sensing in the aquatic environment using spectral signatures in the visible and near infrared regions. Full article
(This article belongs to the Special Issue Remote Sensing of Ocean Colour)
Show Figures

Graphical abstract

20 pages, 11944 KiB  
Article
The Temporal-Spatial Characteristics of Drought in the Loess Plateau Using the Remote-Sensed TRMM Precipitation Data from 1998 to 2014
by Qi Zhao, Qianyun Chen, Mengyan Jiao, Pute Wu, Xuerui Gao, Meihong Ma and Yang Hong
Remote Sens. 2018, 10(6), 838; https://doi.org/10.3390/rs10060838 - 27 May 2018
Cited by 55 | Viewed by 5885
Abstract
Rainfall gauges are always sparse in the arid and semi-arid areas of Northwest China, which makes it difficult to precisely study the characteristics of drought at a large scale in this region and similar areas. This study used the TRMM (The Tropical Rainfall [...] Read more.
Rainfall gauges are always sparse in the arid and semi-arid areas of Northwest China, which makes it difficult to precisely study the characteristics of drought at a large scale in this region and similar areas. This study used the TRMM (The Tropical Rainfall Measuring Mission) multi-satellite precipitation data to study the spatial-temporal evolution of drought in the Loess Plateau based on the SPI (Standardized Precipitation Index) drought index for the period of 1998–2014. The results indicate that the monthly TRMM precipitation data are well matched with the observed precipitation, indicating that this remotely sensed data set can be reliably used to calculate the SPI drought index. Based on the study findings, the average precipitation in the Loess Plateau is showing a significant increasing trend at the rate of 4.46 mm/year. From the spatial perspective, the average annual precipitation in the Southeast is generally greater than that in the Northwest. However, the annual precipitation in the Southeast area is showing a decreasing trend, whereas, the annual precipitation in the northwest areas is showing an increasing trend. Through the SPI analysis, the 3-month SPI and 12-month SPI were both showing an increasing trend, which indicates that the drought severity in the Loess Plateau was a generally declining trend at a seasonal to annual time scale. From the spatial perspective, the SPI values in the Central and Northwest of the Loess Plateau were significantly increasing, whereas, the SPI values in the southern area of the Loess Plateau were slightly decreasing. From the seasonal characteristics, the high-risk area for drought in the spring was concentrated in the northeast and southwest part, and in the summer and autumn, the high-risk area was transferred to the south part. Through this study, it is concluded that the Loess Plateau was likely getting wetter during the time period since the Grain-for-Green Project (1999–2012) was implemented, which replaced much farmland with forestry. This is a positive signal for vegetation recovery and ecological restoration in the near future. Full article
(This article belongs to the Special Issue Remote Sensing of Drought Monitoring)
Show Figures

Graphical abstract

21 pages, 5763 KiB  
Article
Detection of Spatiotemporal Extreme Changes in Atmospheric CO2 Concentration Based on Satellite Observations
by Zhonghua He, Liping Lei, Lisa R. Welp, Zhao-Cheng Zeng, Nian Bie, Shaoyuan Yang and Liangyun Liu
Remote Sens. 2018, 10(6), 839; https://doi.org/10.3390/rs10060839 - 28 May 2018
Cited by 15 | Viewed by 5765
Abstract
Atmospheric CO2 concentrations are sensitive to the effects of climate extremes on carbon sources and sinks of the land biosphere. Therefore, extreme changes of atmospheric CO2 can be used to identify anomalous sources and sinks of carbon. In this study, we [...] Read more.
Atmospheric CO2 concentrations are sensitive to the effects of climate extremes on carbon sources and sinks of the land biosphere. Therefore, extreme changes of atmospheric CO2 can be used to identify anomalous sources and sinks of carbon. In this study, we develop a spatiotemporal extreme change detection method for atmospheric CO2 concentrations using column-averaged CO2 dry air mole fraction (XCO2) retrieved from the Greenhouse gases Observing SATellite (GOSAT) from 1 June 2009 to 31 May 2016. For extreme events identified, we attributed the main drivers using surface environmental parameters, including surface skin temperature, self-calibrating Palmer drought severity index, burned area, and gross primary production (GPP). We also tested the sensitivity of XCO2 response to changing surface CO2 fluxes using model simulations and Goddard Earth Observing System (GEOS)-Chem atmospheric transport. Several extreme high XCO2 events are detected around mid-2010 over Eurasia and in early 2016 in the tropics. The magnitudes of extreme XCO2 increases are around 1.5–1.8 ppm in the Northern Hemisphere and 1.2–1.4 ppm in Southern Hemisphere. The spatiotemporal pattern of detected high XCO2 events are similar to patterns of local surface environmental parameter extremes. The extreme high XCO2 events often occurred during periods of increased temperature, severe drought, increased wildfire or reduced GPP. Our sensitivity tests show that the magnitude of detectable anomalies varies with location, for example 25% or larger anomalies in local CO2 emission fluxes are detectable in tropical forest, whereas anomalies must be half again as large in mid-latitudes (~37.5%). In conclusion, we present a method for extreme high XCO2 detection, and large changes in land CO2 fluxes. This provides another tool to monitor large-scale changes in the land carbon sink and potential feedbacks on the climate system. Full article
(This article belongs to the Section Atmospheric Remote Sensing)
Show Figures

Graphical abstract

21 pages, 5268 KiB  
Article
Hydrologic Evaluation of Multi-Source Satellite Precipitation Products for the Upper Huaihe River Basin, China
by Zhiyong Wu, Zhengguang Xu, Fang Wang, Hai He, Jianhong Zhou, Xiaotao Wu and Zhenchen Liu
Remote Sens. 2018, 10(6), 840; https://doi.org/10.3390/rs10060840 - 28 May 2018
Cited by 62 | Viewed by 6664
Abstract
To evaluate the performance and hydrological utility of merged precipitation products at the current technical level of integration, a newly developed merged precipitation product, Multi-Source Weighted-Ensemble Precipitation (MSWEP) Version 2.1 was evaluated in this study based on rain gauge observations and the Variable [...] Read more.
To evaluate the performance and hydrological utility of merged precipitation products at the current technical level of integration, a newly developed merged precipitation product, Multi-Source Weighted-Ensemble Precipitation (MSWEP) Version 2.1 was evaluated in this study based on rain gauge observations and the Variable Infiltration Capacity (VIC) model for the upper Huaihe River Basin, China. For comparison, three satellite-based precipitation products (SPPs), including Climate Hazards Group InfraRed Precipitation with Station data (CHIRPS) Version 2.0, Climate Prediction Center MORPHing technique (CMORPH) bias-corrected product Version 1.0, and Tropical Rainfall Measuring Mission (TRMM) Multi-satellite Precipitation Analysis (TMPA) 3B42 Version 7, were evaluated. The error analysis against rain gauge observations reveals that the merged precipitation MSWEP performs best, followed by TMPA and CMORPH, which in turn outperform CHIRPS. Generally, the contribution of the random error in all four quantitative precipitation estimates (QPEs) is larger than the systematic error. Additionally, QPEs show large uncertainty in the mountainous regions, with larger systematic errors, and tend to underestimate the precipitation. Under two parameterization scenarios, the MSWEP provides the best streamflow simulation results and TMPA forced simulation ranks second. Unfortunately, the CHIRPS and CMORPH forced simulations produce unsatisfactory results. The relative error (RE) of QPEs is the main factor affecting the RE of simulated streamflow, especially for the results of Scenario I (model parameters calibrated by rain gauge observations). However, its influence on the simulated streamflow can be greatly reduced by recalibration of the parameters using the corresponding QPEs (Scenario II). All QPEs forced simulations underestimate the streamflow with exceedance probabilities below 5.0%, while they overestimate the streamflow with exceedance probabilities above 30.0%. The results of the soil moisture simulation indicate that the influence of the precipitation input on the RE of the simulated soil moisture is insignificant. However, the dynamic variation of soil moisture, simulated by precipitation with higher precision, is more consistent with the measured results. The simulation results at a depth of 0–10 cm are more sensitive to the accuracy of precipitation estimates than that for depths of 0–40 cm. In summary, there are notable advantages of MSWEP and TMPA with respect to hydrological applicability compared with CHIRPS and CMORPH. The MSWEP has a greater potential for basin–scale hydrological modeling than TMPA. Full article
(This article belongs to the Special Issue Remote Sensing of Precipitation)
Show Figures

Graphical abstract

21 pages, 8111 KiB  
Article
A Novel Approach to Unsupervised Change Detection Based on Hybrid Spectral Difference
by Li Yan, Wang Xia, Zhan Zhao and Yanran Wang
Remote Sens. 2018, 10(6), 841; https://doi.org/10.3390/rs10060841 - 28 May 2018
Cited by 23 | Viewed by 4076
Abstract
The most commonly used features in unsupervised change detection are spectral characteristics. Traditional methods describe the degree of the change between two pixels by quantifying the difference in spectral values or spectral shapes (spectral curve shapes). However, traditional methods based on variation in [...] Read more.
The most commonly used features in unsupervised change detection are spectral characteristics. Traditional methods describe the degree of the change between two pixels by quantifying the difference in spectral values or spectral shapes (spectral curve shapes). However, traditional methods based on variation in spectral shapes tend to miss the change between two pixels if their spectral curves are close to flat; and traditional methods based on variation in spectral values tend to miss the change between two pixels if their values are low (dark objects). To inhibit the weaknesses of traditional methods, a novel approach to unsupervised change detection based on hybrid spectral difference (HSD) is proposed which combines the difference between spectral values and spectral shapes. First, a new method referred to as change detection based on spectral shapes (CDSS) is proposed that fuses the difference images produced by the spectral correlation mapper (SCM) and spectral gradient difference (SGD) in order to describe the variation in spectral shapes. Second, a method called change detection based on spectral values (CDSV), computing the Euclidean distance between two spectral vectors, is used to obtain a difference image based on the variation in spectral values. Then, the credibility of CDSS and CDSV for every pixel is calculated to describe how appropriate these two methods are for detecting the change. Finally, the difference images produced by CDSS and CDSV are fused with the corresponding credibility to generate the hybrid spectral difference image. Two experiments were carried out on worldview-2/3 and Landsat-7 Enhanced Thematic Mapper Plus (ETM+) datasets, and both qualitative and quantitative results indicated that HSD had superior capabilities of change detection compared with standard change vector analysis (CVA), SCM, SGD and multivariate alteration detection (MAD). The accuracy of CDSS is higher than CDSV in case-1 but lower in case-2 and, compared to the higher one, the overall accuracy and the kappa coefficient of HSD improved by 3.45% and 6.92%, respectively, in the first experiment, and by 1.66% and 3.31%, respectively, in the second experiment. The omission rate dropped by approx. 4.4% in both tests. Full article
Show Figures

Figure 1

20 pages, 2213 KiB  
Article
Classifying the Built-Up Structure of Urban Blocks with Probabilistic Graphical Models and TerraSAR-X Spotlight Imagery
by Tessio Novack and Uwe Stilla
Remote Sens. 2018, 10(6), 842; https://doi.org/10.3390/rs10060842 - 28 May 2018
Cited by 2 | Viewed by 4646
Abstract
Up-to-date maps of a city’s urban structure types (USTs) are very important for effective planning, as well as for different studies and applications. We present an approach for the classification of USTs at the level of urban blocks based on high-resolution spaceborne radar [...] Read more.
Up-to-date maps of a city’s urban structure types (USTs) are very important for effective planning, as well as for different studies and applications. We present an approach for the classification of USTs at the level of urban blocks based on high-resolution spaceborne radar imagery. Images obtained at the satellite’s ascending and descending orbits were used for extracting line and polygon features from each block. Most of the attributes considered in the classification concern the geometry of these features, as well as their spatial disposition inside the blocks. Furthermore, assuming the UST classes of neighboring blocks are probabilistically dependent, we explored the framework of probabilistic graphical models and propose different context-based classification models. These models differ with respect to (i) their type, i.e., Markov or conditional random fields, (ii) their parameterization and (iii) the criterion applied for establishing pairwise neighboring relationships between blocks. In our experiments, 1,695 blocks from the city of Munich (Germany) and five representative UST classes were considered. A standard classification performed with the Random Forest algorithm achieved an overall accuracy of nearly 70%. All context-based classifications achieved overall accuracies up to 7% higher than that. The results indicate that denser pairwise block-neighborhood structures lead to better results and that the accuracy improvement is higher when the strength of the contextual influences is proportional to the similarity of the neighboring blocks attributes. Full article
(This article belongs to the Section Remote Sensing Image Processing)
Show Figures

Figure 1

18 pages, 975 KiB  
Article
Radar Target Recognition Using Salient Keypoint Descriptors and Multitask Sparse Representation
by Ayoub Karine, Abdelmalek Toumi, Ali Khenchaf and Mohammed El Hassouni
Remote Sens. 2018, 10(6), 843; https://doi.org/10.3390/rs10060843 - 28 May 2018
Cited by 28 | Viewed by 4948
Abstract
In this paper, we propose a novel approach to recognize radar targets on inverse synthetic aperture radar (ISAR) and synthetic aperture radar (SAR) images. This approach is based on the multiple salient keypoint descriptors (MSKD) and multitask sparse representation based classification (MSRC). Thus, [...] Read more.
In this paper, we propose a novel approach to recognize radar targets on inverse synthetic aperture radar (ISAR) and synthetic aperture radar (SAR) images. This approach is based on the multiple salient keypoint descriptors (MSKD) and multitask sparse representation based classification (MSRC). Thus, to characterize the targets in the radar images, we combine the scale-invariant feature transform (SIFT) and the saliency map. The purpose of this combination is to reduce the number of SIFT keypoints by keeping only those located in the target area (salient region); this speeds up the recognition process. After that, we compute the feature vectors of the resulting salient SIFT keypoints (MSKD). This methodology is applied for both training and test images. The MSKD of the training images leads to constructing the dictionary of a sparse convex optimization problem. To achieve the recognition, we adopt the MSRC taking into consideration each vector in the MSKD as a task. This classifier solves the sparse representation problem for each task over the dictionary and determines the class of the radar image according to all sparse reconstruction errors (residuals). The effectiveness of the proposed approach method has been demonstrated by a set of extensive empirical results on ISAR and SAR images databases. The results show the ability of the proposed method to predict adequately the aircraft and the ground targets. Full article
(This article belongs to the Special Issue Radar Remote Sensing of Oceans and Coastal Areas)
Show Figures

Graphical abstract

18 pages, 10262 KiB  
Article
Staring Spotlight TerraSAR-X SAR Interferometry for Identification and Monitoring of Small-Scale Landslide Deformation
by Farnoush Hosseini, Manuele Pichierri, Jayson Eppler and Bernhard Rabus
Remote Sens. 2018, 10(6), 844; https://doi.org/10.3390/rs10060844 - 28 May 2018
Cited by 8 | Viewed by 6994
Abstract
We discuss enhanced processing methods for high resolution Synthetic Aperture Radar
(SAR) interferometry (InSAR) to monitor small landslides with difficult spatial characteristics,
such as very steep and rugged terrain, strong spatially heterogeneous surface motion,
and coherence-compromising factors, including vegetation and seasonal snow cover.
[...] Read more.
We discuss enhanced processing methods for high resolution Synthetic Aperture Radar
(SAR) interferometry (InSAR) to monitor small landslides with difficult spatial characteristics,
such as very steep and rugged terrain, strong spatially heterogeneous surface motion,
and coherence-compromising factors, including vegetation and seasonal snow cover. The enhanced
methods mitigate phase bias induced by atmospheric effects, as well as topographic phase errors
in coherent regions of layover, and due to inaccurate blending of high resolution discontinuous
with lower resolution background Digital Surface Models (DSM). We demonstrate the proposed
methods using TerraSAR-X (TSX) Staring Spotlight InSAR data for three test sites reflecting diverse
challenging landslide-prone mountain terrains in British Columbia, Canada. Comparisons with
corresponding standard processing methods show significant improvements with resulting
displacement residuals that reveal additional movement hotspots and unprecedented spatial detail
for active landslides/rockfalls at the investigated sites.

Full article
(This article belongs to the Special Issue Ten Years of TerraSAR-X—Scientific Results)
Show Figures

Figure 1

17 pages, 13710 KiB  
Article
Nowcasting Surface Solar Irradiance with AMESIS via Motion Vector Fields of MSG-SEVIRI Data
by Donatello Gallucci, Filomena Romano, Angela Cersosimo, Domenico Cimini, Francesco Di Paola, Sabrina Gentile, Edoardo Geraldi, Salvatore Larosa, Saverio T. Nilo, Elisabetta Ricciardelli and Mariassunta Viggiano
Remote Sens. 2018, 10(6), 845; https://doi.org/10.3390/rs10060845 - 29 May 2018
Cited by 25 | Viewed by 5948
Abstract
In this study, we compare different nowcasting techniques based upon the calculation of motion vector fields derived from spectral channels of Meteosat Second Generation—Spinning Enhanced Visible and InfraRed Imager (MSG-SEVIRI). The outputs of the nowcasting techniques are used as inputs to the Advanced [...] Read more.
In this study, we compare different nowcasting techniques based upon the calculation of motion vector fields derived from spectral channels of Meteosat Second Generation—Spinning Enhanced Visible and InfraRed Imager (MSG-SEVIRI). The outputs of the nowcasting techniques are used as inputs to the Advanced Model for Estimation of Surface solar Irradiance from Satellite (AMESIS), for predicting surface solar irradiance up to 2 h in advance. In particular, the first part of the methodology consists in projecting the time evolution of each MSG-SEVIRI channel (for every pixel in the spatial domain) through extrapolation of a displacement vector field obtained by matching similar patterns within two successive MSG-SEVIRI data images. Different ways to implement the above method result in substantial differences in the predicted trajectory, leading to different performances depending on the time interval of interest. All the nowcasting techniques considered here systematically outperform the simple persistence method for all MSG-SEVIRI channels and for each case study used in this work; importantly, this occurs across the entire 2 h period of the forecast. In the second part of the algorithm, the predicted irradiance maps computed with AMESIS from the forecasted radiances, are shown to be in good agreement with irradiances derived from MSG measured radiances and improve on numerical weather model predictions, thus providing a feasible alternative for nowcasting surface solar radiation. The results show that the mean values for correlation, bias, and root mean square error vary across the time interval, ranging between 0.94, −1 W/m 2 , 61 W/m 2 after 15 min, and 0.73, −18 W/m 2 , 147 W/m 2 after 2 h, respectively. Full article
(This article belongs to the Special Issue Solar Radiation, Modelling and Remote Sensing)
Show Figures

Graphical abstract

21 pages, 2998 KiB  
Article
A Deep Convolutional Generative Adversarial Networks (DCGANs)-Based Semi-Supervised Method for Object Recognition in Synthetic Aperture Radar (SAR) Images
by Fei Gao, Yue Yang, Jun Wang, Jinping Sun, Erfu Yang and Huiyu Zhou
Remote Sens. 2018, 10(6), 846; https://doi.org/10.3390/rs10060846 - 29 May 2018
Cited by 146 | Viewed by 9895
Abstract
Synthetic aperture radar automatic target recognition (SAR-ATR) has made great progress in recent years. Most of the established recognition methods are supervised, which have strong dependence on image labels. However, obtaining the labels of radar images is expensive and time-consuming. In this paper, [...] Read more.
Synthetic aperture radar automatic target recognition (SAR-ATR) has made great progress in recent years. Most of the established recognition methods are supervised, which have strong dependence on image labels. However, obtaining the labels of radar images is expensive and time-consuming. In this paper, we present a semi-supervised learning method that is based on the standard deep convolutional generative adversarial networks (DCGANs). We double the discriminator that is used in DCGANs and utilize the two discriminators for joint training. In this process, we introduce a noisy data learning theory to reduce the negative impact of the incorrectly labeled samples on the performance of the networks. We replace the last layer of the classic discriminators with the standard softmax function to output a vector of class probabilities so that we can recognize multiple objects. We subsequently modify the loss function in order to adapt to the revised network structure. In our model, the two discriminators share the same generator, and we take the average value of them when computing the loss function of the generator, which can improve the training stability of DCGANs to some extent. We also utilize images of higher quality from the generated images for training in order to improve the performance of the networks. Our method has achieved state-of-the-art results on the Moving and Stationary Target Acquisition and Recognition (MSTAR) dataset, and we have proved that using the generated images to train the networks can improve the recognition accuracy with a small number of labeled samples. Full article
(This article belongs to the Section Remote Sensing Image Processing)
Show Figures

Figure 1

20 pages, 5139 KiB  
Article
Scratching Beneath the Surface: A Model to Predict the Vertical Distribution of Prochlorococcus Using Remote Sensing
by Priscila K. Lange, Robert J. W. Brewin, Giorgio Dall’Olmo, Glen A. Tarran, Shubha Sathyendranath, Mikhail Zubkov and Heather A. Bouman
Remote Sens. 2018, 10(6), 847; https://doi.org/10.3390/rs10060847 - 29 May 2018
Cited by 20 | Viewed by 6712
Abstract
The unicellular cyanobacterium Prochlorococcus is the most dominant resident of the subtropical gyres, which are considered to be the largest biomes on earth. In this study, the spatial and temporal variability in the global distribution of Prochlorococcus was estimated in the Atlantic Ocean [...] Read more.
The unicellular cyanobacterium Prochlorococcus is the most dominant resident of the subtropical gyres, which are considered to be the largest biomes on earth. In this study, the spatial and temporal variability in the global distribution of Prochlorococcus was estimated in the Atlantic Ocean using an empirical model based on data from 13 Atlantic Meridional Transect cruises. Our model uses satellite-derived sea surface temperature (SST), remote-sensing reflectance at 443 and 488 nm, and the water temperature at a depth of 200 m from Argo data. The model divides the population of Prochlorococcus into two groups: ProI, which dominates under high-light conditions associated with the surface, and ProII, which favors low light found near the deep chlorophyll maximum. ProI and ProII are then summed to provide vertical profiles of the concentration of Prochlorococcus cells. This model predicts that Prochlorococcus cells contribute 32 Mt of carbon biomass (7.4 × 1026 cells) to the Atlantic Ocean, concentrated mainly within the subtropical gyres (35%) and areas near the Equatorial Convergence Zone (30%). When projected globally, 3.4 × 1027 Prochlorococcus cells represent 171 Mt of carbon biomass, with 43% of this global biomass allocated to the upper ocean (0–45 m depth). Annual cell standing stocks were relatively stable between the years 2003 and 2014, and the contribution of the gyres varies seasonally as gyres expand and contract, tracking changes in light and temperature, with lowest cell abundances during the boreal and austral winter (1.4 × 10¹³ cells m−2), when surface cell concentrations were highest (9.8 × 10⁴ cells mL−1), whereas the opposite scenario was observed in spring–summer (2 × 10¹³ cells m−2). This model provides a three-dimensional view of the abundance of Prochlorococcus cells, revealing that Prochlorococcus contributes significantly to total phytoplankton biomass in the Atlantic Ocean, and can be applied using either in situ measurements at the sea surface (r2 = 0.83) or remote-sensing observables (r2 = 0.58). Full article
(This article belongs to the Special Issue Remote Sensing of Ocean Colour)
Show Figures

Graphical abstract

24 pages, 5084 KiB  
Article
A Multisensor Approach to Global Retrievals of Land Surface Albedo
by Aku Riihelä, Terhikki Manninen, Jeffrey Key, Qingsong Sun, Melanie Sütterlin, Alessio Lattanzio and Crystal Schaaf
Remote Sens. 2018, 10(6), 848; https://doi.org/10.3390/rs10060848 - 29 May 2018
Cited by 4 | Viewed by 5972
Abstract
Satellite-based retrievals offer the most cost-effective way to comprehensively map the surface albedo of the Earth, a key variable for understanding the dynamics of radiative energy interactions in the atmosphere-surface system. Surface albedo retrievals have commonly been designed separately for each different spaceborne [...] Read more.
Satellite-based retrievals offer the most cost-effective way to comprehensively map the surface albedo of the Earth, a key variable for understanding the dynamics of radiative energy interactions in the atmosphere-surface system. Surface albedo retrievals have commonly been designed separately for each different spaceborne optical imager. Here, we introduce a novel type of processing framework that combines the data from two polar-orbiting optical imager families, the Advanced Very High-Resolution Radiometer (AVHRR) and Moderate Resolution Imaging Spectroradiometer (MODIS). The goal of the paper is to demonstrate that multisensor albedo retrievals can provide a significant reduction in the sampling time required for a robust and comprehensive surface albedo retrieval, without a major degradation in retrieval accuracy, as compared to state-of-the-art single-sensor retrievals. We evaluated the multisensor retrievals against reference in situ albedo measurements and compare them with existing datasets. The results show that global land surface albedo retrievals with a sampling period of 10 days can offer near-complete spatial coverage, with a retrieval bias mostly comparable to existing single sensor datasets, except for bright surfaces (deserts and snow) where the retrieval framework shows degraded performance because of atmospheric correction design compromises. A level difference is found between the single sensor datasets and the demonstrator developed here, pointing towards a need for further work in the atmospheric correction, particularly over bright surfaces, and inter-sensor radiance homogenization. The introduced framework is expandable to include other sensors in the future. Full article
(This article belongs to the Special Issue Remote Sensing of Essential Climate Variables and Their Applications)
Show Figures

Graphical abstract

13 pages, 2159 KiB  
Article
Modeling Photosynthetically Active Radiation from Satellite-Derived Estimations over Mainland Spain
by Jose M. Vindel, Rita X. Valenzuela, Ana A. Navarro, Luis F. Zarzalejo, Abel Paz-Gallardo, José A. Souto, Ramón Méndez-Gómez, David Cartelle and Juan J. Casares
Remote Sens. 2018, 10(6), 849; https://doi.org/10.3390/rs10060849 - 30 May 2018
Cited by 23 | Viewed by 5475
Abstract
A model based on the known high correlation between photosynthetically active radiation (PAR) and global horizontal irradiance (GHI) was implemented to estimate PAR from GHI measurements in this present study. The model has been developed using satellite-derived GHI and PAR estimations. Both variables [...] Read more.
A model based on the known high correlation between photosynthetically active radiation (PAR) and global horizontal irradiance (GHI) was implemented to estimate PAR from GHI measurements in this present study. The model has been developed using satellite-derived GHI and PAR estimations. Both variables can be estimated using Kato bands, provided by Satellite Application Facility on Climate Monitoring (CM-SAF), and its ratio may be used as the variable of interest in order to obtain the model. The study area, which was located in mainland Spain, has been split by cluster analysis into regions with similar behavior, according to this ratio. In each of these regions, a regression model estimating PAR from GHI has been developed. According to the analysis, two regions are distinguished in the study area. These regions belong to the two climates dominating the territory: an Oceanic climate on the northern edge; and a Mediterranean climate with hot summer in the rest of the study area. The models obtained for each region have been checked against the ground measurements, providing correlograms with determination coefficients higher than 0.99. Full article
(This article belongs to the Special Issue Solar Radiation, Modelling and Remote Sensing)
Show Figures

Graphical abstract

25 pages, 5922 KiB  
Article
Short-Term Forecasting of Coastal Surface Currents Using High Frequency Radar Data and Artificial Neural Networks
by Lei Ren, Zhan Hu and Michael Hartnett
Remote Sens. 2018, 10(6), 850; https://doi.org/10.3390/rs10060850 - 31 May 2018
Cited by 17 | Viewed by 4459
Abstract
Accurate and timely information of surface currents is crucial for various operations such as search and rescue, marine renewable energy extraction and oil spill treatment. Conventional approaches to study coastal surface currents are numerical models and observation platforms such as radars and satellites. [...] Read more.
Accurate and timely information of surface currents is crucial for various operations such as search and rescue, marine renewable energy extraction and oil spill treatment. Conventional approaches to study coastal surface currents are numerical models and observation platforms such as radars and satellites. However, both have limits. To efficiently obtain high accuracy short-term forecasting states of oceanic parameters of interest, a robust soft computing approach—Artificial Neural Networks (ANN)—was applied to predict surface currents in a tide- and wind-dominated coastal area. Hourly observed surface currents from a Coastal Ocean Dynamic Application Radar (CODAR) system, and tide and wind data from forecasting models were used to establish ANN models for Galway Bay area. One of the fastest algorithms, resilient back propagation, was used to adapt all weights and biases. This study focused on investigating the sensitivity of an ANN model to a series of different input datasets. Results indicate that correlation between ANN forecasts and observation was greater than 0.9 for both surface velocity components with one-hour lead time. Strong correlation ( 0.75) was obtained between predicted results and radar data for both surface velocity components with three-hour lead time at best. However, forecasting accuracy deteriorated rapidly with longer lead time. By comparison with previous data assimilation models, in this research, best performance was achieved from ANN model’s peak times of the tidally dominant surface velocity component. The forecasts presented in this research show clear improvements over previous attempts at short-term forecasting of wind- and tide-dominated currents using ANN. Full article
(This article belongs to the Special Issue Radar Remote Sensing of Oceans and Coastal Areas)
Show Figures

Figure 1

19 pages, 21136 KiB  
Article
Estimation of Grassland Canopy Height and Aboveground Biomass at the Quadrat Scale Using Unmanned Aerial Vehicle
by Huifang Zhang, Yi Sun, Li Chang, Yu Qin, Jianjun Chen, Yan Qin, Jiaxing Du, Shuhua Yi and Yingli Wang
Remote Sens. 2018, 10(6), 851; https://doi.org/10.3390/rs10060851 - 31 May 2018
Cited by 113 | Viewed by 9154
Abstract
Aboveground biomass is a key indicator of a grassland ecosystem. Accurate estimation from remote sensing is important for understanding the response of grasslands to climate change and disturbance at a large scale. However, the precision of remote sensing inversion is limited by a [...] Read more.
Aboveground biomass is a key indicator of a grassland ecosystem. Accurate estimation from remote sensing is important for understanding the response of grasslands to climate change and disturbance at a large scale. However, the precision of remote sensing inversion is limited by a lack in the ground truth and scale mismatch with satellite data. In this study, we first tried to establish a grassland aboveground biomass estimation model at 1 m2 quadrat scale by conducting synchronous experiments of unmanned aerial vehicle (UAV) and field measurement in three different grassland ecosystems. Two flight modes (the new QUADRAT mode and the commonly used MOSAIC mode) were used to generate point clouds for further processing. Canopy height metrics of each quadrat were then calculated using the canopy height model (CHM). Correlation analysis showed that the mean of the canopy height model (CHM_mean) had a significant linear relationship with field height (R2 = 0.90, root mean square error (RMSE) = 19.79 cm, rRMSE = 16.5%, p < 0.001) and a logarithmic relationship with field aboveground biomass (R2 = 0.89, RMSE = 91.48 g/m2, rRMSE = 16.11%, p < 0.001). We concluded our study by conducting a preliminary application of estimation of the aboveground biomass at a plot scale by jointly using UAV and the constructed 1 m2 quadrat scale estimation model. Our results confirmed that UAV could be used to collect large quantities of ground truths and bridge the scales between ground truth and remote sensing pixels, which were helpful in improving the accuracy of remote sensing inversion of grassland aboveground biomass. Full article
Show Figures

Graphical abstract

17 pages, 2763 KiB  
Article
What Is the Spatial Resolution of grace Satellite Products for Hydrology?
by Bramha Dutt Vishwakarma, Balaji Devaraju and Nico Sneeuw
Remote Sens. 2018, 10(6), 852; https://doi.org/10.3390/rs10060852 - 31 May 2018
Cited by 96 | Viewed by 14460
Abstract
The mass change information from the Gravity Recovery And Climate Experiment (grace) satellite mission is available in terms of noisy spherical harmonic coefficients truncated at a maximum degree (band-limited). Therefore, filtering is an inevitable step in post-processing of grace fields to [...] Read more.
The mass change information from the Gravity Recovery And Climate Experiment (grace) satellite mission is available in terms of noisy spherical harmonic coefficients truncated at a maximum degree (band-limited). Therefore, filtering is an inevitable step in post-processing of grace fields to extract meaningful information about mass redistribution in the Earth-system. It is well known from previous studies that a number can be allotted to the spatial resolution of a band-limited spherical harmonic spectrum and also to a filtered field. Furthermore, it is now a common practice to correct the filtered grace data for signal damage due to filtering (or convolution in the spatial domain). These correction methods resemble deconvolution, and, therefore, the spatial resolution of the corrected grace data have to be reconsidered. Therefore, the effective spatial resolution at which we can obtain mass changes from grace products is an area of debate. In this contribution, we assess the spatial resolution both theoretically and practically. We confirm that, theoretically, the smallest resolvable catchment is directly related to the band-limit of the spherical harmonic spectrum of the grace data. However, due to the approximate nature of the correction schemes and the noise present in grace data, practically, the complete band-limited signal cannot be retrieved. In this context, we perform a closed-loop simulation comparing four popular correction schemes over 255 catchments to demarcate the minimum size of the catchment whose signal can be efficiently recovered by the correction schemes. We show that the amount of closure error is inversely related to the size of the catchment area. We use this trade-off between the error and the catchment size for defining the potential spatial resolution of the grace product obtained from a correction method. The magnitude of the error and hence the spatial resolution are both dependent on the correction scheme. Currently, a catchment of the size ≈63,000 km 2 can be resolved at an error level of 2 cm in terms of equivalent water height. Full article
(This article belongs to the Special Issue Remote Sensing of Groundwater from River Basin to Global Scales)
Show Figures

Figure 1

17 pages, 3527 KiB  
Article
A Multivariate Analysis Framework to Detect Key Environmental Factors Affecting Spatiotemporal Variability of Chlorophyll-a in a Tropical Productive Estuarine-Lagoon System
by Regina Camara Lins, Jean-Michel Martinez, David Da Motta Marques, José Almir Cirilo, Paulo Ricardo Petter Medeiros and Carlos Ruberto Fragoso Júnior
Remote Sens. 2018, 10(6), 853; https://doi.org/10.3390/rs10060853 - 1 Jun 2018
Cited by 13 | Viewed by 4797
Abstract
Here, we demonstrate how a combination of three multivariate statistic techniques can identify key environmental factors affecting the seasonal and spatial variability of chlorophyll-a (Chl-a) in a productive tropical estuarine-lagoon system. Remote estimation of Chl-a was carried out using a NIR-Red model based [...] Read more.
Here, we demonstrate how a combination of three multivariate statistic techniques can identify key environmental factors affecting the seasonal and spatial variability of chlorophyll-a (Chl-a) in a productive tropical estuarine-lagoon system. Remote estimation of Chl-a was carried out using a NIR-Red model based on MODIS bands, which is highly consistent with the in situ measurement of Chl-a with root mean square error (RMSE) of 15.24 mg m−3 and 13.43 mg m−3 for two independent datasets used for the model’s calibration and validation, respectively. Our findings suggest that the river discharges and hydraulic residence time of the lagoons promote a stronger effect on the spatial variability of Chl-a in the coastal lagoons, while wind, solar radiation and temperature have a secondary importance. The results also indicate a slight seasonal variability of Chl-a in Mundaú lagoon, which are different the from Manguaba lagoon. The multivariate approach was able to fully understand the relative importance of key environmental factors on the spatiotemporal variability of Chl-a of the aquatic ecosystem, providing a powerful tool for reducing dimensionality and analyzing large amounts of satellite-derived Chl-a data. Full article
(This article belongs to the Special Issue Remote Sensing of Inland Waters and Their Catchments)
Show Figures

Graphical abstract

21 pages, 15356 KiB  
Article
Using Multi-Spectral UAV Imagery to Extract Tree Crop Structural Properties and Assess Pruning Effects
by Kasper Johansen, Tri Raharjo and Matthew F. McCabe
Remote Sens. 2018, 10(6), 854; https://doi.org/10.3390/rs10060854 - 1 Jun 2018
Cited by 112 | Viewed by 11418
Abstract
Unmanned aerial vehicles (UAV) provide an unprecedented capacity to monitor the development and dynamics of tree growth and structure through time. It is generally thought that the pruning of tree crops encourages new growth, has a positive effect on fruiting, makes fruit-picking easier, [...] Read more.
Unmanned aerial vehicles (UAV) provide an unprecedented capacity to monitor the development and dynamics of tree growth and structure through time. It is generally thought that the pruning of tree crops encourages new growth, has a positive effect on fruiting, makes fruit-picking easier, and may increase yield, as it increases light interception and tree crown surface area. To establish the response of pruning in an orchard of lychee trees, an assessment of changes in tree structure, i.e., tree crown perimeter, width, height, area and Plant Projective Cover (PPC), was undertaken using multi-spectral UAV imagery collected before and after a pruning event. While tree crown perimeter, width and area could be derived directly from the delineated tree crowns, height was estimated from a produced canopy height model and PPC was most accurately predicted based on the NIR band. Pre- and post-pruning results showed significant differences in all measured tree structural parameters, including an average decrease in tree crown perimeter of 1.94 m, tree crown width of 0.57 m, tree crown height of 0.62 m, tree crown area of 3.5 m2, and PPC of 14.8%. In order to provide guidance on data collection protocols for orchard management, the impact of flying height variations was also examined, offering some insight into the influence of scale and the scalability of this UAV-based approach for larger orchards. The different flying heights (i.e., 30, 50 and 70 m) produced similar measurements of tree crown width and PPC, while tree crown perimeter, area and height measurements decreased with increasing flying height. Overall, these results illustrate that routine collection of multi-spectral UAV imagery can provide a means of assessing pruning effects on changes in tree structure in commercial orchards, and highlight the importance of collecting imagery with consistent flight configurations, as varying flying heights may cause changes to tree structural measurements. Full article
Show Figures

Graphical abstract

20 pages, 5450 KiB  
Article
Sentinel-MSI VNIR and SWIR Bands Sensitivity Analysis for Soil Salinity Discrimination in an Arid Landscape
by Abderrazak Bannari, Ali El-Battay, Rachid Bannari and Hassan Rhinane
Remote Sens. 2018, 10(6), 855; https://doi.org/10.3390/rs10060855 - 1 Jun 2018
Cited by 77 | Viewed by 7509
Abstract
Depending on the band position on the electromagnetic spectrum, optical and electronic characteristics, sensors collect the reflected energy by the Earth’s surface and the atmosphere. Currently, the availability of the new generation of medium resolution, such as the Multi-Spectral Instrument (MSI) on board [...] Read more.
Depending on the band position on the electromagnetic spectrum, optical and electronic characteristics, sensors collect the reflected energy by the Earth’s surface and the atmosphere. Currently, the availability of the new generation of medium resolution, such as the Multi-Spectral Instrument (MSI) on board the Sentinel-2 satellite, offers new opportunities for long-term high-temporal frequency for Earth’s surfaces observation and monitoring. This paper focuses on the analysis and the comparison of the visible, the near-infrared (VNIR), and the shortwave infrared (SWIR) spectral bands of the MSI for soil salinity discrimination in an arid landscape. To achieve these, a field campaign was organized, and 160 soil samples were collected with various degrees of soil salinity, including non-saline soil samples. The bidirectional reflectance factor was measured above each soil sample in a goniometric laboratory using an ASD (Analytical Spectral Devices) spectroradiometer. In the laboratory work, pHs, electrical conductivity (EC-Lab), and the major soluble cations (Na+, K+, Ca2++, and Mg2+) and anions (CO32−, HCO3, Cl, and SO42−) were measured using extraction from a saturated soil paste, and the sodium adsorption ratio (SAR) was calculated using a standard procedure. These parameters, in addition to the field observations, were used to interpret and investigate the spectroradiometric measurements and their relevant transformations using the continuum removed reflectance spectrum (CRRS) and the first derivative (FD). Moreover, the acquired spectra over all the soil samples were resampled and convolved in the solar-reflective spectral bands using the Canadian Modified Herman transfer radiative code (CAM5S) and the relative spectral response profiles characterizing the Sentinel-MSI band filters. The statistical analyses conducted were based on the second-order polynomial regression (p < 0.05) between the measured EC-Lab and the reflectances in the MSI convolved spectral bands. The results obtained indicate the limitation of VNIR bands and the potential of SWIR domain for soil salinity classes’ discrimination. The CRRS and the FD analyses highlighted a serious spectral-signal confusion between the salt and the soil optical properties (i.e., color and brightness) in the VNIR bands. Likewise, the results stressed the independence of the SWIR domain vis-a-vis these soil artifacts and its capability to differentiate significantly among several soil salinity classes. Moreover, the statistical fit between each MSI individual spectral band and EC-Lab corroborates this trend, which revealed that only the SWIR bands were correlated significantly (R2 of 50% and 64%, for SWIR-1 and SWIR-2, respectively), while the R2 between the VNIR bands and EC-Lab remains less than 9%. According to the convergence of these four independent analysis methods, it is concluded that the Sentinel-MSI SWIR bands are excellent candidates for an integration in soil salinity modeling and monitoring at local, regional, and global scales. Full article
Show Figures

Graphical abstract

17 pages, 4929 KiB  
Article
Global Land Cover Heterogeneity Characteristics at Moderate Resolution for Mixed Pixel Modeling and Inversion
by Wentao Yu, Jing Li, Qinhuo Liu, Yelu Zeng, Jing Zhao, Baodong Xu and Gaofei Yin
Remote Sens. 2018, 10(6), 856; https://doi.org/10.3390/rs10060856 - 1 Jun 2018
Cited by 31 | Viewed by 4478
Abstract
Spatial heterogeneity is present in the land surface at every scale and is one of the key factors that introduces inherent uncertainty into simulations of land surface processes and parameter retrieval based on remotely sensed data. Because of a lack of understanding of [...] Read more.
Spatial heterogeneity is present in the land surface at every scale and is one of the key factors that introduces inherent uncertainty into simulations of land surface processes and parameter retrieval based on remotely sensed data. Because of a lack of understanding of the heterogeneous characteristics of global mixed pixels, few studies have focused on modeling and inversion algorithms in heterogeneous areas. This paper presents a parameterization scheme to describe land cover heterogeneity quantitatively by composition and boundary information based on high-resolution land cover products. Global heterogeneity features at the 1-km scale are extracted from the ‘GlobeLand30’ land cover dataset with a spatial resolution of 30 m. The composition analysis of global mixed pixels shows that only 35% of pixels over the land surface of Earth are covered by a single land cover type, namely, pure pixels, and only 25.8% are located in vegetated areas. Pixels mixed with water are more common than pixels mixed with any other non-vegetation type. The fragmentation analysis of typical biomes based on the boundary length shows that the savanna is the most heterogeneous biome, while the evergreen broadleaf forest is the least heterogeneous. Deciduous needleleaf forests are significantly affected by canopy height differences, while crop and grass biomes are less affected. Lastly, the strengths and limitations of the method and the application of the land cover heterogeneity characteristics extracted in this study are discussed. Full article
Show Figures

Graphical abstract

14 pages, 22300 KiB  
Article
Retrieving Three-Dimensional Co-Seismic Deformation of the 2017 Mw7.3 Iraq Earthquake by Multi-Sensor SAR Images
by Zhiheng Wang, Rui Zhang, Xiaowen Wang and Guoxiang Liu
Remote Sens. 2018, 10(6), 857; https://doi.org/10.3390/rs10060857 - 1 Jun 2018
Cited by 19 | Viewed by 4955
Abstract
The Mw7.3 Iraq earthquake on 12 November 2017 was the largest recorded earthquake in the Zagros Mountains since 1900. In order to quantitatively analyze the co-seismic deformation caused by this earthquake, both the ascending and descending SAR images from the Japan Aerospace Exploration [...] Read more.
The Mw7.3 Iraq earthquake on 12 November 2017 was the largest recorded earthquake in the Zagros Mountains since 1900. In order to quantitatively analyze the co-seismic deformation caused by this earthquake, both the ascending and descending SAR images from the Japan Aerospace Exploration Agency’s ALOS-2 and the European Space Agency’s Sentinel-1A satellites were collected to implement the conventional differential interferometric synthetic aperture radar (DInSAR), multiple aperture InSAR (MAI), and azimuth pixel offset (AZO) methods. Subsequently, the three-dimensional (3D) deformation field was reconstructed over an area of about 60 × 70 km2 by a combined use of the line-of-sight (LOS) motion (detected by the DInSAR method) and the along-track (AT) motion (detected by the MAI method) through the weighted least square method. The experiment indicates that the ALOS-2 satellite performs better than the Sentinel-1A sensor in larger-magnitude earthquake deformation monitoring. Furthermore, the MAI method based on phase differencing has a better performance than the AZO method based on SAR amplitude correlation, as long as the coherence of the interferograms is sufficient. The maximum co-seismic displacements in the up–down, north–south, and east–west directions are approximately 100 cm, 100 cm, and −50 cm, respectively. After comparative analysis between the obtained 3D deformation field and the simulated deformation field with the fault parameters published by the USGS (United States Geological Survey), both co-seismic deformation fields are highly coincident, and the residuals between both (in different directions/dimensional) are in the magnitude of centimeters. Considering the geological structure in the earthquake region and factors of the LOS and 3D co-seismic deformation—such as the trend and location of the deformation bound, the different sign of displacements in hanging wall and footwall, and the locations of mainshock and aftershock—the preliminary conclusion is that the Zagros Mountain Front fault is responsible for the earthquake. Full article
Show Figures

Graphical abstract

19 pages, 3457 KiB  
Article
Night-Time Light Dynamics during the Iraqi Civil War
by Xi Li, Shanshan Liu, Michael Jendryke, Deren Li and Chuanqing Wu
Remote Sens. 2018, 10(6), 858; https://doi.org/10.3390/rs10060858 - 1 Jun 2018
Cited by 73 | Viewed by 10481
Abstract
In this study, we analyzed the night-time light dynamics in Iraq over the period 2012–2017 by using Visible Infrared Imaging Radiometer Suite (VIIRS) monthly composites. The data quality of VIIRS images was improved by repairing the missing data, and the Night-time Light Ratio [...] Read more.
In this study, we analyzed the night-time light dynamics in Iraq over the period 2012–2017 by using Visible Infrared Imaging Radiometer Suite (VIIRS) monthly composites. The data quality of VIIRS images was improved by repairing the missing data, and the Night-time Light Ratio Indices (NLRIs), derived from urban extent map and night-time light images, were calculated for different provinces and cities. We found that when the Islamic State of Iraq and Syria (ISIS) attacked or occupied a region, the region lost its light rapidly, with the provinces of Al-Anbar, At-Ta’min, Ninawa, and Sala Ad-din losing 63%, 73%, 88%, and 56%, of their night-time light, respectively, between December 2013 and December 2014. Moreover, the light returned after the Iraqi Security Forces (ISF) recaptured the region. In addition, we also found that the night-time light in the Kurdish Autonomous Region showed a steady decline after 2014, with the Arbil, Dihok, and As-Sulaymaniyah provinces losing 47%, 18%, and 31% of their night-time light between December 2013 and December 2016 as a result of the economic crisis in the region. The night-time light in Southern Iraq, the region controlled by Iraqi central government, has grown continuously; for example, the night-time light in Al Basrah increased by 75% between December 2013 and December 2017. Regions formerly controlled by ISIS experienced a return of night-time light during 2017 as the ISF retook almost all this territory in 2017. This indicates that as reconstruction began, electricity was re-supplied in these regions. Our analysis shows the night-time light in Iraq is directly linked to the socioeconomic dynamics of Iraq, and demonstrates that the VIIRS monthly night-time light images are an effective data source for tracking humanitarian disasters in that country. Full article
(This article belongs to the Special Issue Remote Sensing of Night Lights – Beyond DMSP)
Show Figures

Figure 1

23 pages, 5798 KiB  
Article
Analysis of Spatiotemporal Dynamics of the Chinese Vegetation Net Primary Productivity from the 1960s to the 2000s
by Erping Shang, Erqi Xu, Hongqi Zhang and Fang Liu
Remote Sens. 2018, 10(6), 860; https://doi.org/10.3390/rs10060860 - 1 Jun 2018
Cited by 26 | Viewed by 6361
Abstract
Field net primary productivity (NPP) is useful in research modeling of regional and global carbon cycles and for validating results by remote sensing or process-based models. In this study, we used multiple models of NPP estimation and vegetation classification methods to study Chinese [...] Read more.
Field net primary productivity (NPP) is useful in research modeling of regional and global carbon cycles and for validating results by remote sensing or process-based models. In this study, we used multiple models of NPP estimation and vegetation classification methods to study Chinese vegetation NPP characteristics, trends, and drivers using 7618 field measurements from the 1960s, 1980s, and 2000s. The values of other relevant NPP models, as well as process-based simulation and remote sensing models, were compared. Our results showed that NPP ranged from 3 to 12,407 gC·m−2·year−1 with a mean value of 571 gC·m−2·year−1. Vegetation NPP gradually decreased from the southeast to the northwest. Forest, farmland, and grassland NPP was 1152, 294, and 518 gC·m−2·year−1, respectively. Total NPP of grassland was higher than that of farmland. Total terrestrial NPP decreased from 3.58 to 3.41 Pg C·year−1 from the 1960s to the 2000s, a decadal decrease of 4.7%. Total NPP in forests and grasslands consistently showed a decreasing trend and decreased by 0.46 Pg C·year−1and 0.16 Pg C·year−1, respectively, whereas NPP for farmland showed an opposite trend, with a growth of 0.45 Pg C·year−1. Our research findings filled gaps in the information regarding NPP for the entire landmass of China based on field data from a long-term time series and provide valuable information and a basis for validation analyses by remote sensing models, as well as a robust quantification of carbon estimation to anticipate future development at the national and global scale. Full article
(This article belongs to the Section Biogeosciences Remote Sensing)
Show Figures

Graphical abstract

16 pages, 2670 KiB  
Article
Internal Solitary Waves in the Andaman Sea: New Insights from SAR Imagery
by Jorge M. Magalhaes and José C. B. Da Silva
Remote Sens. 2018, 10(6), 861; https://doi.org/10.3390/rs10060861 - 1 Jun 2018
Cited by 66 | Viewed by 7692
Abstract
The Andaman Sea in the Indian Ocean has been a classical study region for Internal Solitary Waves (ISWs) for several decades. Papers such as Osborne and Burch (1980) usually describe mode-1 packets of ISWs propagating eastwards, separated by distances of around 100 km. [...] Read more.
The Andaman Sea in the Indian Ocean has been a classical study region for Internal Solitary Waves (ISWs) for several decades. Papers such as Osborne and Burch (1980) usually describe mode-1 packets of ISWs propagating eastwards, separated by distances of around 100 km. In this paper, we report on shorter period solitary-like waves that are consistent with a mode-2 vertical structure, which are observed along the Ten Degree Channel, and propagate side-by-side the usual large mode-1 solitary wave packets. The mode-2 waves are identified in TerraSAR-X images because of their distinct surface signatures, which are reversed when compared to those that are typical of mode-1 ISWs in the ocean. These newly observed regularly-spaced packets of ISW-like waves are characterized by average separations of roughly 30 km, which are far from the nominal mode-1 or even the mode-2 internal tidal wavelengths. On some occasions, five consecutive and regularly spaced mode-2 ISW-like wave envelopes were observed simultaneously in the same TerraSAR-X image. This fact points to a tidal generation mechanism somewhere in the west shallow ridges, south of the Nicobar Islands. Furthermore, it implies that unusually long-lived mode-2 waves can be found throughout the majority of the fortnightly tidal cycle. Ray tracing techniques are used to identify internal tidal beams as a possible explanation for the generation of the mode-2 solitary-like waves when the internal tidal beam interacts with the ocean pycnocline. Linear theory suggests that resonant coupling with long internal waves of higher-mode could explain the longevity of the mode-2 waves, which propagate for more than 100 km. Owing to their small-scale dimensions, the mode-2 waves may have been overlooked in previous remote sensing images. The enhanced radiometric resolution of the TerraSAR-X, alongside its wide coverage and detailed spatial resolutions, make it an ideal observational tool for the present study. Full article
(This article belongs to the Special Issue Ten Years of TerraSAR-X—Scientific Results)
Show Figures

Graphical abstract

20 pages, 9780 KiB  
Article
Focusing High-Resolution Highly-Squinted Airborne SAR Data with Maneuvers
by Shiyang Tang, Linrang Zhang and Hing Cheung So
Remote Sens. 2018, 10(6), 862; https://doi.org/10.3390/rs10060862 - 1 Jun 2018
Cited by 19 | Viewed by 5108
Abstract
Maneuvers provide flexibility for high-resolution highly-squinted (HRHS) airborne synthetic aperture radar (SAR) imaging and also mean complex signal properties in the echoes. In this paper, considering the curved path described by the fifth-order motion parameter model, effects of the third- and higher-order motion [...] Read more.
Maneuvers provide flexibility for high-resolution highly-squinted (HRHS) airborne synthetic aperture radar (SAR) imaging and also mean complex signal properties in the echoes. In this paper, considering the curved path described by the fifth-order motion parameter model, effects of the third- and higher-order motion parameters on imaging are analyzed. The results indicate that the spatial variations distributed in range, azimuth, and height directions, have great impacts on imaging qualities, and they should be eliminated when designing the focusing approach. In order to deal with this problem, the spatial variations are decomposed into three main parts: range, azimuth, and cross-coupling terms. The cross-coupling variations are corrected by polynomial phase filter, whereas the range and azimuth terms are removed via Stolt mapping. Different from the traditional focusing methods, the cross-coupling variations can be removed greatly by the proposed approach. Implementation considerations are also included. Simulation results prove the effectiveness of the proposed approach. Full article
Show Figures

Figure 1

32 pages, 964 KiB  
Article
Optimizing Lidars for Wind Turbine Control Applications—Results from the IEA Wind Task 32 Workshop
by Eric Simley, Holger Fürst, Florian Haizmann and David Schlipf
Remote Sens. 2018, 10(6), 863; https://doi.org/10.3390/rs10060863 - 1 Jun 2018
Cited by 53 | Viewed by 7744
Abstract
IEA Wind Task 32 serves as an international platform for the research community and industry to identify and mitigate barriers to the use of lidars in wind energy applications. The workshop “Optimizing Lidar Design for Wind Energy Applications” was held in July 2016 [...] Read more.
IEA Wind Task 32 serves as an international platform for the research community and industry to identify and mitigate barriers to the use of lidars in wind energy applications. The workshop “Optimizing Lidar Design for Wind Energy Applications” was held in July 2016 to identify lidar system properties that are desirable for wind turbine control applications and help foster the widespread application of lidar-assisted control (LAC). One of the main barriers this workshop aimed to address is the multidisciplinary nature of LAC. Since lidar suppliers, wind turbine manufacturers, and researchers typically focus on their own areas of expertise, it is possible that current lidar systems are not optimal for control purposes. This paper summarizes the results of the workshop, addressing both practical and theoretical aspects, beginning with a review of the literature on lidar optimization for control applications. Next, barriers to the use of lidar for wind turbine control are identified, such as availability and reliability concerns, followed by practical suggestions for mitigating those barriers. From a theoretical perspective, the optimization of lidar scan patterns by minimizing the error between the measurements and the rotor effective wind speed of interest is discussed. Frequency domain methods for directly calculating measurement error using a stochastic wind field model are reviewed and applied to the optimization of several continuous wave and pulsed Doppler lidar scan patterns based on commercially-available systems. An overview of the design process for a lidar-assisted pitch controller for rotor speed regulation highlights design choices that can impact the usefulness of lidar measurements beyond scan pattern optimization. Finally, using measurements from an optimized scan pattern, it is shown that the rotor speed regulation achieved after optimizing the lidar-assisted control scenario via time domain simulations matches the performance predicted by the theoretical frequency domain model. Full article
(This article belongs to the Special Issue Remote Sensing of Atmospheric Conditions for Wind Energy Applications)
Show Figures

Graphical abstract

30 pages, 5365 KiB  
Article
Implementation of the Principal Component Analysis onto High-Performance Computer Facilities for Hyperspectral Dimensionality Reduction: Results and Comparisons
by Ernestina Martel, Raquel Lazcano, José López, Daniel Madroñal, Rubén Salvador, Sebastián López, Eduardo Juarez, Raúl Guerra, César Sanz and Roberto Sarmiento
Remote Sens. 2018, 10(6), 864; https://doi.org/10.3390/rs10060864 - 1 Jun 2018
Cited by 34 | Viewed by 7905
Abstract
Dimensionality reduction represents a critical preprocessing step in order to increase the efficiency and the performance of many hyperspectral imaging algorithms. However, dimensionality reduction algorithms, such as the Principal Component Analysis (PCA), suffer from their computationally demanding nature, becoming advisable for their implementation [...] Read more.
Dimensionality reduction represents a critical preprocessing step in order to increase the efficiency and the performance of many hyperspectral imaging algorithms. However, dimensionality reduction algorithms, such as the Principal Component Analysis (PCA), suffer from their computationally demanding nature, becoming advisable for their implementation onto high-performance computer architectures for applications under strict latency constraints. This work presents the implementation of the PCA algorithm onto two different high-performance devices, namely, an NVIDIA Graphics Processing Unit (GPU) and a Kalray manycore, uncovering a highly valuable set of tips and tricks in order to take full advantage of the inherent parallelism of these high-performance computing platforms, and hence, reducing the time that is required to process a given hyperspectral image. Moreover, the achieved results obtained with different hyperspectral images have been compared with the ones that were obtained with a field programmable gate array (FPGA)-based implementation of the PCA algorithm that has been recently published, providing, for the first time in the literature, a comprehensive analysis in order to highlight the pros and cons of each option. Full article
(This article belongs to the Special Issue GPU Computing for Geoscience and Remote Sensing)
Show Figures

Figure 1

18 pages, 11448 KiB  
Article
Quantitative Assessment of Digital Image Correlation Methods to Detect and Monitor Surface Displacements of Large Slope Instabilities
by Valentin Tertius Bickel, Andrea Manconi and Florian Amann
Remote Sens. 2018, 10(6), 865; https://doi.org/10.3390/rs10060865 - 1 Jun 2018
Cited by 79 | Viewed by 11891
Abstract
We evaluate the capability of three different digital image correlation (DIC) algorithms to measure long-term surface displacement caused by a large slope instability in the Swiss Alps. DIC was applied to high-resolution optical imagery taken by airborne sensors, and the accuracy of the [...] Read more.
We evaluate the capability of three different digital image correlation (DIC) algorithms to measure long-term surface displacement caused by a large slope instability in the Swiss Alps. DIC was applied to high-resolution optical imagery taken by airborne sensors, and the accuracy of the displacements assessed against global navigation satellite system measurements. A dynamic radiometric correction of the input images prior to DIC application was shown to enhance both the correlation success and accuracy. Moreover, a newly developed spatial filter considering the displacement direction and magnitude proved to be an effective tool to enhance DIC performance and accuracy. Our results show that all algorithms are capable of quantifying slope instability displacements, with average errors ranging from 8 to 12% of the observed maximum displacement, depending on the DIC processing parameters, and the pre- and postprocessing of the in- and output. Among the tested approaches, the results based on a fast Fourier transform correlation approach provide a considerably better spatial coverage of the displacement field of the slope instability. The findings of this study are relevant for slope instability detection and monitoring via DIC, especially in the context of an ever-increasing availability of high-resolution air- and spaceborne imagery. Full article
(This article belongs to the Special Issue Landslide Hazard and Risk Assessment)
Show Figures

Graphical abstract

21 pages, 7010 KiB  
Article
Changes in the Lake Area of Tonle Sap: Possible Linkage to Runoff Alterations in the Lancang River?
by Xuan Ji, Yungang Li, Xian Luo and Daming He
Remote Sens. 2018, 10(6), 866; https://doi.org/10.3390/rs10060866 - 2 Jun 2018
Cited by 34 | Viewed by 6002
Abstract
Tonle Sap Lake is the largest freshwater lake in Southeast Asia. Water development infrastructures are increasingly being constructed in the Lancang–Mekong River Basin, which is a major concern considering its potential impact on Tonle Sap Lake. This study aimed to investigate variations in [...] Read more.
Tonle Sap Lake is the largest freshwater lake in Southeast Asia. Water development infrastructures are increasingly being constructed in the Lancang–Mekong River Basin, which is a major concern considering its potential impact on Tonle Sap Lake. This study aimed to investigate variations in the area of the lake and discuss their possible linkage to runoff alterations in the Lancang River (Upper Mekong) by comparing runoff at the Yunjinghong hydrological station before and after significant changes in runoff trends that occurred in 2008. First, four commonly used water body extraction methods (MNDWI, NDWI, NDVI, and EVI) were compared and MNDWI was found to provide a better and more stable performance. Based on MOD09A1 data, MNDWI was used to extract the water area of the lake from 2000 to 2014, and characteristics of variations in the area before and after 2008 were analyzed. The water area of Tonle Sap Lake displayed an overall decreasing trend, and specifically decreased by 8.3% during the flood season and by 1.5% on average during the dry season after 2008. Seasonal variations in the water area of Tonle Sap Lake were dominantly influenced by runoff from the Mekong River. Compared with the period 2000–2007, runoff at Yunjinghong station were increased during the dry season (20.74%) and decreased during the flood season (34.25%) between 2008 and 2014. Changes in upstream runoff contributed to runoff at the Stung Treng station in the lower Mekong River by 6.17% (dry season) and −2.41% (flood season). Evidently, the operation of dams in the Lancang River does not primarily account for the area decrease of Tonle Sap Lake during the flood season. In contrast, runoff increase during the dry season mitigates the area decrease of Tonle Sap Lake to a certain extent. Full article
(This article belongs to the Section Remote Sensing in Geology, Geomorphology and Hydrology)
Show Figures

Figure 1

18 pages, 4083 KiB  
Article
The Application of Discrete Wavelet Transform with Improved Partial Least-Squares Method for the Estimation of Soil Properties with Visible and Near-Infrared Spectral Data
by Guoqiang Wang, Wei Wang, Qingqing Fang, Hong Jiang, Qinchuan Xin and Baolin Xue
Remote Sens. 2018, 10(6), 867; https://doi.org/10.3390/rs10060867 - 2 Jun 2018
Cited by 19 | Viewed by 5130
Abstract
This study evaluated whether wavelet functions (Bior1.3, Bior2.4, Db4, Db8, Haar, Sym4, and Sym8) and decomposition levels (Levels 3–8) can estimate soil properties. The analysis is based on the discrete wavelet transform with partial least-squares (DWT–PLS) method, incorporated into a visible and near-infrared [...] Read more.
This study evaluated whether wavelet functions (Bior1.3, Bior2.4, Db4, Db8, Haar, Sym4, and Sym8) and decomposition levels (Levels 3–8) can estimate soil properties. The analysis is based on the discrete wavelet transform with partial least-squares (DWT–PLS) method, incorporated into a visible and near-infrared reflectance analysis. The improved DWT–PLS method (called DWT–Stepwise-PLS) enhances the accuracy of the quantitative analysis model with DWT–PLS. The cation exchange capacity (CEC) was best estimated by the DWT–PLS model using the Haar wavelet function. This model yielded the highest coefficient of determination (Rv2 = 0.787, p < 0.001), with the highest relative percentage deviation (RPD = 2.047) and lowest root mean square error (RMSE = 4.16) for the validation data set of the CEC. The RPD of the SOM predictions by DWT–PLS using the Bior1.3 wavelet function was maximized at 1.441 (Rv2 = 0.642, RMSE = 5.96), highlighting the poor overall predictive ability of soil organic matter (SOM) by DWT–PLS. Furthermore, the best performing decomposition levels of the wavelet function were distributed in the fifth, sixth, and seventh levels. For various wavelet functions and decomposition levels, the DWT–Stepwise-PLS method more accurately predicted the quantified soil properties than the DWT–PLS model. DWT–Stepwise-PLS using the Haar wavelet function remained the best choice for quantifying the CEC (Rv2 = 0.92, p < 0.001, RMSE = 4.91, and RPD = 3.57), but the SOM was better predicted by DWT–Stepwise-PLS using the Bior2.4 wavelet function (Rv2 = 0.8, RMSE = 5.34, and RPD = 2.24) instead of the Bior1.3 wavelet function. However, the performance of the DWT–Stepwise-PLS method tended to degrade at high and low decomposition levels of the DWT. These degradations were attributed to a lack of sufficient information and noise, respectively. Full article
Show Figures

Figure 1

32 pages, 54017 KiB  
Article
Monitoring and Characterizing Heterogeneous Mediterranean Landscapes with Continuous Textural Indices Based on VHSR Imagery
by Marc Lang, Samuel Alleaume, Sandra Luque, Nicolas Baghdadi and Jean-Baptiste Féret
Remote Sens. 2018, 10(6), 868; https://doi.org/10.3390/rs10060868 - 2 Jun 2018
Cited by 7 | Viewed by 6261
Abstract
Remote sensing tools (RS) can contribute to a better understanding of the diversity of natural and semi-naturals habitats, their spatial distribution, and their conservation status. RS can also provide a generic set of derived indicators to support local to regional habitat monitoring. Here [...] Read more.
Remote sensing tools (RS) can contribute to a better understanding of the diversity of natural and semi-naturals habitats, their spatial distribution, and their conservation status. RS can also provide a generic set of derived indicators to support local to regional habitat monitoring. Here we propose a set of synthetic continuous textural indices computed from high spatial resolution airborne images for the characterization of vegetation structure in very heterogeneous landscape mosaics. These indices are based on Fourier-based textural ordination (FOTO) of very-high-resolution images. We investigate the relationship between textural indices and a set of common landscape metrics derived from vegetation maps, identifying four strata of interest: bare soil, herbs, low ligneous, and high ligneous. We identify two continuous textural indices, the first one being related to vegetation strata fragmentation and the second being related to the dominance of high ligneous. The combination of these two textural indices with the Normalized Difference Vegetation Index (NDVI) provides a synoptic and accurate overview of the spatial organization of the different vegetation strata. The methodological approach presented herein has a generic value in response to national conservation targets in the context of mapping relevant habitat indicators. Full article
(This article belongs to the Section Remote Sensing in Agriculture and Vegetation)
Show Figures

Figure 1

23 pages, 23484 KiB  
Article
The Potential and Challenges of Using Soil Moisture Active Passive (SMAP) Sea Surface Salinity to Monitor Arctic Ocean Freshwater Changes
by Wenqing Tang, Simon Yueh, Daqing Yang, Alexander Fore, Akiko Hayashi, Tong Lee, Severine Fournier and Benjamin Holt
Remote Sens. 2018, 10(6), 869; https://doi.org/10.3390/rs10060869 - 4 Jun 2018
Cited by 65 | Viewed by 7081
Abstract
Sea surface salinity (SSS) links various components of the Arctic freshwater system. SSS responds to freshwater inputs from river discharge, sea ice change, precipitation and evaporation, and oceanic transport through the open straits of the Pacific and Atlantic oceans. However, in situ SSS [...] Read more.
Sea surface salinity (SSS) links various components of the Arctic freshwater system. SSS responds to freshwater inputs from river discharge, sea ice change, precipitation and evaporation, and oceanic transport through the open straits of the Pacific and Atlantic oceans. However, in situ SSS data in the Arctic Ocean are very sparse and insufficient to depict the large-scale variability to address the critical question of how climate variability and change affect the Arctic Ocean freshwater. The L-band microwave radiometer on board the NASA Soil Moisture Active Passive (SMAP) mission has been providing SSS measurements since April 2015, at approximately 60 km resolution with Arctic Ocean coverage in 1–2 days. With improved land/ice correction, the SMAP SSS algorithm that was developed at the Jet Propulsion Laboratory (JPL) is able to retrieve SSS in ice-free regions 35 km of the coast. SMAP observes a large-scale contrast in salinity between the Atlantic and Pacific sides of the Arctic Ocean, while retrievals within the Arctic Circle vary over time, depending on the sea ice coverage and river runoff. We assess the accuracy of SMAP SSS through comparative analysis with in situ salinity data collected by Argo floats, ships, gliders, and in field campaigns. Results derived from nearly 20,000 pairs of SMAP and in situ data North of 50°N collocated within a 12.5-km radius and daily time window indicate a Root Mean Square Difference (RMSD) less than ~1 psu with a correlation coefficient of 0.82 and a near unity regression slope over the entire range of salinity. In contrast, the Hybrid Coordinate Ocean Model (HYCOM) has a smaller RMSD with Argo. However, there are clear systematic biases in the HYCOM for salinity in the range of 25–30 psu, leading to a regression slope of about 0.5. In the region North of 65°N, the number of collocated samples drops more than 70%, resulting in an RMSD of about 1.2 psu. SMAP SSS in the Kara Sea shows a consistent response to discharge anomalies from the Ob’ and Yenisei rivers between 2015 and 2016, providing an assessment of runoff impact in a region where no in situ salinity data are available for validation. The Kara Sea SSS anomaly observed by SMAP is missing in the HYCOM SSS, which assimilates climatological runoffs without interannual changes. We explored the feasibility of using SMAP SSS to monitor the sea surface salinity variability at the major Arctic Ocean gateways. Results show that although the SMAP SSS is limited to about 1 psu accuracy, many large salinity changes are observable. This may lead to the potential application of satellite SSS in the Arctic monitoring system as a proxy of the upper ocean layer freshwater exchanges with subarctic oceans. Full article
(This article belongs to the Special Issue Sea Surface Salinity Remote Sensing)
Show Figures

Graphical abstract

16 pages, 5780 KiB  
Article
Low-Frequency Sea Surface Radar Doppler Echo
by Yury Yu. Yurovsky, Vladimir N. Kudryavtsev, Semyon A. Grodsky and Bertrand Chapron
Remote Sens. 2018, 10(6), 870; https://doi.org/10.3390/rs10060870 - 4 Jun 2018
Cited by 10 | Viewed by 5938
Abstract
The sea surface normalized radar backscatter cross-section (NRCS) and Doppler velocity (DV) exhibit energy at low frequencies (LF) below the surface wave peak. These NRCS and DV variations are coherent and thus may produce a bias in the DV averaged over large footprints, [...] Read more.
The sea surface normalized radar backscatter cross-section (NRCS) and Doppler velocity (DV) exhibit energy at low frequencies (LF) below the surface wave peak. These NRCS and DV variations are coherent and thus may produce a bias in the DV averaged over large footprints, which is important for interpretation of Doppler scatterometer measurements. To understand the origin of LF variations, the platform-borne Ka-band radar measurements with well-pronounced LF variations at frequencies below wave peak (0.19 Hz) are analyzed. These data show that the LF NRCS is coherent with wind speed at 21 m height while the LF DV is not. The NRCS-wind correlation is significant only at frequencies below 0.01 Hz indicating either differences between near-surface wind (affecting radar signal) and 21-m height wind (actually measured) or contributions of other mechanisms of LF radar signal variations. It is shown that non-linearity in NRCS-wave slope Modulation Transfer Function (MTF) and inherent averaging within radar footprint account for NRCS and DV LF variance, with the exception of VV NRCS for which almost half of the LF variance is unexplainable by these mechanisms and perhaps attributable to wind fluctuations. Although the distribution of radar DV is quasi-Gaussian, suggesting virtually little impact of non-linearity, the LF DV variations arise due to footprint averaging of correlated local DV and non-linear NRCS. Numerical simulations demonstrate that MTF non-linearity weakly affects traditional linear MTF estimate (less than 10% for typical MTF magnitudes less than 20). Thus the linear MTF is a good approximation to evaluate the DV averaged over large footprints typical of satellite observations. Full article
(This article belongs to the Special Issue Ocean Surface Currents: Progress in Remote Sensing and Validation)
Show Figures

Figure 1

14 pages, 2173 KiB  
Article
Region-Wise Deep Feature Representation for Remote Sensing Images
by Peng Li, Peng Ren, Xiaoyu Zhang, Qian Wang, Xiaobin Zhu and Lei Wang
Remote Sens. 2018, 10(6), 871; https://doi.org/10.3390/rs10060871 - 5 Jun 2018
Cited by 45 | Viewed by 6657
Abstract
Effective feature representations play an important role in remote sensing image analysis tasks. With the rapid progress of deep learning techniques, deep features have been widely applied to remote sensing image understanding in recent years and shown powerful ability in image representation. The [...] Read more.
Effective feature representations play an important role in remote sensing image analysis tasks. With the rapid progress of deep learning techniques, deep features have been widely applied to remote sensing image understanding in recent years and shown powerful ability in image representation. The existing deep feature extraction approaches are usually carried out on the whole image directly. However, such deep feature representation strategies may not effectively capture the local geometric invariance of target regions in remote sensing images. In this paper, we propose a novel region-wise deep feature extraction framework for remote sensing images. First, regions that may contain the target information are extracted from one whole image. Then, these regions are fed into a pre-trained convolutional neural network (CNN) model to extract regional deep features. Finally, the regional deep features are encoded by an improved Vector of Locally Aggregated Descriptors (VLAD) algorithm to generate the feature representation for the image. We conducted extensive experiments on remote sensing image classification and retrieval tasks based on the proposed region-wise deep feature extraction framework. The comparison results show that the proposed approach is superior to the existing CNN feature extraction methods. Full article
Show Figures

Graphical abstract

21 pages, 28354 KiB  
Article
Mapping Urban Land Cover of a Large Area Using Multiple Sensors Multiple Features
by Jike Chen, Peijun Du, Changshan Wu, Junshi Xia and Jocelyn Chanussot
Remote Sens. 2018, 10(6), 872; https://doi.org/10.3390/rs10060872 - 5 Jun 2018
Cited by 27 | Viewed by 4410
Abstract
Concerning the strengths and limitations of multispectral and airborne LiDAR data, the fusion of such datasets can compensate for the weakness of each other. This work have investigated the integration of multispectral and airborne LiDAR data for the land cover mapping of large [...] Read more.
Concerning the strengths and limitations of multispectral and airborne LiDAR data, the fusion of such datasets can compensate for the weakness of each other. This work have investigated the integration of multispectral and airborne LiDAR data for the land cover mapping of large urban area. Different LiDAR-derived features are involoved, including height, intensity, and multiple-return features. However, there is limited knowledge relating to the integration of multispectral and LiDAR data including three feature types for the classification task. Furthermore, a little contribution has been devoted to the relative importance of input features and the impact on the classification uncertainty by using multispectral and LiDAR. The key goal of this study is to explore the potenial improvement by using both multispectral and LiDAR data and to evaluate the importance and uncertainty of input features. Experimental results revealed that using the LiDAR-derived height features produced the lowest classification accuracy (83.17%). The addition of intensity information increased the map accuracy by 3.92 percentage points. The accuracy was further improved to 87.69% with the addition multiple-return features. A SPOT-5 image produced an overall classification accuracy of 86.51%. Combining spectral and spatial features increased the map accuracy by 6.03 percentage points. The best result (94.59%) was obtained by the combination of SPOT-5 and LiDAR data using all available input variables. Analysis of feature relevance demonstrated that the normalized digital surface model (nDSM) was the most beneficial feature in the classification of land cover. LiDAR-derived height features were more conducive to the classification of urban area as compared to LiDAR-derived intensity and multiple-return features. Selecting only 10 most important features can result in higher overall classification accuracy than all scenarios of input variables except the feature of entry scenario using all available input features. The variable importance varied a very large extent in the light of feature importance per land cover class. Results of classification uncertainty suggested that feature combination can tend to decrease classification uncertainty for different land cover classes, but there is no “one-feature-combination-fits-all” solution. The values of classification uncertainty exhibited significant differences between the land cover classes, and extremely low uncertainties were revealed for the water class. However, it should be noted that using all input variables resulted in relatively lower classification uncertainty values for most of the classes when compared to other input features scenarios. Full article
Show Figures

Graphical abstract

20 pages, 8026 KiB  
Article
Operational Built-Up Areas Extraction for Cities in China Using Sentinel-1 SAR Data
by Han Cao, Hong Zhang, Chao Wang and Bo Zhang
Remote Sens. 2018, 10(6), 874; https://doi.org/10.3390/rs10060874 - 5 Jun 2018
Cited by 22 | Viewed by 5109
Abstract
To obtain accurate information in a timely manner on built-up areas (BAs) is essential for urban planning and natural hazard (e.g., earthquakes) response strategies. In this paper, a new method for BAs extraction using the Sentinel-1 SAR is proposed, which includes two steps: [...] Read more.
To obtain accurate information in a timely manner on built-up areas (BAs) is essential for urban planning and natural hazard (e.g., earthquakes) response strategies. In this paper, a new method for BAs extraction using the Sentinel-1 SAR is proposed, which includes two steps: (1) Candidate BAs are first selected as seeds from images that show high backscattering and obvious textural patterns, as characterized by image intensity, Getis-Ord index, and the variogram texture features; (2) region growing is iteratively implemented from these seed pixels to extract the BAs. Sentinel-1 data, with 5 × 20 m2 resolution, are selected over eight cities with various environmental settings around China, to validate the robustness of the proposed method. The results show that the proposed method achieves higher detection accuracy and fewer commission errors compared with the intensity-based region growing and thresholding methods. An averaged accuracy of 96.5% in validation points of eight cities was achieved, which outperforms the GlobCover urban product in both urban and rural area, while fewer commission errors were achieved compared to Landsat data-based methods. Moreover, two polarizations (VV/VH) and the averaged channel are compared for BAs extraction in areas with various environments. It turns out that improved results can be achieved using the averaged image of two polarizations in north China, while the VV image is better suited for BAs extraction in south. These findings indicate that operational BAs mapping over China, and even globally, is possible, since the Sentinel-1 data can provide images with global coverage. Full article
Show Figures

Figure 1

21 pages, 17193 KiB  
Article
Towards Real-Time Service from Remote Sensing: Compression of Earth Observatory Video Data via Long-Term Background Referencing
by Jing Xiao, Rong Zhu, Ruimin Hu, Mi Wang, Ying Zhu, Dan Chen and Deren Li
Remote Sens. 2018, 10(6), 876; https://doi.org/10.3390/rs10060876 - 5 Jun 2018
Cited by 13 | Viewed by 5046
Abstract
City surveillance enables many innovative applications of smart cities. However, the real-time utilization of remotely sensed surveillance data via unmanned aerial vehicles (UAVs) or video satellites is hindered by the considerable gap between the high data collection rate and the limited transmission bandwidth. [...] Read more.
City surveillance enables many innovative applications of smart cities. However, the real-time utilization of remotely sensed surveillance data via unmanned aerial vehicles (UAVs) or video satellites is hindered by the considerable gap between the high data collection rate and the limited transmission bandwidth. High efficiency compression of the data is in high demand. Long-term background redundancy (LBR) (in contrast to local spatial/temporal redundancies in a single video clip) is a new form of redundancy common in Earth observatory video data (EOVD). LBR is induced by the repetition of static landscapes across multiple video clips and becomes significant as the number of video clips shot of the same area increases. Eliminating LBR improves EOVD coding efficiency considerably. First, this study proposes eliminating LBR by creating a long-term background referencing library (LBRL) containing high-definition geographically registered images of an entire area. Then, it analyzes the factors affecting the variations in the image representations of the background. Next, it proposes a method of generating references for encoding current video and develops the encoding and decoding framework for EOVD compression. Experimental results show that encoding UAV video clips with the proposed method saved an average of more than 54% bits using references generated under the same conditions. Bitrate savings reached 25–35% when applied to satellite video data with arbitrarily collected reference images. Applying the proposed coding method to EOVD will facilitate remote surveillance, which can foster the development of online smart city applications. Full article
Show Figures

Figure 1

21 pages, 2667 KiB  
Article
A Cloud Detection Method for Landsat 8 Images Based on PCANet
by Yue Zi, Fengying Xie and Zhiguo Jiang
Remote Sens. 2018, 10(6), 877; https://doi.org/10.3390/rs10060877 - 5 Jun 2018
Cited by 86 | Viewed by 9319
Abstract
Cloud detection for remote sensing images is often a necessary process, because cloud is widespread in optical remote sensing images and causes a lot of difficulty to many remote sensing activities, such as land cover monitoring, environmental monitoring and target recognizing. In this [...] Read more.
Cloud detection for remote sensing images is often a necessary process, because cloud is widespread in optical remote sensing images and causes a lot of difficulty to many remote sensing activities, such as land cover monitoring, environmental monitoring and target recognizing. In this paper, a novel cloud detection method is proposed for multispectral remote sensing images from Landsat 8. Firstly, the color composite image of Bands 6, 3 and 2 is divided into superpixel sub-regions through Simple Linear Iterative Cluster (SLIC) method. Then, a two-step superpixel classification strategy is used to predict each superpixel as cloud or non-cloud. Thirdly, a fully connected Conditional Random Field (CRF) model is used to refine the cloud detection result, and accurate cloud borders are obtained. In the two-step superpixel classification strategy, the bright and thick cloud superpixels, as well as the obvious non-cloud superpixels, are firstly separated from potential cloud superpixels through a threshold function, which greatly speeds up the detection. The designed double-branch PCA Network (PCANet) architecture can extract the high-level information of cloud, then combined with a Support Vector Machine (SVM) classifier, the potential superpixels are correctly classified. Visual and quantitative comparison experiments are conducted on the Landsat 8 Cloud Cover Assessment (L8 CCA) dataset; the results indicate that our proposed method can accurately detect clouds under different conditions, which is more effective and robust than the compared state-of-the-art methods. Full article
(This article belongs to the Special Issue Multispectral Image Acquisition, Processing and Analysis)
Show Figures

Graphical abstract

24 pages, 4602 KiB  
Article
The Generalized Gamma-DBN for High-Resolution SAR Image Classification
by Zhiqiang Zhao, Lei Guo, Meng Jia and Lei Wang
Remote Sens. 2018, 10(6), 878; https://doi.org/10.3390/rs10060878 - 5 Jun 2018
Cited by 14 | Viewed by 4622
Abstract
With the increase of resolution, effective characterization of synthetic aperture radar (SAR) image becomes one of the most critical problems in many earth observation applications. Inspired by deep learning and probability mixture models, a generalized Gamma deep belief network (g Γ-DBN) is [...] Read more.
With the increase of resolution, effective characterization of synthetic aperture radar (SAR) image becomes one of the most critical problems in many earth observation applications. Inspired by deep learning and probability mixture models, a generalized Gamma deep belief network (g Γ-DBN) is proposed for SAR image statistical modeling and land-cover classification in this work. Specifically, a generalized Gamma-Bernoulli restricted Boltzmann machine (gΓB-RBM) is proposed to capture high-order statistical characterizes from SAR images after introducing the generalized Gamma distribution. After stacking the g Γ B-RBM and several standard binary RBMs in a hierarchical manner, a gΓ-DBN is constructed to learn high-level representation of different SAR land-covers. Finally, a discriminative neural network is constructed by adding an additional predict layer for different land-covers over the constructed deep structure. Performance of the proposed approach is evaluated via several experiments on some high-resolution SAR image patch sets and two large-scale scenes which are captured by ALOS PALSAR-2 and COSMO-SkyMed satellites respectively. Full article
(This article belongs to the Special Issue Pattern Analysis and Recognition in Remote Sensing)
Show Figures

Graphical abstract

17 pages, 7264 KiB  
Article
Rimaal: A Sand Buried Structure of Possible Impact Origin in the Sahara: Optical and Radar Remote Sensing Investigation
by Eman Ghoneim
Remote Sens. 2018, 10(6), 880; https://doi.org/10.3390/rs10060880 - 5 Jun 2018
Cited by 6 | Viewed by 6778
Abstract
This work communicates the discovery of a sandy buried 10.5 km diameter near-circular structure in the eastern part of the Great Sahara in North Africa. Rimaal, meaning “sand” in Arabic, is given as the name for this structure since it is largely concealed [...] Read more.
This work communicates the discovery of a sandy buried 10.5 km diameter near-circular structure in the eastern part of the Great Sahara in North Africa. Rimaal, meaning “sand” in Arabic, is given as the name for this structure since it is largely concealed beneath the Sahara Aeolian sand. Remote sensing image fusion and transformation of multispectral data (from Landsat-8) and synthetic aperture radar (from Sentinel-1 and ALOS PALSAR), of dual wavelengths (C and L-bands) and multi-polarization (HV, VV, HH, and HV), were adopted in this work. The optical and microwave hybrid imagery enabled the combining of surface spectral properties and subsurface roughness information for better understanding of the Rimaal structure. The long wavelength of the radar, in particular, enabled the penetration of desert sands and the revealing of the proposed structure. The structure exhibits a clear outer rim with traces of concentric faults, an annular flat basin and an inner ring surrounding remnants of a highly eroded central peak. Radar imagery clearly shows the interior wall of the structure is incised with radial pattern gullies that originate at or near the crater periphery, implying a much steeper rim wall in the past. In addition, data reveals a circumferential of a paleoriver course that flows along a curved path parallel to the crater’s western margin indicating the plausible presence of a concentric ring graben related to the inferred structure. The defined crater boundary is coincident with a shallow semi-circular-like basin in the SRTM elevation data. The structure portrays considerable modifications by extensive long-term Aeolian and fluvial erosion. Residing in the Cretaceous Nubian Sandstone formation suggests an old age of ≤65 Ma for the structure. If proven to be of an impact origin, the Rimaal structure could help in understanding the early evolution of the landscape of the Eastern Sahara and holds promise for hosting economically valuable ore deposits and hydrocarbon resources in the region. Full article
(This article belongs to the Section Remote Sensing in Geology, Geomorphology and Hydrology)
Show Figures

Figure 1

18 pages, 4574 KiB  
Article
An Enhanced Linear Spatio-Temporal Fusion Method for Blending Landsat and MODIS Data to Synthesize Landsat-Like Imagery
by Bo Ping, Yunshan Meng and Fenzhen Su
Remote Sens. 2018, 10(6), 881; https://doi.org/10.3390/rs10060881 - 5 Jun 2018
Cited by 21 | Viewed by 4619
Abstract
Landsat and MODIS data have been widely utilized in many remote sensing applications, however, the trade-off between the spatial resolution and temporal frequency has limited their capacities in monitoring detailed spatio-temporal dynamics. Spatio-temporal fusion methods based on a linear model that considers the [...] Read more.
Landsat and MODIS data have been widely utilized in many remote sensing applications, however, the trade-off between the spatial resolution and temporal frequency has limited their capacities in monitoring detailed spatio-temporal dynamics. Spatio-temporal fusion methods based on a linear model that considers the differences between fine- and coarse-spatial-resolution images as linear can effectively solve this trade-off problem, yet the existing linear fusion methods either regard the coefficients of the linear model as constants or have adopted regression methods to calculate the coefficients, both of which may introduce some errors in the fusion process. In this paper, we proposed an enhanced linear spatio-temporal fusion method (ELSTFM) to improve the data fusion accuracy. In the ELSTFM, it is not necessary to calculate the slope of the linear model, and the intercept, which can be deemed as the residual caused by systematic biases, is calculated based on spectral unmixing theory. Additionally, spectrally similar pixels in a given fine-spatial-resolution pixel’s neighborhood and their corresponding weights were used in the proposed method to mitigate block effects. Landsat-7/ETM+ and 8-day composite MODIS reflectance data covering two study sites with heterogeneous and homogenous landscapes were selected to validate the proposed method. Compared to three other typical spatio-temporal fusion methods visually and quantitatively, the predicted images obtained from ELSTFM could acquire better results for the two selected study sites. Furthermore, the resampling methods used to resample MODIS to the same spatial resolution of Landsat could slightly, but did not significantly influence the fusion accuracy, and the distributions of slopes of different bands for the two study sites could all be deemed as normal distributions with a mean value close to 1. The performance of ELSTFM depends on the accuracy of residual calculation at fine-resolution and large landscape changes may influence the fusion accuracy. Full article
(This article belongs to the Special Issue Multisensor Data Fusion in Remote Sensing)
Show Figures

Graphical abstract

17 pages, 25447 KiB  
Article
Evaluation of TRMM/GPM Blended Daily Products over Brazil
by José Roberto Rozante, Daniel A. Vila, Júlio Barboza Chiquetto, Alex De A. Fernandes and Débora Souza Alvim
Remote Sens. 2018, 10(6), 882; https://doi.org/10.3390/rs10060882 - 6 Jun 2018
Cited by 111 | Viewed by 8105
Abstract
The precipitation estimates from the Tropical Rainfall Measuring Mission (TRMM) Multi-satellite Precipitation Analysis (named TMPA and TMPA-RT for the near real-time version) are widely used both in research and in operational forecasting. However, they will be discontinued soon. The products from the Integrated [...] Read more.
The precipitation estimates from the Tropical Rainfall Measuring Mission (TRMM) Multi-satellite Precipitation Analysis (named TMPA and TMPA-RT for the near real-time version) are widely used both in research and in operational forecasting. However, they will be discontinued soon. The products from the Integrated Multi-satellite Retrievals for Global Precipitation Measurement (IMERG) and The Global Satellite Mapping of Precipitation (GSMaP) are analyzed as potential replacements for TMPA products. The objective of this study is to assess whether the IMERG and/or GSMaP products can properly replace TMPA in several regions with different precipitation regimes within Brazil. The validation study was conducted during the period from 1st of April, 2014 to the 28th of February, 2017 (1065 days), using daily accumulated rain gauge stations over Brazil. Six regions were considered for this study: five according to the precipitation regime, plus another one for the entire Brazilian territory. IMERG-Final, TMPA-V7 and GSMaP-Gauges were the selected versions of those algorithms for this validation study, which include a bias adjustment with monthly (IMERG and TMPA) and daily (GSMaP) gauge accumulations, because they are widely used in the user’s community. Results indicate similar behavior for IMERG and TMPA products, showing that they overestimate precipitation, while GSMaP tend to slightly underestimate the amount of rainfall in most of the analyzed regions. The exception is the northeastern coast of Brazil, where all products underestimate the daily rainfall accumulations. For all analyzed regions, GSMaP and IMERG products present a better performance compared to TMPA products; therefore, they could be suitable replacements for the TMPA. This is particularly important for hydrological forecasting in small river basins, since those products present a finer spatial and temporal resolution compared with TMPA. Full article
(This article belongs to the Special Issue Remote Sensing of Precipitation)
Show Figures

Figure 1

29 pages, 6546 KiB  
Article
Underwater Acoustic Pulsed Source Localization with a Pair of Hydrophones
by Emmanuel K. Skarsoulis, George Piperakis, Michael Kalogerakis, Emmanuel Orfanakis, Panagiotis Papadakis, Stan. E. Dosso and Alexandros Frantzis
Remote Sens. 2018, 10(6), 883; https://doi.org/10.3390/rs10060883 - 6 Jun 2018
Cited by 10 | Viewed by 5657
Abstract
A series of underwater acoustic localization experiments were conducted in the Eastern Mediterranean Sea to test the performance of a Bayesian method for localization of pulsed acoustic sources exploiting time differences between direct and surface-reflected arrivals at two hydrophones of known depth. The [...] Read more.
A series of underwater acoustic localization experiments were conducted in the Eastern Mediterranean Sea to test the performance of a Bayesian method for localization of pulsed acoustic sources exploiting time differences between direct and surface-reflected arrivals at two hydrophones of known depth. The experiments involved a controlled source (pinger) at various depths/ranges as well as vocalizing sperm whales encountered off southern Crete. The localization method provides primarily range and depth information. In addition, if the location of the hydrophones in the horizontal is known, horizontal localization can be performed as well, subject to left–right ambiguity; this was applied for whale localization. The localization results confirmed the anticipated behavior of range, depth, and bearing estimation errors, which, according to theory, depend mainly on the source azimuth. In particular, range and depth estimation errors are larger for source locations close to broadside to the array and smaller towards endfire, and they increase with range. Conversely, bearing estimation errors are larger close to endfire and smaller towards broadside. Localizations in this paper were performed to ranges of about 3.5 km. The limiting factors for localization to longer ranges were the loss of ability to resolve direct and surface-reflected arrivals as well as the self-noise of the hydrophones. Full article
(This article belongs to the Special Issue Advances in Undersea Remote Sensing)
Show Figures

Figure 1

15 pages, 6689 KiB  
Article
Utilizing Pansharpening Technique to Produce Sub-Pixel Resolution Thematic Map from Coarse Remote Sensing Image
by Peng Wang, Liguo Wang, Yiquan Wu and Henry Leung
Remote Sens. 2018, 10(6), 884; https://doi.org/10.3390/rs10060884 - 6 Jun 2018
Cited by 24 | Viewed by 4130
Abstract
Super-resolution mapping (SRM) is a technique to obtain sub-pixel resolution thematic map (SRTM). Soft-then-hard SRM (STHSRM) is an important SRM algorithm due to its simple physical meaning. The soft classification errors may affect the SRTM derived by STHSRM. To overcome this problem, the [...] Read more.
Super-resolution mapping (SRM) is a technique to obtain sub-pixel resolution thematic map (SRTM). Soft-then-hard SRM (STHSRM) is an important SRM algorithm due to its simple physical meaning. The soft classification errors may affect the SRTM derived by STHSRM. To overcome this problem, the maximum a posteriori probability (MAP) super-resolution then hard classification (MTC) algorithm has been proposed. However, the prior information of the original image is difficult to utilize in MTC. To solve this issue, a novel method based on pansharpening then hard classification (PTC) is proposed to improve SRTM. The pansharpening technique is applied to the original coarse image to obtain the improved resolution image by suppling more prior information. The SRTM is then derived from the improved resolution image by hard classification. Not only does PTC inherit the advantages of MTC that avoids soft classification errors, but it can also incorporate more prior information from the original image into the process. Experiments based on real remote sensing images show that the proposed method can produce higher mapping accuracy than the STHSRM and MTC. It is shown that the PTC has the percentage correctly classified (PCC) in the range from 89.62% to 95.92% for the experimental dataset. Full article
(This article belongs to the Special Issue Remote Sensing Image Downscaling)
Show Figures

Graphical abstract

17 pages, 15255 KiB  
Article
Improved Hydrological Decision Support System for the Lower Mekong River Basin Using Satellite-Based Earth Observations
by Ibrahim Nourein Mohammed, John D. Bolten, Raghavan Srinivasan and Venkat Lakshmi
Remote Sens. 2018, 10(6), 885; https://doi.org/10.3390/rs10060885 - 6 Jun 2018
Cited by 58 | Viewed by 8376
Abstract
Multiple satellite-based earth observations and traditional station data along with the Soil & Water Assessment Tool (SWAT) hydrologic model were employed to enhance the Lower Mekong River Basin region’s hydrological decision support system. A nearest neighbor approximation methodology was introduced to fill the [...] Read more.
Multiple satellite-based earth observations and traditional station data along with the Soil & Water Assessment Tool (SWAT) hydrologic model were employed to enhance the Lower Mekong River Basin region’s hydrological decision support system. A nearest neighbor approximation methodology was introduced to fill the Integrated Multi-satellite Retrieval for the Global Precipitation Measurement mission (IMERG) grid points from 2001 to 2014, together with the Tropical Rainfall Measurement Mission (TRMM) data points for continuous precipitation forcing for our hydrological decision support system. A software tool to access and format satellite-based earth observation systems of precipitation and minimum and maximum air temperatures was developed and is presented. Our results suggest that the model-simulated streamflow utilizing TRMM and IMERG forcing data was able to capture the variability of the observed streamflow patterns in the Lower Mekong better than model-simulated streamflow with in-situ precipitation station data. We also present satellite-based and in-situ precipitation adjustment maps that can serve to correct precipitation data for the Lower Mekong region for use in other applications. The inconsistency, scarcity, poor spatial representation, difficult access and incompleteness of the available in-situ precipitation data for the Mekong region make it imperative to adopt satellite-based earth observations to pursue hydrologic modeling. Full article
(This article belongs to the Special Issue Remote Sensing Water Cycle: Theory, Sensors, Data, and Applications)
Show Figures

Figure 1

17 pages, 8453 KiB  
Article
Integration of Single-Frequency GNSS and Strong-Motion Observations for Real-Time Earthquake Monitoring
by Rui Tu, Rui Zhang, Pengfei Zhang, Jinhai Liu and Xiaochun Lu
Remote Sens. 2018, 10(6), 886; https://doi.org/10.3390/rs10060886 - 6 Jun 2018
Cited by 3 | Viewed by 4417
Abstract
In this study, a real-time earthquake monitoring system based on the integration of single-frequency global navigation satellite system (GNSS) and strong motion (SM) observations was developed. This high-precision integrated system can provide full-frequency monitoring information, and it makes full use of SM data [...] Read more.
In this study, a real-time earthquake monitoring system based on the integration of single-frequency global navigation satellite system (GNSS) and strong motion (SM) observations was developed. This high-precision integrated system can provide full-frequency monitoring information, and it makes full use of SM data to quickly and accurately determine the vibration window for initial baseline shift correction. High-precision displacement data obtained from GNSS epoch-differenced velocity estimation are used to constrain the SM’s low-frequency baseline shift. Hence, full-frequency monitoring information (displacement, velocity, and acceleration) can be provided in real-time. Three different datasets were used for validation and the results confirm that the proposed system can be used for practical earthquake monitoring. Full article
Show Figures

Graphical abstract

21 pages, 93260 KiB  
Article
Bidirectional Long Short-Term Memory Network for Vehicle Behavior Recognition
by Jiasong Zhu, Ke Sun, Sen Jia, Weidong Lin, Xianxu Hou, Bozhi Liu and Guoping Qiu
Remote Sens. 2018, 10(6), 887; https://doi.org/10.3390/rs10060887 - 6 Jun 2018
Cited by 17 | Viewed by 6365
Abstract
Vehicle behavior recognition is an attractive research field which is useful for many computer vision and intelligent traffic analysis tasks. This paper presents an all-in-one behavior recognition framework for moving vehicles based on the latest deep learning techniques. Unlike traditional traffic analysis methods [...] Read more.
Vehicle behavior recognition is an attractive research field which is useful for many computer vision and intelligent traffic analysis tasks. This paper presents an all-in-one behavior recognition framework for moving vehicles based on the latest deep learning techniques. Unlike traditional traffic analysis methods which rely on low-resolution videos captured by road cameras, we capture 4K ( 3840 × 2178 ) traffic videos at a busy road intersection of a modern megacity by flying a unmanned aerial vehicle (UAV) during the rush hours. We then manually annotate locations and types of road vehicles. The proposed method consists of the following three steps: (1) vehicle detection and type recognition based on deep neural networks; (2) vehicle tracking by data association and vehicle trajectory modeling; (3) vehicle behavior recognition by nearest neighbor search and by bidirectional long short-term memory network, respectively. This paper also presents experimental results of the proposed framework in comparison with state-of-the-art approaches on the 4K testing traffic video, which demonstrated the effectiveness and superiority of the proposed method. Full article
(This article belongs to the Special Issue Pattern Analysis and Recognition in Remote Sensing)
Show Figures

Figure 1

27 pages, 9431 KiB  
Article
Exploring the Sensitivity of Sampling Density in Digital Mapping of Soil Organic Carbon and Its Application in Soil Sampling
by Long Guo, Marc Linderman, Tiezhu Shi, Yiyun Chen, Lijun Duan and Haitao Zhang
Remote Sens. 2018, 10(6), 888; https://doi.org/10.3390/rs10060888 - 6 Jun 2018
Cited by 27 | Viewed by 5422
Abstract
The rapid monitoring and accurate estimation of dynamic changes in soil organic carbon (SOC) can make great efforts in understanding the global carbon cycle. Traditional field survey is the main approach to obtain soil data and measure SOC content. However, the limited number [...] Read more.
The rapid monitoring and accurate estimation of dynamic changes in soil organic carbon (SOC) can make great efforts in understanding the global carbon cycle. Traditional field survey is the main approach to obtain soil data and measure SOC content. However, the limited number of soil samples and the sampling cost hinder the quality of digital soil mapping. This research aims to explore the sensitive of sampling density in digital soil mapping, and then design a suitable soil sampling plan based on a series of sampling indices. Headwall hyperspectral images (400–1700 nm) were used to estimate the SOC map by partial least squares regression (PLSR) and PLSR kriging (PLSRK). Three traditional soil sampling methods (random, grid, and Latin hypercube sampling) with 10 classes of sampling densities (6.26, 2.79, 1.57, 1.01, 0.69, 0.53, 0.39, 0.30, 0.26, and 0.20 ha−1) were designed. The R2, root mean square error (RMSE) and ratio of standard deviation to RMSE (RPD) were used to evaluate the prediction accuracy in digital soil mapping by ordinary kriging. Three new indices, namely, the ratio of sampling efficiency to performance (RSEP), the density of soil samples index and the comprehensive evaluation index of prediction accuracy, were used to select a suitable soil sampling plan. Results showed that (1) the prediction accuracy of PLSRK (RPD = 2.00) was higher by approximately 11.73% than that of PLSR (RPD = 1.79), and the hyperspectral images provided an actual referential SOC map for the study of soil sampling; (2) the grid sampling plan performed better than the random and Latin hypercube sampling methods, and the quality of SOC map improves with the increase of the sampling density, and (3) the computer simulation and field verification indicated that RSEP is one feasible index in designing a suitable soil sampling plan. Full article
(This article belongs to the Section Remote Sensing in Agriculture and Vegetation)
Show Figures

Graphical abstract

28 pages, 16016 KiB  
Article
Field-Scale Assessment of Land and Water Use Change over the California Delta Using Remote Sensing
by Martha Anderson, Feng Gao, Kyle Knipper, Christopher Hain, Wayne Dulaney, Dennis Baldocchi, Elke Eichelmann, Kyle Hemes, Yun Yang, Josue Medellin-Azuara and William Kustas
Remote Sens. 2018, 10(6), 889; https://doi.org/10.3390/rs10060889 - 7 Jun 2018
Cited by 101 | Viewed by 10705
Abstract
The ability to accurately monitor and anticipate changes in consumptive water use associated with changing land use and land management is critical to developing sustainable water management strategies in water-limited climatic regions. In this paper, we present an application of a remote sensing [...] Read more.
The ability to accurately monitor and anticipate changes in consumptive water use associated with changing land use and land management is critical to developing sustainable water management strategies in water-limited climatic regions. In this paper, we present an application of a remote sensing data fusion technique for developing high spatiotemporal resolution maps of evapotranspiration (ET) at scales that can be associated with changes in land use. The fusion approach combines ET map timeseries developed using an multi-scale energy balance algorithm applied to thermal data from Earth observation platforms with high spatial but low temporal resolution (e.g., Landsat) and with moderate resolution but frequent temporal coverage (e.g., MODIS (Moderate Resolution Imaging Spectroradiometer)). The approach is applied over the Sacramento-San Joaquin Delta region in California—an area critical to both agricultural production and drinking water supply within the state that has recently experienced stresses on water resources due to a multi-year (2012–2017) extreme drought. ET “datacubes” with 30-m resolution and daily timesteps were constructed for the 2015–2016 water years and related to detailed maps of land use developed at the same spatial scale. The ET retrievals are evaluated at flux sites over multiple land covers to establish a metric of accuracy in the annual water use estimates, yielding root-mean-square errors of 1.0, 0.8, and 0.3 mm day−1 at daily, monthly, and yearly timesteps, respectively, for all sites combined. Annual ET averaged over the Delta changed only 3 mm year−1 between water years, from 822 to 819 mm year−1, translating to an area-integrated total change in consumptive water use of seven thousand acre-feet (TAF). Changes were largest in areas with recorded land-use change between water years—most significantly, fallowing of crop land presumably in response to reductions in water availability and allocations due to the drought. Moreover, the time evolution in water use associated with wetland restoration—an effort aimed at reducing subsidence and carbon emissions within the inner Delta—is assessed using a sample wetland chronosequence. Region-specific matrices of consumptive water use associated with land use changes may be an effective tool for policymakers and farmers to understand how land use conversion could impact consumptive use and demand. Full article
(This article belongs to the Special Issue Advances in the Remote Sensing of Terrestrial Evaporation)
Show Figures

Graphical abstract

23 pages, 4346 KiB  
Article
Daily Retrieval of NDVI and LAI at 3 m Resolution via the Fusion of CubeSat, Landsat, and MODIS Data
by Rasmus Houborg and Matthew F. McCabe
Remote Sens. 2018, 10(6), 890; https://doi.org/10.3390/rs10060890 - 7 Jun 2018
Cited by 125 | Viewed by 15074
Abstract
Constellations of CubeSats are emerging as a novel observational resource with the potential to overcome the spatiotemporal constraints of conventional single-sensor satellite missions. With a constellation of more than 170 active CubeSats, Planet has realized daily global imaging in the RGB and near-infrared [...] Read more.
Constellations of CubeSats are emerging as a novel observational resource with the potential to overcome the spatiotemporal constraints of conventional single-sensor satellite missions. With a constellation of more than 170 active CubeSats, Planet has realized daily global imaging in the RGB and near-infrared (NIR) at ~3 m resolution. While superior in terms of spatiotemporal resolution, the radiometric quality is not equivalent to that of larger conventional satellites. Variations in orbital configuration and sensor-specific spectral response functions represent an additional limitation. Here, we exploit a Cubesat Enabled Spatio-Temporal Enhancement Method (CESTEM) to optimize the utility and quality of very high-resolution CubeSat imaging. CESTEM represents a multipurpose data-driven scheme for radiometric normalization, phenology reconstruction, and spatiotemporal enhancement of biophysical properties via synergistic use of CubeSat, Landsat 8, and MODIS observations. Phenological reconstruction, based on original CubeSat Normalized Difference Vegetation Index (NDVI) data derived from top of atmosphere or surface reflectances, is shown to be susceptible to large uncertainties. In comparison, a CESTEM-corrected NDVI time series is able to clearly resolve several consecutive multicut alfalfa growing seasons over a six-month period, in addition to providing precise timing of key phenological transitions. CESTEM adopts a random forest machine-learning approach for producing Landsat-consistent leaf area index (LAI) at the CubeSat scale with a relative mean absolute difference on the order of 4–6%. The CubeSat-based LAI estimates highlight the spatial resolution advantage and capability to provide temporally consistent and time-critical insights into within-field vegetation dynamics, the rate of vegetation green-up, and the timing of harvesting events that are otherwise missed by 8- to 16-day Landsat imagery. Full article
Show Figures

Graphical abstract

17 pages, 4851 KiB  
Article
Estimating Net Photosynthesis of Biological Soil Crusts in the Atacama Using Hyperspectral Remote Sensing
by Lukas W. Lehnert, Patrick Jung, Wolfgang A. Obermeier, Burkhard Büdel and Jörg Bendix
Remote Sens. 2018, 10(6), 891; https://doi.org/10.3390/rs10060891 - 7 Jun 2018
Cited by 18 | Viewed by 5595
Abstract
Biological soil crusts (BSC) encompassing green algae, cyanobacteria, lichens, bryophytes, heterotrophic bacteria and microfungi are keystone species in arid environments because of their role in nitrogen- and carbon-fixation, weathering and soil stabilization, all depending on the photosynthesis of the BSC. Despite their importance, [...] Read more.
Biological soil crusts (BSC) encompassing green algae, cyanobacteria, lichens, bryophytes, heterotrophic bacteria and microfungi are keystone species in arid environments because of their role in nitrogen- and carbon-fixation, weathering and soil stabilization, all depending on the photosynthesis of the BSC. Despite their importance, little is known about the BSCs of the Atacama Desert, although especially crustose chlorolichens account for a large proportion of biomass in the arid coastal zone, where photosynthesis is mainly limited due to low water availability. Here, we present the first hyperspectral reflectance data for the most wide-spread BSC species of the southern Atacama Desert. Combining laboratory and field measurements, we establish transfer functions that allow us to estimate net photosynthesis rates for the most common BSC species. We found that spectral differences among species are high, and differences between the background soil and the BSC at inactive stages are low. Additionally, we found that the water absorption feature at 1420 nm is a more robust indicator for photosynthetic activity than the chlorophyll absorption bands. Therefore, we conclude that common vegetation indices must be taken with care to analyze the photosynthesis of BSC with multispectral data. Full article
Show Figures

Graphical abstract

25 pages, 11615 KiB  
Article
Fluctuation of Glacial Retreat Rates in the Eastern Part of Warszawa Icefield, King George Island, Antarctica, 1979–2018
by Rafał Pudełko, Piotr Jan Angiel, Mariusz Potocki, Anna Jędrejek and Małgorzata Kozak
Remote Sens. 2018, 10(6), 892; https://doi.org/10.3390/rs10060892 - 7 Jun 2018
Cited by 49 | Viewed by 9390
Abstract
Antarctica is a region of the world where climate change is visible in the rapid melting of glaciers. This is particularly evident in marginal zones, where the pace of glacial retreat has systematically accelerated. The effective mapping of these changes is possible with [...] Read more.
Antarctica is a region of the world where climate change is visible in the rapid melting of glaciers. This is particularly evident in marginal zones, where the pace of glacial retreat has systematically accelerated. The effective mapping of these changes is possible with the use of remote sensing methods. This study assesses changes in glacier margin positions between 1979 and 2018 in the Antarctic Specially Protected Area 128 (ASPA-128) on King George Island, South Shetland Islands, Antarctica. In 1979, 19.8 km2 of the study area was glaciated. Over the following 39 years, an area of 6.1 km2 became ice-free, impacting local ecosystems both on land and in Admiralty Bay. The reduction in glacier extent was different in time and depended on the glacier type. Land-terminating glaciers had the fastest retreat rates below 200 m a.s.l. and were influenced mostly by surface melting. The reduction of tidewater glaciers occurred primarily in areas below 100 m a.s.l., with the most pronounced ice extent decreases occurring below 50 m a.s.l. The observed rates of front retreat suggest that glacier retreat rates were fastest between 1989–2001 and 2007–2011, with reduced retreat rates between 2001 and 2007. During the last 7 years, the lowest rate of regression was recorded in the entire analysed period (1979–2018). Changes in the areal extent of glaciers were compared with the climate record available for King George Island. The observed fluctuations in glacier retreat rates could be correlated to oscillations in annual Positive Degree-Days. The spatial analyses were based on aerial photographs (1956, 1979), theodolite measurements (1989), GPS survey (2001, 2007), and satellite images (2011, 2018). Full article
(This article belongs to the Section Remote Sensing in Geology, Geomorphology and Hydrology)
Show Figures

Graphical abstract

23 pages, 14265 KiB  
Article
Irrigation History Estimation Using Multitemporal Landsat Satellite Images: Application to an Intensive Groundwater Irrigated Agricultural Watershed in India
by Amit Kumar Sharma, Laurance Hubert-Moy, Sriramulu Buvaneshwari, Muddu Sekhar, Laurent Ruiz, Soumya Bandyopadhyay and Samuel Corgne
Remote Sens. 2018, 10(6), 893; https://doi.org/10.3390/rs10060893 - 7 Jun 2018
Cited by 45 | Viewed by 6802
Abstract
Groundwater has rapidly evolved as a primary source for irrigation in Indian agriculture. Over-exploitation of the groundwater substantially depletes the natural water table and has negative impacts on the water resource availability. The overarching goal of the proposed research is to identify the [...] Read more.
Groundwater has rapidly evolved as a primary source for irrigation in Indian agriculture. Over-exploitation of the groundwater substantially depletes the natural water table and has negative impacts on the water resource availability. The overarching goal of the proposed research is to identify the historical evolution of irrigated cropland for the post-monsoon (rabi) and summer cropping seasons in the Berambadi watershed (Area = 89 km2) of Kabini River basin, southern India. Approximately five-year interval irrigated area maps were generated using 30 m spatial resolution Landsat satellite images for the period from 1990 to 2016. The potential of Support Vector Machine (SVM) was assessed to discriminate irrigated and non-irrigated croplands. Three indices, Normalized Difference Vegetation Index (NDVI), Normalized Difference Moisture Index (NDMI) and Enhanced Vegetation Index (EVI), were derived from multi-temporal Landsat satellite images. Spatially distributed intensive ground observations were collected for training and validation of the SVM models. The irrigated and non-irrigated croplands were estimated with high classification accuracy (kappa coefficient greater than 0.9). At the watershed scale, this approach allowed highlighting the contrasted evolution of multiple-cropping (two successive crops in rabi and summer seasons that often imply dual irrigation) with a steady increase in the upstream and a recent decrease in the downstream of the watershed. Moreover, the multiple-cropping was found to be much more frequent in the valleys. These intensive practices were found to have significant impacts on the water resources, with a drastic decline in the water table level (more than 50 m). It also impacted the ecosystem: Groundwater level decline was more pronounced in the valleys and the rivers are no more fed by the base flow. Full article
(This article belongs to the Section Remote Sensing in Agriculture and Vegetation)
Show Figures

Graphical abstract

13 pages, 7084 KiB  
Article
Deformation Response of Seismogenic Faults to the Wenchuan MS 8.0 Earthquake: A Case Study for the Southern Segment of the Longmenshan Fault Zone
by Yanqiang Wu, Zaisen Jiang, Hongbao Liang, Yajin Pang, Shuang Zhu, Liu Chang, Changyun Chen and Jingwei Li
Remote Sens. 2018, 10(6), 894; https://doi.org/10.3390/rs10060894 - 7 Jun 2018
Cited by 9 | Viewed by 4176
Abstract
The spatiotemporal deformation response of a seismogenic fault to a large earthquake is of great significance to understanding the nucleation and occurrence of the next strong earthquake. The Longmeshan fault, where the 2008 Wenchuan MS 8.0 earthquake and 2013 Lushan MS [...] Read more.
The spatiotemporal deformation response of a seismogenic fault to a large earthquake is of great significance to understanding the nucleation and occurrence of the next strong earthquake. The Longmeshan fault, where the 2008 Wenchuan MS 8.0 earthquake and 2013 Lushan MS 7.0 earthquake occurred, provides an opportunity for us to study this important issue. Based on the GPS observations, we exploit the deformation response of the Southern Segment of the Longmenshan Fault (SSLMF) to the Wenchuan earthquake. The results are as follows: (1) during the co-seismic and post-seismic processes of the Wenchuan earthquake, the deformation is dominated by a continuous pattern in the SSLMF, which is different from the rupture pattern in the middle-northern segment of the Longmenshan Fault (LMF). Quantitatively, the compressive strain present between 2008 and 2013 was equal to the strain accumulation of 69 years during the interseismic period in the SSLMF. If the statistics scope is restricted to the eastern region of the Anxian-Guanxian Fault (AGF), which covers the Lushan source area (Abbr.: Eastern Region), the value is about 25 years; (2) After the Wenchuan earthquake, the strain accumulation pattern changes significantly. First, the deformation adjustment (especially the shear deformation) in the region that crosses the Maoxian-Wenchuan Fault (MWF) and Beichuan-Yingxiu Fault (BYF) (Abbr.: Western Region) is significantly greater than that in the Eastern Region. Furthermore, the crustal shortening is significant in the Eastern Region with minor adjustments in shear deformation. Second, the azimuth angles of the principal compressive strain rate in both regions show significant adjustments, which change fast in the first year of the observation period and then turn into the stable state. In general, the deformation responses of the SSLMF reveal that the Wenchuan earthquake promotes the occurrence of the Lushan earthquake. Their differences in the spatiotemporal domain can be attributed to the influence of afterslip, viscous relaxation of the lithosphere, mechanical parameters and block movement. Full article
Show Figures

Figure 1

18 pages, 15375 KiB  
Article
Where We Live—A Summary of the Achievements and Planned Evolution of the Global Urban Footprint
by Thomas Esch, Felix Bachofer, Wieke Heldens, Andreas Hirner, Mattia Marconcini, Daniela Palacios-Lopez, Achim Roth, Soner Üreyen, Julian Zeidler, Stefan Dech and Noel Gorelick
Remote Sens. 2018, 10(6), 895; https://doi.org/10.3390/rs10060895 - 7 Jun 2018
Cited by 77 | Viewed by 9984
Abstract
The TerraSAR-X (TSX) mission provides a distinguished collection of high resolution satellite images that shows great promise for a global monitoring of human settlements. Hence, the German Aerospace Center (DLR) has developed the Urban Footprint Processor (UFP) that represents an operational framework for [...] Read more.
The TerraSAR-X (TSX) mission provides a distinguished collection of high resolution satellite images that shows great promise for a global monitoring of human settlements. Hence, the German Aerospace Center (DLR) has developed the Urban Footprint Processor (UFP) that represents an operational framework for the mapping of built-up areas based on a mass processing and analysis of TSX imagery. The UFP includes functionalities for data management, feature extraction, unsupervised classification, mosaicking, and post-editing. Based on >180.000 TSX StripMap scenes, the UFP was used in 2016 to derive a global map of human presence on Earth in a so far unique spatial resolution of 12 m per grid cell: the Global Urban Footprint (GUF). This work provides a comprehensive summary of the major achievements related to the Global Urban Footprint initiative, with dedicated sections focusing on aspects such as UFP methodology, basic product characteristics (specification, accuracy, global figures on urbanization derived from GUF), the user community, and the already initiated future roadmap of follow-on activities and products. The active community of >250 institutions already working with the GUF data documents the relevance and suitability of the GUF initiative and the underlying high-resolution SAR imagery with respect to the provision of key information on the human presence on earth and the global human settlements properties and patterns, respectively. Full article
(This article belongs to the Special Issue Ten Years of TerraSAR-X—Scientific Results)
Show Figures

Figure 1

23 pages, 3428 KiB  
Article
High Temporal Resolution Refractivity Retrieval from Radar Phase Measurements
by Rubén Nocelo López and Verónica Santalla del Río
Remote Sens. 2018, 10(6), 896; https://doi.org/10.3390/rs10060896 - 7 Jun 2018
Cited by 7 | Viewed by 5127
Abstract
Knowledge of the spatial and temporal variability of near-surface water vapor is of great importance to successfully model reliable radio communications systems and forecast atmospheric phenomena such as convective initiation and boundary layer processes. However, most current methods to measure atmospheric moisture variations [...] Read more.
Knowledge of the spatial and temporal variability of near-surface water vapor is of great importance to successfully model reliable radio communications systems and forecast atmospheric phenomena such as convective initiation and boundary layer processes. However, most current methods to measure atmospheric moisture variations hardly provide the temporal and spatial resolutions required for detection of such atmospheric processes. Recently, considering the high correlation between refractivity variations and water vapor pressure variations at warm temperatures, and the good temporal and spatial resolution that weather radars provide, the measurement of the refractivity with radar became of interest. Firstly, it was proposed to estimate refractivity variations from radar phase measurements of ground-based stationary targets returns. For that, it was considered that the backscattering from ground targets is stationary and the vertical gradient of the refractivity could be neglected. Initial experiments showed good results over flat terrain when the radar and target heights are similar. However, the need to consider the non-zero vertical gradient of the refractivity over hilly terrain is clear. Up to date, the methods proposed consider previous estimation of the refractivity gradient in order to correct the measured phases before the refractivity estimation. In this paper, joint estimation of the refractivity variations at the radar height and the refractivity vertical gradient variations using scan-to-scan phase measurement variations is proposed. To reduce the noisiness of the estimates, a least squares method is used. Importantly, to apply this algorithm, it is not necessary to modify the radar scanning mode. For the purpose of this study, radar data obtained during the Refractivity Experiment for H 2 O Research and Collaborative Operational Technology Transfer (REFRACTT_2006), held in northeastern Colorado (USA), are used. The refractivity estimates obtained show a good performance of the algorithm proposed compared to the refractivity derived from two automatic weather stations located close to the radar, demonstrating the possibility of radar based refractivity estimation in hilly terrain and non-homogeneous atmosphere with high spatial resolution. Full article
(This article belongs to the Special Issue Remote Sensing of Land-Atmosphere Interactions)
Show Figures

Graphical abstract

34 pages, 7028 KiB  
Article
Normalized Difference Vegetation Vigour Index: A New Remote Sensing Approach to Biodiversity Monitoring in Oil Polluted Regions
by Nkeiruka Nneti Onyia, Heiko Balzter and Juan-Carlos Berrio
Remote Sens. 2018, 10(6), 897; https://doi.org/10.3390/rs10060897 - 7 Jun 2018
Cited by 23 | Viewed by 11845
Abstract
Biodiversity loss remains a global challenge despite international commitment to the United Nations Convention on Biodiversity. Biodiversity monitoring methods are often limited in their geographical coverage or thematic content. Furthermore, remote sensing-based integrated monitoring methods mostly attempt to determine species diversity from habitat [...] Read more.
Biodiversity loss remains a global challenge despite international commitment to the United Nations Convention on Biodiversity. Biodiversity monitoring methods are often limited in their geographical coverage or thematic content. Furthermore, remote sensing-based integrated monitoring methods mostly attempt to determine species diversity from habitat heterogeneity somewhat reflected in the spectral diversity of the image used. Up to date, there has been no standardized method for monitoring biodiversity against the backdrop of ecosystem or environmental pressures. This study presents a new method for monitoring the impact of oil pollution an environmental pressure on biodiversity at regional scale and presents a case study in the Niger delta region of Nigeria. It integrates satellite remote sensing and field data to develop a set of spectral metrics for biodiversity monitoring. Using vascular plants of various lifeforms observed on polluted and unpolluted (control) locations, as surrogates for biodiversity, the normalized difference vegetation vigour index (NDVVI) variants were estimated from Hyperion wavelengths sensitive to petroleum hydrocarbons and evaluated for potential use in biodiversity monitoring schemes. The NDVVI ranges from 0 to 1 and stems from the presupposition that increasing chlorophyll absorption in the green vegetation can be used as a predictor to model vascular plant species diversity. The performances of NDVVI variants were compared to traditional narrowband vegetation indices (NBVIs). The results show strong links between vascular plant species diversity and primary productivity of vegetation quantified by the chlorophyll content, vegetation vigour and abundance. An NDVVI-based model gave much more accurate predictions of species diversity than traditional NBVIs (R-squared and prediction square error (PSE) respectively for Shannon’s diversity = 0.54 and 0.69 for NDVVIs and 0.14 and 0.9 for NBVIs). We conclude that NDVVI is a superior remote sensing index for monitoring biodiversity indicators in oil-polluted areas than traditional NBVIs. Full article
(This article belongs to the Special Issue Remote Sensing for Biodiversity, Ecology and Conservation)
Show Figures

Graphical abstract

22 pages, 9117 KiB  
Article
Spatiotemporal Estimation of Bamboo Forest Aboveground Carbon Storage Based on Landsat Data in Zhejiang, China
by Yangguang Li, Ning Han, Xuejian Li, Huaqiang Du, Fangjie Mao, Lu Cui, Tengyan Liu and Luqi Xing
Remote Sens. 2018, 10(6), 898; https://doi.org/10.3390/rs10060898 - 7 Jun 2018
Cited by 45 | Viewed by 6590
Abstract
China is one of the countries with the most abundant bamboo forest resources in the world, and Zhejiang province is among the top-3 Chinese provinces with richest bamboo forests. For rational bamboo forests management, it is of great significance to study the spatiotemporal [...] Read more.
China is one of the countries with the most abundant bamboo forest resources in the world, and Zhejiang province is among the top-3 Chinese provinces with richest bamboo forests. For rational bamboo forests management, it is of great significance to study the spatiotemporal dynamic changes of Aboveground Carbon (AGC) stocks of bamboo forest in Zhejiang. In this study, remote sensing variables, such as spectral, vegetation indices and texture features of bamboo forest in Zhejiang, were extracted from 32 Landsat TM and OLI images got from four different years (2000, 2004, 2008 and 2014). These variables were subsequently selected with stepwise regression method to build an estimation model of AGC of the bamboo forests. The results showed that (1) the accuracy of bamboo forest remote sensing information extracted from the four different years was high with a classification accuracy of >76.26% and an accuracy of users of >91.62%. The classification area of bamboo forest was highly consistent with the area from forest resource inventory, and the area accuracy was over 96.50%; (2) the estimation model performed well in predicting the AGC in Zhejiang for different years. The correlation coefficient for estimated and measured AGC was between 63% and 72% with low root mean square error; (3) the derived AGC of the bamboo forests in Zhejiang province increased gradually from 2000 to 2014, with the AGC density of 6.75 Mg·ha−1, 10.95 Mg·ha−1, 15.25 Mg·ha−1 and 19.07 Mg·ha−1 respectively, and the average annual growth of 0.88 Mg·ha−1. The spatiotemporal evolution of bamboo forest AGC in Zhejiang province had a close relationship with the gradual expansion of bamboo forest in the province and the differentiation of management levels in different regions. Full article
(This article belongs to the Special Issue Multitemporal Remote Sensing for Forestry)
Show Figures

Graphical abstract

24 pages, 12471 KiB  
Article
InSAR-Based Mapping to Support Decision-Making after an Earthquake
by Marta Béjar-Pizarro, José A. Álvarez Gómez, Alejandra Staller, Marco P. Luna, Raúl Pérez-López, Oriol Monserrat, Kervin Chunga, Aracely Lima, Jorge Pedro Galve, José J. Martínez Díaz, Rosa María Mateos and Gerardo Herrera
Remote Sens. 2018, 10(6), 899; https://doi.org/10.3390/rs10060899 - 7 Jun 2018
Cited by 22 | Viewed by 8498
Abstract
It has long been recognized that earthquakes change the stress in the upper crust around the fault rupture and can influence the behaviour of neighbouring faults and volcanoes. Rapid estimates of these stress changes can provide the authorities managing the post-disaster situation with [...] Read more.
It has long been recognized that earthquakes change the stress in the upper crust around the fault rupture and can influence the behaviour of neighbouring faults and volcanoes. Rapid estimates of these stress changes can provide the authorities managing the post-disaster situation with valuable data to identify and monitor potential threads and to update the estimates of seismic and volcanic hazard in a region. Here we propose a methodology to evaluate the potential influence of an earthquake on nearby faults and volcanoes and create easy-to-understand maps for decision-making support after large earthquakes. We apply this methodology to the Mw 7.8, 2016 Ecuador earthquake. Using Sentinel-1 Interferometric Synthetic Aperture Radar (InSAR) and continuous GPS data, we measure the coseismic ground deformation and estimate the distribution of slip over the fault rupture. We also build an alternative source model using the Global Centroid Moment Tensor (CMT) solution. Then we use these models to evaluate changes of static stress on the surrounding faults and volcanoes and produce maps of potentially activated faults and volcanoes. We found, in general, good agreement between our maps and the seismic and volcanic events that occurred after the Pedernales earthquake. We discuss the potential and limitations of the methodology. Full article
(This article belongs to the Special Issue Remote Sensing of Tectonic Deformation)
Show Figures

Graphical abstract

22 pages, 8622 KiB  
Article
Method Based on Edge Constraint and Fast Marching for Road Centerline Extraction from Very High-Resolution Remote Sensing Images
by Lipeng Gao, Wenzhong Shi, Zelang Miao and Zhiyong Lv
Remote Sens. 2018, 10(6), 900; https://doi.org/10.3390/rs10060900 - 7 Jun 2018
Cited by 30 | Viewed by 5374
Abstract
In recent decades, road extraction from very high-resolution (VHR) remote sensing images has become popular and has attracted extensive research efforts. However, the very high spatial resolution, complex urban structure, and contextual background effect of road images complicate the process of road extraction. [...] Read more.
In recent decades, road extraction from very high-resolution (VHR) remote sensing images has become popular and has attracted extensive research efforts. However, the very high spatial resolution, complex urban structure, and contextual background effect of road images complicate the process of road extraction. For example, shadows, vehicles, or other objects may occlude a road located in a developed urban area. To address the problem of occlusion, this study proposes a semiautomatic approach for road extraction from VHR remote sensing images. First, guided image filtering is employed to reduce the negative effects of nonroad pixels while preserving edge smoothness. Then, an edge-constraint-based weighted fusion model is adopted to trace and refine the road centerline. An edge-constraint fast marching method, which sequentially links discrete seed points, is presented to maintain road-point connectivity. Six experiments with eight VHR remote sensing images (spatial resolution of 0.3 m/pixel to 2 m/pixel) are conducted to evaluate the efficiency and robustness of the proposed approach. Compared with state-of-the-art methods, the proposed approach presents superior extraction quality, time consumption, and seed-point requirements. Full article
Show Figures

Graphical abstract

16 pages, 3423 KiB  
Article
Land Cover Change Detection Based on Adaptive Contextual Information Using Bi-Temporal Remote Sensing Images
by Zhiyong Lv, Tongfei Liu, Penglin Zhang, Jón Atli Benediktsson and Yixiang Chen
Remote Sens. 2018, 10(6), 901; https://doi.org/10.3390/rs10060901 - 8 Jun 2018
Cited by 25 | Viewed by 6369
Abstract
Land cover change detection (LCCD) based on bi-temporal remote sensing images plays an important role in the inventory of land cover change. Due to the benefit of having spatial dependency properties within the image space while using remote sensing images for detecting land [...] Read more.
Land cover change detection (LCCD) based on bi-temporal remote sensing images plays an important role in the inventory of land cover change. Due to the benefit of having spatial dependency properties within the image space while using remote sensing images for detecting land cover change, many contextual information-based change detection methods have been proposed in past decades. However, there is still a space for improvement in accuracies and usability of LCCD. In this paper, a LCCD method based on adaptive contextual information is proposed. First, an adaptive region is constructed by gradually detecting the spectral similarity surrounding a central pixel. Second, the Euclidean distance between pairwise extended regions is calculated to measure the change magnitude between the pairwise central pixels of bi-temporal images. All the bi-temporal images are scanned pixel by pixel so the change magnitude image (CMI) can be generated. Then, the Otsu or a manual threshold is employed to acquire the binary change detection map (BCDM). The detection accuracies of the proposed approach are investigated by three land cover change cases with Landsat bi-temporal remote sensing images and aerial images with very high spatial resolution (0.5 m/pixel). In comparison to several widely used change detection methods, the proposed approach can produce a land cover change inventory map with a competitive accuracy. Full article
Show Figures

Graphical abstract

9 pages, 4615 KiB  
Article
Automatic Measurement of Water Height in the As Conchas (Spain) Reservoir Using Sentinel 2 and Aerial LiDAR Data
by Higinio González-Jorge, Luis Miguel González-deSantos, Joaquin Martínez-Sánchez, Ana Sánchez-Rodríguez and Henrique Lorenzo
Remote Sens. 2018, 10(6), 902; https://doi.org/10.3390/rs10060902 - 8 Jun 2018
Cited by 3 | Viewed by 3641
Abstract
A methodology for the measurement of height in water reservoirs is developed. It is based on Sentinel 2 imagery and aerial LiDAR data. The methodology is automatized using Matlab software and focused on image processing techniques (equalization, binarization, and edge detection) combined with [...] Read more.
A methodology for the measurement of height in water reservoirs is developed. It is based on Sentinel 2 imagery and aerial LiDAR data. The methodology is automatized using Matlab software and focused on image processing techniques (equalization, binarization, and edge detection) combined with LiDAR data processing (near neighbour search and height averaging). It is applied in a region of interest selected by the user characterized by a water–land interface. Results are validated in the As Conchas water reservoir (Spain) using an in situ sensing system provided by the Hydrographic Miño-Sil Confederation. The duration of the experiment was one year. The Sentinel 2 bands B2, B3, B4, and B8 were tested during this study. The best results for water height evaluation were obtained for band B8 (842 nm) with an error of 0.20 m and a standard deviation of 0.17 m. The time resolution of the technique depends on the Sentinel 2 revisit time. The time resolution and height accuracy could be improved using complementary satellite systems. Full article
(This article belongs to the Section Remote Sensing in Geology, Geomorphology and Hydrology)
Show Figures

Graphical abstract

16 pages, 7866 KiB  
Article
Soil Moisture Monitoring in a Temperate Peatland Using Multi-Sensor Remote Sensing and Linear Mixed Effects
by Koreen Millard, Dan K. Thompson, Marc-André Parisien and Murray Richardson
Remote Sens. 2018, 10(6), 903; https://doi.org/10.3390/rs10060903 - 8 Jun 2018
Cited by 21 | Viewed by 7448
Abstract
The purpose of this research was to use empirical models to monitor temporal dynamics of soil moisture in a peatland using remotely sensed imagery, and to determine the predictive accuracy of the approach on dates outside the time series through statistically independent validation. [...] Read more.
The purpose of this research was to use empirical models to monitor temporal dynamics of soil moisture in a peatland using remotely sensed imagery, and to determine the predictive accuracy of the approach on dates outside the time series through statistically independent validation. A time series of seven Moderate Resolution Imaging Spectroradiometer (MODIS) and Synthetic Aperture Radar (SAR) images were collected along with concurrent field measurements of soil moisture over one growing season, and soil moisture retrieval was tested using Linear Mixed Effects models (LMEs). A single-date airborne Light Detection and Ranging (LiDAR) survey was incorporated into the analysis, along with temporally varying environmental covariates (Drought Code, Time Since Last Rain, Day of Year). LMEs allowed repeated measures to be accounted for at individual sampling sites, as well as soil moisture differences associated with peatland classes. Covariates provided a large amount of explanatory power in models; however, SAR imagery contributed to only a moderate improvement in soil moisture predictions (marginal R2 = 0.07; conditional R2 = 0.7, independently validated R2 = 0.36). The use of LMEs allows for a more accurate characterization of soil moisture as a function of specific measurement sites, peatland classes and measurement dates on model strength and predictive power. For intensively monitored peatlands, SAR data is best analyzed in conjunction with peatland Class (e.g., derived from an ecosystem classification map) to estimate the spatial distribution of surface soil moisture, provided there is a ground-based monitoring network with a sufficiently fine spatial and temporal resolution to fit the LME models. Full article
(This article belongs to the Special Issue Remote Sensing of Peatlands)
Show Figures

Graphical abstract

20 pages, 4032 KiB  
Article
Seasonal and Decadal Groundwater Changes in African Sedimentary Aquifers Estimated Using GRACE Products and LSMs
by H. C. Bonsor, M. Shamsudduha, B. P. Marchant, A. M. MacDonald and R. G. Taylor
Remote Sens. 2018, 10(6), 904; https://doi.org/10.3390/rs10060904 - 8 Jun 2018
Cited by 66 | Viewed by 9293
Abstract
Increased groundwater abstraction is important to the economic development of Africa and to achieving many of the Sustainable Development Goals. However, there is little information on long-term or seasonal groundwater trends due to a lack of in situ monitoring. Here, we used GRACE [...] Read more.
Increased groundwater abstraction is important to the economic development of Africa and to achieving many of the Sustainable Development Goals. However, there is little information on long-term or seasonal groundwater trends due to a lack of in situ monitoring. Here, we used GRACE data from three products (the Centre for Space Research land solution (CSR), the Jet Propulsion Laboratory’s Global Mascon solution (JPL-MSCN), and the Centre National D’etudes Spatiales / Groupe de Recherches de Géodésie Spatiale solution (GRGS)), to examine terrestrial water storage (TWS) changes in 12 African sedimentary aquifers, to examine relationships between TWS and rainfall , and estimate groundwater storage (GWS) changes using four Land Surface Models (LSMs) (Community Land Model (CLM2.0), the Variable Infiltration Capacity model (VIC), the Mosaic model (MOSAIC) and the Noah model (NOAH)). We find that there are no substantial continuous long-term decreasing trends in groundwater storage from 2002 to 2016 in any of the African basins, however, consistent rising groundwater trends amounting to ~1 km3/year and 1.5 km3/year are identified in the Iullemmeden and Senegal basins, respectively, and longer term variations in ΔTWS in several basins associated with rainfall patterns. Discrete seasonal ΔTWS responses of ±1–5 cm/year are indicated by GRACE for each of the basins, with the exception of the Congo, North Kalahari, and Senegal basins, which display larger seasonal ΔTWS equivalent to approx. ±11–20 cm/year. The different seasonal responses in ΔTWS provide useful information about groundwater, including the identification of 5 to 9 month accumulation periods of rainfall in many semi-arid and arid basins as well as differences in ΔTWS responses between Sahelian and southern African aquifers to similar rainfall, likely reflecting differences in landcover. Seasonal ΔGWS estimated by combining GRACE ΔTWS with LSM outputs compare inconsistently to available in situ measurements of groundwater recharge from different basins, highlighting the need to further develop the representation of the recharge process in LSMs and the need for more in situ observations from piezometry. Full article
(This article belongs to the Special Issue Remote Sensing of Groundwater from River Basin to Global Scales)
Show Figures

Graphical abstract

20 pages, 5087 KiB  
Article
Improved Joint Sparse Models for Hyperspectral Image Classification Based on a Novel Neighbour Selection Strategy
by Qishuo Gao, Samsung Lim and Xiuping Jia
Remote Sens. 2018, 10(6), 905; https://doi.org/10.3390/rs10060905 - 8 Jun 2018
Cited by 11 | Viewed by 4110
Abstract
Joint sparse representation has been widely used for hyperspectral image classification in recent years, however, the equal weight assigned to each neighbouring pixel is less realistic, especially for the edge areas, and one fixed scale is not appropriate for the entire image extent. [...] Read more.
Joint sparse representation has been widely used for hyperspectral image classification in recent years, however, the equal weight assigned to each neighbouring pixel is less realistic, especially for the edge areas, and one fixed scale is not appropriate for the entire image extent. To overcome these problems, we propose an adaptive local neighbour selection strategy suitable for hyperspectral image classification. We also introduce a multi-level joint sparse model based on the proposed adaptive local neighbour selection strategy. This method can generate multiple joint sparse matrices on different levels based on the selected parameters, and the multi-level joint sparse optimization can be performed efficiently by a simultaneous orthogonal matching pursuit algorithm. Tests on three benchmark datasets show that the proposed method is superior to the conventional sparsity representation methods and the popular support vector machines. Full article
(This article belongs to the Section Remote Sensing Image Processing)
Show Figures

Graphical abstract

16 pages, 4241 KiB  
Article
Synthetic Aperture Radar Image Segmentation with Reaction Diffusion Level Set Evolution Equation in an Active Contour Model
by Jiaxing Liu, Xianbin Wen, Qingxia Meng, Haixia Xu and Liming Yuan
Remote Sens. 2018, 10(6), 906; https://doi.org/10.3390/rs10060906 - 8 Jun 2018
Cited by 15 | Viewed by 4125
Abstract
This paper presents a method for synthetic aperture radar (SAR) image segmentation by draing upon a reaction–diffusion (RD) level set evolution (LSE) equation. The well-known RD theory consists of two main parts: reaction and diffusion terms. We first constructed the reaction term using [...] Read more.
This paper presents a method for synthetic aperture radar (SAR) image segmentation by draing upon a reaction–diffusion (RD) level set evolution (LSE) equation. The well-known RD theory consists of two main parts: reaction and diffusion terms. We first constructed the reaction term using an energy functional, which integrates the gamma statistical distribution with region–edge information from SAR images that can simultaneously suppress speckle noise and drive the active contour toward the object boundaries. Then, we used partial differential equation-based LSE to solve the proposed energy functional. Finally, a diffusion term was introduced into the LSE to ensure stability of the level set function and regularize the segmented region. The experimental results of both simulated and real SAR images showed that the proposed model has good robustness against a speckle noise as well as higher segmentation efficiency and accuracy than some existing models. Full article
(This article belongs to the Section Remote Sensing Image Processing)
Show Figures

Graphical abstract

13 pages, 1659 KiB  
Article
Hyperspectral Image Compression Using Vector Quantization, PCA and JPEG2000
by Daniel Báscones, Carlos González and Daniel Mozos
Remote Sens. 2018, 10(6), 907; https://doi.org/10.3390/rs10060907 - 8 Jun 2018
Cited by 77 | Viewed by 5730
Abstract
Compression of hyperspectral imagery increases the efficiency of image storage and transmission. It is especially useful to alleviate congestion in the downlinks of planes and satellites, where these images are usually taken from. A novel compression algorithm is presented here. It first spectrally [...] Read more.
Compression of hyperspectral imagery increases the efficiency of image storage and transmission. It is especially useful to alleviate congestion in the downlinks of planes and satellites, where these images are usually taken from. A novel compression algorithm is presented here. It first spectrally decorrelates the image using Vector Quantization and Principal Component Analysis (PCA), and then applies JPEG2000 to the Principal Components (PCs) exploiting spatial correlations for compression. We take advantage of the fact that dimensionality reduction preserves more information in the first components, allocating more depth to the first PCs. We optimize the selection of parameters by maximizing the distortion-ratio performance across the test images. An increase of 1 to 3 dB in Signal Noise Ratio (SNR) for the same compression ratio is found over just using PCA + JPEG2000, while also speeding up compression and decompression by more than 10%. A formula is proposed which determines the configuration of the algorithm, obtaining results that range from heavily compressed-low SNR images to low compressed-near lossless ones. Full article
(This article belongs to the Section Remote Sensing Image Processing)
Show Figures

Graphical abstract

21 pages, 7721 KiB  
Article
Issues in Unmanned Aerial Systems (UAS) Data Collection of Complex Forest Environments
by Benjamin T. Fraser and Russell G. Congalton
Remote Sens. 2018, 10(6), 908; https://doi.org/10.3390/rs10060908 - 8 Jun 2018
Cited by 88 | Viewed by 9446
Abstract
Unmanned Aerial Systems (UAS) offer users the ability to capture large amounts of imagery at unprecedented spatial resolutions due to their flexible designs, low costs, automated workflows, and minimal technical knowledge barriers. Their rapid extension into new disciplines promotes the necessity to question [...] Read more.
Unmanned Aerial Systems (UAS) offer users the ability to capture large amounts of imagery at unprecedented spatial resolutions due to their flexible designs, low costs, automated workflows, and minimal technical knowledge barriers. Their rapid extension into new disciplines promotes the necessity to question and understand the implications of data capture and processing parameter decisions on the respective output completeness. This research provides a culmination of quantitative insight using an eBee Plus, fixed-wing UAS for collecting robust data on complex forest environments. These analyses differentiate from measures of accuracy, which were derived from positional comparison to other data sources, to instead guide applications of comprehensive coverage. Our results demonstrated the impacts of flying height on Structure from Motion (SfM) processing completeness, discrepancies in outputs based on software package choice, and the effects caused by processing parameter settings. For flying heights of 50 m, 100 m, and 120 m above the forest canopy, key quality indicators within the software demonstrated the superior performance of the 100-m flying height. These indicators included, among others, image alignment success, the average number of tie points per image, and planimetric model ground sampling distance. We also compared the output results of two leading SfM software packages: Agisoft PhotoScan and Pix4D Mapper Pro. Agisoft PhotoScan maintained an 11.8% greater image alignment success and a 9.91% finer planimetric model resolution. Lastly, we compared the “high” and “medium” resolution processing workflows in Agisoft PhotoScan. The high-resolution processing setting achieved a 371% increase in point cloud density, with a 3.1% coarser planimetric model resolution, over a considerably longer processing time. As UAS continue to expand their sphere of influence and develop technologically, best-use practices based on aerial photogrammetry principles must remain apparent to achieve optimal results. Full article
Show Figures

Graphical abstract

19 pages, 5886 KiB  
Article
Historical and Operational Monitoring of Surface Sediments in the Lower Mekong Basin Using Landsat and Google Earth Engine Cloud Computing
by Kel N. Markert, Calla M. Schmidt, Robert E. Griffin, Africa I. Flores, Ate Poortinga, David S. Saah, Rebekke E. Muench, Nicholas E. Clinton, Farrukh Chishtie, Kritsana Kityuttachai, Paradis Someth, Eric R. Anderson, Aekkapol Aekakkararungroj and David J. Ganz
Remote Sens. 2018, 10(6), 909; https://doi.org/10.3390/rs10060909 - 8 Jun 2018
Cited by 61 | Viewed by 15438
Abstract
Reservoir construction and land use change are altering sediment transport within river systems at a global scale. Changes in sediment transport can impact river morphology, aquatic ecosystems, and ultimately the growth and retreat of delta environments. The Lower Mekong Basin is crucial to [...] Read more.
Reservoir construction and land use change are altering sediment transport within river systems at a global scale. Changes in sediment transport can impact river morphology, aquatic ecosystems, and ultimately the growth and retreat of delta environments. The Lower Mekong Basin is crucial to five neighboring countries for transportation, energy production, sustainable water supply, and food production. In response, countries have coordinated to develop programs for regional scale water quality monitoring that including surface sediment concentrations (SSSC); however, these programs are based on a limited number of point measurements and due to resource limitations, cannot provide comprehensive insights into sediment transport across all strategic locations within the Lower Mekong Basin. To augment in situ SSSC data from the current monitoring program, we developed an empirical model to estimate SSSC across the Lower Mekong Basin from Landsat observations. Model validation revealed that remotely sensed SSSC estimates captured the spatial and temporal dynamics in a range of aquatic environments (main stem of Mekong river, tributary systems, Mekong Floodplain, and reservoirs) while, on average, slightly underestimating SSSC by about 2 mg·L1 across all settings. The operational SSSC model was developed and implemented using Google Earth Engine and Google App Engine was used to host an online application that allows users, without any knowledge of remote sensing, to access SSSC data across the region. Expanded access to SSSC data should be particularly helpful for resource managers and other stakeholders seeking to understand the dynamics between surface sediment concentrations and land use conversions, water policy, and energy production in a globally strategic region. Full article
(This article belongs to the Collection Google Earth Engine Applications)
Show Figures

Graphical abstract

23 pages, 4779 KiB  
Article
Fast and Automatic Data-Driven Thresholding for Inundation Mapping with Sentinel-2 Data
by Georgios A. Kordelas, Ioannis Manakos, David Aragonés, Ricardo Díaz-Delgado and Javier Bustamante
Remote Sens. 2018, 10(6), 910; https://doi.org/10.3390/rs10060910 - 8 Jun 2018
Cited by 54 | Viewed by 9550
Abstract
Satellite data offer the opportunity for monitoring the temporal flooding dynamics of seasonal wetlands, a parameter that is essential for the ecosystem services these areas provide. This study introduces an unsupervised approach to estimate the extent of flooded areas in a satellite image [...] Read more.
Satellite data offer the opportunity for monitoring the temporal flooding dynamics of seasonal wetlands, a parameter that is essential for the ecosystem services these areas provide. This study introduces an unsupervised approach to estimate the extent of flooded areas in a satellite image relying on the physics of light interaction with water, vegetation and their combination. The approach detects automatically thresholds on the Short-Wave Infrared (SWIR) band and on a Modified-Normalized Difference Vegetation Index (MNDVI), derived from radiometrically-corrected Sentinel-2 data. Then, it combines them in a meaningful way based on a knowledge base coming out of an iterative trial and error process. Classes of interest concern water and non-water areas. The water class is comprised of the open-water and water-vegetation subclasses. In parallel, a supervised approach is implemented mainly for performance comparison reasons. The latter approach performs a random forest classification on a set of bands and indices extracted from Sentinel-2 data. The approaches are able to discriminate the water class in different types of wetlands (marshland, rice-paddies and temporary ponds) existing in the Doñana Biosphere Reserve study area, located in southwest Spain. Both unsupervised and supervised approaches are examined against validation data derived from Landsat satellite inundation time series maps, generated by the local administration and offered as an online service since 1983. Accuracy assessment metrics show that both approaches have similarly high classification performance (e.g., the combined kappa coefficient of the unsupervised and the supervised approach is 0.8827 and 0.9477, and the combined overall accuracy is 97.71% and 98.95, respectively). The unsupervised approach can be used by non-trained personnel with a potential for transferability to sites of, at least, similar characteristics. Full article
(This article belongs to the Special Issue Remote Sensing for Flood Mapping and Monitoring of Flood Dynamics)
Show Figures

Graphical abstract

21 pages, 5667 KiB  
Article
Scalable Parcel-Based Crop Identification Scheme Using Sentinel-2 Data Time-Series for the Monitoring of the Common Agricultural Policy
by Vasileios Sitokonstantinou, Ioannis Papoutsis, Charalampos Kontoes, Alberto Lafarga Arnal, Ana Pilar Armesto Andrés and José Angel Garraza Zurbano
Remote Sens. 2018, 10(6), 911; https://doi.org/10.3390/rs10060911 - 8 Jun 2018
Cited by 100 | Viewed by 10481
Abstract
This work investigates a Sentinel-2 based crop identification methodology for the monitoring of the Common Agricultural Policy’s (CAP) Cross Compliance (CC) and Greening obligations. In this regard, we implemented and evaluated a parcel-based supervised classification scheme to produce accurate crop type mapping in [...] Read more.
This work investigates a Sentinel-2 based crop identification methodology for the monitoring of the Common Agricultural Policy’s (CAP) Cross Compliance (CC) and Greening obligations. In this regard, we implemented and evaluated a parcel-based supervised classification scheme to produce accurate crop type mapping in a smallholder agricultural zone in Navarra, Spain. The scheme makes use of supervised classifiers Support Vector Machines (SVMs) and Random Forest (RF) to discriminate among the various crop types, based on a large variable space of Sentinel-2 imagery and Vegetation Index (VI) time-series. The classifiers are separately applied at three different levels of crop nomenclature hierarchy, comparing their performance with respect to accuracy and execution time. SVM provides optimal performance and proves significantly superior to RF for the lowest level of the nomenclature, resulting in 0.87 Cohen’s kappa coefficient. Experiments were carried out to assess the importance of input variables, where top contributors are the Near Infrared (NIR), vegetation red-edge, and Short-Wave Infrared (SWIR) multispectral bands, and the Normalized Difference Vegetation (NDVI) and Plant Senescence Reflectance (PSRI) indices, sensed during advanced crop phenology stages. The scheme is finally applied to a Lansat-8 OLI based equivalent variable space, offering 0.70 Cohen’s kappa coefficient for the SVM classification, highlighting the superior performance of Sentinel-2 for this type of application. This is credited to Sentinel-2’s spatial, spectral, and temporal characteristics. Full article
(This article belongs to the Special Issue High Resolution Image Time Series for Novel Agricultural Applications)
Show Figures

Figure 1

12 pages, 3595 KiB  
Article
UAV Photogrammetry of Forests as a Vulnerable Process. A Sensitivity Analysis for a Structure from Motion RGB-Image Pipeline
by Julian Frey, Kyle Kovach, Simon Stemmler and Barbara Koch
Remote Sens. 2018, 10(6), 912; https://doi.org/10.3390/rs10060912 - 9 Jun 2018
Cited by 102 | Viewed by 11584
Abstract
Structural analysis of forests by UAV is currently growing in popularity. Given the reduction in platform costs, and the number of algorithms available to analyze data output, the number of applications has grown rapidly. Forest structures are not only linked to economic value [...] Read more.
Structural analysis of forests by UAV is currently growing in popularity. Given the reduction in platform costs, and the number of algorithms available to analyze data output, the number of applications has grown rapidly. Forest structures are not only linked to economic value in forestry, but also to biodiversity and vulnerability issues. LiDAR remains the most promising technique for forest structural assessment, but small LiDAR sensors suitable for UAV applications are expensive and are limited to a few manufactures. The estimation of 3D-structures from two-dimensional image sequences called ‘Structure from motion’ (SfM) overcomes this limitation by photogrammetrically reconstructing point clouds similar to those rendered from LiDAR sensors. The result of these techniques in highly structured terrain strongly depends on the methods employed during image acquisition, therefore structural indices might be vulnerable to misspecifications in flight campaigns. In this paper, we outline how image overlap and ground sampling distances affect image reconstruction completeness in 2D and 3D. Higher image overlaps and coarser GSDs have a clearly positive influence on reconstruction quality. Therefore, higher accuracy requirements in the GSD must be compensated by a higher image overlap. The best results are achieved with an image overlap of > 95% and a resolution of > 5 cm. The most important environmental factors have been found to be wind and terrain elevation, which could be an indicator of vegetation density. Full article
(This article belongs to the Special Issue Advances in Remote Sensing of Forest Structure and Applications)
Show Figures

Graphical abstract

28 pages, 11446 KiB  
Article
Applying High-Resolution Imagery to Evaluate Restoration-Induced Changes in Stream Condition, Missouri River Headwaters Basin, Montana
by Melanie K. Vanderhoof and Clifton Burt
Remote Sens. 2018, 10(6), 913; https://doi.org/10.3390/rs10060913 - 9 Jun 2018
Cited by 17 | Viewed by 6942
Abstract
Degradation of streams and associated riparian habitat across the Missouri River Headwaters Basin has motivated several stream restoration projects across the watershed. Many of these projects install a series of beaver dam analogues (BDAs) to aggrade incised streams, elevate local water tables, and [...] Read more.
Degradation of streams and associated riparian habitat across the Missouri River Headwaters Basin has motivated several stream restoration projects across the watershed. Many of these projects install a series of beaver dam analogues (BDAs) to aggrade incised streams, elevate local water tables, and create natural surface water storage by reconnecting streams with their floodplains. Satellite imagery can provide a spatially continuous mechanism to monitor the effects of these in-stream structures on stream surface area. However, remote sensing-based approaches to map narrow (e.g., <5 m wide) linear features such as streams have been under-developed relative to efforts to map other types of aquatic systems, such as wetlands or lakes. We mapped pre- and post-restoration (one to three years post-restoration) stream surface area and riparian greenness at four stream restoration sites using Worldview-2 and 3 images as well as a QuickBird-2 image. We found that panchromatic brightness and eCognition-based outputs (0.5 m resolution) provided high-accuracy maps of stream surface area (overall accuracy ranged from 91% to 99%) for streams as narrow as 1.5 m wide. Using image pairs, we were able to document increases in stream surface area immediately upstream of BDAs as well as increases in stream surface area along the restoration reach at Robb Creek, Alkali Creek and Long Creek (South). Although Long Creek (North) did not show a net increase in stream surface area along the restoration reach, we did observe an increase in riparian greenness, suggesting increased water retention adjacent to the stream. As high-resolution imagery becomes more widely collected and available, improvements in our ability to provide spatially continuous monitoring of stream systems can effectively complement more traditional field-based and gage-based datasets to inform watershed management. Full article
Show Figures

Graphical abstract

23 pages, 11223 KiB  
Article
Ground-Based Differential Interferometric Radar Monitoring of Unstable Mountain Blocks in a Coastal Environment
by Rune Gundersen, Richard Norland and Cecilie Rolstad Denby
Remote Sens. 2018, 10(6), 914; https://doi.org/10.3390/rs10060914 - 9 Jun 2018
Cited by 6 | Viewed by 4763
Abstract
In this paper, we present the results of eight years of continuous monitoring with a ground-based, interferometric, real-aperture radar of two unstable mountain blocks at Tafjord on the western coast of Norway. A real-time, interferometric, ground-based radar has the capability to provide high [...] Read more.
In this paper, we present the results of eight years of continuous monitoring with a ground-based, interferometric, real-aperture radar of two unstable mountain blocks at Tafjord on the western coast of Norway. A real-time, interferometric, ground-based radar has the capability to provide high accuracy range measurements by using the phase of the transmitted signal, thus achieving sub-millimeter accuracy when a sufficient signal-to-noise level is present. The main challenge with long term monitoring is the variations in radio refractivity caused by changes in the atmosphere. The range variations caused by refractive changes in the atmosphere are corrected using meteorological data. We use triangular corner reflectors as references to improve the signal-to-clutter ratio and improve the accuracy of the measurements. We have also shown that by using differential interferometry, a significant part of the variation caused by radio refractivity variations is removed. The overall reduction in path length variation when using differential interferometry varies from 27 to 164 times depending on the radar-to-reflector path length. The measurements reveal cyclic seasonal variations, which are coherent with air temperature. The results show that radar measurements are as accurate as data from in situ instruments like extensometers and crack meters, making it possible to monitor inaccessible areas. The total measured displacement is between 1.2 mm and 4.7 mm for the two monitored mountain blocks. Full article
(This article belongs to the Special Issue Radar Interferometry for Geohazards)
Show Figures

Figure 1

23 pages, 1581 KiB  
Article
Extraction of Photosynthesis Parameters from Time Series Measurements of In Situ Production: Bermuda Atlantic Time-Series Study
by Žarko Kovač, Trevor Platt, Shubha Sathyendranath and Michael W. Lomas
Remote Sens. 2018, 10(6), 915; https://doi.org/10.3390/rs10060915 - 9 Jun 2018
Cited by 8 | Viewed by 5503
Abstract
Computing the vertical structure of primary production in ocean ecosystem models requires information about the vertical distribution of available light, chlorophyll concentration and photosynthesis response parameters. Conversely, given information on vertical structure of chlorophyll and light, we can extract photosynthesis parameters from vertical [...] Read more.
Computing the vertical structure of primary production in ocean ecosystem models requires information about the vertical distribution of available light, chlorophyll concentration and photosynthesis response parameters. Conversely, given information on vertical structure of chlorophyll and light, we can extract photosynthesis parameters from vertical profiles of primary production measured at sea, as we illustrate here for the Bermuda Atlantic Time-Series Study. The procedure is based on a model of the production profile, which itself depends on the underwater light field. To model the light field, attenuation coefficients were estimated from measured optical profiles using a simple model of exponential decay of photosynthetically-available irradiance with depth, which accounted for 97% of the variance in the measured optical data. With the underwater light climate known, an analytical solution for the production profile was employed to recover photosynthesis parameters by minimizing the residual model error. The recovered parameters were used to model normalized production profiles and normalized watercolumn production. The model explained 95% of the variance in the measured normalized production at depth and 97% of the variance in measured normalized watercolumn production. A shifted Gaussian function was used to model biomass profiles and accounted for 93% of the variance in measured biomass at depth. An analytical solution for watercolumn production with the shifted Gaussian biomass was also tested. With the recovered photosynthesis parameters, maximum instantaneous growth rates were estimated by using a literature value for the carbon-to-chlorophyll ratio in this region of the Atlantic. An exact relationship between the maximum instantaneous growth rate and the daily growth rate in the ocean was derived. It was shown that calculating the growth rate by dividing the production by the carbon-to-chlorophyll ratio is equivalent to calculating it from the ratio of the final to the initial biomass, even when production is time dependent. Finally, the seasonal cycle of the recovered assimilation number at the Bermuda Station was constructed and analysed. The presented approach enables the estimation of photosynthesis parameters and growth rates from measured production profiles with only a few model assumptions, and increases the utility of in situ primary production measurements. The retrieved parameters have direct applications in satellite-based estimates of primary production from ocean-colour data, of which we give an example. Full article
(This article belongs to the Special Issue Remote Sensing of Ocean Colour)
Show Figures

Graphical abstract

17 pages, 3757 KiB  
Article
Supervised Classification of RGB Aerial Imagery to Evaluate the Impact of a Root Rot Disease
by Chakradhar Mattupalli, Corey A. Moffet, Kushendra N. Shah and Carolyn A. Young
Remote Sens. 2018, 10(6), 917; https://doi.org/10.3390/rs10060917 - 10 Jun 2018
Cited by 34 | Viewed by 6803
Abstract
Aerial imaging provides a landscape view of crop fields that can be utilized to monitor plant diseases. Phymatotrichopsis root rot (PRR) is a serious root rot disease affecting several dicotyledonous hosts, including the perennial forage crop alfalfa. PRR disease causes stand loss by [...] Read more.
Aerial imaging provides a landscape view of crop fields that can be utilized to monitor plant diseases. Phymatotrichopsis root rot (PRR) is a serious root rot disease affecting several dicotyledonous hosts, including the perennial forage crop alfalfa. PRR disease causes stand loss by spreading as circular to irregular diseased areas that increase over time, but disease progression in alfalfa fields is poorly understood. The objectives of this study were to develop a workflow to produce PRR disease maps from sets of high-resolution red, green and blue (RGB) images acquired from two different platforms and to assess the feasibility of using these PRR disease maps to monitor disease progression in alfalfa fields. Aerial RGB images, two from unmanned aircraft systems (UAS) and four images from a manned aircraft platform were acquired at different time points during the 2014–2015 growing seasons from a center-pivot irrigated, PRR-infested alfalfa field near Burneyville, OK. Supervised classification of images acquired from both platforms were performed using three spectral signatures: image-specific, UAS-platform-specific and manned-aircraft platform-specific. Our results showed that the UAS-platform-specific spectral signature was most efficient for classifying images acquired with the UAS, with accuracy ranging from 90 to 96%. In contrast, manned-aircraft-acquired images classified using image-specific spectral signatures yielded 95 to 100% accuracy. The effect of hue, saturation and value color space transformations (HSV and Hrot60SV) on classification accuracy was determined, but the accuracy estimates showed no improvement in their efficiency compared to the RGB color space. Finally, the data showed that the classification of the bare ground increased by 74% during the study period, indicating the extent of alfalfa stand loss caused by PRR disease. Thus, this study showed the utility of high-resolution RGB aerial images for monitoring PRR disease spread in alfalfa. Full article
(This article belongs to the Section Remote Sensing Image Processing)
Show Figures

Graphical abstract

16 pages, 9997 KiB  
Article
Satellite-Based Evaluation of the Post-Fire Recovery Process from the Worst Forest Fire Case in South Korea
by Jae-Hyun Ryu, Kyung-Soo Han, Sungwook Hong, No-Wook Park, Yang-Won Lee and Jaeil Cho
Remote Sens. 2018, 10(6), 918; https://doi.org/10.3390/rs10060918 - 10 Jun 2018
Cited by 60 | Viewed by 9025
Abstract
The worst forest fire in South Korea occurred in April 2000 on the eastern coast. Forest recovery works were conducted until 2005, and the forest has been monitored since the fire. Remote sensing techniques have been used to detect the burned areas and [...] Read more.
The worst forest fire in South Korea occurred in April 2000 on the eastern coast. Forest recovery works were conducted until 2005, and the forest has been monitored since the fire. Remote sensing techniques have been used to detect the burned areas and to evaluate the recovery-time point of the post-fire processes during the past 18 years. We used three indices, Normalized Burn Ratio (NBR), Normalized Difference Vegetation Index (NDVI), and Gross Primary Production (GPP), to temporally monitor a burned area in terms of its moisture condition, vegetation biomass, and photosynthetic activity, respectively. The change of those three indices by forest recovery processes was relatively analyzed using an unburned reference area. The selected unburned area had similar characteristics to the burned area prior to the forest fire. The temporal patterns of NBR and NDVI, not only showed the forest recovery process as a result of forest management, but also statistically distinguished the recovery periods at the regions of low, moderate, and high fire severity. The NBR2.1 for all areas, calculated using 2.1 μm wavelengths, reached the unburned state in 2008. The NDVI for areas with low and moderate fire severity levels became significantly equal to the unburned state in 2009 (p > 0.05), but areas with high severity levels did not reach the unburned state until 2017. This indicated that the surface and vegetation moisture conditions recovered to the unburned state about 8 years after the fire event, while vegetation biomass and health required a longer time to recover, particularly for high severity regions. In the case of GPP, it rapidly recovered after about 3 years. Then, the steady increase in GPP surpassed the GPP of the reference area in 2015 because of the rapid growth and high photosynthetic activity of young forests. Therefore, the concluding scientific message is that, because the recovery-time point for each component of the forest ecosystem is different, using only one satellite-based indicator will not be suitable to understand the post-fire recovery process. NBR, NDVI, and GPP can be combined. Further studies will require more approaches using various terms of indices. Full article
(This article belongs to the Special Issue Advances in Remote Sensing-based Disaster Monitoring and Assessment)
Show Figures

Graphical abstract

16 pages, 3744 KiB  
Article
Monitoring the Agung (Indonesia) Ash Plume of November 2017 by Means of Infrared Himawari 8 Data
by Francesco Marchese, Alfredo Falconieri, Nicola Pergola and Valerio Tramutoli
Remote Sens. 2018, 10(6), 919; https://doi.org/10.3390/rs10060919 - 10 Jun 2018
Cited by 23 | Viewed by 5035
Abstract
The Agung volcano (Bali; Indonesia) erupted in later November 2017 after several years of quiescence. Because of ash emissions, hundreds of flights were cancelled, causing an important air traffic disruption in Indonesia. We investigate those ash emissions from space by applying the RST [...] Read more.
The Agung volcano (Bali; Indonesia) erupted in later November 2017 after several years of quiescence. Because of ash emissions, hundreds of flights were cancelled, causing an important air traffic disruption in Indonesia. We investigate those ash emissions from space by applying the RSTASH algorithm for the first time to Himawari-8 data and using an ad hoc implementation scheme to reduce the time of the elaboration processes. Himawari-8 is a new generation Japanese geostationary meteorological satellite, whose AHI (Advanced Himawari Imager) sensor offers improved features, in terms of spectral, spatial and temporal resolution, in comparison with the previous imagers of the MTSAT (Multi-Functional Transport Satellite) series. Those features should guarantee further improvements in monitoring rapidly evolving weather/environmental phenomena. Results of this work show that RSTASH was capable of successfully detecting and tracking the Agung ash plume, despite some limitations (e.g., underestimation of ash coverage under certain conditions; generation of residual artefacts). Moreover, estimates of ash cloud-top height indicate that the monitored plume extended up to an altitude of about 9.3 km above sea level during the period 25 November at 21:10 UTC–26 November at 00:50 UTC. The study demonstrates that RSTASH may give a useful contribution for the operational monitoring of ash clouds over East Asia and the Western Pacific region, well exploiting the 10 min temporal resolution and the spectral features of the Himawari-8 data. Full article
Show Figures

Figure 1

20 pages, 41363 KiB  
Article
High-Resolution Remote Sensing Image Classification Method Based on Convolutional Neural Network and Restricted Conditional Random Field
by Xin Pan and Jian Zhao
Remote Sens. 2018, 10(6), 920; https://doi.org/10.3390/rs10060920 - 10 Jun 2018
Cited by 36 | Viewed by 9341
Abstract
Convolutional neural networks (CNNs) can adapt to more complex data, extract deeper characteristics from images, and achieve higher classification accuracy in remote sensing image scene classification and object detection compared to traditional shallow-model methods. However, directly applying common-structure CNNs to pixel-based remote sensing [...] Read more.
Convolutional neural networks (CNNs) can adapt to more complex data, extract deeper characteristics from images, and achieve higher classification accuracy in remote sensing image scene classification and object detection compared to traditional shallow-model methods. However, directly applying common-structure CNNs to pixel-based remote sensing image classification will lead to boundary or outline distortions of the land cover and consumes enormous computation time in the image classification stage. To solve this problem, we propose a high-resolution remote sensing image classification method based on CNN and the restricted conditional random field algorithm (CNN-RCRF). CNN-RCRF adopts CNN superpixel classification instead of pixel-based classification and uses the restricted conditional random field algorithm (RCRF) to refine the superpixel result image into a pixel-based result. The proposed method not only takes advantage of the classification ability of CNNs but can also avoid boundary or outline distortions of the land cover and greatly reduce computation time in classifying images. The effectiveness of the proposed method is tested with two high-resolution remote sensing images, and the experimental results show that the CNN-RCRF outperforms the existing traditional methods in terms of overall accuracy, and CNN-RCRF’s computation time is much less than that of traditional pixel-based deep-model methods. Full article
(This article belongs to the Special Issue Recent Advances in Neural Networks for Remote Sensing)
Show Figures

Graphical abstract

23 pages, 25110 KiB  
Article
Landslide Monitoring Using Multi-Temporal SAR Interferometry with Advanced Persistent Scatterers Identification Methods and Super High-Spatial Resolution TerraSAR-X Images
by Feng Zhao, Jordi J. Mallorqui, Rubén Iglesias, Josep A. Gili and Jordi Corominas
Remote Sens. 2018, 10(6), 921; https://doi.org/10.3390/rs10060921 - 11 Jun 2018
Cited by 26 | Viewed by 6091
Abstract
Landslides are one of the most common and dangerous threats in the world that generate considerable damage and economic losses. An efficient landslide monitoring tool is the Differential Synthetic Aperture Radar Interferometry (DInSAR) or Persistent Scatter Interferometry (PSI). However, landslides are usually located [...] Read more.
Landslides are one of the most common and dangerous threats in the world that generate considerable damage and economic losses. An efficient landslide monitoring tool is the Differential Synthetic Aperture Radar Interferometry (DInSAR) or Persistent Scatter Interferometry (PSI). However, landslides are usually located in mountainous areas and the area of interest can be partially or even heavily vegetated. The inherent temporal decorrelation that dramatically reduces the number of Persistent Scatters (PSs) of the scene limits in practice the application of this technique. Thus, it is crucial to be able to detect as much PSs as possible that can be usually embedded in decorrelated areas. High resolution imagery combined with efficient pixel selection methods can make possible the application of DInSAR techniques in landslide monitoring. In this paper, different strategies to identify PS Candidates (PSCs) have been employed together with 32 super high-spatial resolution (SHR) TerraSAR-X (TSX) images, staring-spotlight mode, to monitor the Canillo landslide (Andorra). The results show that advanced PSI strategies (i.e., the temporal sub-look coherence (TSC) and temporal phase coherence (TPC) methods) are able to obtain much more valid PSs than the classical amplitude dispersion (DA) method. In addition, the TPC method presents the best performance among all three full-resolution strategies employed. The SHR TSX data allows for obtaining much higher densities of PSs compared with a lower-spatial resolution SAR data set (Sentinel-1A in this study). Thanks to the huge amount of valid PSs obtained by the TPC method with SHR TSX images, the complexity of the structure of the Canillo landslide has been highlighted and three different slide units have been identified. The results of this study indicate that the TPC approach together with SHR SAR images can be a powerful tool to characterize displacement rates and extension of complex landslides in challenging areas. Full article
(This article belongs to the Special Issue Ten Years of TerraSAR-X—Scientific Results)
Show Figures

Figure 1

19 pages, 6392 KiB  
Article
Using Multiple Monthly Water Balance Models to Evaluate Gridded Precipitation Products over Peninsular Spain
by Javier Senent-Aparicio, Adrián López-Ballesteros, Julio Pérez-Sánchez, Francisco José Segura-Méndez and David Pulido-Velazquez
Remote Sens. 2018, 10(6), 922; https://doi.org/10.3390/rs10060922 - 11 Jun 2018
Cited by 33 | Viewed by 4727
Abstract
The availability of precipitation data is the key driver in the application of hydrological models when simulating streamflow. Ground weather stations are regularly used to measure precipitation. However, spatial coverage is often limited in low-population areas and mountain areas. To overcome this limitation, [...] Read more.
The availability of precipitation data is the key driver in the application of hydrological models when simulating streamflow. Ground weather stations are regularly used to measure precipitation. However, spatial coverage is often limited in low-population areas and mountain areas. To overcome this limitation, gridded datasets from remote sensing have been widely used. This study evaluates four widely used global precipitation datasets (GPDs): The Tropical Rainfall Measuring Mission (TRMM) 3B43, the Climate Forecast System Reanalysis (CFSR), the Precipitation Estimation from Remotely Sensed Information using Artificial Neural Networks (PERSIANN), and the Multi-Source Weighted-Ensemble Precipitation (MSWEP), against point gauge and gridded dataset observations using multiple monthly water balance models (MWBMs) in four different meso-scale basins that cover the main climatic zones of Peninsular Spain. The volumes of precipitation obtained from the GPDs tend to be smaller than those from the gauged data. Results underscore the superiority of the national gridded dataset, although the TRMM provides satisfactory results in simulating streamflow, reaching similar Nash-Sutcliffe values, between 0.70 and 0.95, and an average total volume error of 12% when using the GR2M model. The performance of GPDs highly depends on the climate, so that the more humid the watershed is, the better results can be achieved. The procedures used can be applied in regions with similar case studies to more accurately assess the resources within a system in which there is scarcity of recorded data available. Full article
(This article belongs to the Special Issue Remote Sensing of Precipitation)
Show Figures

Graphical abstract

14 pages, 2777 KiB  
Article
An Advanced Forest Fire Danger Forecasting System: Integration of Remote Sensing and Historical Sources of Ignition Data
by Masoud Abdollahi, Tanvir Islam, Anil Gupta and Quazi K. Hassan
Remote Sens. 2018, 10(6), 923; https://doi.org/10.3390/rs10060923 - 12 Jun 2018
Cited by 40 | Viewed by 7584
Abstract
Forest fire is one of the major natural hazards/disasters in Canada and many ecosystems across the world. Here, our objective was to enhance the performance of an existing solely remote sensing-based forest fire danger forecasting system (FFDFS), and its implementation over the northern [...] Read more.
Forest fire is one of the major natural hazards/disasters in Canada and many ecosystems across the world. Here, our objective was to enhance the performance of an existing solely remote sensing-based forest fire danger forecasting system (FFDFS), and its implementation over the northern region of the Canadian province of Alberta. The modified FFDFS was comprised of Moderate Resolution Imaging Spectroradiometer (MODIS)-derived daily surface temperature (Ts) and precipitable water (PW), and 8-day composite of normalized difference vegetation index (NDVI) and normalized difference water index (NDWI), where we assumed that cloud-contaminant pixels would reduce the risk of fire occurrences. In addition, we generated ignition cause-specific static fire danger (SFD) maps derived using the historical human- and lightning-caused fires during the period 1961–2014. Upon incorporating different combinations of the generated SFD maps with the modified FFDFS, we evaluated their performances against actual fire spots during the 2009–2011 fire seasons. Our findings revealed that our proposed modifications were quite effective and the modified FFDFS captured almost the same amount of fires as the original FFDFS, i.e., about 77% of the detected fires on an average in the top three fire danger classes of extremely high, very high, and high categories, where about 50% of the study area fell under low and moderate danger classes. Additionally, we observed that the combination of modified FFDFS and human-caused SFD map (road buffer) demonstrated the most effective results in fire detection, i.e., 82% of detected fires on an average in the top three fire danger classes, where about 46% of the study area fell under the moderate and low danger categories. We believe that our developments would be helpful to manage the forest fire in order to reduce its overall impact. Full article
(This article belongs to the Special Issue Remote Sensing of Wildfire)
Show Figures

Graphical abstract

24 pages, 15643 KiB  
Article
Investigation of Short-Term Evolution of Soil Characteristics over the Lake Chad Basin Using GRACE Data
by Teodolina Lopez, Guillaume Ramillien, Raphaël Antoine, José Darrozes, Yu-Jun Cui and Yann Kerr
Remote Sens. 2018, 10(6), 924; https://doi.org/10.3390/rs10060924 - 12 Jun 2018
Cited by 3 | Viewed by 4331
Abstract
In the Sahelian region, the West African Monsoon (WAM) is an important phenomenon for land water storage evolution, as demonstrated by The Gravity Recovery and Climate Experiment (GRACE) estimations. The Monsoon leads to an annual increase of the water mass. However, GRACE data [...] Read more.
In the Sahelian region, the West African Monsoon (WAM) is an important phenomenon for land water storage evolution, as demonstrated by The Gravity Recovery and Climate Experiment (GRACE) estimations. The Monsoon leads to an annual increase of the water mass. However, GRACE data also displays the existence of a semi-annual cycle whose its origin is still uncertain. This cycle is characterized by a gain of water mass at the beginning of the dry season. In this study, 10-days GRACE data are used to understand the characteristics of this semi-annual cycle. Investigations of the rainfall events, rivers discharge peaks, and the Lake Chad water level variations suggest that they are not at the origin of this cycle. However, MODIS evapotranspiration data display an increase each 6 months, during the rainy season, and at the same time as the semi-annual cycle estimated by GRACE. This increase occurs in regions where the amount of clays at the surface exceeds 30%. The link between both signals and the proportion of clays at the surface leads us to the conclusion that the seasonal variation of the vertical permeability of clays controls the amount of water present in the unsaturated zone. Full article
(This article belongs to the Special Issue GRACE Facing the Challenge of Extreme Spatial and Temporal Scales)
Show Figures

Graphical abstract

23 pages, 4785 KiB  
Article
Evaluating Operational AVHRR Sea Surface Temperature Data at the Coastline Using Benthic Temperature Loggers
by Robert J. W. Brewin, Dan A. Smale, Pippa J. Moore, Giorgio Dall’Olmo, Peter I. Miller, Benjamin H. Taylor, Tim J. Smyth, James R. Fishwick and Mingxi Yang
Remote Sens. 2018, 10(6), 925; https://doi.org/10.3390/rs10060925 - 12 Jun 2018
Cited by 40 | Viewed by 7182
Abstract
The nearshore coastal ocean is one of the most dynamic and biologically productive regions on our planet, supporting a wide range of ecosystem services. It is also one of the most vulnerable regions, increasingly exposed to anthropogenic pressure. In the context of climate [...] Read more.
The nearshore coastal ocean is one of the most dynamic and biologically productive regions on our planet, supporting a wide range of ecosystem services. It is also one of the most vulnerable regions, increasingly exposed to anthropogenic pressure. In the context of climate change, monitoring changes in nearshore coastal waters requires systematic and sustained observations of key essential climate variables (ECV), one of which is sea surface temperature (SST). As temperature influences physical, chemical and biological processes within coastal systems, accurate monitoring is crucial for detecting change. SST is an ECV that can be measured systematically from satellites. Yet, owing to a lack of adequate in situ data, the accuracy and precision of satellite SST at the coastline are not well known. In a prior study, we attempted to address this by taking advantage of in situ SST measurements collected by a group of surfers. Here, we make use of a three year time-series (2014–2017) of in situ water temperature measurements collected using a temperature logger (recording every 30 min) deployed within a kelp forest (∼3 m below chart datum) at a subtidal rocky reef site near Plymouth, UK. We compared the temperature measurements with three other independent in situ SST datasets in the region, from two autonomous buoys located ∼7 km and ∼33 km from the coastline, and from a group of surfers at two beaches near the kelp site. The three datasets showed good agreement, with discrepancies consistent with the spatial separation of the sites. The in situ SST measurements collected from the kelp site and the two autonomous buoys were matched with operational Advanced Very High Resolution Radiometer (AVHRR) EO SST passes, all within 1 h of the in situ data. By extracting data from the closest satellite pixel to the three sites, we observed a significant reduction in the performance of AVHRR at retrieving SST at the coastline, with root mean square differences at the kelp site over twice that observed at the two offshore buoys. Comparing the in situ water temperature data with pixels surrounding the kelp site revealed the performance of the satellite data improves when moving two to three pixels offshore and that this improvement was better when using an SST algorithm that treats each pixel independently in the retrieval process. At the three sites, we related differences between satellite and in situ SST data with a suite of atmospheric variables, collected from a nearby atmospheric observatory, and a high temporal resolution land surface temperature (LST) dataset. We found that differences between satellite and in situ SST at the coastline (kelp site) were well correlated with LST and solar zenith angle; implying contamination of the pixel by land is the principal cause of these larger differences at the coastline, as opposed to issues with atmospheric correction. This contamination could be either from land directly within the pixel, potentially impacted by errors in geo-location, or possibly through thermal adjacency effects. Our results demonstrate the value of using benthic temperature loggers for evaluating satellite SST data in coastal regions, and highlight issues with retrievals at the coastline that may inform future improvements in operational products. Full article
Show Figures

Graphical abstract

14 pages, 1036 KiB  
Article
Mapping Vegetation and Land Use Types in Fanjingshan National Nature Reserve Using Google Earth Engine
by Yu Hsin Tsai, Douglas Stow, Hsiang Ling Chen, Rebecca Lewison, Li An and Lei Shi
Remote Sens. 2018, 10(6), 927; https://doi.org/10.3390/rs10060927 - 12 Jun 2018
Cited by 145 | Viewed by 20554
Abstract
Fanjinshan National Nature Reserve (FNNR) is a biodiversity hotspot in China that is part of a larger, multi-use landscape where farming, grazing, tourism, and other human activities occur. The steep terrain and persistent cloud cover pose challenges to robust vegetation and land use [...] Read more.
Fanjinshan National Nature Reserve (FNNR) is a biodiversity hotspot in China that is part of a larger, multi-use landscape where farming, grazing, tourism, and other human activities occur. The steep terrain and persistent cloud cover pose challenges to robust vegetation and land use mapping. Our objective is to develop satellite image classification techniques that can reliably map forest cover and land use while minimizing the cloud and terrain issues, and provide the basis for long-term monitoring. Multi-seasonal Landsat image composites and elevation ancillary layers effectively minimize the persistent cloud cover and terrain issues. Spectral vegetation index (SVI) products and shade/illumination normalization approaches yield significantly higher mapping accuracies, compared to non-normalized spectral bands. Advanced machine learning image classification routines are implemented through the cloud-based Google Earth Engine platform. Optimal classifier parameters (e.g., number of trees and number of features for random forest classifiers) were achieved by using tuning techniques. Accuracy assessment results indicate consistent and effective overall classification (i.e., above 70% mapping accuracies) can be achieved using multi-temporal SVI composites with simple illumination normalization and elevation ancillary data, despite the fact limited training and reference data are available. This efficient and open-access image analysis workflow provides a reliable methodology to remotely monitor forest cover and land use in FNNR and other mountainous forested, cloud prevalent areas. Full article
(This article belongs to the Collection Google Earth Engine Applications)
Show Figures

Graphical abstract

16 pages, 2278 KiB  
Article
Real-Time Precise Point Positioning Using Tomographic Wet Refractivity Fields
by Wenkun Yu, Biyan Chen, Wujiao Dai and Xiaomin Luo
Remote Sens. 2018, 10(6), 928; https://doi.org/10.3390/rs10060928 - 12 Jun 2018
Cited by 14 | Viewed by 4058
Abstract
The tropospheric wet delay induced by water vapor is a major error source in precise point positioning (PPP), significantly influencing the convergence time to obtain high-accuracy positioning. Thus, high-quality water vapor information is necessary to support PPP processing. This study presents the use [...] Read more.
The tropospheric wet delay induced by water vapor is a major error source in precise point positioning (PPP), significantly influencing the convergence time to obtain high-accuracy positioning. Thus, high-quality water vapor information is necessary to support PPP processing. This study presents the use of tomographic wet refractivity (WR) fields in PPP to examine their impacts on the positioning performance. Tests are carried out based on 1-year of 2013 global navigation satellite system (GNSS) observations (30 s sampling rate) from three stations with different altitudes in the Hong Kong GNSS network. Coordinate errors with respect to reference values at a 0.1 m level of convergence is used for the north, east, and up components, whilst an error of 0.2 m is adopted for 3D position convergence. Experimental results demonstrate that, in both static and kinematic modes, the tomography-based PPP approach outperforms empirical tropospheric models in terms of positioning accuracy and convergence time. Compared with the results based on traditional, Saastamoinen, AN (Askne and Nordis), and VMF1 (Vienna Mapping Function 1) models, 23–48% improvements of positioning accuracy, and 5–30% reductions of convergence time are achieved with the application of tomographic WR fields. When using a tomography model, about 35% of the solutions converged within 20 min, whereas only 23%, 25%, 25%, and 30% solutions converged within 20 min for the traditional, Saastamoinen, AN, and VMF1 models, respectively. Our study demonstrates the benefit to real-time PPP processing brought by additional tomographic WR fields as they can significantly improve the PPP solution and reduce the convergence time for the up component. Full article
(This article belongs to the Special Issue Environmental Research with Global Navigation Satellite System (GNSS))
Show Figures

Graphical abstract

37 pages, 32727 KiB  
Article
Intercomparison and Validation of SAR-Based Ice Velocity Measurement Techniques within the Greenland Ice Sheet CCI Project
by John Peter Merryman Boncori, Morten Langer Andersen, Jørgen Dall, Anders Kusk, Martijn Kamstra, Signe Bech Andersen, Noa Bechor, Suzanne Bevan, Christian Bignami, Noel Gourmelen, Ian Joughin, Hyung-Sup Jung, Adrian Luckman, Jeremie Mouginot, Julia Neelmeijer, Eric Rignot, Kilian Scharrer, Thomas Nagler, Bernd Scheuchl and Tazio Strozzi
Remote Sens. 2018, 10(6), 929; https://doi.org/10.3390/rs10060929 - 12 Jun 2018
Cited by 19 | Viewed by 9046
Abstract
Ice velocity is one of the products associated with the Ice Sheets Essential Climate Variable. This paper describes the intercomparison and validation of ice-velocity measurements carried out by several international research groups within the European Space Agency Greenland Ice Sheet Climate Change Initiative [...] Read more.
Ice velocity is one of the products associated with the Ice Sheets Essential Climate Variable. This paper describes the intercomparison and validation of ice-velocity measurements carried out by several international research groups within the European Space Agency Greenland Ice Sheet Climate Change Initiative project, based on space-borne Synthetic Aperture Radar (SAR) data. The goal of this activity was to survey the best SAR-based measurement and error characterization approaches currently in practice. To this end, four experiments were carried out, related to different processing techniques and scenarios, namely differential SAR interferometry, multi aperture SAR interferometry and offset-tracking of incoherent as well as of partially-coherent data. For each task, participants were provided with common datasets covering areas located on the Greenland ice-sheet margin and asked to provide mean velocity maps, quality characterization and a description of processing algorithms and parameters. The results were then intercompared and validated against GPS data, revealing in several cases significant differences in terms of coverage and accuracy. The algorithmic steps and parameters influencing the coverage, accuracy and spatial resolution of the measurements are discussed in detail for each technique, as well as the consistency between quality parameters and validation results. This allows several recommendations to be formulated, in particular concerning procedures which can reduce the impact of analyst decisions, and which are often found to be the cause of sub-optimal algorithm performance. Full article
(This article belongs to the Special Issue Remote Sensing of Essential Climate Variables and Their Applications)
Show Figures

Graphical abstract

26 pages, 5196 KiB  
Article
Multi-Temporal and Spectral Analysis of High-Resolution Hyperspectral Airborne Imagery for Precision Agriculture: Assessment of Wheat Grain Yield and Grain Protein Content
by Francelino A. Rodrigues, Jr., Gerald Blasch, Pierre Defourny, J. Ivan Ortiz-Monasterio, Urs Schulthess, Pablo J. Zarco-Tejada, James A. Taylor and Bruno Gérard
Remote Sens. 2018, 10(6), 930; https://doi.org/10.3390/rs10060930 - 12 Jun 2018
Cited by 52 | Viewed by 9650
Abstract
This study evaluates the potential of high resolution hyperspectral airborne imagery to capture within-field variability of durum wheat grain yield (GY) and grain protein content (GPC) in two commercial fields in the Yaqui Valley (northwestern Mexico). Through a weekly/biweekly airborne flight campaign, we [...] Read more.
This study evaluates the potential of high resolution hyperspectral airborne imagery to capture within-field variability of durum wheat grain yield (GY) and grain protein content (GPC) in two commercial fields in the Yaqui Valley (northwestern Mexico). Through a weekly/biweekly airborne flight campaign, we acquired 10 mosaics with a micro-hyperspectral Vis-NIR imaging sensor ranging from 400–850 nanometres (nm). Just before harvest, 114 georeferenced grain samples were obtained manually. Using spectral exploratory analysis, we calculated narrow-band physiological spectral indices—normalized difference spectral index (NDSI) and ratio spectral index (RSI)—from every single hyperspectral mosaic using complete two by two combinations of wavelengths. We applied two methods for the multi-temporal hyperspectral exploratory analysis: (a) Temporal Principal Component Analysis (tPCA) on wavelengths across all images and (b) the integration of vegetation indices over time based on area under the curve (AUC) calculations. For GY, the best R2 (0.32) were found using both the spectral (NDSI—Ri, 750 to 840 nm and Rj, ±720–736 nm) and the multi-temporal AUC exploratory analysis (EVI and OSAVI through AUC) methods. For GPC, all exploratory analysis methods tested revealed (a) a low to very low coefficient of determination (R2 ≤ 0.21), (b) a relatively low overall prediction error (RMSE: 0.45–0.49%), compared to results from other literature studies, and (c) that the spectral exploratory analysis approach is slightly better than the multi-temporal approaches, with early season NDSI of 700 with 574 nm and late season NDSI of 707 with 523 nm as the best indicators. Using residual maps from the regression analyses of NDSIs and GPC, we visualized GPC within-field variability and showed that up to 75% of the field area could be mapped with relatively good predictability (residual class: −0.25 to 0.25%), therefore showing the potential of remote sensing imagery to capture the within-field variation of GPC under conventional agricultural practices. Full article
(This article belongs to the Section Remote Sensing in Agriculture and Vegetation)
Show Figures

Figure 1

26 pages, 24855 KiB  
Article
East Africa Rainfall Trends and Variability 1983–2015 Using Three Long-Term Satellite Products
by Elsa Cattani, Andrés Merino, José A. Guijarro and Vincenzo Levizzani
Remote Sens. 2018, 10(6), 931; https://doi.org/10.3390/rs10060931 - 13 Jun 2018
Cited by 90 | Viewed by 12145
Abstract
Daily time series from the Climate Prediction Center (CPC) Africa Rainfall Climatology version 2.0 (ARC2), Climate Hazards Group InfraRed Precipitation with Stations (CHIRPS) and Tropical Applications of Meteorology using SATellite (TAMSAT) African Rainfall Climatology And Time series version 2 (TARCAT) high-resolution long-term satellite [...] Read more.
Daily time series from the Climate Prediction Center (CPC) Africa Rainfall Climatology version 2.0 (ARC2), Climate Hazards Group InfraRed Precipitation with Stations (CHIRPS) and Tropical Applications of Meteorology using SATellite (TAMSAT) African Rainfall Climatology And Time series version 2 (TARCAT) high-resolution long-term satellite rainfall products are exploited to study the spatial and temporal variability of East Africa (EA, 5S–20N, 28–52E) rainfall between 1983 and 2015. Time series of selected rainfall indices from the joint CCl/CLIVAR/JCOMM Expert Team on Climate Change Detection and Indices are computed at yearly and seasonal scales. Rainfall climatology and spatial patterns of variability are extracted via the analysis of the total rainfall amount (PRCPTOT), the simple daily intensity (SDII), the number of precipitating days (R1), the number of consecutive dry and wet days (CDD and CWD), and the number of very heavy precipitating days (R20). Our results show that the spatial patterns of such trends depend on the selected rainfall product, as much as on the geographic areas characterized by statistically significant trends for a specific rainfall index. Nevertheless, indications of rainfall trends were extracted especially at the seasonal scale. Increasing trends were identified for the October–November–December PRCPTOT, R1, and SDII indices over eastern EA, with the exception of Kenya. In March–April–May, rainfall is decreasing over a large part of EA, as demonstrated by negative trends of PRCPTOT, R1, CWD, and R20, even if a complete convergence of all satellite products is not achieved. Full article
(This article belongs to the Special Issue Remote Sensing of Essential Climate Variables and Their Applications)
Show Figures

Figure 1

19 pages, 2317 KiB  
Article
Comparison of Phenology Estimated from Reflectance-Based Indices and Solar-Induced Chlorophyll Fluorescence (SIF) Observations in a Temperate Forest Using GPP-Based Phenology as the Standard
by Xiaoliang Lu, Zhunqiao Liu, Yuyu Zhou, Yaling Liu, Shuqing An and Jianwu Tang
Remote Sens. 2018, 10(6), 932; https://doi.org/10.3390/rs10060932 - 13 Jun 2018
Cited by 52 | Viewed by 8124
Abstract
We assessed the performance of reflectance-based vegetation indices and solar-induced chlorophyll fluorescence (SIF) datasets with various spatial and temporal resolutions in monitoring the Gross Primary Production (GPP)-based phenology in a temperate deciduous forest. The reflectance-based indices include the green chromatic coordinate (GCC), field [...] Read more.
We assessed the performance of reflectance-based vegetation indices and solar-induced chlorophyll fluorescence (SIF) datasets with various spatial and temporal resolutions in monitoring the Gross Primary Production (GPP)-based phenology in a temperate deciduous forest. The reflectance-based indices include the green chromatic coordinate (GCC), field measured and satellite remotely sensed Normalized Difference Vegetation Index (NDVI); and the SIF datasets include ground-based measurement and satellite-based products. We found that, if negative impacts due to coarse spatial and temporal resolutions are effectively reduced, all these data can serve as good indicators of phenological metrics for spring. However, the autumn phenological metrics derived from all reflectance-based datasets are later than the those derived from ground-based GPP estimates (flux sites). This is because the reflectance-based observations estimate phenology by tracking physiological properties including leaf area index (LAI) and leaf chlorophyll content (Chl), which does not reflect instantaneous changes in phenophase transitions, and thus the estimated fall phenological events may be later than GPP-based phenology. In contrast, we found that SIF has a good potential to track seasonal transition of photosynthetic activities in both spring and fall seasons. The advantage of SIF in estimating the GPP-based phenology lies in its inherent link to photosynthesis activities such that SIF can respond quickly to all factors regulating phenological events. Despite uncertainties in phenological metrics estimated from current spaceborne SIF observations due to their coarse spatial and temporal resolutions, dates in middle spring and autumn—the two most important metrics—can still be reasonably estimated from satellite SIF. Our study reveals that SIF provides a better way to monitor GPP-based phenological metrics. Full article
(This article belongs to the Special Issue Land Surface Phenology )
Show Figures

Graphical abstract

15 pages, 13769 KiB  
Article
Realistic Forest Stand Reconstruction from Terrestrial LiDAR for Radiative Transfer Modelling
by Kim Calders, Niall Origo, Andrew Burt, Mathias Disney, Joanne Nightingale, Pasi Raumonen, Markku Åkerblom, Yadvinder Malhi and Philip Lewis
Remote Sens. 2018, 10(6), 933; https://doi.org/10.3390/rs10060933 - 13 Jun 2018
Cited by 126 | Viewed by 15355
Abstract
Forest biophysical variables derived from remote sensing observations are vital for climate research. The combination of structurally and radiometrically accurate 3D “virtual” forests with radiative transfer (RT) models creates a powerful tool to facilitate the calibration and validation of remote sensing data and [...] Read more.
Forest biophysical variables derived from remote sensing observations are vital for climate research. The combination of structurally and radiometrically accurate 3D “virtual” forests with radiative transfer (RT) models creates a powerful tool to facilitate the calibration and validation of remote sensing data and derived biophysical products by helping us understand the assumptions made in data processing algorithms. We present a workflow that uses highly detailed 3D terrestrial laser scanning (TLS) data to generate virtual forests for RT model simulations. Our approach to forest stand reconstruction from a co-registered point cloud is unique as it models each tree individually. Our approach follows three steps: (1) tree segmentation; (2) tree structure modelling and (3) leaf addition. To demonstrate this approach, we present the measurement and construction of a one hectare model of the deciduous forest in Wytham Woods (Oxford, UK). The model contains 559 individual trees. We matched the TLS data with traditional census data to determine the species of each individual tree and allocate species-specific radiometric properties. Our modelling framework is generic, highly transferable and adjustable to data collected with other TLS instruments and different ecosystems. The Wytham Woods virtual forest is made publicly available through an online repository. Full article
(This article belongs to the Special Issue Radiative Transfer Modelling and Applications in Remote Sensing)
Show Figures

Graphical abstract

19 pages, 5258 KiB  
Article
Concentric Circle Pooling in Deep Convolutional Networks for Remote Sensing Scene Classification
by Kunlun Qi, Qingfeng Guan, Chao Yang, Feifei Peng, Shengyu Shen and Huayi Wu
Remote Sens. 2018, 10(6), 934; https://doi.org/10.3390/rs10060934 - 13 Jun 2018
Cited by 52 | Viewed by 5764
Abstract
Convolutional neural networks (CNNs) have been increasingly used in remote sensing scene classification/recognition. The conventional CNNs are sensitive to the rotation of the image scene, which will inevitably result in the misclassification of remote sensing scene images that belong to the same category. [...] Read more.
Convolutional neural networks (CNNs) have been increasingly used in remote sensing scene classification/recognition. The conventional CNNs are sensitive to the rotation of the image scene, which will inevitably result in the misclassification of remote sensing scene images that belong to the same category. In this work, we equip the networks with a new pooling strategy, “concentric circle pooling”, to alleviate the above problem. The new network structure, called CCP-net can generate a concentric circle-based spatial-rotation-invariant representation of an image, hence improving the classification accuracy. The square kernel is adopted to approximate the circle kernels in concentric circle pooling, which is much more efficient and suitable for CNNs to propagate gradients. We implement the training of the proposed network structure with standard back-propagation, thus CCP-net is an end-to-end trainable CNNs. With these advantages, CCP-net should in general improve CNN-based remote sensing scene classification methods. Experiments using two publicly available remote sensing scene datasets demonstrate that using CCP-net can achieve competitive classification results compared with the state-of-art methods. Full article
(This article belongs to the Section Remote Sensing Image Processing)
Show Figures

Graphical abstract

24 pages, 3018 KiB  
Article
Sampling Strategies to Improve Passive Optical Remote Sensing of River Bathymetry
by Carl J. Legleiter, Brandon T. Overstreet and Paul J. Kinzel
Remote Sens. 2018, 10(6), 935; https://doi.org/10.3390/rs10060935 - 13 Jun 2018
Cited by 24 | Viewed by 5710
Abstract
Passive optical remote sensing of river bathymetry involves establishing a relation between depth and reflectance that can be applied throughout an image to produce a depth map. Building upon the Optimal Band Ratio Analysis (OBRA) framework, we introduce sampling strategies for constructing calibration [...] Read more.
Passive optical remote sensing of river bathymetry involves establishing a relation between depth and reflectance that can be applied throughout an image to produce a depth map. Building upon the Optimal Band Ratio Analysis (OBRA) framework, we introduce sampling strategies for constructing calibration data sets that lead to strong relationships between an image-derived quantity and depth across a range of depths. Progressively excluding observations that exceed a series of cutoff depths from the calibration process improved the accuracy of depth estimates and allowed the maximum detectable depth (dmax) to be inferred directly from an image. Depth retrieval in two distinct rivers also was enhanced by a stratified version of OBRA that partitions field measurements into a series of depth bins to avoid biases associated with under-representation of shallow areas in typical field data sets. In the shallower, clearer of the two rivers, including the deepest field observations in the calibration data set did not compromise depth retrieval accuracy, suggesting that dmax was not exceeded and the reach could be mapped without gaps. Conversely, in the deeper and more turbid stream, progressive truncation of input depths yielded a plausible estimate of dmax consistent with theoretical calculations based on field measurements of light attenuation by the water column. This result implied that the entire channel, including pools, could not be mapped remotely. However, truncation improved the accuracy of depth estimates in areas shallower than dmax, which comprise the majority of the channel and are of primary interest for many habitat-oriented applications. Full article
(This article belongs to the Section Remote Sensing in Geology, Geomorphology and Hydrology)
Show Figures

Graphical abstract

29 pages, 14399 KiB  
Article
Suitability Assessment of X-Band Satellite SAR Data for Geotechnical Monitoring of Site Scale Slow Moving Landslides
by Guadalupe Bru, Joaquin Escayo, José Fernández, Jordi J. Mallorqui, Rubén Iglesias, Eugenio Sansosti, Tamara Abajo and Antonio Morales
Remote Sens. 2018, 10(6), 936; https://doi.org/10.3390/rs10060936 - 13 Jun 2018
Cited by 15 | Viewed by 6703
Abstract
This work addresses the suitability of using X-band Synthetic Aperture Radar (SAR) data for operational geotechnical monitoring of site scale slow moving landslides, affecting urban areas and infrastructures. The scale of these studies requires high resolution data. We propose a procedure for the [...] Read more.
This work addresses the suitability of using X-band Synthetic Aperture Radar (SAR) data for operational geotechnical monitoring of site scale slow moving landslides, affecting urban areas and infrastructures. The scale of these studies requires high resolution data. We propose a procedure for the practical use of SAR data in geotechnical landslides campaigns, that includes an appropriate dataset selection taking into account the scenario characteristics, a visibility analysis, and considerations when comparing advanced differential SAR interferometry (A-DInSAR) results with other monitoring techniques. We have determined that Sentinel-2 satellite optical images are suited for performing high resolution land cover classifications, which results in the achievement of qualitative visibility maps. We also concluded that A-DInSAR is a very powerful and versatile tool for detailed scale landslide monitoring, although in combination with other instrumentation techniques. Full article
(This article belongs to the Special Issue Landslide Hazard and Risk Assessment)
Show Figures

Graphical abstract

16 pages, 1263 KiB  
Article
Retrieval of Aerosol Components Using Multi-Wavelength Mie-Raman Lidar and Comparison with Ground Aerosol Sampling
by Yukari Hara, Tomoaki Nishizawa, Nobuo Sugimoto, Kazuo Osada, Keiya Yumimoto, Itsushi Uno, Rei Kudo and Hiroshi Ishimoto
Remote Sens. 2018, 10(6), 937; https://doi.org/10.3390/rs10060937 - 13 Jun 2018
Cited by 29 | Viewed by 5602
Abstract
We verified an algorithm using multi-wavelength Mie-Raman lidar (MMRL) observations to retrieve four aerosol components (black carbon (BC), sea salt (SS), air pollution (AP), and mineral dust (DS)) with in-situ aerosol measurements, and determined the seasonal variation of aerosol components in Fukuoka, in [...] Read more.
We verified an algorithm using multi-wavelength Mie-Raman lidar (MMRL) observations to retrieve four aerosol components (black carbon (BC), sea salt (SS), air pollution (AP), and mineral dust (DS)) with in-situ aerosol measurements, and determined the seasonal variation of aerosol components in Fukuoka, in the western region of Japan. PM2.5, PM10, and mass concentrations of BC and SS components are derived from in-situ measurements. MMRL provides the aerosol extinction coefficient (α), particle linear depolarization ratio (δ), backscatter coefficient (β), and lidar ratio (S) at 355 and 532 nm, and the attenuated backscatter coefficient (βatt) at 1064 nm. We retrieved vertical distributions of extinction coefficients at 532 nm for four aerosol components (BC, SS, AP, and DS) using 1α532 + 1β532 + 1βatt,1064 + 1δ532 data of MMRL. The retrieved extinction coefficients of the four aerosol components at 532 nm were converted to mass concentrations using the theoretical computed conversion factor assuming the prescribed size distribution, particle shape, and refractive index for each aerosol component. MMRL and in-situ measurements confirmed that seasonal variation of aerosol optical properties was affected by internal/external mixing of various aerosol components, in addition to hygroscopic growth of water-soluble aerosols. MMRL overestimates BC mass concentration compared to in-situ observation using the pure BC model. This overestimation was reduced drastically by introducing the internal mixture model of BC and water-soluble substances (Core-Gray Shell (CGS) model). This result suggests that considering the internal mixture of BC and water-soluble substances is essential for evaluating BC mass concentration in this area. Systematic overestimation of BC mass concentration was found during summer, even when we applied the CGS model. The observational facts based on in-situ and MMRL measurements suggested that misclassification of AP as CGS particles was due to underestimation of relative humidity (RH) by the numerical model in lidar analysis, as well as mismatching of the optical models of AP and CGS assumed in the retrieval with aerosol properties in the actual atmosphere. The time variation of lidar-derived SS was generally consistent with in-situ measurement; however, we found some overestimation of SS during dust events. The cause of this SS overestimation is mainly due to misclassifying internally mixing DS as SS, implying that to consider internal mixing between DS and water-soluble substances leads to better estimation. The time-variations of PM2.5 and PM10 generally showed good agreement with in-situ measurement although lidar-derived PM2.5 and PM10 overestimated in dust events. Full article
(This article belongs to the Special Issue Optical and Laser Remote Sensing of the Atmosphere)
Show Figures

Graphical abstract

12 pages, 5460 KiB  
Article
Spatio-Temporal Variability of the Habitat Suitability Index for Chub Mackerel (Scomber Japonicus) in the East/Japan Sea and the South Sea of South Korea
by Dabin Lee, SeungHyun Son, Wonkook Kim, Joo Myun Park, Huitae Joo and Sang Heon Lee
Remote Sens. 2018, 10(6), 938; https://doi.org/10.3390/rs10060938 - 13 Jun 2018
Cited by 52 | Viewed by 6788
Abstract
The climate-induced decrease in fish catches in South Korea has been a big concern over the last decades. The increase in sea surface temperature (SST) due to climate change has led to not only a decline in fishery landings but also a shift [...] Read more.
The climate-induced decrease in fish catches in South Korea has been a big concern over the last decades. The increase in sea surface temperature (SST) due to climate change has led to not only a decline in fishery landings but also a shift in the fishing grounds of several fish species. The habitat suitability index (HSI), a reliable indicator of the capacity of a habitant to support selected species, has been widely used to detect and forecast fishing ground formation. In this study, the catch data of the chub mackerel and satellite-derived environmental factors were used to calculate the HSI for the chub mackerel in the South Sea, South Korea. More than 80% of the total catch was found in areas with an SST of 14.72–25.72 °C, chlorophyll-a of 0.30–0.92 mg m−3, and primary production of 523.7–806.46 mg C m−2 d−1. Based on these results, the estimated climatological monthly HSI from 2002 to 2016 clearly showed that the wintering ground of the chub mackerel generally formed in the South Sea of South Korea, coinciding with the catch distribution during the same period. This outcome implies that our estimated HSI can yield a reliable prediction of the fishing ground for the chub mackerel in the East/Japan Sea and South Sea of South Korea. Full article
(This article belongs to the Special Issue Remote Sensing of Ocean Colour)
Show Figures

Graphical abstract

24 pages, 8157 KiB  
Article
Satellite-Based Rainfall Retrieval: From Generalized Linear Models to Artificial Neural Networks
by Lea Beusch, Loris Foresti, Marco Gabella and Ulrich Hamann
Remote Sens. 2018, 10(6), 939; https://doi.org/10.3390/rs10060939 - 13 Jun 2018
Cited by 32 | Viewed by 6954
Abstract
In this study, we develop and compare satellite rainfall retrievals based on generalized linear models and artificial neural networks. Both approaches are used in classification mode in a first step to identify the precipitating areas (precipitation detection) and in regression mode in a [...] Read more.
In this study, we develop and compare satellite rainfall retrievals based on generalized linear models and artificial neural networks. Both approaches are used in classification mode in a first step to identify the precipitating areas (precipitation detection) and in regression mode in a second step to estimate the rainfall intensity at the ground (rain rate). The input predictors are geostationary satellite infrared (IR) brightness temperatures and Satellite Application Facility (SAF) nowcasting products which consist of cloud properties, such as cloud top height and cloud type. Additionally, a set of auxiliary location-describing input variables is employed. The output predictand is the ground-based instantaneous rain rate provided by the European-scale radar composite OPERA, that was additionally quality-controlled. We compare our results to a precipitation product which uses a single infrared (IR) channel for the rainfall retrieval. Specifically, we choose the operational PR-OBS-3 hydrology SAF product as a representative example for this type of approach. With generalized linear models, we show that we are able to substantially improve in terms of hits by considering more IR channels and cloud property predictors. Furthermore, we demonstrate the added value of using artificial neural networks to further improve prediction skill by additionally reducing false alarms. In the rain rate estimation, the indirect relationship between surface rain rates and the cloud properties measurable with geostationary satellites limit the skill of all models, which leads to smooth predictions close to the mean rainfall intensity. Probability matching is explored as a tool to recover higher order statistics to obtain a more realistic rain rate distribution. Full article
(This article belongs to the Section Atmospheric Remote Sensing)
Show Figures

Graphical abstract

15 pages, 3573 KiB  
Article
Estimation of Burned Area in the Northeastern Siberian Boreal Forest from a Long-Term Data Record (LTDR) 1982–2015 Time Series
by José R. García-Lázaro, José A. Moreno-Ruiz, David Riaño and Manuel Arbelo
Remote Sens. 2018, 10(6), 940; https://doi.org/10.3390/rs10060940 - 14 Jun 2018
Cited by 36 | Viewed by 5144
Abstract
A Bayesian classifier mapped the Burned Area (BA) in the Northeastern Siberian boreal forest (70°N 120°E–60°N 170°E) from 1982 to 2015. The algorithm selected the 0.05° (~5 km) Long-Term Data Record (LTDR) version 3 and 4 data sets to generate 10-day BA composites. [...] Read more.
A Bayesian classifier mapped the Burned Area (BA) in the Northeastern Siberian boreal forest (70°N 120°E–60°N 170°E) from 1982 to 2015. The algorithm selected the 0.05° (~5 km) Long-Term Data Record (LTDR) version 3 and 4 data sets to generate 10-day BA composites. Landsat-TM scenes of the entire study site in 2002, 2010, and 2011 assessed the spatial accuracy of this LTDR-BA product, in comparison to Moderate-Resolution Imaging Spectroradiometer (MODIS) MCD45A1 and MCD64A1 BA products. The LTDR-BA algorithm proves a reliable source to quantify BA in this part of Siberia, where comprehensive BA remote sensing products since the 1980s are lacking. Once grouped by year and decade, this study explored the trends in fire activity. The LTDR-BA estimates contained a high interannual variability with a maximum of 2.42 million ha in 2002, an average of 0.78 million ha/year, and a standard deviation of 0.61 million ha. Going from 6.36 in the 1980s to 10.21 million ha BA in the 2010s, there was a positive linear BA trend of approximately 1.28 million ha/decade during these last four decades in the Northeastern Siberian boreal forest. Full article
(This article belongs to the Special Issue Optical Remote Sensing of Boreal Forests)
Show Figures

Graphical abstract

22 pages, 8048 KiB  
Article
Mapping and Characterizing Thermal Dilation of Civil Infrastructures with Multi-Temporal X-Band Synthetic Aperture Radar Interferometry
by Xiaoqiong Qin, Lu Zhang, Xiaoli Ding, Mingsheng Liao and Mengshi Yang
Remote Sens. 2018, 10(6), 941; https://doi.org/10.3390/rs10060941 - 14 Jun 2018
Cited by 16 | Viewed by 4712
Abstract
Temperature variation plays a significant role in the long-term structural behaviour of civil infrastructures, but very few quantitative studies have measured and analysed the infrastructures’ global thermal dilation because of their large sizes and geometric complexities. The modern Differential Synthetic Aperture Radar Interferometry [...] Read more.
Temperature variation plays a significant role in the long-term structural behaviour of civil infrastructures, but very few quantitative studies have measured and analysed the infrastructures’ global thermal dilation because of their large sizes and geometric complexities. The modern Differential Synthetic Aperture Radar Interferometry (DInSAR) technique has great potential in applications of their thermal dilation mapping and characterization due to the techniques’ unique capabilities for use in large areas, with high-resolution, and at low-costs for deformation measurements. However, the practical application of DInSAR in thermal dilation estimation is limited by difficulty in the precise separation from the residual topographic phase and the trend deformation phase. Moreover, due to a lack of thermal dilation characteristics analyses in previous studies, the thermal dilation mechanisms are still unclear to users, which restricts the accurate understanding of the thermal dilation evolution process. Given the above challenges, an advanced multi-temporal DInSAR approach is proposed in this study, and the effectiveness of this approach was presented using three cases studies concerning different infrastructure types. In this method, the coherent, incoherent, and semantic information of structures were combined in order to refine the detection of point-like targets (PTs). Interferometric subsets with small temporal baselines and temperature differences were used for high-resolution topography estimation. A pre-analysis was adopted to determine the transmission direction, spatial pattern, and temporal variation of the thermal dilation. Then, both the traditional least squares estimation and our robust coherence-weighted least squares regression analysis were performed between the time series displacements and the corresponding temperatures to quantitatively estimate the thermal dilation model. The results were verified in terms of the estimated linear thermal dilation coefficient, which indicates the greater reliability of our method. Furthermore, the thermal dilation characteristics of different civil infrastructure types were analysed, which facilitates a greater understanding of the thermal dilation evolution process of civil infrastructures. Full article
(This article belongs to the Special Issue Imaging Geodesy and Infrastructure Monitoring)
Show Figures

Graphical abstract

26 pages, 8789 KiB  
Article
Potential of Different Optical and SAR Data in Forest and Land Cover Classification to Support REDD+ MRV
by Laura Sirro, Tuomas Häme, Yrjö Rauste, Jorma Kilpi, Jarno Hämäläinen, Katja Gunia, Bernardus De Jong and Fernando Paz Pellat
Remote Sens. 2018, 10(6), 942; https://doi.org/10.3390/rs10060942 - 14 Jun 2018
Cited by 22 | Viewed by 6093
Abstract
The applicability of optical and synthetic aperture radar (SAR) data for land cover classification to support REDD+ (Reducing Emissions from Deforestation and Forest Degradation) MRV (measuring, reporting and verification) services was tested on a tropical to sub-tropical test site. The 100 km by [...] Read more.
The applicability of optical and synthetic aperture radar (SAR) data for land cover classification to support REDD+ (Reducing Emissions from Deforestation and Forest Degradation) MRV (measuring, reporting and verification) services was tested on a tropical to sub-tropical test site. The 100 km by 100 km test site was situated in the State of Chiapas in Mexico. Land cover classifications were computed using RapidEye and Landsat TM optical satellite images and ALOS PALSAR L-band and Envisat ASAR C-band images. Identical sample plot data from Kompsat-2 imagery of one-metre spatial resolution were used for the accuracy assessment. The overall accuracy for forest and non-forest classification varied between 95% for the RapidEye classification and 74% for the Envisat ASAR classification. For more detailed land cover classification, the accuracies varied between 89% and 70%, respectively. A combination of Landsat TM and ALOS PALSAR data sets provided only 1% improvement in the overall accuracy. The biases were small in most classifications, varying from practically zero for the Landsat TM based classification to a 7% overestimation of forest area in the Envisat ASAR classification. Considering the pros and cons of the data types, we recommend optical data of 10 m spatial resolution as the primary data source for REDD MRV purposes. The results with L-band SAR data were nearly as accurate as the optical data but considering the present maturity of the imaging systems and image analysis methods, the L-band SAR is recommended as a secondary data source. The C-band SAR clearly has poorer potential than the L-band but it is applicable in stratification for a statistical sampling when other image types are unavailable. Full article
Show Figures

Graphical abstract

20 pages, 12215 KiB  
Article
InSAR-Constrained Interseismic Deformation and Potential Seismogenic Asperities on the Altyn Tagh Fault at 91.5–95°E, Northern Tibetan Plateau
by Chuanjin Liu, Lingyun Ji, Liangyu Zhu and Chaoying Zhao
Remote Sens. 2018, 10(6), 943; https://doi.org/10.3390/rs10060943 - 14 Jun 2018
Cited by 32 | Viewed by 5662
Abstract
The present-day kinematic features of the different segments of the Altyn Tagh Fault (ATF) have been well-studied using geodetic data. However, on the eastern segment of the ATF at 91.5–95°E, high spatial resolution deformation has not been previously reported. Here, we processed 185 [...] Read more.
The present-day kinematic features of the different segments of the Altyn Tagh Fault (ATF) have been well-studied using geodetic data. However, on the eastern segment of the ATF at 91.5–95°E, high spatial resolution deformation has not been previously reported. Here, we processed 185 interferometric synthetic aperture radar (InSAR) images from three descending tracks of the C band ERS-1/2 and Envisat satellites spanning 1995–2011 and obtained the average deformation velocity field. Results show a left-lateral motion of ~4 mm/year along the fault-parallel direction across the ATF at 91.5–95°E, which is consistent with Global Positioning System (GPS) observations. The slip deficit rate distribution at shallow depths was resolved through the InSAR deformation velocity using a discretized fault plane. The slip deficit is capable of an Mw 7.9 earthquake, considering the elapsed time of the latest M 7.0 event. Two potential asperities that could be nucleation sites or rupture areas of future earthquakes were delineated based on the coupling coefficient and seismicity distributions along the fault plane. The larger asperity extends more than 100 km along the ATF at depths of 8–12 km. Our InSAR observations support the undeformed blocks model of the Indo-Eurasian collisional mechanism at the northern margin of the Tibetan plateau. Full article
(This article belongs to the Special Issue Remote Sensing of Tectonic Deformation)
Show Figures

Graphical abstract

18 pages, 6642 KiB  
Article
Multiscale Comparative Evaluation of the GPM IMERG v5 and TRMM 3B42 v7 Precipitation Products from 2015 to 2017 over a Climate Transition Area of China
by Cheng Chen, Qiuwen Chen, Zheng Duan, Jianyun Zhang, Kangle Mo, Zhe Li and Guoqiang Tang
Remote Sens. 2018, 10(6), 944; https://doi.org/10.3390/rs10060944 - 14 Jun 2018
Cited by 102 | Viewed by 6871
Abstract
The performance of the latest released Integrated Multi-satellitE Retrievals for GPM mission (IMERG) version 5 (IMERG v5) and the TRMM Multisatellite Precipitation Analysis 3B42 version 7 (3B42 v7) are evaluated and compared at multiple temporal scales over a semi-humid to humid climate transition [...] Read more.
The performance of the latest released Integrated Multi-satellitE Retrievals for GPM mission (IMERG) version 5 (IMERG v5) and the TRMM Multisatellite Precipitation Analysis 3B42 version 7 (3B42 v7) are evaluated and compared at multiple temporal scales over a semi-humid to humid climate transition area (Huaihe River basin) from 2015 to 2017. The impacts of rainfall rate, latitude and elevation on precipitation detection skills are also investigated. Results indicate that both satellite estimates showed a high Pearson correlation coefficient (r, above 0.89) with gauge observations, and an overestimation of precipitation at monthly and annual scales. Mean daily precipitation of IMERG v5 and 3B42 v7 display a consistent spatial pattern, and both characterize the observed precipitation distribution well, but 3B42 v7 tends to markedly overestimate precipitation over water bodies. Both satellite precipitation products overestimate rainfalls with intensity ranging from 0.5 to 25 mm/day, but tend to underestimate light (0–0.5 mm/day) and heavy (>25 mm/day) rainfalls, especially for torrential rains (above 100 mm/day). Regarding each gauge station, the IMERG v5 has larger mean r (0.36 for GPM, 0.33 for TRMM) and lower mean relative root mean square error (RRMSE, 1.73 for GPM, 1.88 for TRMM) than those of 3B42 v7. The higher probability of detection (POD), critical success index (CSI) and lower false alarm ratio (FAR) of IMERG v5 than those of 3B42 v7 at different rainfall rates indicates that IMERG v5 in general performs better in detecting the observed precipitations. This study provides a better understanding of the spatiotemporal distribution of accuracy of IMERG v5 and 3B42 v7 precipitation and the influencing factors, which is of great significance to hydrological applications. Full article
(This article belongs to the Special Issue Remote Sensing of Precipitation)
Show Figures

Graphical abstract

24 pages, 10723 KiB  
Article
Multi-Scale Residual Convolutional Neural Network for Haze Removal of Remote Sensing Images
by Hou Jiang and Ning Lu
Remote Sens. 2018, 10(6), 945; https://doi.org/10.3390/rs10060945 - 14 Jun 2018
Cited by 74 | Viewed by 6317
Abstract
Haze removal is a pre-processing step that operates on at-sensor radiance data prior to the physically based image correction step to enhance hazy imagery visually. Most current haze removal methods focus on point-to-point operations and utilize information in the spectral domain, without taking [...] Read more.
Haze removal is a pre-processing step that operates on at-sensor radiance data prior to the physically based image correction step to enhance hazy imagery visually. Most current haze removal methods focus on point-to-point operations and utilize information in the spectral domain, without taking consideration of the multi-scale spatial information of haze. In this paper, we propose a multi-scale residual convolutional neural network (MRCNN) for haze removal of remote sensing images. MRCNN utilizes 3D convolutional kernels to extract spatial–spectral correlation information and abstract features from surrounding neighborhoods for haze transmission estimation. It takes advantage of dilated convolution to aggregate multi-scale contextual information for the purpose of improving its prediction accuracy. Meanwhile, residual learning is utilized to avoid the loss of weak information while deepening the network. Our experiments indicate that MRCNN performs accurately, achieving an extremely low validation error and testing error. The haze removal results of several scenes of Landsat 8 Operational Land Imager (OLI) data show that the visibility of the dehazed images is significantly improved, and the color of recovered surface is consistent with the actual scene. Quantitative analysis proves that the dehazed results of MRCNN are superior to the traditional methods and other networks. Additionally, a comparison to haze-free data illustrates the spectral consistency after haze removal and reveals the changes in the vegetation index. Full article
(This article belongs to the Section Remote Sensing Image Processing)
Show Figures

Graphical abstract

25 pages, 4360 KiB  
Article
Forest Type Identification with Random Forest Using Sentinel-1A, Sentinel-2A, Multi-Temporal Landsat-8 and DEM Data
by Yanan Liu, Weishu Gong, Xiangyun Hu and Jianya Gong
Remote Sens. 2018, 10(6), 946; https://doi.org/10.3390/rs10060946 - 14 Jun 2018
Cited by 128 | Viewed by 15993
Abstract
Carbon sink estimation and ecological assessment of forests require accurate forest type mapping. The traditional survey method is time consuming and labor intensive, and the remote sensing method with high-resolution, multi-spectral commercial satellite images has high cost and low availability. In this study, [...] Read more.
Carbon sink estimation and ecological assessment of forests require accurate forest type mapping. The traditional survey method is time consuming and labor intensive, and the remote sensing method with high-resolution, multi-spectral commercial satellite images has high cost and low availability. In this study, we explore and evaluate the potential of freely-available multi-source imagery to identify forest types with an object-based random forest algorithm. These datasets included Sentinel-2A (S2), Sentinel-1A (S1) in dual polarization, one-arc-second Shuttle Radar Topographic Mission Digital Elevation (DEM) and multi-temporal Landsat-8 images (L8). We tested seven different sets of explanatory variables for classifying eight forest types in Wuhan, China. The results indicate that single-sensor (S2) or single-day data (L8) cannot obtain satisfactory results; the overall accuracy was 54.31% and 50.00%, respectively. Compared with the classification using only Sentinel-2 data, the overall accuracy increased by approximately 15.23% and 22.51%, respectively, by adding DEM and multi-temporal Landsat-8 imagery. The highest accuracy (82.78%) was achieved with fused imagery, the terrain and multi-temporal data contributing the most to forest type identification. These encouraging results demonstrate that freely-accessible multi-source remotely-sensed data have tremendous potential in forest type identification, which can effectively support monitoring and management of forest ecological resources at regional or global scales. Full article
(This article belongs to the Section Forest Remote Sensing)
Show Figures

Graphical abstract

30 pages, 4670 KiB  
Article
Estimation of AOD Under Uncertainty: An Approach for Hyperspectral Airborne Data
by Nitin Bhatia, Valentyn A. Tolpekin, Alfred Stein and Ils Reusen
Remote Sens. 2018, 10(6), 947; https://doi.org/10.3390/rs10060947 - 14 Jun 2018
Cited by 16 | Viewed by 5232
Abstract
A key parameter for atmospheric correction (AC) is Aerosol Optical Depth (AOD), which is often estimated from sensor radiance (Lrs,t(λ)). Noise, the dependency on surface type, viewing and illumination geometry cause uncertainty in AOD inference. [...] Read more.
A key parameter for atmospheric correction (AC) is Aerosol Optical Depth (AOD), which is often estimated from sensor radiance (Lrs,t(λ)). Noise, the dependency on surface type, viewing and illumination geometry cause uncertainty in AOD inference. We propose a method that determines pre-estimates of surface reflectance (ρt,pre) where effects associated with Lrs,t(λ) are less influential. The method identifies pixels comprising pure materials from ρt,pre. AOD values at the pure pixels are iteratively estimated using l2-norm optimization. Using the adjacency range function, the AOD is estimated at each pixel. We applied the method on Hyperspectral Mapper and Airborne Prism Experiment instruments for experiments on synthetic data and on real data. To simulate real imaging conditions, noise was added to the data. The estimation error of the AOD is minimized to 0.06–0.08 with a signal-to-reconstruction-error equal to 35 dB. We compared the proposed method with a dense dark vegetation (DDV)-based state-of-the-art method. This reference method, resulted in a larger variability in AOD estimates resulting in low signal-to-reconstruction-error between 5–10 dB. For per-pixel estimation of AOD, the performance of the reference method further degraded. We conclude that the proposed method is more precise than the DDV methods and can be extended to other AC parameters. Full article
(This article belongs to the Special Issue Uncertainty in Remote Sensing Image Analysis)
Show Figures

Graphical abstract

22 pages, 4469 KiB  
Article
A Ship Detector Applying Principal Component Analysis to the Polarimetric Notch Filter
by Tao Zhang, Armando Marino, Huilin Xiong and Wenxian Yu
Remote Sens. 2018, 10(6), 948; https://doi.org/10.3390/rs10060948 - 14 Jun 2018
Cited by 15 | Viewed by 4580
Abstract
Ship detection using polarimetric synthetic aperture radar (PolSAR) data has attracted a lot of attention in recent years. Polarimetry can provide information regarding the scattering mechanisms of targets, which helps discriminate between ships and sea clutter. This enhancement is particularly valuable when we [...] Read more.
Ship detection using polarimetric synthetic aperture radar (PolSAR) data has attracted a lot of attention in recent years. Polarimetry can provide information regarding the scattering mechanisms of targets, which helps discriminate between ships and sea clutter. This enhancement is particularly valuable when we aim at detecting smaller vessels in rough sea states. This work exploits a ship detector called the Geometrical Perturbation-Polarimetric Notch Filter (GP-PNF), and it is aimed at improving its performance especially when less polarimetric images are available (e.g., dual-polarimetric data). The idea is to design a new polarimetric feature vector containing more features that are renowned to allow separation between ships and sea clutter. Then, a Principal Component Analysis (PCA) is further used to reduce the dimensionality of the new feature space. Experiments on four real Sentinel-1 datasets are carried out to demonstrate the validity of the proposed method and compare it against other ship detectors. Analyses of the experimental results show that the proposed algorithm can not only reduce the false alarms significantly, but also enhance the target-to-clutter ratio (TCR) so that it can more effectively detect weaker ships. Full article
(This article belongs to the Special Issue Remote Sensing of Target Detection in Marine Environment)
Show Figures

Graphical abstract

17 pages, 4762 KiB  
Article
Assessing Single-Polarization and Dual-Polarization TerraSAR-X Data for Surface Water Monitoring
by Katherine Irwin, Alexander Braun, Georgia Fotopoulos, Achim Roth and Birgit Wessel
Remote Sens. 2018, 10(6), 949; https://doi.org/10.3390/rs10060949 - 14 Jun 2018
Cited by 23 | Viewed by 6501
Abstract
Three synthetic aperture radar (SAR) data classification methodologies were used to assess the ability of single-polarization and dual-polarization TerraSAR-X (TSX) data to classify surface water, including open water, ice, and flooded vegetation. Multi-polarization SAR observations contain more information than single-polarization SAR, but the [...] Read more.
Three synthetic aperture radar (SAR) data classification methodologies were used to assess the ability of single-polarization and dual-polarization TerraSAR-X (TSX) data to classify surface water, including open water, ice, and flooded vegetation. Multi-polarization SAR observations contain more information than single-polarization SAR, but the availability of multi-polarization data is much lower, which limits the temporal monitoring capabilities. The study area is a principally natural landscape centered on a seasonally flooding river, in which four TSX dual-co-polarized images were acquired between the months of April and June 2016. Previous studies have shown that single-polarization SAR is useful for analyzing surface water extent and change using grey-level thresholding. The H-Alpha–Wishart decomposition, adapted to dual-polarization data, and the Kennaugh Element Framework were used to classify areas of water and flooded vegetation. Although grey-level thresholding was able to identify areas of water and non-water, the percentage of seasonal change was limited, indicating an increase in water area from 8% to 10%, which is in disagreement with seasonal trends. The dual-polarization methods show a decrease in water over the season and indicate a decrease in flooded vegetation, which agrees with expected seasonal variations. When comparing the two dual-polarization methods, a clear benefit of the Kennaugh Elements Framework is the ability to classify change in the transition zones of ice to open water, open water to marsh, and flooded vegetation to land, using the differential Kennaugh technique. The H-Alpha–Wishart classifier was not able to classify ice, and misclassified fields and ice as water. Although single-polarization SAR was effective in classifying open water, the findings of this study confirm the advantages of dual-polarization observations, with the Kennaugh Element Framework being the best performing classification framework. Full article
(This article belongs to the Special Issue Ten Years of TerraSAR-X—Scientific Results)
Show Figures

Graphical abstract

19 pages, 4301 KiB  
Article
Quantitative Estimation of Wheat Phenotyping Traits Using Ground and Aerial Imagery
by Zohaib Khan, Joshua Chopin, Jinhai Cai, Vahid-Rahimi Eichi, Stephan Haefele and Stanley J. Miklavcic
Remote Sens. 2018, 10(6), 950; https://doi.org/10.3390/rs10060950 - 14 Jun 2018
Cited by 40 | Viewed by 7476
Abstract
This study evaluates an aerial and ground imaging platform for assessment of canopy development in a wheat field. The dependence of two canopy traits, height and vigour, on fertilizer treatment was observed in a field trial comprised of ten varieties of spring wheat. [...] Read more.
This study evaluates an aerial and ground imaging platform for assessment of canopy development in a wheat field. The dependence of two canopy traits, height and vigour, on fertilizer treatment was observed in a field trial comprised of ten varieties of spring wheat. A custom-built mobile ground platform (MGP) and an unmanned aerial vehicle (UAV) were deployed at the experimental site for standard red, green and blue (RGB) image collection on five occasions. Meanwhile, reference field measurements of canopy height and vigour were manually recorded during the growing season. Canopy level estimates of height and vigour for each variety and treatment were computed by image analysis. The agreement between estimates from each platform and reference measurements was statistically analysed. Estimates of canopy height derived from MGP imagery were more accurate (RMSE = 3.95 cm, R2 = 0.94) than estimates derived from UAV imagery (RMSE = 6.64 cm, R2 = 0.85). In contrast, vigour was better estimated using the UAV imagery (RMSE = 0.057, R2 = 0.57), compared to MGP imagery (RMSE = 0.063, R2 = 0.42), albeit with a significant fixed and proportional bias. The ability of the platforms to capture differential development of traits as a function of fertilizer treatment was also investigated. Both imaging methodologies observed a higher median canopy height of treated plots compared with untreated plots throughout the season, and a greater median vigour of treated plots compared with untreated plots exhibited in the early growth stages. While the UAV imaging provides a high-throughput method for canopy-level trait determination, the MGP imaging captures subtle canopy structures, potentially useful for fine-grained analyses of plants. Full article
Show Figures

Graphical abstract

17 pages, 5595 KiB  
Article
Investigation and Analysis of All-Day Atmospheric Water Vapor Content over Xi’an Using Raman Lidar and Sunphotometer Measurements
by Yufeng Wang, Liu Tang, Tianle Gao, Qing Wang, Chuan Lu, Yuehui Song and Dengxin Hua
Remote Sens. 2018, 10(6), 951; https://doi.org/10.3390/rs10060951 - 14 Jun 2018
Cited by 2 | Viewed by 5145
Abstract
All-day atmospheric water vapor content measurements determined by Raman lidar and a sunphotometer were combined to investigate the all-day variation characteristics in the water vapor distribution in Xi’an, China (34.233°N, 108.911°E). To enhance the daytime lidar performance, the wavelet threshold de-noising method is [...] Read more.
All-day atmospheric water vapor content measurements determined by Raman lidar and a sunphotometer were combined to investigate the all-day variation characteristics in the water vapor distribution in Xi’an, China (34.233°N, 108.911°E). To enhance the daytime lidar performance, the wavelet threshold de-noising method is used to filter out the strong solar background light, and effective denoised results are demonstrated with the following optimization: wavelet sym6, the improved threshold function, and the improved threshold selection. The denoised system signal-to-noise ratio (SNR) for the water vapor daytime measurement is validated, with an enhancement of ~3.4 times up to a height of 3 km compared to that of the original signal. The time series of the atmospheric water vapor mixing ratio profiles and the obtained precipitable water vapor (PWV) measured by Raman lidar are used to reveal the temporal and spatial variations in water vapor, and the comparisons with the total column water vapor content (TCWV) measured by a sunphotometer validate the daytime variation trend of the water vapor. All-day continuous observations clearly present a consistent variation trend in the water vapor between the sunphotometer and Raman lidar measurements. The correlation analysis between TCWV and PWV at the layers below 850 hPa and below 700 hPa yields a good positive correlation coefficient (>0.75), indicating that PWV determination in the bottom layer by Raman lidar can directly reflect the variations in the total water vapor content. Moreover, different diurnal variation trends in water vapor are also observed, that is, a downward trend from the afternoon to the night, or a tendency of being high in the morning and afternoon and low at noon, demonstrating the high temporal-spatial variation characteristics of water vapor and close correlation with weather changes. The results reflected and validated that the diurnal variation in water vapor is complicated and can be an indicator of the weather to a certain extent. Full article
(This article belongs to the Special Issue Remote Sensing of Atmospheric Properties)
Show Figures

Figure 1

19 pages, 4014 KiB  
Article
Using Google Earth Engine to Map Complex Shade-Grown Coffee Landscapes in Northern Nicaragua
by Lisa C. Kelley, Lincoln Pitcher and Chris Bacon
Remote Sens. 2018, 10(6), 952; https://doi.org/10.3390/rs10060952 - 14 Jun 2018
Cited by 63 | Viewed by 16879
Abstract
Shade-grown coffee (shade coffee) is an important component of the forested tropics, and is essential to the conservation of forest-dependent biodiversity. Despite its importance, shade coffee is challenging to map using remotely sensed data given its spectral similarity to forested land. This paper [...] Read more.
Shade-grown coffee (shade coffee) is an important component of the forested tropics, and is essential to the conservation of forest-dependent biodiversity. Despite its importance, shade coffee is challenging to map using remotely sensed data given its spectral similarity to forested land. This paper addresses this challenge in three districts of northern Nicaragua, here leveraging cloud-based computing techniques within Google Earth Engine (GEE) to integrate multi-seasonal Landsat 8 satellite imagery (30 m), and physiographic variables (temperature, topography, and precipitation). Applying a random forest machine learning algorithm using reference data from two field surveys produced a 90.5% accuracy across ten classes of land cover, with an 82.1% and 80.0% user’s and producer’s accuracy respectively for shade-grown coffee. Comparing classification accuracies obtained from five datasets exploring different combinations of non-seasonal and seasonal spectral data as well as physiographic data also revealed a trend of increasing accuracy when seasonal data were included in the model and a significant improvement (7.8–20.1%) when topographical data were integrated with spectral data. These results are significant in piloting an open-access and user-friendly approach to mapping heterogeneous shade coffee landscapes with high overall accuracy, even in locations with persistent cloud cover. Full article
(This article belongs to the Special Issue Remote Sensing of Tropical Forest Biodiversity)
Show Figures

Graphical abstract

22 pages, 7999 KiB  
Article
Side-Scan Sonar Image Mosaic Using Couple Feature Points with Constraint of Track Line Positions
by Jianhu Zhao, Xiaodong Shang and Hongmei Zhang
Remote Sens. 2018, 10(6), 953; https://doi.org/10.3390/rs10060953 - 15 Jun 2018
Cited by 14 | Viewed by 6569
Abstract
To obtain large-scale seabed surface image, this paper proposes a side-scan sonar (SSS) image mosaic method using couple feature points (CFPs) with constraint of track line positions. The SSS geocoded images are firstly used to form a coarsely mosaicked one and the overlapping [...] Read more.
To obtain large-scale seabed surface image, this paper proposes a side-scan sonar (SSS) image mosaic method using couple feature points (CFPs) with constraint of track line positions. The SSS geocoded images are firstly used to form a coarsely mosaicked one and the overlapping areas between adjacent strip images can be determined based on geographic information. Inside the overlapping areas, the feature point (FP) detection and registration operation are adopted for both strips. According to the detected CFPs and track line positions, an adjustment model is established to accommodate complex local distortions as well as ensure the global stability. This proposed method effectively solves the problem of target ghosting or dislocation and no accumulated errors arise in the mosaicking process. Experimental results show that the finally mosaicked image correctly reflects the object distribution, which is meaningful for understanding and interpreting seabed topography. Full article
(This article belongs to the Special Issue Advances in Undersea Remote Sensing)
Show Figures

Graphical abstract

24 pages, 12146 KiB  
Article
Climate Sensitivity of High Arctic Permafrost Terrain Demonstrated by Widespread Ice-Wedge Thermokarst on Banks Island
by Robert H. Fraser, Steven V. Kokelj, Trevor C. Lantz, Morgan McFarlane-Winchester, Ian Olthof and Denis Lacelle
Remote Sens. 2018, 10(6), 954; https://doi.org/10.3390/rs10060954 - 15 Jun 2018
Cited by 81 | Viewed by 12271
Abstract
Ice-wedge networks underlie polygonal terrain and comprise the most widespread form of massive ground ice in continuous permafrost. Here, we show that climate-driven thaw of hilltop ice-wedge networks is rapidly transforming uplands across Banks Island in the Canadian Arctic Archipelago. Change detection using [...] Read more.
Ice-wedge networks underlie polygonal terrain and comprise the most widespread form of massive ground ice in continuous permafrost. Here, we show that climate-driven thaw of hilltop ice-wedge networks is rapidly transforming uplands across Banks Island in the Canadian Arctic Archipelago. Change detection using high-resolution WorldView images and historical air photos, coupled with 32-year Landsat reflectance trends, indicate broad-scale increases in ponding from ice-wedge thaw on hilltops, which has significantly affected at least 1500 km2 of Banks Island and over 3.5% of the total upland area. Trajectories of change associated with this upland ice-wedge thermokarst include increased micro-relief, development of high-centred polygons, and, in areas of poor drainage, ponding and potential initiation of thaw lakes. Millennia of cooling climate have favoured ice-wedge growth, and an absence of ecosystem disturbance combined with surface denudation by solifluction has produced high Arctic uplands and slopes underlain by ice-wedge networks truncated at the permafrost table. The thin veneer of thermally-conductive mineral soils strongly links Arctic upland active-layer responses to summer warming. For these reasons, widespread and intense ice-wedge thermokarst on Arctic hilltops and slopes contrast more muted responses to warming reported in low and subarctic environments. Increasing field evidence of thermokarst highlights the inherent climate sensitivity of the Arctic permafrost terrain and the need for integrated approaches to monitor change and investigate the cascade of environmental consequences. Full article
(This article belongs to the Special Issue Remote Sensing of Dynamic Permafrost Regions)
Show Figures

Graphical abstract

16 pages, 1956 KiB  
Article
A Novel Approach for the Short-Term Forecast of the Effective Cloud Albedo
by Isabel Urbich, Jörg Bendix and Richard Müller
Remote Sens. 2018, 10(6), 955; https://doi.org/10.3390/rs10060955 - 15 Jun 2018
Cited by 23 | Viewed by 10608
Abstract
The increasing use of renewable energies as a source of electricity has led to a fundamental transition of the power supply system. The integration of fluctuating weather-dependent energy sources into the grid already has a major impact on its load flows. As a [...] Read more.
The increasing use of renewable energies as a source of electricity has led to a fundamental transition of the power supply system. The integration of fluctuating weather-dependent energy sources into the grid already has a major impact on its load flows. As a result, the interest in forecasting wind and solar radiation with a sufficient accuracy over short time periods (<4 h) has grown. In this study, the short-term forecast of the effective cloud albedo based on optical flow estimation methods is investigated. The optical flow method utilized here is TV-L1 from the open source library OpenCV. This method uses a multi-scale approach to capture cloud motions on various spatial scales. After the clouds are displaced, the solar surface radiation will be calculated with SPECMAGIC NOW, which computes the global irradiation spectrally resolved from satellite imagery. Due to the high temporal and spatial resolution of satellite measurements, the effective cloud albedo and thus solar radiation can be forecasted from 5 min up to 4 h with a resolution of 0.05°. The validation results of this method are very promising, and the RMSE of the 30-min, 60-min, 90-min and 120-min forecast equals 10.47%, 14.28%, 16.87% and 18.83%, respectively. The paper gives a brief description of the method for the short-term forecast of the effective cloud albedo. Subsequently, evaluation results will be presented and discussed. Full article
(This article belongs to the Section Atmospheric Remote Sensing)
Show Figures

Graphical abstract

12 pages, 3945 KiB  
Article
Temporal Variability of MODIS Phenological Indices in the Temperate Rainforest of Northern Patagonia
by Carlos Lara, Gonzalo S. Saldías, Alvaro L. Paredes, Bernard Cazelles and Bernardo R. Broitman
Remote Sens. 2018, 10(6), 956; https://doi.org/10.3390/rs10060956 - 15 Jun 2018
Cited by 19 | Viewed by 4980
Abstract
Western Patagonia harbors unique and sparsely studied terrestrial ecosystems that are threatened by land use changes and exposure to basin-scale climatic variability. We assessed the performance of two satellite vegetation indices derived from MODIS–Terra, EVI (Enhanced Vegetation Index) and NDVI (Normalized Difference Vegetation [...] Read more.
Western Patagonia harbors unique and sparsely studied terrestrial ecosystems that are threatened by land use changes and exposure to basin-scale climatic variability. We assessed the performance of two satellite vegetation indices derived from MODIS–Terra, EVI (Enhanced Vegetation Index) and NDVI (Normalized Difference Vegetation Index), over the northern and southern sectors of the Chiloé Island System (CIS) to advance our understanding of vegetation dynamics in the region. Then we examined their time-varying relationships with two climatic indices indicative of tropical and extratropical influence, the ENSO (El Niño–Southern Oscillation) and the Antarctic Oscillation (AAO) index, respectively. The 17-year time series showed that only EVI captured the seasonal pattern characteristic of temperate regions, with low (high) phenological activity during Autumn-Winter (Spring–Summer). NDVI saturated during the season of high productivity and failed to capture the seasonal cycle. Temporal patterns in productivity showed a weakened seasonal cycle during the past decade, particularly over the northern sector. We observed a non-stationary association between EVI and both climatic indices. Significant co-variation between EVI and the Niño–Southern Oscillation index in the annual band persisted from 2001 until 2008–2009; annual coherence with AAO prevailed from 2013 onwards and the 2009–2012 period was characterized by coherence between EVI and both climate indices over longer temporal scales. Our results suggest that the influence of large-scale climatic variability on local weather patterns drives phenological responses in the northern and southern regions of the CIS. The imprint of climatic variability on patterns of primary production across the CIS may be underpinned by spatial differences in the anthropogenic modification of this ecosystem, as the northern sector is strongly modified by forestry and agriculture. We highlight the need for field validation of satellite indices around areas of high biomass and high endemism, located in the southern sector of the island, in order to enhance the utility of satellite vegetation indices in the conservation and management of austral ecosystems. Full article
(This article belongs to the Special Issue Multitemporal Remote Sensing for Forestry)
Show Figures

Figure 1

20 pages, 2079 KiB  
Article
Aerosol and Meteorological Parameters Associated with the Intense Dust Event of 15 April 2015 over Beijing, China
by Sheng Zheng and Ramesh P. Singh
Remote Sens. 2018, 10(6), 957; https://doi.org/10.3390/rs10060957 - 15 Jun 2018
Cited by 18 | Viewed by 4806
Abstract
The northeastern parts of China, including Beijing city, the capital of China, were hit by an intense dust storm on 15 April 2015. The present paper discusses aerosol and meteorological parameters associated with this dust storm event. The back trajectory clearly shows that [...] Read more.
The northeastern parts of China, including Beijing city, the capital of China, were hit by an intense dust storm on 15 April 2015. The present paper discusses aerosol and meteorological parameters associated with this dust storm event. The back trajectory clearly shows that the dust originated from Inner Mongolia, the border of China, and Mongolia regions. Pronounced changes in aerosol and meteorological parameters along the dust track were observed. High aerosol optical depth (AOD) with low Ångström exponent (AE) are characteristics of coarse-mode dominated dust particles in the wavelength range 440–870 nm during the dusty day. During dust storm, dominance of coarse aerosol concentrations is observed in the aerosol size distribution (ASD). The single scattering albedo (SSA) retrieved from AERONET station shows increase with higher wavelength on the dusty day, and is found to be higher compared to the days prior to and after the dust event, supported with high values of the real part and decrease in the imaginary part of the refractive index (RI). With regard to meteorological parameters, during the dusty day, CO volume mixing ratio (COVMR) is observed to decrease, from the surface up to mid-altitude, compared with the non-dusty days due to strong winds. O3 volume mixing ratio (O3VMR) enhances at the increasing altitudes (at the low-pressure levels), and decreases near the surface at the pressure levels 500–925 hPa during the dust event, compared with the non-dusty periods. An increase in the H2O mass mixing ratio (H2OMMR) is observed during dusty periods at the higher altitudes equivalent to the pressure levels 500 and 700 hPa. The mid-altitude relative humidity (RH) is observed to decrease at the pressure levels 700 and 925 hPa during sand storm days. With the onset of the dust storm event, the RH reduces at the surface level. Full article
(This article belongs to the Special Issue Remote Sensing of Atmospheric Properties)
Show Figures

Graphical abstract

19 pages, 7228 KiB  
Article
Influences of Environmental Loading Corrections on the Nonlinear Variations and Velocity Uncertainties for the Reprocessed Global Positioning System Height Time Series of the Crustal Movement Observation Network of China
by Peng Yuan, Zhao Li, Weiping Jiang, Yifang Ma, Wu Chen and Nico Sneeuw
Remote Sens. 2018, 10(6), 958; https://doi.org/10.3390/rs10060958 - 15 Jun 2018
Cited by 25 | Viewed by 5301
Abstract
Mass redistribution of the atmosphere, oceans, and terrestrial water storage generates crustal displacements which can be predicted by environmental loading models and observed by the Global Positioning System (GPS). In this paper, daily height time series of 235 GPS stations derived from a [...] Read more.
Mass redistribution of the atmosphere, oceans, and terrestrial water storage generates crustal displacements which can be predicted by environmental loading models and observed by the Global Positioning System (GPS). In this paper, daily height time series of 235 GPS stations derived from a homogeneously reprocessed Crustal Movement Observation Network of China (CMONOC) and corresponding loading displacements predicted by the Deutsche GeoForschungsZentrum (GFZ) are compared to assess the effects of loading corrections on the nonlinear variations of GPS time series. Results show that the average root mean square (RMS) of vertical displacements due to atmospheric, nontidal oceanic, hydrological, and their combined effects are 3.2, 0.6, 2.7, and 4.0 mm, respectively. Vertical annual signals of loading and GPS are consistent in amplitude but different in phase systematically. The average correlation coefficient between loading and GPS height time series is 0.6. RMS of the GPS height time series are reduced by 20% on average. Moreover, an investigation of 208 CMONOC stations with observing time spans of ~4.6 years shows that environmental loading corrections lead to an overestimation of the GPS velocity uncertainty by about 1.4 times on average. Nevertheless, by using a common mode component filter through principal component analysis, the dilution of velocity precision due to environmental loading corrections can be compensated. Full article
(This article belongs to the Special Issue Remote Sensing of Tectonic Deformation)
Show Figures

Graphical abstract

21 pages, 19221 KiB  
Article
The Temperature Vegetation Dryness Index (TVDI) Based on Bi-Parabolic NDVI-Ts Space and Gradient-Based Structural Similarity (GSSIM) for Long-Term Drought Assessment Across Shaanxi Province, China (2000–2016)
by Ying Liu and Hui Yue
Remote Sens. 2018, 10(6), 959; https://doi.org/10.3390/rs10060959 - 15 Jun 2018
Cited by 49 | Viewed by 8302
Abstract
Traditional NDVI-Ts space is triangular or trapezoidal, but Liu et al. (2015) discovered that the NDVI-Ts space was bi-parabolic when the study area was covered with low biomass vegetation. Moreover, the numerical value of the indicator was considered in most of [...] Read more.
Traditional NDVI-Ts space is triangular or trapezoidal, but Liu et al. (2015) discovered that the NDVI-Ts space was bi-parabolic when the study area was covered with low biomass vegetation. Moreover, the numerical value of the indicator was considered in most of the study when the drought conditions in the space domain were evaluated. In addition, quantitatively assessing the spatial-temporal changes of the drought was not enough. In this study, first, we used MODIS NDVI and Ts data to reexamine if the NDVI-Ts space with “time” and a single pixel domain is bi-parabolic in the Shaanxi province of China, which is vegetated with low biomass to high biomass. This is compared with the triangular NDVI-Ts space and one of the well-known drought indexes called the temperature-vegetation index (TVX). The results demonstrated that dry and wet edges exhibited a parabolic shape again in scatter plots of Ts and NDVI in the Shaanxi province, which was linear in the triangular NDVI-Ts space. The Temperature Vegetation Dryness Index (TVDIc) was obtained from bi-parabolic NDVI-Ts andTVDIt was obtained from the triangular NDVI-Ts space and TVX were compared with 10-cm depth relative soil moisture. By estimating the 10-cm depth soil moisture, TVDIc was better than TVDIt, which were all apparently better than TVX. Second, combined with MODIS data, the drought conditions of the study area were assessed by TVDIc between 2000 to 2016. Spatially, the drought in the Shaanxi Province between 2000 to 2016 were mainly distributed in the northwest, North Shaanxi, and the North and East Guanzhong plain. The drought area of the Shaanxi province accounted for 31.95% in 2000 and 27.65% in 2016, respectively. Third, we quantitatively evaluated the variation of the drought status by using Gradient-based Structural Similarity (GSSIM) methods. The area of the drought conditions significantly changed and moderately changed at 5.34% and 40.22%, respectively, between 2000 and 2016. Finally, the possible reasons for drought change were discussed. The change of precipitation, temperature, irrigation, destruction or betterment of vegetation, and the enlargement of opening mining, etc., can lead to the variations of drought. Full article
(This article belongs to the Section Biogeosciences Remote Sensing)
Show Figures

Figure 1

13 pages, 2269 KiB  
Article
Variability of Microwave Scattering in a Stochastic Ensemble of Measured Rain Drops
by Francisco J. Tapiador, Raúl Moreno, Andrés Navarro, Alfonso Jiménez, Enrique Arias and Diego Cazorla
Remote Sens. 2018, 10(6), 960; https://doi.org/10.3390/rs10060960 - 15 Jun 2018
Cited by 2 | Viewed by 4303
Abstract
While it has been proved that multiple scattering in the microwave frequencies has to be accounted for in precipitation retrieval algorithms, the effects of the random arrangements of drops in space has seldom been investigated. The fact is, a single rain drop size [...] Read more.
While it has been proved that multiple scattering in the microwave frequencies has to be accounted for in precipitation retrieval algorithms, the effects of the random arrangements of drops in space has seldom been investigated. The fact is, a single rain drop size distribution (RDSD) corresponds with many actual 3D distributions of those rain drops and each of those may a priori absorb and scatter radiation in a different way. Each spatial configuration is equivalent to any other in terms of the RDSD function, but not in terms of radiometric characteristics, both near and far from field, because of changes in the relative phases among the particles. Here, using the T-matrix formalism, we investigate the radiometric variability of two ensembles of 50 different 3D, stochastically-derived configurations from two consecutive measured RDSDs with 30 and 31 drops, respectively. The results show that the random distribution of drops in space has a measurable but apparently small effect in the scattering calculations with the exception of the asymmetry factor. Full article
(This article belongs to the Special Issue Remote Sensing of Precipitation)
Show Figures

Graphical abstract

17 pages, 5763 KiB  
Article
Temporal and Spatial Characteristics of EVI and Its Response to Climatic Factors in Recent 16 years Based on Grey Relational Analysis in Inner Mongolia Autonomous Region, China
by Dong He, Guihua Yi, Tingbin Zhang, Jiaqing Miao, Jingji Li and Xiaojuan Bie
Remote Sens. 2018, 10(6), 961; https://doi.org/10.3390/rs10060961 - 15 Jun 2018
Cited by 42 | Viewed by 6047
Abstract
The Inner Mongolia Autonomous Region (IMAR) is a major source of rivers, catchment areas, and ecological barriers in the northeast of China, related to the nation’s ecological security and improvement of the ecological environment. Therefore, studying the response of vegetation to climate change [...] Read more.
The Inner Mongolia Autonomous Region (IMAR) is a major source of rivers, catchment areas, and ecological barriers in the northeast of China, related to the nation’s ecological security and improvement of the ecological environment. Therefore, studying the response of vegetation to climate change has become an important part of current global change research. Since existing studies lack detailed descriptions of the response of vegetation to different climatic factors using the method of grey correlation analysis based on pixel, the temporal and spatial patterns and trends of enhanced vegetation index (EVI) are analyzed in the growing season in IMAR from 2000 to 2015 based on moderate resolution imaging spectroradiometer (MODIS) EVI data. Combined with the data of air temperature, relative humidity, and precipitation in the study area, the grey relational analysis (GRA) method is used to study the time lag of EVI to climate change, and the study area is finally zoned into different parts according to the driving climatic factors for EVI on the basis of lag analysis. The driving zones quantitatively show the characteristics of temporal and spatial differences in response to different climatic factors for EVI. The results show that: (1) The value of EVI generally features in spatial distribution, increasing from the west to the east and the south to the north. The rate of change is 0.22/10°E from the west to the east, 0.28/10°N from the south to the north; (2) During 2000–2015, the EVI in IMAR showed a slightly upward trend with a growth rate of 0.021/10a. Among them, the areas with slight and significant improvement accounted for 21.1% and 7.5% of the total area respectively, ones with slight and significant degradation being 24.6% and 4.3%; (3) The time lag analysis of climatic factors for EVI indicates that vegetation growth in the study area lags behind air temperature by 1–2 months, relative humidity by 1–2 months, and precipitation by one month respectively; (4) During the growing season, the EVI of precipitation driving zone (21.8%) in IMAR is much larger than that in the air temperature driving zone (8%) and the relative humidity driving zone (11.6%). The growth of vegetation in IMAR generally has the closest relationship with precipitation. The growth of vegetation does not depend on the change of a single climatic factor. Instead, it is the result of the combined action of multiple climatic factors and human activities. Full article
(This article belongs to the Special Issue Earth Observations for Addressing Global Challenges)
Show Figures

Figure 1

25 pages, 8668 KiB  
Article
Winter Wheat Production Estimation Based on Environmental Stress Factors from Satellite Observations
by Juan Sui, Qiming Qin, Huazhong Ren, Yuanheng Sun, Tianyuan Zhang, Jiandong Wang and Shihong Gong
Remote Sens. 2018, 10(6), 962; https://doi.org/10.3390/rs10060962 - 15 Jun 2018
Cited by 21 | Viewed by 5471
Abstract
The rapid and accurate estimation of wheat production at a regional scale is crucial for national food security and sustainable agricultural development. This study developed a new gross primary productivity (GPP) estimation model (denoted as the [ACPM]), based on the effects of light, [...] Read more.
The rapid and accurate estimation of wheat production at a regional scale is crucial for national food security and sustainable agricultural development. This study developed a new gross primary productivity (GPP) estimation model (denoted as the [ACPM]), based on the effects of light, heat, soil moisture, and nitrogen content (N) on the light-use efficiency of winter wheat. The ACPM model used the quantic additivity of the environmental factors to improve the minimum form or multiple multiplication form in the previous model and thus characterized the joint effects of heat, soil moisture, and N on crop photosynthesis performance. The key parameters (i.e., light) were determined from the photosynthetically active radiation product of the Himawari-8 sensor and the fraction of photosynthetically active radiation product of Moderate Resolution Imaging Spectroradiometer (MODIS). The heat was determined from the land temperature products of MODIS. The soil moisture was obtained from the inversion using a visible and shortwave infrared drought index (VSDI), whereas the N stress of winter wheat was detected using the newly developed modified ratio vegetation index (MRVI), which could accurately obtain the spatiotemporal distribution of the leaf chlorophyll content of winter wheat. The ACPM and two other previous models (named the GPP1 and GPP2 models) were applied on the Himawari-8 and MODIS images in Hengshui City. The evaluation results, based on the ground measurement, indicated that the ACPM models exhibited the best estimate of dry aboveground biomass (DAM) and the wheat yield in Hengshui City, with errors of <10% and <12% for the DAM and yield, respectively. Considering the easy operation of the ACPM model and the accessibility of the corresponding satellite images, the Agriculture Crop Photosynthesis Model (ACPM) can be expected to provide information on the winter wheat shortfalls and surplus ahead of the availability of official statistical data. Full article
(This article belongs to the Section Remote Sensing in Agriculture and Vegetation)
Show Figures

Graphical abstract

22 pages, 9275 KiB  
Article
A Seismic Capacity Evaluation Approach for Architectural Heritage Using Finite Element Analysis of Three-Dimensional Model: A Case Study of the Limestone Hall in the Ming Dynasty
by Siliang Chen, Shaohua Wang, Chen Li, Qingwu Hu and Hongjun Yang
Remote Sens. 2018, 10(6), 963; https://doi.org/10.3390/rs10060963 - 15 Jun 2018
Cited by 15 | Viewed by 6018
Abstract
A lot of architectural heritage in China are urgently in need to carry out seismic assessment for further conservation. In this paper, a seismic capacity evaluation approach for architectural heritage using finite element analysis with precision three-dimensional data was proposed. The Limestone Hall [...] Read more.
A lot of architectural heritage in China are urgently in need to carry out seismic assessment for further conservation. In this paper, a seismic capacity evaluation approach for architectural heritage using finite element analysis with precision three-dimensional data was proposed. The Limestone Hall of Shaanxi Province was taken as an example. First, low attitude unmanned aerial vehicle photogrammetry and a close-range photogrammetry camera were used to collect multiple view images to obtain the precision three-dimensional current model of the Limestone. Second, the dimensions of internal structures of Limestone Hall are obtained by means of structural analysis; re-establishing the ideal model of Limestone Hall based on the modeling software. Third, a finite element analysis was conducted to find out the natural frequency and seismic stress in various conditions with the 3D model using ANSYS software. Finally, the seismic capacity analysis results were comprehensively evaluated for the risk assessment and simulation. The results showed that for architectural heritage with a multilayer structure, utilizing photogrammetric surveying and mapping, 3D software modeling, finite element software simulation, and seismic evaluation for simulation was feasible where the precision of the modeling and parameters determine the accuracy of the simulation. The precise degree of the three-dimensional model, the accurate degree of parameter measurement and estimation, the setting of component attributes in the finite element model and the strategy of finite element analysis have an important effect on the result of seismic assessment. The main body structure of the Limestone Hall could resist an VII-degree earthquake at most, and the ridge of the second floor could not resist a V-degree earthquake due to unsupported conditions. The maximum deformation of the Limestone Hall during the earthquake occurred in the tabia layer below the second roof. Full article
(This article belongs to the Special Issue Advances in Remote Sensing for Archaeological Heritage)
Show Figures

Graphical abstract

13 pages, 2289 KiB  
Article
Performance Evaluation of Single-Label and Multi-Label Remote Sensing Image Retrieval Using a Dense Labeling Dataset
by Zhenfeng Shao, Ke Yang and Weixun Zhou
Remote Sens. 2018, 10(6), 964; https://doi.org/10.3390/rs10060964 - 16 Jun 2018
Cited by 150 | Viewed by 11044 | Correction
Abstract
Benchmark datasets are essential for developing and evaluating remote sensing image retrieval (RSIR) approaches. However, most of the existing datasets are single-labeled, with each image in these datasets being annotated by a single label representing the most significant semantic content of the image. [...] Read more.
Benchmark datasets are essential for developing and evaluating remote sensing image retrieval (RSIR) approaches. However, most of the existing datasets are single-labeled, with each image in these datasets being annotated by a single label representing the most significant semantic content of the image. This is sufficient for simple problems, such as distinguishing between a building and a beach, but multiple labels and sometimes even dense (pixel) labels are required for more complex problems, such as RSIR and semantic segmentation.We therefore extended the existing multi-labeled dataset collected for multi-label RSIR and presented a dense labeling remote sensing dataset termed "DLRSD". DLRSD contained a total of 17 classes, and the pixels of each image were assigned with 17 pre-defined labels. We used DLRSD to evaluate the performance of RSIR methods ranging from traditional handcrafted feature-based methods to deep learning-based ones. More specifically, we evaluated the performances of RSIR methods from both single-label and multi-label perspectives. These results demonstrated the advantages of multiple labels over single labels for interpreting complex remote sensing images. DLRSD provided the literature a benchmark for RSIR and other pixel-based problems such as semantic segmentation. Full article
(This article belongs to the Special Issue Deep Learning for Remote Sensing)
Show Figures

Graphical abstract

14 pages, 3264 KiB  
Article
The Heterogeneity of Air Temperature in Urban Residential Neighborhoods and Its Relationship with the Surrounding Greenspace
by Yuguo Qian, Weiqi Zhou, Xiaofang Hu and Fan Fu
Remote Sens. 2018, 10(6), 965; https://doi.org/10.3390/rs10060965 - 16 Jun 2018
Cited by 28 | Viewed by 5176
Abstract
The thermal environment in residential areas is directly related to the living quality of residents. Therefore, it is important to understand thermal heterogeneity and ways to regulate temperature in residential neighborhoods. We investigated the spatial heterogeneity and temporal dynamics of air temperatures in [...] Read more.
The thermal environment in residential areas is directly related to the living quality of residents. Therefore, it is important to understand thermal heterogeneity and ways to regulate temperature in residential neighborhoods. We investigated the spatial heterogeneity and temporal dynamics of air temperatures in 20 residential neighborhoods within the 5th ring road of Beijing, China. We further explored how the variations in air temperature were related to the patterns of the surrounding greenspace at different scales. We found that: (1) large air temperature differences existed among residential neighborhoods, with hourly maximum differences in air temperature reaching 5.30 °C on hot summer days; (2) not only the percentage but also the spatial configuration (e.g., edge density) of greenspace affected the local air temperature; and (3) the effects of spatial greenspace patterns on air temperature were scale dependent and varied by season. For example, increasing the proportion of greenspace in surrounding areas within a 100-m radius and increasing the edge density within radii from 500 to 1000 m could lower air temperatures in summer but not affect air temperatures in winter. In addition, decreasing the edge density of greenspaces within a 100-m radius of the surrounding areas would lead to an increase in air temperature in winter but not affect the air temperature in summer. These results extend our understanding of thermal environments and their relationships with greenspace patterns at the microscale (i.e., residential neighborhoods). They also provide useful information for urban planners to optimize greenspace patterns under better thermal conditions at the neighborhood scale. Full article
(This article belongs to the Special Issue Remote Sensing of Urban Ecology)
Show Figures

Graphical abstract

20 pages, 7050 KiB  
Article
Estimation of Water Level Changes of Large-Scale Amazon Wetlands Using ALOS2 ScanSAR Differential Interferometry
by Ning Cao, Hyongki Lee, Hahn Chul Jung and Hanwen Yu
Remote Sens. 2018, 10(6), 966; https://doi.org/10.3390/rs10060966 - 17 Jun 2018
Cited by 25 | Viewed by 6136
Abstract
Differential synthetic aperture radar (SAR) interferometry (DInSAR) has been successfully used to estimate water level changes (∂h/∂t) over wetlands and floodplains. Specifically, amongst ALOS PALSAR datasets, the fine-beam stripmap mode has been mostly implemented to estimate ∂h/∂t due to its availability of multitemporal [...] Read more.
Differential synthetic aperture radar (SAR) interferometry (DInSAR) has been successfully used to estimate water level changes (∂h/∂t) over wetlands and floodplains. Specifically, amongst ALOS PALSAR datasets, the fine-beam stripmap mode has been mostly implemented to estimate ∂h/∂t due to its availability of multitemporal images. However, the fine-beam observation mode provides limited swath coverage to study large floodplains and wetlands, such as the Amazon floodplains. Therefore, for the first time, this paper demonstrates that ALOS2 ScanSAR data can be used to estimate the large-scale ∂h/∂t in Amazon floodplains. The basic procedures and challenges of DInSAR processing with ALOS2 ScanSAR data are addressed and final ∂h/∂t maps are generated based on the Satellite with ARgos and ALtiKa (SARAL) altimetry’s reference data. This study reveals that the local ∂h/∂t patterns of Amazon floodplains are spatially complex with highly interconnected floodplain channels, but the large-scale (with 350 km swath) ∂h/∂t patterns are simply characterized by river water flow directions. Full article
(This article belongs to the Special Issue Imaging Geodesy and Infrastructure Monitoring)
Show Figures

Figure 1

16 pages, 6854 KiB  
Article
Investigation of Precipitable Water Vapor Obtained by Raman Lidar and Comprehensive Analyses with Meteorological Parameters in Xi’an
by Yufeng Wang, Liu Tang, Jing Zhang, Tianle Gao, Qing Wang, Yuehui Song and Dengxin Hua
Remote Sens. 2018, 10(6), 967; https://doi.org/10.3390/rs10060967 - 17 Jun 2018
Cited by 8 | Viewed by 4924
Abstract
To evaluate the potential of Raman lidar observations for measuring precipitable water vapor (PWV), PWV variations and distribution characteristics were investigated in Xi’an (34.233°N, 108.911°E), and its comparisons with meteorological parameters were also analysed. Comparisons of lidar PWV with radiosonde PWV verified the [...] Read more.
To evaluate the potential of Raman lidar observations for measuring precipitable water vapor (PWV), PWV variations and distribution characteristics were investigated in Xi’an (34.233°N, 108.911°E), and its comparisons with meteorological parameters were also analysed. Comparisons of lidar PWV with radiosonde PWV verified the ability and accuracy of using Raman lidars for PWV measurements. The diurnal and monthly variation trends in PWV in different layers are first discussed via the statistical analysis of lidar data from November 2013 to July 2016; different proportions of PWV were found in different layers, and the PWV in each layer presented a slight diurnal change trend and consistent seasonal variation, which was relatively rich in summer, less so in spring and autumn, and relatively deficient in winter. Furthermore, correlation analyses between lidar PWV and meteorological parameters are explored. Water vapor pressure and surface temperature revealed the same inter-seasonal oscillation of PWV, with a correlation coefficient of ~0.90. However, incomplete synchronization was found between PWV and relative humidity and precipitation parameters. Higher humidity appeared in the late summer and the beginning of autumn of each year, which was also the case for precipitation and precipitation efficiency. In addition, atmospheric water vapor density profiles and the obtained PWV by Raman lidar are discussed employing a rainfall case, and a comprehensive analysis with meteorological parameters is undertaken. The intensifying characteristics of vertical change in water vapor and the accumulation of PWV in the lower troposphere can be captured by lidar before the onset of rainfall. In contrast to the obvious diurnal change trend, such meteorological parameters as relative humidity, water vapor pressure, and dew-point temperature difference are accompanied with stable trends with a change rate of close to 0 in the rainfall processes; they also show high correlated variations with lidar PWV. Thus, with the advantage of lidar detection, investigation of water vapor profiles and PWV by Raman lidar, and the comprehensive correlation analyses with synchronic meteorological parameters can prove to be good indications of rainfall. Full article
(This article belongs to the Special Issue Remote Sensing of Atmospheric Properties)
Show Figures

Graphical abstract

20 pages, 4745 KiB  
Article
The Use of Massive Deformation Datasets for the Analysis of Spatial and Temporal Evolution of Mauna Loa Volcano (Hawai’i)
by Susi Pepe, Luca D’Auria, Raffaele Castaldo, Francesco Casu, Claudio De Luca, Vincenzo De Novellis, Eugenio Sansosti, Giuseppe Solaro and Pietro Tizzani
Remote Sens. 2018, 10(6), 968; https://doi.org/10.3390/rs10060968 - 17 Jun 2018
Cited by 12 | Viewed by 6773
Abstract
In this work, we exploited large DInSAR and GPS datasets to create a 4D image of the magma transfer processes at Mauna Loa Volcano (Island of Hawai’i) from 2005 to 2015. The datasets consist of 23 continuous GPS time series and 307 SAR [...] Read more.
In this work, we exploited large DInSAR and GPS datasets to create a 4D image of the magma transfer processes at Mauna Loa Volcano (Island of Hawai’i) from 2005 to 2015. The datasets consist of 23 continuous GPS time series and 307 SAR images acquired from ascending and descending orbits by ENVISAT (ENV) and COSMO-SkyMed (CSK) satellites. Our results highlight how the joint use of SAR data acquired from different orbits (thus with different look angles and wavelengths), together with deformation data from GPS networks and geological information can significantly improve the constraints on the geometry and location of the sources responsible for the observed deformation. The analysis of these datasets has been performed by using an innovative method that allows building a complex source configuration. The results suggest that the deformation pattern observed from 2005 to 2015 has been controlled by three deformation sources: the ascent of magma along a conduit, the opening of a dike and the slip along the basal decollement. This confirms that the intrusion of the magma within a tabular system (rift dikes) may trigger the sliding of the SE portion of the volcanic edifice along the basal decollement. This case study confirms that it is now possible to exploit large geodetic datasets to improve our knowledge of volcano dynamics. The same approach could also be easily applied in other geodynamical contexts such as geothermal reservoirs and regions with complex tectonics. Full article
(This article belongs to the Special Issue Remote Sensing of Tectonic Deformation)
Show Figures

Graphical abstract

24 pages, 4716 KiB  
Article
Relation between Convective Rainfall Properties and Antecedent Soil Moisture Heterogeneity Conditions in North Africa
by Irina Y. Petrova, Diego G. Miralles, Chiel C. Van Heerwaarden and Hendrik Wouters
Remote Sens. 2018, 10(6), 969; https://doi.org/10.3390/rs10060969 - 17 Jun 2018
Cited by 10 | Viewed by 6397
Abstract
Recent observational studies have demonstrated the relevance of soil moisture heterogeneity and the associated thermally-induced circulation on deep convection and rainfall triggering. However, whether this dynamical mechanism further influences rainfall properties—such as rain volume or timing—has yet to be confirmed by observational data. [...] Read more.
Recent observational studies have demonstrated the relevance of soil moisture heterogeneity and the associated thermally-induced circulation on deep convection and rainfall triggering. However, whether this dynamical mechanism further influences rainfall properties—such as rain volume or timing—has yet to be confirmed by observational data. Here, we analyze 10 years of satellite-based sub-daily soil moisture and precipitation records and explore the potential of strong spatial gradients in morning soil moisture to influence the properties of afternoon rainfall in the North African region, at the 100-km scale. We find that the convective rain systems that form over locally drier soils and anomalously strong soil moisture gradients have a tendency to initiate earlier in the afternoon; they also yield lower volumes of rain, weaker intensity and lower spatial variability. The strongest sensitivity to antecedent soil conditions is identified for the timing of the rain onset; it is found to be correlated with the magnitude of the soil moisture gradient. Further analysis shows that the early initiation of rainfall over dry soils and strong surface gradients yet requires the presence of a very moist boundary layer on that day. Our findings agree well with the expected effects of thermally-induced circulation on rainfall properties suggested by theoretical studies and point to the potential of locally drier and heterogeneous soils to influence convective rainfall development. The systematic nature of the identified effect of soil moisture state on the onset time of rainstorms in the region is of particular relevance and may help foster research on rainfall predictability. Full article
(This article belongs to the Special Issue Remote Sensing of Land-Atmosphere Interactions)
Show Figures

Graphical abstract

23 pages, 9192 KiB  
Article
Remote Sensing of Leaf Area Index from LiDAR Height Percentile Metrics and Comparison with MODIS Product in a Selectively Logged Tropical Forest Area in Eastern Amazonia
by Yonghua Qu, Ahmed Shaker, Carlos Alberto Silva, Carine Klauberg and Ekena Rangel Pinagé
Remote Sens. 2018, 10(6), 970; https://doi.org/10.3390/rs10060970 - 17 Jun 2018
Cited by 27 | Viewed by 7063
Abstract
Leaf area index (LAI) is an important parameter to describe the capacity of forests to intercept light and thus affects the microclimate and photosynthetic capacity of canopies. In general, tropical forests have a higher leaf area index and it is a challenge to [...] Read more.
Leaf area index (LAI) is an important parameter to describe the capacity of forests to intercept light and thus affects the microclimate and photosynthetic capacity of canopies. In general, tropical forests have a higher leaf area index and it is a challenge to estimate LAI in a forest with a very dense canopy. In this study, it is assumed that the traditional Light Detection and Ranging (LiDAR)-derived fractional vegetation cover (fCover) has weak relationship with leaf area index in a dense forest. We propose a partial least squares (PLS) regression model using the height percentile metrics derived from airborne LiDAR data to estimate the LAI of a dense forest. Ground inventory and airborne LiDAR data collected in a selectively logged tropical forest area in Eastern Amazonia are used to map LAI from the plot level to the landscape scale. The results indicate that the fCover, derived from the first return or the last return, has no significant correlations with the ground-based LAI. The PLS model evaluated by the leave-one-out validation shows that the estimated LAI is significantly correlated with the ground-based LAI with an R2 of 0.58 and a root mean square error (RMSE) of 1.13. A data comparison indicates that the Moderate Resolution Imaging Spectrometer (MODIS) LAI underestimates the landscape-level LAI by about 22%. The MODIS quality control data show that in the selected tile, the cloud state is not the primary factor affecting the MODIS LAI performance; rather, the LAI from the main radiative transfer (RT) algorithm contributes much to the underestimation of the LAI in the tropical forest. In addition, the results show that the LiDAR-based LAI has a better response to the logging activities than the MODIS-based LAI, and that the leaf area reduction caused by logging is about 13%. In contrast, the MODIS-based LAI exhibits no apparent spatial correlation with the LiDAR-based LAI. It is suggested that the main algorithm of MODIS should be improved with regard to tropical forests. The significance of this study is the proposal of a framework to produce ground-based LAI using forest inventory data and determine the plot-level LAI at the airborne and satellite scale using LiDAR data. Full article
(This article belongs to the Section Forest Remote Sensing)
Show Figures

Figure 1

21 pages, 4727 KiB  
Article
Improving Geometric Performance for Imagery Captured by Non-Cartographic Optical Satellite: A Case Study of GF-1 WFV Imagery
by Kai Xu, Guo Zhang, Mingjun Deng, Qingjun Zhang and Deren Li
Remote Sens. 2018, 10(6), 971; https://doi.org/10.3390/rs10060971 - 18 Jun 2018
Cited by 1 | Viewed by 4040
Abstract
Numerous countries have established their own Earth observing systems (EOSs) for global change research. Data acquisition efforts are generally only concerned with the completion of the mission regardless of the potential to expand into other areas, which reduces the application effectiveness of Earth [...] Read more.
Numerous countries have established their own Earth observing systems (EOSs) for global change research. Data acquisition efforts are generally only concerned with the completion of the mission regardless of the potential to expand into other areas, which reduces the application effectiveness of Earth observation data. This paper explores the cartographic possibility of images being not initially intended for surveying and mapping, and a novel method is proposed to improve the geometric performance. First, the rigorous sensor model (RSM) is recovered from the rational function model (RFM), and then the system errors of the non-cartographic satellite’s imagery are compensated by using the conventional geometric calibration method based on RSM; finally, a new and improved RFM is generated. The advantage of the method over traditional ones is that it divides the errors into static errors and non-static errors for each image during the improvement process. Experiments using images collected with the Gaofen-1 (GF-1) wide-field view (WFV) camera demonstrate that the orientation accuracy of the proposed method is within 1 pixel for both calibration and validation images, and the obvious high-order system errors are eliminated. Moreover, a block adjustment test shows that the vertical accuracy is improved from 21 m to 11 m with four ground control points (GCPs) after compensation, which can fulfill requirements for 1:100,000 stereo mapping in mountainous areas. Generally, the proposed method can effectively improve the geometric potential for images captured by non-cartographic satellite. Full article
(This article belongs to the Section Remote Sensing Image Processing)
Show Figures

Graphical abstract

21 pages, 6824 KiB  
Article
Assessment of Irrigation Performance in Large River Basins under Data Scarce Environment—A Case of Kabul River Basin, Afghanistan
by Fazlullah Akhtar, Usman Khalid Awan, Bernhard Tischbein and Umar Waqas Liaqat
Remote Sens. 2018, 10(6), 972; https://doi.org/10.3390/rs10060972 - 18 Jun 2018
Cited by 32 | Viewed by 7657
Abstract
The Kabul River basin (KRB) of Afghanistan, a lifeline of around 10 million people, has multiplicity of governance, management, and development-related challenges leading to inequity, inadequacy, and unreliability of irrigation water distribution. Prior to any uplifting intervention, there is a need to evaluate [...] Read more.
The Kabul River basin (KRB) of Afghanistan, a lifeline of around 10 million people, has multiplicity of governance, management, and development-related challenges leading to inequity, inadequacy, and unreliability of irrigation water distribution. Prior to any uplifting intervention, there is a need to evaluate the performance of irrigation system on a long term basis to identify the existing bottlenecks. Although there are several indicators available for the performance evaluation of the irrigation schemes, we used the coefficient of variation (CV) of actual evapotranspiration (ETa) in space (basin, sub-basin, and provincial level), relative evapotranspiration (RET), and temporal CV of RET, to assess the equity, adequacy, and reliability of water distribution, respectively, from 2003 to 2013. The ETa was estimated through a surface energy balance system (SEBS) algorithm and the ETa estimates were validated using the advection aridity (AA) method with a R2 value of 0.81 and 0.77 at Nawabad and Sultanpur stations, respectively. The global land data assimilation system (GLDAS) and moderate-resolution imaging spectroradiometer (MODIS) products were used as main inputs to the SEBS. Results show that the mean seasonal sub-based RET values during summer (May–September) (0.37 ± 0.06) and winter (October–April) (0.40 ± 0.08) are below the target values (RET ≥ 0.75) during 2003–2013. The CV of the mean ETa, within sub-basins and provinces for the entire study period, has an equitable distribution of water from October–January (0.09 ± 0.04), whereas the highest inequity (0.24 ± 0.08) in water distribution is during early summer. The range of the CV of the mean ETa (0.04–0.06) on a monthly and seasonal basis shows the unreliability of water supplies in several provinces or sub-basins. The analysis of the temporal CV of mean RET highlights the unreliable water supplies across the entire basin. The maximum ETa during the study period was estimated for the Shamal sub-basin (552 ± 43 mm) while among the provinces, Kunar experienced the highest ETa (544 ± 39 mm). This study highlights the dire need for interventions to improve the irrigation performance in time and space. The proposed methodology can be used as a framework for monitoring and implementing water distribution plans in future. Full article
Show Figures

Graphical abstract

22 pages, 14068 KiB  
Article
Land Cover Segmentation of Airborne LiDAR Data Using Stochastic Atrous Network
by Hasan Asy’ari Arief, Geir-Harald Strand, Håvard Tveite and Ulf Geir Indahl
Remote Sens. 2018, 10(6), 973; https://doi.org/10.3390/rs10060973 - 19 Jun 2018
Cited by 31 | Viewed by 7675
Abstract
Inspired by the success of deep learning techniques in dense-label prediction and the increasing availability of high precision airborne light detection and ranging (LiDAR) data, we present a research process that compares a collection of well-proven semantic segmentation architectures based on the deep [...] Read more.
Inspired by the success of deep learning techniques in dense-label prediction and the increasing availability of high precision airborne light detection and ranging (LiDAR) data, we present a research process that compares a collection of well-proven semantic segmentation architectures based on the deep learning approach. Our investigation concludes with the proposition of some novel deep learning architectures for generating detailed land resource maps by employing a semantic segmentation approach. The contribution of our work is threefold. (1) First, we implement the multiclass version of the intersection-over-union (IoU) loss function that contributes to handling highly imbalanced datasets and preventing overfitting. (2) Thereafter, we propose a novel deep learning architecture integrating the deep atrous network architecture with the stochastic depth approach for speeding up the learning process, and impose a regularization effect. (3) Finally, we introduce an early fusion deep layer that combines image-based and LiDAR-derived features. In a benchmark study carried out using the Follo 2014 LiDAR data and the NIBIO AR5 land resources dataset, we compare our proposals to other deep learning architectures. A quantitative comparison shows that our best proposal provides more than 5% relative improvement in terms of mean intersection-over-union over the atrous network, providing a basis for a more frequent and improved use of LiDAR data for automatic land cover segmentation. Full article
(This article belongs to the Special Issue Deep Learning for Remote Sensing)
Show Figures

Graphical abstract

29 pages, 4817 KiB  
Article
Combining a Two Source Energy Balance Model Driven by MODIS and MSG-SEVIRI Products with an Aggregation Approach to Estimate Turbulent Fluxes over Sparse and Heterogeneous Vegetation in Sahel Region (Niger)
by Bouchra Ait Hssaine, Jamal Ezzahar, Lionel Jarlan, Olivier Merlin, Said Khabba, Aurore Brut, Salah Er-Raki, Jamal Elfarkh, Bernard Cappelaere and Ghani Chehbouni
Remote Sens. 2018, 10(6), 974; https://doi.org/10.3390/rs10060974 - 19 Jun 2018
Cited by 8 | Viewed by 5950
Abstract
Estimates of turbulent fluxes (i.e., sensible and latent heat fluxes H and LE) over heterogeneous surfaces is not an easy task. The heterogeneity caused by the contrast in vegetation, hydric and soil conditions can generate a large spatial variability in terms of surface–atmosphere [...] Read more.
Estimates of turbulent fluxes (i.e., sensible and latent heat fluxes H and LE) over heterogeneous surfaces is not an easy task. The heterogeneity caused by the contrast in vegetation, hydric and soil conditions can generate a large spatial variability in terms of surface–atmosphere interactions. This study considered the issue of using a thermal-based two-source energy model (TSEB) driven by MODIS (Moderate resolution Imaging Spectroradiometer) and MSG (Meteosat Second Generation) observations in conjunction with an aggregation scheme to derive area-averaged H and LE over a heterogeneous watershed in Niamey, Niger (Wankama catchment). Data collected in the context of the African Monsoon Multidisciplinary Analysis (AMMA) program, including a scintillometry campaign, were used to test the proposed approach. The model predictions of area-averaged turbulent fluxes were compared to data acquired by a Large Aperture Scintillometer (LAS) set up over a transect about 3.2 km-long and spanning three vegetation types (millet, fallow and degraded shrubs). First, H and LE fluxes were estimated at the MSG-SEVIRI grid scale by neglecting explicitly the subpixel heterogeneity. Moreover, the impact of upscaling the model’s inputs was investigated using in-situ input data and three aggregation schemes of increasing complexity based on MODIS products: a simple averaging of inputs at the MODIS resolution scale, another simple averaging scheme that considers scintillometer footprint extent, and the weighted average of inputs based on the footprint weighting function. The H and LE simulated using the footprint weighted method were more accurate than for the two other aggregation rules despite the heterogeneity of the landscape. The statistical values are: correlation coefficient (R) = 0.71, root mean square error (RMSE) = 63 W/m2 and mean bias error (MBE) = −23 W/m2 for H and an R = 0.82, RMSE = 88 W/m2 and MBE = 45 W/m2 for LE. This study opens perspectives for the monitoring of convective and evaporative fluxes over heterogeneous landscape based on medium resolution satellite products. Full article
(This article belongs to the Special Issue Remote Sensing of Land-Atmosphere Interactions)
Show Figures

Graphical abstract

34 pages, 16499 KiB  
Article
A Hybrid Analytic Network Process and Artificial Neural Network (ANP-ANN) Model for Urban Earthquake Vulnerability Assessment
by Mohsen Alizadeh, Ibrahim Ngah, Mazlan Hashim, Biswajeet Pradhan and Amin Beiranvand Pour
Remote Sens. 2018, 10(6), 975; https://doi.org/10.3390/rs10060975 - 19 Jun 2018
Cited by 100 | Viewed by 11476
Abstract
Vulnerability assessment is one of the prerequisites for risk analysis in disaster management. Vulnerability to earthquakes, especially in urban areas, has increased over the years due to the presence of complex urban structures and rapid development. Urban vulnerability is a result of human [...] Read more.
Vulnerability assessment is one of the prerequisites for risk analysis in disaster management. Vulnerability to earthquakes, especially in urban areas, has increased over the years due to the presence of complex urban structures and rapid development. Urban vulnerability is a result of human behavior which describes the extent of susceptibility or resilience of social, economic, and physical assets to natural disasters. The main aim of this paper is to develop a new hybrid framework using Analytic Network Process (ANP) and Artificial Neural Network (ANN) models for constructing a composite social, economic, environmental, and physical vulnerability index. This index was then applied to Tabriz City, which is a seismic-prone province in the northwestern part of Iran with recurring devastating earthquakes and consequent heavy casualties and damages. A Geographical Information Systems (GIS) analysis was used to identify and evaluate quantitative vulnerability indicators for generating an earthquake vulnerability map. The classified and standardized indicators were subsequently weighed and ranked using an ANP model to construct the training database. Then, standardized maps coupled with the training site maps were presented as input to a Multilayer Perceptron (MLP) neural network for producing an Earthquake Vulnerability Map (EVM). Finally, an EVM was produced for Tabriz City and the level of vulnerability in various zones was obtained. South and southeast regions of Tabriz City indicate low to moderate vulnerability, while some zones of the northeastern tract are under critical vulnerability conditions. Furthermore, the impact of the vulnerability of Tabriz City on population during an earthquake was included in this analysis for risk estimation. A comparison of the result produced by EVM and the Population Vulnerability (PV) of Tabriz City corroborated the validity of the results obtained by ANP-ANN. The findings of this paper are useful for decision-makers and government authorities to obtain a better knowledge of a city’s vulnerability dimensions, and to adopt preparedness strategies in the future for Tabriz City. The developed hybrid framework of ANP and ANN Models can easily be replicated and applied to other urban regions around the world for sustainability and environmental management. Full article
Show Figures

Graphical abstract

22 pages, 2561 KiB  
Article
Physical Retrieval of Land Surface Emissivity Spectra from Hyper-Spectral Infrared Observations and Validation with In Situ Measurements
by Guido Masiello, Carmine Serio, Sara Venafra, Giuliano Liuzzi, Laurent Poutier and Frank-M. Göttsche
Remote Sens. 2018, 10(6), 976; https://doi.org/10.3390/rs10060976 - 20 Jun 2018
Cited by 37 | Viewed by 7261
Abstract
A fully physical retrieval scheme for land surface emissivity spectra is presented, which applies to high spectral resolution infrared observations from satellite sensors. The surface emissivity spectrum is represented with a suitably truncated Principal Component Analysis (PCA) transform and PCA scores are simultaneously [...] Read more.
A fully physical retrieval scheme for land surface emissivity spectra is presented, which applies to high spectral resolution infrared observations from satellite sensors. The surface emissivity spectrum is represented with a suitably truncated Principal Component Analysis (PCA) transform and PCA scores are simultaneously retrieved with surface temperature and atmospheric parameters. The retrieval methodology has been developed within the general framework of Optimal Estimation and, in this context, is the first physical scheme based on a PCA representation of the emissivity spectrum. The scheme has been applied to IASI (Infrared Atmospheric Sounder Interferometer) and the retrieved emissivities have been validated with in situ observations acquired during a field experiment carried out in 2017 at Gobabeb (Namib desert) validation station. It has been found that the retrieved emissivity spectra are independent of background information and in good agreement with in situ observations. Full article
Show Figures

Graphical abstract

18 pages, 9846 KiB  
Article
Parameterization of Spectral Particulate and Phytoplankton Absorption Coefficients in Sognefjord and Trondheimsfjord, Two Contrasting Norwegian Fjord Ecosystems
by Veloisa J. Mascarenhas and Oliver Zielinski
Remote Sens. 2018, 10(6), 977; https://doi.org/10.3390/rs10060977 - 20 Jun 2018
Cited by 4 | Viewed by 5164
Abstract
We present here parameterizations of particulate and phytoplankton absorption coefficients as functions of pigment concentrations (Tchla) in Sognefjord and Trondheimsfjord along the northwestern coast of Norway. The total particulate and non-algal optical densities were measured via quantitative filter technique (QFT) in a spectrophotometer [...] Read more.
We present here parameterizations of particulate and phytoplankton absorption coefficients as functions of pigment concentrations (Tchla) in Sognefjord and Trondheimsfjord along the northwestern coast of Norway. The total particulate and non-algal optical densities were measured via quantitative filter technique (QFT) in a spectrophotometer with integrating sphere. The spectral parameter coefficients A(λ) and E(λ) of the power law describing variations of particulate and phytoplankton absorption coefficients as a function of Tchla, were not only different from those provided for open ocean case 1 waters, but also exhibited differences in the two fjords under investigation. Considering the influence of glacial meltwater leading to increased inorganic sediment load in Sognefjord we investigate differences in two different parameterizations, developed by excluding and including inner Sognefjord stations. Tchla are modelled to test the parameterizations and validated against data from the same cruise and that from a repeated campaign. Being less influenced by non-algal particles parameterizations performed well in Trondheimsfjord and yielded high coefficients of determination (R2) of modelled vs. measured Tchla. In Sognefjord, the modelled vs. measured Tchla resulted in better R2 with parameter coefficients developed excluding the inner-fjord stations influenced by glacial meltwater influx. Full article
(This article belongs to the Special Issue Remote Sensing of Ocean Colour)
Show Figures

Graphical abstract

Review

Jump to: Research, Other

25 pages, 3950 KiB  
Review
Monitoring Groundwater Storage Changes Using the Gravity Recovery and Climate Experiment (GRACE) Satellite Mission: A Review
by Frédéric Frappart and Guillaume Ramillien
Remote Sens. 2018, 10(6), 829; https://doi.org/10.3390/rs10060829 - 25 May 2018
Cited by 233 | Viewed by 21422
Abstract
The Gravity Recovery and Climate Experiment (GRACE) satellite mission, which was in operation from March 2002 to June 2017, was the first remote sensing mission to provide temporal variations of Terrestrial Water Storage (TWS), which is the sum of the water masses that [...] Read more.
The Gravity Recovery and Climate Experiment (GRACE) satellite mission, which was in operation from March 2002 to June 2017, was the first remote sensing mission to provide temporal variations of Terrestrial Water Storage (TWS), which is the sum of the water masses that were contained in the soil column (i.e., snow, surface water, soil moisture, and groundwater), at a spatial resolution of a few hundred kilometers. As in situ level measurements are generally not sufficiently available for monitoring groundwater changes at the regional-scale, this unique dataset, combined with external information, is widely used to quantify the interannual variations of groundwater storage in the world’s major aquifers. GRACE-based groundwater changes revealed significant aquifer depletion over large regions, such as the Middle East, the northwest India aquifer, the North China Plain aquifer, the Murray-Darling Basin in Australia, the High Plains, and the California Central Valley aquifers in the United States of America (USA), but were also used to estimate groundwater-related parameters such as the specific yield, which relates groundwater level to storage, or to define the indices of groundwater depletion and stress. In this review, the approaches used for estimating groundwater storage variations are presented along with the main applications of GRACE data for groundwater monitoring. Issues that were related to the use of GRACE-based TWS are also addressed. Full article
(This article belongs to the Special Issue Remote Sensing of Groundwater from River Basin to Global Scales)
Show Figures

Figure 1

28 pages, 8661 KiB  
Review
Ten Years of TerraSAR-X Operations
by Stefan Buckreuss, Birgit Schättler, Thomas Fritz, Josef Mittermayer, Ralph Kahle, Edith Maurer, Johannes Böer, Markus Bachmann, Falk Mrowka, Egbert Schwarz, Helko Breit and Ulrich Steinbrecher
Remote Sens. 2018, 10(6), 873; https://doi.org/10.3390/rs10060873 - 5 Jun 2018
Cited by 32 | Viewed by 8519
Abstract
The satellite of the TerraSAR-X mission, called TSX, was launched on 15 June 2007 and its identically constructed twin satellite TDX, which is required by the mission TanDEM-X, launched on 21 June 2010. Together they supply high-quality radar data in order to serve [...] Read more.
The satellite of the TerraSAR-X mission, called TSX, was launched on 15 June 2007 and its identically constructed twin satellite TDX, which is required by the mission TanDEM-X, launched on 21 June 2010. Together they supply high-quality radar data in order to serve two mission goals: Scientific observation of Earth and the provisioning of remote sensing data for the commercial market (TerraSAR-X mission) and the generation of a global digital elevation model (DEM) of Earth’s surface (TanDEM-X mission). On the occasion of the 10th anniversary of the mission, the focus will be on the development of the TerraSAR-X system during this period, including the extension of the ground segment, the evolution of the product portfolio, dedicated mission campaigns, radar experiments, refinement of the satellite operations and orbit control, and the results of the performance monitoring. Despite numerous interventions in the overall system, we managed to incorporate new scientific and commercial requirements and to improve and enhance the overall system in order to fulfill the increasing demand for Earth observation data without noticeable interruptions to ongoing operations. Full article
(This article belongs to the Special Issue Ten Years of TerraSAR-X—Scientific Results)
Show Figures

Figure 1

24 pages, 2664 KiB  
Review
TerraSAR-X and Wetlands: A Review
by Christian Wohlfart, Karina Winkler, Anna Wendleder and Achim Roth
Remote Sens. 2018, 10(6), 916; https://doi.org/10.3390/rs10060916 - 10 Jun 2018
Cited by 36 | Viewed by 8184
Abstract
Since its launch in 2007, TerraSAR-X observations have been widely used in a broad range of scientific applications. Particularly in wetland research, TerraSAR-X’s shortwave X-band synthetic aperture radar (SAR) possesses unique capabilities, such as high spatial and temporal resolution, for delineating and characterizing [...] Read more.
Since its launch in 2007, TerraSAR-X observations have been widely used in a broad range of scientific applications. Particularly in wetland research, TerraSAR-X’s shortwave X-band synthetic aperture radar (SAR) possesses unique capabilities, such as high spatial and temporal resolution, for delineating and characterizing the inherent spatially and temporally complex and heterogeneous structure of wetland ecosystems and their dynamics. As transitional areas, wetlands comprise characteristics of both terrestrial and aquatic features, forming a large diversity of wetland types. This study reviews all published articles incorporating TerraSAR-X information into wetland research to provide a comprehensive study of how this sensor has been used with regard to polarization, and the function of the data, time-series analyses, or the assessment of specific wetland ecosystem types. What is evident throughout this literature review is the synergistic fusion of multi-frequency and multi-polarization SAR sensors, sometimes optical sensors, in almost all investigated studies to attain improved wetland classification results. Due to the short revisiting time of the TerraSAR-X sensor, it is possible to compute dense SAR time-series, allowing for a more precise observation of the seasonality in dynamic wetland areas as demonstrated in many of the reviewed studies. Full article
(This article belongs to the Special Issue Ten Years of TerraSAR-X—Scientific Results)
Show Figures

Figure 1

Other

Jump to: Research, Review

15 pages, 6424 KiB  
Letter
Random Forest Variable Importance Spectral Indices Scheme for Burnt Forest Recovery Monitoring—Multilevel RF-VIMP
by Sornkitja Boonprong, Chunxiang Cao, Wei Chen and Shanning Bao
Remote Sens. 2018, 10(6), 807; https://doi.org/10.3390/rs10060807 - 23 May 2018
Cited by 27 | Viewed by 6409
Abstract
Burnt forest recovery is normally monitored with a time-series analysis of satellite data because of its proficiency for large observation areas. Traditional methods, such as linear correlation plotting, have been proven to be effective, as forest recovery naturally increases with time. However, these [...] Read more.
Burnt forest recovery is normally monitored with a time-series analysis of satellite data because of its proficiency for large observation areas. Traditional methods, such as linear correlation plotting, have been proven to be effective, as forest recovery naturally increases with time. However, these methods are complicated and time consuming when increasing the number of observed parameters. In this work, we present a random forest variable importance (RF-VIMP) scheme called multilevel RF-VIMP to compare and assess the relationship between 36 spectral indices (parameters) of burnt boreal forest recovery in the Great Xing’an Mountain, China. Six Landsat images were acquired in the same month 0, 1, 4, 14, 16, and 20 years after a fire, and 39,380 fixed-location samples were then extracted to calculate the effectiveness of the 36 parameters. Consequently, the proposed method was applied to find correlations between the forest recovery indices. The experiment showed that the proposed method is suitable for explaining the efficacy of those spectral indices in terms of discrimination and trend analysis, and for showing the satellite data and forest succession dynamics when applied in a time series. The results suggest that the tasseled cap transformation wetness, brightness, and the shortwave infrared bands (both 1 and 2) perform better than other indices for both classification and monitoring. Full article
(This article belongs to the Special Issue Optical Remote Sensing of Boreal Forests)
Show Figures

Graphical abstract

18 pages, 15796 KiB  
Technical Note
Estimating Satellite-Derived Bathymetry (SDB) with the Google Earth Engine and Sentinel-2
by Dimosthenis Traganos, Dimitris Poursanidis, Bharat Aggarwal, Nektarios Chrysoulakis and Peter Reinartz
Remote Sens. 2018, 10(6), 859; https://doi.org/10.3390/rs10060859 - 1 Jun 2018
Cited by 185 | Viewed by 26931
Abstract
Bathymetry mapping forms the basis of understanding physical, economic, and ecological processes in the vastly biodiverse coastal fringes of our planet which are subjected to constant anthropogenic pressure. Here, we pair recent advances in cloud computing using the geospatial platform of the Google [...] Read more.
Bathymetry mapping forms the basis of understanding physical, economic, and ecological processes in the vastly biodiverse coastal fringes of our planet which are subjected to constant anthropogenic pressure. Here, we pair recent advances in cloud computing using the geospatial platform of the Google Earth Engine (GEE) with optical remote sensing technology using the open Sentinel-2 archive, obtaining low-cost in situ collected data to develop an empirical preprocessing workflow for estimating satellite-derived bathymetry (SDB). The workflow implements widely used and well-established algorithms, including cloud, atmospheric, and sun glint corrections, image composition and radiometric normalisation to address intra- and inter-image interferences before training, and validation of four SDB algorithms in three sites of the Aegean Sea in the Eastern Mediterranean. Best accuracy values for training and validation were R2 = 0.79, RMSE = 1.39 m, and R2 = 0.9, RMSE = 1.67 m, respectively. The increased accuracy highlights the importance of the radiometric normalisation given spatially independent calibration and validation datasets. Spatial error maps reveal over-prediction over low-reflectance and very shallow seabeds, and under-prediction over high-reflectance (<6 m) and optically deep bottoms (>17 m). We provide access to the developed code, allowing users to map bathymetry by customising the time range based on the field data acquisition dates and the optical conditions of their study area. Full article
(This article belongs to the Collection Google Earth Engine Applications)
Show Figures

Figure 1

11 pages, 4707 KiB  
Letter
Dual-Polarized Backscatter Features of Surface Currents in the Open Ocean during Typhoon Lan (2017)
by Guosheng Zhang and William Perrie
Remote Sens. 2018, 10(6), 875; https://doi.org/10.3390/rs10060875 - 5 Jun 2018
Cited by 6 | Viewed by 3871
Abstract
Ocean surface current measurements from satellites have historically been limited. We propose a new approach to detect ocean surface currents as observed by dual-polarized (VV and VH) spaceborne synthetic aperture radar (SAR). This approach is based on the assumptions that the VH-polarized SAR [...] Read more.
Ocean surface current measurements from satellites have historically been limited. We propose a new approach to detect ocean surface currents as observed by dual-polarized (VV and VH) spaceborne synthetic aperture radar (SAR). This approach is based on the assumptions that the VH-polarized SAR signal is only generated by the effects of ocean winds creating surface waves, whereas the VV-polarization data are due to the effects of both ocean winds and surface currents. Therefore, the surface currents features may be extracted after retrieving the ocean winds from VH-polarized backscatter and inputting signal due to the wind to the VV-polarized backscatter data. To investigate the performance of this approach under extreme wind conditions, we consider a scene of C-band RADARSAT-2 dual-polarized ScanSAR images over Typhoon Lan (2017) in the open ocean, and we verify our results with current estimates from altimeter data. The ocean current features extracted from the backscatter data that were collected from the SAR images are shown to correspond to an area of strong currents and an oceanic front observed by altimeters. We suggest that the proposed method has the potential capacity to provide information about ocean surface currents from high-resolution dual-polarized ScanSAR images. Full article
(This article belongs to the Special Issue Ocean Surface Currents: Progress in Remote Sensing and Validation)
Show Figures

Graphical abstract

15 pages, 1498 KiB  
Technical Note
Mean Composite Fire Severity Metrics Computed with Google Earth Engine Offer Improved Accuracy and Expanded Mapping Potential
by Sean A. Parks, Lisa M. Holsinger, Morgan A. Voss, Rachel A. Loehman and Nathaniel P. Robinson
Remote Sens. 2018, 10(6), 879; https://doi.org/10.3390/rs10060879 - 5 Jun 2018
Cited by 128 | Viewed by 18075 | Correction
Abstract
Landsat-based fire severity datasets are an invaluable resource for monitoring and research purposes. These gridded fire severity datasets are generally produced with pre- and post-fire imagery to estimate the degree of fire-induced ecological change. Here, we introduce methods to produce three Landsat-based fire [...] Read more.
Landsat-based fire severity datasets are an invaluable resource for monitoring and research purposes. These gridded fire severity datasets are generally produced with pre- and post-fire imagery to estimate the degree of fire-induced ecological change. Here, we introduce methods to produce three Landsat-based fire severity metrics using the Google Earth Engine (GEE) platform: The delta normalized burn ratio (dNBR), the relativized delta normalized burn ratio (RdNBR), and the relativized burn ratio (RBR). Our methods do not rely on time-consuming a priori scene selection but instead use a mean compositing approach in which all valid pixels (e.g., cloud-free) over a pre-specified date range (pre- and post-fire) are stacked and the mean value for each pixel over each stack is used to produce the resulting fire severity datasets. This approach demonstrates that fire severity datasets can be produced with relative ease and speed compared to the standard approach in which one pre-fire and one post-fire scene are judiciously identified and used to produce fire severity datasets. We also validate the GEE-derived fire severity metrics using field-based fire severity plots for 18 fires in the western United States. These validations are compared to Landsat-based fire severity datasets produced using only one pre- and post-fire scene, which has been the standard approach in producing such datasets since their inception. Results indicate that the GEE-derived fire severity datasets generally show improved validation statistics compared to parallel versions in which only one pre-fire and one post-fire scene are used, though some of the improvements in some validations are more or less negligible. We provide code and a sample geospatial fire history layer to produce dNBR, RdNBR, and RBR for the 18 fires we evaluated. Although our approach requires that a geospatial fire history layer (i.e., fire perimeters) be produced independently and prior to applying our methods, we suggest that our GEE methodology can reasonably be implemented on hundreds to thousands of fires, thereby increasing opportunities for fire severity monitoring and research across the globe. Full article
(This article belongs to the Collection Google Earth Engine Applications)
Show Figures

Graphical abstract

17 pages, 5863 KiB  
Technical Note
Comparison of SNAP-Derived Sentinel-2A L2A Product to ESA Product over Europe
by Najib Djamai and Richard Fernandes
Remote Sens. 2018, 10(6), 926; https://doi.org/10.3390/rs10060926 - 12 Jun 2018
Cited by 43 | Viewed by 14613
Abstract
Sentinel-2 is a constellation of two satellites launched by the European Space Agency (ESA), respectively on 23 June 2015 and 7 March 2017, to map geophysical parameters over land surfaces. ESA provides Level 2 bottom-of-atmosphere reflectance (BOA) products (ESA-L2A) for Europe, with plans [...] Read more.
Sentinel-2 is a constellation of two satellites launched by the European Space Agency (ESA), respectively on 23 June 2015 and 7 March 2017, to map geophysical parameters over land surfaces. ESA provides Level 2 bottom-of-atmosphere reflectance (BOA) products (ESA-L2A) for Europe, with plans for operational global coverage, as well as the Sen2Cor (S2C) offline processor. In this study, aerosol optical thickness (AOT), precipitable water vapour (WVP) and surface reflectance from ESA-L2A products are compared with S2C output when using identical input Level 1 radiance products. Additionally, AOT and WVP are validated against reference measurement. As ESA and S2C share the same input and atmospheric correction algorithm, it was hypothesized that they should show identical validation performance and that differences between products should be negligible in comparison to the uncertainty of retrieved geophysical parameters due to radiometric uncertainty alone. Validation and intercomparison was performed for five clear-sky growing season dates for each of three ESA-L2A tiles selected to span a range of vegetation and topography as well as to be close to the AERONET measurement site. Validation of S2C (ESA) products using AERONET site measurements indicated an overall root mean square error (RMSE) of 0.06 (0.07) and a bias of 0.05 (0.09) for AOT and 0.20 cm (0.22 cm) and the bias was −0.02 cm (−0.10 cm) for WVP. Intercomparison of S2C-L2A and ESA-L2A showed an overall agreement higher than 99% for scene classification (SCL) maps and negligible differences for WVP (RMSE under 0.09 and R2 above 0.99). Larger disagreement was observed for aerosol optical thickness (AOT) (RMSE up to 0.04 and R2 as low as 0.14). For BOA reflectance, disagreement between products depends on vegetation cover density, topography slope and spectral band. The largest differences were observed for red-edge and infrared bands in mountainous vegetated areas (RMSE up to 4.9% reflectance and R2 as low as 0.53). These differences are of similar magnitude to the radiometric calibration requirements for the Sentinel 2 imager. The differences had minimal impact of commonly used vegetation indices (NDVI, NDWI, EVI), but application of the Sentinel Level 2 biophysical processor generally resulted in proportional differences in most derived vegetation parameters. It is recommended that the consistency of ESA and S2C products should be improved by the developers of the ESA and S2C processors. Full article
(This article belongs to the Collection Sentinel-2: Science and Applications)
Show Figures

Figure 1

Previous Issue
Next Issue
Back to TopTop