Article

Seasonal and Decadal Groundwater Changes in African Sedimentary Aquifers Estimated Using GRACE Products and LSMs

1
British Geological Survey, the Lyell Centre, Research Avenue South, Edinburgh EH14 4AP, UK
2
Institute for Risk and Disaster Reduction, University College London, Gower Street, London WC1E 6BT, UK
3
Department of Geography, University College London, Gower Street, London WC1E 6BT, UK
4
British Geological Survey, Environmental Science Centre, Keyworth NG12 5GG, UK
*
Author to whom correspondence should be addressed.
Remote Sens. 2018, 10(6), 904; https://doi.org/10.3390/rs10060904
Submission received: 4 April 2018 / Revised: 31 May 2018 / Accepted: 5 June 2018 / Published: 8 June 2018
(This article belongs to the Special Issue Remote Sensing of Groundwater from River Basin to Global Scales)

Abstract

:
Increased groundwater abstraction is important to the economic development of Africa and to achieving many of the Sustainable Development Goals. However, there is little information on long-term or seasonal groundwater trends due to a lack of in situ monitoring. Here, we used GRACE data from three products (the Centre for Space Research land solution (CSR), the Jet Propulsion Laboratory’s Global Mascon solution (JPL-MSCN), and the Centre National D’etudes Spatiales / Groupe de Recherches de Géodésie Spatiale solution (GRGS)), to examine terrestrial water storage (TWS) changes in 12 African sedimentary aquifers, to examine relationships between TWS and rainfall , and estimate groundwater storage (GWS) changes using four Land Surface Models (LSMs) (Community Land Model (CLM2.0), the Variable Infiltration Capacity model (VIC), the Mosaic model (MOSAIC) and the Noah model (NOAH)). We find that there are no substantial continuous long-term decreasing trends in groundwater storage from 2002 to 2016 in any of the African basins, however, consistent rising groundwater trends amounting to ~1 km3/year and 1.5 km3/year are identified in the Iullemmeden and Senegal basins, respectively, and longer term variations in ΔTWS in several basins associated with rainfall patterns. Discrete seasonal ΔTWS responses of ±1–5 cm/year are indicated by GRACE for each of the basins, with the exception of the Congo, North Kalahari, and Senegal basins, which display larger seasonal ΔTWS equivalent to approx. ±11–20 cm/year. The different seasonal responses in ΔTWS provide useful information about groundwater, including the identification of 5 to 9 month accumulation periods of rainfall in many semi-arid and arid basins as well as differences in ΔTWS responses between Sahelian and southern African aquifers to similar rainfall, likely reflecting differences in landcover. Seasonal ΔGWS estimated by combining GRACE ΔTWS with LSM outputs compare inconsistently to available in situ measurements of groundwater recharge from different basins, highlighting the need to further develop the representation of the recharge process in LSMs and the need for more in situ observations from piezometry.

Graphical Abstract

1. Introduction

Groundwater supplies an estimated 36% of all global domestic water and 42% of agricultural water [1] and its use is forecast to continue to rise in response to economic and population growth [2,3]. This is particularly the case in Africa where other sources of water are often scarce or unreliable and groundwater offers an affordable means of increasing access to secure water and reducing poverty [4,5]. With increased abstraction come concerns about over-exploitation and depletion of groundwater storage. Already it is estimated that globally, groundwater storage is being mined at a rate of approximately 150–200 km3 per year [6,7], which although a small proportion of the estimated global groundwater reserves [8], can lead to several unwanted impacts. These can include: falling water tables [9,10], which are associated with the failure of shallow wells and springs [11], the ingress of poor quality water into aquifers [12,13], and the deterioration of aquatic ecosystems [14,15]. Groundwater depletion also contributes to sea-level rise through the net transfer of water from long-term terrestrial storage to the ocean [3], which may contribute 0.4 to 0. 6 mm per year to sea level rise [6,7].
Recent quantitative maps of African groundwater storage and potential borehole yields [16] highlights the potential for groundwater resources to support increased water and food security, improving health, and reducing poverty [5]. The study estimates groundwater stored in African aquifers to be more than 0.5 million km3 representing a freshwater resource that is of a fundamentally different scale to that available from surface water in Africa [16]. However, if groundwater resources are to be increasingly abstracted across Africa to underpin development, climate adaptation, and achievement of the Sustainable Development Goals [2,17,18] it will be important to monitor changes in groundwater storage to forecast and mitigate unwanted human or environmental impacts of abstraction. The most reliable methods for monitoring changes in groundwater storage are through a network of properly located and designed observation boreholes which monitor changes in groundwater levels over a long-term period. However, systematic groundwater monitoring in Africa is rare, and there are only isolated locations where groundwater is monitored for more than one or two years in places unaffected by abstraction (e.g., South Africa, Uganda, and Ghana), and few examples of data sequences that last for more than a decade [19,20,21,22].
In the absence of widespread in situ groundwater monitoring data, remotely sensed data can provide an opportunity to gather observations of groundwater behaviour at a river basin, aquifer, or continental scale. In particular, the launch of the Gravity Recovery and Climate Experiment (GRACE) satellite mission generated considerable interest in the use of remotely sensed data for a wide variety of hydrological applications [23]. Since March 2002, the GRACE satellites have provided independent monthly models of the Earth’s gravity field at a spatial resolution of approximately 200,000 km2 [24]. Consistent seasonal variations in the data have been shown to relate to terrestrial water mass variations at the Earth’s surface [24,25]; data have been widely used at a river basin [26] and continent scale to estimate groundwater storage variations [27,28,29,30,31,32], ice sheet and glacier mass loss [33,34,35], drought events [36,37]; as well as a validation for hydrological models [38,39,40].
Interpretation of data from the GRACE satellites provides an integrated measure of monthly terrestrial water mass changes over a footprint of approximately 450 × 450 km. Observed data and/or hydrological models need to be used in conjunction with GRACE data to determine how individual components of terrestrial water storage (TWS) such as groundwater storage relate to the total relative monthly change (i.e., ΔTWS) indicated by GRACE.
Validation studies demonstrate that GRACE data show a close correspondence to in situ groundwater data (to within 10%) e.g., [28] in areas where changes in terrestrial water mass are dominated by groundwater storage, and GRACE data can be related directly to the groundwater mass where long-term depletion is occurring e.g., [25]. There is significant interest, therefore, to use GRACE data to identify and characterise groundwater storage changes within data-poor regions in conjunction with other remotely sensed datasets (rainfall and soil moisture).
This paper examines GRACE data and output from Land Surface Models (LSMs) for each of the major sedimentary aquifers across Africa to determine: (i) if GRACE data can be used to reliably characterise and differentiate the annual and long term terrestrial water mass storage changes in each groundwater basin; and (ii) what, if any, long-term trends and seasonal behaviour in groundwater storage (GWS) can be identified in Africa over the last 15 years using different GRACE products and LSMs. These outputs are then interpreted to help inform groundwater response to climate and abstraction.

2. Materials and Methods

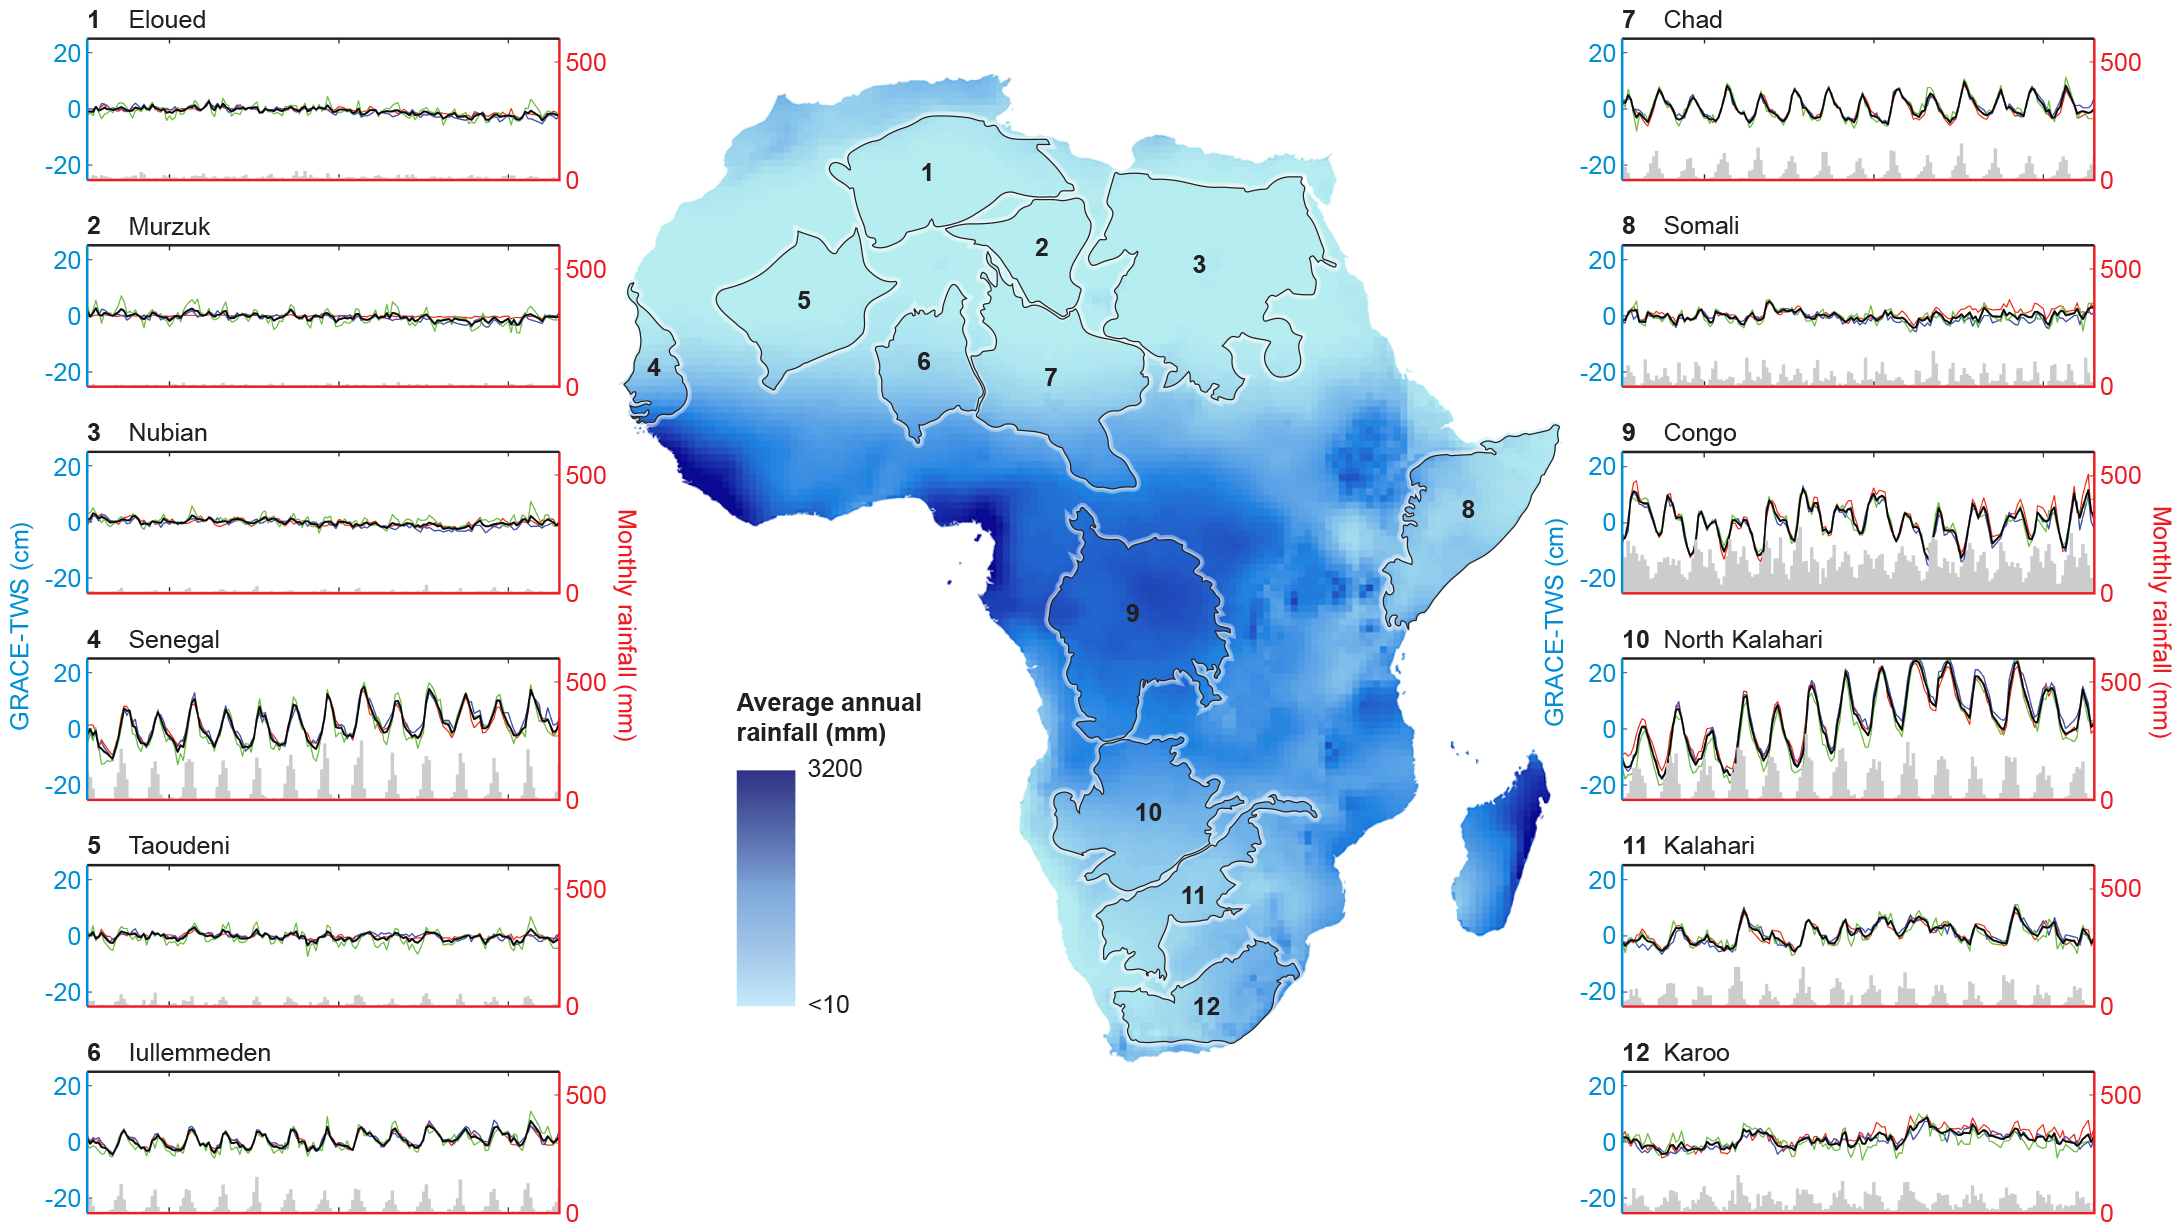
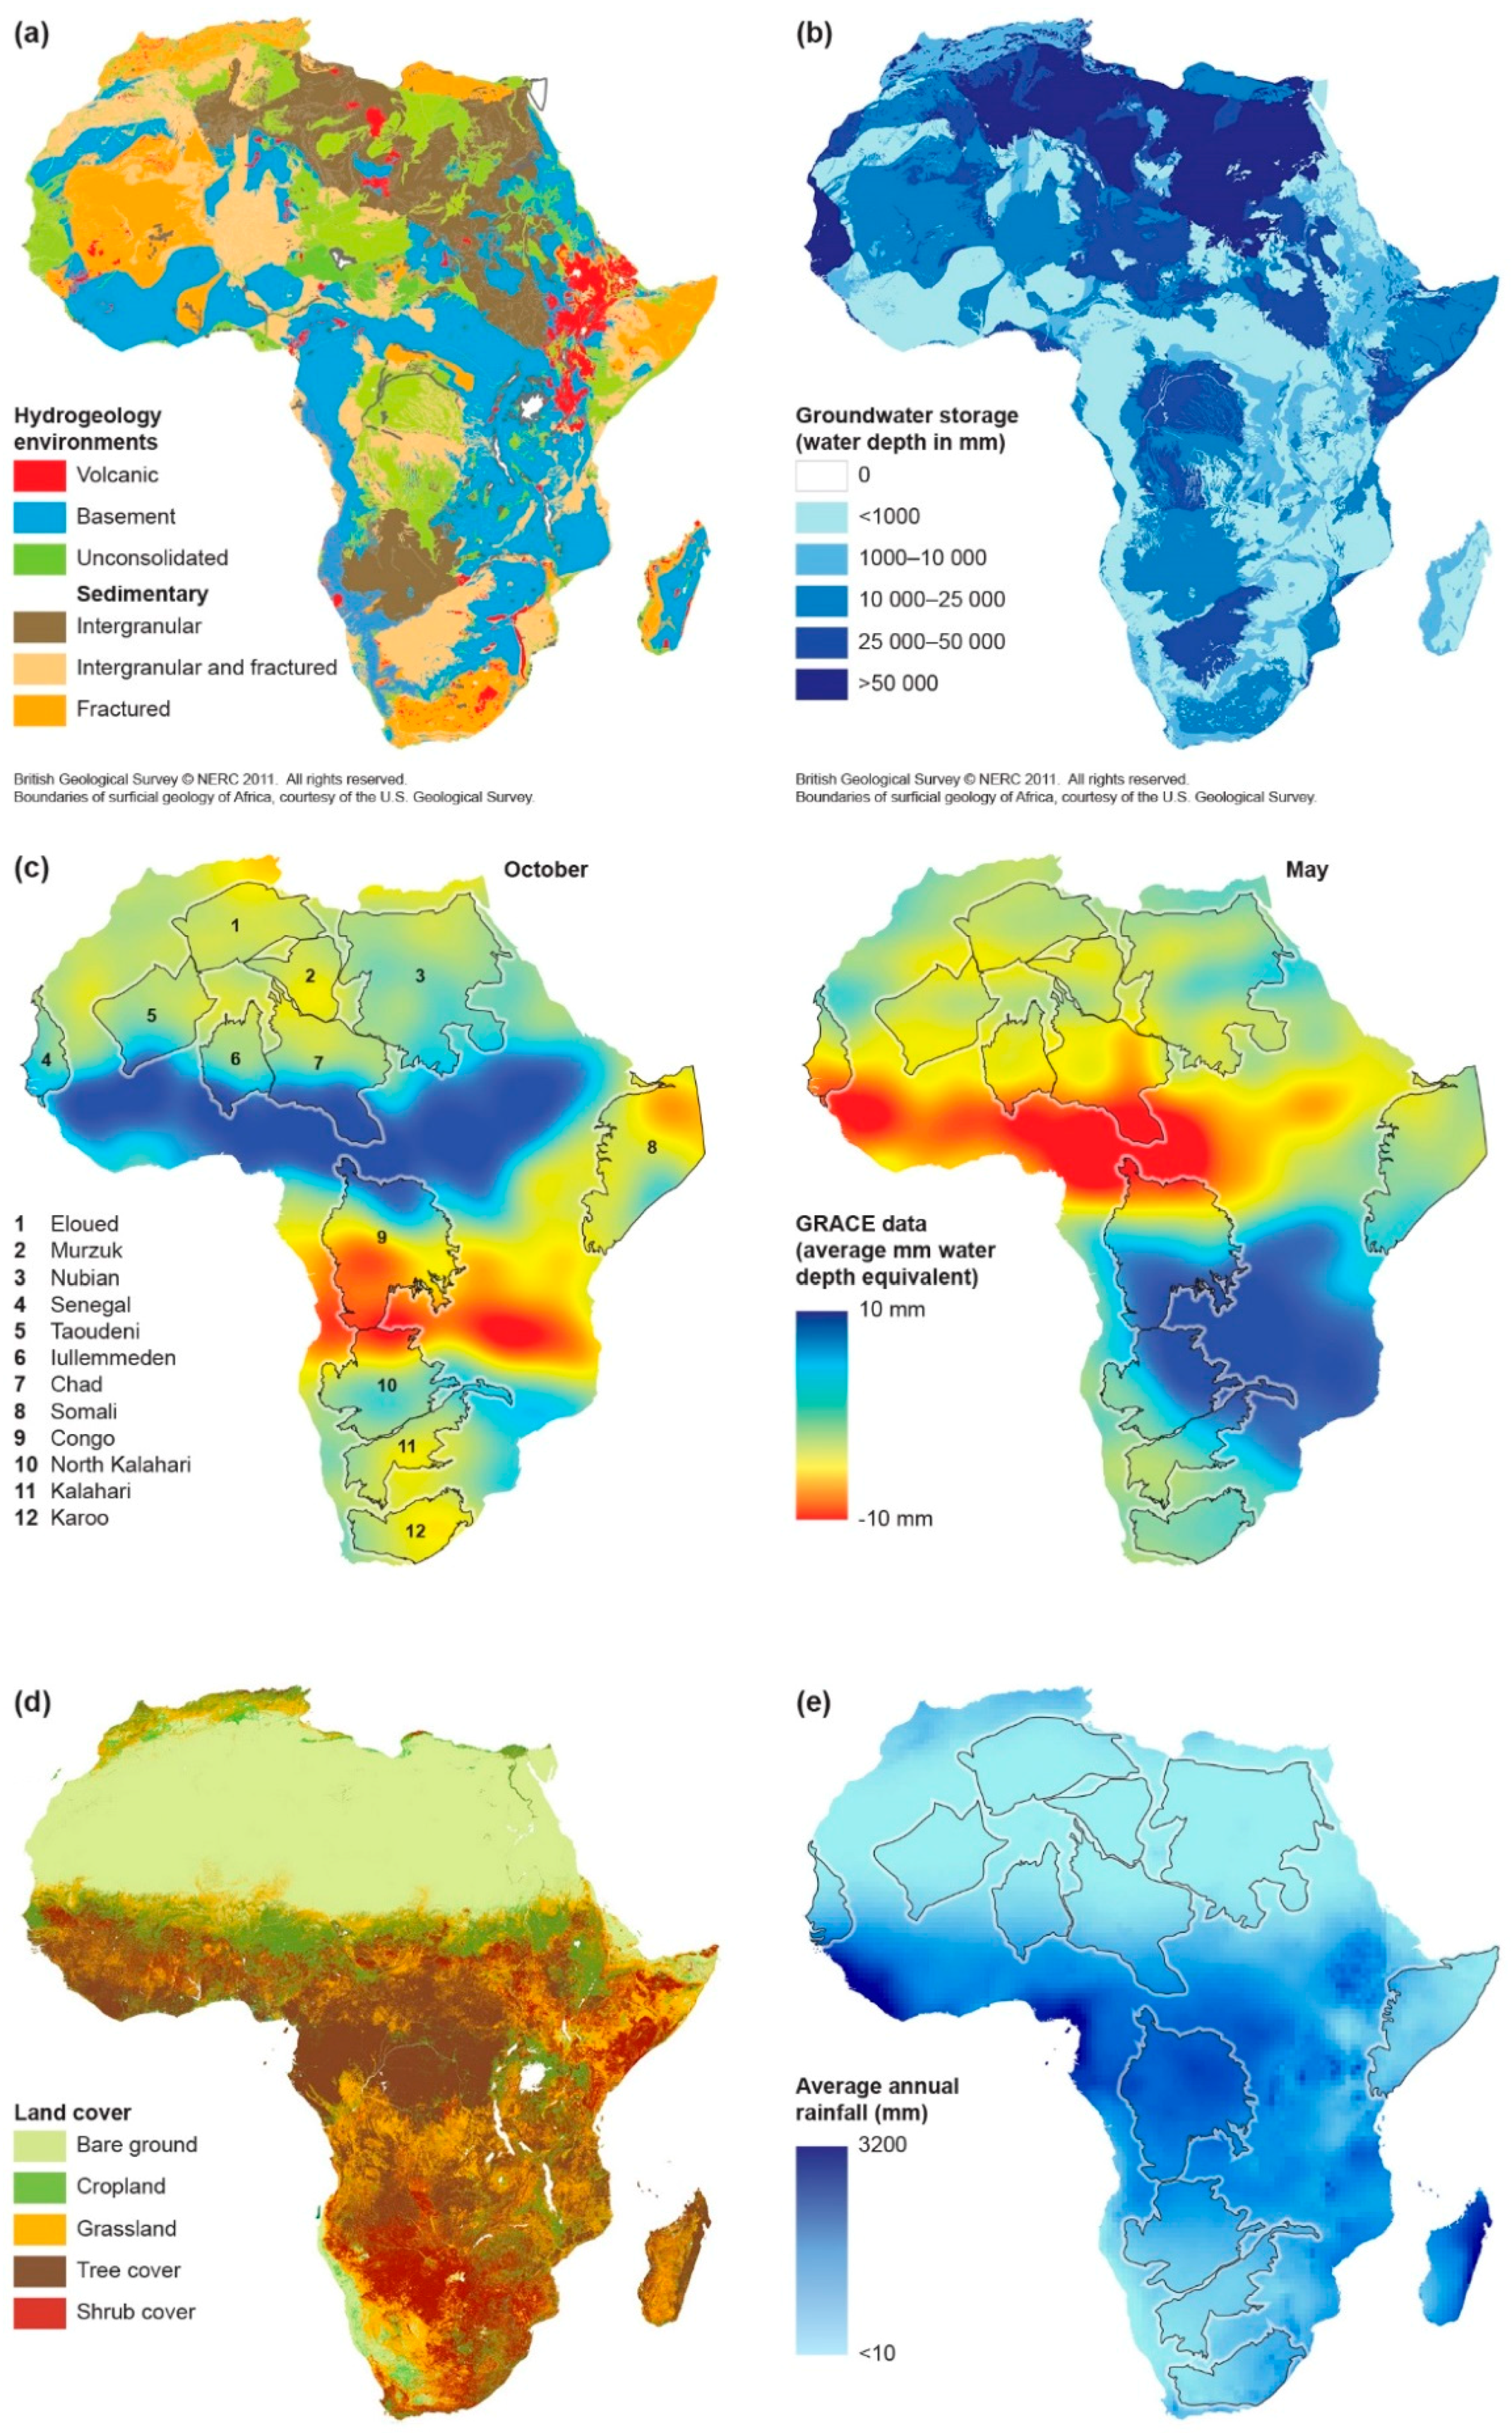
2.1. Groundwater Basins in Africa

The major sedimentary aquifer basins in Africa were selected as the focus of this study, as these aquifers hold the largest groundwater reserves in the continent. Recent research has estimated groundwater storage in the sedimentary aquifers in northern Africa could be as high as 75 × 106 m3 per km2 [16], with sedimentary basins within the rest of Africa containing a considerable proportion of the remaining groundwater in the continent (Figure 1). Away from these basins, groundwater storage is much less (by one or two orders of magnitude) as a result of the lower porosity rock types and much thinner effective aquifers (Figure 1). Precambrian basement rocks generally comprise aquifers with the least storage, where average groundwater volumes are estimated to be 0.5 × 10⁶ m3 km−2 [16].
The major sedimentary basins are located in a range of climate zones across Africa (see summary data in Table 1), and provide an opportunity to examine differences in groundwater storage dynamics between seasonally wet areas (e.g., Senegal and North Kalahari basins) where groundwater is being actively recharged, and arid areas (e.g., North African basins). Basin boundaries were identified using an adapted 1:5 million scale geological map of Africa which divides the geology into hydrogeologically significant units and classifies sedimentary rocks into the major basins to which they belong [16] (Figure 1). The GRACE, Tropical Rainfall Measuring Mission (TRMM), and LSMs datasets used by this study were then all extracted to these areas.

2.2. ΔTWS and ΔGWS Estimates from GRACE and Land Surface Models (LSMs)

We apply post-processed, gridded (1° × 1°) monthly GRACE solutions for the period of August 2002 to July 2016: the Centre for Space Research land solution (CSR) [42,43] and the Jet Propulsion Laboratory’s Global Mascon solution (JPL-MSCN) [44,45] from NASA’s GRCTellus data dissemination site (http://grace.jpl.nasa.gov/data), and a third GRACE solution, GRGS (release RL03-v1) [46] from the French government space agency, Centre National D’études Spatiales (CNES) Groupe de Recherches de Géodésie Spatiale (GRGS). To address uncertainty associated with different GRACE processing strategies (GRCTellus, JPL-Mascons, GRGS) and the later derivation of ΔGWS, we apply an ensemble mean of the three GRACE ΔTWS. A brief description of all three GRACE products is provided below.
GRCTellus CSR land solution (version RL05.DSTvSCS1409) is post-processed from spherical harmonics released by the Centre for Space Research (CSR) at the University of Texas at Austin. GRCTellus gridded datasets are available at a monthly timestep and a spatial resolution of 1° × 1° (~111 km at equator) though the actual spatial resolution of GRACE footprint is ~450 km or ~200,000 km2 [27]. To amplify TWS signals we apply the dimensionless scaling factors provided as 1° × 1° bins that are derived from minimising differences between TWS estimated from GRACE and the hydrological fields from the Community Land Model (CLM4.0) [43]. JPL-Mascons (version RL05M_1.MSCNv01) data processing involves the same glacial isostatic adjustment correction but applies no spatial filtering as JPL-RL05M directly relates inter-satellite range-rate data to mass concentration blocks (Mascons) to estimate monthly gravity fields in terms of equal area 3° × 3° mass concentration functions in order to minimise measurement errors. Gridded mascon fields are provided at a spatial sampling of 0.5° in both latitude and longitude (~56 km at the equator). Similar to the GRCTellus CSR product, dimensionless scaling factors are provided as 0.5° × 0.5° bins [31] that also derive from the Community Land Model (CLM4.0) [45]. The scaling factors are multiplicative coefficients that minimize the difference between the smoothed and unfiltered monthly ΔTWS variations from the CLM4.0 hydrology model [45]. GRGS monthly GRACE products (version RL03-v1) are processed and made publicly available (http://grgs.obs-mip.fr/grace) by CNES [31]. Further details on the Earth’s mean gravity-field models can be found on the CNES official website of GRGS (http://grgs.obs-mip.fr/grace/).
GRACE ΔTWS time-series data have some missing records as the satellites were switched off periodically to conserve battery life [31]; these missing records are linearly interpolated (Shamsudduha et al., 2012). Monthly ΔTWS time-series data as equivalent water depth (cm) are extracted from GRACE TWS datasets by using basin boundaries in R environment (raster package) [47] and taking the mean values aggregating the grid points within each basin. Residual mean error in TWS after processing is estimated to be <2 cm in the basins of interest [43].
We use the TRMM [48] monthly rainfall product (3B43 version 7) with the GRACE products within the statistical analysis of this work, as it shown to best represent the distribution of tropical rainfall. The monthly TRMM data from 2002 to 2016 of 0.25° × 0.25° spatial resolution were aggregated to 1° × 1°grids, to be the same as GRACE and LSMs data.
Most authors e.g., [26,49] trace changes in regional-scale groundwater storage (GWS) by computing total terrestrial water storage anomalies (ΔTWS) from one or more GRACE products and deducting changes in other terrestrial stores simulated by LSMs, which in Africa comprise changes in soil moisture (ΔSMS) and surface water (ΔSWS) storage (Equation (1)).
ΔGWS = ΔTWS − (ΔSMS + ΔSWS)
To derive ΔGWS from GRACE ΔTWS (Equation (1)), we use simulated soil moisture to represent ΔSMS and surface runoff, as a proxy for ΔSWS [50,51], from LSMs within NASA’s Global Land Data Assimilation System (GLDAS). GLDAS is an uncoupled land surface modelling system that includes multiple global LSMs [52], driven by the observed surface atmospheric fields of Sheffield et al. (2006). We apply monthly ΔSMS and surface runoff data at a spatial resolution of 1° × 1° from 4 GLDAS LSMs: the Community Land Model (CLM, version 2) [53], the Noah model (NOAH) (version 2.7.1) [54], the Variable Infiltration Capacity (VIC) model (version 1.0) [55], and the Mosaic model (MOSAIC) (version 1.0) [56]. The respective total depths of modelled soil profiles are 3.4 m, 2.0 m, 1.9 m, and 3.5 m in CLM (10 vertical layers), NOAH (4 vertical layers), VIC (3 vertical layers), and MOSAIC (3 vertical layers) [52]. In the absence of in situ ΔSMS and ΔSWS data in the study areas, we apply an ensemble mean of three ΔGWS estimates and the 4 LSMs-derived ΔSMS and ΔSWS data in order to disaggregate GRACE ΔTWS signals across our study regions, for the period August 2002 to July 2016, similar to the approach applied for other locations by Shamsudduha et al., [31,57]. Canopy and snow water storage are not considered within equation 1 as we assume the relative contribution of these terrestrial water stores to be small in Africa compared to other water stores (soil moisture, groundwater, and surface water).

2.3. Statistical Methods

Our analysis of the GRACE ΔTWS and ΔGWS signals is based on the linear model:
y = M β + ε
where y = [ y ( t 1 ) , y ( t 2 ) , , y ( t n ) ] T is a length n vector of observations of a product at times t i , M is a n × q matrix containing values of q covariates which explain a proportion of the variation of y , β is a length q vector of regression coefficients and ε = [ ε 1 , ε 2 , , ε n ] T is a length n vector of model residuals that are independent realizations from a Gaussian random variable with mean zero and variance σ 2 . The M β term is referred to as the fixed effects.
Initially, we consider the time-scales over which the products vary. For each GRACE ΔTWS and ΔGWS product we estimate a model where the fixed effects are constant and the matrix M consists of a single column of 1s. We denote the estimated residual variance for this model by σ 0 2 . Then we expand the fixed effects to include a seasonal term by adding two additional columns to M equal to sin ( 2 π m i 12 ) and cos ( 2 π m i 12 ) where m i is the number of the month of the year in which the observation was made. We record the proportion by which the inclusion of these terms reduce the residual variance. Finally, we add a cubic temporal trend to the model. Thus q = 6 and the additional columns contain the values of t i , t i 2 , and t i 3 . Again we calculate the proportion of the σ 0 2 which has been explained by the fixed effects and record the additional proportion that was explained by the cubic trend. The proportions of the variance explained by the sinusoid and cubic terms correspond to the proportion of the variation in the product that can be explained by regular seasonal patterns of variation and longer-term multi-annual trends, respectively.
We consider the proportion of variation in the GRACE ΔTWS products that can be explained by modelled rainfall and the time-scale over which the response to rainfall occurs. Again, our baseline model assumes constant fixed effects. We then add a second term to the fixed effects proportional to the accumulated rainfall over the previous m r months. We vary m r between 1 and 20 and find the value which explains the largest proportion of variation of each product. We note that for both sets of models we do not include temporal correlation amongst the residuals since the long-term and seasonal trends would not be discernible from the patterns of variation that result from this correlation.

3. Results and Discussion

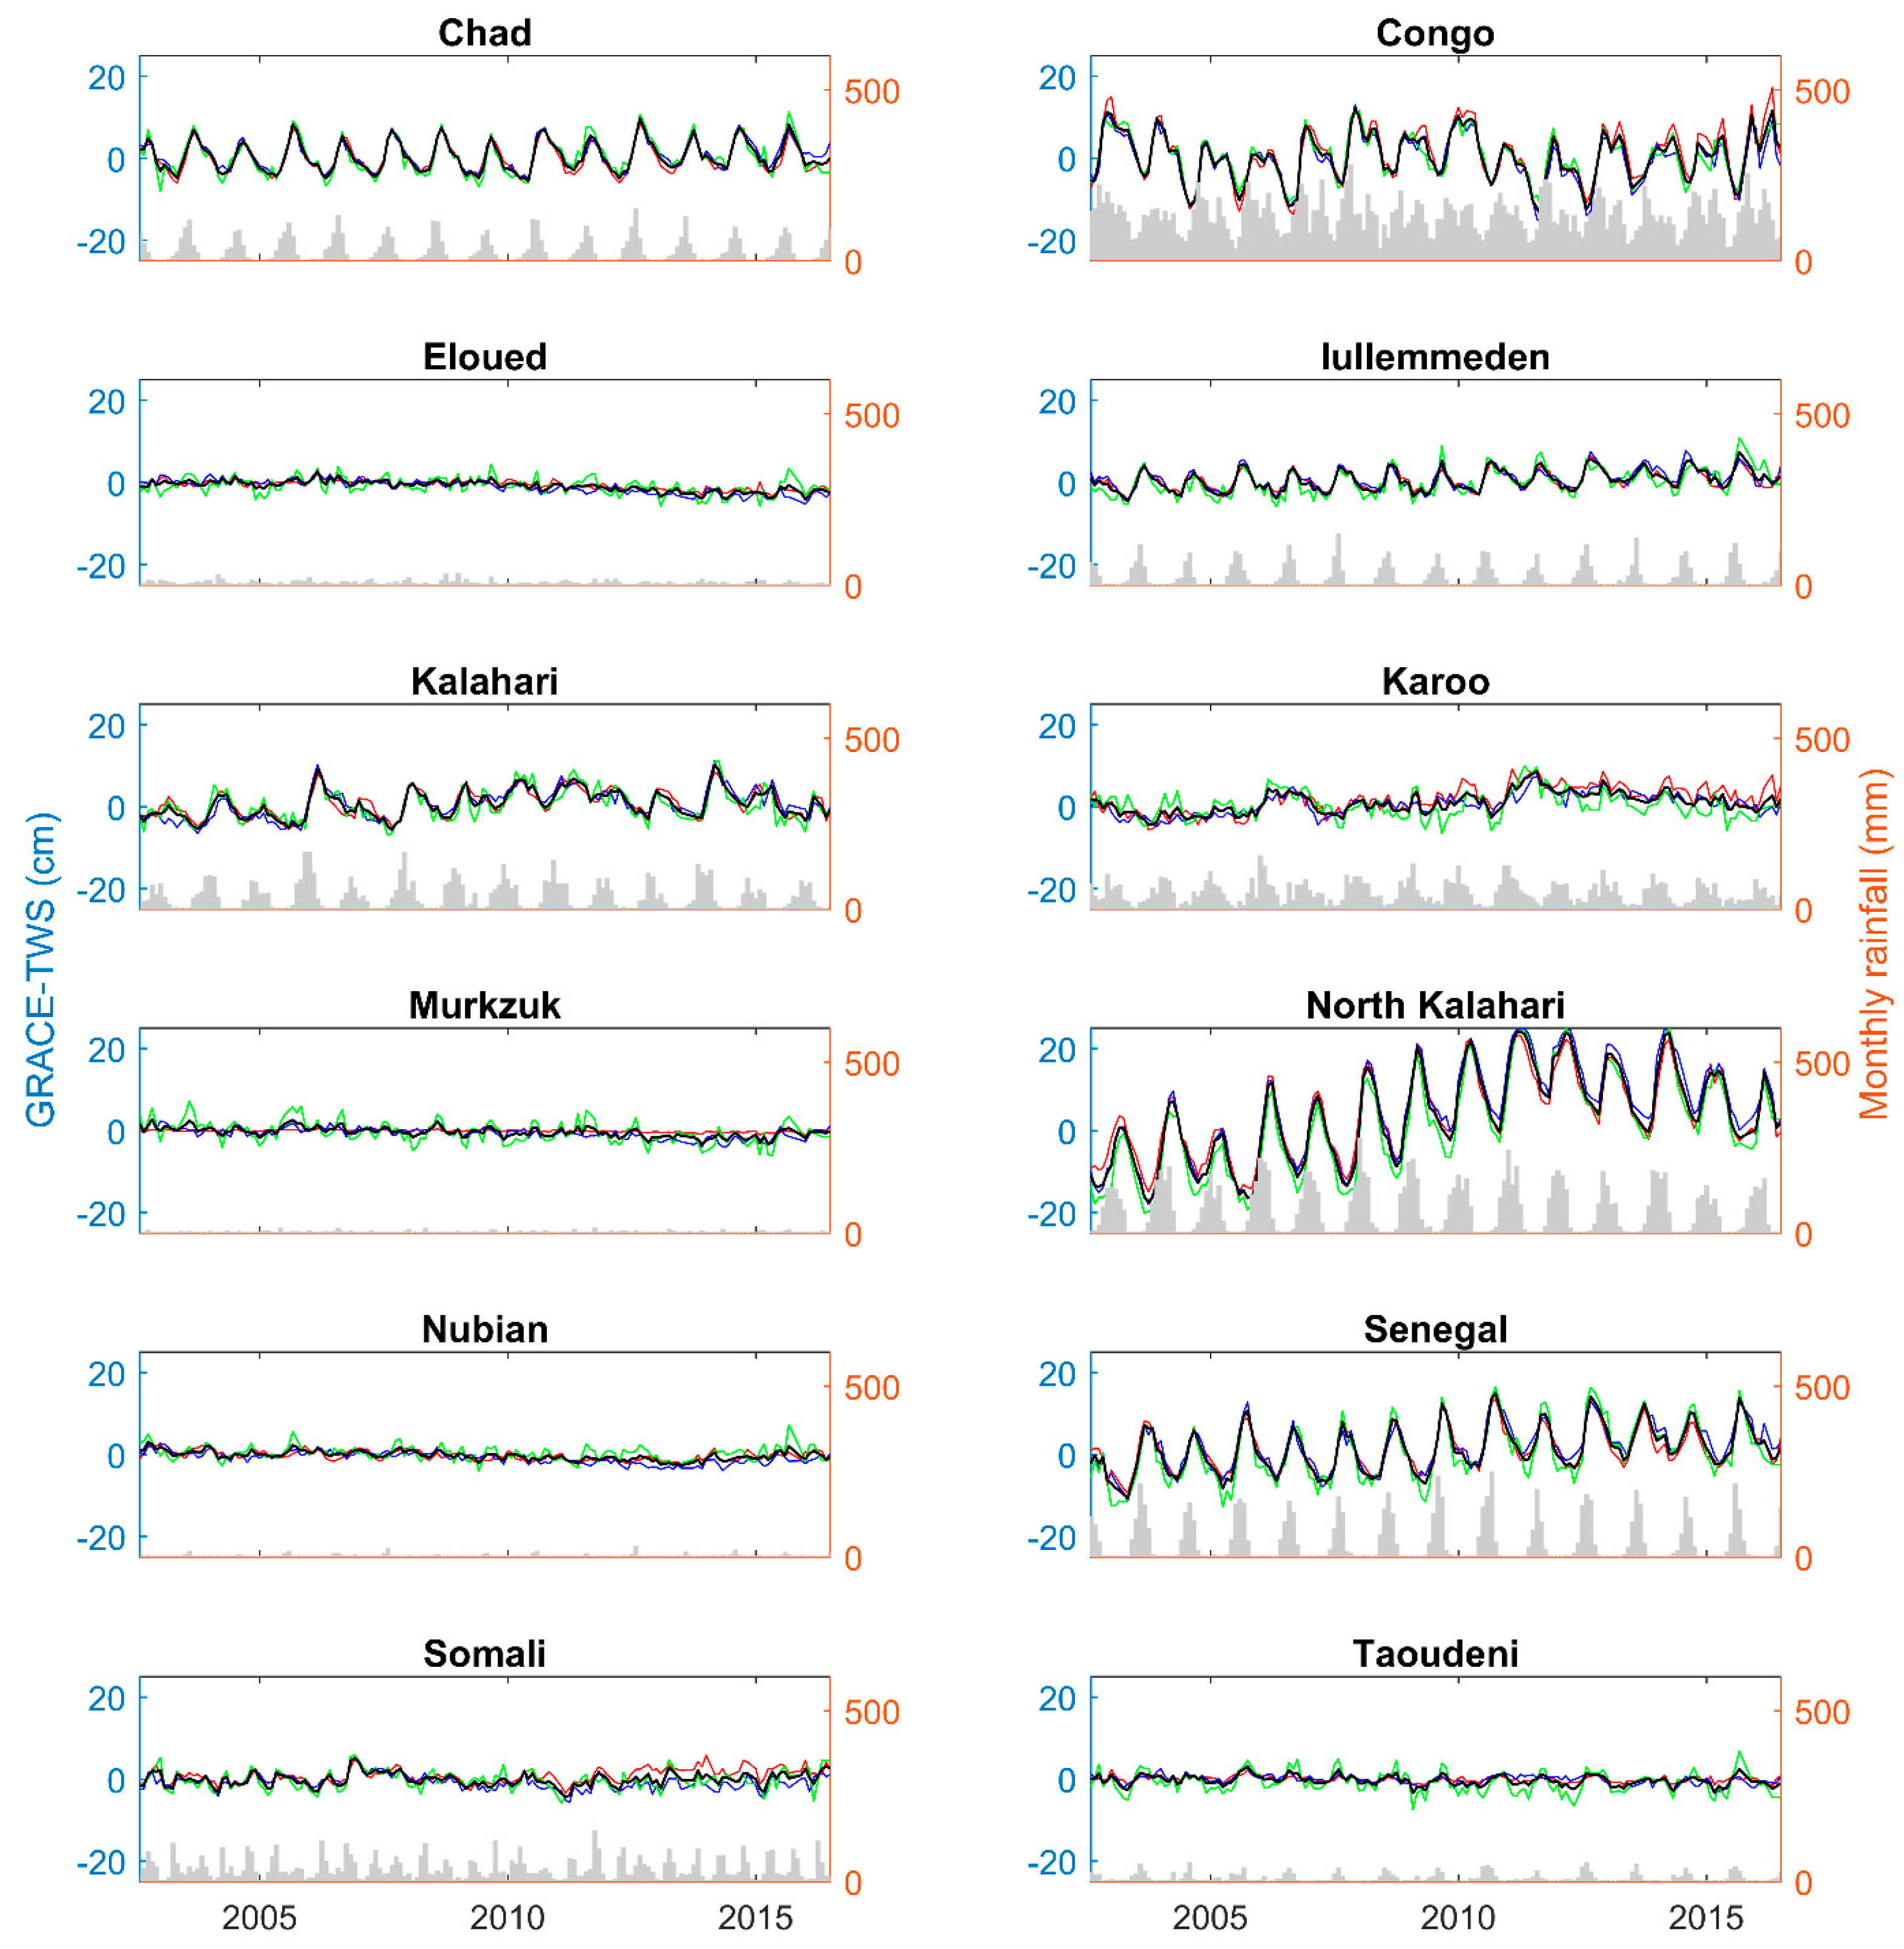
3.1. ΔTWS Patterns Across the Major Aquifer Basins in Africa

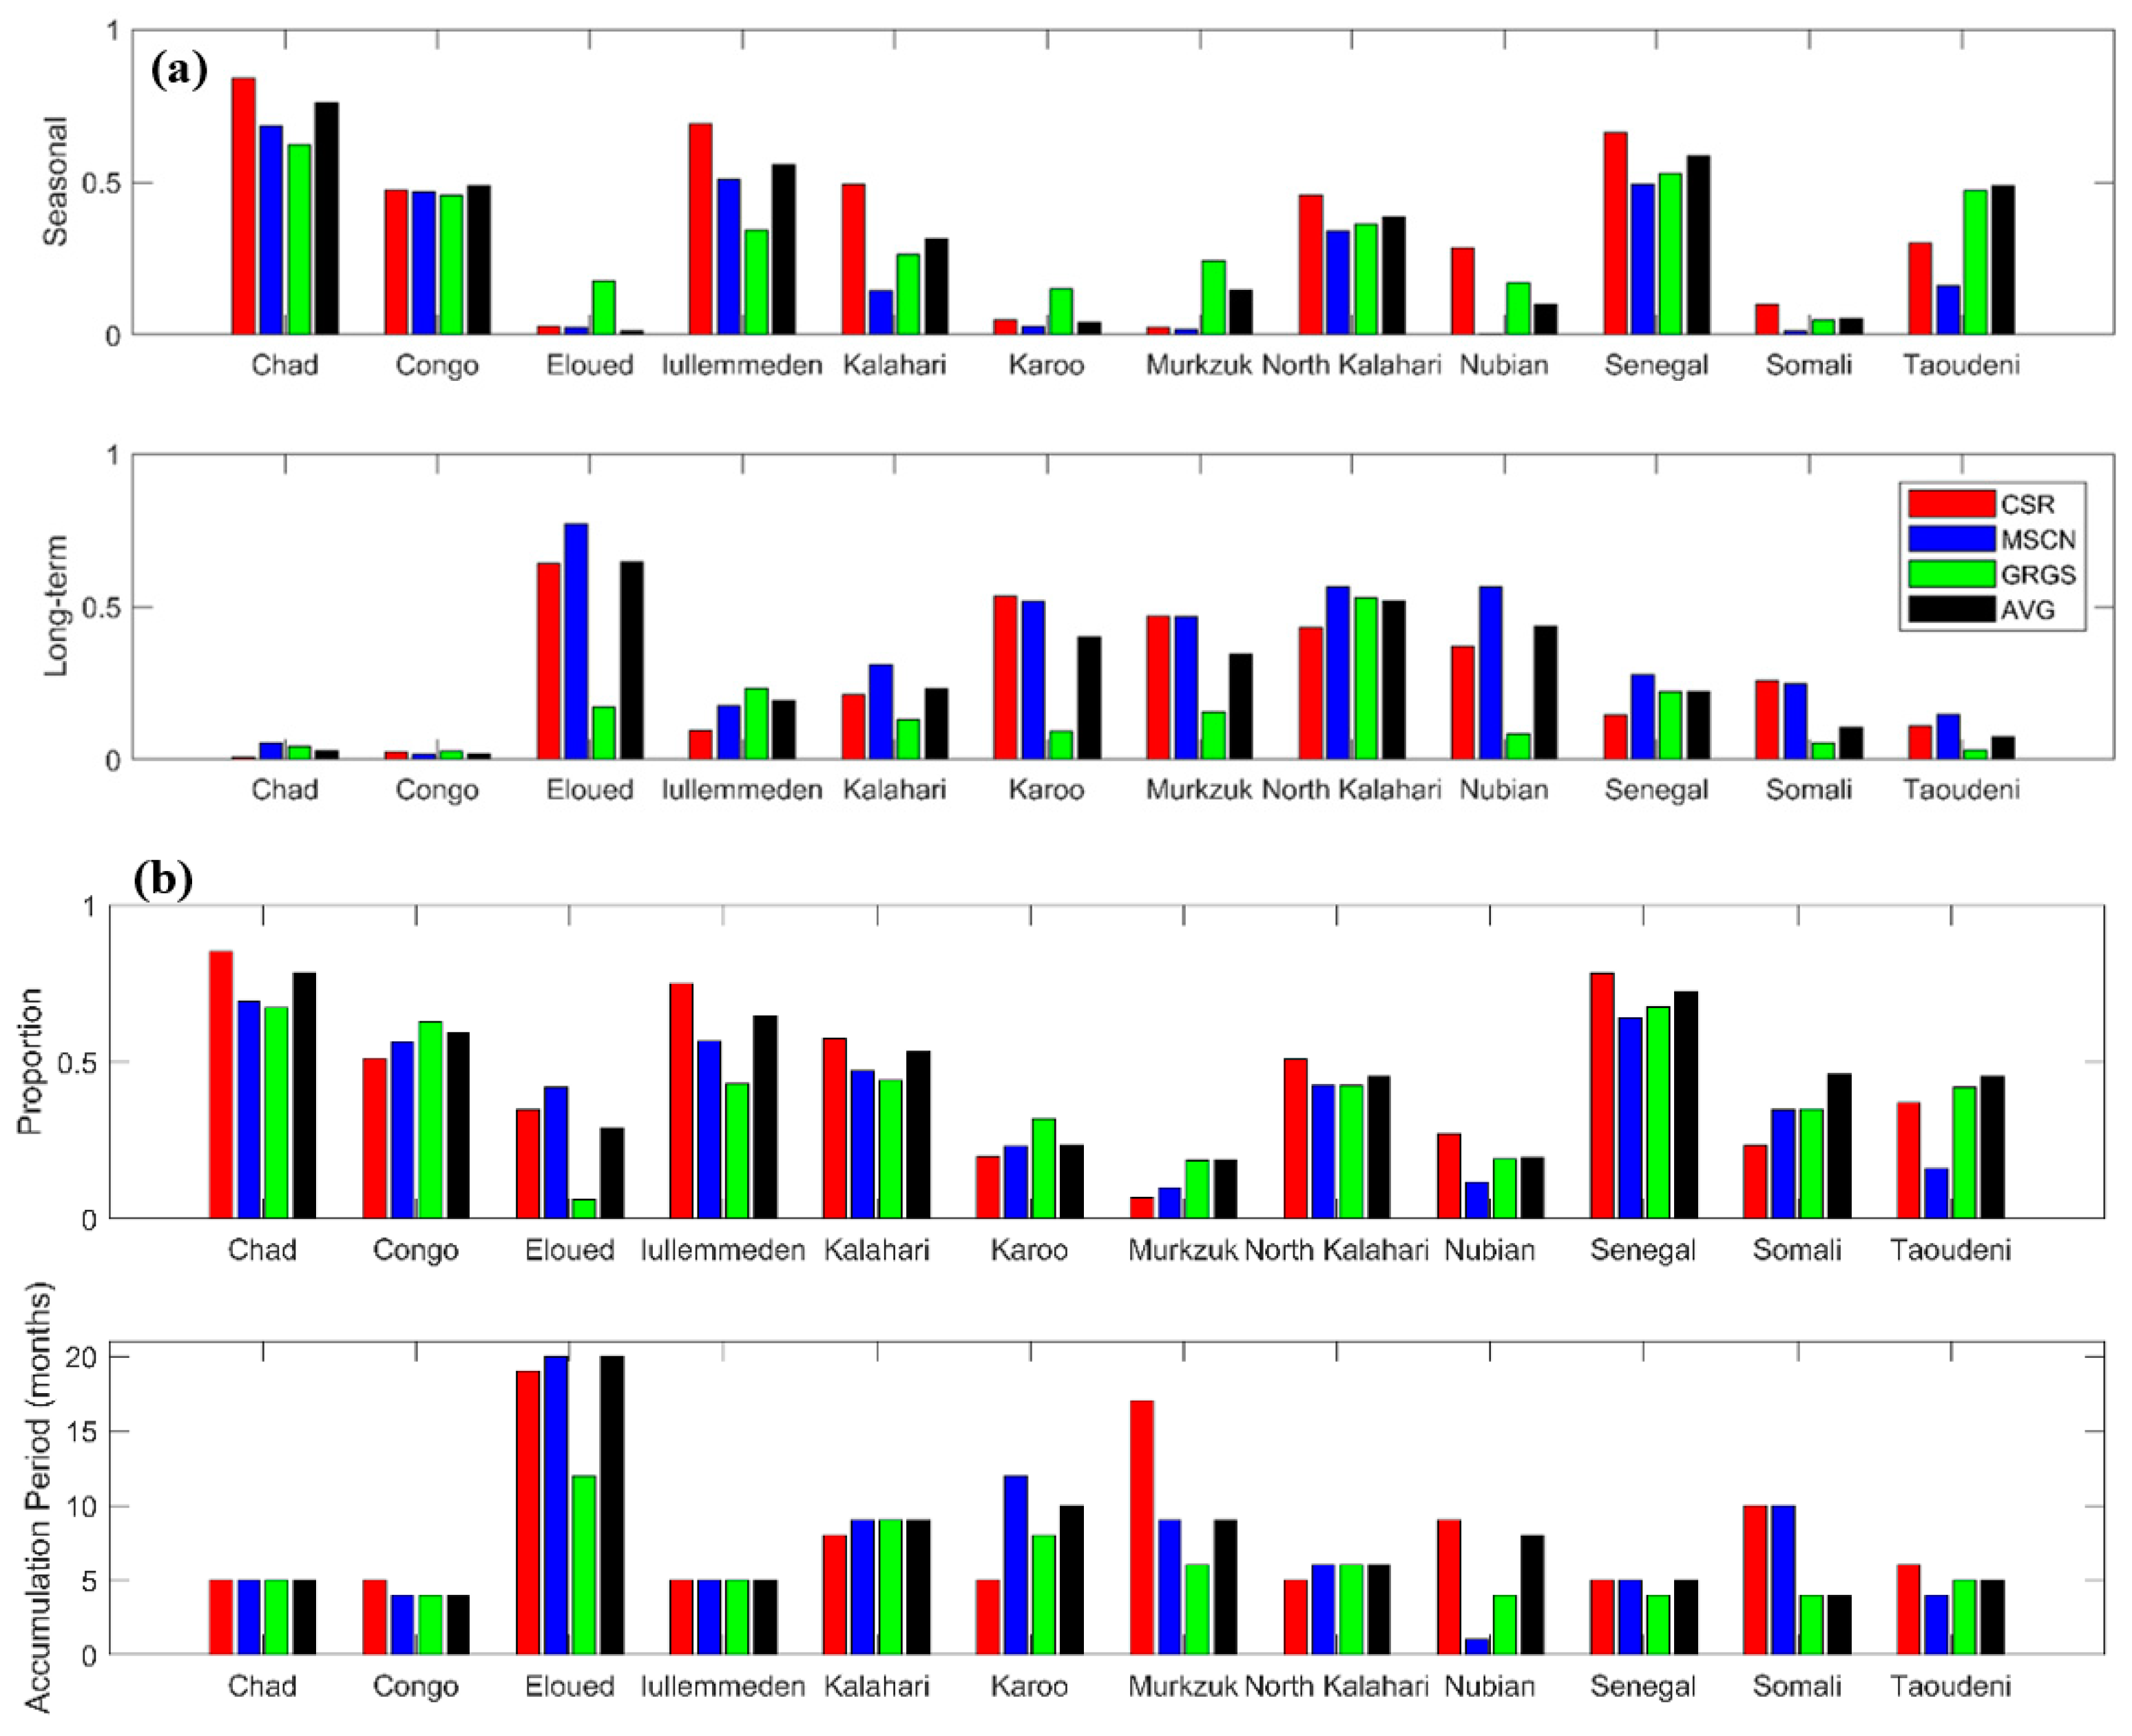
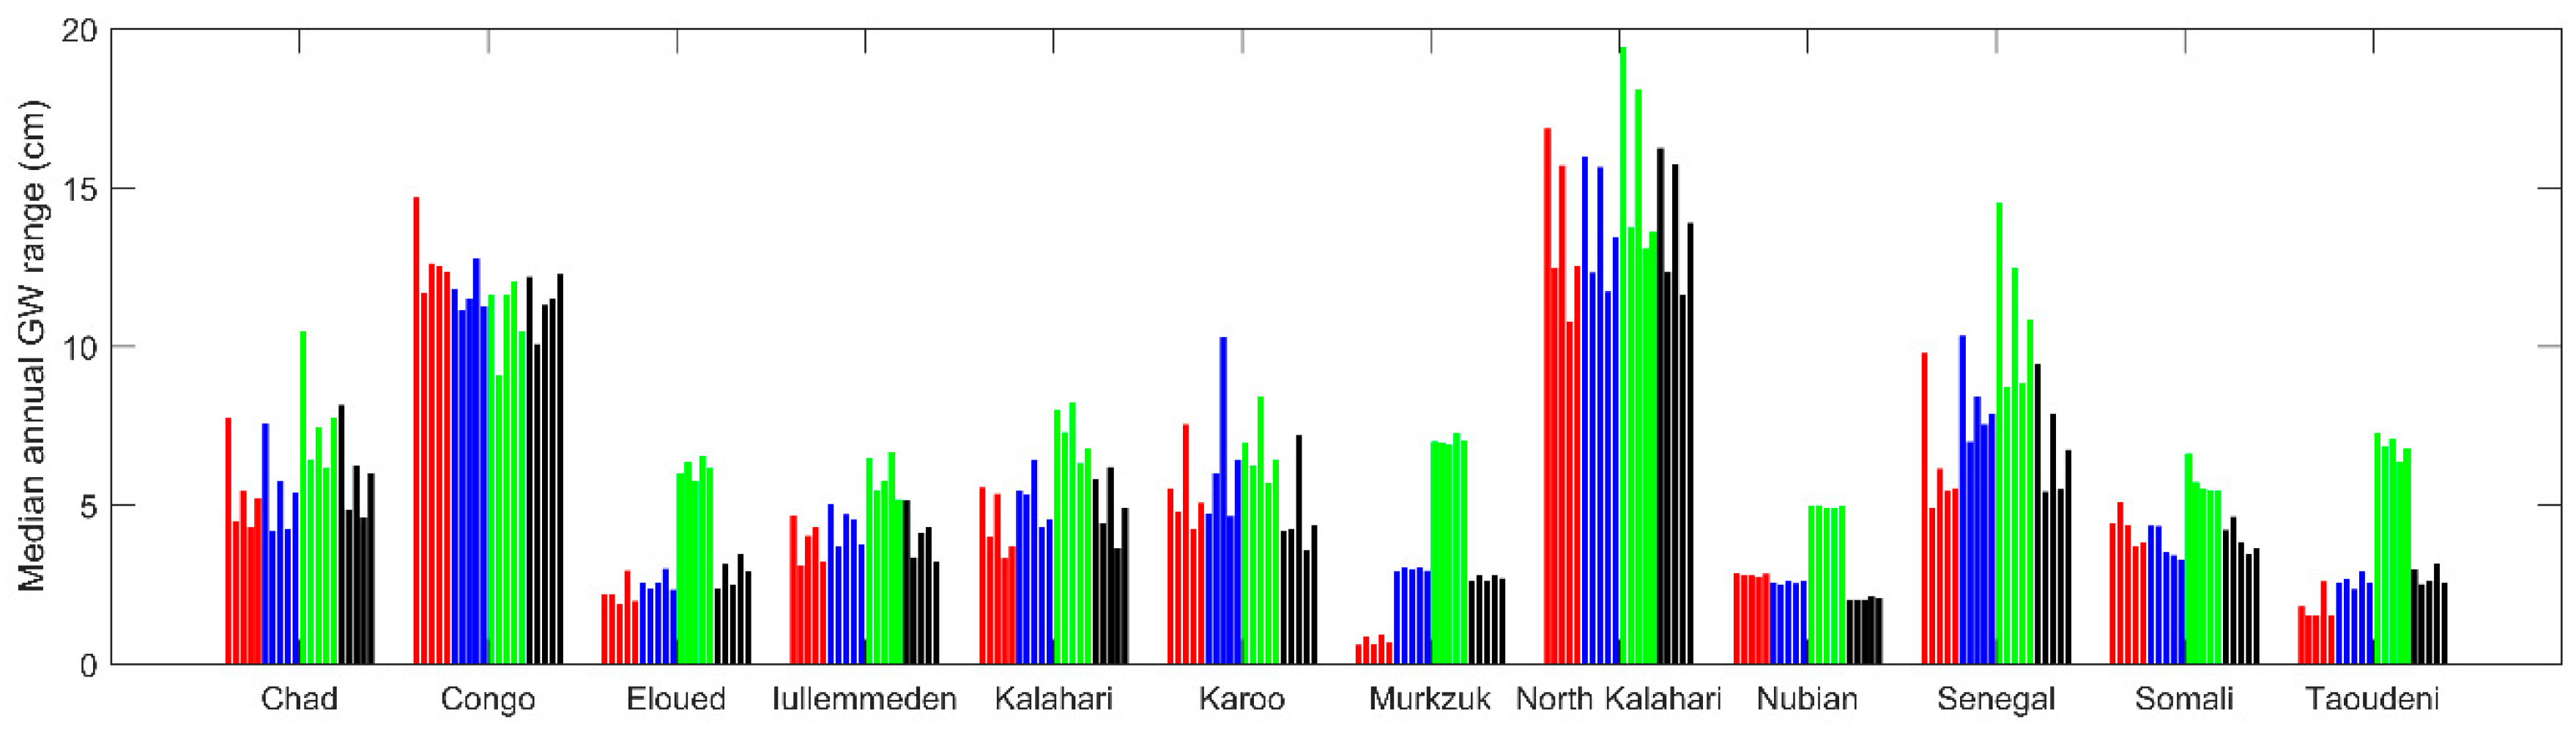
3.1.1. Seasonality of TWS Changes

Discrete consistent patterns of seasonal ΔTWS characterise each of the major sedimentary aquifer basins studied (Figure 2). A clear distinction exists between aquifers which show consistent annual periodicity in ΔTWS, and aquifers characterised by smaller, irregular ΔTWS (Figure 2).
Within seven of the basins (Chad, Congo, Iullemmeden, Kalahari, North Kalahari, Senegal, Taoudeni), 30 to 75% of the variance in ΔTWS is explained by seasonal responses (Figure 3). The annual periodicity in ΔTWS within these individual basins is remarkably consistent both in frequency and amplitude across the 15-year time-series (Figure 2). The greatest amplitudes of seasonal ΔTWS, equivalent to a ΔTWS anomaly of approximately 20 cm water depth equivalent, are observed in the wetter Congo, North Kalahari, and Senegal basins, Figure 2. For all seven basins, linear modelling indicates rainfall input accounts for a substantial component of the seasonal TWS variations (Table 1). We find the periodicity of the TWS variations generally best accounted for when rainfall is accumulated by 5 to 9 months (Figure 2 and Figure 3). Similar strength of correlations between ΔTWS and TRMM rainfall were found in the Horn of Africa [58] with lags between peak rainfall and peak ΔTWS of 1–2 months. The correspondence of accumulated rainfall to TWS and variations between basins reflects the duration of the annual rains and processes of soil saturation, infiltration, storage, and recharge processes within each of the basins according to the different land cover. Lateral movement of local runoff from highland areas to storage in lowland areas and wetlands has been shown to progressively shift the phase of peak ΔTWS [59], and the timing of ΔTWS annual peaks have also been demonstrated to be sensitive to the depth of the zero flux plane, where infiltrating water is committed to groundwater storage [60].
Within the other five basins (Eloued, Murzuk, Nubian, Somali, and Karoo), less than 25% of the variance of the TWS variations is explained by seasonal responses (Figure 2 and Figure 3). However up to 50% of TWS variation is related to rainfall (Figure 3) with the remaining signal unaccounted for. This unexplained variance is likely to be related to direct land-surface atmospheric feedbacks [61], local water use (e.g., irrigation abstractions), and noise in the TWS signal and processing [43].
Differences between the seasonal response of the southern African aquifer basins of the Karoo and Kalahari aquifer basins and the Sahelian aquifer basins of the Chad and Iullemmeden are striking (Figure 3). The four basins have similar rainfall but the southern African basins show a weaker seasonal response; TWS variations in the Karoo aquifer show a particularly weak relationship to rainfall (Figure 3b). This may in part be due to the seasonal distribution of rainfall but may also reflect differences in land cover (Figure 1 and Table 1). The Sahelian aquifers have largely been cleared of native vegetation leading to increased infiltration and run off compared to Karoo and Kalahari aquifers [62,63,64]. The more densely vegetated southern African land cover is likely to reduce infiltration and runoff and storage changes may be more dominated by evapotranspiration.

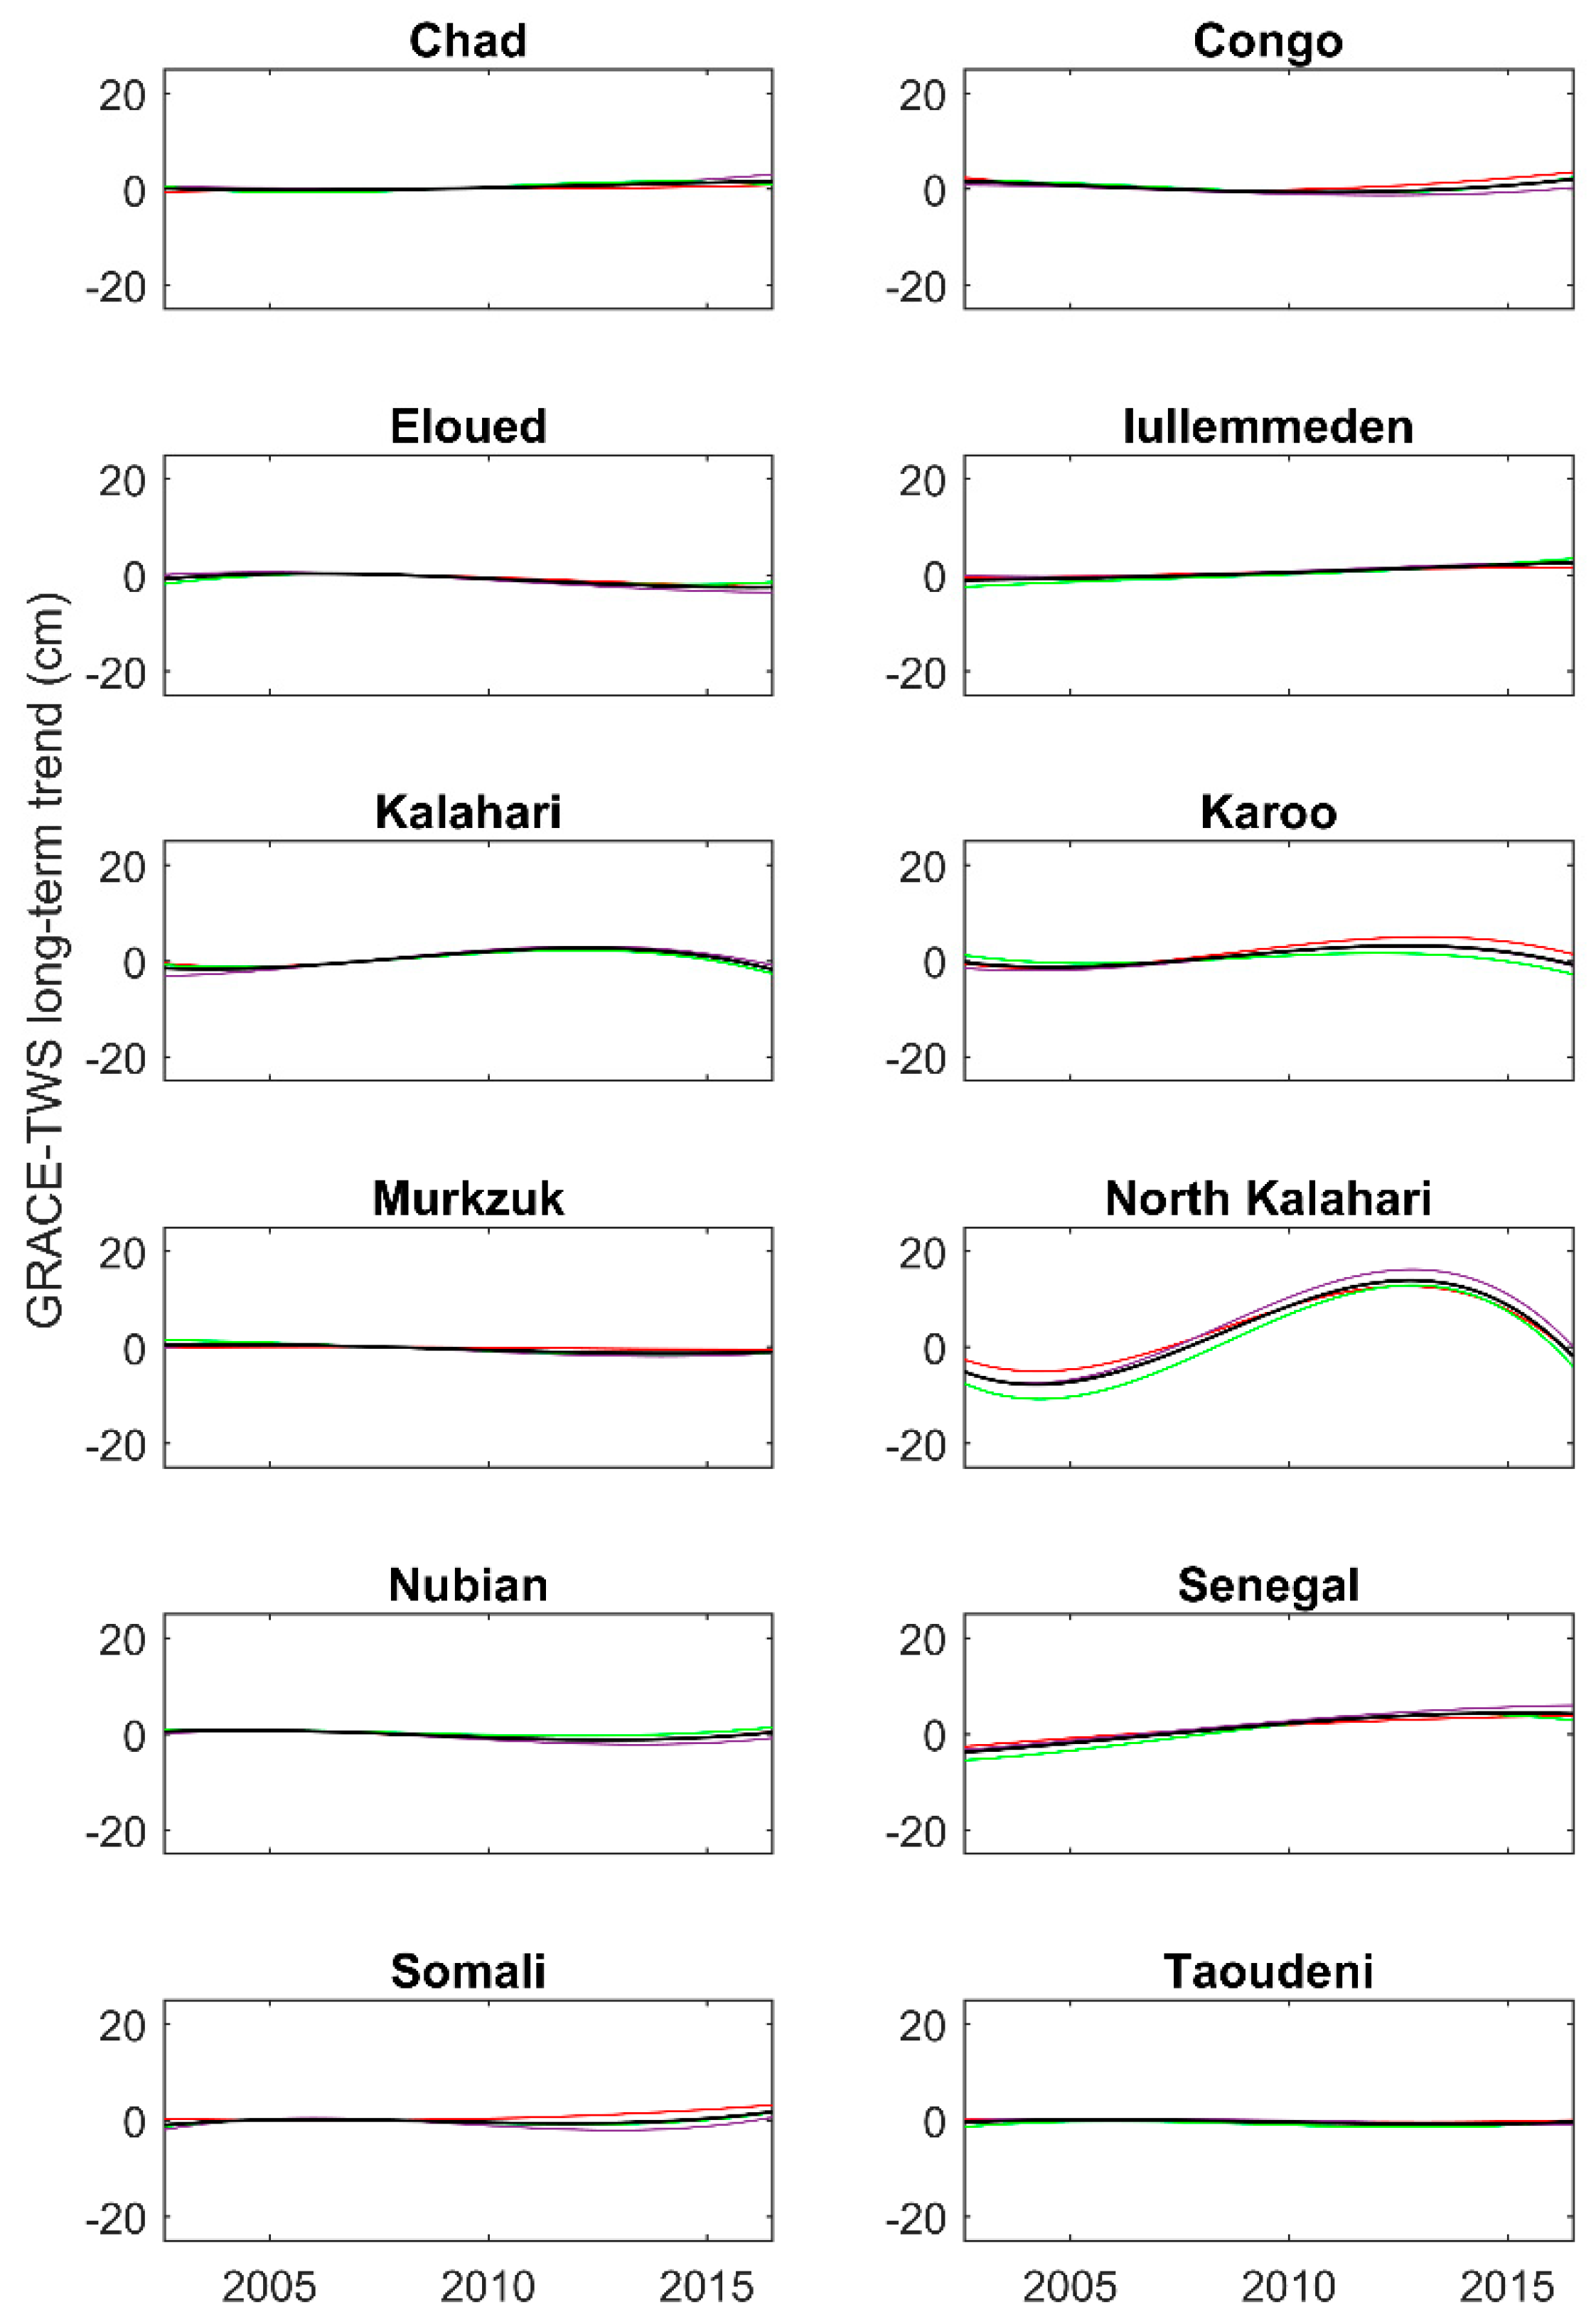
3.1.2. Long Term Patterns in TWS

A variety of long-term patterns in TWS is shown across the basins in Figure 4. There is no evidence of continuous long-term declining trends of TWS in any of the major sedimentary aquifer basins from 2002 to 2016 (Figure 4). The amplitude of most of the long-term TWS changes in the basins are within 2 to 5 cm water equivalent, with the exception of the North Kalahari basin which displays a greater amplitude of both rising and falling TWS changes (TWS anomaly approx. 15–20 cm) (Figure 4 and Table 1). Figure 4 also reveals a consistency in long-term responses shown for each basin using the three GRACE solutions.
Three aquifers (Chad, Taoudeni, and Congo) display little evidence of long-term trend; the Iullemmeden and Senegal basins display small consistent increasing trends in TWS equivalent to approx. 1 km3/year and 1.5 km3/year, respectively, over the time-series. The aquifers south of the equator: Kalahari, North Kalahari, and Karoo aquifer basins show similar patterns of rising TWS to 2012/2014 and falling thereafter (Figure 4). Trends in TWS for the northern and eastern aquifer basins of the Nubian, Murzuk, Eloued, and Somali basins are similar but of lower overall change (1 to 2 cm). For the Nubian, Murzuk, and Somali basins there is a slight falling trend until 2012/2013, then rising thereafter. Within the Eloued basin, TWS is stable until 2010 and then falling slightly until 2016 (Figure 4). The existence of these complex trends highlights the real value of using a non-linear function to examine long-term TWS behaviour patterns in GRACE, and also the benefit of longer datasets. Similar inter-annual TWS trends associated are also observed in other African river basins in Ethiopia, Sudan, and Tanzania (e.g., Lake Victoria Basin) [65,66].
Variations in rainfall explain some of the long-term trends (Table 1). Within the southern African basins (Kalahari, North Kalahari, Karoo), the pattern is of strong rising TWS trends until 2012–2014 before then changing to a pattern of falling TWS (Figure 4). This ‘rise and fall’ corresponds to general rainfall patterns in the region with above average rainfall over much of southern Africa for the period up to 2012, and persistent drought since then [67] (Figure 2). Other studies, mainly over shorter time periods, have highlighted that the increased TWS in the Okavango and Zambezi river basins are linked to the increased flooding in the area [68,69]. The North Kalahari aquifer, where the greatest long-term variation in TWS is observed, is mostly located within the upper Okavango basin, where additional rainfall must be stored. However, the impact of recent reduction in rainfall is shown in a reversal of the rising trend and currently falling TWS. Within the North African basins of the Nubian, Eloued, Murzuk where rainfall is negligible, much smaller trends (<1.5 cm) are mostly within uncertainties in the analysis and are difficult to attribute confidently to groundwater abstraction patterns, rainfall variability, or surface water flows. An earlier study [68] attributed falling TWS in the Nubian aquifer as evidence of groundwater abstraction; however, in our analysis TWS has risen slightly in the Nubian aquifer since 2012/2013 and in 2016 was at the same level as 2002. TWS in the Eloued aquifer was largely stable until 2011 and there is some evidence of declining TWS since. These North African basins last received significant recharge approximately 5000 years ago, although modern recharge can still occur particularly at the basin edges [70], and groundwater levels have naturally declined since [71].
The absence of any continuous long-term decline in TWS in any basin indicates that at an aquifer basin-scale, the groundwater resources are not stressed by current total abstraction volumes, and that TWS responds mostly to long-term climate. It is important to note that local-scale depletion of groundwater resource around individual well fields is beyond the resolution of GRACE, and may still be occurring within the groundwater basins, causing for example seasonal failure of hand pumps [11]. What the GRACE data indicates, however, is that these effects are localised, and are not reflective of the overall status of the groundwater resources at a basin-scale. The complexity and variety of long-term TWS patterns across the African basins demonstrates the need to examine data of as long as time-series as possible—at a minimum 15 years.

3.1.3. Differences between GRACE Products

Comparison of the seasonal and long-term TWS changes shown by each of the GRACE products in this study, provides an opportunity to assess how TWS characteristics can differ between GRACE products for each basins.
In relation to the timing and frequency of inter-annual changes in TWS across the different basins and long-term TWS behaviour, there is strong similarity among all three GRACE products (CSR, JPL-MSCN, GRGS) (Figure 2 and Figure 3a). There are, however, notable differences (equivalent to TWS anomaly of ~5 cm) in the amplitudes of the inter-annual TWS changes represented by the different products. The GRGS GRACE product produces greater annual variations in TWS, and a noisier response compared to the CSR and new JPL-MSCN products (Figure 2). Differences in the amplitudes of inter-annual TWS changes estimated by the products are greatest in the semi-arid and arid climates, as discussed by others [72].

3.2. Estimated GWS Patterns across the Major Aquifer Basins in Africa

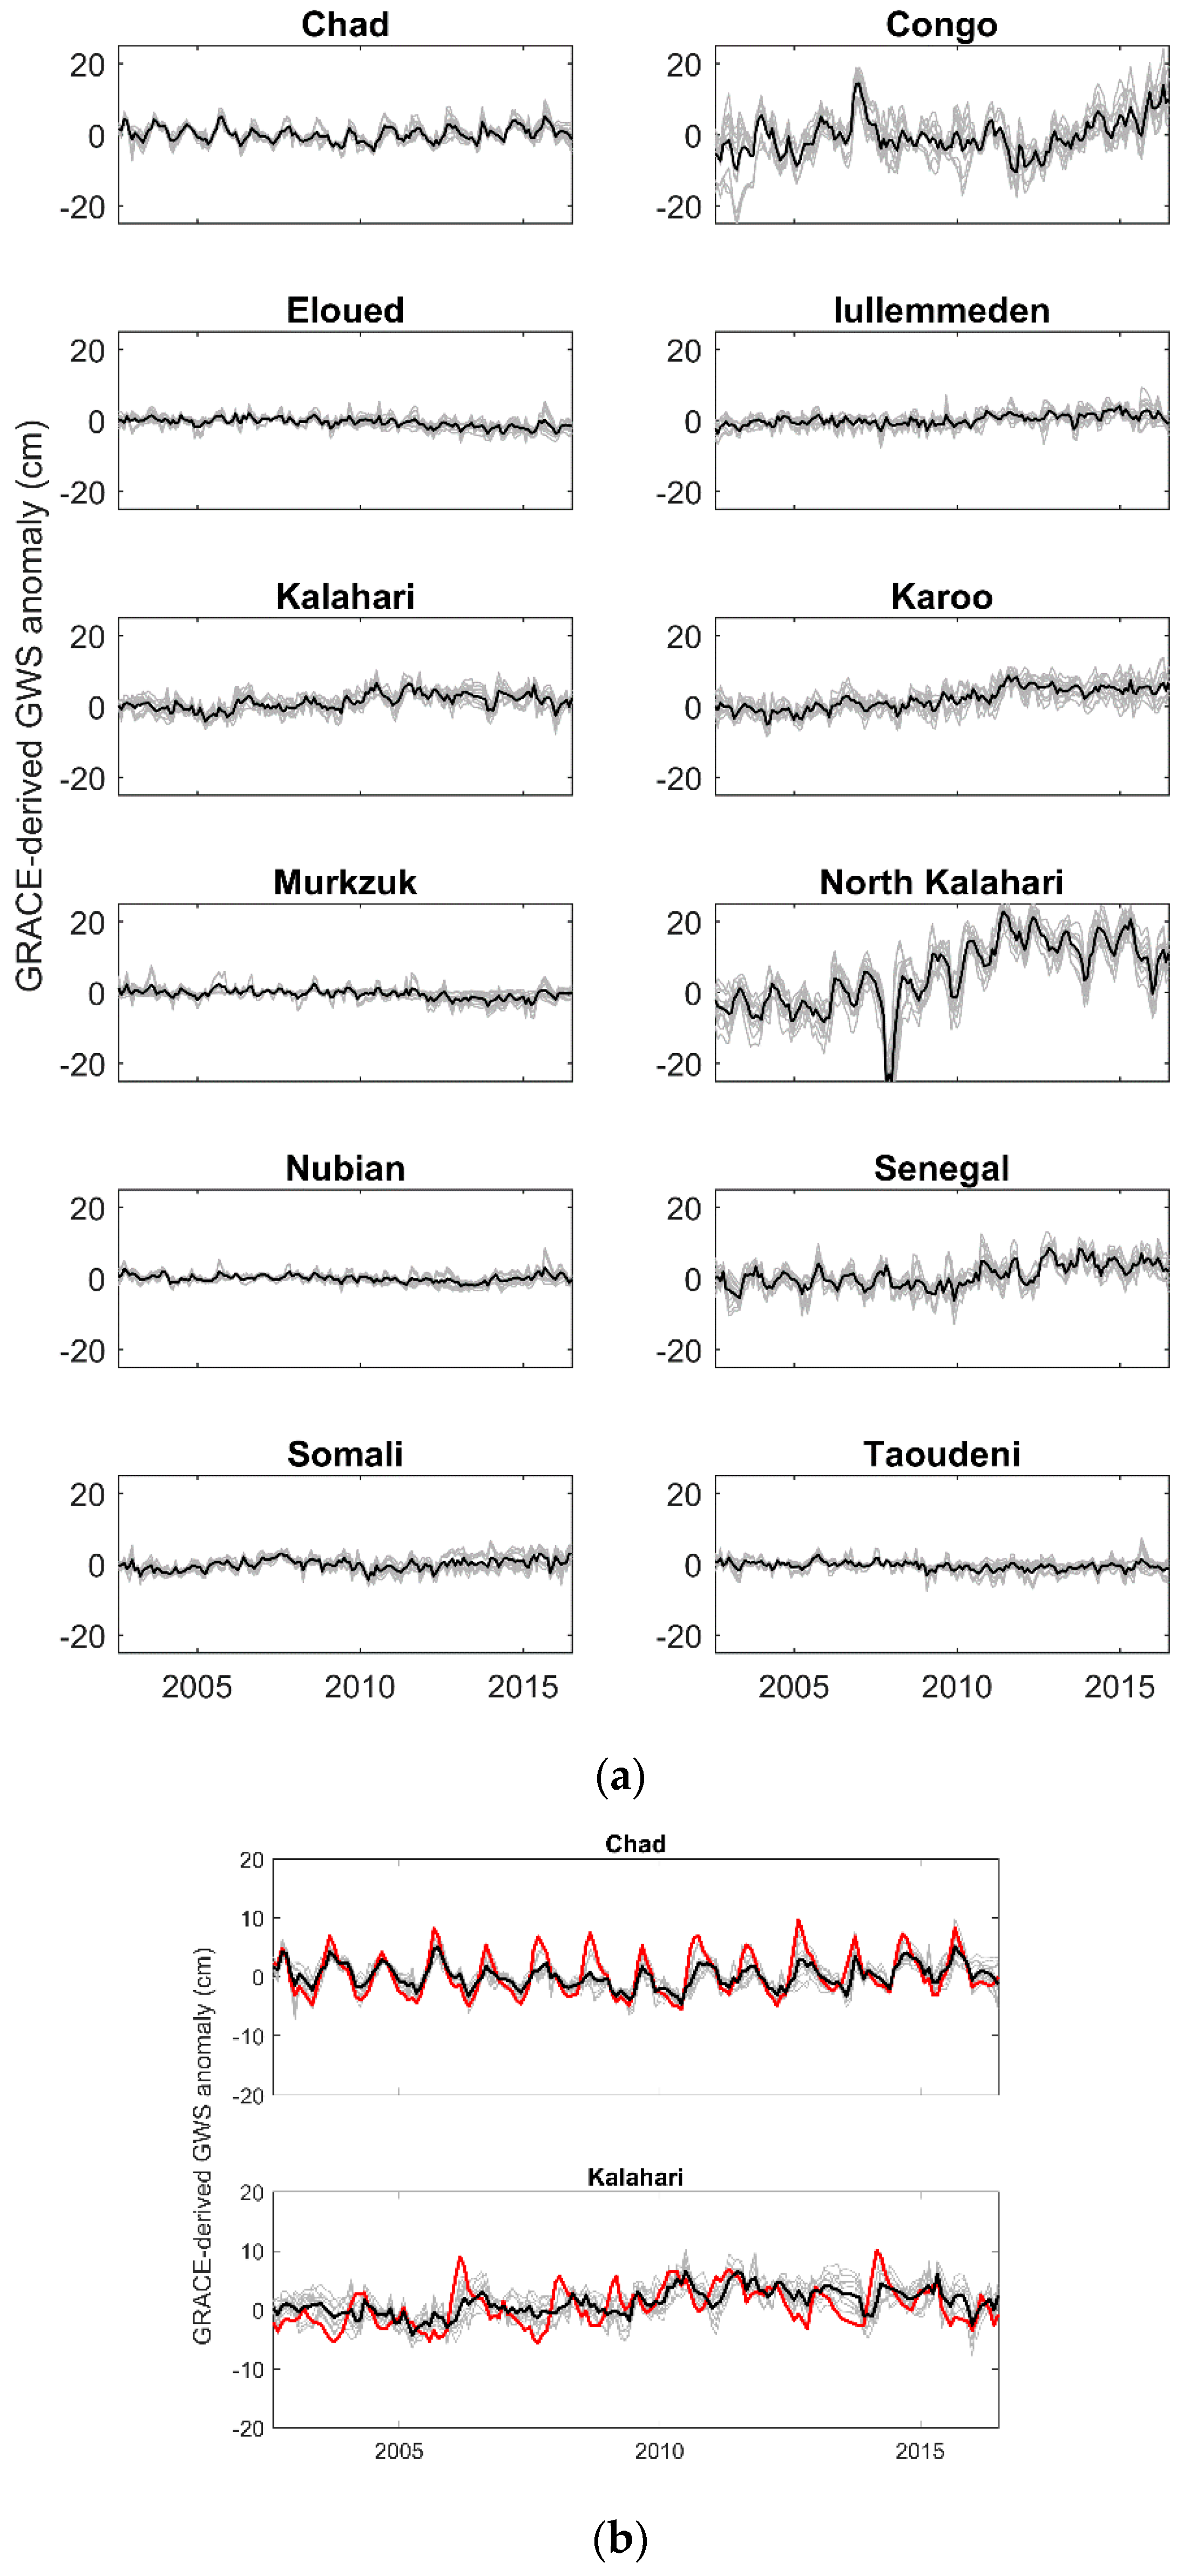
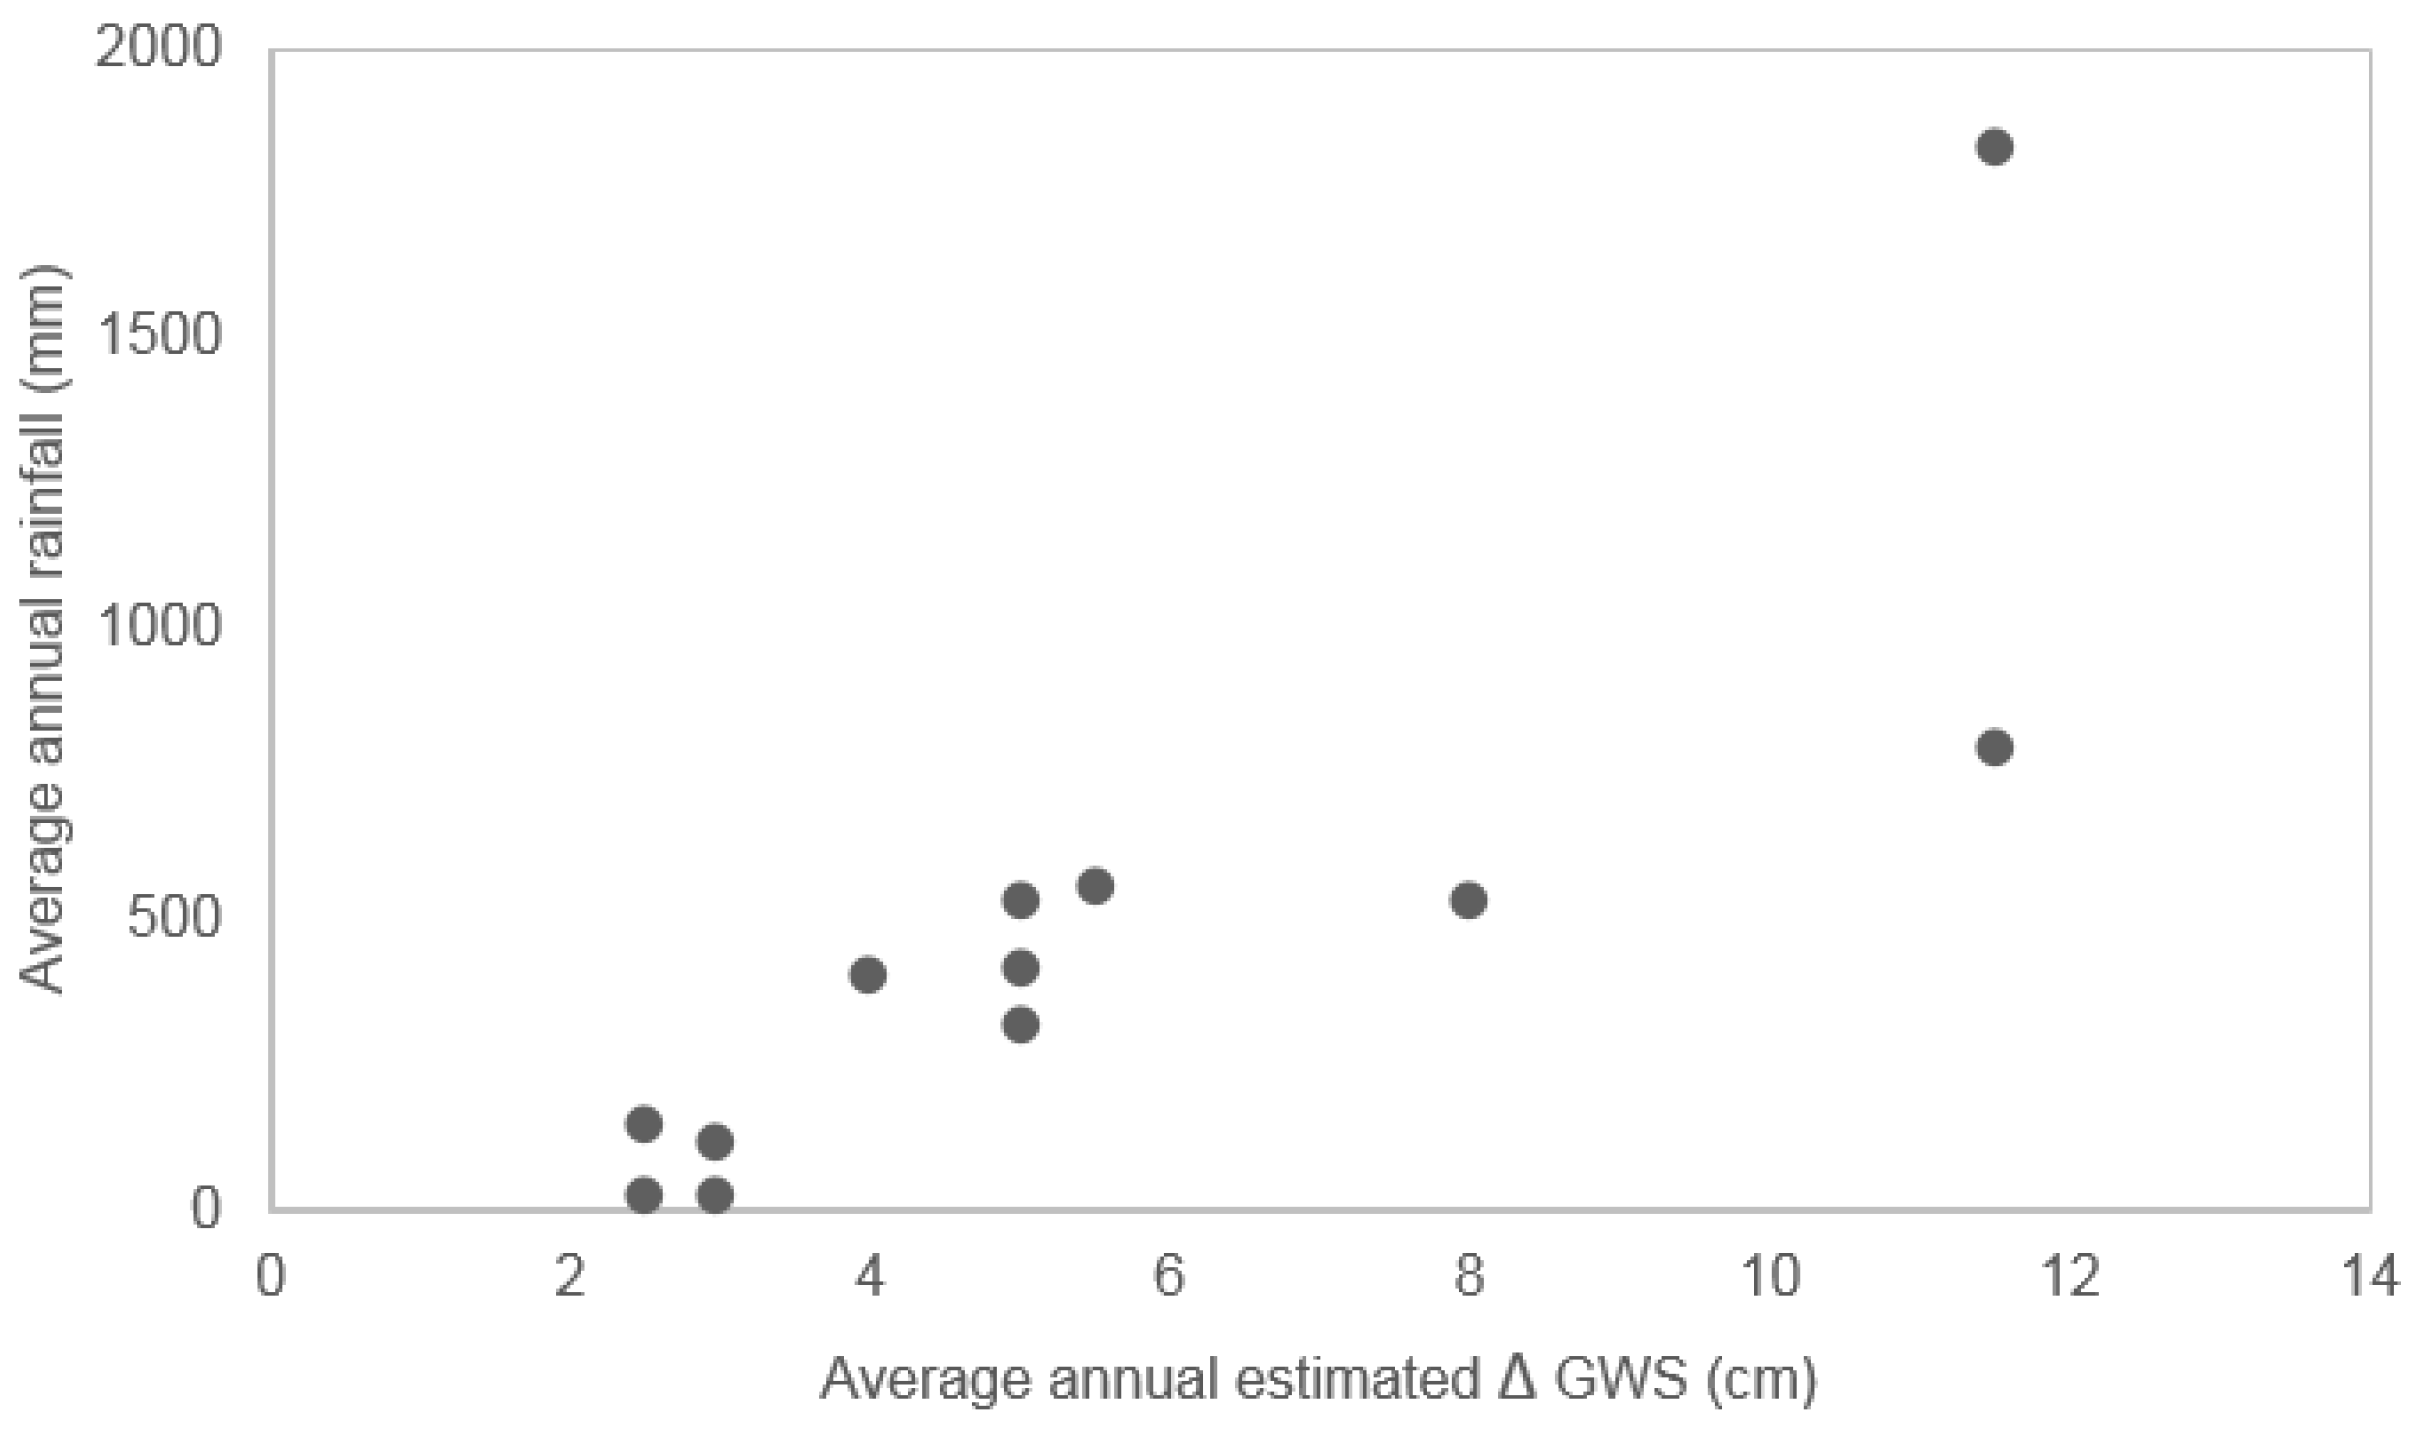
3.2.1. Seasonality of Estimated GWS Changes

Estimated GWS changes from GRACE and LSMs are shown for the major aquifer basins in Figure 5 and long term trends in Figure 6.
Out of the seven basins that displayed seasonality in TWS variability, not all display such distinct annual GWS changes; the Iullummeden, Kalahari, and Congo Basins show less of a regular seasonal change in GWS. For some aquifers in arid areas, where TWS showed no seasonal changes, the introduction of the LSMs to estimate GWS has introduced a seasonal response (e.g., Eloued). Figure 7 compares the mean annual GWS changes estimated for each major aquifer basin using different combinations of GRACE products and LSM outputs. The similarity between the GWS estimates found for each basin, across the suite of GRACE and LSM product combinations, indicates that estimated annual GWS changes averaged over the period 2002–2016 are not substantially affected by the combination GRACE products and LSM outputs used. Seasonal groundwater storage changes of approximately 10% of average annual rainfall are forecast for all of the 12 aquifer basins (Figure 8). These average seasonal behaviours compare well for estimates of recharge for some of the aquifers, such as the Iullemmuden [62,73] and Chad [74] aquifers, where groundwater recharge of 15–50 mm has been measured; and appear to overestimate annual recharge in other basins, such as the Kalahari and Karoo [75,76,77,78], where long term recharge measurements are generally >>20 mm per annum and episodic. The estimated seasonal GWS behaviour also does not appear plausible for the hyper-arid basins where seasonal groundwater recharge has been estimated to be negligible through the application of groundwater tracer methods [79] but regular seasonal groundwater recharge is predicted through the modelled combination of GRACE and LSMs.
The poor plausibility of much of the seasonal groundwater behaviour from the combined TWS and LSM analysis highlights that LSMs do not yet capture the processes partitioning rainfall into different terrestrial water stores (soil moisture, lakes, seasonal wetlands) sufficiently to enable seasonal groundwater recharge to be represented. Recent work by Scanlon et al. [80] highlights the inability of many LSMs and global hydrological models (i.e., PCRaster Global water balance model (PCR-GLOBWB), and WaterGAP Hydrological Module (WGHM)) to reliably model long term terrestrial mass changes, probably as a result of not accurately simulating changes in surface water and groundwater storage. A recent study by Kolusu et al. [36] comparing GRACE to groundwater level variations in southern and eastern Africa found that although a combination of GRACE and LSMs could represent long-term groundwater behaviour, seasonal behaviour was more uncertain. Other work has shown that modifying the representative of the zero flux plane in LSMs can improve the apparent representation of TWS partitioning between soil moisture and groundwater [60], and the importance of including groundwater abstraction [81].

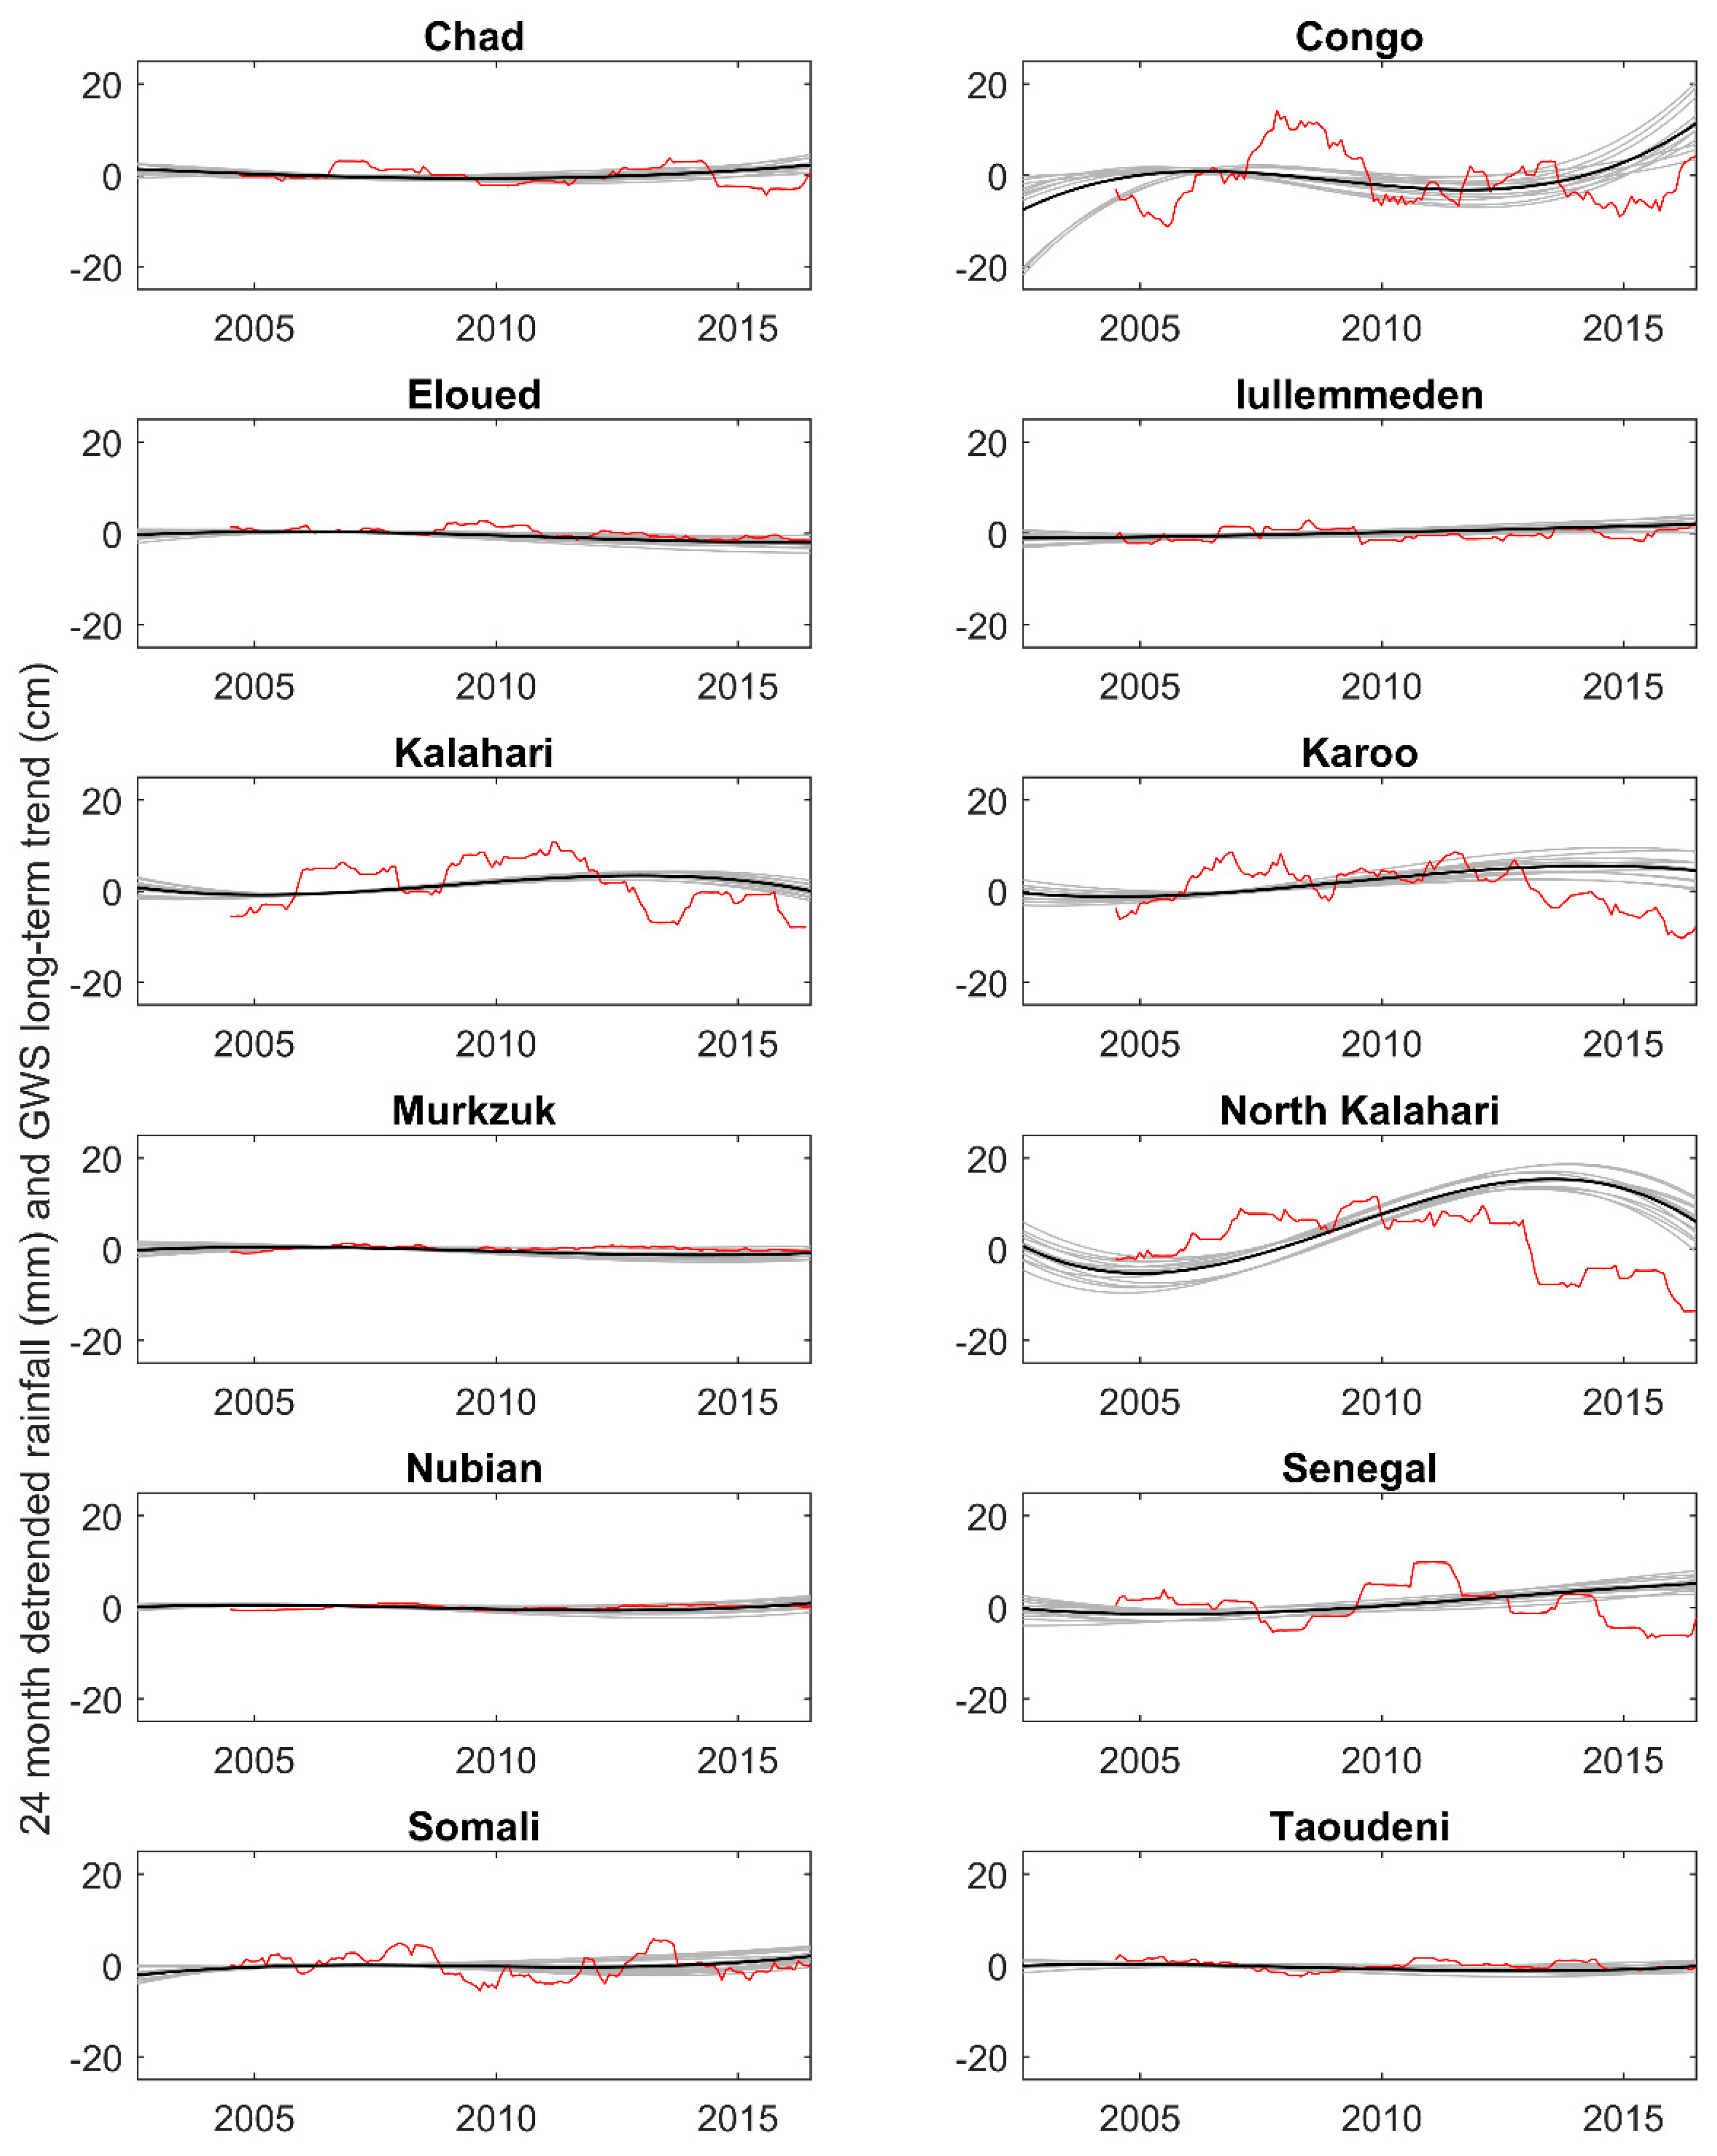
3.2.2. Long Term Patterns in Estimated GWS

The long-term patterns of estimated GWS show similar patterns to the long-term behaviour of TWS in each basin, with the exception of the Congo (Figure 4 and Figure 6). No substantial continuous long-term declining trends of GWS are indicated for any of the major sedimentary aquifer basins from 2002 to 2016 (Figure 6). As with the long-term patterns of TWS, there is little evidence of any substantial long-term trend in estimated GWS changes in the Chad, Taoudeni, Nubian, Murkzuk, Eloued, and Somali basins; small consistent increasing trends in estimated GWS are indicated over the time-series in the Iullemmeden and Senegal basins—the trend in the Iullummeden basin is substantiated by observations studies in the region [62,82]. Within the Kalahari, North Kalahari, and Karoo basins, rising patterns of GWS are observed from 2002 to 2012/2014 with either a levelling or falling trend thereafter. This change in the trend is coincidental with recent drought in southern Africa, with below average rainfall in the basins since 2012/2013 (Figure 6). The estimated long-term dynamics of rising GWS compare well to that estimated by other GRACE analyses within Africa e.g., [49]. However, the calculation that there is no substantial long-term trend in GWS within the Chad, Taoudeni, Nubian, Murkzuk, Eloued, and Somali basins, differs to the analysis of Richey et al. [49] which estimates declining long-term GWS trend of 1 cm per year in these basins.

4. Conclusions

This study demonstrates the value of using GRACE products to characterise TWS and GWS variation across large African sedimentary aquifer basins where in situ data are scarce. The three GRACE products considered (CRC, JPL-MSCN, and GRGS) provide similar long-term behaviour for each aquifer which were interpreted as GWS changes through the use of the LSMs CLM2.0, VIC, MOSAIC, and NOAH. We find that long-term trends in GWS can be plausibly represented from GRACE using LSMs. No substantial long term continuous decreasing trends in groundwater storage are apparent in any of the African basins, however, consistent rising groundwater trends from 2012 to 2016 amounting to ~1 km3/year and 1.5 km3/year are identified in the Iullemmeden and Senegal basins, respectively. Rising then falling trends with an inflexion at 2012–2014 are identified in the three aquifers south of the equator, Karoo, Kalahari, and Northern Kalahari, where recent changes in the trend consistent with reductions in rainfall. Other smaller trends (generally <1 cm over the measurement period, and not continuous) are likely to be within the uncertainties of processing the data and do not yet provide a strength of evidence suggested by others to confidently indicate the observable widespread impact of groundwater abstraction [49,68,69].
Seasonal variations in TWS identified seven aquifer basins (Chad, Congo, Iullemmeden, Kalahari, North Kalahari, Senegal, Taoudeni), with a consistent seasonal response, which is largely accounted for by rainfall that has accumulated by 5 to 9 months. Within the five other basins (Eloued, Murzuk, Nubian, Somali, and Karoo), non-seasonal rainfall explains <50% of TWS variation with the remaining unexplained signal attributed to other factors such as direct land-surface atmospheric feedbacks, local water use, and noise in the TWS signal processing. The seasonal analysis highlights differences in TWS responses between Sahelian and southern African basins that are possibly controlled by differences in land cover.
Seasonal responses in GWS as estimated by combining TWS from GRACE with LSM outputs, show consistent GWS variation for each basin across the ensembles. However, by comparing basin results with available recharge studies, we find that although they were plausible for arid basins in the Sahel, they were less plausible for southern African semi-arid basins and incongruous with hyper-arid basins where substantial annual groundwater recharge is forecast through the combination of GRACE and LSM outputs but in situ studies of groundwater recharge consistently identify negligible annual recharge. These results highlight the importance of further developing LSMs to be able to represent groundwater recharge processes, and the large uncertainties when using GWS anomalies from GRACE and LSMs to estimate seasonal groundwater storage fluxes.
By using several different products, in this study, we demonstrate that uncertainties in representing changes in seasonal groundwater storage by combining GRACE and LSM data are not reduced by using an ensemble of models, but are inherent to current limitations in how LSMs represent the partitioning of terrestrial water stores. However, our results show that seasonal groundwater behaviour can be explored using ΔTWS from several GRACE products and combining with rainfall and land use datasets. Long-term groundwater response can also be more confidently inferred from interpreting ΔTWS from an ensemble of GRACE products using a standard statistical approach.

Author Contributions

H.C.B. and A.M.M. prepared first draft of the manuscript and interpretation. M.S. undertook processing of GRACE products, TRMM and LSM outputs. B.P.M. undertook statistical analysis. A.M.M. and R.G.T. developed final analysis. All edited and contributed to final manuscript.

Acknowledgments

This paper is published with the permission of the Executive Director of the British Geological Survey. The project was supported by BGS NC-ODA grant NE/R000069/1: Geoscience for Sustainable Futures. M.S. and R.G.T. acknowledge support from NERC-ESRC-DFID UPGro ‘GroFutures’ (ref. NE/M008932/1, www.grofutures.org).

Conflicts of Interest

The authors declare no conflict of interest.

References

  1. Döll, P.; Hoffman-Dobrev, H.; Portmann, F.T.; Siebert, S.; Eicker, A.; Rodell, M.; Strassburg, G.; Scanlon B, R. Impact of water withdrawals from groundwater and surface water on continental water storage variations. J. Geodyn. 2012, 59–60, 143–156. [Google Scholar]
  2. Vörösmarty, C.J.; Douglas, E.M.; Green, P.A.; Revenga, C. Geospatial indicators of emerging water stress: An application to Africa. Ambio 2005, 34, 230–236. [Google Scholar] [CrossRef] [PubMed]
  3. Taylor, R.G.; Scanlon, B.; Döll, P.; Rodell, M.; van Beek, R.; Wada, Y.; Longuevergne, L.; Leblanc, M.; Famiglietti, J.S.; Edmunds, M.; et al. Ground water and climate change. Nat. Clim. Chang. 2013, 3, 322–329. [Google Scholar] [CrossRef] [Green Version]
  4. MacDonald, A.M.; Calow, R.C. Developing groundwater for secure rural water supplies in Africa. Desalination 2009, 248, 546–556. [Google Scholar] [CrossRef] [Green Version]
  5. Hunter, P.R.; MacDonald, A.M.; Carter, R.C. Water Supply and Health. PLoS Med. 2010, 7, E1000361. [Google Scholar] [CrossRef] [PubMed] [Green Version]
  6. Konikow, L.F. Contribution of global groundwater depletion since 1900 to sea-level rise. Geophys. Res. Lett. 2011, 38, L17401. [Google Scholar] [CrossRef]
  7. Wada, Y.; Lo, M.-H.; Yeh, P.J.F.; Reager, J.T.; Famiglietti, J.S.; Wu, R.-J.; Tseng, Y.-H. Fate of water pumped from underground and contributions to sea-level rise. Nat. Clim. Chang. 2016, 6, 777–780. [Google Scholar] [CrossRef] [Green Version]
  8. Shiklomanov, I.; Rodda, J. World Water Resources at the Beginning of the Twenty-First Century [International Hydrology Series, UNESCO]; Cambridge University Press: Cambridge, UK, 2003; 417p. [Google Scholar]
  9. Longuevergne, L.; Scanlon, B.R.; Wilson, C.R. GRACE hydrological estimates for small basins: Evaluating approaches on the High Plains Aquifer, USA. Water Resour. Res. 2010, 46, W11517. [Google Scholar] [CrossRef]
  10. MacDonald, A.M.; Bonsor, H.C.; Ahmed, K.M.; Burgess, W.G.; Basharat, M.; Calow, R.C.; Dixit, A.; Foster, S.S.D.; Gopal, K.; Lapworth, D.J.; et al. Groundwater quality and depletion in the Indo-Gangetic Basin mapped from in situ observations. Nat. Geosci. 2016, 9, 762–766. [Google Scholar] [CrossRef] [Green Version]
  11. Calow, R.C.; MacDonald, A.M.; Nicol, A.L.; Robins, N.S. Ground Water Security and Drought in Africa: Linking availability, access and demand. Ground Water 2010, 48, 246–256. [Google Scholar] [CrossRef] [PubMed]
  12. Lawrence, A.R.; MacDonald, D.M.; Howard, A.G.; Barret, M.H.; Pedley, S.; Ahmed, K.M.; Nalubega, M. Guidelines for Assessing the Risk to Groundwater from On-Site Sanitation; British Geological Survey Commissioned Report, CR/01/142; British Geological Survey: Nottingham, UK, 2004. [Google Scholar]
  13. Pritchard, M.; Mkandawire, T.; O’Neill, J.G. Assessment of groundwater quality in shallow wells within the southern districts of Malawi. Phys. Chem. Earth 2008. [Google Scholar] [CrossRef]
  14. Morris, B.L.; Lawrence, A.R.; Chilton, P.J.; Adams, B.; Caylow, R.C.; Klinck, B.A. Groundwater and its Susceptibility to Degradation: A Global Assessment of the Problems and Options for Management; UNEP Early Warning & Assessment Report Series RS. 03-3; UNEP: Nairobi, Kenya, 2003. [Google Scholar]
  15. Foster, S.S.D.; Chilton, P.J. Groundwater: The processes and global significance of aquifer degradation. Philos. Trans. R. Soc. B 2003, 358, 1957–1972. [Google Scholar] [CrossRef] [PubMed]
  16. MacDonald, A.M.; Bonsor, H.C.; Ó Dochartaigh, B.É.; Taylor, R.G. Quantitative maps of groundwater resources in Africa. Environ. Res. Lett. 2012, 7, 024009. [Google Scholar] [CrossRef] [Green Version]
  17. UNEP. Africa Water Atlas; Division of Early Warning and Assessment [DEWA], United Nations Environment Programme: Nairobi, Kenya, 2010. [Google Scholar]
  18. Pfister, S.; Bayer, P.; Koehler, A.; Hellweg, S. Projected water consumption in future global agriculture: Scenarios and related impacts. Sci. Total Environ. 2011, 409, 4206–4216. [Google Scholar] [CrossRef] [PubMed]
  19. Owor, M.; Taylor, R.G.; Tindimugaya, C.; Mwesigwa, D. Rainfall intensity and groundwater recharge: Empirical evidence from the Upper Nile Basin. Environ. Res. Lett. 2009, 4, 035009. [Google Scholar] [CrossRef]
  20. Robins, N.; Davies, J.F. Groundwater supply and demand from southern Africa’s crystalline basement aquifer: Evidence from Malawi. Hydrogeol. J. 2013, 21, 905–917. [Google Scholar] [CrossRef]
  21. Taylor, R.G.; Todd, M.C.; Kongola, L.; Maurice, L. Evidence of the dependence of groundwater resources on extreme rainfall in East Africa. Nat. Clim. Chang. 2013, 3, 374–378. [Google Scholar] [CrossRef] [Green Version]
  22. Kotchoni, V.D.O.; Vouillamoz, J.M.; Lawson, F.M.A.; Adjomayi, P.; Boukari, M.; Taylor, R.G. Relationships between rainfall and groundwater recharge in seasonally humid Benin: A comparative analysis of long-term hydrographs in sedimentary and crystalline aquifers. Hydrogeol. J. 2018, in press. [Google Scholar]
  23. Scanlon, B.R.; Zhang, Z.; Save, H.; Wiese, D.N.; Landerer, F.W.; Long, D.; Longuevergne, L.; Chen, J. Global evaluation of new GRACE mascon products for hydrologic applications. Water Resour. Res. 2016, 52, 9412–9429. [Google Scholar] [CrossRef] [Green Version]
  24. Tapley, B.D.S.; Bettadpur, M.W.; Reigber, C. The gravity recovery and climate experiment: Mission overview and early results. Geophys. Res. Lett. 2004, 31, L09607. [Google Scholar] [CrossRef]
  25. Wahr, J.; Swenson, S.; Zlotnicki, V.; Velicogna, I. Time-variable gravity from GRACE: First results. Geophys. Res. Lett. 2004, 31, 4. [Google Scholar] [CrossRef]
  26. Ramillien, G.; Frappart, F.; Seoane, L. Application of the Regional Water Mass Variations from GRACE Satellite Gravimetry to Large-scale water management in Africa. Remote Sens. 2014, 6, 7379–7405. [Google Scholar] [CrossRef]
  27. Rodell, M.; Velicogna, I.; Famiglietti, J.S. Satellite-based estimates of groundwater depletion in India. Nature 2009, 460, 999–1003. [Google Scholar] [CrossRef] [PubMed]
  28. Famiglietti, J.S.; Lo, M.; Ho, S.L.; Bethune, J.; Anderson, K.J.; Syed, T.H.; Swenson, S.C.; de Linage, C.R.; Rodell, M. Satellites measure recent rates of groundwater depletion in California’s Central Valley. Geophys. Res. Lett. 2011, 38, L03403. [Google Scholar] [CrossRef]
  29. Scanlon, B.R.; Longuevergne, L.; Long, D. Ground referencing GRACE satellite estimates of groundwater storage changes in the California Central Valley, USA. Water Resour. Res. 2012, 48, W04520. [Google Scholar] [CrossRef]
  30. Castellazzi, P.; Martel, R.; Galloway, D.L.; Longuevergne, L.; Rivera, A. Assessing Groundwater Depletion and Dynamics Using GRACE and InSAR: Potential and Limitations. Ground Water 2016, 54, 768–780. [Google Scholar] [CrossRef] [PubMed] [Green Version]
  31. Nanteza, J.; de Linage, C.R.; Thomas, B.F.; Famiglietti, J.S. Monitoring groundwater storage changes in complex basement aquifers: An evaluation of the GRACE satellites over East Africa. Water Resour. Res. 2016, 52, 9542–9564. [Google Scholar] [CrossRef] [Green Version]
  32. Shamsudduha, M.; Taylor, R.G.; Jones, D.; Longuevergne, L.; Owor, M.; Tindimugaya, C. Recent changes in terrestrial water storage in the Upper Nile Basin: An evaluation of commonly used gridded GRACE products. Hydrol. Earth Syst. Sci. 2017, 21, 4533–4549. [Google Scholar] [CrossRef]
  33. Ramilien, G.; Lombarda, A.; Cazenavea, A.; Ivins, E.R.; Llubes, M.; Remy, F.; Biancale, R. Inter-annual variations of the mass balance of the Antarctica and Greenland ice sheets from GRACE. Glob. Planet. Chang. 2006, 53, 198–208. [Google Scholar] [CrossRef]
  34. Velicogna, I. Increasing rates of ice mass loss from the Greenland and Antarctic ice sheets revealed by GRACE. Geophys. Res. Lett. 2009, 36, L19503. [Google Scholar] [CrossRef]
  35. Arendt, A.A.; Luthcke, S.B.; Gardner, A.S.; O’Neel, S.; Hill, D.; Moholdt, G.; Abdalati, W. Analysis of a GRACE global mascon solution for Gulf of Alaska glaciers. J. Glaciol. 2013, 59, 913–924. [Google Scholar] [CrossRef] [Green Version]
  36. LeBlanc, M.; Tweed, S.; Frappart, F.; Ramillien, G.; Van Dijk, A. GRACE and Groundwater Drought in the Murray-Darling Basin. In Climate Change Effects on Groundwater Resources: A Global Synthesis of Findings and Recommendations; Treidel, H., Martin-Bordes, J.L., Gurdak, J.J., Eds.; IAH—International Contributions to Hydrogeology—CRC Press: Boca Raton, FL, USA, 2011; Volume 27, p. 414. ISBN 9780415689366. [Google Scholar]
  37. Kolusu, S.R.; Shamsudduha, M.; Todd, M.C.; Taylor, R.G.; Seddon, D.; Kashaigili, J.J.; Girma, E.; Cuthbert, M.; Sorensen, J.P.R.; Villholth, K.; et al. The El Niño event of 2015–16: Climate anomalies and their impact on groundwater resources in East and Southern Africa. Environ. Res. Lett. 2017. in review. [Google Scholar]
  38. Güntner, A. Improvement of Global Hydrological Models Using GRACE Data. Surv. Geophys. 2008, 29, 375–397. [Google Scholar] [CrossRef] [Green Version]
  39. Xie, H.; Longuevergne, L.; Ringler, C.; Scanlon, B.R. Calibration and evaluation of a semi-distributed watershed model of Sub-Saharan Africa using GRACE data. Hydrol. Earth Syst. Sci. 2012, 16, 3083–3099. [Google Scholar] [CrossRef] [Green Version]
  40. Hu, L.; Jiao, J.J. Calibration of a large-scale groundwater flow model using GRACE data: A case study in the Qaidam Basin, China. Hydrogeol. J. 2015, 23, 1305–1317. [Google Scholar] [CrossRef]
  41. Bonsor, H.C.; MacDonald, A.M. An Initial Estimate of Depth to Groundwater across Africa; British Geological Survey, OR/11/067; British Geological Survey: Nottingham, UK, 2011; 26p. [Google Scholar]
  42. Swenson, S.C.; Wahr, J. Post-processing removal of correlated errors in GRACE data. Geophys. Res. Lett. 2006, 33, L08402. [Google Scholar] [CrossRef]
  43. Landerer, F.W.; Swenson, S.C. Accuracy of scaled GRACE terrestrial water storage estimates. Water Resour. Res. 2012, 48, W04531. [Google Scholar] [CrossRef]
  44. Watkins, M.M.; Wiese, D.N.; Yuan, D.-N.; Boening, C.; Landerer, F.W. Improved methods for observing Earth’s time variable mass distribution with GRACE using spherical cap mascons. J. Geophys. Res.-Sol. Earth 2015, 120, 2648–2671. [Google Scholar] [CrossRef]
  45. Wiese, D.N.; Landerer, F.W.; Watkins, M.M. Quantifying and reducing leakage errors in the JPL RL05M GRACE Mascon solution. Water Resour. Res. 2016, 52, 7490–7502. [Google Scholar] [CrossRef]
  46. Biancale, R.; Lemoine, J.-M.; Balmino, G.; Loyer, S.; Bruisma, S.; Perosanz, F.; Marty, J.-C.; Gégout, P. 3 Years of Geoid Variations from GRACE and LAGEOS Data at 10-Day Intervals from July 2002 to March 2005; CNES/GRGS product; CNES/GRGS: Toulouse, France, 2006. [Google Scholar]
  47. Huffman, G.J.; Adler, R.F.; Bolvin, D.T.; Gu, G.; Nelkin, E.J.; Bowman, K.P.; Hong, Y.; Stocker, E.F.; Wolff, D.B. The TRMM multi-satellite precipitation analysis: Quasi global, multi-year, combined-sensor precipitation estimates at fine scale. J. Hydrometeorol. 2007, 8, 38–55. [Google Scholar] [CrossRef]
  48. R Core Team. A Language and Environment for Statistical Computing (R Version 3.4.3); R Foundation for Statistical Computing: Vienna, Austria, 2017; p. 12. [Google Scholar]
  49. Richey, A.S.; Thomas, B.F.; Lo, M.-H.; Reager, J.T.; Famiglietti, J.S.; Voss, K.; Swenson, S.; Rodell, M. Quantifying renewable groundwater stress with GRACE. Water Resour. Res. 2015, 51, 7. [Google Scholar] [CrossRef] [PubMed]
  50. Mishra, V.; Aadhar, S.; Asoka, A.; Pai, S.; Kumar, R. On the frequency of the 2015 monsoon season drought in the Indo-Gangetic Plain. Geophys. Res. Lett. 2016, 43, 12102–12112. [Google Scholar] [CrossRef]
  51. Thomas, B.F.; Caineta, J.; Nanteza, J. Global assessment of groundwater sustainability based on storage anomalies. Geophys. Res. Lett. 2017, 44, 11445–11455. [Google Scholar] [CrossRef]
  52. Rodell, M.; Houser, P.R.; Jambor, U.; Gottschalck, J.; Mitchell, K.; Meng, C.-J.; Arsenault, K.; Cosgrove, B.; Radakovich, J.; Bosilovich, M.; et al. The global land data assimilation system. Bull. Am. Meteorol. Soc. 2004, 85, 381–394. [Google Scholar] [CrossRef]
  53. Dai, Y.; Zeng, X.; Dickinson, R.E.; Baker, I.; Bonan, G.B.; Bosilovich, M.G.; Denning, A.S.; Dirmeyer, P.A.; Houser, P.R.; Niu, G.; et al. The common land model (CLM). Bull. Am. Meteorol. Soc. 2003, 84, 1013–1023. [Google Scholar] [CrossRef]
  54. Ek, M.B.; Mitchell, K.E.; Lin, Y.; Rogers, E.; Grunmann, P.; Koren, V.; Gayno, G.; Tarpley, J.D. Implementation of Noah land surface model advances in the National Centers for Environmental Prediction operational mesoscale Eta model. J. Geophys. Res. 2003, 108, 8851. [Google Scholar] [CrossRef]
  55. Liang, X.; Xie, Z.; Huang, M. A new parameterization for surface and groundwater interactions and its impact on water budgets with the variable infiltration capacity (VIC) land surface model. J. Geophys. Res. 2003, 108, 8613. [Google Scholar] [CrossRef]
  56. Koster, R.D.; Suarez, M.J. Modelling the land surface boundary in climate models as a composite of independent vegetation stands. J. Geophys. Res. 1992, 97, 2697–2715. [Google Scholar] [CrossRef]
  57. Shamsudduha, M.; Taylor, R.G.; Longuevergne, L. Monitoring groundwater storage changes in the highly seasonal humid tropics: Validation of GRACE measurements in the Bengal Basin. Water Resour. Res. 2012, 48, W02508. [Google Scholar] [CrossRef]
  58. Awange, J.L.; Khandu, M.; Schumacher, M.; Forootan, E.; Heck, B. Exploring hydro-meteorological drought patterns over the Greater Horn of Africa (1979–2014) using remote sensing and reanalysis products. Adv. Water Resour. 2016, 94, 45–59. [Google Scholar] [CrossRef] [Green Version]
  59. Ahmed, M.; Sultan, M.; Wahr, J.; Yan, E.; Milewski, A.M.; Sauck, W.; Becker, R.; Welton, B. Integration of GRACE (Gravity Recovery and Climate Experiment) data with traditional data sets for a better understanding of the time-dependent water partitioning in African watersheds. Geology 2011, 39, 479–482. [Google Scholar] [CrossRef]
  60. Swenson, S.C.; Lawrence, D.M. A GRACE-based assessment of interannual groundwater dynamics in the Community Land Model. Water Resour. Res. 2015, 51, 8817–8833. [Google Scholar] [CrossRef]
  61. Dadson, S.J.; Ashpole, I.; Harris, P.; Davies, H.N. Wetland inundation dynamics in a model of land surface climate: Evaluation in the Niger inland delta region. J. Geophys. Res.-Atmos. 2010, 115, D23114. [Google Scholar] [CrossRef]
  62. Conway, D.; Persechino, A.; Ardoin-Bardin, S.; Hamandawana, H.; Dieulin, C.; Mahé, G. Rainfall and water resources variability in sub-Saharan Africa during the twentieth century. J. Hydrometeorol. 2009, 10, 41–59. [Google Scholar] [CrossRef]
  63. Favreau, G.; Cappelaere, B.; Massuel, S.; Leblanc, M.; Boucher, M.; Boulain, N.; Leduc, C. Land clearing, climate variability, and water resources increase in semiarid southwest Niger: A review. Water Resour. Res. 2009, 45. [Google Scholar] [CrossRef] [Green Version]
  64. Ibrahim, M.; Favreau, G.; Scanlon, B.R.; Luc Seidel, J.; Le Coz, M.; Demarty, J.; Cappelaere, B. Long-term increase in diffuse groundwater recharge following expansion of rainfed cultivation in the Sahel, West Africa. Hydrogeol. J. 2014, 22, 1293–1305. [Google Scholar] [CrossRef]
  65. Awange, J.L.; Forootan, E.; Kuhn, M.; Kusche, J.; Heck, B. Water storage changes and climate variability within the Nile Basin between 2002 and 2011. Adv. Water Resour. 2014, 73, 1–15. [Google Scholar] [CrossRef] [Green Version]
  66. Awange, J.L.; Anyah, R.; Agola, N.; Forootan, E.; Omondi, P. Potential impacts of climate and environmental change on the stored water of Lake Victoria Basin and economic implications. Water Resour. Res. 2013, 49, 8160–8173. [Google Scholar] [CrossRef] [Green Version]
  67. Nicholson, S.E.; Funk, C.; Fink, A.H. Rainfall over the African continent from the 19th through the 21st century. Glob. Planet. Chang. 2017. [Google Scholar] [CrossRef]
  68. Ahmed, M.; Sultan, M.; Wahr, J.; Yan, E. The use of GRACE data to monitor natural and anthropogenic induced variations in water availability across Africa. Earth Sci. Rev. 2014, 136, 289–300. [Google Scholar] [CrossRef]
  69. Rodell, M.; Famiglietti, J.S.; Wiese, D.N.; Reager, J.T.; Beaudoing, H.K.; Landerer, F.W.; Lo, M.H. Emerging trends in global freshwater availability. Nature 2018, 557, 651–659. [Google Scholar] [CrossRef] [PubMed]
  70. Edmunds, M.; Dodo, A.; Djoret, D.; Gaye, C.H.; Goni, I.B.; Travi, Y.; Zouari, K.; Zuppi, Gi.; Gasse, F. Groundwater as an archive of climatic and environmental change: Europe to Africa. In Past Climate Variability through Europe and Africa; Batterbee, R.W., Gasse, F., Stickley, C.E., Eds.; Dev in Palaeoenv Research Series; Kluwer Publishing: Dordrecht, The Netherlands, 2004; pp. 279–306. [Google Scholar]
  71. Gossel, W.; Ebraheem, A.M.; Wycisk, P. A GIS-Based Flow Model for Groundwater Resources Management in the Development Areas in the Eastern Sahara, Africa. In Applied Groundwater Studies in Africa; Adelana, S., MacDonald, A.M., Eds.; IAH Selected Papers on Hydrogeology; CRC Press: Boca Raton, FL, USA, 2004; Volume 13, pp. 41–48. [Google Scholar]
  72. Long, D.; Longuevergne, L.; Scanlon, B.R. Global analysis of approaches for deriving total waterstorage changes from GRACE satellites. Water Resour. Res. 2015, 51, 2574–2594. [Google Scholar] [CrossRef]
  73. Leduc, C.; Favreau, G.; Schroeter, P. Long-term rise in a Sahelian water-table: The Continental Terminal in South-West Niger. J. Hydrol. 2001, 243, 43–54. [Google Scholar] [CrossRef]
  74. Edmunds, W.M.; Fellman, E.; Goni, I.; Prudhomme, C. Spatial and temporal distribution of groundwater recharge in northern Nigeria. Hydrogeol. J. 2002, 10, 205–215. [Google Scholar] [CrossRef] [Green Version]
  75. Gieske, A.; Selaolo, E.; McMullan, S. Groundwater recharge through the unsaturated zone of southeastern Botswana: A study of chlorides and environmental isotopes. Regional. Hydrol. Proc. Ljubljana Symp. IAHS Publ. 1990, 191, 33–45. [Google Scholar]
  76. Sami, K.; Hughes, D.A. A comparison of recharge estimates to a fractured sedimentary aquifer in South Africa from a chloride mass balance and an integrated surface-subsurface model. J. Hydrol. 1996, 179, 111–136. [Google Scholar] [CrossRef]
  77. Selaolo, E.T.; Beekman, H.E.; Gieske, A.S.M.; de Vries, J.J. Multiple Tracer Profiling in Botswana—GRES findings. In GW Recharge Estimation in Southern Africa; Xu, Y., Beekman, H.E., Eds.; UNESCO: Paris, France, 2003; 12p. [Google Scholar]
  78. Van Wyk, E.; van Tonder, G.J.; Vermeulen, D. Characteristics of local groundwater recharge cycles in South African semi-arid hard rock terrains: Rainfall-groundwater interaction. Water SA 2012, 38, 5–14. [Google Scholar] [CrossRef]
  79. Edmunds, W.M. Groundwater in Africa—Palaeowater, Climate Change and Modern Recharge. In Applied Groundwater Studies in Africa; IAH Selected Papers on Hydrogeology; Adelana, S.M.A., MacDonald, A.M., Eds.; CRC Press/Balkema: Leiden, The Netherlands, 2008; Volume 13, pp. 305–336. [Google Scholar]
  80. Scanlon, B.R.; Zhang, Z.; Save, H.; Sun, A.Y.; Schmied, H.M.; van Beek, L.P.H.; Wiese, D.N.; Wada, Y.; Long, D.; Reedy, R.C.; et al. Global models underestimate large decadal declining and rising water storage trends relative to GRACE satellite data. Proc. Natl. Acad. Sci. USA 2018, 115, E1080–E1089. [Google Scholar] [CrossRef] [PubMed] [Green Version]
  81. Döll, P.; Müller-Schmeid, H.; Schuh, C.; Portmann, F.T.; Eicker, A. Global-scale assessment of groundwater depletion and related groundwater abstractions: Combining hydrological modelling with information from well observations and GRACE satellites. Water Resour. Res 2014, 50, 5698–5720. [Google Scholar] [CrossRef]
  82. Werth, S.; White, D.; Bliss, D.W. GRACE Detected Rise of Groundwater in the Sahelian Niger River Basin. J. Geophys. Res.-Sol. Earth 2017, 122, 10459–10477. [Google Scholar] [CrossRef]
Figure 1. A series of groundwater maps for Africa: (a) the hydrogeological environments for Africa [41], in which the sedimentary environments are divided in terms of groundwater storage and flow; (b) estimated groundwater storage in Africa, based on effective porosity and thickness of the aquifers [16]; (c) the average seasonal terrestrial water storage changes indicated by Gravity Recovery and Climate Experiment (GRACE) at a continental-scale across Africa, with the major sedimentary aquifer basin boundaries (to which the GRACE, rainfall and land surface model (LSM) data are extracted) highlighted in black; (d) land cover; and (e) average annual rainfall.
Remotesensing 10 00904 g001
Figure 2. Terrestrial water storage (TWS) anomalies (cm) for each of the major aquifer basins across Africa. The ensemble GRACE product is shown in black; the Centre for Space Research (CSR) product in red, the Jet Propulsion Laboratory Global Mascon solution (JPL-MSCN) product in blue, and the Centre National D’études Spatiales (CNES) Groupe de Recherches de Géodésie Spatiale product (GRGS) t in green. Monthly rainfall from the Tropical Rainfall Measuring Mission (TRMM) is also shown.
Remotesensing 10 00904 g002
Figure 3. Plot showing: (a) the proportion of variance in TWS signal explained by seasonal and long term signals in each GRACE product. Ensemble is shown in black; CSR product red, MSCN product blue, and GRGS product in green; (b) the variance of each TWS GRACE product which is explained by rainfall, and the corresponding accumulation periods. The ensemble GRACE product is shown in black; CSR product red, JPL-MSCN product blue, and GRGS product in green.
Remotesensing 10 00904 g003
Figure 4. Long-term patterns in TWS anomaly changes for each of major aquifer basins in Africa as derived from adding a cubic polynomial within the modelling. The ensemble GRACE product is shown in black; CSR product red, MSCN product blue, and GRGS product in green.
Remotesensing 10 00904 g004
Figure 5. (a) Groundwater storage changes (ΔGWS) estimated from an ensemble of GRACE solutions and LSMs. Solid black line is the ensemble mean, with the grey lines denoting the surrounding range of ΔGWS from the different product combinations. (b) Comparison of ΔTWS and estimated ΔGWS between Chad and Kalahari which exemplify the differences in behaviour between the Sahelian (Chad, Iullemmeden) and southern African basins (Karoo, Kalahari). The red line shows the ensemble TWS changes.
Remotesensing 10 00904 g005
Figure 6. Long-term patterns in estimated GWS anomaly changes for each of major aquifer basins in Africa. The solid black line shows the ensemble GWS changes, with the grey lines denoting the surrounding range of TWS changes from the different products. Mean de-seasonalised monthly rainfall averaged over 24 months (mm) is shown in red.
Remotesensing 10 00904 g006
Figure 7. Comparison the difference between the maximum and minimum GWS change estimated for each aquifer basin, using the different GRACE products and LSM products.
Remotesensing 10 00904 g007
Figure 8. Comparison of average annual rainfall to the average annual GWS estimated from GRACE and LSMs products for each basin.
Remotesensing 10 00904 g008
Table 1. Comparison of the average annual rainfall, amplitude of seasonal TWS changes, the amplitude of estimated groundwater storage (GWS) changes, and average annual estimated GWS for each basin. Average annual rainfall, spatial area, aridity index, main climate type, and land use are also compared for each basin.
Aquifer BasinArea (km2)Land CoverMean Annual Rainfall (cm)Main Climate Type (Koeppen Classification)Aridity ClassRange of Ensemble TWS Seasonal Sinusoid (cm)Range of Ensemble GWS Seasonal Sinusoid (cm)Linear Rainfall Model of TWS–Accumulation Period (Months)Linear Rainfall Model of TWS–Proportion of Variance Explained
Eloued1,422,000bare area11.6Dry desertHyper-arid0.411.24200.29
Murzuk639,000bare area2.5Dry desertHyper-arid1.281.4790.19
Nubian2,569,000bare area2.4Dry desertHyper-arid0.970.9280.20
Senegal343,000cropland; grass53.3Tropical savannahSemi-arid12.173.8250.72
Taoudeni1,037,000bare area14.6Dry DesertHyper-arid2.391.3450.45
Iullemmeden671,000cropland; bare area39.9Tropical savannahArid5.280.9450.64
Chad1,436,000cropland; bare area41.3Tropical savannahArid8.73.9750.78
Somali1,164,000grassland; shrub31.6Dry desertArid1.020.9740.46
Congo1,659,000tree cover182.4Tropical rainforestHumid11.433.540.59
North Kalahari1,161,000tree cover; shrub79.3Tropical SavannahSemi-arid19.2310.0260.45
Kalahari761,000shrub; grassland52.9Temperate grasslandsSemi-arid5.251.7190.53
Karoo814,000shrub; grassland55.7Dry desertSemi-arid1.441.91100.23

