1. Introduction
Geospatial object detection is one of the concerned fields in remote sensing. The development of high spatial resolution (HSR) remote sensing image sensors accelerates the acquisition of various aerial and satellite images with adequate detailed spatial structural information. These remote sensing imagery can facilitate a wide range of military and civil applications, such as marine monitoring [
1], urban area detection [
2,
3], cargo transportation, and port management, etc. Different from natural imagery obtained on the ground from a horizontal view, HSR remote sensing imagery is obtained from a top-down view, which is an approach that can be easily affected by weather and illumination conditions. Apart from this, the small-size and scale-variable properties of multi-class geospatial objects as well as the dearth of manually annotated training samples make the detection tasks more challenging.
Many investigations related to object detection in remote sensing imagery have been carried out. The existing methods can be generally divided into four main categories: template matching-based methods, knowledge-based methods, object based image analysis (OBIA)-based methods, and machine learning-based methods [
4]. Template matching-based methods [
5,
6,
7,
8] are widely applied in remote sensing field and can be further divided into two classes—rigid template matching and deformable template matching, which involve two main steps, namely, template generation and similarity measurement [
9,
10]. For knowledge-based methods, the prior knowledge including geometric and contextual information is used to address a hypothesis-testing problem [
11,
12,
13]. OBIA-based methods contain two main procedures: image segmentation and object classification, where the appropriate segmentation scale is the key factor influencing the performance [
14]. For the machine learning methods, the following processing steps are feature extraction, feature fusion, dimension reduction, and classifier training, respectively [
3,
15]. Owing to the powerful techniques in machine learning area, detection tasks can be formulated as feature extraction and classification stages. The feature extraction stage relying on the proposals chosen by selective search (SS) [
16] usually involves extracting handcrafted features such as scale-invariant feature transform (SIFT), histograms of oriented gradients (HOG) [
17], which are widely applied in computer vision and other image related fields. Bag of words (BoW) feature represents the image of a scene by the collection of local regions by unsupervised learning and it has been widely used in the geospatial object detection with excellent performance. Sparse coding based features are learned by sets of over-completed bases to represent data with high efficiency. The subsequent classification stage mainly deals with training a classifier such as a support vector machine (SVM) [
18], conditional random fields [
19], k-nearest neighbors (KNN), and so on [
20,
21]. In addition to the uncertainty of human feature design and complex time-consuming procedures, these methods divide the object detection tasks into region proposal generation and object localization stages, which greatly influences the efficiency of the algorithm.
The popularity of deep neural networks, which are capable of hierarchical feature representation, has enabled a highly promising method for end-to-end object detection. Owing to the rapid development of large-scale public natural image datasets such as PASCAL VOC [
22] and well-performing graphics processing units (GPUs), the algorithms based on convolutional neural networks (CNN) have achieved prominent success in many visual recognition tasks [
23,
24].
The deep learning methods for object detection can be grouped into two main streams, including the region-based methods and the region-free (regression-based) methods. Since the region-based convolutional neural network (R-CNN) [
25] has made breakthroughs on the PASCAL VOC dataset, the procedure consisting of the region proposal-based extractor with a detection network has become a classical paradigm in recent years. However, these approaches such as RCNN, Spatial Pyramid Pooling (SPP-Net) [
26], and Fast-RCNN [
27] are still hindered by the time consumption of the proposal of generation procedures and detection procedure. Ren et al. [
28], put forward a region proposal network (RPN) to substitute the typical region proposal methods, which shares convolutional features with a RPN and Fast R-CNN, and achieves end-to-end object detection. In these region-based methods, the proposed object boxes are generated and then passed to the deep convolutional neural networks for classification and location regression in the second stage. The other regression-based methods, including You Only Look Once (YOLO) [
29] and Single Shot Multi-Box Detector (SSD) [
30], treat object detection as a single shot problem, and directly predict bounding boxes and classification results simultaneously. In SSD, small convolutional filters are applied to each feature map to predict box offsets and category scores rather than fully connected layers in region-based methods. Additionally, SSD uses multi-representation that detect objects with different scales and aspect ratios. Multi-scale Convolutional Neural Networks (MS-CNN) [
31] and Feature Pyramid Networks (FPN) [
32] adopts the multi-scale feature pyramid form and fuse the output detection in the end.
CNN’s amazing benchmark breaking records and presented innovative structure have continuously motivated us to explore the better solutions for small, multi-scale object detection. As for remote sensing imagery, Han et al. [
33] proposed R-P-Faster R-CNN which added RPN to the original Faster R-CNN architecture and this method has achieved higher precision than other CNN-based models in the Northwestern Polytechnical University very high spatial resolution-10 (NWPU VHR-10) dataset [
24,
34]. Another workflow tried to address the geometric modeling problem in object detection and introduced CNN with deformable convolution layers embedded on Region-based Fully Convolutional Networks (R-FCN) [
35]. To reduce the number of false positive bounding boxes in distorted aspect ratio, the authors also proposed aspect ratio constrained non-maximum suppression (NMS) to eradicate false results and improve precision. The method proposed by Kang in [
36] also concatenate multi-layer features of each region proposal using region of interest (ROI) pooling before predicting final results in ship detection tasks. Although these region proposal based methods have achieved promising performance and fit the geometric properties of VHR targets well, they have poor adaptability in complex practical scenarios and are somewhat time consuming both in training and inference stage.
To remedy the limit of the two-stage frameworks, we mainly focus on the improvement of regression-based detection. In order to cover the shortage of small-sized object detection, experiments have been conducted by making combination of different layers in CNN. Deconvolution single shot detector (DSSD) [
37] introduces additional context into SSD via deconvolution to improve the accuracy. Deeply supervised object detector (DSOD) [
38] designs an efficient architecture and a set of principles to learn object detectors from scratch, also following the framework of SSD. Furthermore, GRP-DSOD [
39], a network which concatenates high-level semantic features and low-level spatial features in a single pyramid is proposed by Shen et al. Some researchers [
40] even aim to address the extreme class imbalance problem by re-designing the loss function or classification strategies. Although the progress made by one-stage detectors are inspiring, their ability for accurate positioning on multi-scale objects and small objects still has a large room for improvement. Some investigations such as [
41,
42] have leveraged scene context information to help object detection. Zhang et al. [
43] use semantic segmentation-aware CNN features to strengthen detection features by activation function for natural image challenge object detection. Nevertheless, this approach only considers learning relationship between channels and object classes in a channel-level attention while the scale information is too restricted to enrich the semantics at higher level layers.
Based on a backbone network that generates a low level detection feature map, semantic information from features of different level are learned in a hierarchical manner. Smaller objects are detected by lower layers, while larger ones are detected by higher layers. However, the feature of small objects generated by shallow layers only capture elementary visual patterns without enough semantic information. This may affect the performance on small object detection, and the quality of coarse features from top layers would also be impaired by the inadequate fine features from shallow layers.
To tackle the problem of restricted detection speed as well as inaccurate positioning especially for small objects, a novel end-to-end single shot detection framework, namely, recurrent detection with activated semantics (RDAS), is presented here for multi-class geospatial object detection from HSR remote sensing imagery. Semantic augmentation is divided into two stages and implemented during the whole network structure. In the first stage, a low-level detection feature map is enriched with strong semantic meaningful information supervised by bounding-box level segmentation ground-truth. This can be interpreted as an attention mechanism, where each channel of original low-level features is activated by a semantic attention map. For higher level detection feature maps, a refined location module which consists of several identical blocks is employed to enrich semantic information again and prune out unnecessary locating information in the second stage. By seamlessly incorporated into the SSD framework, which elegantly customizes it towards fast, accurate, single shot object detection, RDAS results in a forceful object detector that works reliably on multi-scale and multi-orientation objects with single input resolution.
The main contributions of this paper can be summarized as follows:
- (a)
Different from previous two-stage detectors for geospatial object detection in HSR images, we build a new regression-based detection framework which can play a crucial part in complex scenarios, detect small sized objects or objects with extremely different scales, and reduce repetitive detection regions of densely arranged targets.
- (b)
We improve the traditional single shot detectors by augmented semantic information. Our thought is achieved by developing a semantic segmentation branch to strength low-level spatial features with more meaningful high-level semantic features, which ensures the effectiveness of segmentation information and can be interpreted as an attention mechanism. This object regional attention greatly suppresses background interference in convolutional features, which turns out to reduce false detections as well as highlight challenging object patterns.
- (c)
We adopt gating functions to control message transmission and enhance the representation power of modules throughout the networks, which integrates attention from local and global view.
The proposed method with enriched semantics is evaluated on a publicly available remote sensing object detection dataset and then compared with current state-of-the-art approaches. The experimental results confirm our elaborate design and demonstrate the effectiveness and efficiency of our method. With this method, objects in VHR remote sensing images will be better understood by RDAS with less time consumption and more condensed computation resources.
The rest of this paper is organized as follows.
Section 2 describes the details of the proposed method.
Section 3 presents the experiments conducted on NWPU VHR-10 dataset to validate the effectiveness of the modified framework.
Section 4 presents the analysis of the experimental results and the discussion of the results, respectively. Finally,
Section 5 concludes this paper.
2. Proposed Method
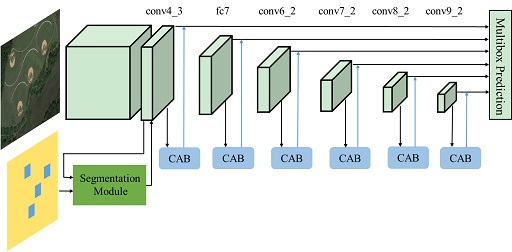
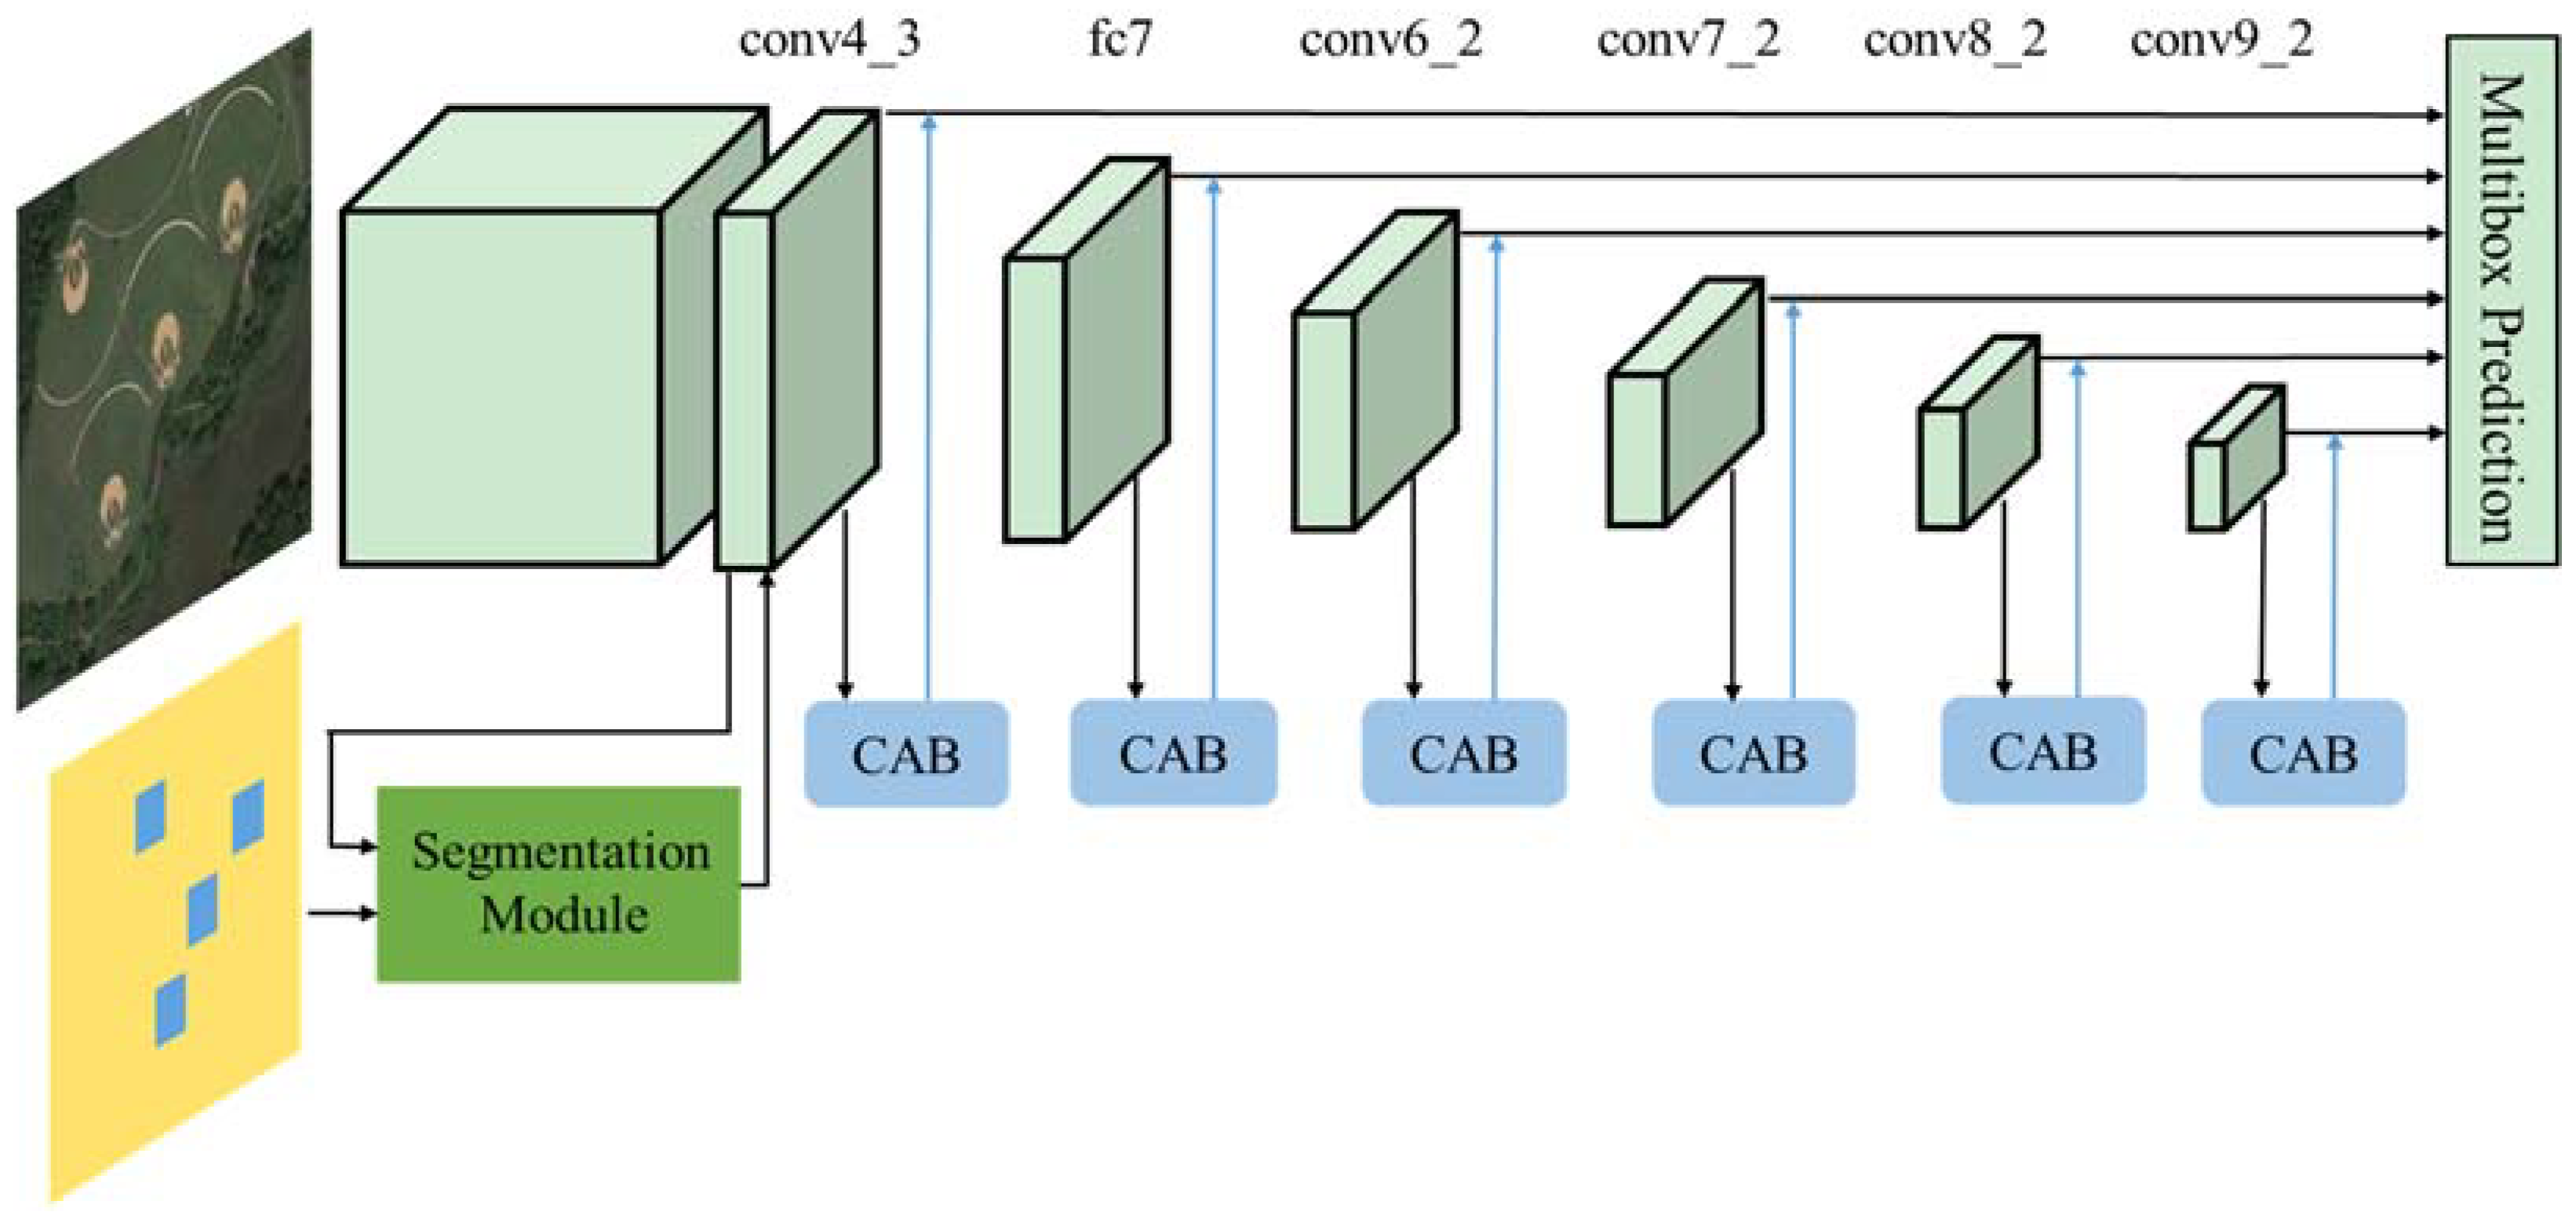
Figure 1 shows the overall architecture of RDAS. The framework is mainly composed of two components, namely segmentation branch and the main detection branch for prediction upon multi-scale response maps. The backbone VGG16 used in typical single shot detector acts as a sub-network for detection in RDAS and it is represented in the upper part of
Figure 1. The convolutional architecture of the SSD is extended from the 16-layer VGGNet, by replacing the fully-connected (FC) layers fc6, fc7 with several convolutional layers and changing pool5 from 2
2-
s2 to 3
3-
s1. As represented in
Figure 1, conv4_3 denotes the third convolutional operation in the fourth convolutional block and other identifiers mean similarly, while fc7 is the last layer of VGG16 because we remove all the dropout layers and the fc8 layer. Since the early network layers are based on VGG16 used for image classification (truncated before classification layers), the convolutional feature maps from conv6_2 to conv9_2 are added as auxiliary structure on top of the base network. The conv4_3 up to conv9_2 indicates the detection source layers. To augment the low level detection feature map with strengthened semantic information, a segmentation module is introduced as shown in the lower left part of
Figure 1. For the high level feature maps, we explore an alternate direction of recalibrating the feature maps adaptively, to boost meaningful features with activated semantics, while suppressing weak ones. In the lower right part of
Figure 1, a refined location module which contains several identical blocks called concurrent global attention blocks (CABs), is presented to strengthen the useful feature maps from the main detection branch. Both segmentation module and refined location module play an indispensable role of enriching semantic information and multi-scale information incorporation is achieved in a recurrent way. The rest of this section describes the details of the proposed method and analyzes the motivation behind our design.
2.1. Semantic Enrichment at Low Level Layer
In a typical CNN model, convolutional features in a lower layer often focus on local image details, while the features from deeper layer generally capture more abstracted information. The segmentation branch was introduced to enrich sematic information at low-level detection feature layer, which was achieved in a weakly supervised way. The low-level detection layer conv4_3 from original SSD and segmentation ground truth from bounding-box level were taken as inputs, and a semantic oriented feature map with the same dimension as the ground truth was generated.
Our segmentation module, identified as a green rectangular in
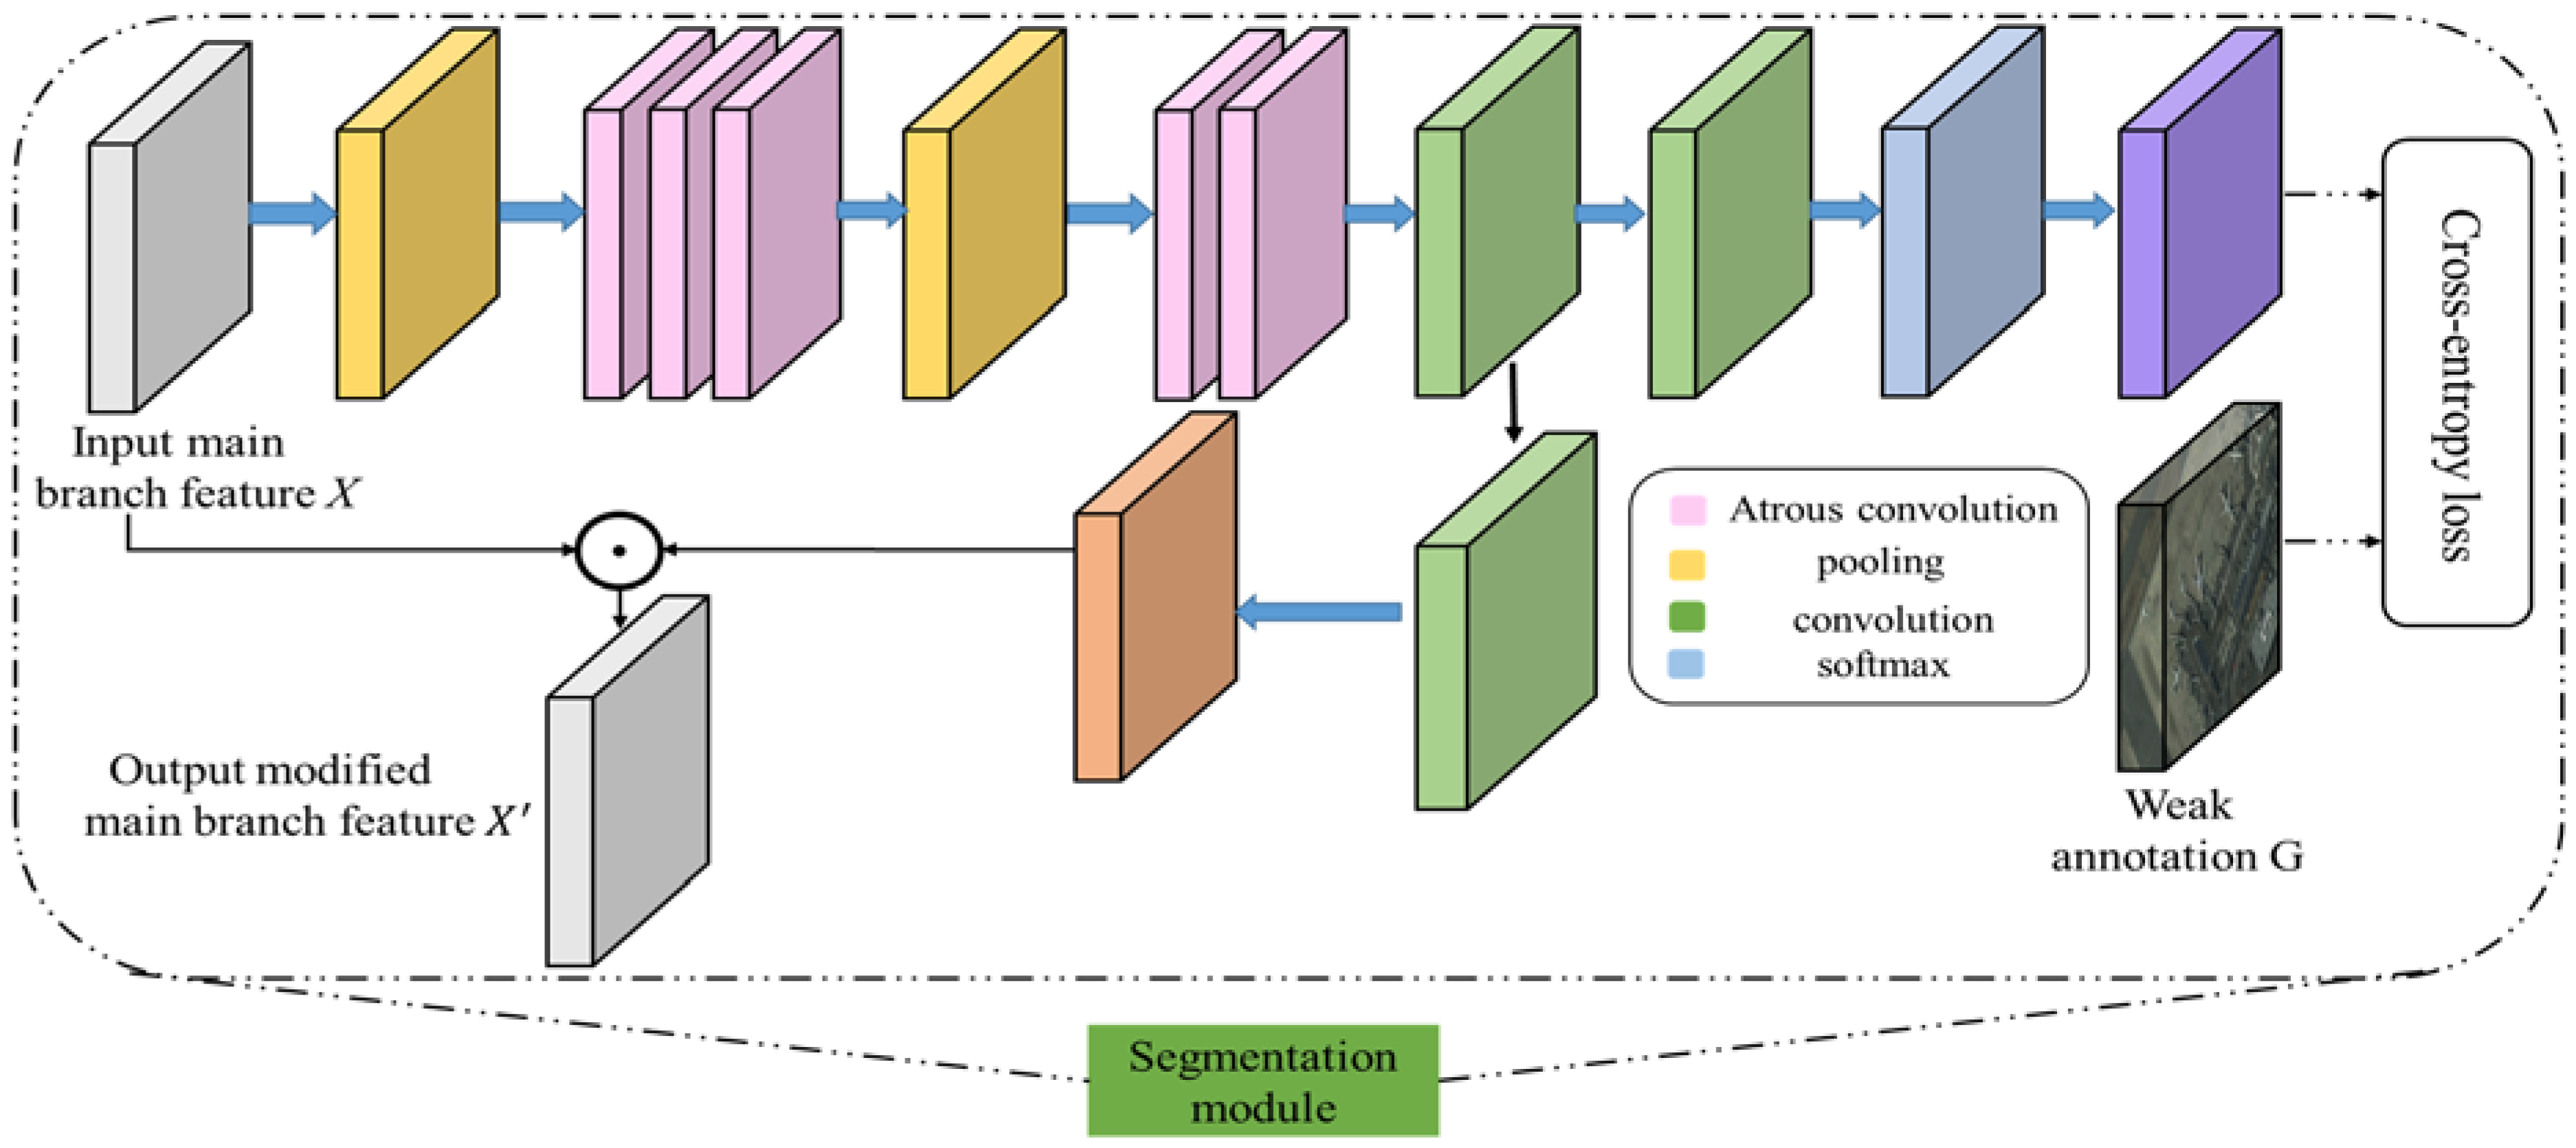
Figure 1, was able to automatically learn rough spatial regions of objects from the convolutional features. This semantic segmentation to object was then directly encoded back into the convolutional features, where target-related features are strongly strengthened by suppressing background interference in the convolutional maps, as shown in
Figure 2.
Since atrous convolution [
44] allows us to explicitly control the resolution at which features responses are computed within CNNs, the dense prediction tasks such as semantic image segmentation usually highlight this atrous convolution. We deployed this powerful operator in the segmentation branch. It allowed us to effectively enlarge the field of visualization of filters to incorporate large context without increasing the number of parameters or the amount of computation. Specifically, we added five atrous convolutional layers with 3
3 kernel size after the input feature map
X from main branch. The first three atrous convolutional layers had a dilation rate of 2 and the last two atrous convolutional layers had a dilation of 4. After that, another 1
1 convolutional layer was deployed to generate the intermediate feature map denoted as
G(X). This feature map was used to generate segmentation prediction and provide high semantic information to strengthen the input feature map from main branch. To this end, there were two paths linked to
G(X). The first path included a 1
1 convolution layer with
N+1 output channels followed with a softmax layer to generate the segmentation prediction
Y. The second path took another 1
1 convolutional layer to generate a semantic meaningful feature map
Z, which enjoys the same output channel number with that of
X. After that, we activated the feature map from main branch by element-wise multiplication. All these layers were elaborately designed to ensure the size of feature maps was invariable.
As shown in
Figure 2, we gave a mathematically definition of the segmentation branch. Let
be the low level detection feature map from the main detection branch,
C,
H,
W represents the channel number, the height and width of the feature map respectively. The weak annotation
means the segmentation ground truth where
N is the number of classes in the dataset. The segmentation branch predicts the per-pixel class assignment where:
satisfying:
is the intermediate result which will be further used to generate the output local activation feature map
Z:
This sematic meaningful feature map Z is then used to strengthen the original low level detection feature map X by element-wise multiplication: .
In this way, the semantically strengthened low level detection feature map will contain both basic visual patterns and high level semantic information. The proposed segmentation branch is formulated in an unified framework which is trained end to end by allowing for computation back propagations through all layers.
As for the problem of generating segmentation ground-truth given the object bounding boxes, we denoted this segmentation ground-truth as SG and ensure it has the same resolution as the input of segmentation branch. This strategy guarantees that there is only one class to be distributed to each pixel in SG. For a pixel locates within a bounding-box on an image patch I, we assigned the label of the bounding box to . If this pixel was located in more than one bounding boxes, the label of the bounding box with the smallest size was chosen as the class of the pixel. Otherwise, if it did not locate in any bounding box, we assigned it to the background class.
2.2. Semantic Activation at Low Level Layer
Motivated by the goal of guaranteeing that our detection network could adaptively filtrate the representative scales for objects with different sizes, we proposed to introduce a two-level attention mechanism and broadcasted identity mapping principle to enrich the semantic information of each prediction layer. This ingenious design was partially inspired by SENets [
45], which showed the best performance in the ILSVRC 2017 classification challenge. In this way, the useful features in a suitable resolution would be intensified and less useful ones would be weakened correspondingly. The block in the refined location module called CAB, consisted of two main stages that could be seen as an effective gating mechanism which combined attention both locally and globally.
Figure 3 shows a diagram of our structure.
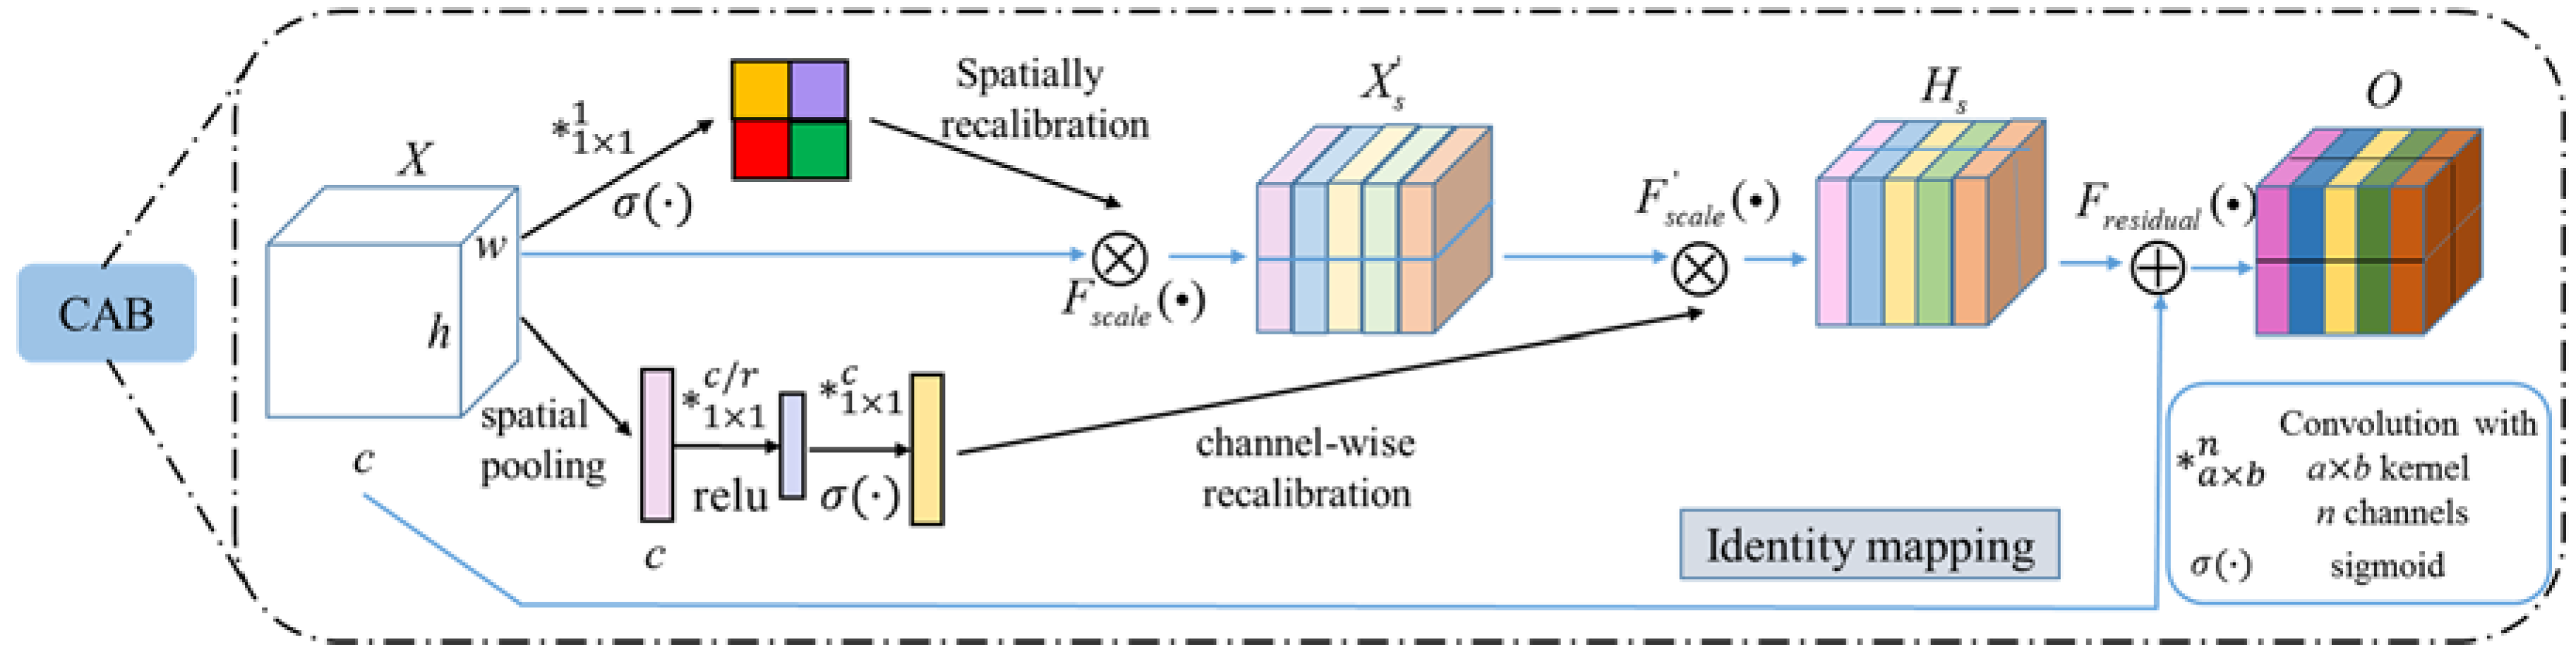
As the previously introduced SE block only excited channel-wise, which proved to be effective for classification, we introduced variants of SE blocks for object detection. Considering the pixel-wise spatial information is more representative for object detection, we introduced another SE block, which squeezed along the channels and excited spatially. Finally, we proposed the introduction of concurrent attention blocks that recalibrated the feature maps to be informative both channel-wise and spatially. The two SE blocks were integrated into CAB and we explained it in two parts: concurrent attention with channel-level, and global-level and identity mapping.
For the upper branch part in
Figure 3, the Squeeze and Excitation block [
45] was applied in our structure as channel level attention, which consisted of: (i) a spatial pooling stage
for global information embedding; and (ii) an excitation stage
for channel-wise recalibration. In this way the channel-level will output feature map as:
Formally, given the input feature map
, the spatial pooling stage will produce a vector
calculated by:
where
is the
c-th element of
z.
The excitation stage is composed of two fully-connected layers with different dimensions of output plus a sigmoid activation.
This can be seen as a gating mechanism to limit the model complexity and aid generalization, so a dimensionality-reduction layer with parameters
with reduction ratio
r and a dimensionality-increasing layer with parameters
are produced. Then, we can express the excitation stage as:
where
refers to the ReLU function,
and
. Here, we choose
.
Then, we can express:
where
denotes channel-wise multiplication.
While our global attention in the bottom branch in
Figure 3 takes the feature map
X as the input, and different from the upper branch, we squeeze the feature map along the channels and excites spatially. The modified excitation stage can be denoted as:
Here, we considered an arbitrary slicing of the input tensor
, where
corresponding to the spatial location (
i,
j) with
and
. The spatial squeeze operation is achieved by a convolution with weight
, generating a projected tensor
. Each element of the projection represents the linearly combined representation for all channesl
C for a global location (
i,
j) in the channel-wise attentioned feature map
. This projection can then be passed through a sigmoid layer to rescale activations to [0,1]. Finally, the global-level attention used to excite
can be calculated by:
In the stage of broadcasted identity mapping, addition operation [
46]
is used to obtain the final outputs:
where
denotes the element-wise addition.
The final combined feature map contains both fundamental visual patterns and high level semantic information. All these layer are well-designed to guarantee the size of feature maps unchanged.
Since the semantic information from higher level detection layers was already inherited from previous layers, it was not necessary to adopt the segmentation branch for higher layers. Moreover, the small resolution of coarse features made it harder to do the segmentation task on them. Due to the above reasons, we employed an unambiguous refined location module, to strengthen the semantic information of feature maps from fc7 to conv9_2 in a recurrent fashion.
The refined location module was shown in the right lower part of
Figure 1, which included several identical global attention blocks. Those blocks were attached at each object detection source layers in the detection branch. As illustrated in
Figure 3, concurrent attention blocks can learn the relationship between channels and object classes, by recalibrating the input feature map both spatial and channel-wise information. In this way, the refined location module encouraged the network to learn more representaive feature maps, thus making the final location of bounding boxes more accurate.
2.3. Multi-Task Training
The modified feature maps obtained by semantic activation can be fused to train our newly presented detector. Similar to the principle in SSD, two 3
3 convolutional layers are added on top of the feature maps of detection branch to obtain the classification scores and bounding box results. The original object detection loss function
can be represented as:
where
i is the index of default box in a mini-batch, and
and
are the predicted object category and coordinates of the bounding box being processed by CAB.
means the ground truth class label of default box
i,
is the ground truth location and size of the default box. The multi-class classification loss
means the softmax loss over multiple classes confidences and the smooth
loss
represents the regression loss similar to that in Fast R-CNN [
27]. The Iverson bracket indicator function
outputs 1 when the condition is true, and 0 otherwise.
For segmentation branch, we introduce another cross-entropy loss function
which is denoted as:
where
is the segmentation prediction.
By adding the new segmentation loss in conjunction with the original detection loss function, the final object function we are optimizing is defined as:
where
is a parameter to tradeoff between the task of segmentation and detection.
Current one-stage methods rely on one-step regression and use various feature maps with different scales to predict the locations and sizes of objects, which is rather inaccurate in some challenging scenarios especially for small scaled objects. To this end, we supposed to use semantic information and then modify the original feature layers in the detection branch. That is, CAB provided better initialization for the final regression. Specifically, we associated n anchor boxes with each regularly divided cell on the feature map. The initial position of each anchor box relatively to its corresponding cell was fixed. Processed by CAB, the corresponding feature maps were passed to generate specific object categories and accurate object locations and sizes. This procedure was similar to the default boxes used in SSD. Instead of directly using the regularly tiled default boxes for detection, CAB takes the initial anchor boxes as input for further detection, leading to more precise detection results.
4. Results
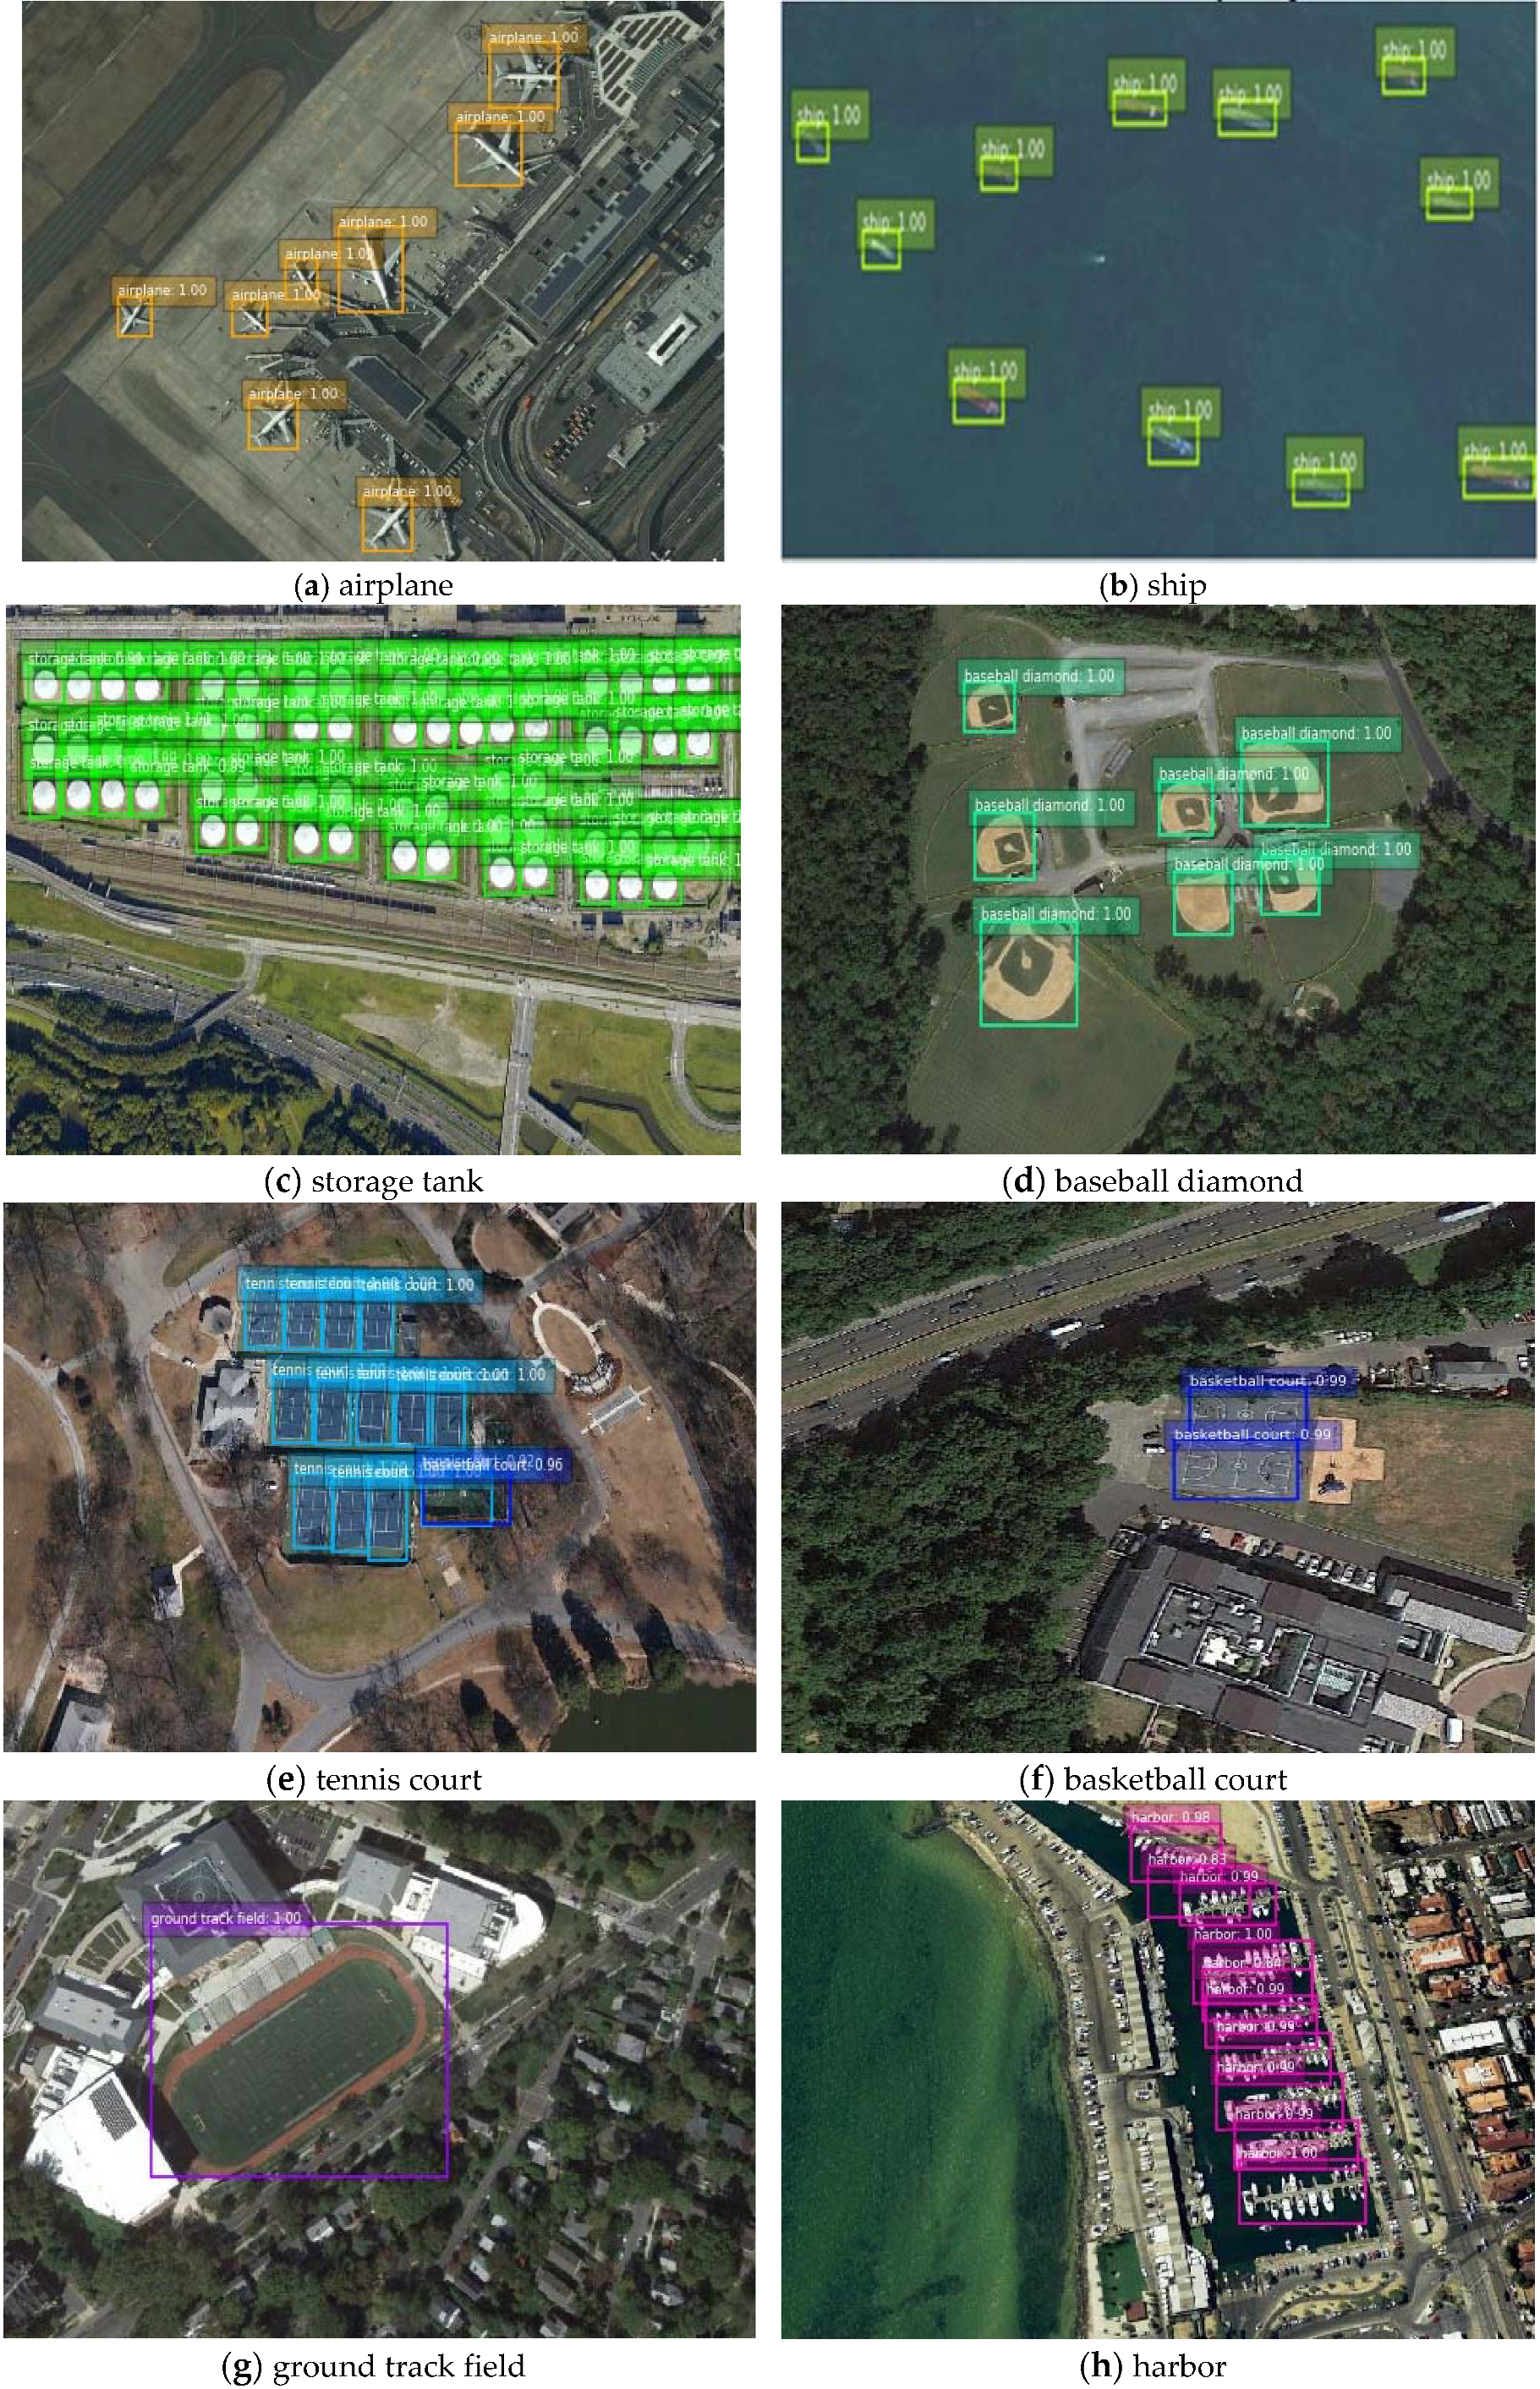
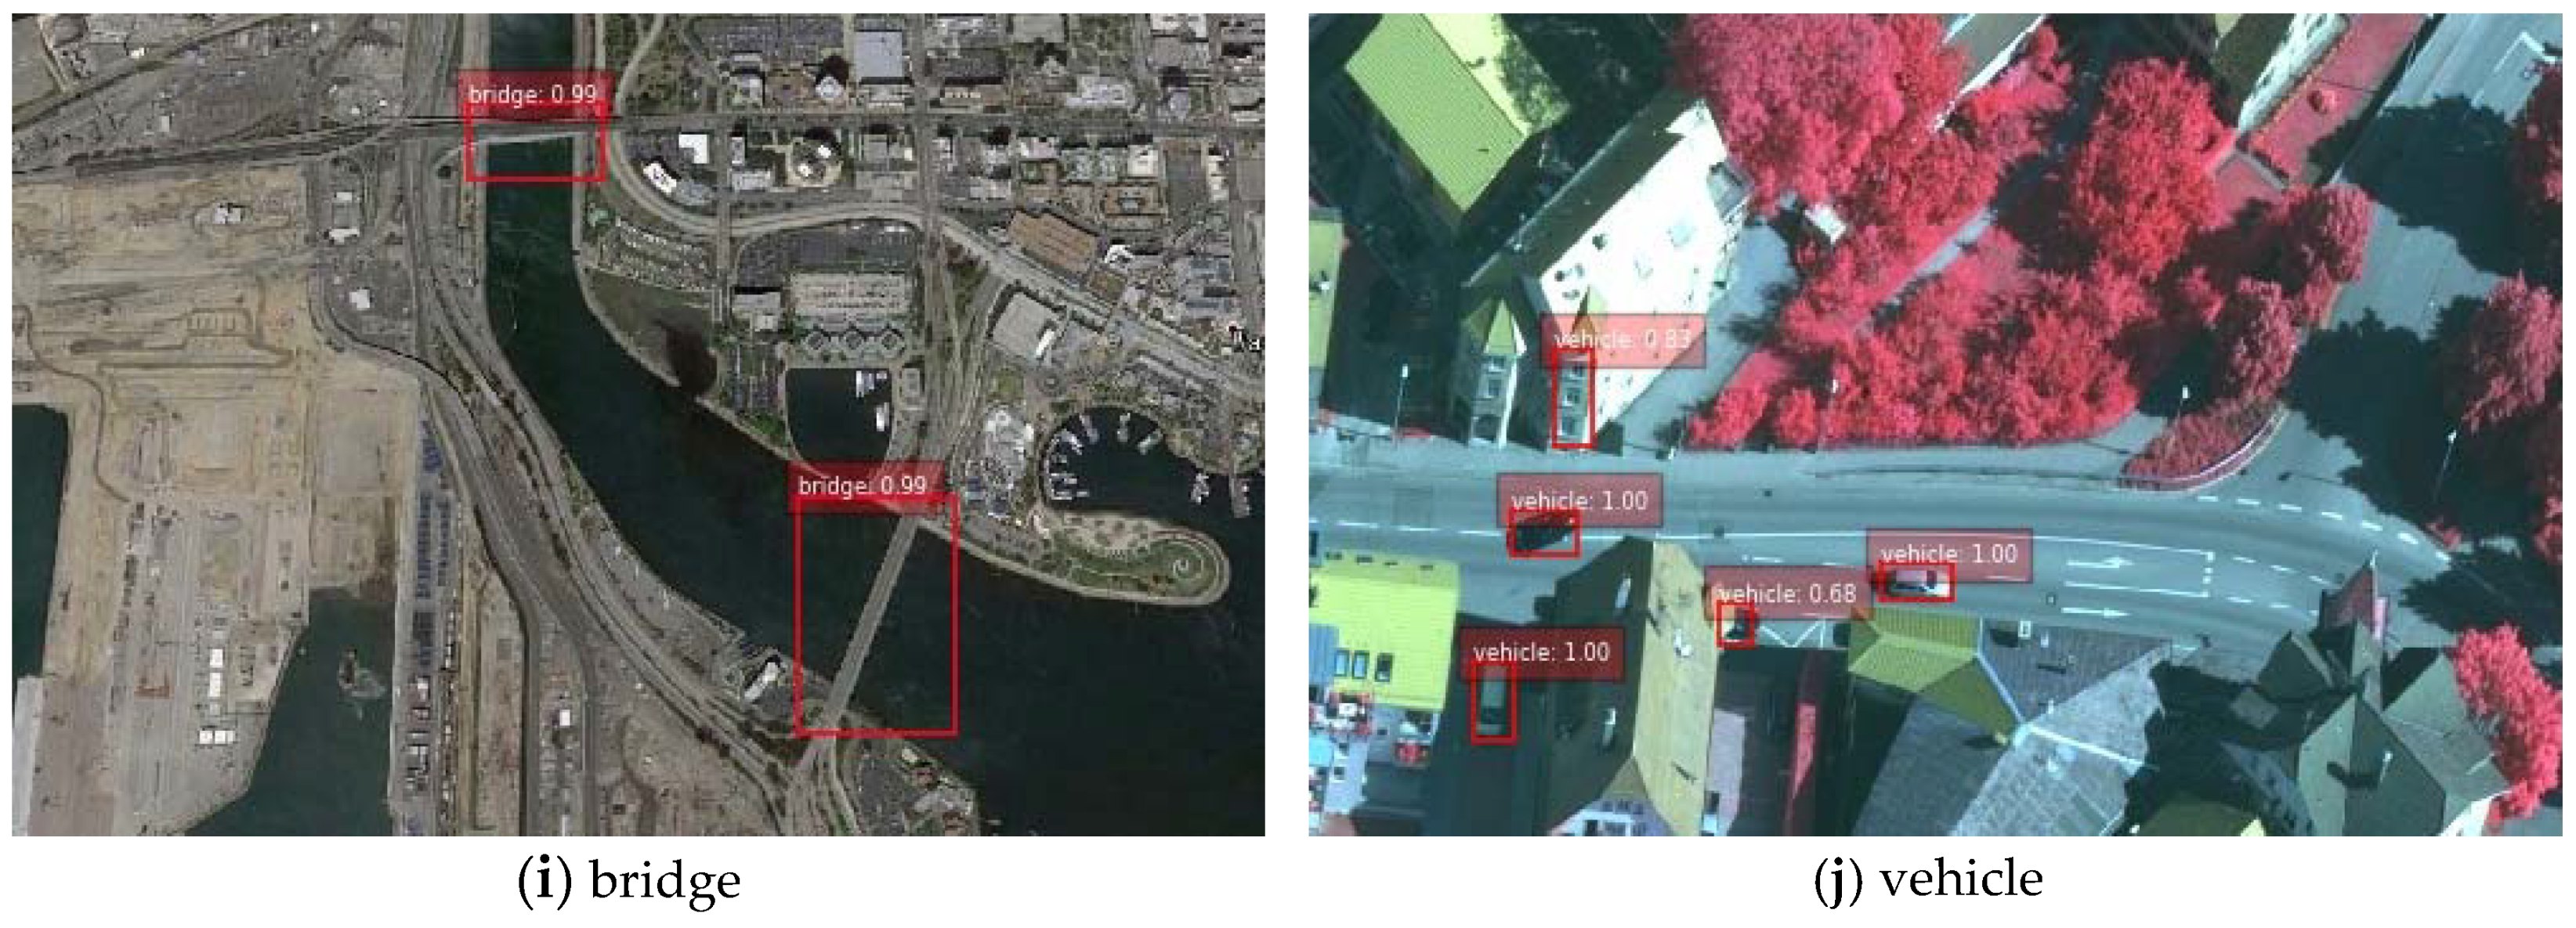
Experiments on enriched semantics strategies verified the effectiveness of the proposed method in remote sensing object detection, especially in the detection of small-sized targets and densely packed objects. Visualization of the objects detected by the proposed approach in NWPU VHR-10 dataset is shown in
Figure 4. The predicted bounding boxes which match the ground truth bounding boxes with Intersection-over-Union (IoU) > 0.5 are plotted in different colors according to the categories. From
Figure 4, the newly presented detector could generate satisfactory bounding boxes that covered most of the targets even when recognizing orientation variant targets or densely arranged objects such as storage tanks, tennis courts, and especially harbors. Besides, the detection performance for extremely small scales objects, like ships in
Figure 4b and vehicles in
Figure 4j was also promising. Unlike general SSD, which produces a plethora of bounding boxes with low IOU and confidence scores by multi-scale prediction, our method could exclude most of the false bounding boxes and suppress some false alarms by refined location module. Although our detectors could cover most objects, there still existed a small number of overlapped bounding boxes which had a large intersection with others, as shown in
Figure 4h where harbors were closely aligned.
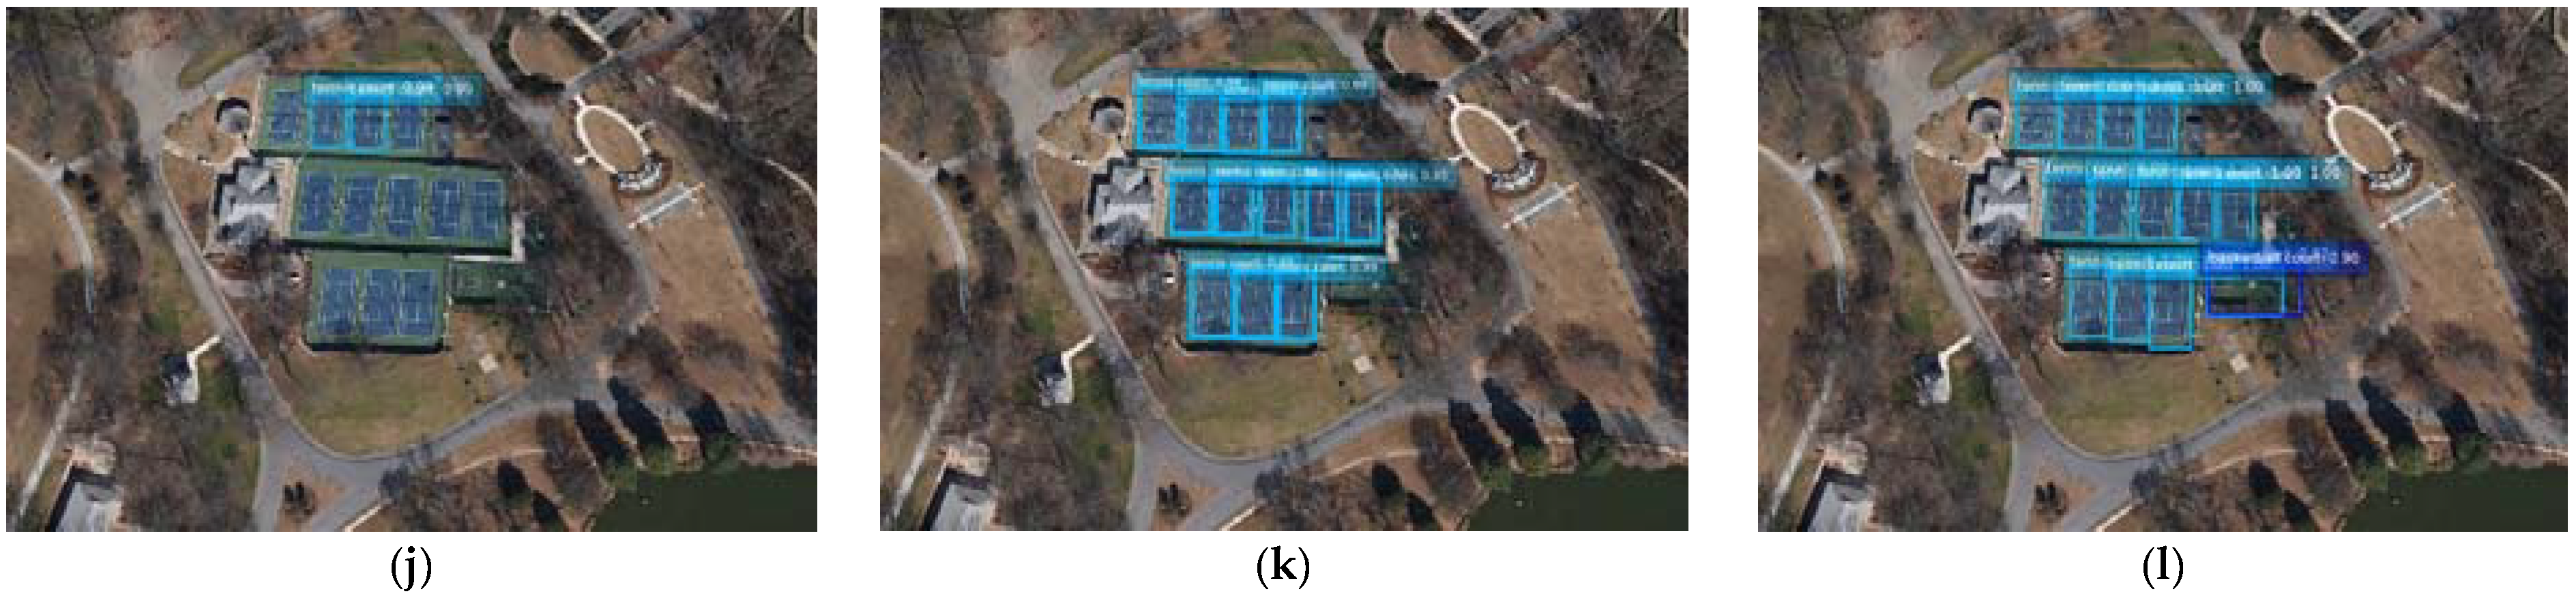
To explicitly analyze the superiority of our detector, we displayed ships, storage tanks, vehicles, basketball courts, and baseball diamonds detected by applying SSD, improved methods based on SSD, and our method in
Figure 5. As shown in
Figure 5a,d,g,j, only a small fraction of objects with extremely small sizes were detected by SSD. Nevertheless, the improved single-shot stage based methods indeed detected more small scaled targets to some extent, while the remaining parts were still omitted. The newly presented method resulted in a better performance in the given scenes. Not only small-sized targets such as ships and closely aligned targets such as storage tanks and tennis courts are successfully detected, but also a basketball court arranged around the tennis court was well detected in
Figure 5l. All the amazing results benefited from the segmentation branch and attention mechanism used to enrich the semantic information.
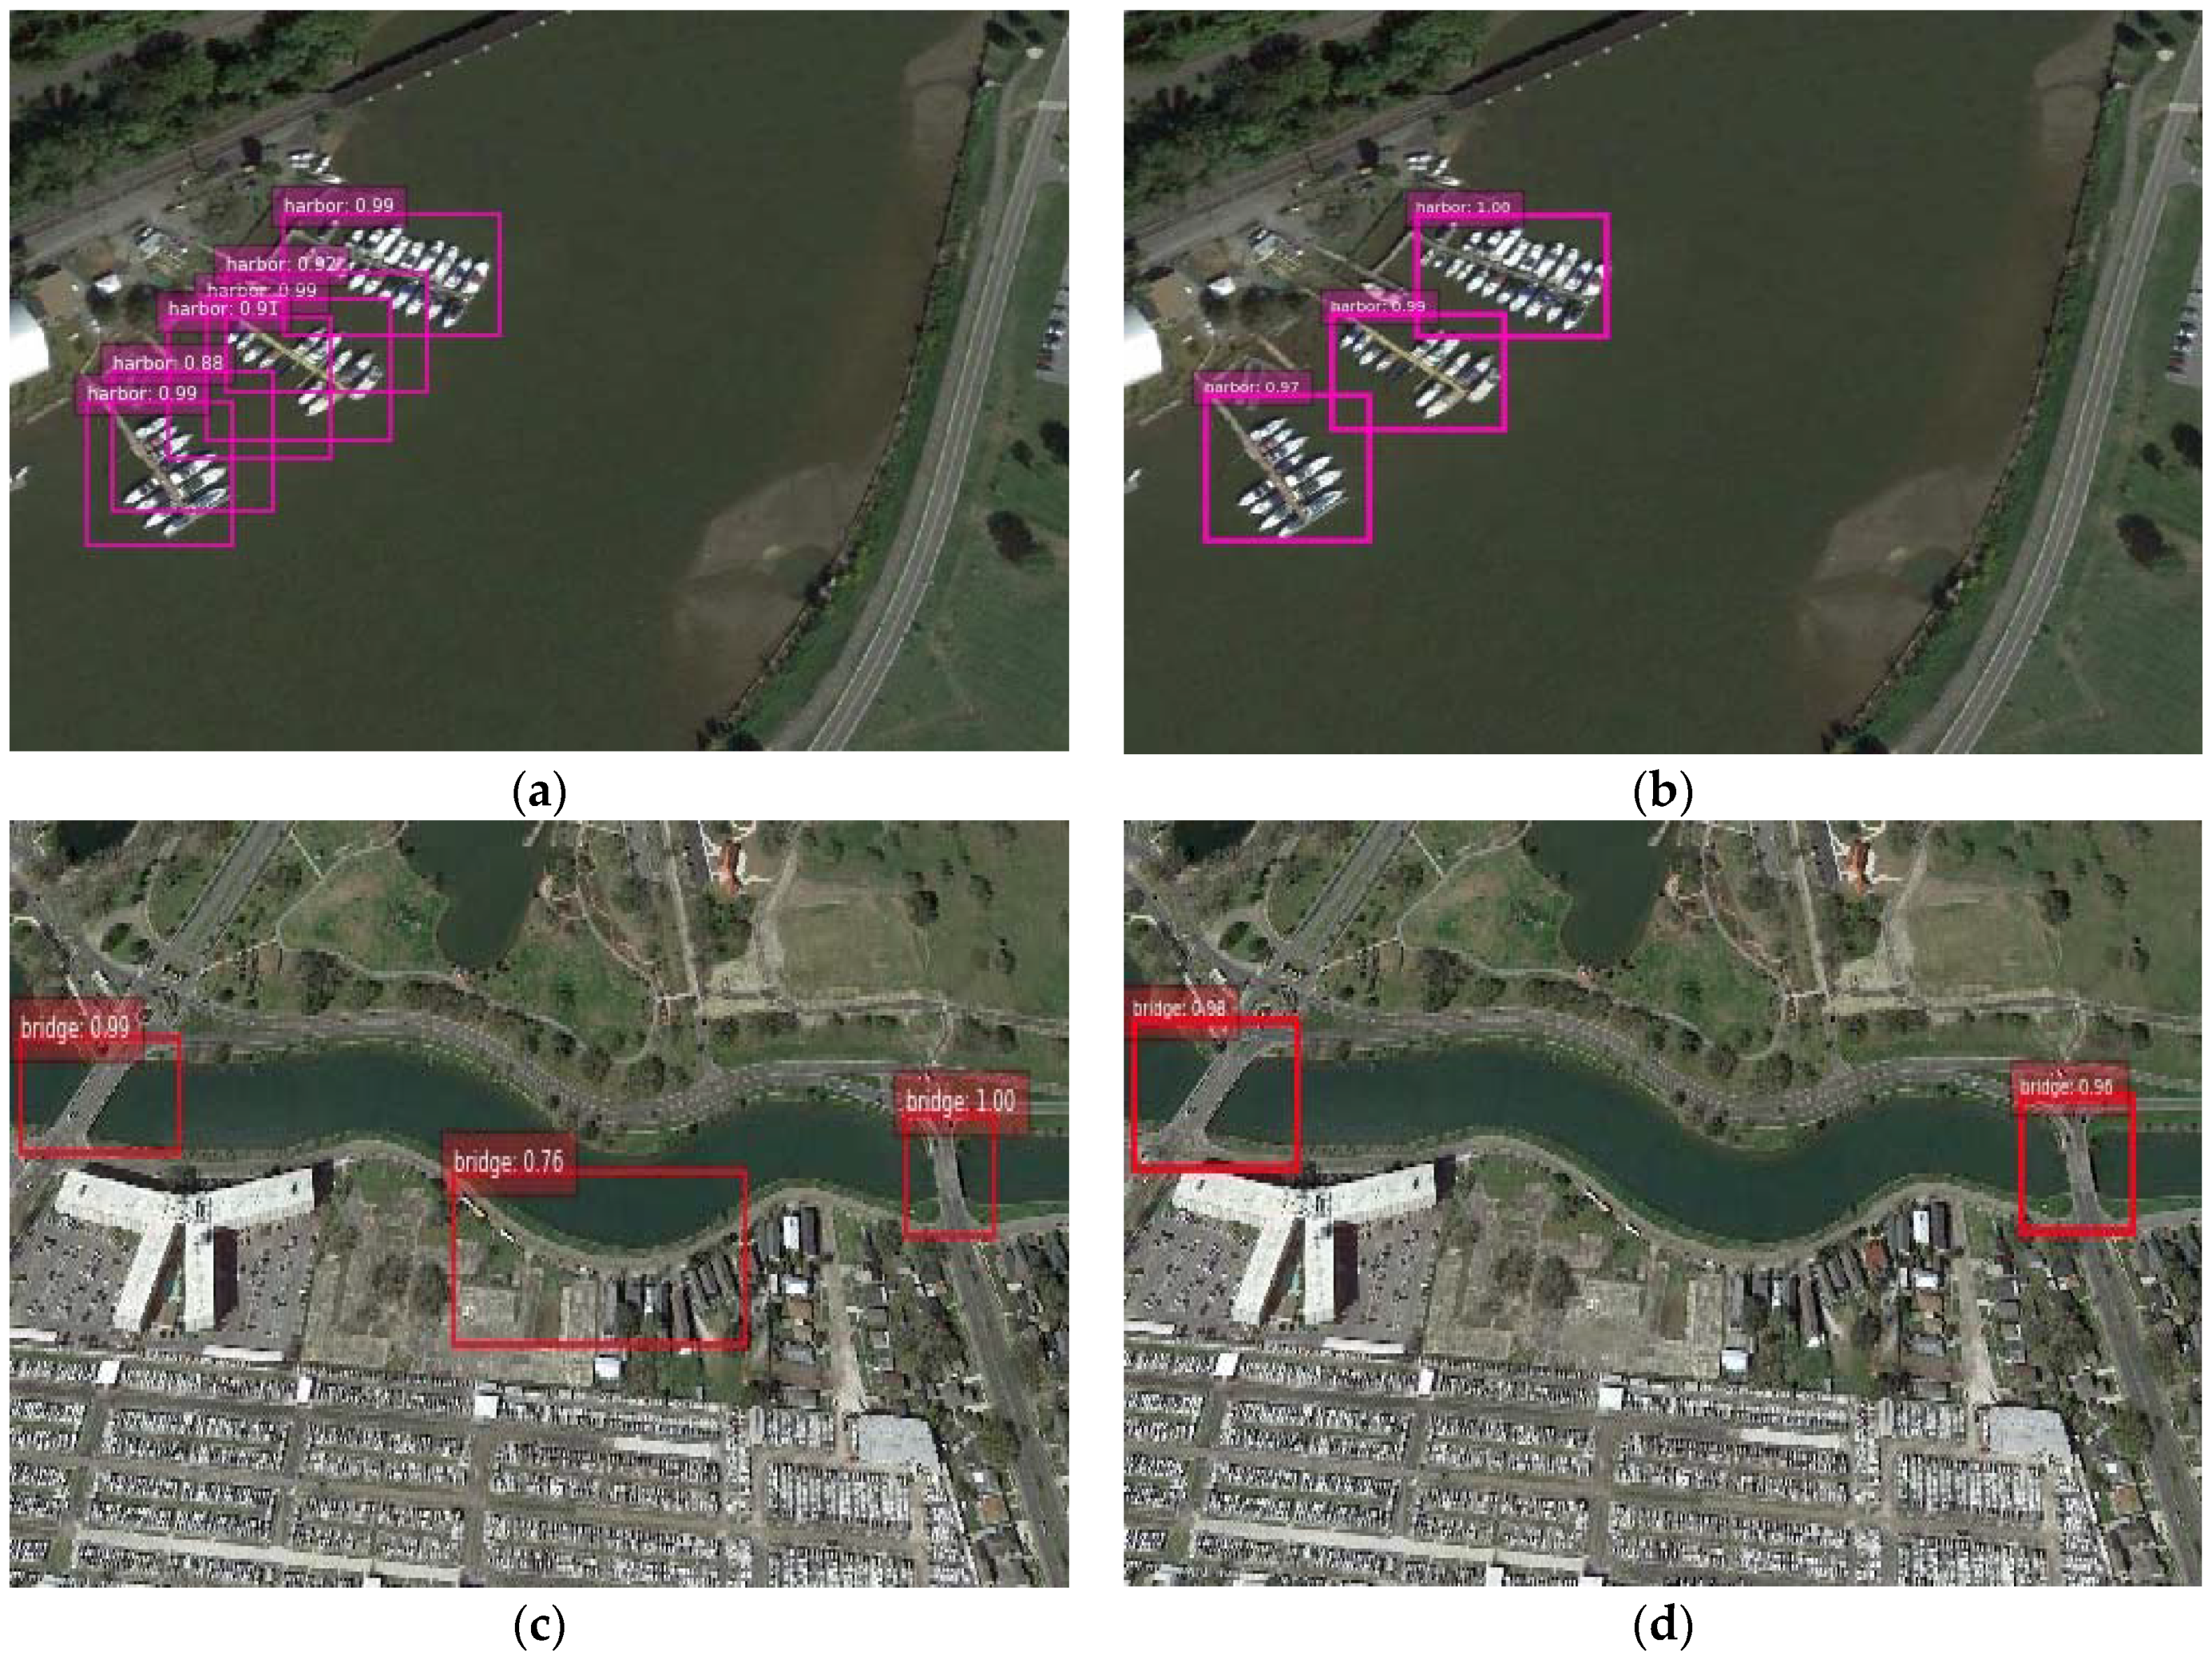
The method of enriching semantics at higher level layer proposed in [
43] only introduces channel-level attention while spatial information also counts in the task of object detection. For the purpose of validating the effectiveness of two-level attention mechanism introduced in the CAB module, we demonstrate the experimental results using the segmentation branch combined with channel-level attention and two-level attention, respectively. In
Figure 6a, for one object with irregular shape, more than one bounding box was predicted to locate the target if we applied channel-level attention; nevertheless, the redundant bounding boxes were eliminated by two-level attention. As for the false alarm displayed in
Figure 6c, the margin of the river was mistaken as a bridge while it was suppressed in our method.
In the following subsection, quantitative and qualitative analysis will be presented to evaluate the performance of the SSD with enriched semantics.
4.1. Quantitative Evaluation of NWPU VHR-10 Dataset
To validate the effectiveness of the proposed method, object detection experiments are divided into methods based on traditional or region-based approaches and regression-based approaches. In
Table 1 and
Table 2, we display the quantitative comparisons measured by AP values from two main stream methods, respectively. The best AP value of each category is bold in
Table 2.
Table 3 shows the average running time per image of some methods. The recall rate value is displayed in
Figure 7. In review of some region-based methods, the RICNN [
34] with fine-tuning method uses AlexNet pre-trained on ImageNet. Apart from the Zeiler and Fergus (ZF) model, the R-P-Faster R-CNN used the VGG16 training mechanism, which contains single fine-tuning and double fine-tuning. The deformable R-FCN with arcNMS was fine-tuned on the ResNet-101 ImageNet pre-trained model. The Multi-Scale CNN initializes the parameters with VGG16 by the model pre-trained on ImageNet. As shown in
Table 1, the application of multi-scale strategy in region-based method has shown a superior high average precision value. From
Table 2, among all the single-shot stage based methods, the proposed RDAS, once fine-tuned on the VGG16 ImageNet pre-trained model, obtained the amazing performance and pushes the benchmark into 89.5%, which is slightly lower than the best result in the region-based method while greatly cuts down the processing time. Although some innovative methods such as DSSD, DSOD, GRP-DSOD have achieved surprising improvement on the whole, there still exists some weakness in performances when compared to the newly presented method as indicated in
Table 2. After segmentation branch was added to the recurrent detection with activated semantics, the APs among all the objects all increased, including basketball court (0.844 to 0.948), harbor (0.759 to 0.826), bridge (0.738 to 0.772), and vehicle (0.808 to 0.865) are all increased. Compared with the region-based method, the APs of ship, ground track field as well as harbor still can be boosted by further strategies.
Except the above evaluation indexes, we also take the computational efficiency as an important factor for evaluating the performance of the proposed algorithm. To quantitatively evaluate the inference speed, we run RDAS, SSD, as well as some other competitors on our machine to compare the speed fairly and
Table 2 shows the average running time of all previous approaches. From the results in
Table 2, it can be confirmed that our method can achieve a relatively high average precision without large time consumption.
For object detection in remote sensing, the running time per image of RDAS was slightly slower than the VGG16-based SSD given its additional modules while it is faster than the two-stage detectors.
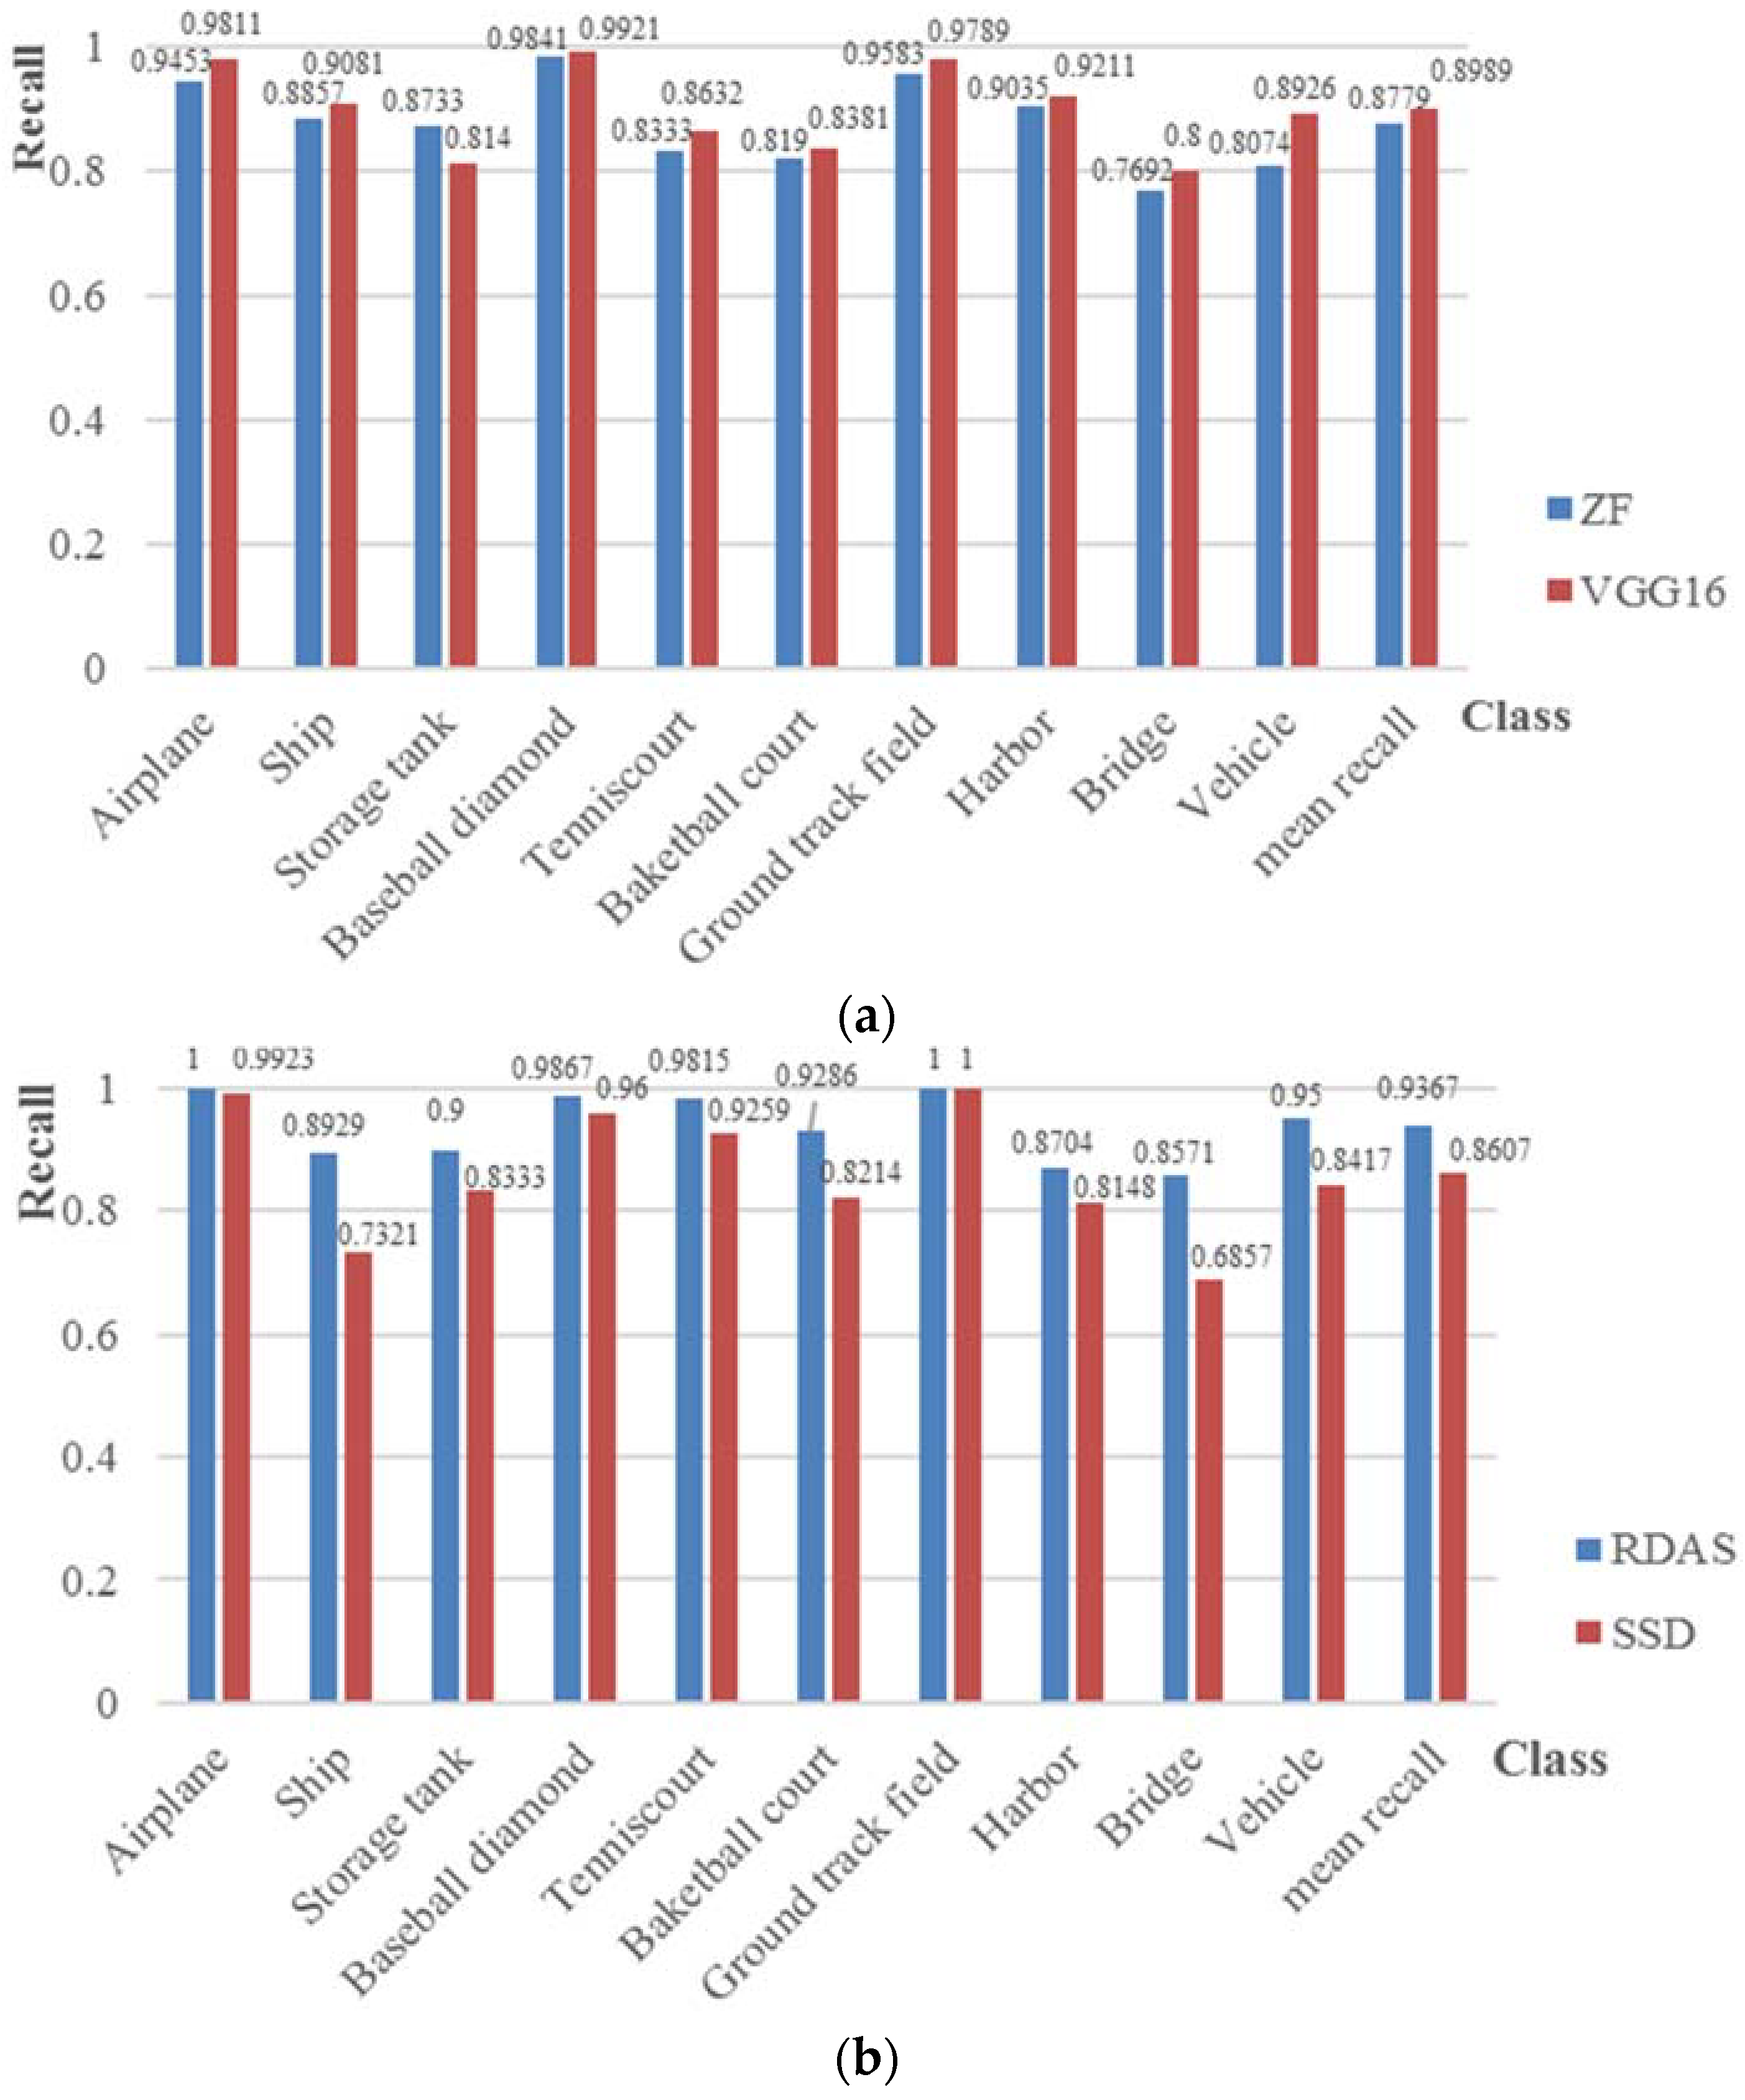
Figure 7 demonstrates the recall values of Faster R-CNN fine-tuned with ZF and VGG16 model, the VGG16-based SSD and the proposed RDAS, which achieves an overall recall rate of 0.9367. From the overall view, it can be concluded that the recall value of the proposed one-stage detector with enriched semantics based on VGG16 is higher than the original SSD under the same training conditions. Compared with region-based methods such as Faster R-CNN, the recall values of tennis court, basketball court, ground track field, and vehicle were escalated by at least 0.1 on average. In
Figure 7, it can be seen that the classes of airplane, baseball diamond, tennis court, ground track field and vehicle can obtain high recall values of greater than 0.95; however, the classes of harbor and bridge presents worse recall values. Furthermore, to balance the trade-off existing between precision and recall, the following PRC explains the limitation of evaluating the performance of various CNN architectures.
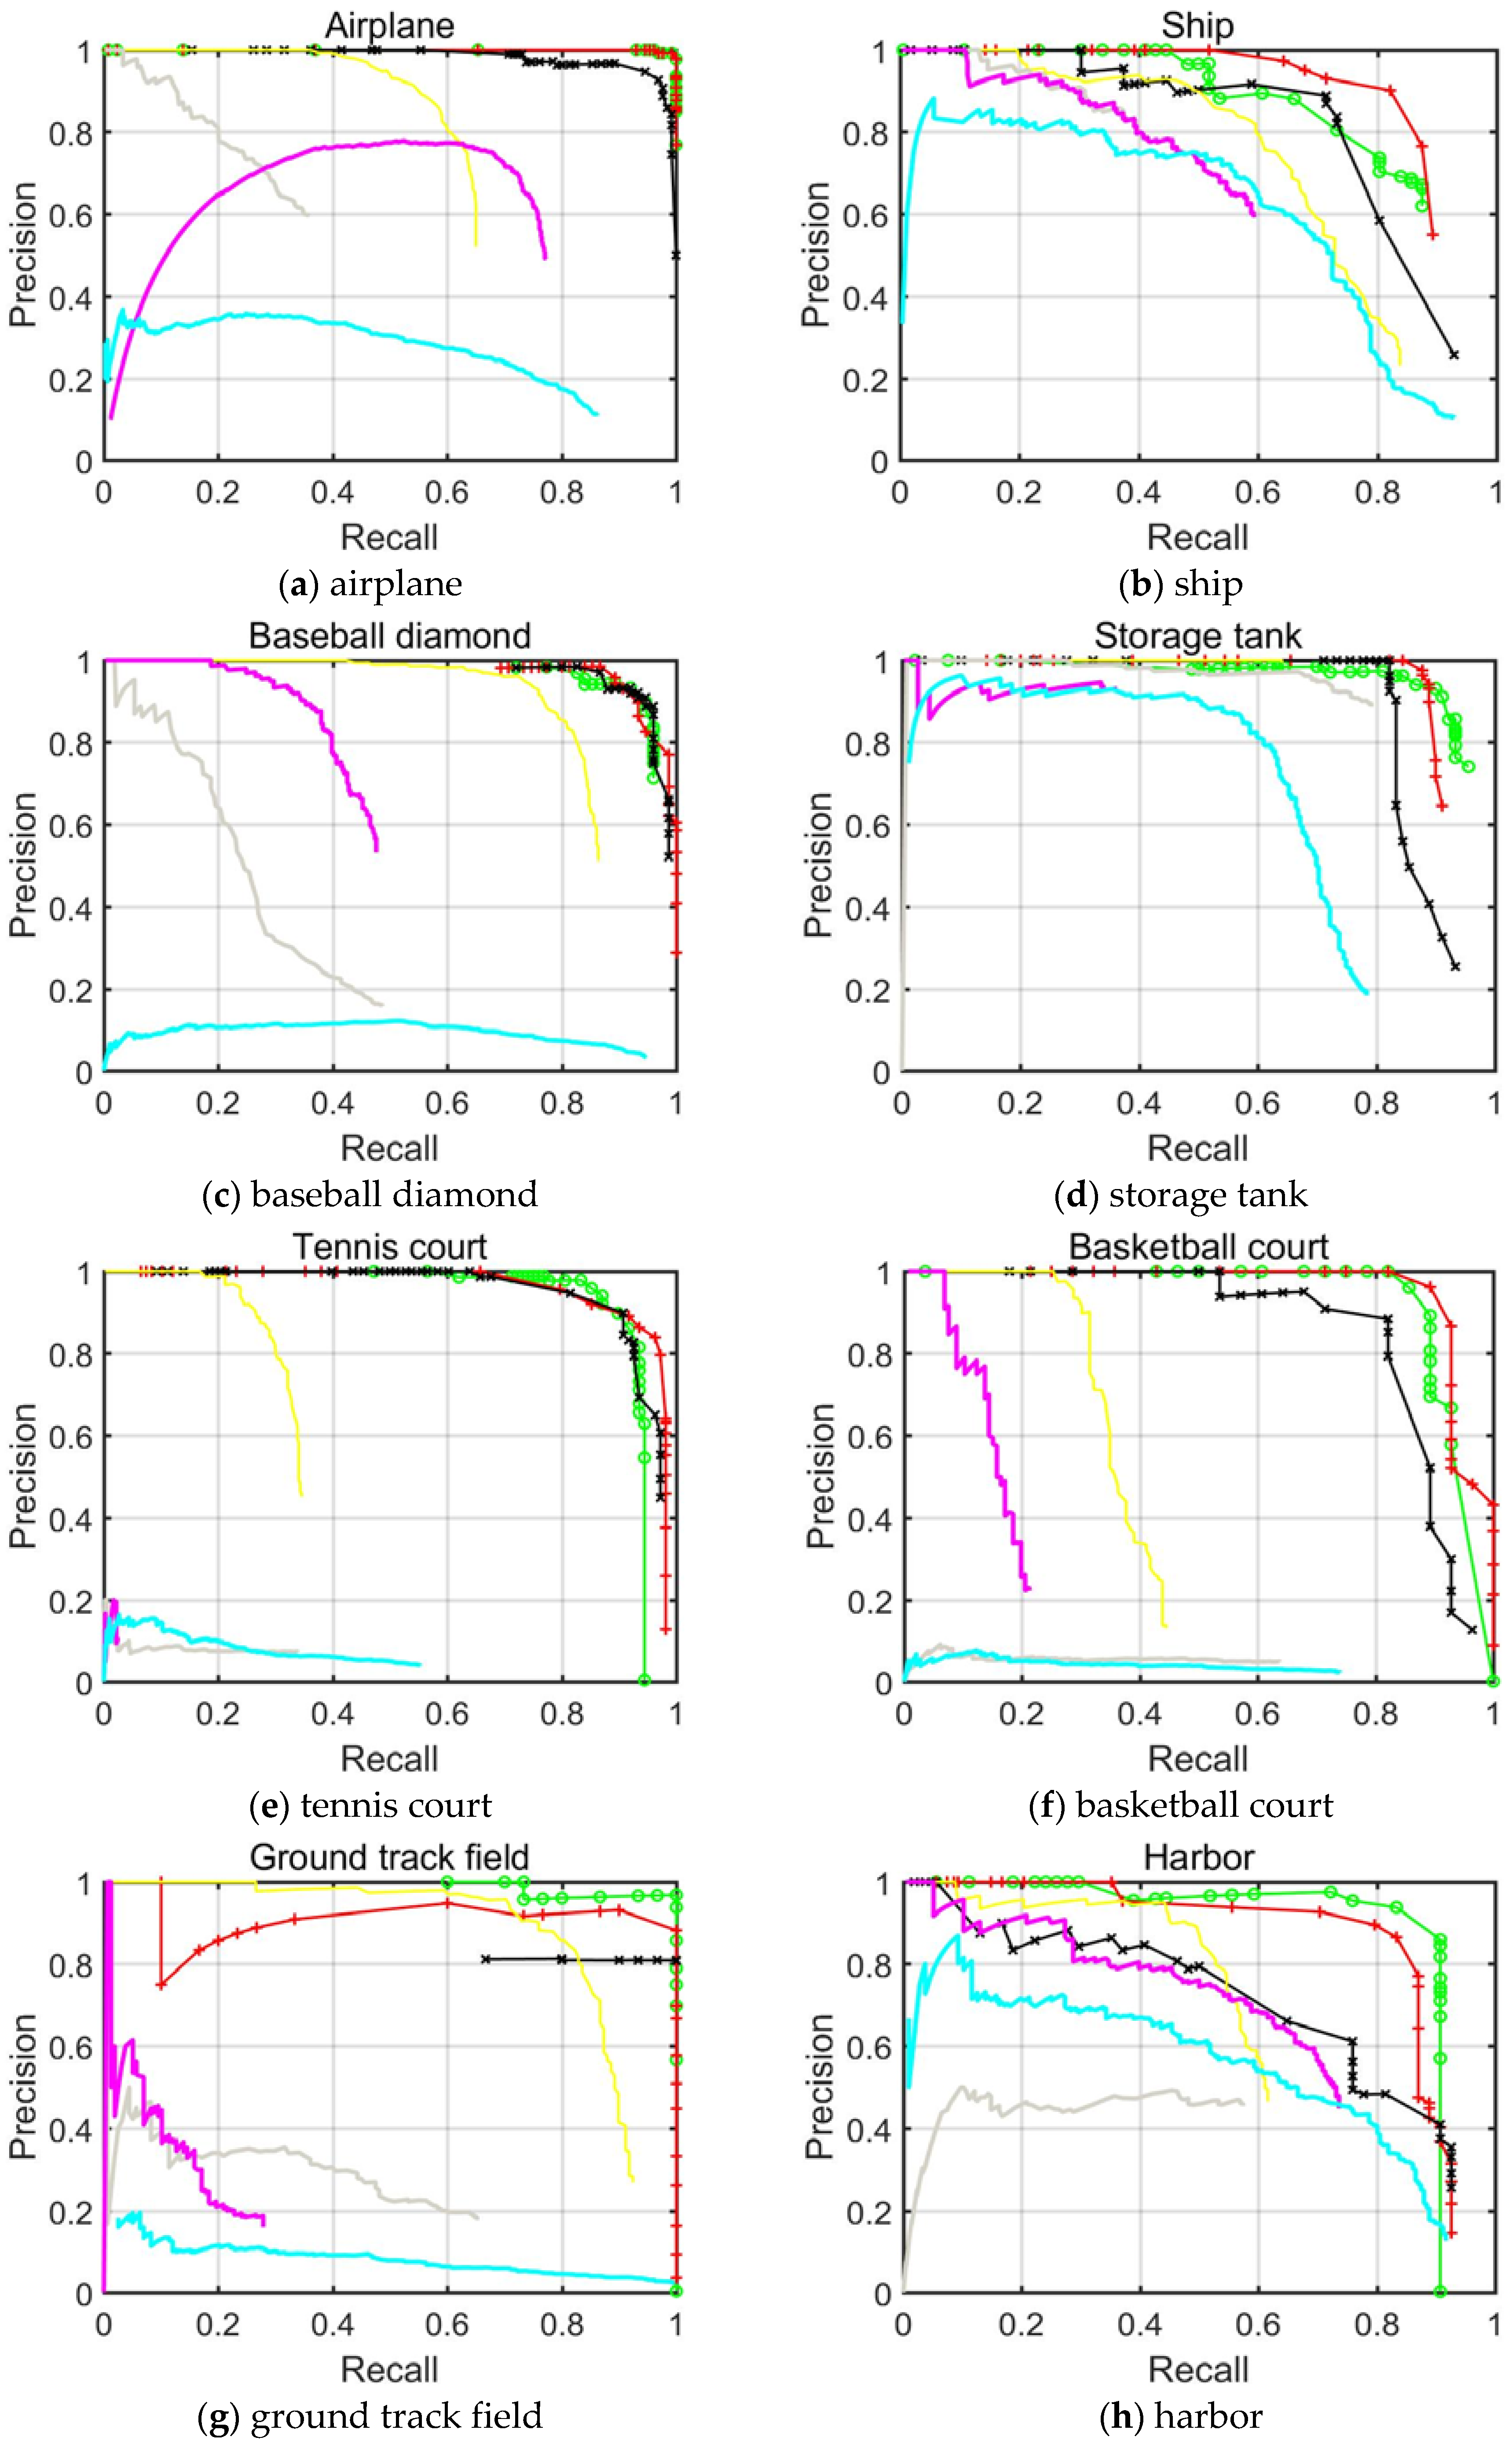
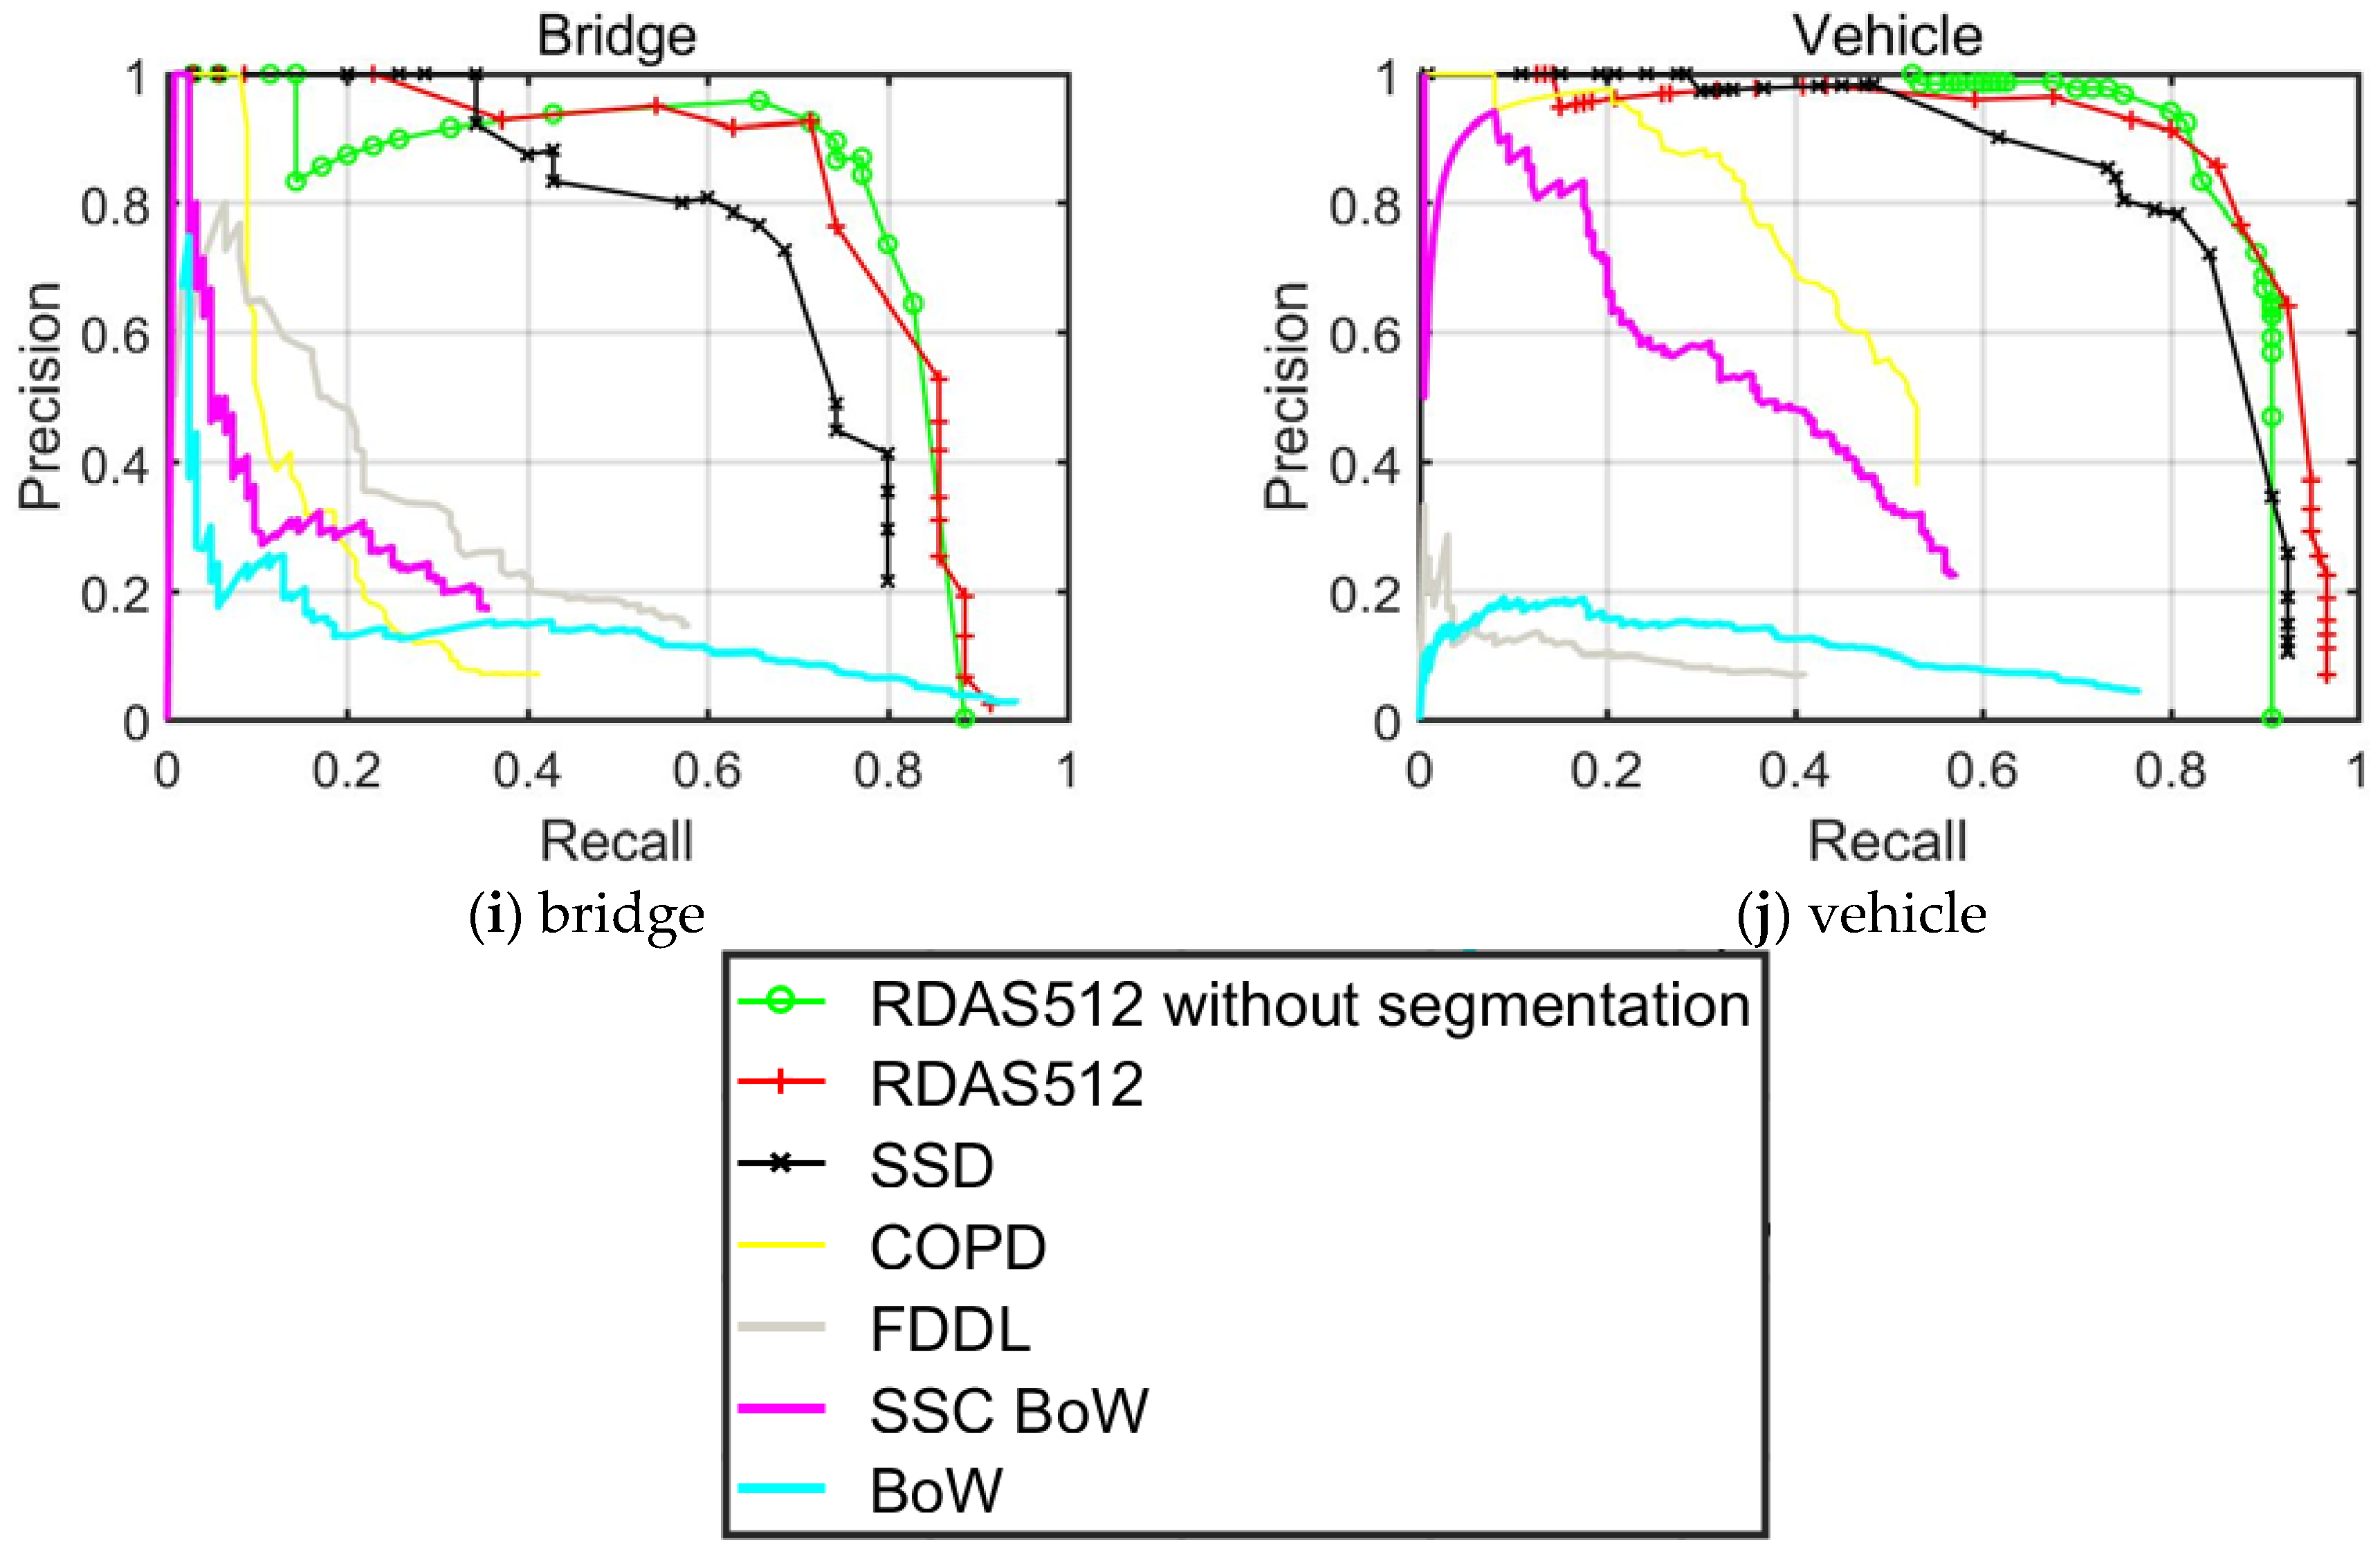
4.2. PRC Evaluation of NWPU VHR-10 Dataset
For object detection approaches, PRC acts as one of the elementary indicators of robustness and effectiveness. The precision vector generated in experiments is measured on the
y-axis and the recall rate on the
x-axis. The curve at the top of the PRCs indicates a better performance. In this paper, we focused on the single-shot based detector and the improved version, i.e., SSD512, RDAS without segmentation branch and RDAS trained on VGG16 with an optimized hyper-parameter.
Figure 8 shows the PRCs of these three methods as well as the traditional comparison methods. From
Figure 8, we can conclude that our RDAS achieves the best recall for all classes since this detector could produce more precise anchor boxes which cover most objects. In particular, the recall rates of small objects like airplanes, storage tanks and vehicles increase more than other objects, which further validate the effectiveness of our method for small object detection. Considering another indicator, it is seen that most of the classes in RDAS achieve higher precision than SSD and traditional methods especially in detecting baseball diamonds, tennis courts and ground track fields. Nevertheless, for ships, bridges, harbors and basketball courts, RDAS requires improvement. Moreover, the segmentation branch was proved effective in elevating the AP value by preventing PRC from decreasing.
By jointly analyzing the AP values, the recall rate and the PRCs, it can be drawn that the proposed RDAS algorithm displays a superior detection performance especially for small scaled objects and geometrically variant objects such as ships, bridges and baseball diamonds. We also confirmed our intuition that the performance can be further boosted by the addition of segmentation branch, and introducing high level semantic knowledge to the early stage of the detection network can contribute to a stronger object detector.


