An Advanced Forest Fire Danger Forecasting System: Integration of Remote Sensing and Historical Sources of Ignition Data


Abstract
1. Introduction
- Preisler et al. [11] employed the AVHRR-derived relative greenness (RG) and normalized difference vegetation index (NDVI) in calculating fire potential index (FPI) to determine the weekly distributions of three fire-related components (i.e., the total number of fires, total fires with a specific size, and probability of those fires which have a certain size) over the continental United States during the period 1985–2005. In determining the probability, they used two types of FPI values (i.e., FPI10 and FPI1000 obtained from 10-h and 1000-h time lag fuel moisture, respectively). Upon generating the probabilities, they compared the forecasted number of large fires and observed ones. The result showed that both FPI10 and FPI1000 could predict large fires.
- Bisquert et al. [12] used Moderate Resolution Imaging Spectroradiometer (MODIS)-derived 16-day enhanced vegetation index (EVI) at 250 m spatial resolution, and daily surface temperature (Ts) at 1 km spatial resolution to predict fire danger condition over the Galicia region, Spain during the period 2001–2006. They evaluated different combinations of input variables (e.g., difference between two 16-day images for EVI; average and maximum 2 to 16-day composites, and differences between two Ts images in the same composite period, and so on) along with fire history and period of year using logistic regression and artificial neural networks. They found the best predictor (i.e., combination of 8-day Ts images, fire history in each cell, and period of year) was able to classify 65% of the observed fires in the high fire danger class.
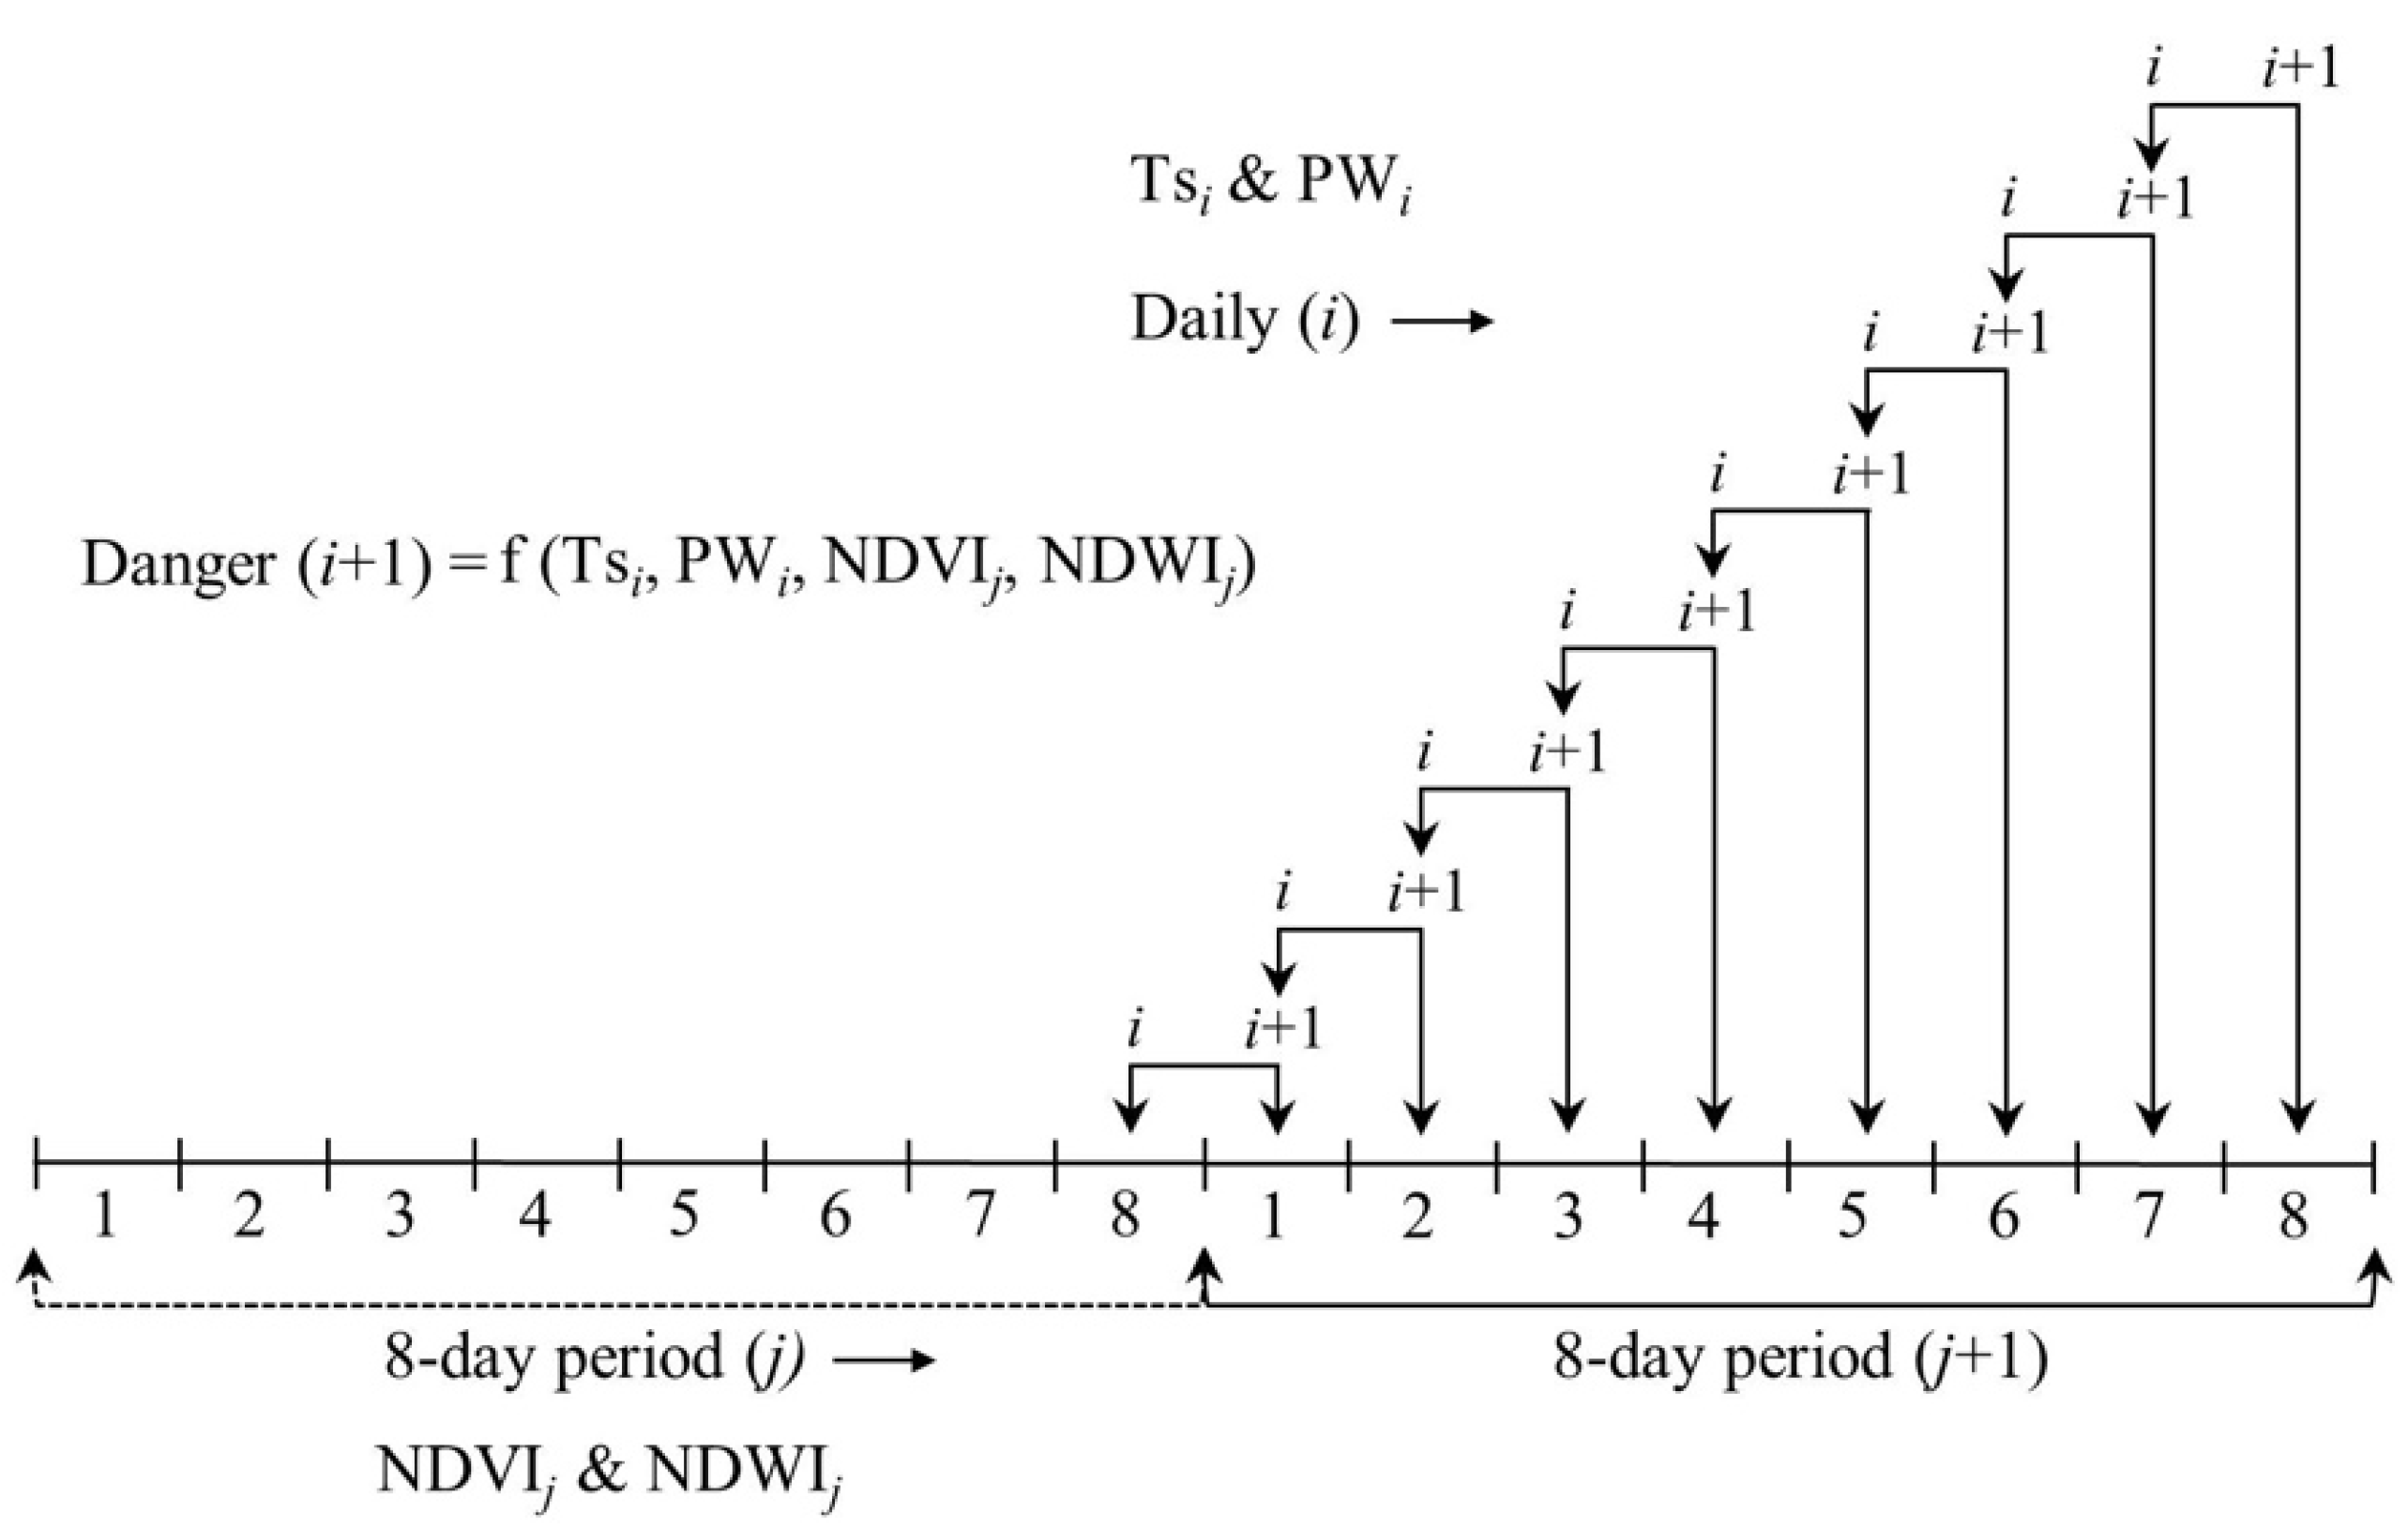
- Chowdhury and Hassan [8] employed MODIS-derived products, such as 8-day composites of Ts at 1 km, NDVI and normalized multiband drought index (NMDI) at 500 m, and daily precipitable water (PW) at 1 km resolution to develop a Forest Fire Danger Forecasting System (FFDFS). They forecasted the fire danger conditions at daily scale over the forest areas in Alberta during 2009–2011 in five fire danger classes (i.e., low, moderate, high, very high, and extremely high), and demonstrated that ~77.39% of the fire events fell into the high to extremely high categories. Note that this study was based on the earlier research conducted in the Earth Observation Laboratory at The University of Calgary, and was focused on forecasting fire dangers at 8-day time-scale [1,13].
- Li et al. [14] studied MODIS-derived 16-day composites of RG and vegetation danger index (VDI) at a 250 m spatial resolution in conjunction with historical fire events in order to determine fire danger conditions over Northern China for the period 2008–2011. They compared RG and VDI values for fire spot locations at three times: (i) before the fire (2008 and 2009); (ii) during the fire events (2010); and (iii) after fire occurrence (2011). They showed that RG values were more than 70% at the fire spot locations before the fire occurring, and VDI values were positive.
- Liu et al. [15] used: (i) MODIS-derived 8-day Ts and surface reflectance data; (ii) Advanced Spaceborne Thermal Emission and Reflection Radiometer (ASTER)-derived digital elevation model (DEM) at 30 m spatial resolution; and (iii) historical lightning-caused fire data to generate the potential fire risk at a 0.5° × 0.5° spatial resolution over a mountainous area in China during the period 2000–2006. They produced five fire risk classes (i.e., low to extremely high); and found that ~68.8% of the historical fires fell under the three fire risk classes (i.e., relatively high, high, and extremely high).
- Arganaraz et al. [16] employed MODIS-derived 8-day vegetation and canopy water content-related indices (e.g., NDVI, EVI, and normalized difference water index (NDWI), etc.) to estimate live fuel moisture content (LFMC) and, subsequently, to predict fire danger conditions within different land cover classes in the forest area of Gran Chaco in Argentina during three fire seasons (i.e., 2003, 2012, and 2013). Then, they classified the modeled LFMC values into four fire danger classes (i.e., low, moderate, high, and extremely high) at a monthly scale, and observed that ~60% of the burn pixels contained high and extremely high danger classes.
- Yu et al. [17] used: (i) MODIS-derived 8-day Ts at 1 km, surface reflectance at 500 m, and fire mask at 1 km data; (ii) Shuttle Radar Topography Mission (SRTM)-derived DEM at 30 m; and (iii) Tropical Rainfall Measuring Mission (TRMM)-derived 8-day accumulated precipitation data at 0.25° × 0.25°, to forecast fire risk at a 8-day scale in Cambodia. They reported that the predicted risk in comparison to the MODIS-derived fire spots had good agreement (i.e., r2 ≈ 0.987).
2. Materials
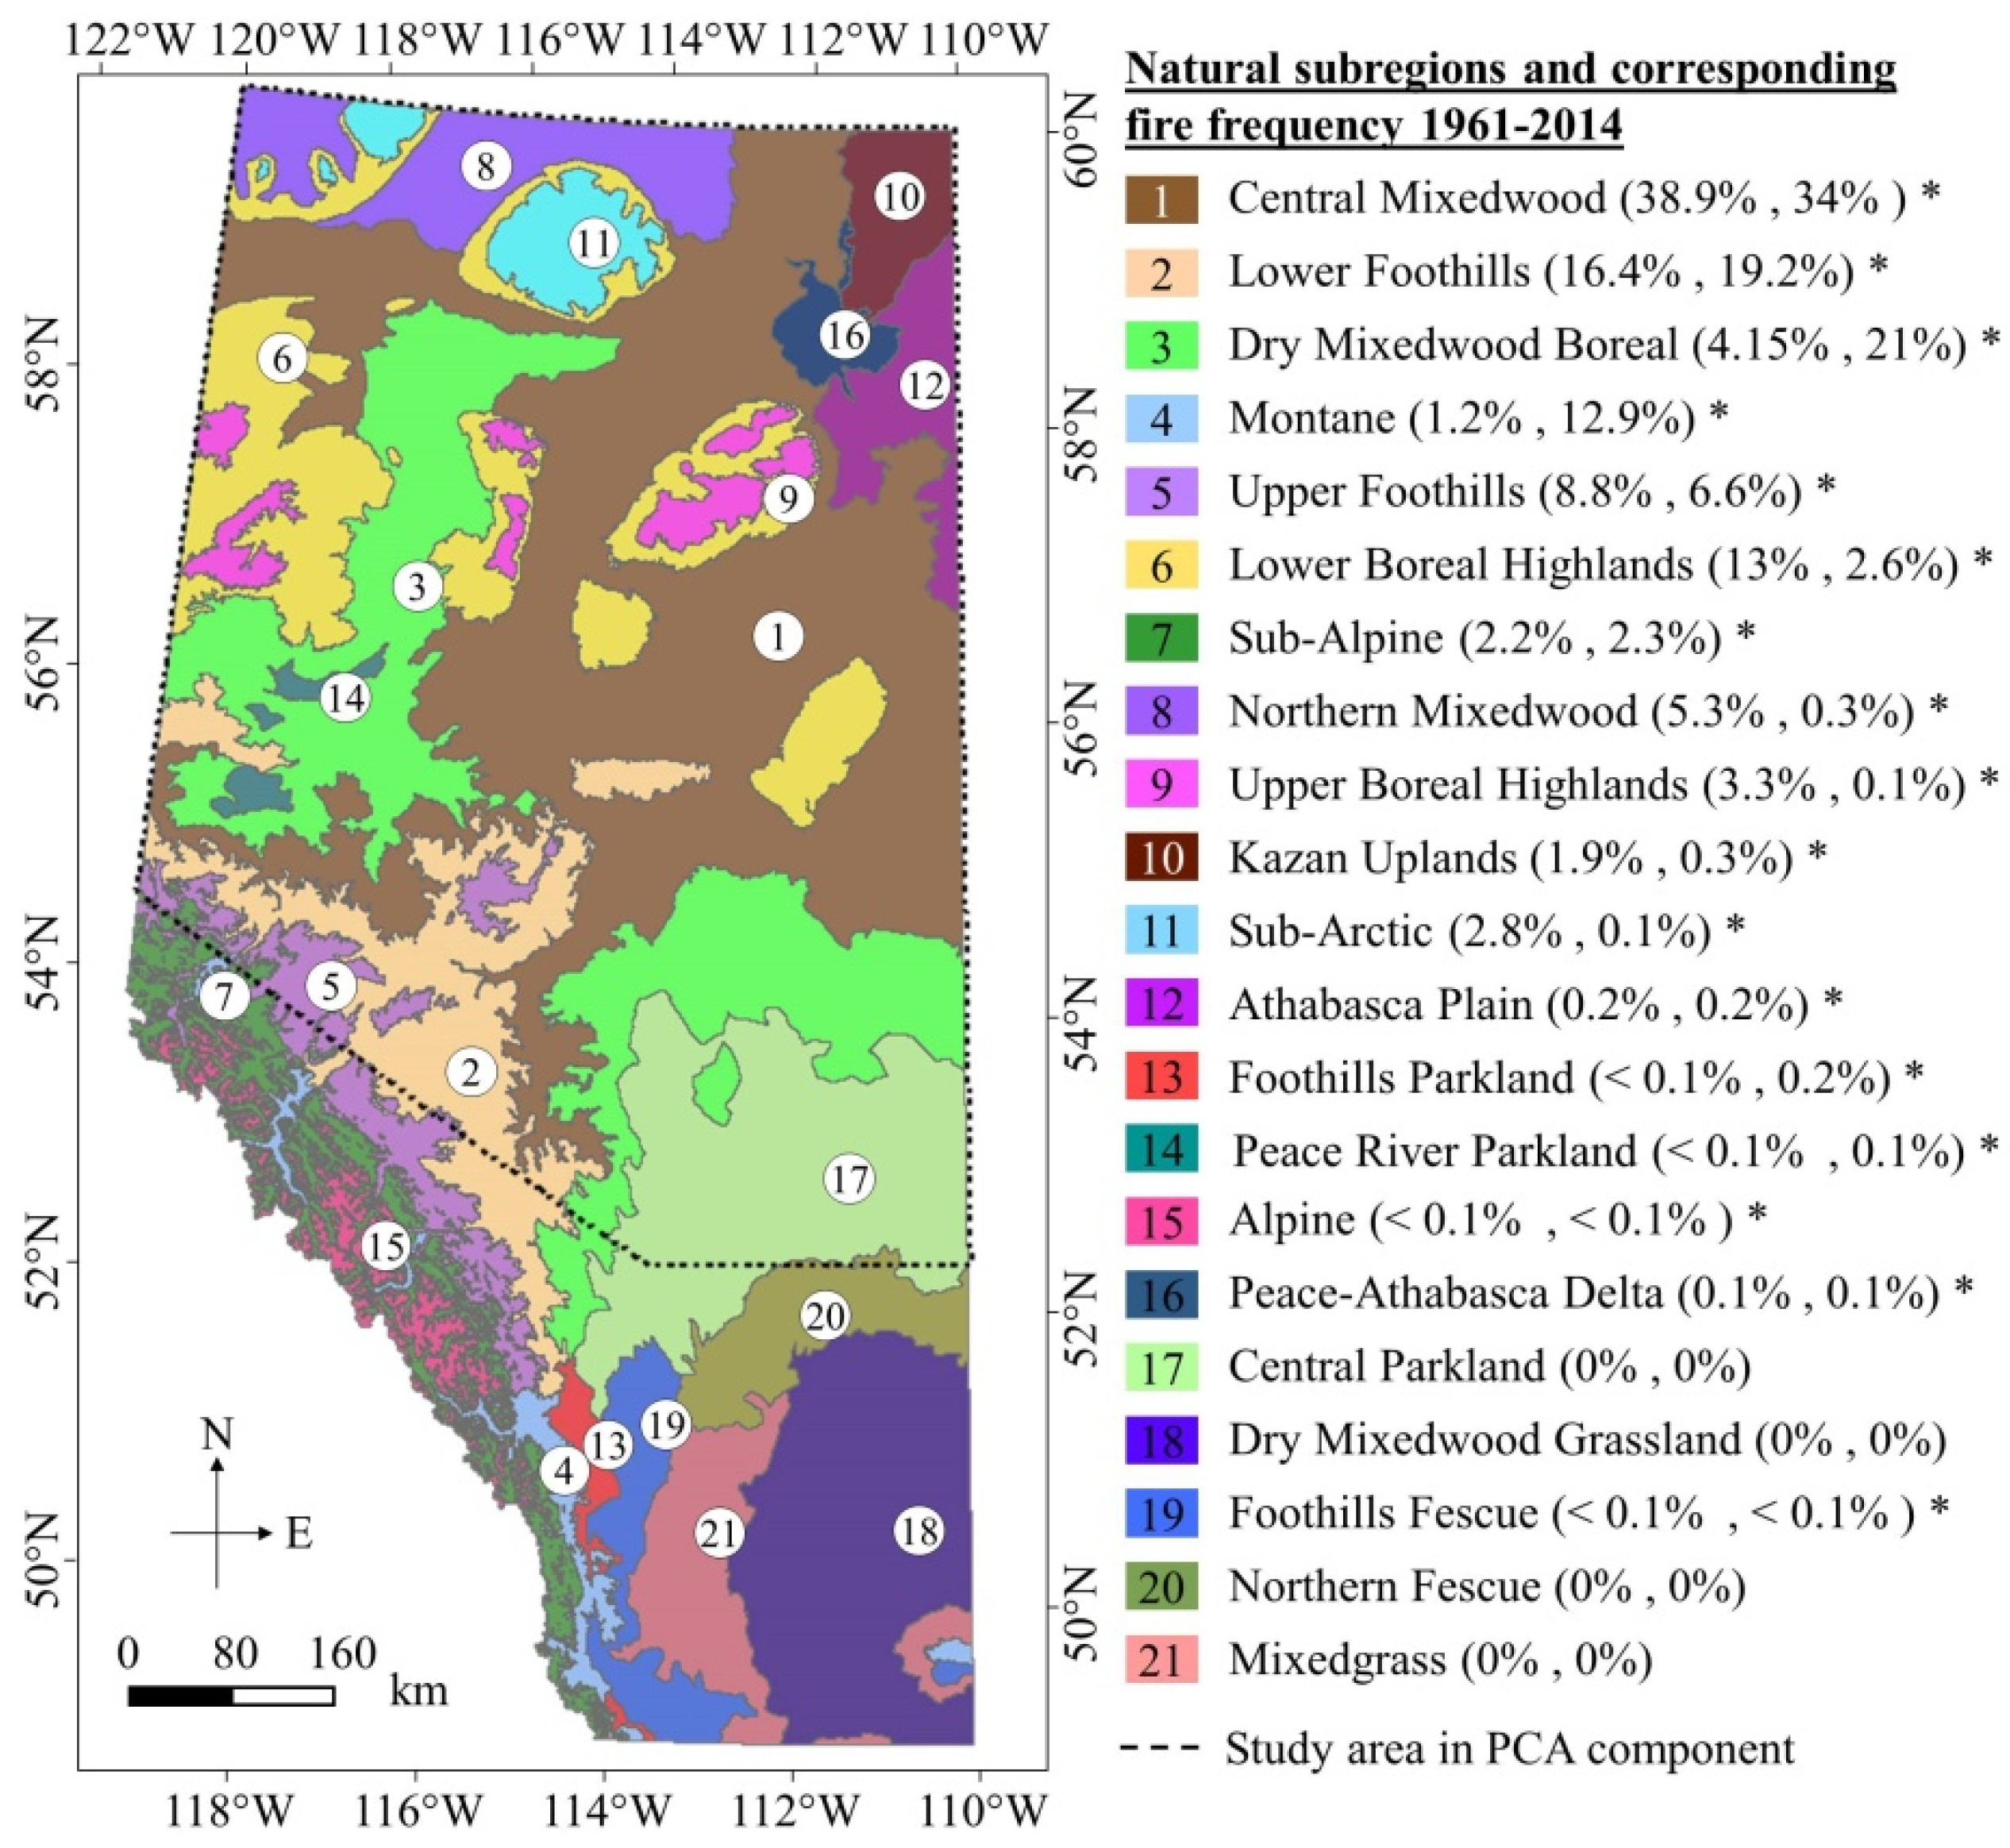
2.1. Study Area
2.2. Data Requirement
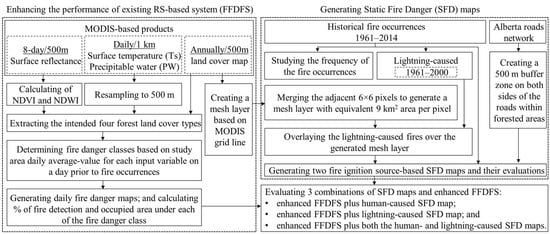
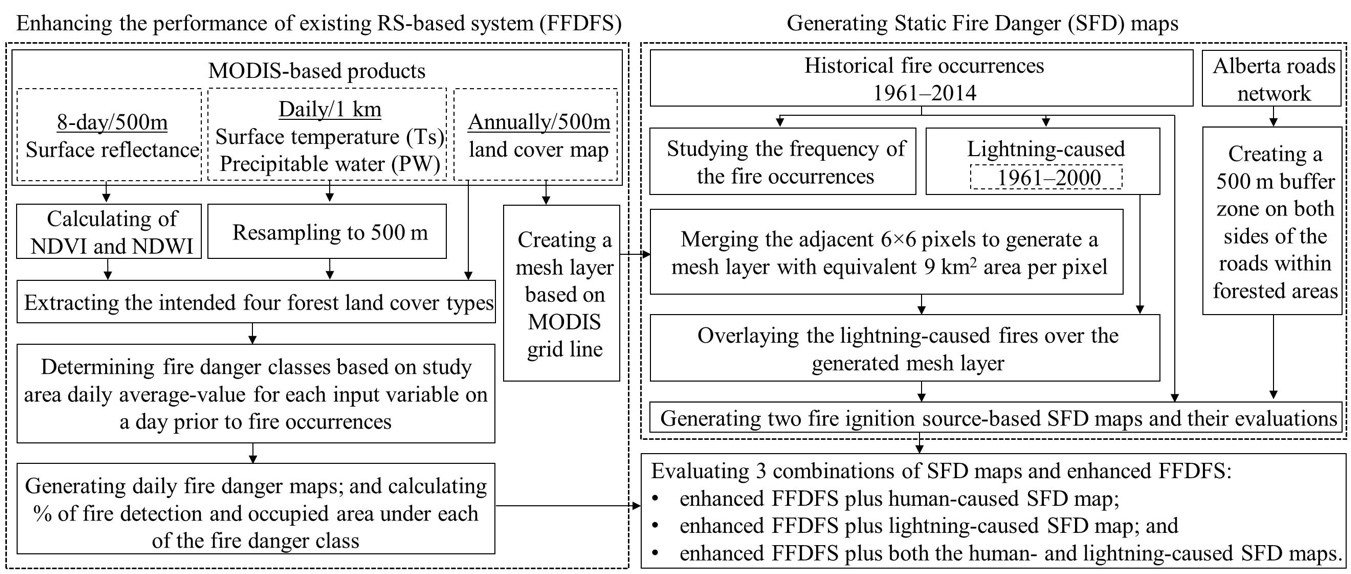
3. Methods
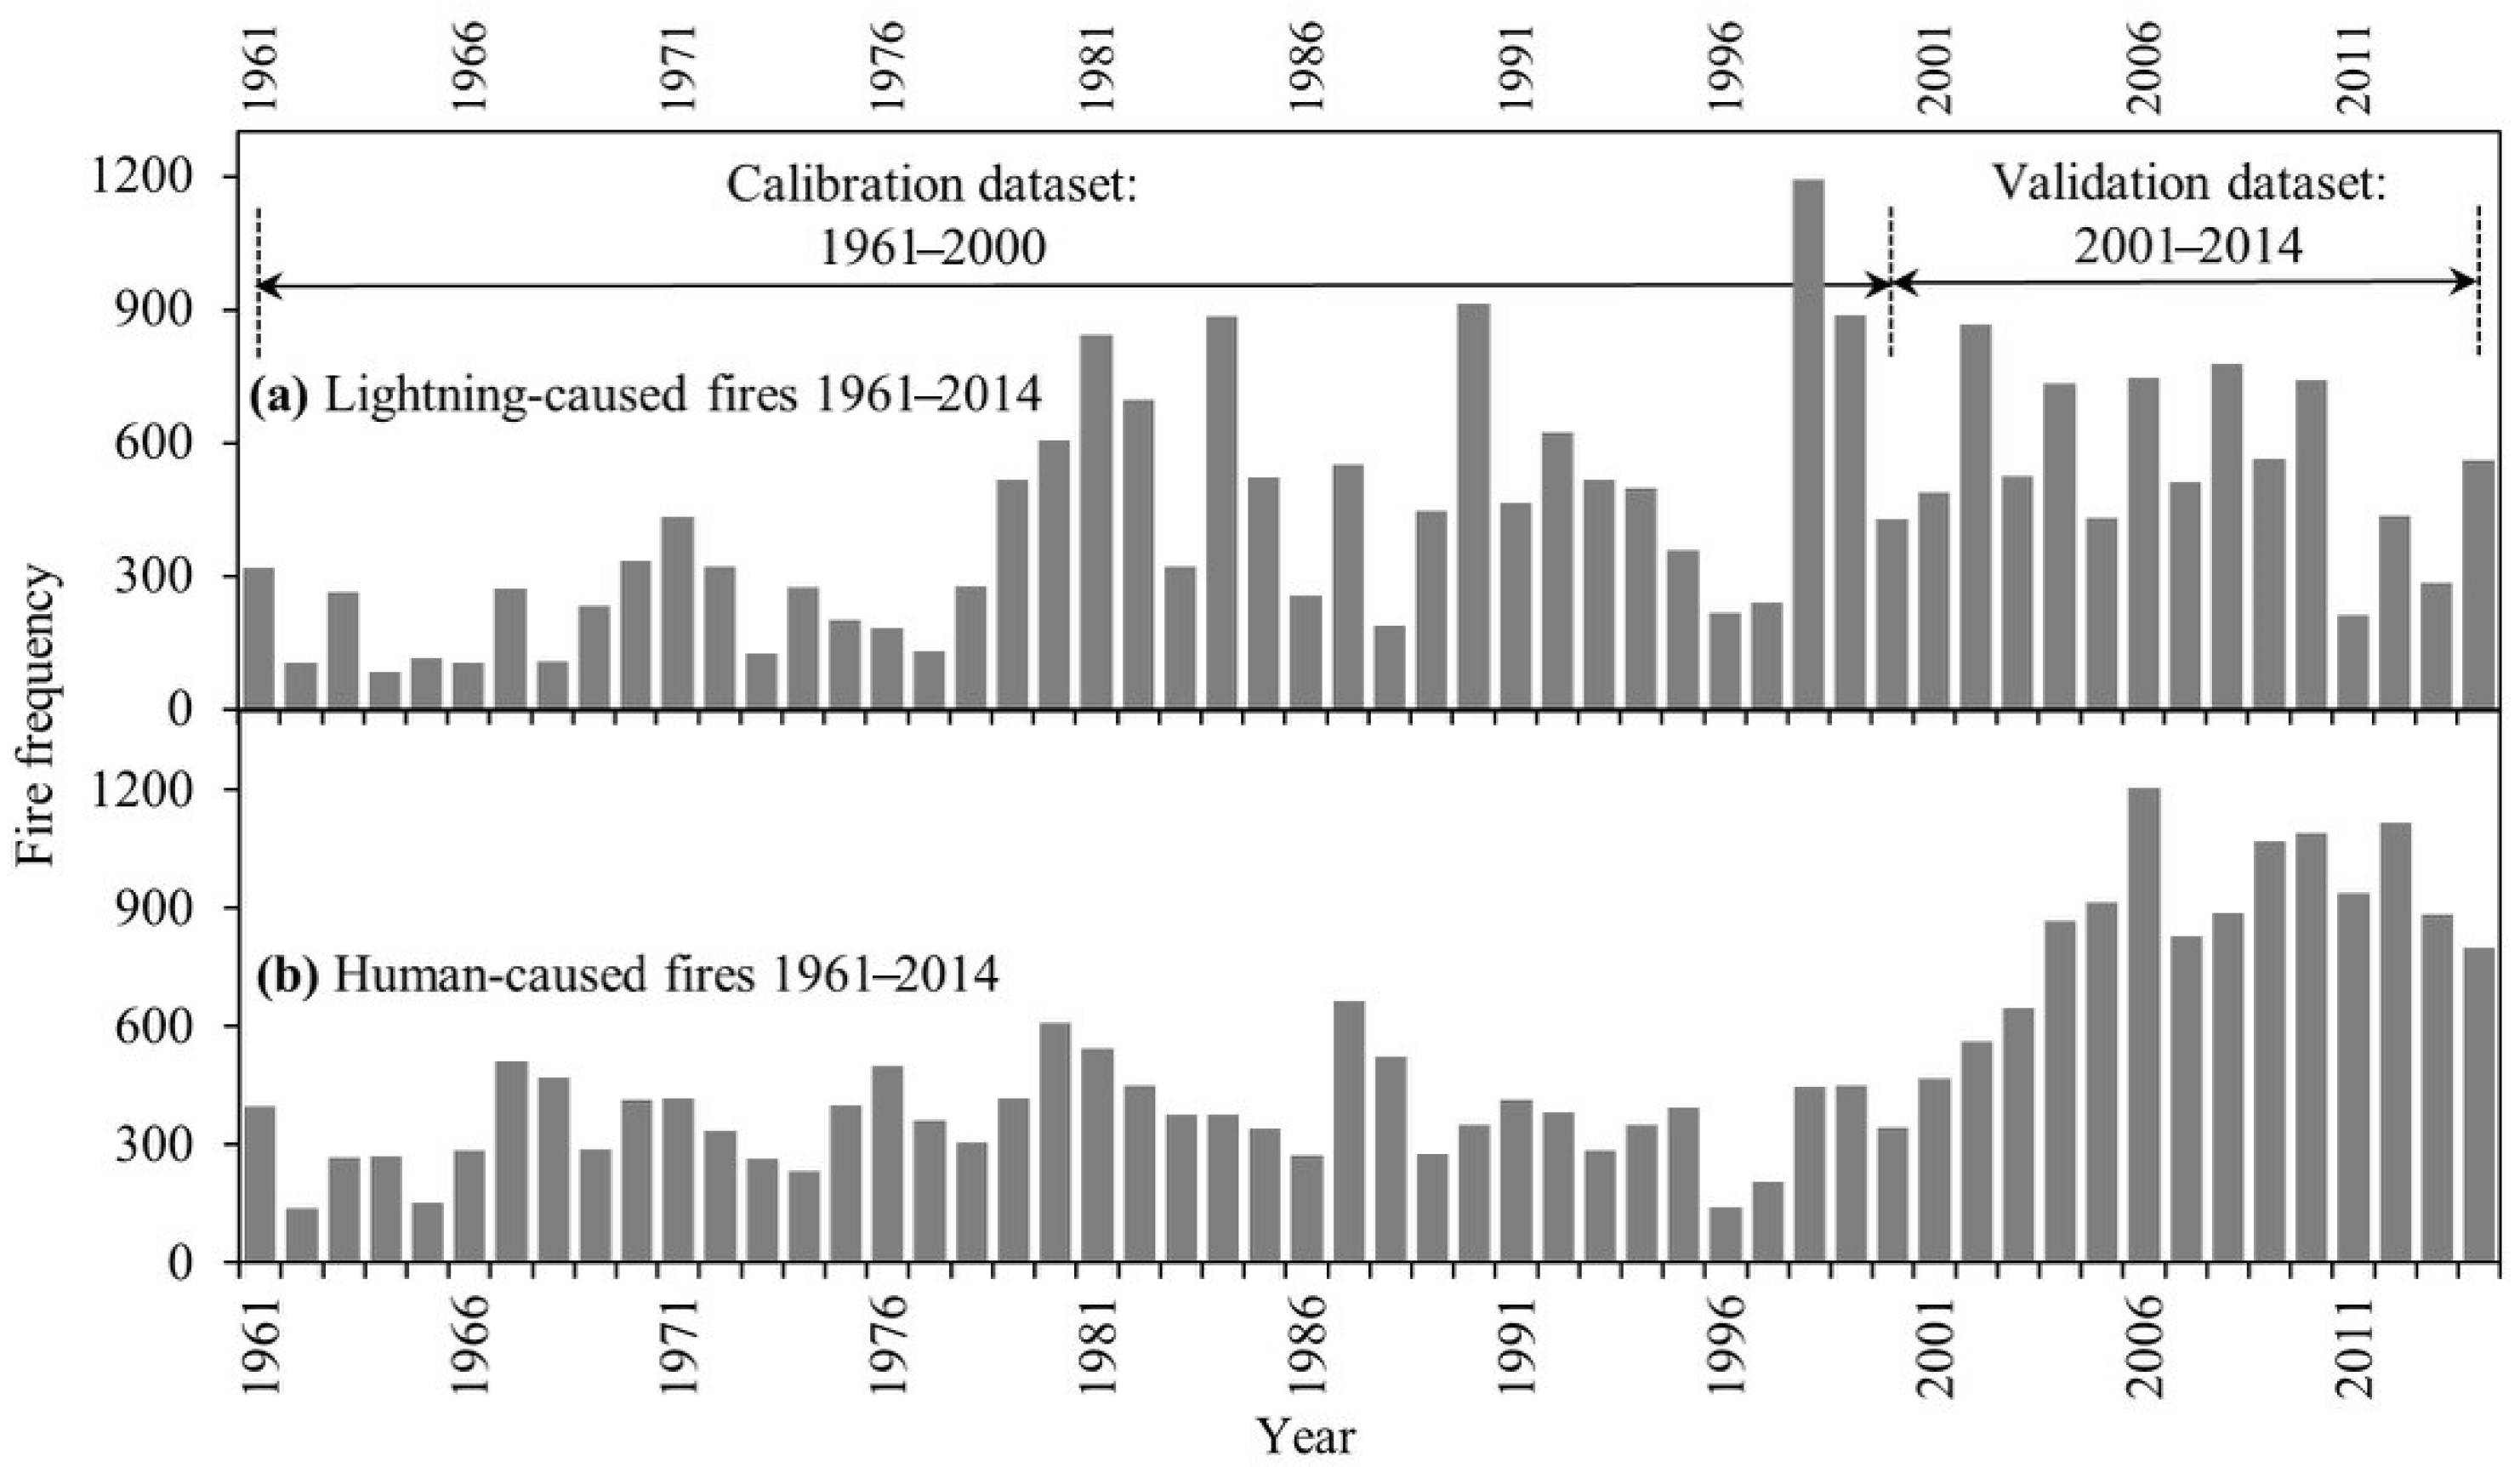
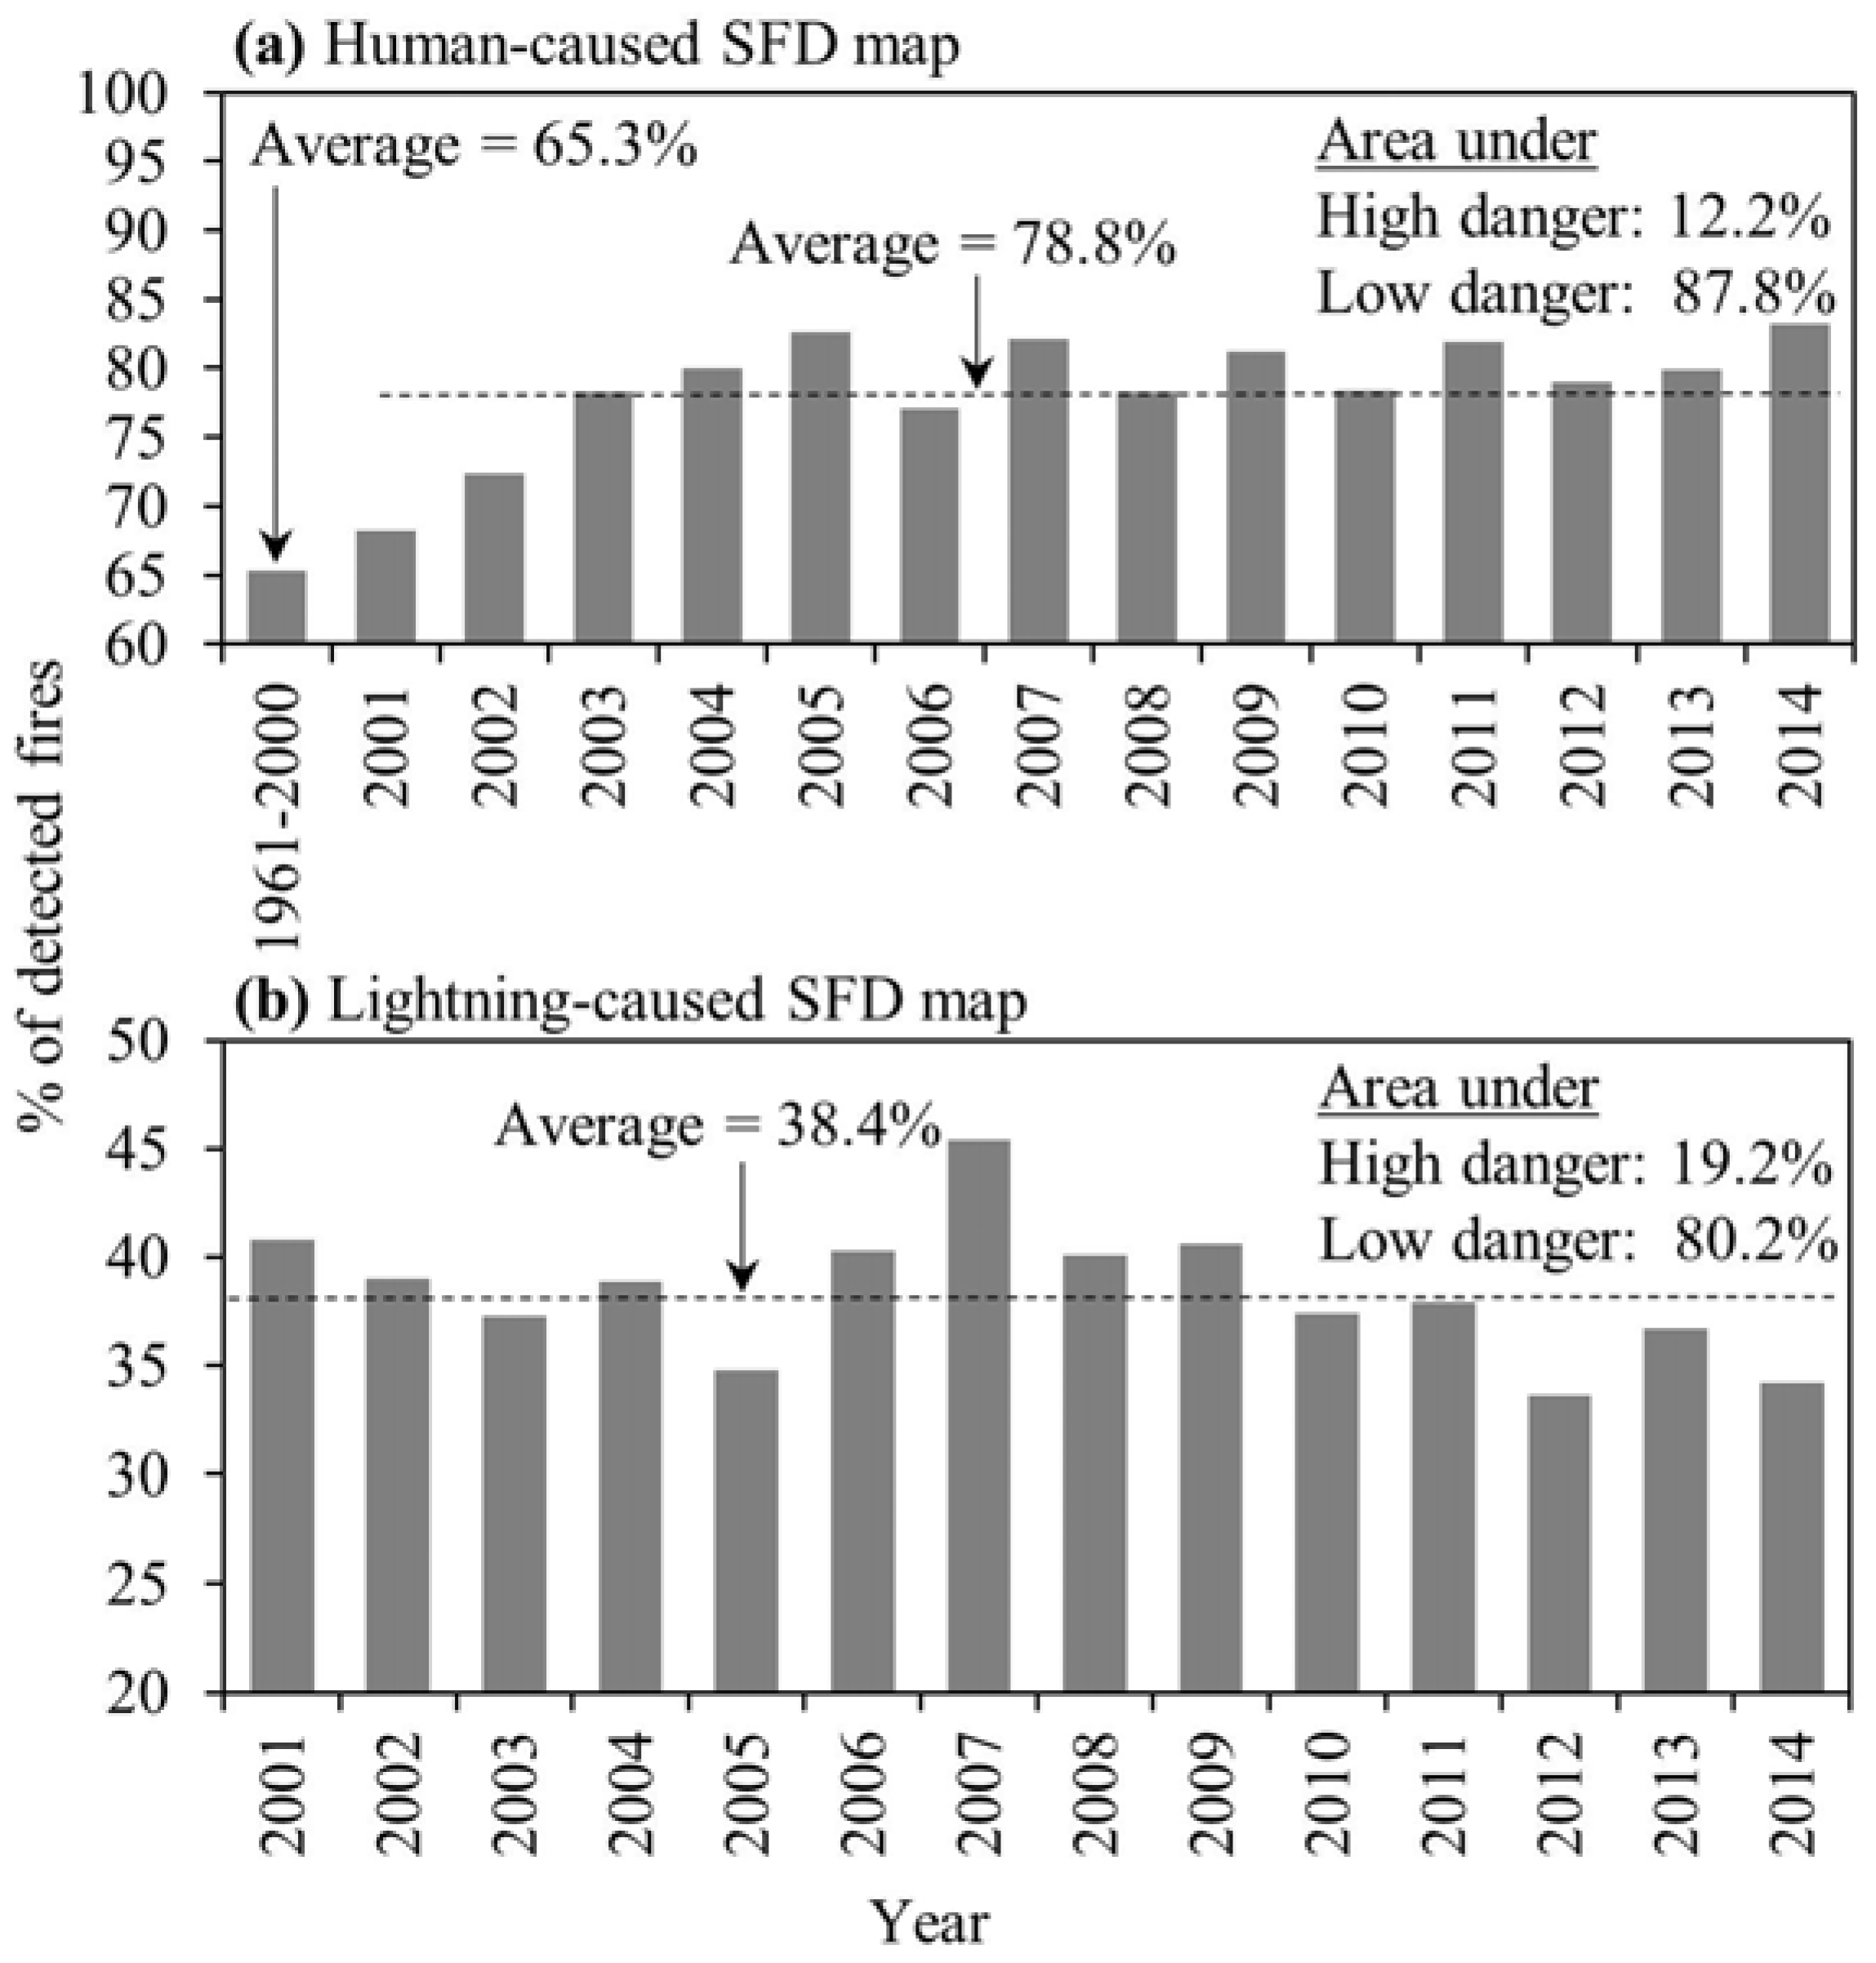
3.1. Generating of Fire Ignition Source-Based SFD Maps
3.2. Enhancing the Performance of FFDFS and Their Validations
- higher temperature than daily average (i.e., ≥ );
- lower precipitable water than daily average (i.e., ≤ );
- lower level of vegetation greenness than daily average (i.e., ≤ ); or
- lower vegetation water content than daily average (i.e., ≤ ).
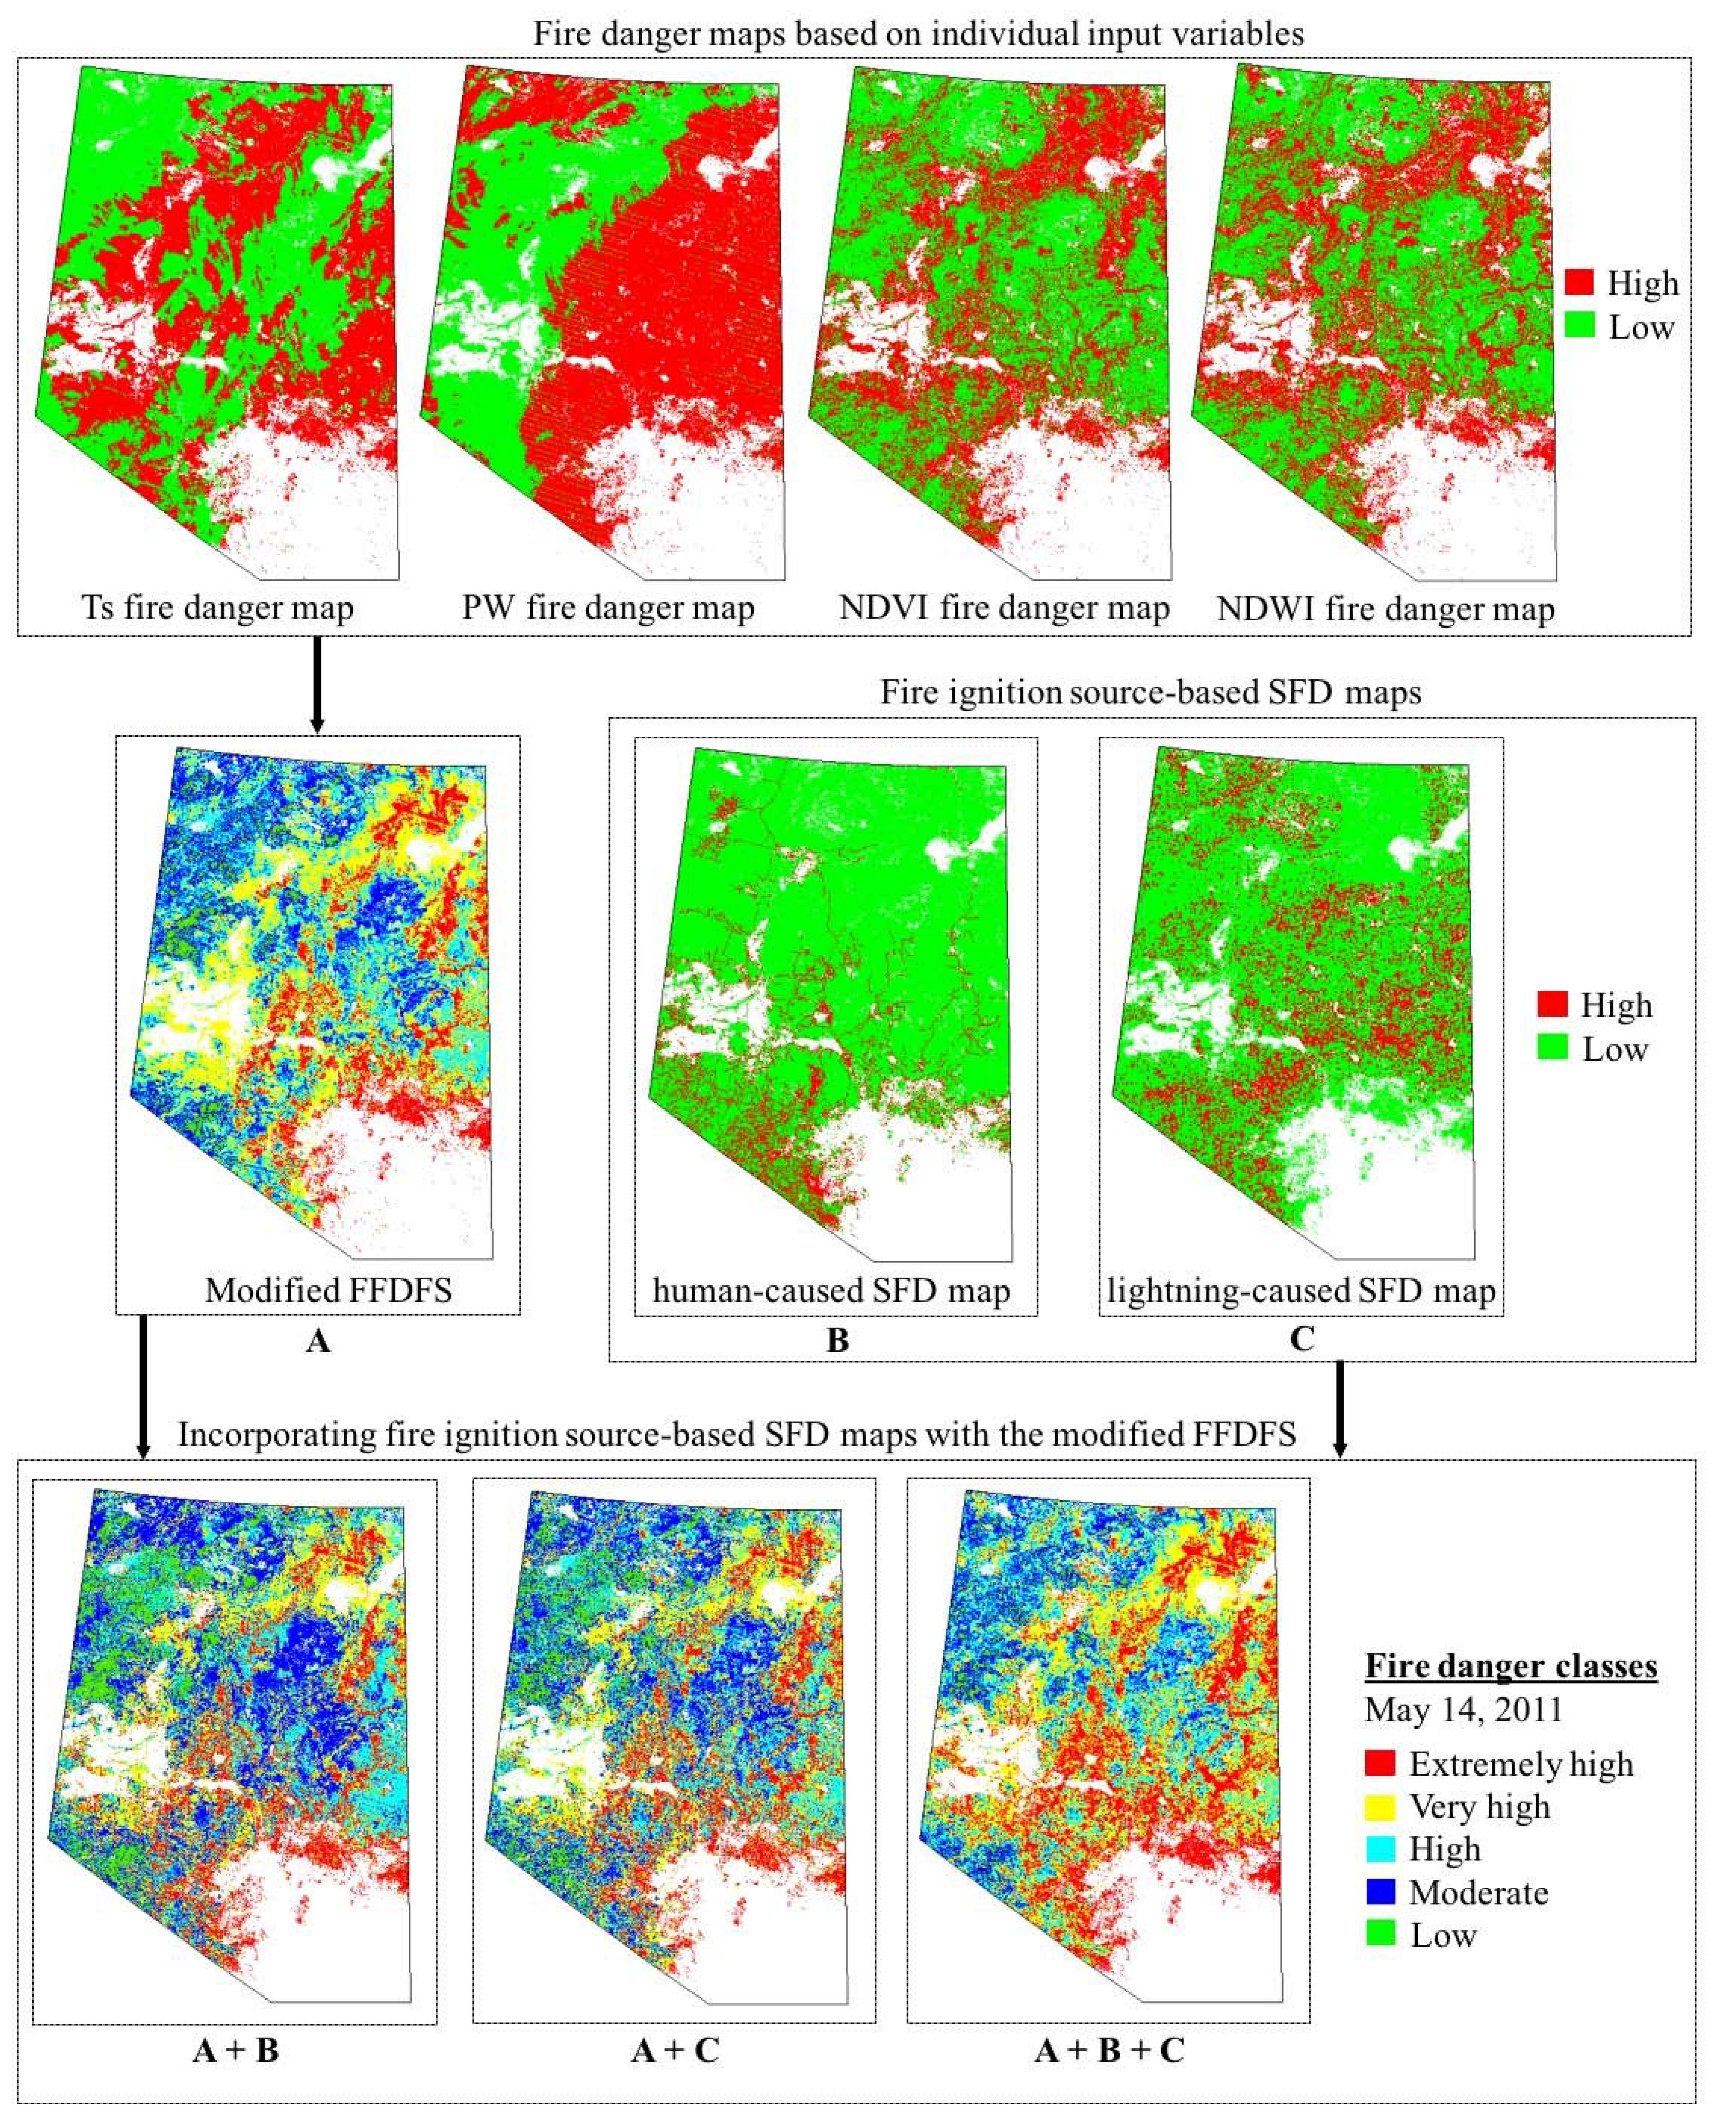
3.3. Incorporating SFD Maps with Enhanced FFDFS
- (i)
- enhanced FFDFS plus human-caused SFD map;
- (ii)
- enhanced FFDFS plus lightning-caused SFD map; and
- (iii)
- enhanced FFDFS plus both the human- and lightning-caused SFD maps.
4. Results and Discussion
4.1. Generating of Fire Ignition Source-Based SFD Maps
4.2. Enhacing the Remote Sensing-Based FFDFS and Its Incorporation with the SFD Maps
5. Concluding Remarks
Author Contributions
Acknowledgments
Conflicts of Interest
References
- Akther, M.S.; Hassan, Q.K. Remote Sensing-Based Assessment of Fire Danger Conditions Over Boreal Forest. IEEE J. Sel. Top. Appl. Earth Obs. Remote Sens. 2011, 4, 992–999. [Google Scholar] [CrossRef]
- Booth, B.; Bellouin, N. Black carbon and atmospheric feedbacks. Nature 2015, 519, 167–168. [Google Scholar] [CrossRef] [PubMed]
- Ahmed, M.R.; Rahaman, K.R.; Hassan, Q.K. Remote Sensing of Wildland Fire-Induced Risk Assessment at the Community Level. Sensors 2018, 18, 1570. [Google Scholar] [CrossRef] [PubMed]
- Williamson, G.J.; Bowman, D.M.; Price, O.F.; Henderson, S.B.; Johnston, F.H. A transdisciplinary approach to understanding the health effects of wildfire and prescribed fire smoke regimes. Environ. Res. Lett. 2015, 11, 125009. [Google Scholar] [CrossRef]
- Sow, M.; Mbow, C.; Hély, C.; Fensholt, R.; Sambou, B. Estimation of Herbaceous Fuel Moisture Content Using Vegetation Indices and Land Surface Temperature from MODIS Data. Remote Sens. 2013, 5, 2617–2638. [Google Scholar] [CrossRef]
- Qi, Y.; Dennison, P.E.; Spencer, J.; Riano, D. Monitoring live fuel moisture using soil moisture and remote sensing proxies. Fire Ecol. 2012, 8, 71–87. [Google Scholar] [CrossRef]
- Wang, L.; Qu, J.J.; Hao, X. Forest fire detection using the normalized multi-band drought index (NMDI) with satellite measurements. Agric. For. Meteorol. 2008, 148, 1767–1776. [Google Scholar] [CrossRef]
- Chowdhury, E.H.; Hassan, Q.K. Development of a New Daily-Scale Forest Fire Danger Forecasting System Using Remote Sensing Data. Remote Sens. 2015, 7, 2431–2448. [Google Scholar] [CrossRef]
- Bisquert, M.M.; Sánchez, J.M.; Caselles, V. Fire danger estimation from MODIS Enhanced Vegetation Index data: Application to Galicia region (north-west Spain). Int. J. Wildl. Fire 2011, 20, 465. [Google Scholar] [CrossRef]
- Chowdhury, E.H.; Hassan, Q.K. Operational perspective of remote sensing-based forest fire danger forecasting systems. ISPRS J. Photogramm. Remote Sens. 2015, 104, 224–236. [Google Scholar] [CrossRef]
- Preisler, H.K.; Burgan, R.E.; Eidenshink, J.C.; Klaver, J.M.; Klaver, R.W. Forecasting distributions of large federal-lands fires utilizing satellite and gridded weather information. Int. J. Wildl. Fire 2009, 18, 508–516. [Google Scholar] [CrossRef]
- Bisquert, M.M.; Caselles, E.; Snchez, J.M.; Caselles, V. Application of artificial neural networks and logistic regression to the prediction of forest fire danger in Galicia using MODIS data. Int. J. Wildl. Fire 2012, 21, 1025–1029. [Google Scholar] [CrossRef]
- Chowdhury, E.H.; Hassan, Q.K. Use of remote sensing-derived variables in developing a forest fire danger forecasting system. Nat. Hazards 2013, 67, 321–334. [Google Scholar] [CrossRef]
- Li, X.; Lanorte, A.; Telesca, L.; Song, W.; Lasaponara, R. Assessment of MODIS-Based NDVI-Derived Index for Fire Susceptibility Estimation in Northern China. In Computational Science and Its Applications; Springer: Berlin, Germany, 2015; Volume 9155, pp. 193–203. ISBN 978-3-319-21469-6. [Google Scholar]
- Liu, W.; Wang, S.; Zhou, Y.; Wang, L.; Zhu, J.; Wang, F. Lightning-caused forest fire risk rating assessment based on case-based reasoning: A case study in DaXingAn Mountains of China. Nat. Hazards 2016, 81, 347–363. [Google Scholar] [CrossRef]
- Arganaraz, J.P.; Landi, M.A.; Bravo, S.J.; Gavier-Pizarro, G.I.; Scavuzzo, C.M.; Bellis, L.M. Estimation of Live Fuel Moisture Content From MODIS Images for Fire Danger Assessment in Southern Gran Chaco. IEEE J. Sel. Top. Appl. Earth Obs. Remote Sens. 2016, 9, 5339–5349. [Google Scholar] [CrossRef]
- Yu, B.; Chen, F.; Li, B.; Wang, L.; Wu, M. Fire Risk Prediction Using Remote Sensed Products: A Case of Cambodia. Photogramm. Eng. Remote Sens. 2017, 83, 19–25. [Google Scholar] [CrossRef]
- Downing, D.J.; Pettapiece, W.W. Natural Regions and Subregions of Alberta; Government of Alberta: Edmonton, AB, Canada, 2006.
- Costafreda-Aumedes, S.; Vega-Garcia, C. ANN multivariate analysis of factors that influence human-caused multiple fire starts. In Advances in Forest Fire Research; Imprensa da Universidade de Coimbra: Coimbra, Portugal, 2014; Volume 4, pp. 1787–1798. ISBN 9789892608846. [Google Scholar]
- Wang, Y.; Anderson, K.R. An evaluation of spatial and temporal patterns of lightning- and human-caused forest fires in Alberta, Canada, 1980–2007. Int. J. Wildl. Fire 2010, 19, 1059–1072. [Google Scholar] [CrossRef]
- Martínez, J.; Vega-Garcia, C.; Chuvieco, E. Human-caused wildfire risk rating for prevention planning in Spain. J. Environ. Manag. 2009, 90, 1241–1252. [Google Scholar] [CrossRef] [PubMed]
- Krawchuk, M.A.; Cumming, S.G.; Flannigan, M.D.; Wein, R.W. Biotic and abiotic regulation of lightning fire inititation in the mixedwood boreal forest. Ecology 2006, 87, 458–468. [Google Scholar] [CrossRef] [PubMed]
- Camp, P.E.; Krawchuk, M.A. Spatially varying constraints of human-caused fire occurrence in British Columbia, Canada. Int. J. Wildl. Fire 2017, 26, 219–229. [Google Scholar] [CrossRef]
- Guo, F.; Su, Z.; Wang, G.; Sun, L.; Lin, F.; Liu, A. Wildfire ignition in the forests of southeast China: Identifying drivers and spatial distribution to predict wildfire likelihood. Appl. Geogr. 2016, 66, 12–21. [Google Scholar] [CrossRef]
- Adab, H.; Kanniah, K.D.; Solaimani, K.; Sallehuddin, R. Modelling static fire hazard in a semi-arid region using frequency analysis. Int. J. Wildl. Fire 2015, 24, 763–777. [Google Scholar] [CrossRef]
- Abatzoglou, J.T.; Kolden, C.A.; Balch, J.K.; Bradley, B.A. Controls on interannual variability in lightning-caused fire activity in the western US. Environ. Res. Lett. 2016, 11. [Google Scholar] [CrossRef]
- Podur, J.; Martell, D.L.; Csillag, F. Spatial patterns of lightning-caused forest fires in Ontario, 1976–1998. Ecol. Model. 2003, 164, 1–20. [Google Scholar] [CrossRef]
- Frost, C. Presettlement fire frequency regimes of the United States: A first approximation. In Fire in Ecosystem Management: Shifting the Paradigm from Suppression to Prescription; Proceedings of the Tall Timbers Fire Ecology Conference, Tallahassee, FL, USA, 14–16 April 1998; Tall Timbers Research Station: Tallahassee, FL, USA, 1998; Volume 20, pp. 70–81. [Google Scholar]
- Calef, M.P.; Varvak, A.; McGuire, A.D. Differences in human versus lightning fires between urban and rural areas of the boreal forest in interior Alaska. Forests 2017, 8, 422. [Google Scholar] [CrossRef]
- Kilinc, M.; Beringer, J. The spatial and temporal distribution of lightning strikes and their relationship with vegetation type, elevation, and fire scars in the northern Territory. J. Clim. 2007, 20, 1161–1173. [Google Scholar] [CrossRef]
- Živanovic, S.; Zigar, D. Monitoring of cloudiness in the function of the forests fire protection. Acta Agric. Serbica 2016, 41, 3–15. [Google Scholar] [CrossRef]
- Bisquert, M.; Sánchez, J.; Caselles, V. Modeling Fire Danger in Galicia and Asturias (Spain) from MODIS Images. Remote Sens. 2014, 6, 540–554. [Google Scholar] [CrossRef]
- De Angelis, A.; Bajocco, S.; Ricotta, C. Phenological variability drives the distribution of wildfires in Sardinia. Landsc. Ecol. 2012, 27, 1535–1545. [Google Scholar] [CrossRef]
- Abdollahi, M.; Hassan, Q.K.; Chowdhury, E.H.; Gupta, A. Exploring the relationships between topographical elements and forest fire occurrences in Alberta, Canada. In Remote Sensing of Hydro-Meteorological Hazards; Petropoulos, G., Islam, T., Eds.; CRC Press: Boca Raton, FL, USA, 2017. [Google Scholar]


| Source | Period | Description | Purpose |
|---|---|---|---|
| Alberta Forest Service | 1961–2000 | Historical lightning-caused fire dataset consisting of 16087 no. fires | Used as calibration dataset in generating the lightning-caused SFD map |
| 2001–2014 | Historical lightning-caused fire dataset consisting of 7888 no. fires | Utilized in validating the lightning-caused SFD map | |
| 1961–2014 | Historical human-caused fire dataset consisting of 26776 no. fires | Employed in validating the human-caused the SFD map | |
| 2009–2011 | Historical fire dataset with the fire sizes ≥ 1 hectares, consisting of 2772 fire spots within four forest land cover types of interest | Employed in evaluating the generated daily fire danger maps | |
| Moderate Resolution Imaging Spectroradiometer (MODIS) | 2009–2011 | Daily surface temperature (i.e., MOD11A1) at 1 km spatial resolution | Used as an input into the model |
| Daily precipitable water (i.e., MOD05L2) at 1 km spatial resolution | |||
| 8-day composite of surface reflectance (i.e., MOD09A1) at 500 m spatial resolution | Utilized in calculating NDWI and NDVI, and subsequently employed as input into the model | ||
| 2008 | Annual land cover map (i.e., MCD12Q1) at 500 m spatial resolution | Used in extracting the intended four forest land cover types, i.e., (i) deciduous broadleaf forest; (ii) evergreen broadleaf forest; (iii) evergreen needleleaf forest; and (iv) deciduous needleleaf forest | |
| Government of Alberta | 2006 | Alberta natural subregions as GIS layer | Employed in generating the SFD maps |
| 2000 | Alberta road network as GIS layer |
| Year | Danger Class | Original FFDFS | Modified FFDFS | Modified FFDFS + Road Buffer | Modified FFDFS + Lightning | Modified FFDFS + Road Buffer + Lightning | ||||||
|---|---|---|---|---|---|---|---|---|---|---|---|---|
| % of: | ||||||||||||
| Detected Fires | Cumulative (↓) | Detected Fires | Cumulative (↓) | Detected Fires | Cumulative (↓) | Detected Fires | Cumulative (↓) | Detected Fires | Cumulative (↓) | |||
| 2009 | Extremely High | 8.96 | 8.96 | 10.39 | 10.39 | 19.48 | 19.48 | 19.48 | 19.48 | 31.17 | 31.17 | |
| Very High | 28.36 | 37.31 | 33.12 | 43.51 | 29.87 | 49.35 | 29.22 | 48.70 | 38.31 | 69.48 | ||
| High | 36.57 | 73.88 | 28.57 | 72.08 | 28.57 | 77.92 | 27.27 | 75.97 | 23.38 | 92.86 | ||
| Moderate | 20.90 | 94.78 | 22.73 | 94.81 | 18.18 | 96.10 | 20.78 | 96.75 | 7.14 | 100.00 | ||
| Low | 5.22 | 100.00 | 5.19 | 100.00 | 3.90 | 100.00 | 3.25 | 100.00 | 0.00 | 100.00 | ||
| 2010 | Extremely High | 14.88 | 14.88 | 8.08 | 8.08 | 15.66 | 15.66 | 24.75 | 24.75 | 40.91 | 40.91 | |
| Very High | 30.95 | 45.83 | 43.94 | 52.02 | 49.49 | 65.15 | 36.36 | 61.11 | 37.37 | 78.28 | ||
| High | 30.36 | 76.19 | 26.77 | 78.79 | 16.67 | 81.82 | 20.71 | 81.82 | 12.63 | 90.91 | ||
| Moderate | 19.64 | 95.83 | 15.66 | 94.44 | 12.63 | 94.44 | 15.15 | 96.97 | 8.59 | 99.49 | ||
| Low | 4.17 | 100.00 | 5.56 | 100.00 | 5.56 | 100.00 | 3.03 | 100.00 | 0.51 | 100.00 | ||
| 2011 | Extremely High | 15.45 | 15.45 | 11.11 | 11.11 | 36.30 | 36.30 | 25.19 | 25.19 | 49.63 | 49.63 | |
| Very High | 36.59 | 52.03 | 41.48 | 52.59 | 31.11 | 67.41 | 31.85 | 57.04 | 28.15 | 77.78 | ||
| High | 30.08 | 82.11 | 26.67 | 79.26 | 17.78 | 85.19 | 27.41 | 84.44 | 17.04 | 94.81 | ||
| Moderate | 13.82 | 95.93 | 14.07 | 93.33 | 8.89 | 94.07 | 10.37 | 94.81 | 5.19 | 100.00 | ||
| Low | 4.07 | 100.00 | 6.67 | 100.00 | 5.93 | 100.00 | 5.19 | 100.00 | 0.00 | 100.00 | ||
| 2009–2011 | Extremely High | 13.09 | 13.09 | 9.86 | 9.86 | 23.81 | 23.81 | 23.14 | 23.14 | 40.57 | 40.57 | |
| Very High | 31.97 | 45.06 | 39.51 | 49.37 | 36.83 | 60.64 | 32.48 | 55.62 | 34.61 | 75.18 | ||
| High | 32.34 | 77.39 | 27.34 | 76.71 | 21.01 | 81.64 | 25.13 | 80.75 | 17.68 | 92.86 | ||
| Moderate | 18.12 | 95.51 | 17.49 | 94.19 | 13.23 | 94.87 | 15.43 | 96.18 | 6.97 | 99.83 | ||
| Low | 4.49 | 100.00 | 5.81 | 100.00 | 5.13 | 100.00 | 3.82 | 100.00 | 0.17 | 100.00 | ||
| Year | Danger Class | Modified FFDFS | Modified FFDFS + Road Buffer | Modified FFDFS + Lightning | Modified FFDFS + Road Buffer + Lightning | ||||
|---|---|---|---|---|---|---|---|---|---|
| Area (%) | Cumulative (↑) | Area (%) | Cumulative (↑) | Area (%) | Cumulative (↑) | Area (%) | Cumulative (↑) | ||
| 2009 | Extremely High | 2.57 | 100.00 | 5.24 | 100.00 | 7.77 | 100.00 | 9.84 | 100.00 |
| Very High | 21.75 | 97.42 | 22.39 | 94.76 | 22.96 | 92.23 | 23.42 | 90.16 | |
| High | 26.95 | 75.67 | 27.81 | 72.37 | 28.75 | 69.27 | 29.37 | 66.74 | |
| Moderate | 34.72 | 48.72 | 32.10 | 44.56 | 29.71 | 40.52 | 27.72 | 37.37 | |
| Low | 14.00 | 14.00 | 12.46 | 12.46 | 10.81 | 10.81 | 9.65 | 9.65 | |
| 2010 | Extremely High | 1.94 | 100.00 | 4.61 | 100.00 | 7.13 | 100.00 | 9.16 | 100.00 |
| Very High | 21.77 | 98.07 | 22.17 | 95.39 | 22.78 | 92.88 | 23.07 | 90.84 | |
| High | 25.51 | 76.30 | 26.76 | 73.22 | 27.81 | 70.10 | 28.78 | 67.77 | |
| Moderate | 36.13 | 50.79 | 33.58 | 46.46 | 30.99 | 42.29 | 29.05 | 38.99 | |
| Low | 14.66 | 14.66 | 12.88 | 12.88 | 11.30 | 11.30 | 9.94 | 9.94 | |
| 2011 | Extremely High | 2.56 | 100.00 | 4.88 | 100.00 | 7.61 | 100.00 | 9.33 | 100.00 |
| Very High | 21.10 | 97.44 | 21.87 | 95.12 | 22.39 | 92.40 | 22.96 | 90.67 | |
| High | 25.72 | 76.34 | 27.26 | 73.25 | 27.88 | 70.01 | 29.13 | 67.71 | |
| Moderate | 35.98 | 50.62 | 33.20 | 45.99 | 30.76 | 42.13 | 28.66 | 38.58 | |
| Low | 14.64 | 14.64 | 12.79 | 12.79 | 11.37 | 11.37 | 9.92 | 9.92 | |
| 2009–2011 | Extremely High | 2.36 | 100.00 | 4.91 | 100.00 | 7.50 | 100.00 | 9.44 | 100.00 |
| Very High | 21.54 | 97.64 | 22.14 | 95.09 | 22.71 | 92.50 | 23.15 | 90.55 | |
| High | 26.06 | 76.10 | 27.28 | 72.95 | 28.15 | 69.79 | 29.09 | 67.40 | |
| Moderate | 35.61 | 50.04 | 32.96 | 45.67 | 30.48 | 41.64 | 28.47 | 38.31 | |
| Low | 14.43 | 14.43 | 12.71 | 12.71 | 11.16 | 11.16 | 9.84 | 9.84 | |
© 2018 by the authors. Licensee MDPI, Basel, Switzerland. This article is an open access article distributed under the terms and conditions of the Creative Commons Attribution (CC BY) license (http://creativecommons.org/licenses/by/4.0/).
Share and Cite
Abdollahi, M.; Islam, T.; Gupta, A.; Hassan, Q.K. An Advanced Forest Fire Danger Forecasting System: Integration of Remote Sensing and Historical Sources of Ignition Data. Remote Sens. 2018, 10, 923. https://doi.org/10.3390/rs10060923
Abdollahi M, Islam T, Gupta A, Hassan QK. An Advanced Forest Fire Danger Forecasting System: Integration of Remote Sensing and Historical Sources of Ignition Data. Remote Sensing. 2018; 10(6):923. https://doi.org/10.3390/rs10060923
Chicago/Turabian StyleAbdollahi, Masoud, Tanvir Islam, Anil Gupta, and Quazi K. Hassan. 2018. "An Advanced Forest Fire Danger Forecasting System: Integration of Remote Sensing and Historical Sources of Ignition Data" Remote Sensing 10, no. 6: 923. https://doi.org/10.3390/rs10060923
APA StyleAbdollahi, M., Islam, T., Gupta, A., & Hassan, Q. K. (2018). An Advanced Forest Fire Danger Forecasting System: Integration of Remote Sensing and Historical Sources of Ignition Data. Remote Sensing, 10(6), 923. https://doi.org/10.3390/rs10060923