In our paper titled, ‘Mean Composite Fire Severity Metrics Computed with Google Earth Engine Offer Improved Accuracy and Expanded Mapping Potential’ (Parks et al., 2018, [1]), we incorrectly executed the relativized delta normalized burn ratio (RdNBR) equation in Google Earth Engine. This error affects the ‘mean compositing’ results pertaining to RdNBR, and perhaps more importantly, the equation was incorrect in the Earth Engine code we distributed with the paper. Results and code pertaining to the delta normalized burn ratio (dNBR) and the relativized burn ratio (RBR) are not affected.
Our goals for this correction are threefold: (1) to acknowledge that the originally published paper and accompanying Earth Engine code did not correctly implement the RdNBR equation, (2) to correct the Earth Engine code so that the RdNBR equation is correctly executed, and (3) to provide updated tables and figures pertaining to RdNBR (as correctly implemented in Earth Engine).
Although this error is most unfortunate, it does not change the overall message of the paper: that producing fire severity metrics using the mean compositing approach in Earth Engine usually provides a slight improvement over paired-scene assessments and that using Earth Engine makes the process relatively fast and easy.
The Earth Engine code has been updated and RdNBR is now correctly executed: https://code.earthengine.google.com/c76157be827be2f24570df50cca427e9 (accessed on 12 September 2021)
We updated all tables and figures affected by this error (see below). We opted to use the same table and figure numbers as originally published in Parks et al. (2018) [1], thereby facilitating easier comparison between the originally published paper and this correction.
We are extremely sorry for this error. The original article has been updated.
1. Earth Engine Code
The Earth Engine code has been updated and RdNBR is now correctly executed: https://code.earthengine.google.com/c76157be827be2f24570df50cca427e9 (accessed on 12 September 2021).
2. Error in Tables 2–7
The original and corrected Tables 2–7 appear below. The corrected tables are exactly as originally published in Parks et al. (2018) [1] except for those cells highlighted in gray.
Original Version

Table 2.
Mean R2 of the correspondence between CBI and each MTBS- and GEE-derived fire severity metric across the 18 fires. MTBS: Monitoring Trends in Burn Severity; GEE: Google Earth Engine. The correspondence between CBI and the severity metrics were computed for each of the 18 fires and the mean R2 is reported here.
| Mean R2 without dNBRoffset | Mean R2 with dNBRoffset | |||
|---|---|---|---|---|
| MTBS-Derived | GEE-Derived | MTBS-Derived | GEE-Derived | |
| dNBR | 0.761 | 0.768 | 0.761 | 0.768 |
| RdNBR | 0.736 | 0.782 | 0.751 | 0.782 |
| RBR | 0.784 | 0.791 | 0.784 | 0.790 |
Table 3.
R2 of the five-fold cross-validation of the correspondence between CBI and each MTBS- and GEE-derived fire severity metric for 1681 plots across 18 fires; standard error shown in parentheses. The values characterize the average of five folds and represent the severity metrics excluding and including the dNBRoffset.
| R2 without dNBRoffset (Standard Error) | R2 with dNBRoffset (Standard Error) | |||
|---|---|---|---|---|
| MTBS-Derived | GEE-Derived | MTBS-Derived | GEE-Derived | |
| dNBR | 0.630 (0.026) | 0.660 (0.025) | 0.655 (0.026) | 0.682 (0.025) |
| RdNBR | 0.616 (0.026) | 0.723 (0.024) | 0.661 (0.027) | 0.732 (0.024) |
| RBR | 0.683 (0.025) | 0.722 (0.024) | 0.714 (0.025) | 0.739 (0.024) |
Table 4.
Classification accuracy (percent correctly classified) and 95% confidence intervals (CI) for the three fire severity metrics (with and without the dNBRoffset). Each fire severity metric is classified into categories representing low, moderate, and high severity based on index-specific thresholds (see Table 7) and compared to the same classes based on composite burn index thresholds.
| Without dNBRoffset | With dNBRoffset | ||||
|---|---|---|---|---|---|
| Accuracy (%) | 95% CI | Accuracy (%) | 95% CI | ||
| dNBR | MTBS-derived | 69.6 | 67.3–71.8 | 70.2 | 68.0–72.4 |
| GEE-derived | 71.3 | 69.0–73.4 | 71.7 | 69.5–73.9 | |
| RdNBR | MTBS-derived | 71.4 | 69.2–73.5 | 73.6 | 71.4–75.6 |
| GEE-derived | 73.9 | 71.8–76.0 | 73.9 | 71.8–76.0 | |
| RBR | MTBS-derived | 72.4 | 71.1–74.5 | 73.5 | 71.4–75.6 |
| GEE-derived | 73.5 | 71.4–75.6 | 74.1 | 72.0–76.2 | |
Table 5.
Confusion matrices for classifying as low, moderate, and high severity using the severity metrics computed without the dNBRoffset. Confusion matrices for MTBS-derived metrics are on the left and confusion matrices for GEE-derived metrics are on the right. UA: user’s accuracy; PA: producer’s accuracy.
| Reference CBI Class | Reference CBI Class | ||||||||||
| Classified using MTBS-derived dNBR | Low | Mod. | High | UA | Classified using GEE-derived dNBR | Low | Mod. | High | UA | ||
| Low | 401 | 159 | 18 | 69.4 | Low | 407 | 139 | 13 | 72.8 | ||
| Mod. | 91 | 412 | 114 | 66.8 | Mod. | 87 | 438 | 123 | 67.6 | ||
| High | 5 | 124 | 357 | 73.5 | High | 3 | 118 | 353 | 74.5 | ||
| PA | 80.7 | 59.3 | 73.0 | PA | 81.9 | 63.0 | 72.2 | ||||
| Reference CBI class | Reference CBI class | ||||||||||
| Classified using MTBS-derived RdNBR | Low | Mod. | High | UA | Classified using GEE-derived RdNBR | Low | Mod. | High | UA | ||
| Low | 366 | 142 | 7 | 71.1 | Low | 396 | 130 | 7 | 74.3 | ||
| Mod. | 119 | 451 | 99 | 67.4 | Mod. | 97 | 470 | 105 | 69.9 | ||
| High | 12 | 102 | 383 | 77.1 | High | 4 | 95 | 377 | 79.2 | ||
| PA | 73.6 | 64.9 | 78.3 | PA | 79.7 | 67.6 | 77.1 | ||||
| Reference CBI class | Reference CBI class | ||||||||||
| Classified using MTBS-derived RBR | Low | Mod. | High | UA | Classified using GEE-derived RBR | Low | Mod. | High | UA | ||
| Low | 380 | 127 | 12 | 73.2 | Low | 403 | 130 | 9 | 74.4 | ||
| Mod. | 113 | 462 | 102 | 68.2 | Mod. | 90 | 464 | 111 | 69.8 | ||
| High | 4 | 106 | 375 | 77.3 | High | 4 | 101 | 369 | 77.8 | ||
| PA | 76.5 | 66.5 | 76.7 | PA | 81.1 | 66.8 | 75.5 | ||||
Table 6.
Confusion matrices for classifying as low, moderate, and high severity using the severity metrics computed with the dNBRoffset. Confusion matrices for MTBS-derived metrics are on the left and confusion matrices for GEE-derived metrics are on the right. UA: user’s accuracy; PA: producer’s accuracy.
| Reference CBI Class | Reference CBI Class | ||||||||||
| Classified using MTBS-derived dNBR | Low | Mod. | High | UA | Classified using GEE-derived dNBR | Low | Mod. | High | UA | ||
| Low | 397 | 156 | 13 | 70.1 | Low | 402 | 141 | 10 | 72.7 | ||
| Mod. | 98 | 425 | 118 | 66.3 | Mod. | 92 | 451 | 126 | 67.4 | ||
| High | 2 | 114 | 358 | 75.5 | High | 3 | 103 | 353 | 76.9 | ||
| PA | 79.9 | 61.2 | 73.2 | PA | 80.9 | 64.9 | 72.2 | ||||
| Reference CBI class | Reference CBI class | ||||||||||
| Classified using MTBS-derived RdNBR | Low | Mod. | High | UA | Classified using GEE-derived RdNBR | Low | Mod. | High | UA | ||
| Low | 378 | 133 | 5 | 73.3 | Low | 386 | 122 | 7 | 75.0 | ||
| Mod. | 112 | 467 | 92 | 69.6 | Mod. | 108 | 478 | 103 | 69.4 | ||
| High | 7 | 95 | 392 | 79.4 | High | 3 | 95 | 379 | 79.5 | ||
| PA | 76.1 | 67.2 | 80.2 | PA | 77.7 | 68.8 | 77.5 | ||||
| Reference CBI class | Reference CBI class | ||||||||||
| Classified using MTBS-derived RBR | Low | Mod. | High | UA | Classified using GEE-derived RBR | Low | Mod. | High | UA | ||
| Low | 390 | 135 | 6 | 73.4 | Low | 386 | 123 | 7 | 74.8 | ||
| Mod. | 105 | 460 | 97 | 69.5 | Mod. | 107 | 481 | 103 | 69.6 | ||
| High | 2 | 100 | 386 | 79.1 | High | 4 | 91 | 379 | 80.0 | ||
| PA | 78.5 | 66.2 | 78.9 | PA | 77.7 | 69.2 | 77.5 | ||||
Table 7.
Threshold values for each fire severity metric corresponding to low (CBI = 0–1.24), moderate (CBI = 1.25–2.25), and high severity (CBI = 2.25–3).
Table 7.
Threshold values for each fire severity metric corresponding to low (CBI = 0–1.24), moderate (CBI = 1.25–2.25), and high severity (CBI = 2.25–3).
| MTBS-Derived | GEE-Derived | ||||||
|---|---|---|---|---|---|---|---|
| Low | Moderate | High | Low | Moderate | High | ||
| Excludes dNBRoffset | dNBR | ≤186 | 187–429 | ≥430 | ≤185 | 186–417 | ≥418 |
| RdNBR | ≤337 | 338–721 | ≥722 | ≤248 | 249–544 | ≥545 | |
| RBR | ≤134 | 135–303 | ≥304 | ≤135 | 136–300 | ≥301 | |
| Includes dNBRoffset | dNBR | ≤165 | 166–440 | ≥411 | ≤159 | 160–392 | ≥393 |
| RdNBR | ≤294 | 295–690 | ≥691 | ≤212 | 213–511 | ≥512 | |
| RBR | ≤118 | 119–289 | ≥289 | ≤115 | 116–282 | ≥283 | |
Corrected Version
Table 2.
Mean R2 of the correspondence between CBI and each MTBS- and GEE-derived fire severity metric across the 18 fires. The correspondence between CBI and the severity metrics were computed for each of the 18 fires and the mean R2 is reported here.
Table 2.
Mean R2 of the correspondence between CBI and each MTBS- and GEE-derived fire severity metric across the 18 fires. The correspondence between CBI and the severity metrics were computed for each of the 18 fires and the mean R2 is reported here.
| Mean R2 without dNBRoffset | Mean R2 with dNBRoffset | |||
| MTBS-Derived | GEE-Derived | MTBS-Derived | GEE-Derived | |
| dNBR | 0.761 | 0.768 | 0.761 | 0.768 |
| RdNBR | 0.736 | 0.764 | 0.751 | 0.759 |
| RBR | 0.784 | 0.791 | 0.784 | 0.790 |
Table 3.
R2 of the five-fold cross-validation of the correspondence between CBI and each MTBS- and GEE-derived fire severity metric for 1681 plots across 18 fires; standard error shown in parentheses. The values characterize the average of five folds and represent the severity metrics excluding and including the dNBRoffset.
Table 3.
R2 of the five-fold cross-validation of the correspondence between CBI and each MTBS- and GEE-derived fire severity metric for 1681 plots across 18 fires; standard error shown in parentheses. The values characterize the average of five folds and represent the severity metrics excluding and including the dNBRoffset.
| R2 without dNBRoffset (Standard Error) | R2 with dNBRoffset (Standard Error) | |||
| MTBS-Derived | GEE-Derived | MTBS-Derived | GEE-Derived | |
| dNBR | 0.630 (0.026) | 0.660 (0.025) | 0.655 (0.026) | 0.682 (0.025) |
| RdNBR | 0.616 (0.026) | 0.692 (0.025) | 0.661 (0.026) | 0.669 (0.026) |
| RBR | 0.683 (0.025) | 0.722 (0.024) | 0.714 (0.025) | 0.739 (0.024) |
Table 4.
Classification accuracy (percent correctly classified) and 95% confidence intervals (CI) for the three fire severity metrics (with and without the dNBRoffset). Each fire severity metric is classified into categories representing low, moderate, and high severity based on index-specific thresholds (see Table 7) and compared to the same classes based on composite burn index thresholds.
Table 4.
Classification accuracy (percent correctly classified) and 95% confidence intervals (CI) for the three fire severity metrics (with and without the dNBRoffset). Each fire severity metric is classified into categories representing low, moderate, and high severity based on index-specific thresholds (see Table 7) and compared to the same classes based on composite burn index thresholds.
| Without dNBRoffset | With dNBRoffset | ||||
| Accuracy (%) | 95% CI | Accuracy (%) | 95% CI | ||
| dNBR | MTBS-derived | 69.6 | 67.3–71.8 | 70.2 | 68.0–72.4 |
| GEE-derived | 71.3 | 69.0–73.4 | 71.7 | 69.5–73.9 | |
| RdNBR | MTBS-derived | 71.4 | 69.2–73.5 | 73.6 | 71.4–75.6 |
| GEE-derived | 73.4 | 71.2–75.5 | 73.1 | 71.0–75.3 | |
| RBR | MTBS-derived | 72.4 | 71.1–74.5 | 73.5 | 71.4–75.6 |
| GEE-derived | 73.5 | 71.4–75.6 | 74.1 | 72.0–76.2 | |
Table 5.
Confusion matrices for classifying as low, moderate, and high severity using the severity metrics computed without the dNBRoffset. Confusion matrices for MTBS-derived metrics are on the left and confusion matrices for GEE-derived metrics are on the right. UA: user’s accuracy; PA: producer’s accuracy.
Table 5.
Confusion matrices for classifying as low, moderate, and high severity using the severity metrics computed without the dNBRoffset. Confusion matrices for MTBS-derived metrics are on the left and confusion matrices for GEE-derived metrics are on the right. UA: user’s accuracy; PA: producer’s accuracy.
| Reference CBI Class | Reference CBI Class | ||||||||||
| Classified using MTBS-derived dNBR | Low | Mod. | High | UA | Classified using GEE-derived dNBR | Low | Mod. | High | UA | ||
| Low | 401 | 159 | 18 | 69.4 | Low | 407 | 139 | 13 | 72.8 | ||
| Mod. | 91 | 412 | 114 | 66.8 | Mod. | 87 | 438 | 123 | 67.6 | ||
| High | 5 | 124 | 357 | 73.5 | High | 3 | 118 | 353 | 74.5 | ||
| PA | 80.7 | 59.3 | 73.0 | PA | 81.9 | 63.0 | 72.2 | ||||
| Reference CBI class | Reference CBI class | ||||||||||
| Classified using MTBS-derived RdNBR | Low | Mod. | High | UA | Classified using GEE-derived RdNBR | Low | Mod. | High | UA | ||
| Low | 366 | 142 | 7 | 71.1 | Low | 385 | 136 | 5 | 73.2 | ||
| Mod. | 119 | 451 | 99 | 67.4 | Mod. | 105 | 465 | 100 | 69.4 | ||
| High | 12 | 102 | 383 | 77.1 | High | 7 | 94 | 384 | 79.2 | ||
| PA | 73.6 | 64.9 | 78.3 | PA | 77.5 | 66.9 | 78.5 | ||||
| Reference CBI class | Reference CBI class | ||||||||||
| Classified using MTBS-derived RBR | Low | Mod. | High | UA | Classified using GEE-derived RBR | Low | Mod. | High | UA | ||
| Low | 380 | 127 | 12 | 73.2 | Low | 403 | 130 | 9 | 74.4 | ||
| Mod. | 113 | 462 | 102 | 68.2 | Mod. | 90 | 464 | 111 | 69.8 | ||
| High | 4 | 106 | 375 | 77.3 | High | 4 | 101 | 369 | 77.8 | ||
| PA | 76.5 | 66.5 | 76.7 | PA | 81.1 | 66.8 | 75.5 | ||||
Table 6.
Confusion matrices for classifying as low, moderate, and high severity using the severity metrics computed with the dNBRoffset. Confusion matrices for MTBS-derived metrics are on the left and confusion matrices for GEE-derived metrics are on the right. UA: user’s accuracy; PA: producer’s accuracy.
Table 6.
Confusion matrices for classifying as low, moderate, and high severity using the severity metrics computed with the dNBRoffset. Confusion matrices for MTBS-derived metrics are on the left and confusion matrices for GEE-derived metrics are on the right. UA: user’s accuracy; PA: producer’s accuracy.
| Reference CBI Class | Reference CBI Class | ||||||||||
| Classified using MTBS-derived dNBR | Low | Mod. | High | UA | Classified using GEE-derived dNBR | Low | Mod. | High | UA | ||
| Low | 397 | 156 | 13 | 70.1 | Low | 402 | 141 | 10 | 72.7 | ||
| Mod. | 98 | 425 | 118 | 66.3 | Mod. | 92 | 451 | 126 | 67.4 | ||
| High | 2 | 114 | 358 | 75.5 | High | 3 | 103 | 353 | 76.9 | ||
| PA | 79.9 | 61.2 | 73.2 | PA | 80.9 | 64.9 | 72.2 | ||||
| Reference CBI class | Reference CBI class | ||||||||||
| Classified using MTBS-derived RdNBR | Low | Mod. | High | UA | Classified using GEE-derived RdNBR | Low | Mod. | High | UA | ||
| Low | 378 | 133 | 5 | 73.3 | Low | 390 | 137 | 5 | 73.3 | ||
| Mod. | 112 | 467 | 92 | 69.6 | Mod. | 101 | 460 | 104 | 69.2 | ||
| High | 7 | 95 | 392 | 79.4 | High | 6 | 98 | 380 | 78.5 | ||
| PA | 76.1 | 67.2 | 80.2 | PA | 78.5 | 66.2 | 77.7 | ||||
| Reference CBI class | Reference CBI class | ||||||||||
| Classified using MTBS-derived RBR | Low | Mod. | High | UA | Classified using GEE-derived RBR | Low | Mod. | High | UA | ||
| Low | 390 | 135 | 6 | 73.4 | Low | 386 | 123 | 7 | 74.8 | ||
| Mod. | 105 | 460 | 97 | 69.5 | Mod. | 107 | 481 | 103 | 69.6 | ||
| High | 2 | 100 | 386 | 79.1 | High | 4 | 91 | 379 | 80.0 | ||
| PA | 78.5 | 66.2 | 78.9 | PA | 77.7 | 69.2 | 77.5 | ||||
Table 7.
Threshold values for each fire severity metric corresponding to low (CBI = 0−1.24), moderate (CBI = 1.25−2.25), and high severity (CBI = 2.25−3).
Table 7.
Threshold values for each fire severity metric corresponding to low (CBI = 0−1.24), moderate (CBI = 1.25−2.25), and high severity (CBI = 2.25−3).
| MTBS-Derived | GEE-Derived | ||||||
|---|---|---|---|---|---|---|---|
| Low | Moderate | High | Low | Moderate | High | ||
| Excludes dNBRoffset | dNBR | ≤186 | 187–429 | ≥430 | ≤185 | 186–417 | ≥418 |
| RdNBR | ≤337 | 338–721 | ≥722 | ≤338 | 339–726 | ≥727 | |
| RBR | ≤134 | 135–303 | ≥304 | ≤135 | 136–300 | ≥301 | |
| Includes dNBRoffset | dNBR | ≤165 | 166–440 | ≥411 | ≤159 | 160–392 | ≥393 |
| RdNBR | ≤294 | 295–690 | ≥691 | ≤312 | 313–706 | ≥707 | |
| RBR | ≤118 | 119–289 | ≥289 | ≤115 | 116–282 | ≥283 | |
3. Error in Figure 2
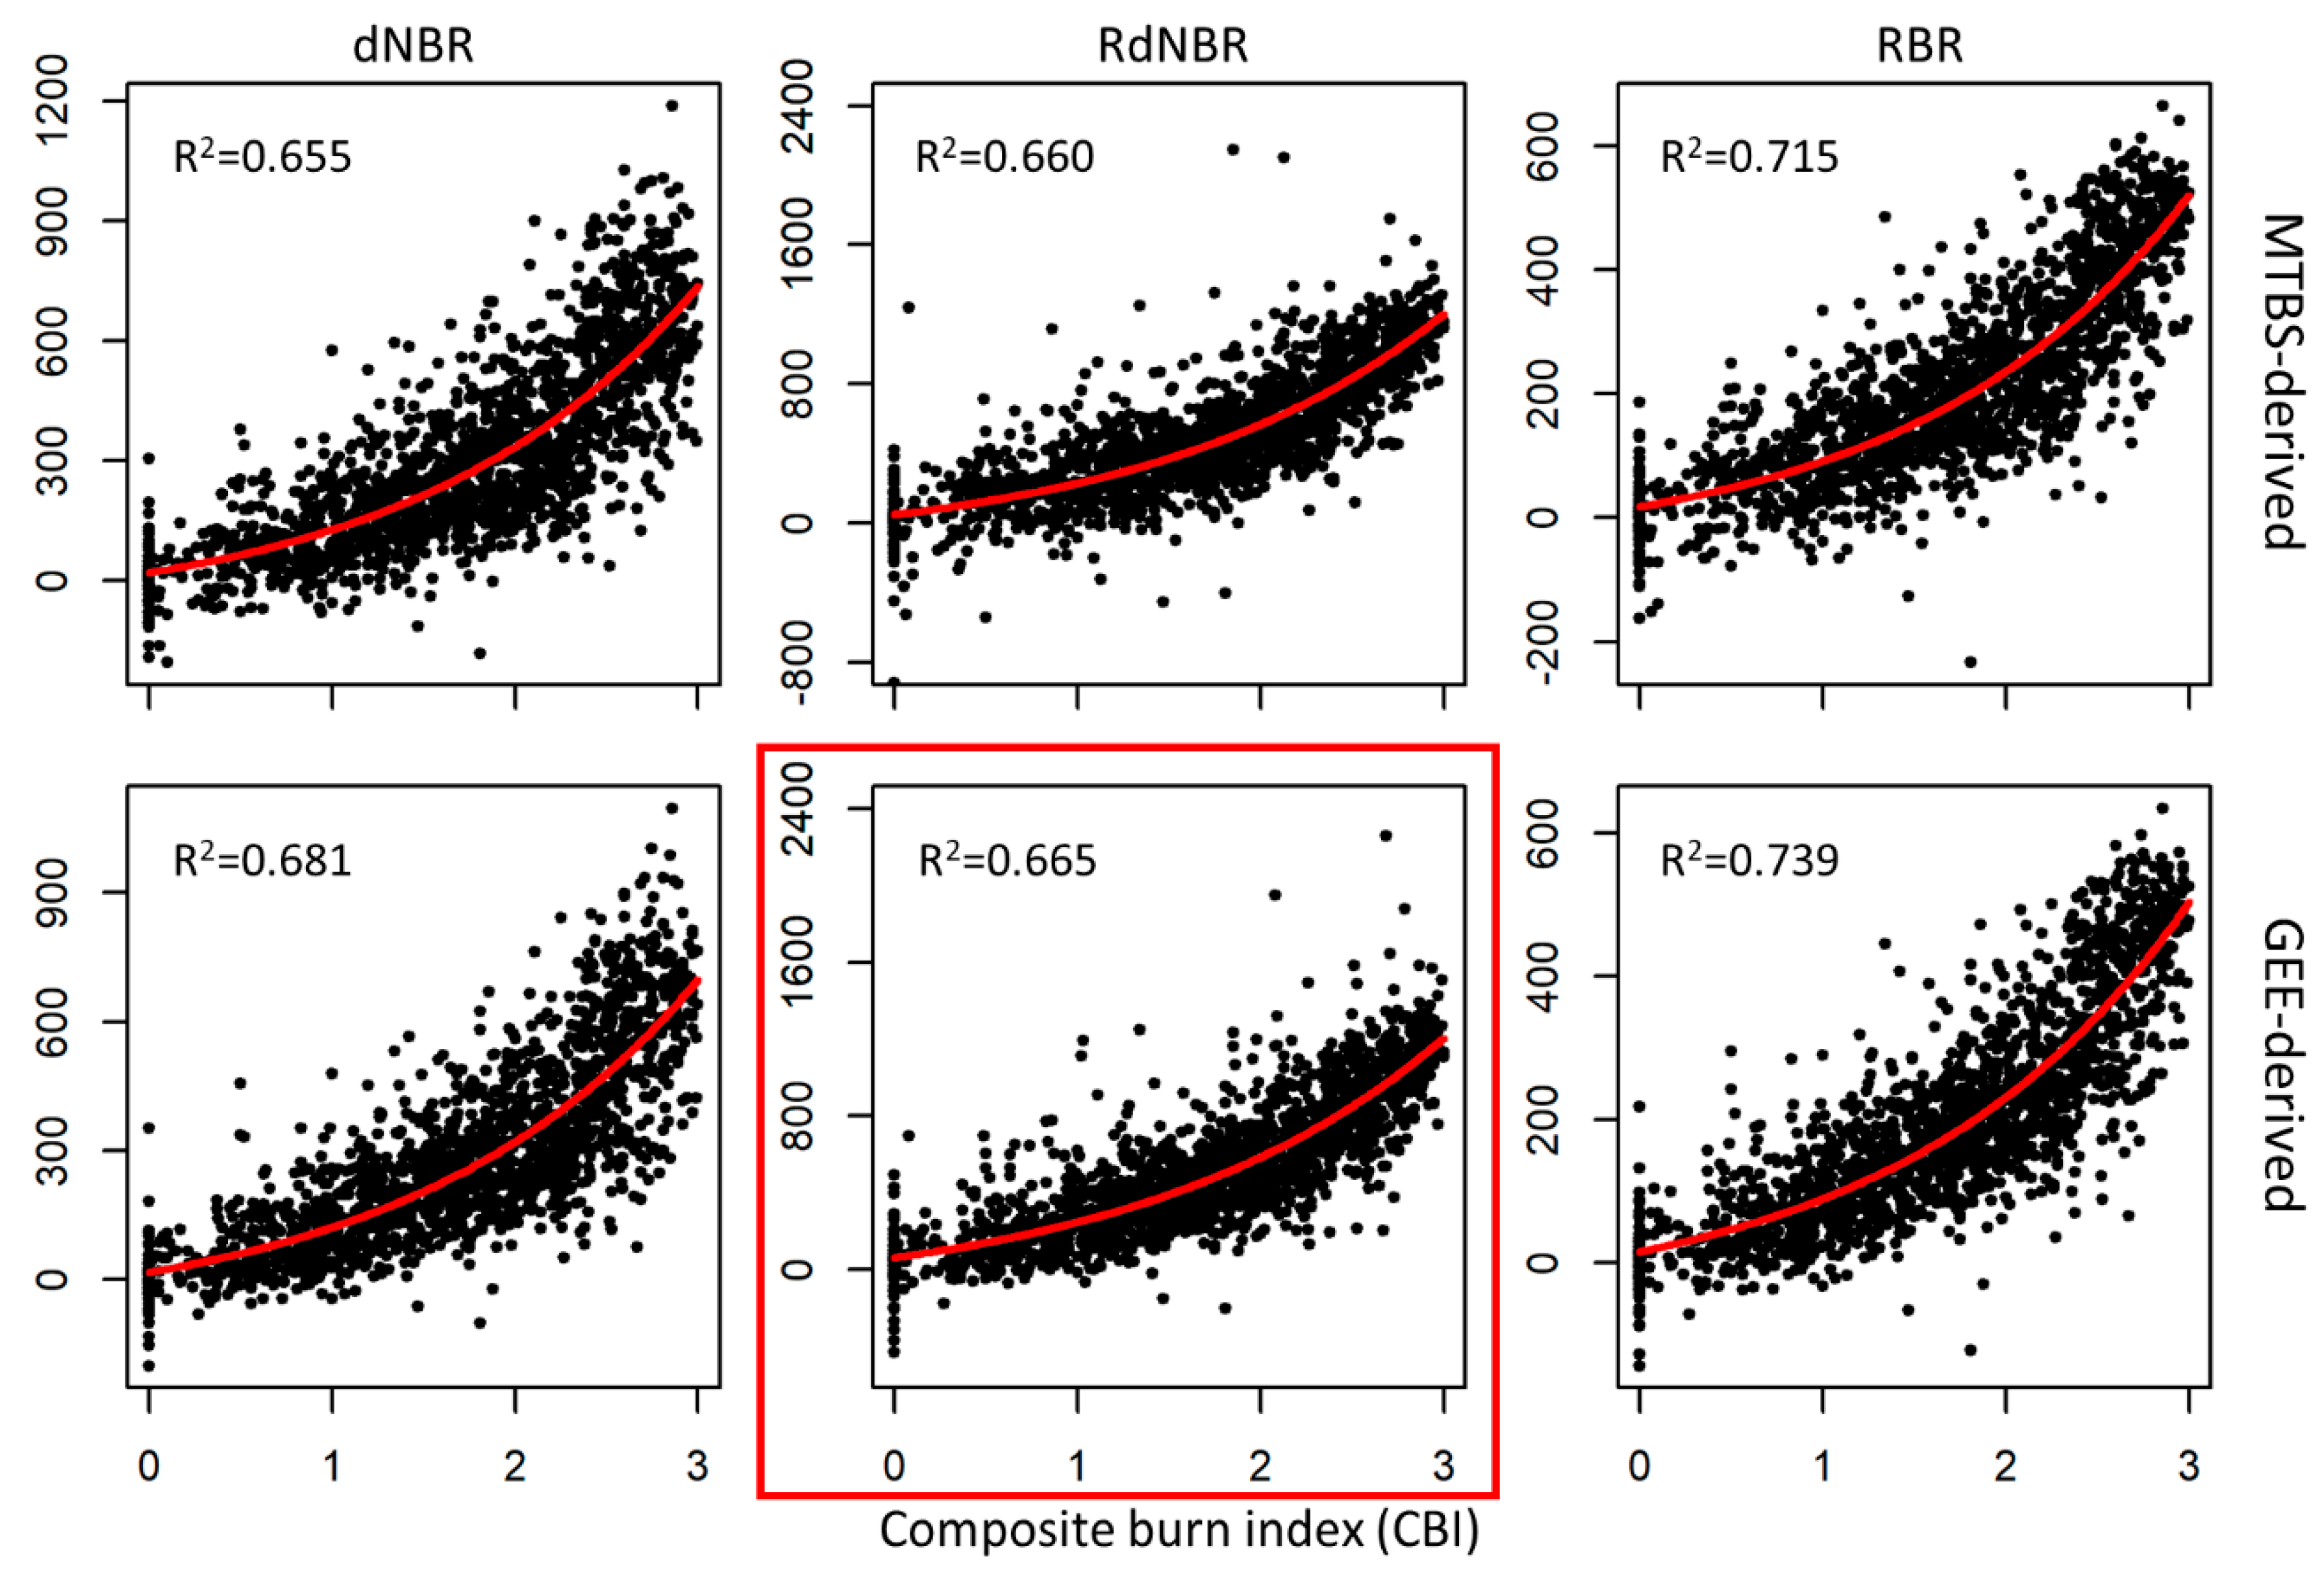
The original and corrected Figure 2 appears below. This corrected figure is exactly as originally published in Parks et al. (2018) [1] except for the panel indicated by the red outline.
Original Version
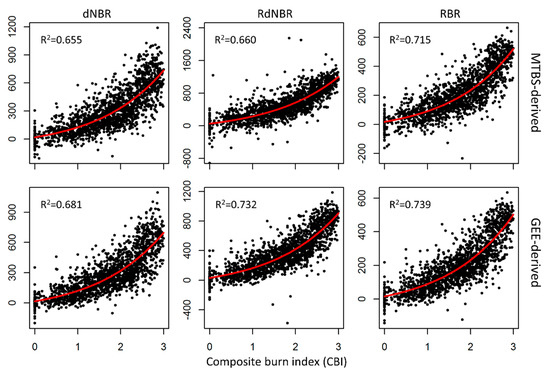
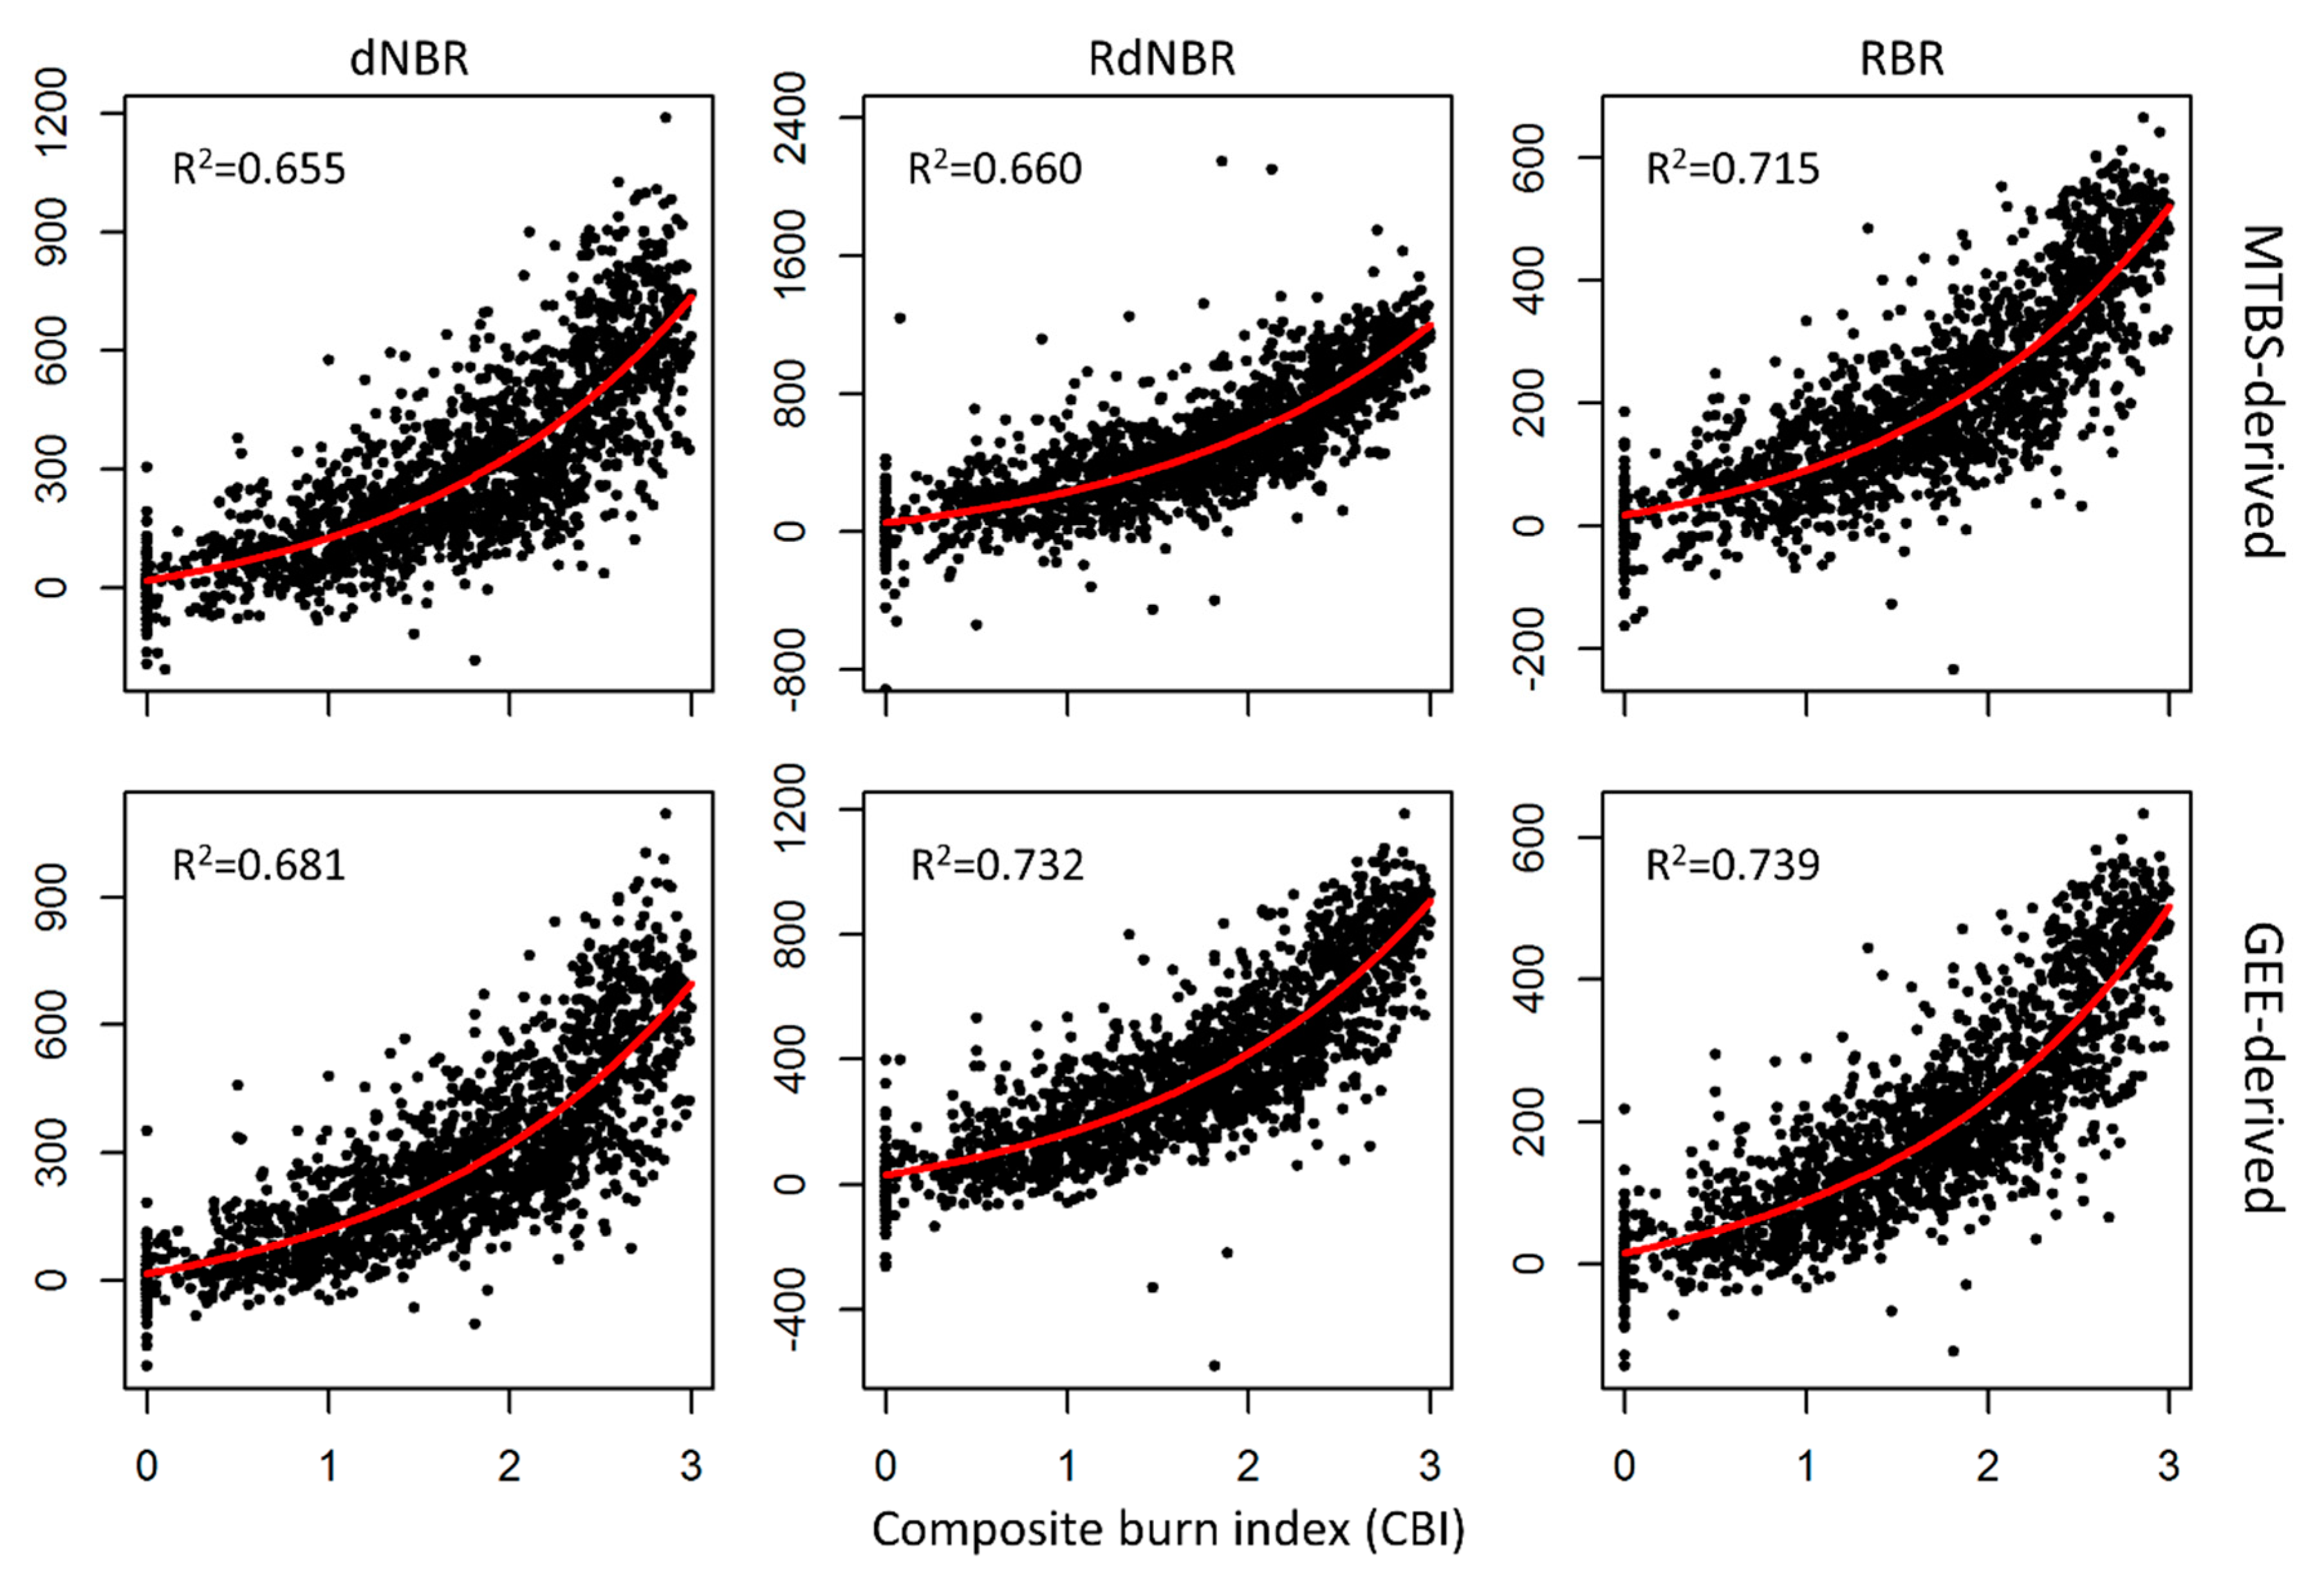
Figure 2.
Plots show each MTBS- (top row) and GEE-derived (bottom row) severity metric and the corresponding field-based CBI. All severity metrics include the dNBRoffset. Red lines show the modeled fit of the nonlinear regressions for all 1681 plots. The model fits and the resulting R2 shown here were not produced using cross-validation and therefore may differ slightly from the results shown in Table 3.
Corrected Version
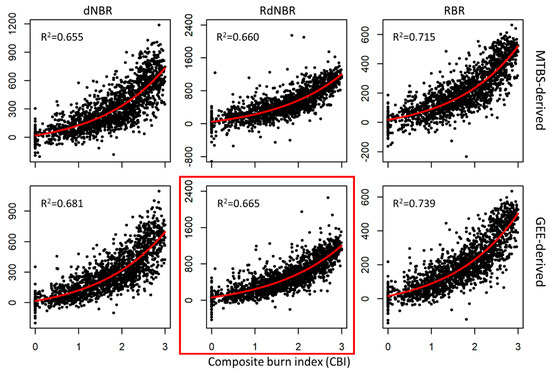
Figure 2.
Plots show each MTBS- (top row) and GEE-derived (bottom row) severity metric and the corresponding field-based CBI. All severity metrics include the dNBRoffset. Red lines show the modeled fit of the nonlinear regressions for all 1681 plots. The model fits and the resulting R2 shown here were not produced using cross-validation and therefore may differ slightly from the results shown in Table 3. Extreme RdNBR values are not shown to improve visual appearance of the RdNBR panels.
Reference
- Parks, S.A.; Holsinger, L.M.; Voss, M.A.; Loehman, R.A.; Robinson, N.P. Mean Composite Fire Severity Metrics Computed with Google Earth Engine Offer Improved Accuracy and Expanded Mapping Potential. Remote Sens. 2018, 10, 879. [Google Scholar] [CrossRef] [Green Version]
Publisher’s Note: MDPI stays neutral with regard to jurisdictional claims in published maps and institutional affiliations. |
© 2021 by the authors. Licensee MDPI, Basel, Switzerland. This article is an open access article distributed under the terms and conditions of the Creative Commons Attribution (CC BY) license (https://creativecommons.org/licenses/by/4.0/).