TerraSAR-X and Wetlands: A Review


Abstract
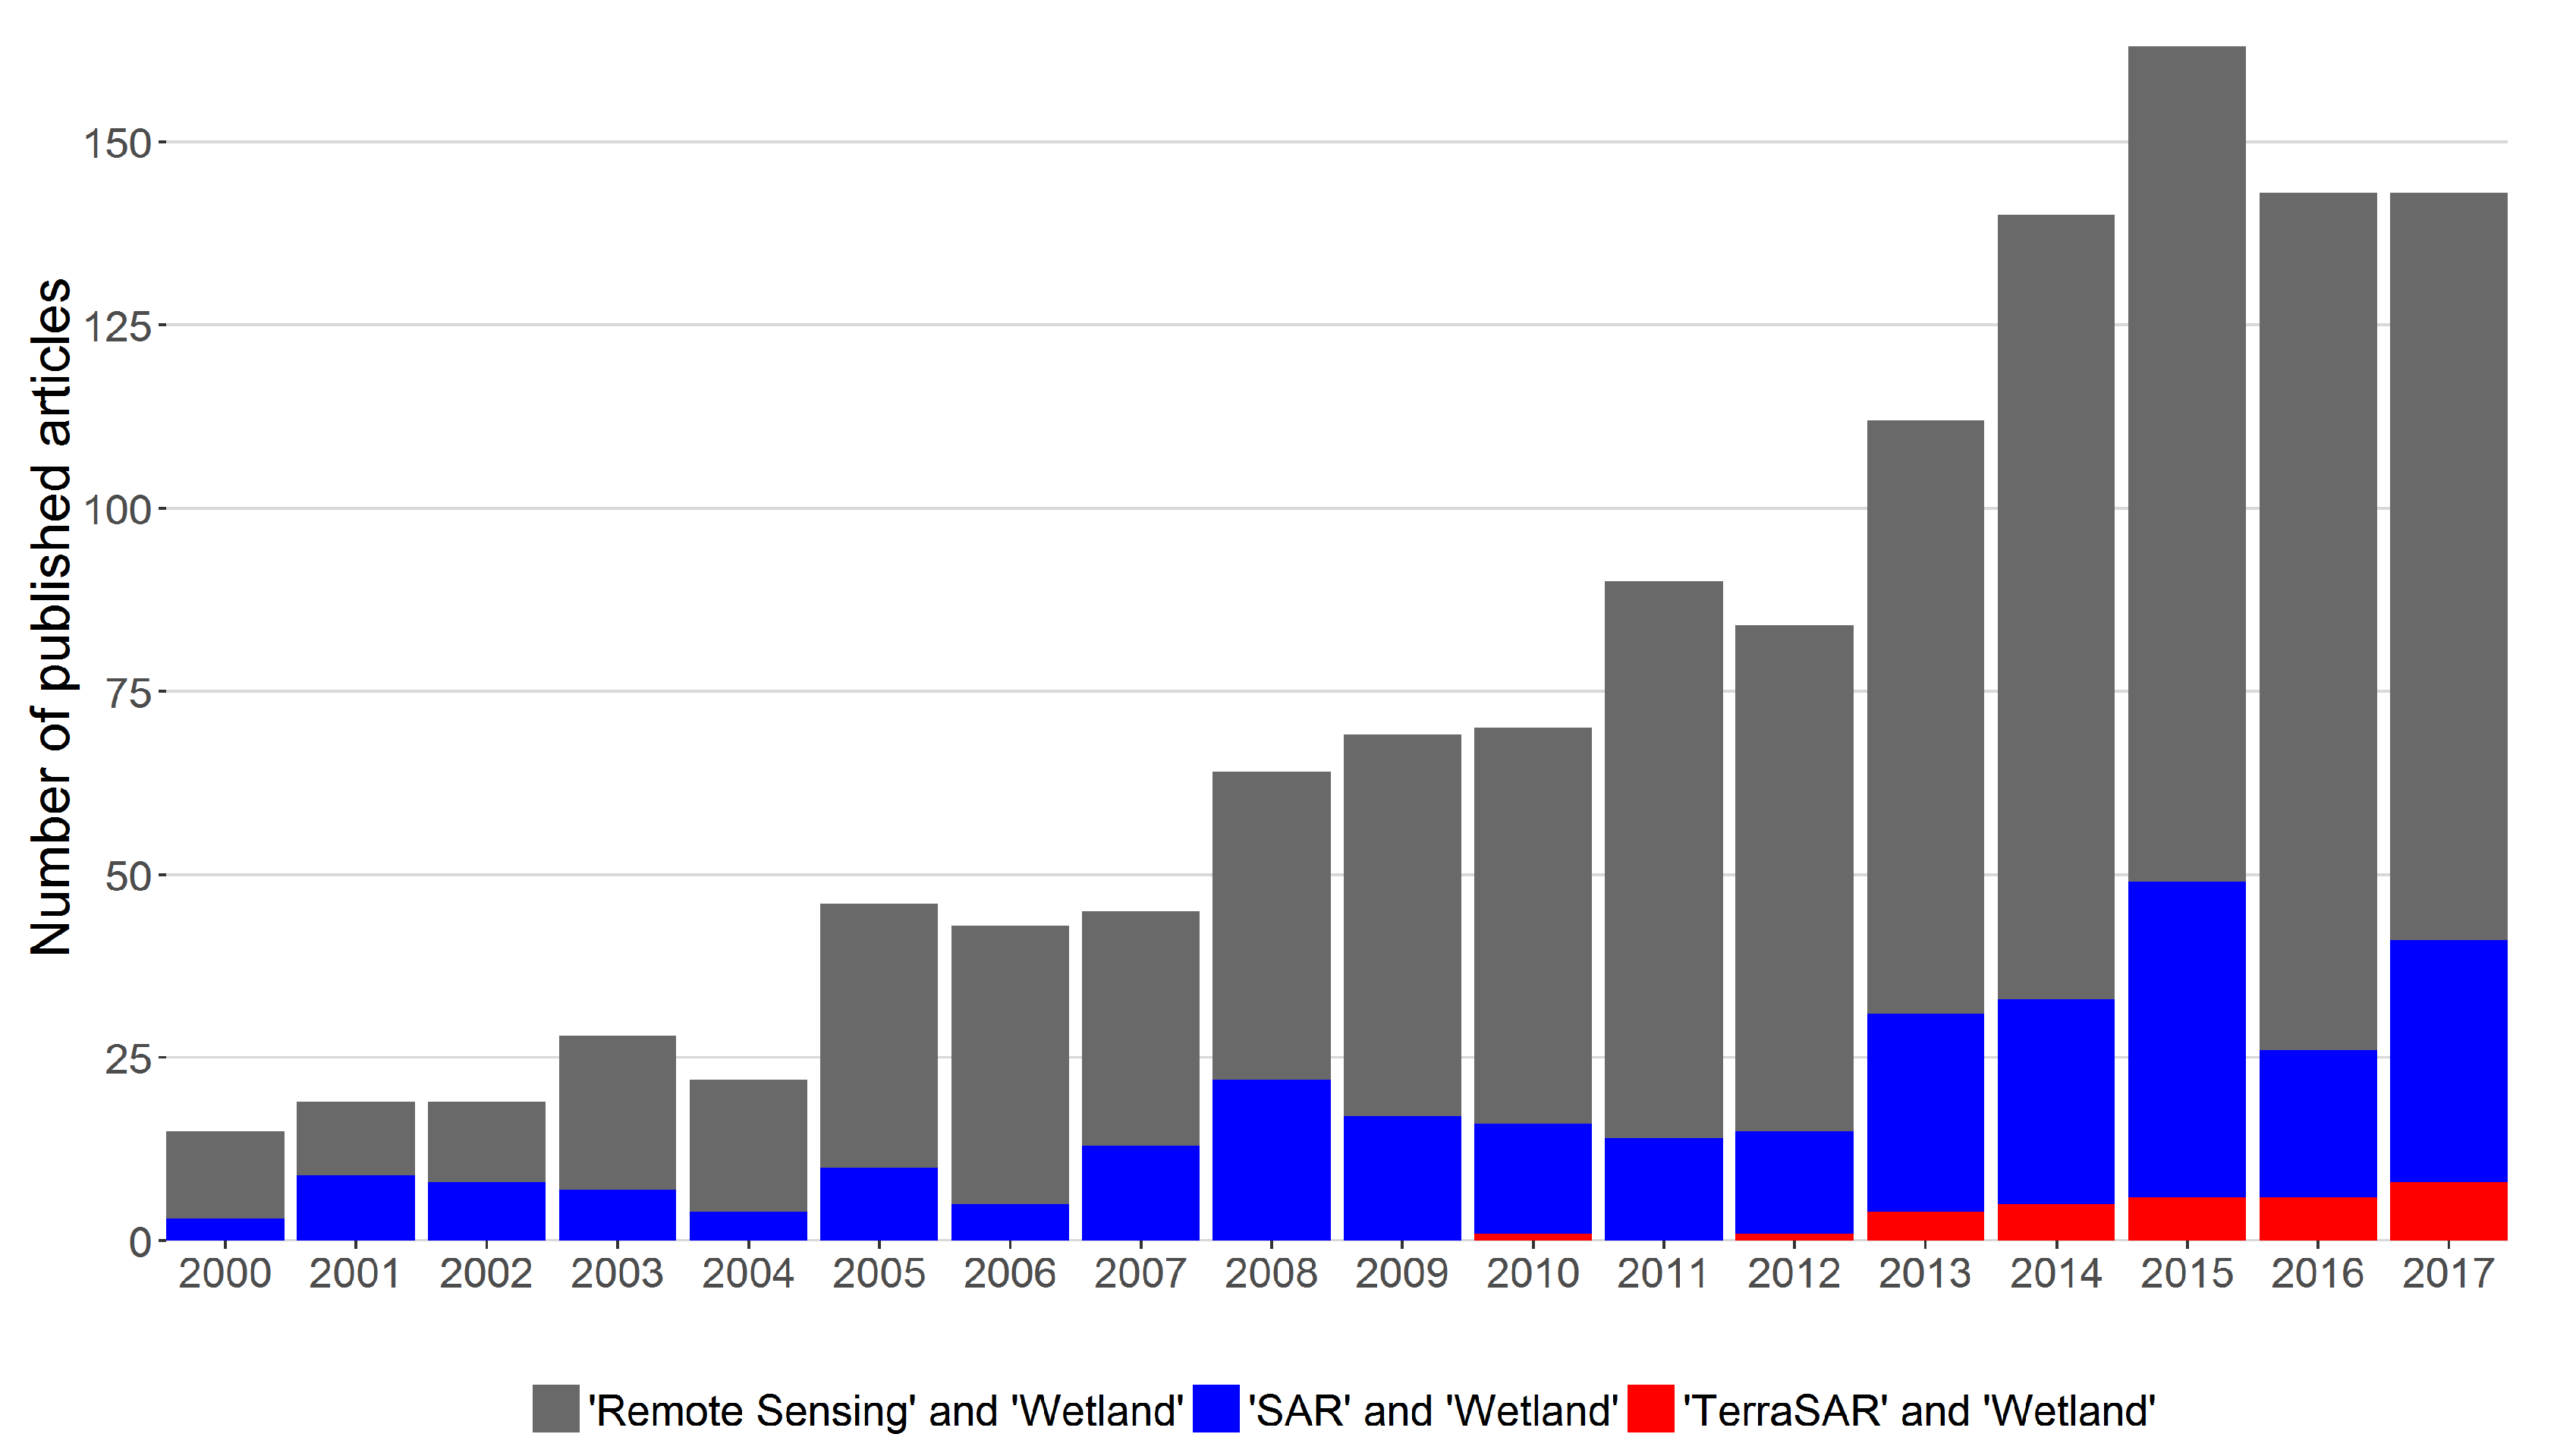
1. Introduction
2. Wetland Concept, Types, and Characteristics
“areas of marsh, fen, peatland or water, whether natural or artificial, permanent or temporary, with water that is static or flowing, fresh, brackish or salt, including areas of marine water the depth of which at low tide does not exceed six metres” [35].
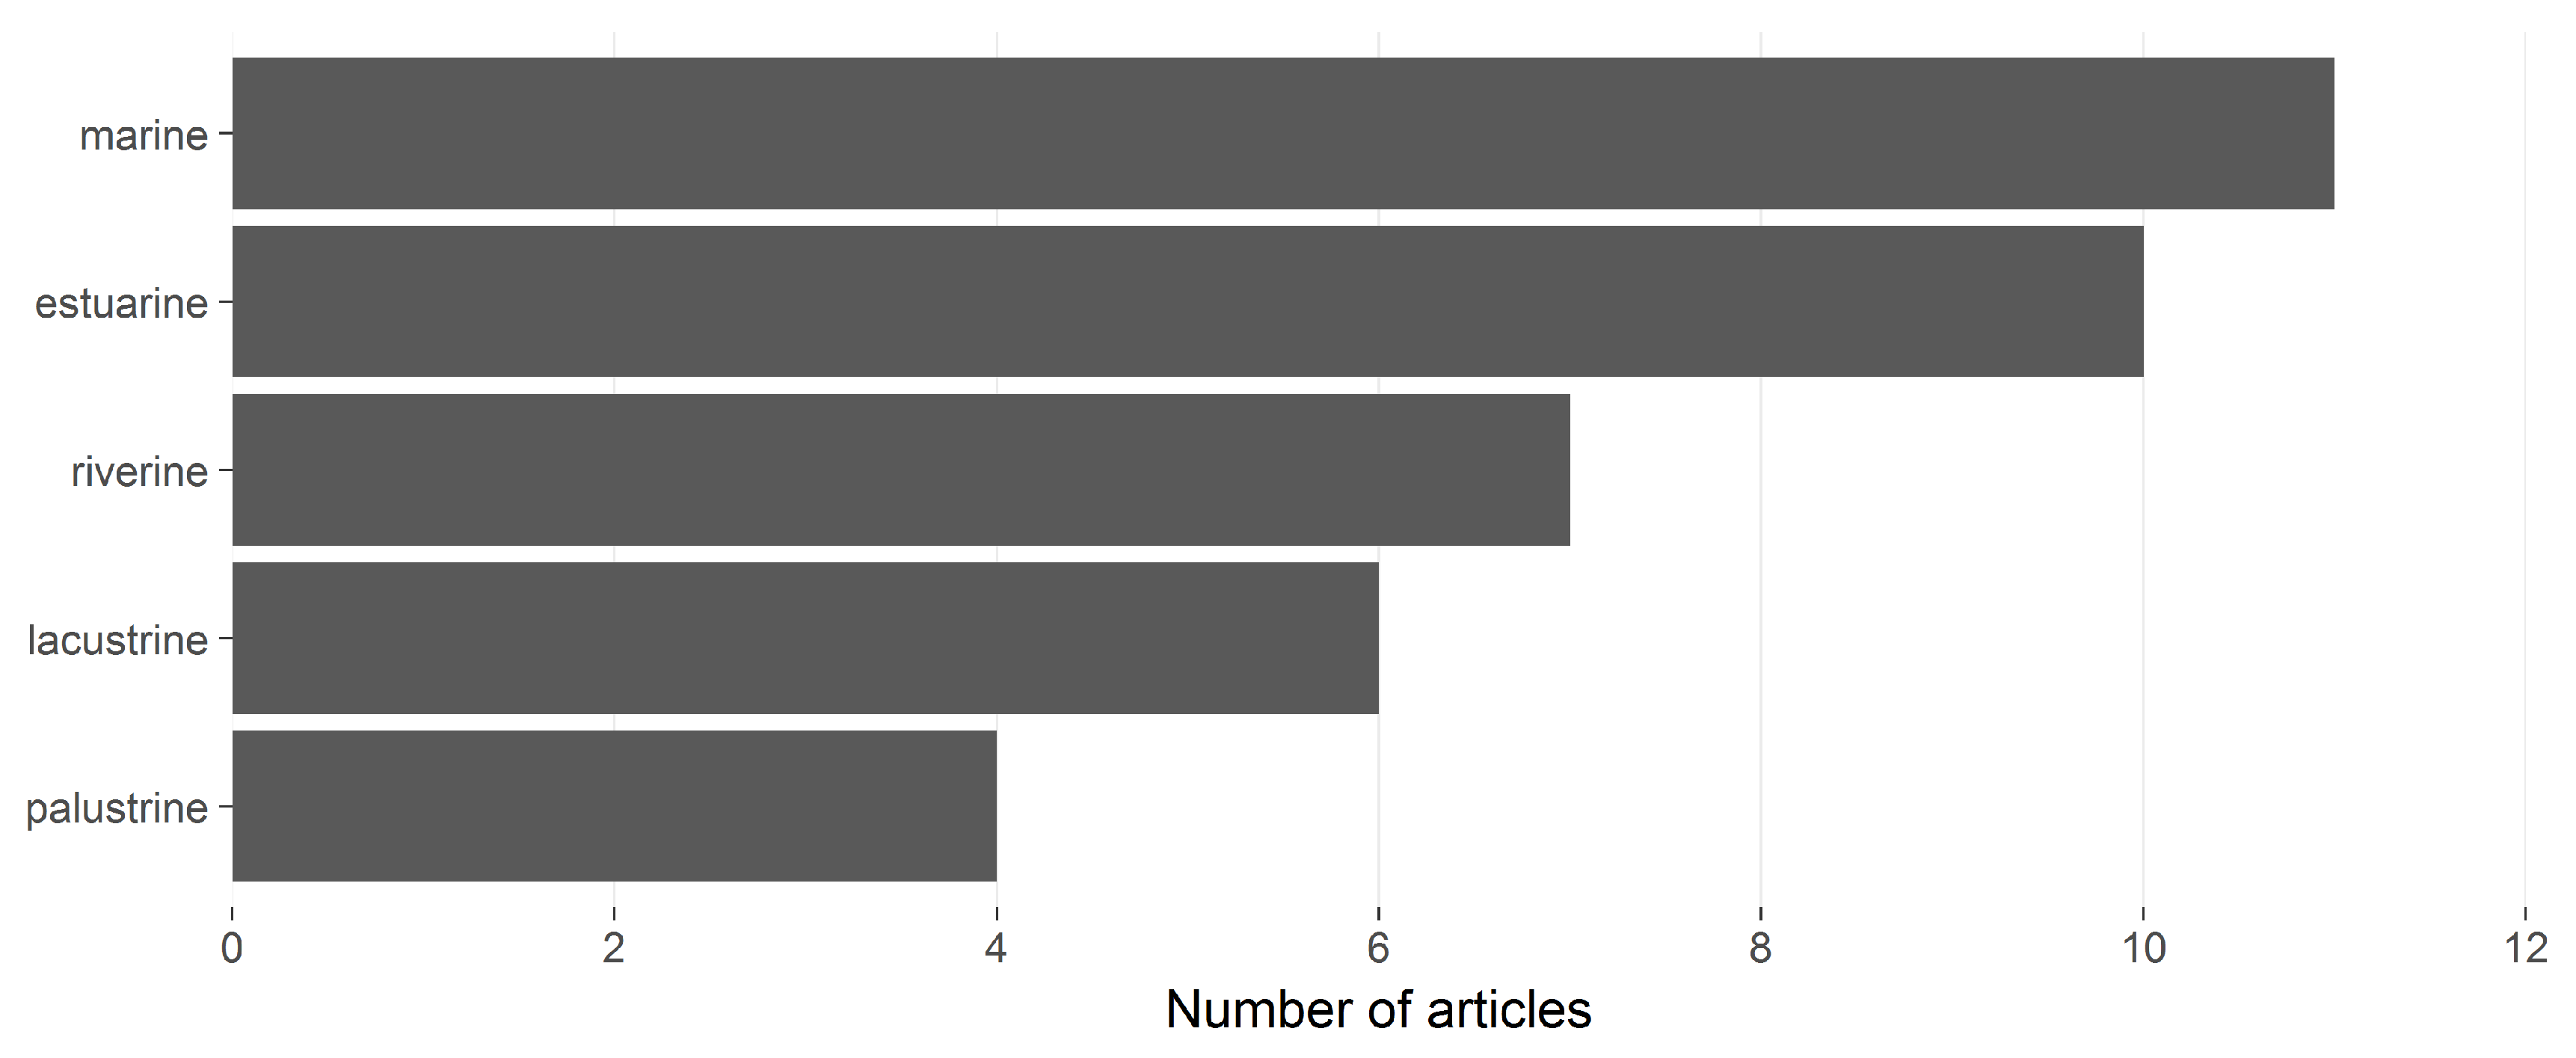
- marine (coastal wetlands such as lagoons, shores, and coral reefs)
- estuarine (deltas, tidal marshes, mudflats, and mangrove swamps)
- lacustrine (wetlands associated with lakes)
- riverine (wetlands along rivers and streams)
- palustrine ("marshy" wetlands like marshes, swamps, and bogs)
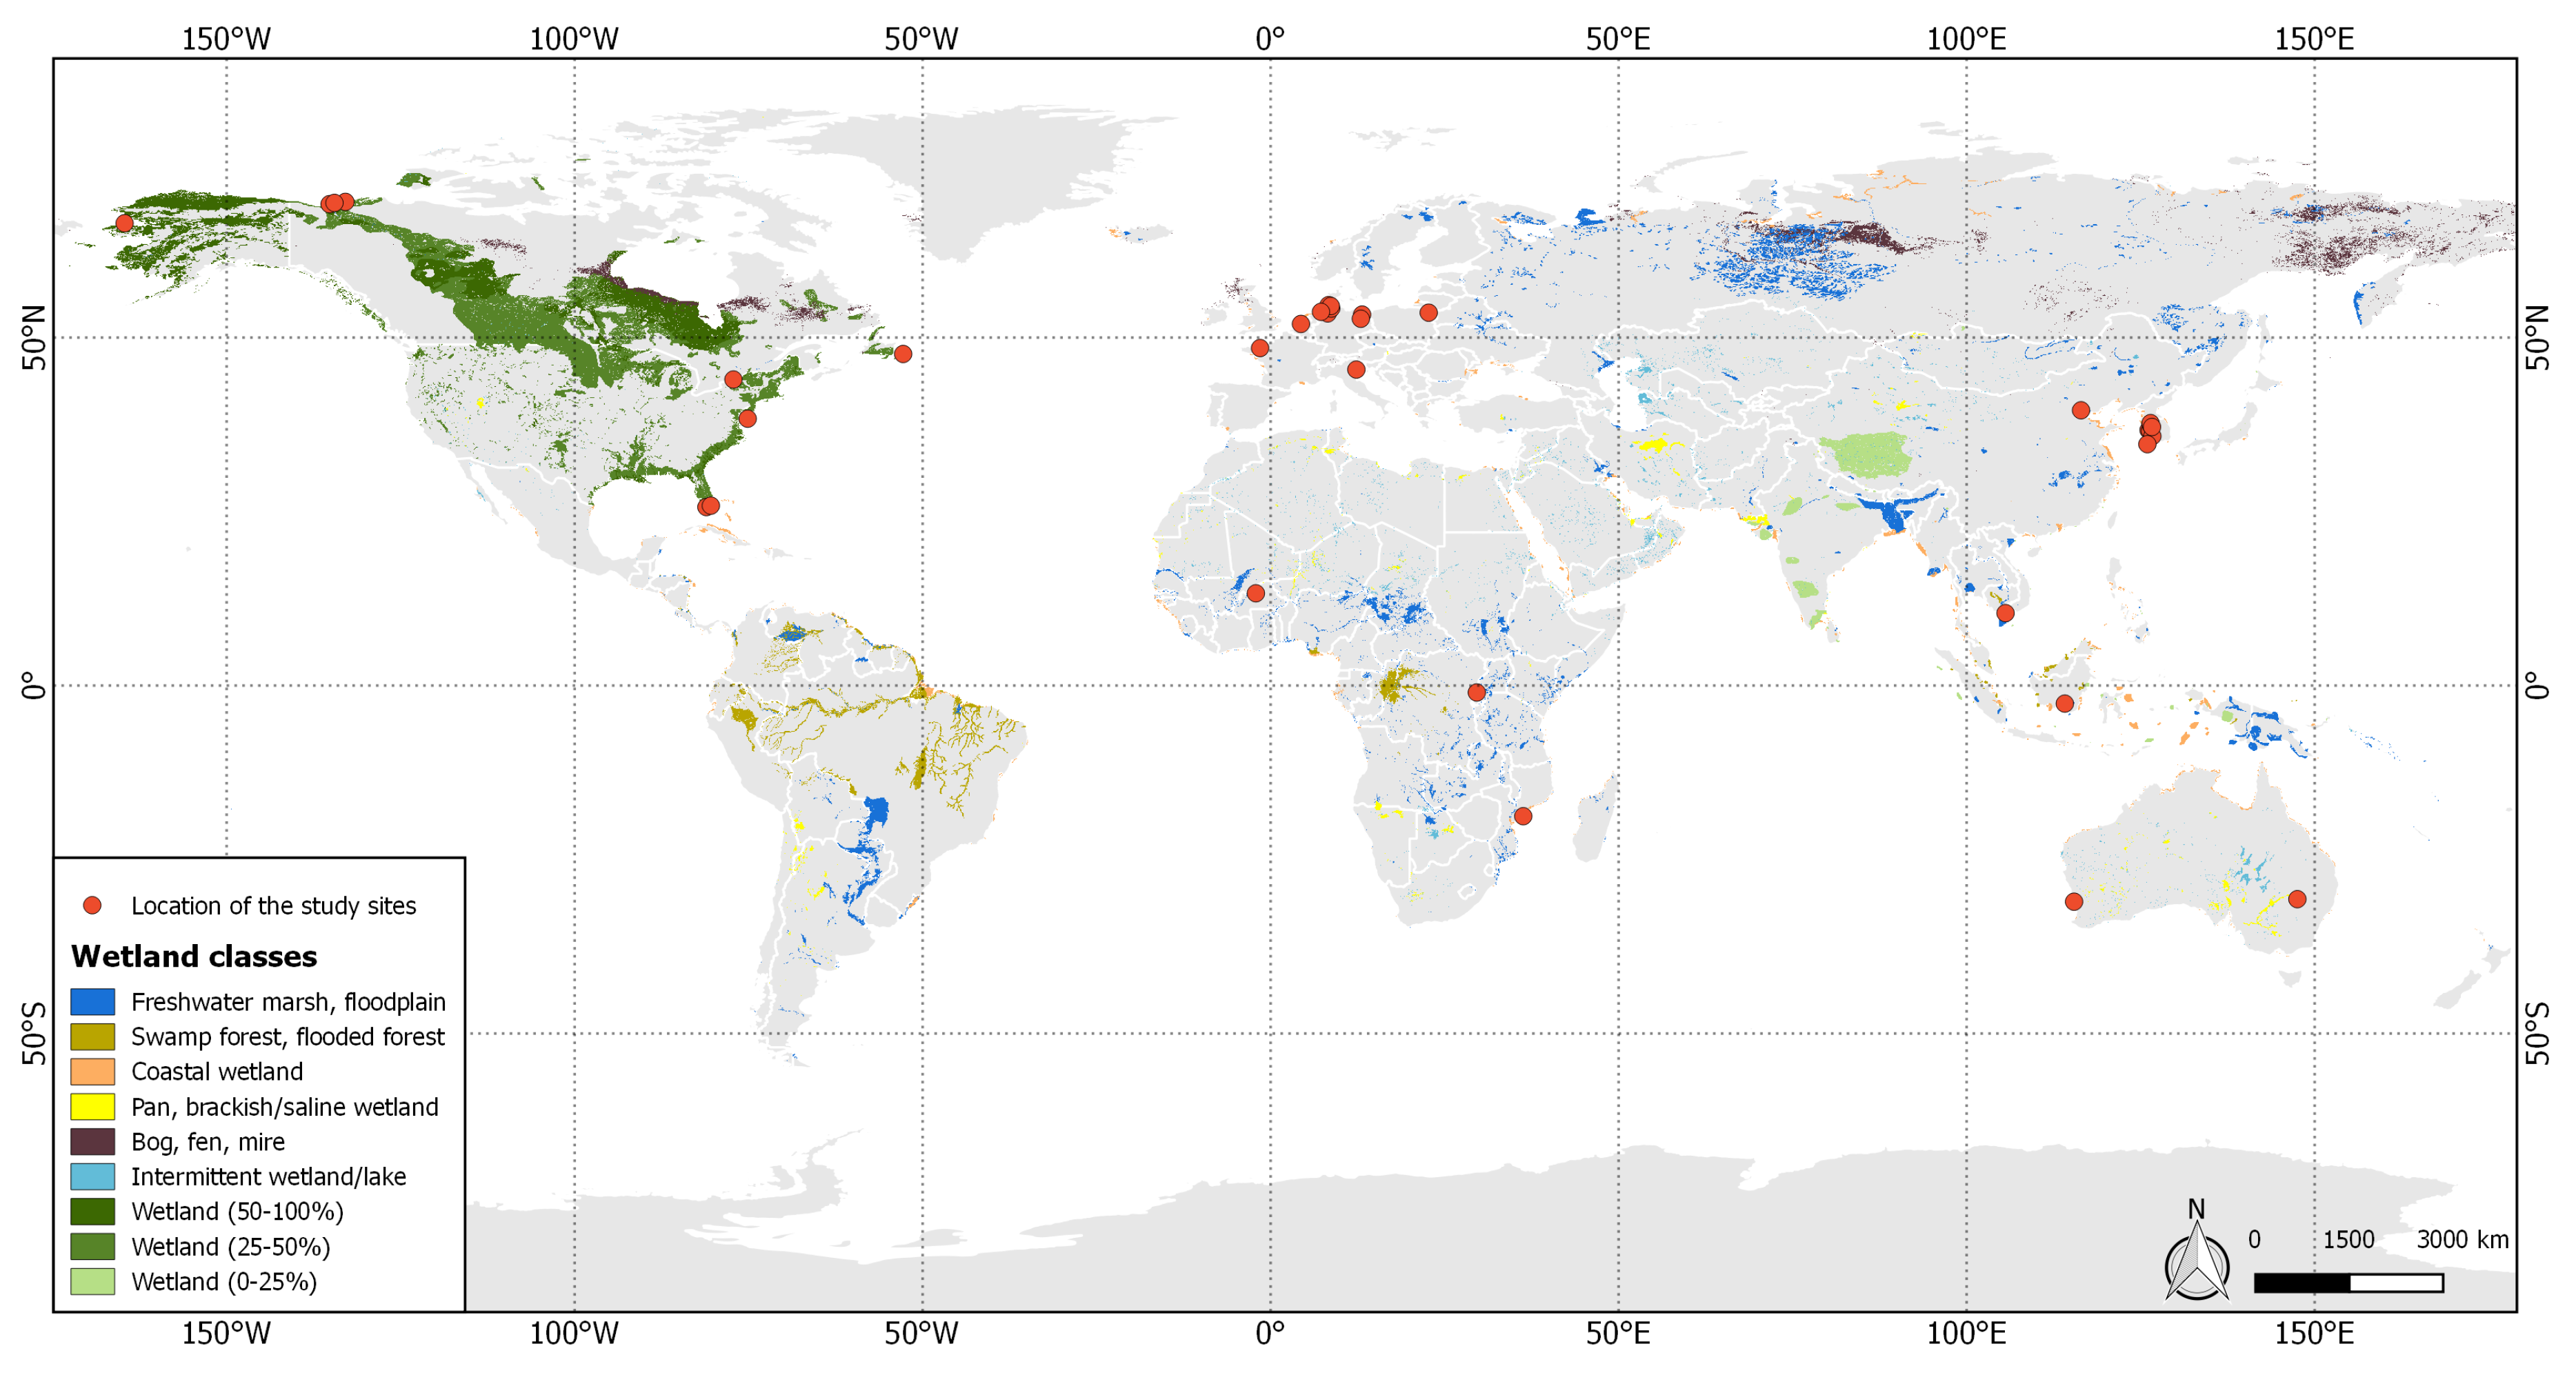
3. Data and Methodology
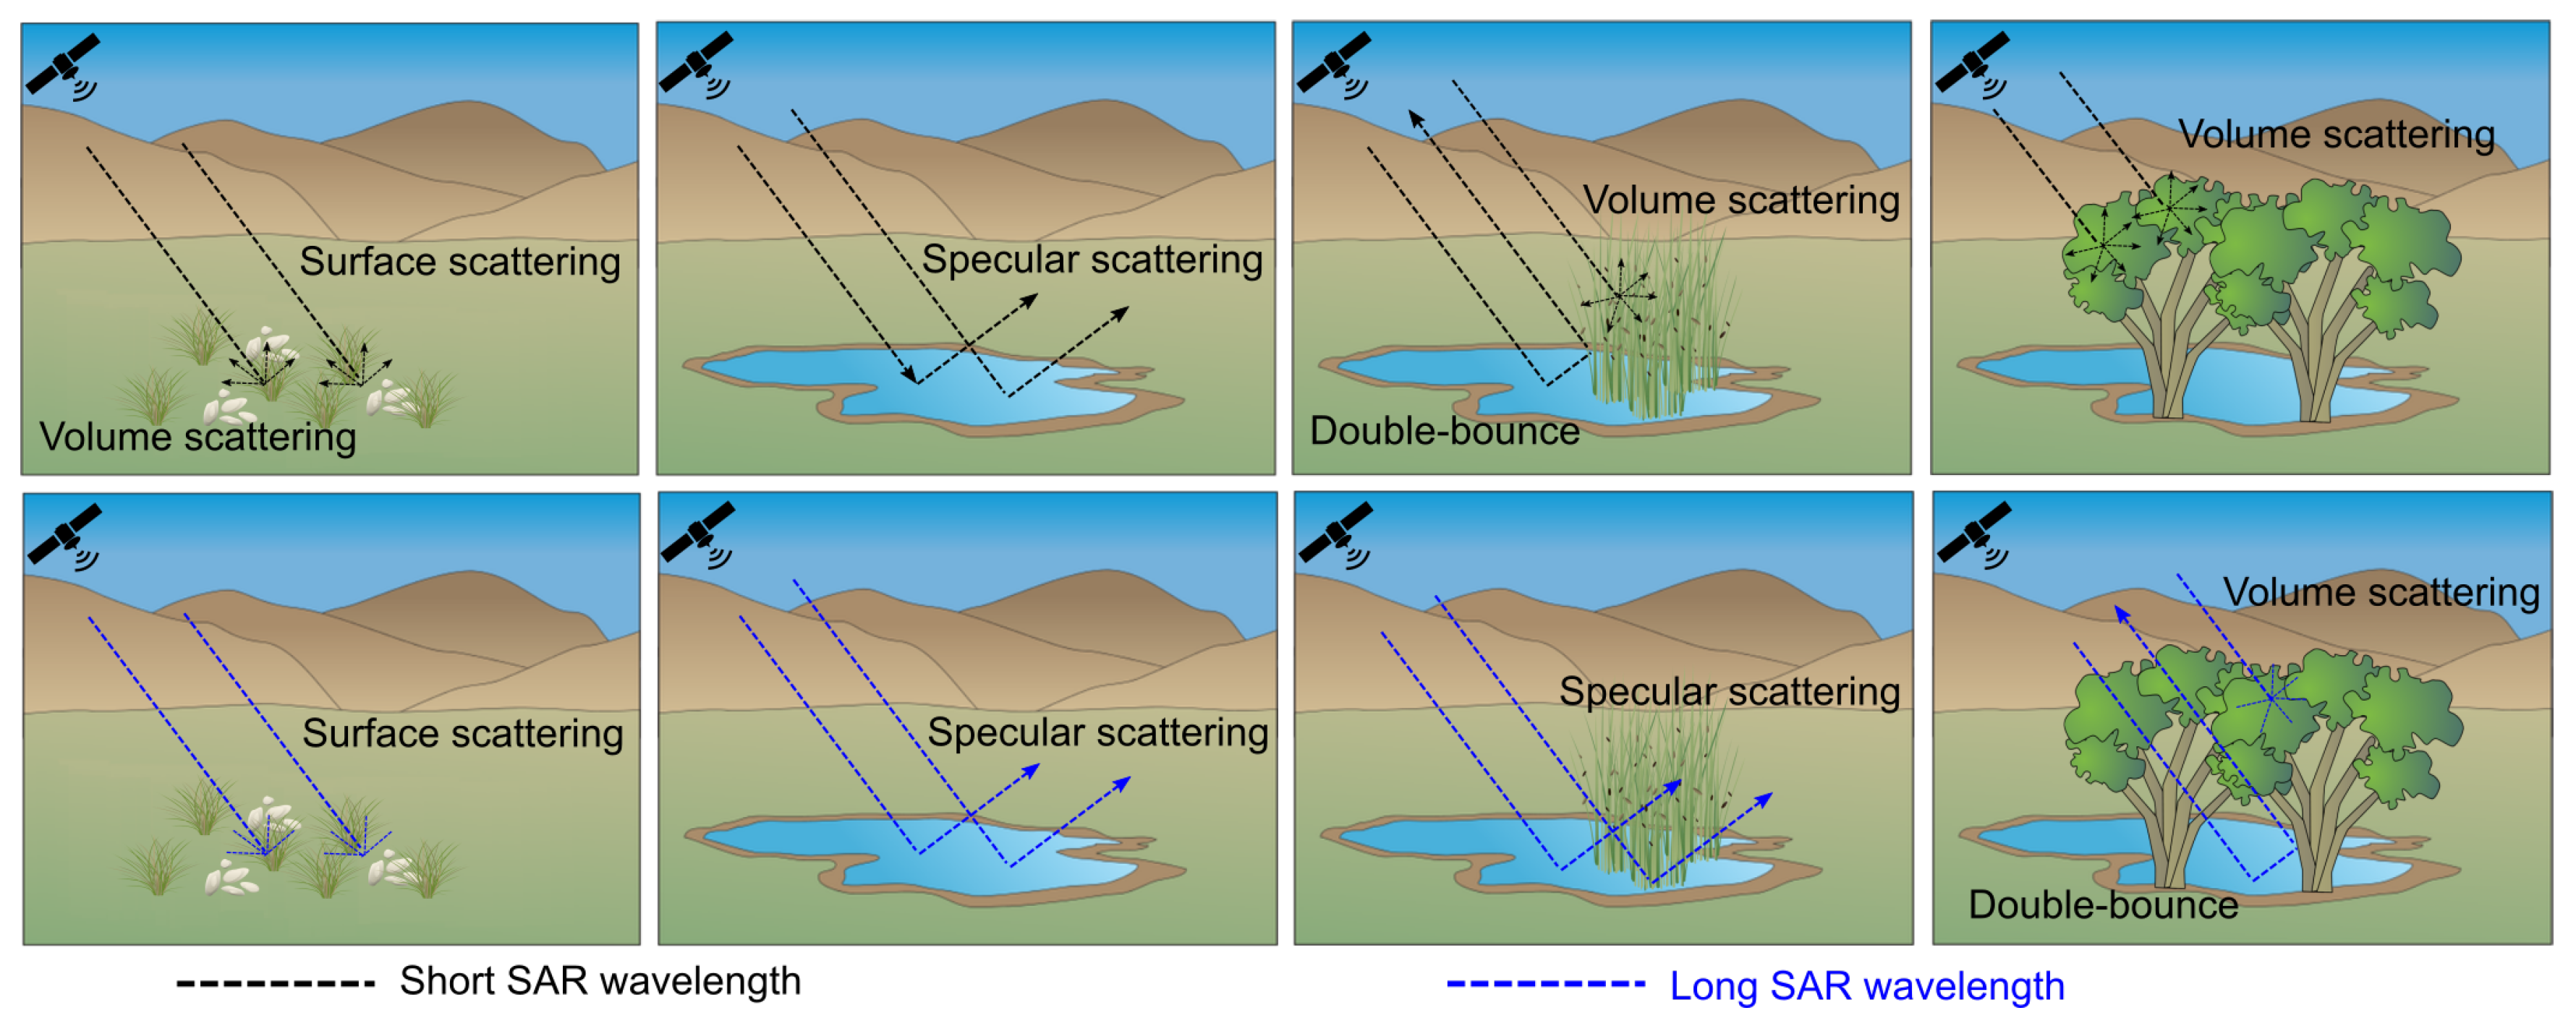
4. SAR Principles for Mapping Wetland Characteristics
- surface scattering (rough surface reflects transmitted radiation in all directions)
- specular scattering (smooth surface reflects radiation away from the sensor)
- volume scattering (radiation is both reflected and refracted/transmitted in an object or volume)
- double-bounce scattering (radiation is reflected on two perpendicular planes)
5. TerraSAR-X and Wetlands
5.1. How Has TerraSAR-X Been Used in Wetland Studies?
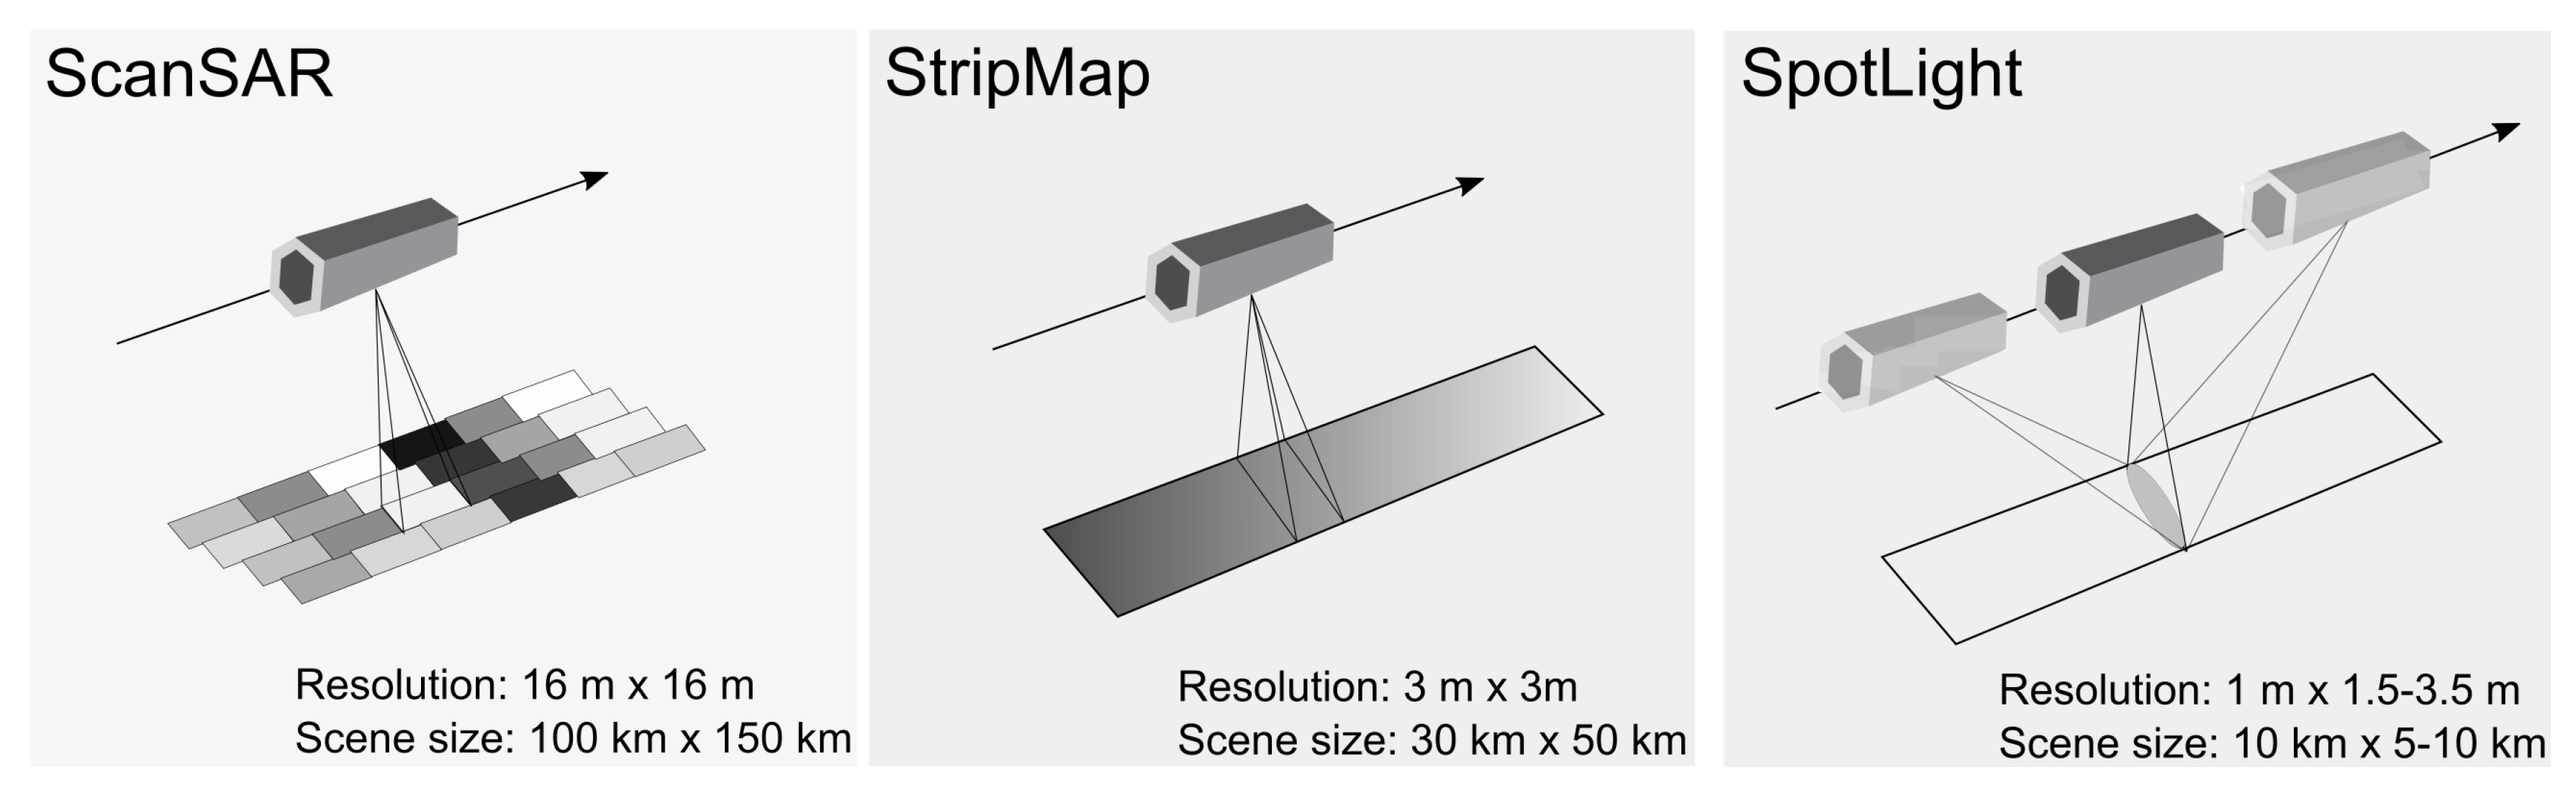
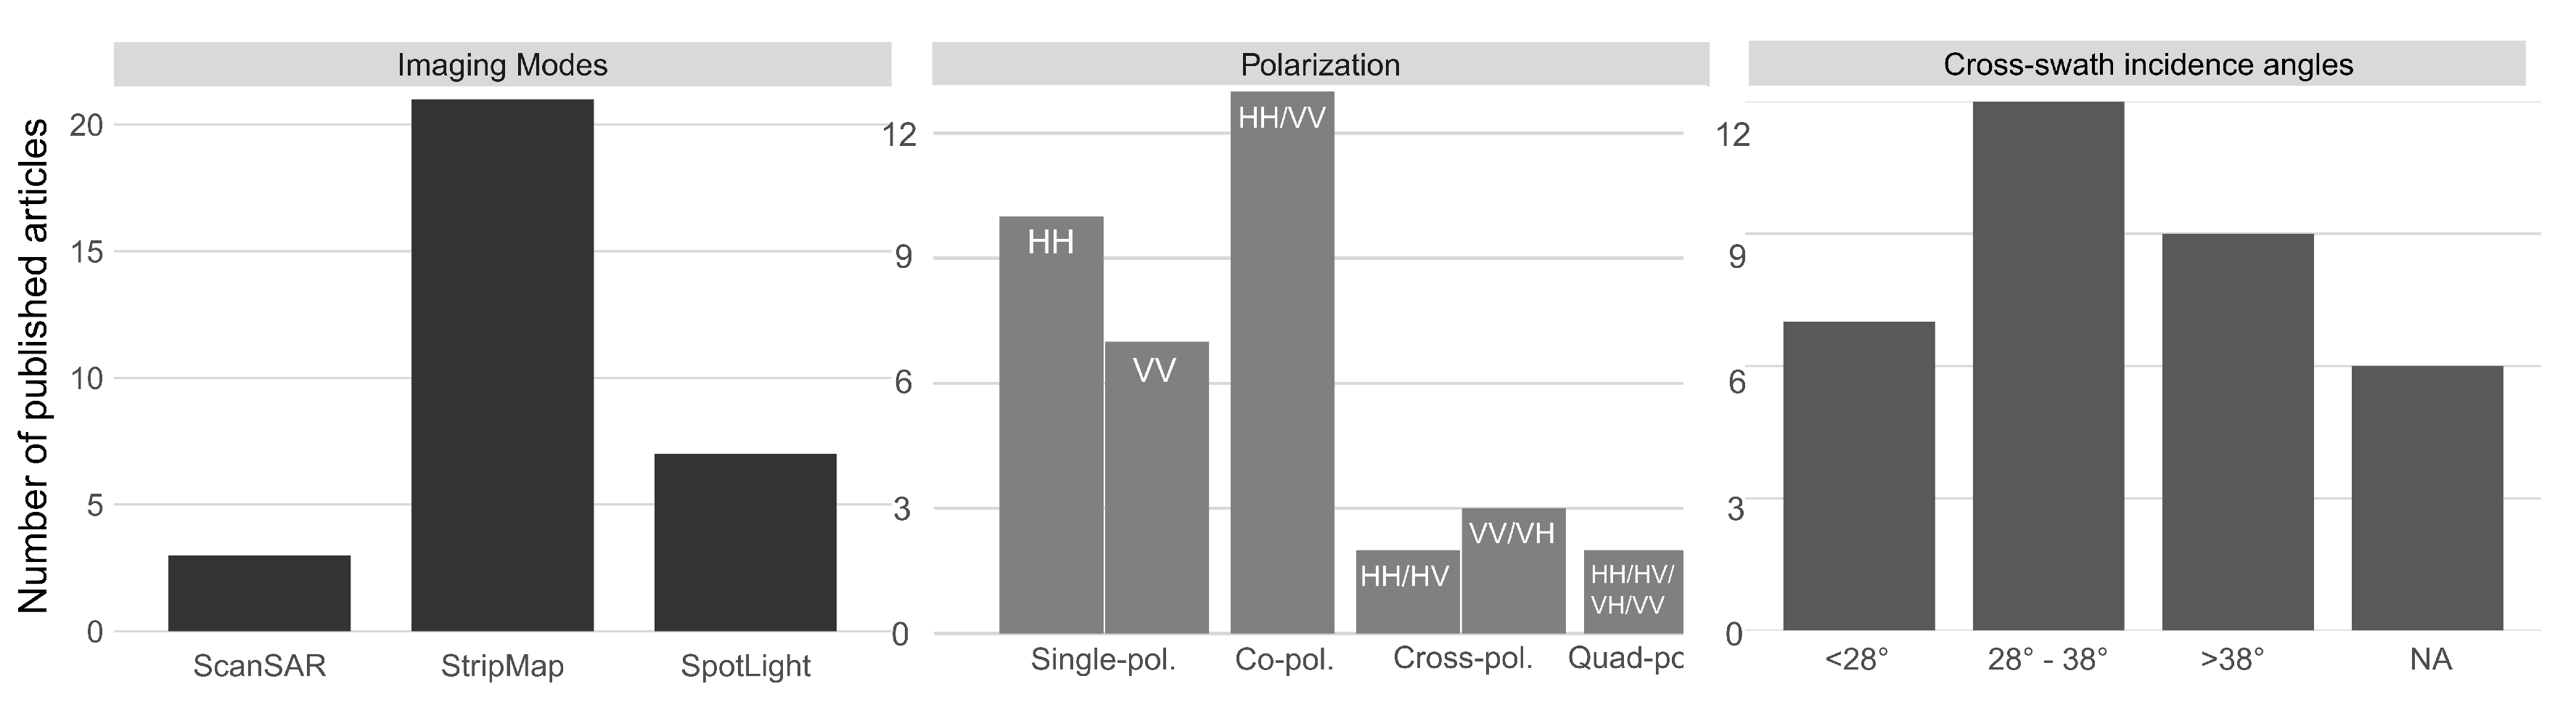
5.1.1. Sensor Specifications
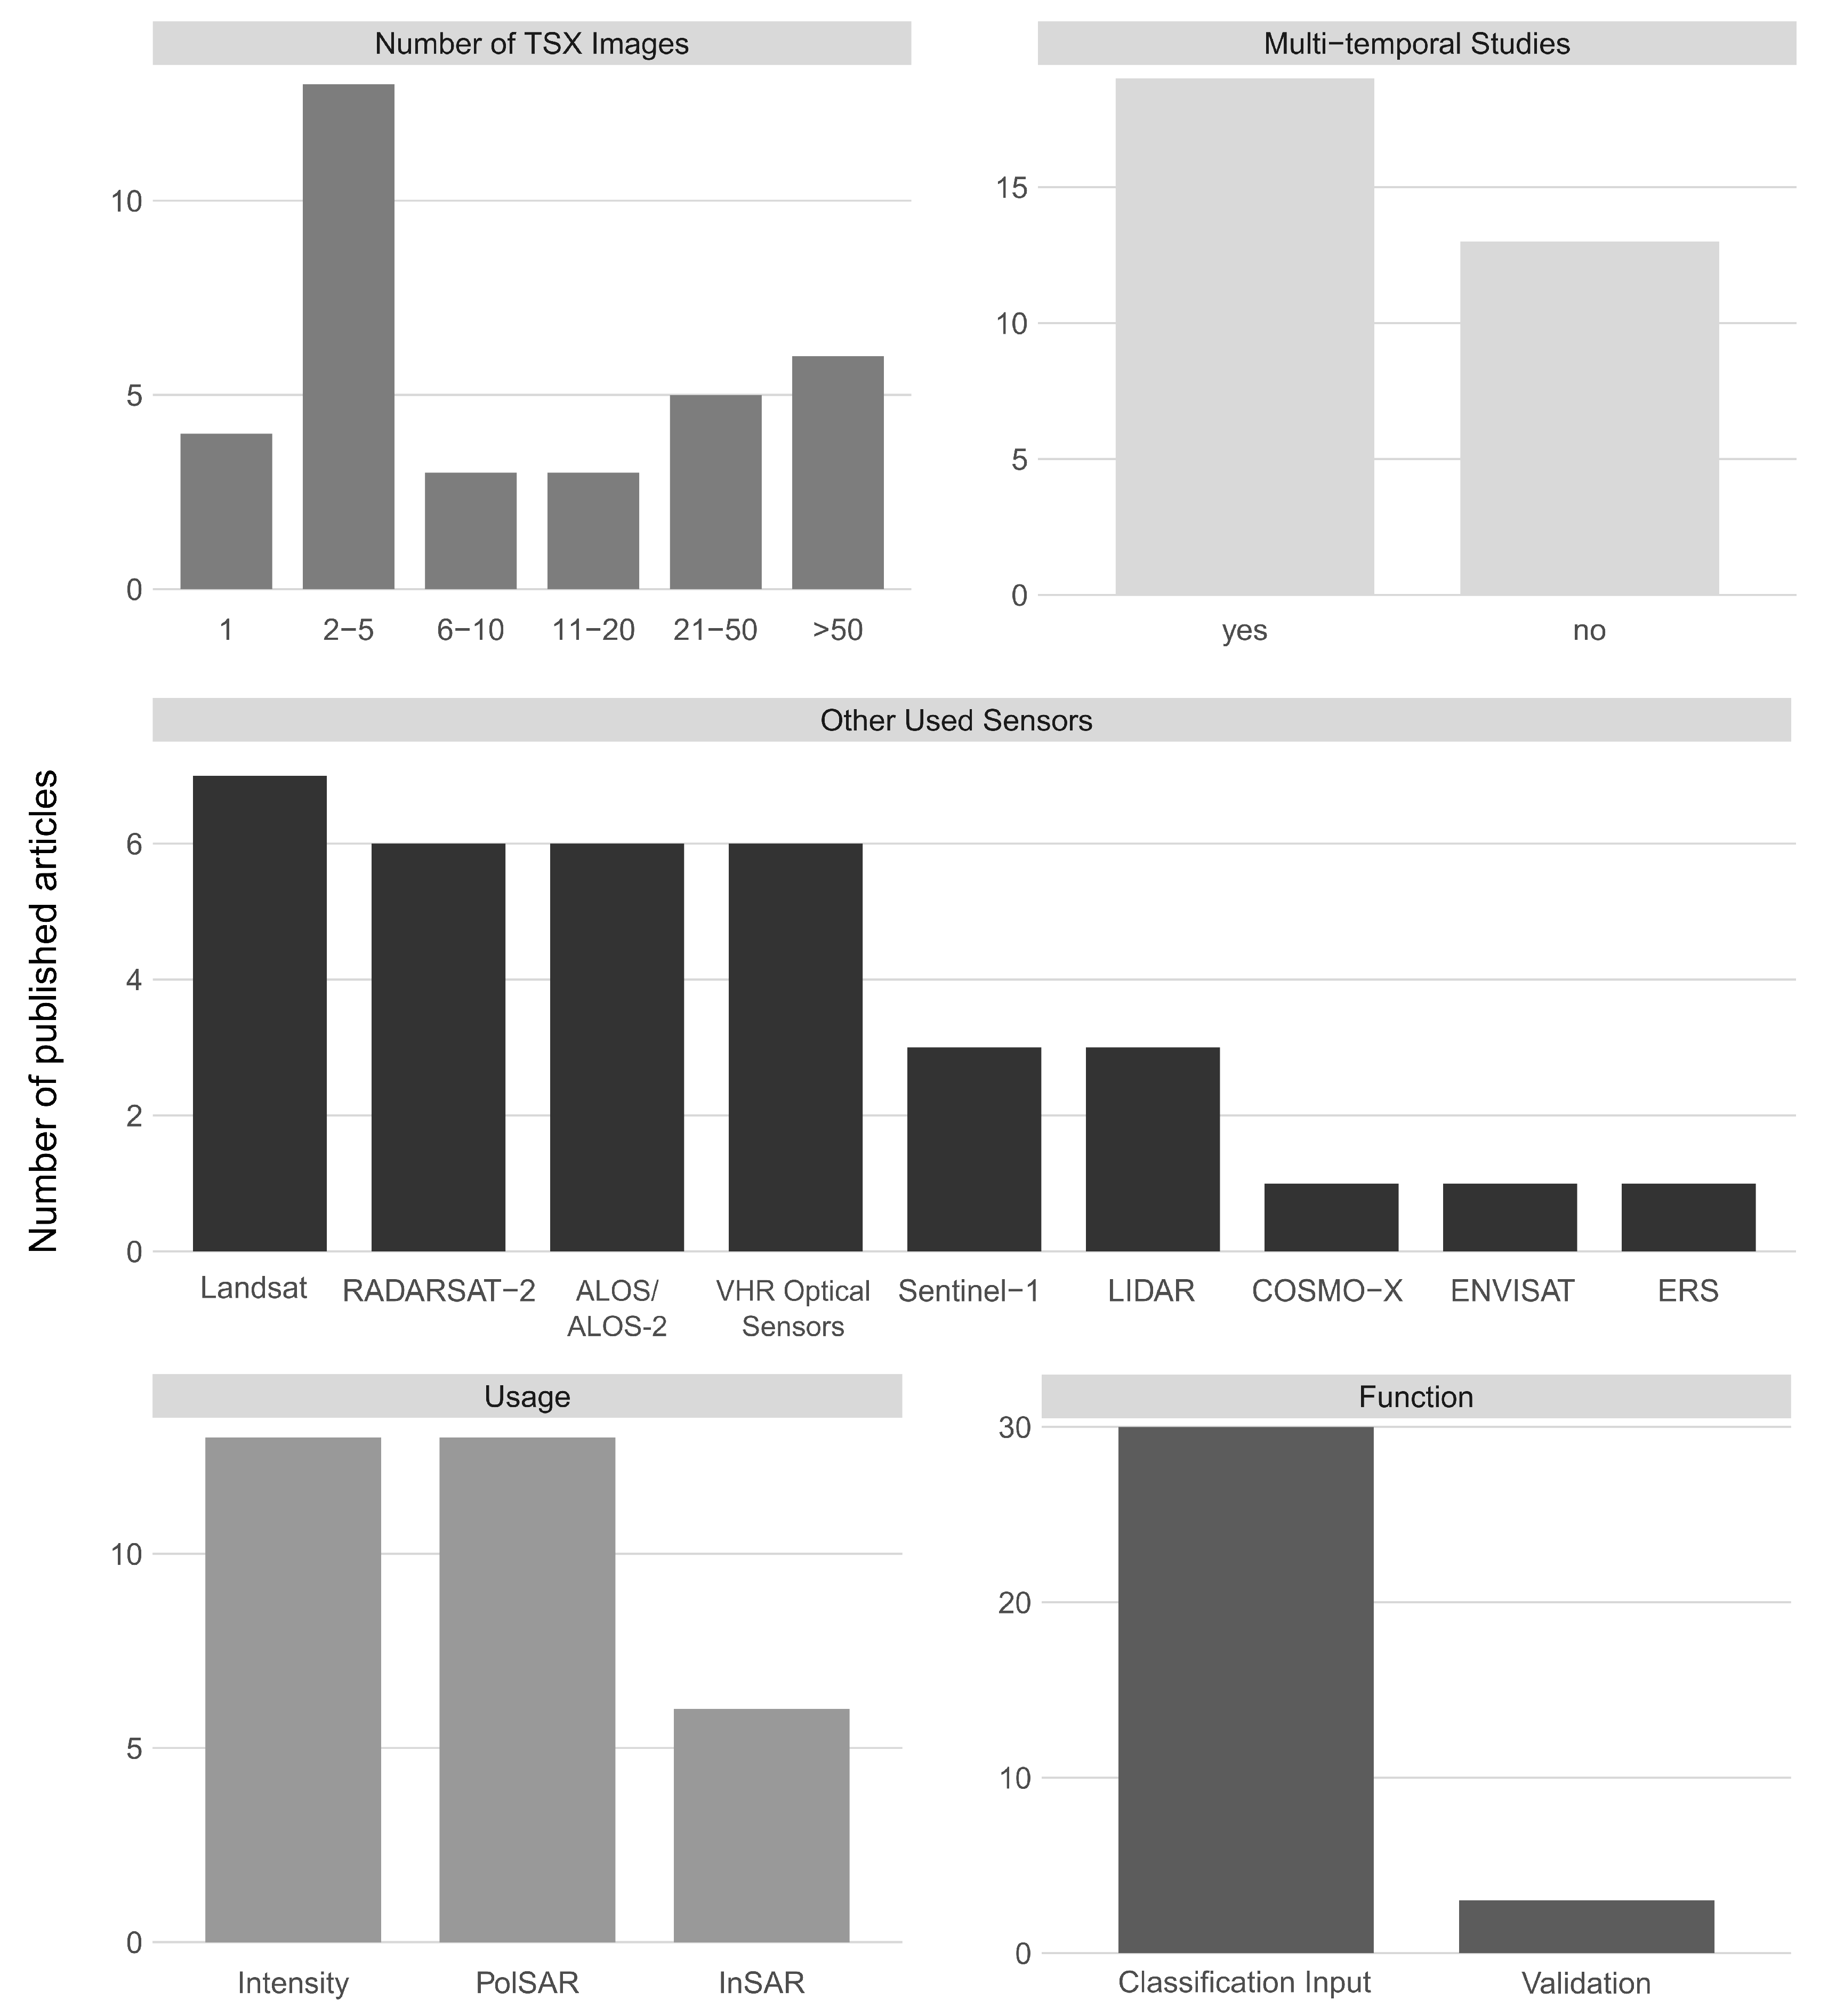
5.1.2. Usage of TerraSAR-X Data
5.2. Delineation and Characterization of Various Wetland Types
5.2.1. Palustrine Wetlands
5.2.2. Lacustrine Wetlands
5.2.3. Riverine Wetlands
5.2.4. Estuarine Wetlands
5.2.5. Marine Wetlands
6. Conclusions
Author Contributions
Funding
Acknowledgments
Conflicts of Interest
Appendix A

| Study (Year Published) | Study Area (Country) | Wetland Type | Research Objectives |
|---|---|---|---|
| Da Lio et al. (2018) [44] | Venice Laggon (Italy) | marine, estuarine | land subsidence |
| Gade et al. (2018) [39] | Wadden Sea (Germany) | marine | monitoring tidal flats |
| Mleczko et al. (2018) [71] | Biebrza Valley (Poland) | riverine | wetland classification |
| Irwin et al. (2018) [53] | Ontario (Canada) | lacustrine | wetland classification |
| Mahdianpari et al. (2017) [49] | Avalon Peninsula (Canada) | palustrine | wetland classification |
| Parker et al. (2017) [54] | Perth Basin (Australia) | lacustrine | land subsidence |
| Ullmann et al. (2017) [73] | Tuktoyaktuk Peninsula (Canada) | lacustrine | tundra classification |
| Zhou et al. (2017) [87] | Eastern Beijing Plain (China) | palustrine | land subsidence |
| Dabrowska-Zielinska et al. (2016) [64] | Biebrza Valley (Poland) | palustrine, riverine | carbon fluxes |
| Gade et al. (2016) [40] | North Sea (Germany) | marine | detection of bivalve beds |
| Heine et al. (2016) [70] | Lake Fürstenseer (Germany) | lacustrine | reed classification |
| Lagomasino et al. (2016) [47] | Zambezi River Shed (Mozambique) | estuarine | mangrove height classification |
| Moser et al. (2016) [68] | Lac Bam (Burkina Faso) | lacustrine | wetland classification |
| Ullmann et al. (2016) [73] | Mackenzie Delta (Canada) | esturine | wetland classification |
| Rangoonwala et al. (2016) [86] | New Yersey Bay (USA) | marine, esturine | coastal wetland classification |
| Betbeder et al. (2015) [80] | Mont-Saint-Michel (France) | riverine | wetland classification |
| Jung et al. (2015) [42] | Norderney (Germany) | marine | tidal flats classification |
| Mitchell et al. (2015) [67] | Macqarie Marshes (Australia) | riverine | wetland classification |
| Hong et al. (2015) [46] | Florida Everglades (USA) | estuarine | wetland classification |
| Morishita et al. (2015) [48] | Delft (Netherlands) | palustrine | peatland classification |
| Schuster et al. (2015) [76] | Döberitzer Heide (Germany) | palustrine | wetland classification |
| Otukei et al. (2015) [76] | Bwindi (Uganda) | palustrine | wetland classification |
| Ullmann et al. (2014) [85] | Richard Island (Canada) | marine, estuarine | wetland classification |
| Betbeder et al. (2014) [31] | Mont-Saint-Michel (France) | riverine | wetland classification |
| Gade et al. (2014) [38] | North Sea (Germany) | marine | intertidal flats classification |
| Zalite et al. (2014) [81] | Soomaa National Park (Estonia) | riverine | wetland characterization |
| Lee et al. (2012) [84] | Ganghwa (Korea) | marine, estuarine | tidal flats classification |
| Regmi et al. (2012) [50] | Seward Peninsula (USA) | lacustrine | peat age classification |
| Kim et al. (2011) [41] | Namyang Bay (Korea) | marine | tidal flats classification |
| Englhart et al. (2011) [52] | River Sebangau (Borneo) | riverine | swamp forest classification |
| Hong et al. (2010) [45] | Everglades (USA) | riverine | mangrove classification |
| Wijaya et al. (2010) [51] | Southern Kalimantan (Borneo) | riverine | swamp forest classification |
References
- Costanza, R.; d’Arge, R.; de Groot, R.; Farber, S.; Grasso, M.; Hannon, B.; Limburg, K.; Naeem, S.; O’Neill, R.V.; Paruelo, J.; et al. The value of the world’s ecosystem services and natural capital. Nature 1997, 387, 253. [Google Scholar] [CrossRef]
- Assessment, Millennium Ecosystem. Ecosystems and Human Well-Being: General Synthesis; Island Press: Washington, DC, USA, 2005. [Google Scholar]
- Mitsch, W.J.; Bernal, B.; Hernandez, M.E. Ecosystem services of wetlands. Int. J. Biodivers. Sci. Ecosyst. Serv. Manag. 2015, 11, 1–4. [Google Scholar] [CrossRef]
- Sharma, B.; Rasul, G.; Chettri, N. The economic value of wetland ecosystem services: Evidence from the Koshi Tappu Wildlife Reserve, Nepal. Ecosyst. Serv. 2015, 12, 84–93. [Google Scholar] [CrossRef]
- Dodds, W.K.; Wilson, K.C.; Rehmeier, R.L.; Knight, G.L.; Wiggam, S.; Falke, J.A.; Dalgleish, H.J.; Bertrand, K.N. Comparing ecosystem goods and services provided by restored and native lands. BioScience 2008, 58, 837–845. [Google Scholar] [CrossRef]
- Erwin, K.L. Wetlands and global climate change: The role of wetland restoration in a changing world. Wetl. Ecol. Manag. 2008, 17, 71. [Google Scholar] [CrossRef]
- Shepard, C.C.; Crain, C.M.; Beck, M.W. The protective role of coastal marshes: A systematic review and meta-analysis. PLoS ONE 2011, 6, e27374. [Google Scholar] [CrossRef] [PubMed]
- IPCC. Summary for Policymakers. In Climate Change 2013: The Physical Science Basis. Contribution of Working Group I to the Fifth Assessment Report of the Intergovernmental Panel on Climate Change; Stocker, T., Qin, D., Plattner, G.K., Tignor, M., Allen, S., Boschung, J., Nauels, A., Xia, Y., Bex, V., Midgley, P., Eds.; Book Section SPM; Cambridge University Press: Cambridge, UK; New York, NY, USA, 2013; pp. 1–30. [Google Scholar]
- Mitsch, W.J.; Bernal, B.; Nahlik, A.M.; Mander, Ü.; Zhang, L.; Anderson, C.J.; Jørgensen, S.E.; Brix, H. Wetlands, carbon, and climate change. Landsc. Ecol. 2013, 28, 583–597. [Google Scholar] [CrossRef]
- Hu, S.; Niu, Z.; Chen, Y.; Li, L.; Zhang, H. Global wetlands: Potential distribution, wetland loss, and status. Sci. Total Environ. 2017, 586, 319–327. [Google Scholar] [CrossRef] [PubMed]
- Davidson, N.C. How much wetland has the world lost? Long-term and recent trends in global wetland area. Mar. Freshw. Res. 2014, 65, 934–941. [Google Scholar] [CrossRef]
- Foley, J.A.; DeFries, R.; Asner, G.P.; Barford, C.; Bonan, G.; Carpenter, S.R.; Chapin, F.S.; Coe, M.T.; Daily, G.C.; Gibbs, H.K.; et al. Global consequences of land use. Science 2005, 309, 570–574. [Google Scholar] [CrossRef] [PubMed]
- Nagendra, H.; Lucas, R.; Honrado, J.P.; Jongman, R.H.G.; Tarantino, C.; Adamo, M.; Mairota, P. Remote sensing for conservation monitoring: Assessing protected areas, habitat extent, habitat condition, species diversity, and threats. Ecol. Indic. 2013, 33, 45–59. [Google Scholar] [CrossRef]
- Kuenzer, C.; Ottinger, M.; Wegmann, M.; Guo, H.; Wang, C.; Zhang, J.; Dech, S.; Wikelski, M. Earth observation satellite sensors for biodiversity monitoring: Potentials and bottlenecks. Int. J. Remote Sens. 2014, 35, 6599–6647. [Google Scholar] [CrossRef]
- Hess, L.L.; Melack, J.M.; Novo, E.M.; Barbosa, C.C.; Gastil, M. Dual-season mapping of wetland inundation and vegetation for the central Amazon basin. Remote Sens. Environ. 2003, 87, 404–428. [Google Scholar] [CrossRef]
- Schmidt, K.; Skidmore, A. Spectral discrimination of vegetation types in a coastal wetland. Remote Sens. Environ. 2003, 85, 92–108. [Google Scholar] [CrossRef]
- Henderson, F.M.; Lewis, A.J. Radar detection of wetland ecosystems: A review. Int. J. Remote Sens. 2008, 29, 5809–5835. [Google Scholar] [CrossRef]
- Petus, C.; Lewis, M.; White, D. Monitoring temporal dynamics of Great Artesian Basin wetland vegetation, Australia, using MODIS NDVI. Ecol. Indic. 2013, 34, 41–52. [Google Scholar] [CrossRef]
- Wohlfart, C.; Liu, G.; Huang, C.; Kuenzer, C. A river basin over the course of time: Multi-temporal analyses of land surface dynamics in the Yellow River Basin (China) based on medium resolution remote sensing data. Remote Sens. 2016, 8, 186. [Google Scholar] [CrossRef]
- Klein, I.; Gessner, U.; Dietz, A.J.; Kuenzer, C. Global WaterPack—A 250 m resolution dataset revealing the daily dynamics of global inland water bodies. Remote Sens. Environ. 2017, 198, 345–362. [Google Scholar] [CrossRef]
- Martinis, S.; Kuenzer, C.; Wendleder, A.; Huth, J.; Twele, A.; Roth, A.; Dech, S. Comparing four operational SAR-based water and flood detection approaches. Int. J. Remote Sens. 2015, 36, 3519–3543. [Google Scholar] [CrossRef]
- White, L.; Brisco, B.; Dabboor, M.; Schmitt, A.; Pratt, A. A collection of SAR methodologies for monitoring wetlands. Remote Sens. 2015, 7, 7615–7645. [Google Scholar] [CrossRef]
- Smith, L.C. Satellite remote sensing of river inundation area, stage, and discharge: A review. Hydrol. Process. 1997, 11, 1427–1439. [Google Scholar] [CrossRef]
- Hess, L.L.; Melack, J.M.; Simonett, D.S. Radar detection of flooding beneath the forest canopy: A review. Int. J. Remote Sens. 1990, 11, 1313–1325. [Google Scholar] [CrossRef]
- Schmullius, C.; Evans, D. Review article Synthetic aperture radar (SAR) frequency and polarization requirements for applications in ecology, geology, hydrology, and oceanography: A tabular status quo after SIR-C/X-SAR. Int. J. Remote Sens. 1997, 18, 2713–2722. [Google Scholar] [CrossRef]
- Kuenzer, C.; Bluemel, A.; Gebhardt, S.; Quoc, T.V.; Dech, S. Remote sensing of mangrove ecosystems: A review. Remote Sens. 2011, 3, 878–928. [Google Scholar] [CrossRef]
- Kuenzer, C.; Knauer, K. Remote sensing of rice crop areas. Int. J. Remote Sens. 2013, 34, 2101–2139. [Google Scholar] [CrossRef]
- Guo, M.; Li, J.; Sheng, C.; Xu, J.; Wu, L. A review of wetland remote sensing. Sensors 2017, 17, 777. [Google Scholar] [CrossRef] [PubMed]
- Moreira, A.; Prats-Iraola, P.; Younis, M.; Krieger, G.; Hajnsek, I.; Papathanassiou, K.P. A tutorial on synthetic aperture radar. IEEE Geosci. Remote Sens. Mag. 2013, 1, 6–43. [Google Scholar] [CrossRef]
- Ryu, J.H.; Choi, J.K.; Lee, Y.K. Potential of remote sensing in management of tidal flats: A case study of thematic mapping in the Korean tidal flats. Ocean Coast. Manag. 2014, 102, 458–470. [Google Scholar] [CrossRef]
- Betbeder, J.; Rapinel, S.; Corpetti, T.; Pottier, E.; Corgne, S.; Hubert-Moy, L. Multitemporal classification of TerraSAR-X data for wetland vegetation mapping. J. Appl. Remote Sens. 2014, 8, 083648. [Google Scholar] [CrossRef]
- Mitsch, W.; Gosselink, J. Wetlands, 4th ed.; Wiley: Hoboken, NJ, USA, 2007. [Google Scholar]
- Keddy, P.A. Wetland Ecology: Principles and Conservation; Cambridge University Press: Cambridge, UK, 2010. [Google Scholar]
- Tiner, R.W. Wetlands. An Overview. In Remote Sensing of Wetlands: Applications and Advances; CRC Press: Boca Raton, FL, USA, 2015; pp. 1–18. [Google Scholar]
- Ramsar, Iran. Convention on wetlands of international importance, especially as waterfowl habitat. Ramsar (Iran) 1971, 1–3. [Google Scholar]
- Frazier, S.; International, W. An Overview of the World’s Ramsar Sites; Wetlands International: Wageningen, The Netherlands, 1996. [Google Scholar]
- Ramsar, Iran, 1971. Recommendation 4.7: Mechanisms for improved application of the Ramsar Convention. In Proceedings of the Meeting of the Conference of the Contracting Parties, Montreux, Switzerland, 27 June–4 July 1990; Volume 4. [Google Scholar]
- Gade, M.; Melchionna, S.; Stelzer, K.; Kohlus, J. Multi-frequency SAR data help improving the monitoring of intertidal flats on the German North Sea coast. Estuar. Coast. Shelf Sci. 2014, 140, 32–42. [Google Scholar] [CrossRef]
- Gade, M.; Wang, W.; Kemme, L. On the imaging of exposed intertidal flats by single-and dual-co-polarization Synthetic Aperture Radar. Remote Sens. Environ. 2018, 205, 315–328. [Google Scholar] [CrossRef]
- Gade, M.; Melchionna, S. Joint use of multiple Synthetic Aperture Radar imagery for the detection of bivalve beds and morphological changes on intertidal flats. Estuar. Coast. Shelf Sci. 2016, 171, 1–10. [Google Scholar] [CrossRef]
- Kim, D.J.; Moon, W.M.; Kim, G.; Park, S.E.; Lee, H. Submarine groundwater discharge in tidal flats revealed by space-borne synthetic aperture radar. Remote Sens. Environ. 2011, 115, 793–800. [Google Scholar] [CrossRef]
- Jung, R.; Adolph, W.; Ehlers, M.; Farke, H. A multi-sensor approach for detecting the different land covers of tidal flats in the German Wadden Sea—A case study at Norderney. Remote Sens. Environ. 2015, 170, 188–202. [Google Scholar] [CrossRef]
- Lee, Y.K.; Park, W.; Choi, J.K.; Ryu, J.H.; Won, J.S. Assessment of TerraSAR-X for mapping salt marsh. In Proceedings of the Geoscience and Remote Sensing Symposium (IGARSS), Vancouver, BC, Canada, 24–29 July 2011; pp. 2330–2333. [Google Scholar]
- Da Lio, C.; Teatini, P.; Strozzi, T.; Tosi, L. Understanding land subsidence in salt marshes of the Venice Lagoon from SAR Interferometry and ground-based investigations. Remote Sens. Environ. 2018, 205, 56–70. [Google Scholar] [CrossRef]
- Hong, S.H.; Wdowinski, S.; Kim, S.W. Evaluation of TerraSAR-X observations for wetland InSAR application. IEEE Trans. Geosci. Remote Sens. 2010, 48, 864–873. [Google Scholar] [CrossRef]
- Hong, S.H.; Kim, H.O.; Wdowinski, S.; Feliciano, E. Evaluation of polarimetric SAR decomposition for classifying wetland vegetation types. Remote Sens. 2015, 7, 8563–8585. [Google Scholar] [CrossRef]
- Lagomasino, D.; Fatoyinbo, T.; Lee, S.; Feliciano, E.; Trettin, C.; Simard, M. A comparison of mangrove canopy height using multiple independent measurements from land, air, and space. Remote Sens. 2016, 8, 327. [Google Scholar] [CrossRef] [PubMed]
- Morishita, Y.; Hanssen, R.F. Temporal decorrelation in L-, C-, and X-band satellite radar interferometry for pasture on drained peat soils. IEEE Trans. Geosci. Remote Sens. 2015, 53, 1096–1104. [Google Scholar] [CrossRef]
- Mahdianpari, M.; Salehi, B.; Mohammadimanesh, F.; Motagh, M. Random forest wetland classification using ALOS-2 L-band, RADARSAT-2 C-band, and TerraSAR-X imagery. ISPRS J. Photogramm. Remote Sens. 2017, 130, 13–31. [Google Scholar] [CrossRef]
- Regmi, P.; Grosse, G.; Jones, M.C.; Jones, B.M.; Anthony, K.W. Characterizing post-drainage succession in thermokarst lake basins on the Seward Peninsula, Alaska with TerraSAR-X backscatter and Landsat-based NDVI data. Remote Sens. 2012, 4, 3741–3765. [Google Scholar] [CrossRef]
- Wijaya, A.; Reddy Marpu, P.; Gloaguen, R. Discrimination of peatlands in tropical swamp forests using dual-polarimetric SAR and Landsat ETM data. Int. J. Image Data Fusion 2010, 1, 257–270. [Google Scholar] [CrossRef]
- Englhart, S.; Keuck, V.; Siegert, F. Aboveground biomass retrieval in tropical forests—The potential of combined X-and L-band SAR data use. Remote Sens. Environ. 2011, 115, 1260–1271. [Google Scholar] [CrossRef]
- Irwin, K.; Beaulne, D.; Braun, A.; Fotopoulos, G. Fusion of SAR, optical imagery and airborne LiDAR for surface water detection. Remote Sens. 2017, 9, 890. [Google Scholar] [CrossRef]
- Parker, A.L.; Filmer, M.S.; Featherstone, W.E. First results from Sentinel-1A InSAR over Australia: Application to the Perth Basin. Remote Sens. 2017, 9, 299. [Google Scholar] [CrossRef]
- Scott, D.; Jones, T. Classification and inventory of wetlands: A global overview. Vegetatio 1995, 118, 3–16. [Google Scholar] [CrossRef]
- Ramsar Convention Secretariat. An introduction to the Convention on Wetlands (previously The Ramsar Convention Manual); CRC Press: Gland, Switzerland, 2016. [Google Scholar]
- Lehner, B.; Döll, P. Development and validation of a global database of lakes, reservoirs and wetlands. J. Hydrol. 2004, 296, 1–22. [Google Scholar] [CrossRef]
- Knight, J.F.; Corcoran, J.M.; Rampi, L.P.; Pelletier, K.C. Theory and applications of object-based image analysis and emerging methods in wetland mapping. In Remote Sensing of Wetlands: Applications and Advances; CRC Press: Boca Raton, FL, USA, 2015; pp. 175–194. [Google Scholar]
- Baghdadi, N.; Bernier, M.; Gauthier, R.; Neeson, I. Evaluation of C-band SAR data for wetlands mapping. Int. J. Remote Sens. 2001, 22, 71–88. [Google Scholar] [CrossRef]
- Töyrä, J.; Pietroniro, A. Towards operational monitoring of a northern wetland using geomatics-based techniques. Remote Sens. Environ. 2005, 97, 174–191. [Google Scholar] [CrossRef]
- Huang, S.; Potter, C.; Crabtree, R.L.; Hager, S.; Gross, P. Fusing optical and radar data to estimate sagebrush, herbaceous, and bare ground cover in Yellowstone. Remote Sens. Environ. 2010, 114, 251–264. [Google Scholar] [CrossRef]
- Werninghaus, R.; Buckreuss, S. The TerraSAR-X mission and system design. IEEE Trans. Geosci. Remote Sens. 2010, 48, 606–614. [Google Scholar] [CrossRef]
- Buckreuss, S.; Schattler, B. The TerraSAR-X ground segment. IEEE Trans. Geosci. Remote Sens. 2010, 48, 623–632. [Google Scholar] [CrossRef]
- Dabrowska-Zielinska, K.; Budzynska, M.; Tomaszewska, M.; Malinska, A.; Gatkowska, M.; Bartold, M.; Malek, I. Assessment of carbon flux and soil moisture in wetlands applying Sentinel-1 Data. Remote Sens. 2016, 8, 756. [Google Scholar] [CrossRef]
- Schmitt, A.; Wendleder, A.; Hinz, S. The Kennaugh element framework for multi-scale, multi-polarized, multi-temporal and multi-frequency SAR image preparation. ISPRS J. Photogramm. Remote Sens. 2015, 102, 122–139. [Google Scholar] [CrossRef]
- Brisco, B. Mapping and monitoring surface water and wetlands with synthetic aperture radar. In Remote Sensing of Wetlands: Applications and Advances; CRC Press: Boca Raton, FL, USA, 2015; pp. 119–136. [Google Scholar]
- Mitchell, A.; Milne, A.; Tapley, I. Towards an operational SAR monitoring system for monitoring environmental flows in the Macquarie Marshes. Wetl. Ecol. Manag. 2015, 23, 61–77. [Google Scholar] [CrossRef]
- Moser, L.; Schmitt, A.; Wendleder, A.; Roth, A. Monitoring of the Lac Bam wetland extent using dual-polarized X-band SAR data. Remote Sens. 2016, 8, 302. [Google Scholar] [CrossRef]
- Hajnsek, I.; Busche, T.; Krieger, G.; Zink, M.; Moreira, A. Announcement of Opportunity: TanDEM-X Science Phase; DLR Public Document TD-PD-PL-0032, Issue: 1.0, 19 May 2014; TanDEM-X Ground Segment, Microwaves and Radar Institute(DLR-HR): Wessling, Germany, 2014; pp. 1–27. [Google Scholar]
- Heine, I.; Jagdhuber, T.; Itzerott, S. Classification and monitoring of reed belts using dual-polarimetric TerraSAR-X time series. Remote Sens. 2016, 8, 552. [Google Scholar] [CrossRef]
- Mleczko, M.; Mróz, M. Wetland Mapping Using SAR Data from the Sentinel-1A and TanDEM-X Missions: A Comparative Study in the Biebrza Floodplain (Poland). Remote Sens. 2018, 10, 78. [Google Scholar] [CrossRef]
- Otukei, J.R.; Blaschke, T.; Collins, M. Fusion of TerraSAR-x and Landsat ETM+ data for protected area mapping in Uganda. Int. J. Appl. Earth Obs. Geoinform. 2015, 38, 99–104. [Google Scholar] [CrossRef]
- Ullmann, T.; Banks, S.N.; Schmitt, A.; Jagdhuber, T. Scattering characteristics of X-, C-and L-Band polsar data examined for the tundra environment of the Tuktoyaktuk Peninsula, Canada. Appl. Sci. 2017, 7, 595. [Google Scholar] [CrossRef]
- Wdowinski, S.; Amelung, F.; Kim, S.W.; Dixon, T. Wetland InSAR. In Remote Sensing of Wetlands: Applications and Advances; CRC Press: Boca Raton, FL, USA, 2015; p. 137. [Google Scholar]
- Hammerson, G. Connecticut Wildlife: Biodiversity, Natural History, and Conservation; University Press of New England: Lebanon, NH, USA, 2004. [Google Scholar]
- Schuster, C.; Schmidt, T.; Conrad, C.; Kleinschmit, B.; Förster, M. Grassland habitat mapping by intra-annual time series analysis–Comparison of RapidEye and TerraSAR-X satellite data. Int. J. Appl. Earth Obs. Geoinform. 2015, 34, 25–34. [Google Scholar] [CrossRef]
- Jones, M.C.; Grosse, G.; Jones, B.M.; Walter Anthony, K. Peat accumulation in drained thermokarst lake basins in continuous, ice-rich permafrost, northern Seward Peninsula, Alaska. J. Geophys. Res. Biogeosci. 2012, 117. [Google Scholar] [CrossRef]
- Cloude, S.R.; Pottier, E. An entropy based classification scheme for land applications of polarimetric SAR. IEEE Trans. Geosci. Remote Sens. 1997, 35, 68–78. [Google Scholar] [CrossRef]
- Cloude, S.R.; Pottier, E. A review of target decomposition theorems in radar polarimetry. IEEE Trans. Geosci. Remote Sens. 1996, 34, 498–518. [Google Scholar] [CrossRef]
- Betbeder, J.; Rapinel, S.; Corgne, S.; Pottier, E.; Hubert-Moy, L. TerraSAR-X dual-pol time-series for mapping of wetland vegetation. ISPRS J. Photogramm. Remote Sens. 2015, 107, 90–98. [Google Scholar] [CrossRef]
- Zalite, K.; Voormansik, K.; Olesk, A.; Noorma, M.; Reinart, A. Effects of inundated vegetation on X-band HH–VV backscatter and phase difference. IEEE J. Sel. Top. Appl. Earth Obs. Remote Sens. 2014, 7, 1402–1406. [Google Scholar] [CrossRef]
- Tiner, R.W. Classification of wetland types for mapping and large-scale inventories. In Remote Sensing of Wetlands: Applications and Advances; CRC Press: Boca Raton, FL, USA, 2015; pp. 19–42. [Google Scholar]
- Ullmann, T.; Schmitt, A.; Jagdhuber, T. Two component decomposition of dual polarimetric HH/VV SAR data: Case study for the tundra environment of the Mackenzie Delta region, Canada. Remote Sens. 2016, 8, 1027. [Google Scholar] [CrossRef]
- Lee, Y.K.; Park, J.W.; Choi, J.K.; Oh, Y.; Won, J.S. Potential uses of TerraSAR-X for mapping herbaceous halophytes over salt marsh and tidal flats. Estuar. Coast. Shelf Sci. 2012, 115, 366–376. [Google Scholar] [CrossRef]
- Ullmann, T.; Schmitt, A.; Roth, A.; Duffe, J.; Dech, S.; Hubberten, H.W.; Baumhauer, R. Land cover characterization and classification of arctic tundra environments by means of polarized synthetic aperture X-and C-Band Radar (PolSAR) and Landsat 8 multispectral imagery—Richards Island, Canada. Remote Sens. 2014, 6, 8565–8593. [Google Scholar] [CrossRef]
- Rangoonwala, A.; Enwright, N.M.; Ramsey III, E.; Spruce, J.P. Radar and optical mapping of surge persistence and marsh dieback along the New Jersey Mid-Atlantic coast after Hurricane Sandy. Int. J. Remote Sens. 2016, 37, 1692–1713. [Google Scholar] [CrossRef]
- Zhou, C.; Gong, H.; Chen, B.; Li, J.; Gao, M.; Zhu, F.; Chen, W.; Liang, Y. InSAR time-series analysis of land subsidence under different land use types in the Eastern Beijing Plain, China. Remote Sens. 2017, 9, 380. [Google Scholar] [CrossRef]


| Wetland Type | Characteristics | Functions | Selected Studies Using TerraSAR-X |
|---|---|---|---|
| Marine and Coastal Wetlands (Mostly Marine and Estuarine) | |||
| G: Intertidal (salt) flats | Non-vegetated shore with tidal flooding (salt restricting plant growth) | Shoreline stabilization; Nutrient and sediment retention; Vital habitats for clams, crabs, and juvenile fish | Gade et al. (2014 [38], 2018 [39]); Gade & Melchionna (2016) [40]; Kim et al. (2011) [41]; Jung et al. (2015) [42] |
| H: Intertidal (salt) marshes, freshwater marshes | Herb-dominated shores with tidal/long-term flooding during the year (often with halophytic plants) and hydric soils | Carbon sequestration; Nutrient and sediment retention; Water-quality renovation; Wildlife habitat | Lee et al. (2011) [43]; Da Lio et al. (2018) [44] |
| I: Intertidal forested wetlands (mangrove and tidal freshwater swamps) | Tree-dominated shores with tidal/long-term flooding during the year and hydric soils | Carbon sequestration; Valuable habitat for fish and crustacean species; Coastal protection; Water-quality renovation; Production of timber | Hong et al. (2010 [45], 2015 [46]); Lagomasino et al. (2016) [47] |
| Inland Wetlands (Lacustrine, Riverine, Palustrine) | |||
| Peatlands | Peat-forming soils | Carbon sequestration in the form of peat; Provision of substrate; Bird breeding and wildlife habitat | |
| U: Non-forested peatlands (bogs, swamps, fens) | Dominated by moss, sedges, and grasses | Morishita & Hansen (2015) [48]; Mahdianpari et al. (2017) [49]; Regmi et al. (2012) [50] | |
| Xp: Forested peatlands (peatswamp forest) | Tree-dominated | Wijaya et al. (2010) [51]; Englhart et al. (2011) [52]; | |
| Marshes and swamps | Inorganic soils | Carbon sequestration; Water-quality renovation; Bird breeding and wildlife habitat; Production of timber | Irwin et al. (2017) [53]; Betbeder et al. (2014) [31]; Parker et al. (2017) [54] |
| S/T: Marshes/pools | saline/brackish/alkaline or freshwater, herb-dominated | ||
| W: Shrub-dominated wetlands | |||
| Xf: Tree-dominated wetlands | |||
© 2018 by the authors. Licensee MDPI, Basel, Switzerland. This article is an open access article distributed under the terms and conditions of the Creative Commons Attribution (CC BY) license (http://creativecommons.org/licenses/by/4.0/).
Share and Cite
Wohlfart, C.; Winkler, K.; Wendleder, A.; Roth, A. TerraSAR-X and Wetlands: A Review. Remote Sens. 2018, 10, 916. https://doi.org/10.3390/rs10060916
Wohlfart C, Winkler K, Wendleder A, Roth A. TerraSAR-X and Wetlands: A Review. Remote Sensing. 2018; 10(6):916. https://doi.org/10.3390/rs10060916
Chicago/Turabian StyleWohlfart, Christian, Karina Winkler, Anna Wendleder, and Achim Roth. 2018. "TerraSAR-X and Wetlands: A Review" Remote Sensing 10, no. 6: 916. https://doi.org/10.3390/rs10060916
APA StyleWohlfart, C., Winkler, K., Wendleder, A., & Roth, A. (2018). TerraSAR-X and Wetlands: A Review. Remote Sensing, 10(6), 916. https://doi.org/10.3390/rs10060916