Abstract
Vulnerability assessment is one of the prerequisites for risk analysis in disaster management. Vulnerability to earthquakes, especially in urban areas, has increased over the years due to the presence of complex urban structures and rapid development. Urban vulnerability is a result of human behavior which describes the extent of susceptibility or resilience of social, economic, and physical assets to natural disasters. The main aim of this paper is to develop a new hybrid framework using Analytic Network Process (ANP) and Artificial Neural Network (ANN) models for constructing a composite social, economic, environmental, and physical vulnerability index. This index was then applied to Tabriz City, which is a seismic-prone province in the northwestern part of Iran with recurring devastating earthquakes and consequent heavy casualties and damages. A Geographical Information Systems (GIS) analysis was used to identify and evaluate quantitative vulnerability indicators for generating an earthquake vulnerability map. The classified and standardized indicators were subsequently weighed and ranked using an ANP model to construct the training database. Then, standardized maps coupled with the training site maps were presented as input to a Multilayer Perceptron (MLP) neural network for producing an Earthquake Vulnerability Map (EVM). Finally, an EVM was produced for Tabriz City and the level of vulnerability in various zones was obtained. South and southeast regions of Tabriz City indicate low to moderate vulnerability, while some zones of the northeastern tract are under critical vulnerability conditions. Furthermore, the impact of the vulnerability of Tabriz City on population during an earthquake was included in this analysis for risk estimation. A comparison of the result produced by EVM and the Population Vulnerability (PV) of Tabriz City corroborated the validity of the results obtained by ANP-ANN. The findings of this paper are useful for decision-makers and government authorities to obtain a better knowledge of a city’s vulnerability dimensions, and to adopt preparedness strategies in the future for Tabriz City. The developed hybrid framework of ANP and ANN Models can easily be replicated and applied to other urban regions around the world for sustainability and environmental management.
1. Introduction
Research studies on worldwide change of environment and sustainability sciences have found vulnerability as the main concern [1,2,3,4,5,6,7,8,9,10]. The urban vulnerability is a result of human behavior which describes the extent of susceptibility or resilience of social, economic, and physical assets to the natural disasters [11,12,13]. Urban vulnerability to earthquakes has increased over the years due to the presence of complex urban structures and uncontrolled urban growth. The main causes of high vulnerability of cities to earthquakes are due to many factors e.g., uncontrolled urban growth in highly seismic areas, improper disaster management, high exposure to indicators of risk, vulnerable buildings and infrastructures, rising urbanization and population growth, incising wealth measures, and the high vulnerability of modern communities and technologies [14,15,16,17,18].
Earthquake vulnerability assessment methods generally focus on magnitude prediction [19,20,21,22,23,24,25,26,27,28] and structural and geological engineering aspects [29,30,31,32,33,34,35,36]. However, apart from their devastating effects on built-up areas, earthquakes can have significant impacts on economic degradation, social structure, and the cultural heritage of an urban area. To effectively utilize a strong evaluation method for an earthquake vulnerability assessment, it is necessary to incorporate some important vulnerability components of an urban area, such as socio-economic, environmental and physical components.
The comprehension and preparation of urban vulnerability due to earthquakes take into account a wide scale of vulnerability aspects that could be managed by developing an integrated approach. The Artificial Neural Networks (ANN) [37,38] can provide computational models to assess earthquake vulnerability due to uncertainty being an inherent nature of earthquake phenomena. ANN systems work consecutively to process information of interconnected units that respond to inputs through variables, such as weights, threshold, and mathematical transfer functions [37]. Each unit processes input from other units, and then sends signals to another unit in the link. This makes ANNs very suitable for dealing with problems which require large sets of data, and have complex nonlinear relations with many different alternatives. ANN can also determine complicated patterns in sets of data which computational formulas are unable to solve [38,39,40,41,42]. Furthermore, it provides reliable predictions even on noisy and uncertain data [40,41]. Therefore, ANN has the capacity to produce classified vulnerability maps arising from complex interactions with high accuracy. To develop an ANN structure based on selected research indicators, it needs to be trained. An appropriate choice of training parameters is necessary for training ANN [42,43,44]. The single most imperative limitation of an ANN lies in its efficiency, which relies heavily on the training algorithm and network architecture. Regrettably, to date, no guidelines exist to define both features of the network. It is feasible to find the ideal and optimal network just by utilizing a trial and error procedure [45,46,47,48,49].
The Analytic Network Process (ANP) is a tool capable of Multi-Criteria Decision Making (MCDM), which takes into account of the complex relationships between indicators [45]. ANP consists of a network of criteria and sub-criteria that controls communication, and a network of effects among the elements and clusters [50]. It is a popular MCDM method, which is used to evaluate the key risk factors and potential risk, regulate risk level and consequences, as well as analyze variables and preferences of a decision [51]. The lack of an integrated model with all effective parameters for such assessments limits the possibility of policy-making and decision-making toward earthquake vulnerability assessment and disaster risk reduction. This paper is a response to this need, and proposes an integrated model for the seismic vulnerability assessment of Tabriz City based on an integrated model. Therefore, it is vital to consider an integrated urban earthquake vulnerability assessment framework. Due to the non-availability of earthquake records from 1780, and the lack of enough sampling and databases at sites, the proposed method in this research employs a new training strategy. The purpose of applying an ANP model in this study is to create a suitable training database for the Artificial Neural Network (ANN). Therefore, the combination of ANP and ANN Models for the assessment of urban vulnerability to earthquake hazards can solve complex problems of selecting suitable training sites in earthquake vulnerability assessments, and adequately consider all the relationships among the factors and indicators. The proposed framework will account for the vulnerability of urban environment using a holistic approach at the municipality zone scale. Therefore, the ANN- ANP based method presented here meets the requirements of earthquake prediction. This is because current approaches for vulnerability assessment are difficult to implement in countries like Iran. This paper employs a new hybrid framework of ANP and ANN models for constructing a composite social, economic, environmental, and physical vulnerability index. The developed model was applied to a real case study from Tabriz City, which is situated in the northwestern Iran (Figure 1).
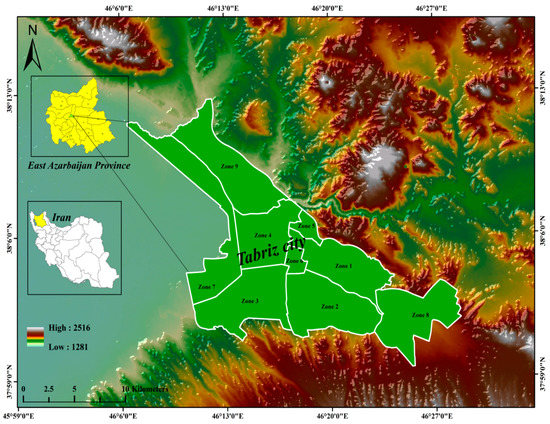
Figure 1.
The geographic location of Tabriz City in the NW of Iran.
Tabriz City is a seismic-prone province with recurring devastating earthquakes which have resulted in heavy casualties and damages. It is one of the high-risk zones for future earthquakes in Iran due to its geographical location and geological structural features. Historical studies have shown that Tabriz has been devastated by several destructive earthquakes (Table 1). In view of that, there is a need to generate a local and national assessment framework at the municipal scale. Unfortunately, none of the descriptions by which these events are known is sufficiently detailed to allow an accurate assessment of destruction and ground deformation. According to a probabilistic and deterministic assessment, seismologists believe that a strong earthquake might occur in Tabriz in the near future [52]. Therefore, hazard mitigation assessment is necessary to decrease the damage severity.

Table 1.
List of historical earthquakes of Tabriz up to 1900 AD (Source A: [63] and B: [65]).
The main objectives of this paper are: (1) to develop a hybrid ANP-ANN model in geographic information system (GIS); (2) to assess four main dimensions of earthquake vulnerability such as social, economic, environmental, and physical an Earthquake Vulnerability Map (EVM) for Tabriz City; and (3) to compare the results with data provided by Population Vulnerability (PV) with an aim to reduce the impact of an earthquake by determining and categorizing the most vulnerable zones.
2. Related Research
Comprehensive implementation of the ANP-ANN model has not been reported in urban vulnerability assessment for earthquakes. However, some of the current studies in related fields are summarized as follows. To date, there is no general agreement among researchers on how to build earthquake-forecasting models [53]. Hence, different kinds of approaches to extracting knowledge have been proposed over the last decade. Mili, Hosseini and Izadkhah [54] developed a holistic model for assessing earthquake risk and determining priorities for risk reduction and management in urban fabrics. The developed model estimates the earthquake risk at each urban zone based on hazard, vulnerability, and response capacity. Additionally, a new indicator called “Integrated Earthquake Safety Index, IESI” is introduced to address the safety level of urban fabrics in relation to earthquakes, and assess the impacts of applicable interventions on risk. The proposed model is then applied in two districts of Tehran, having different physical and socio-economic characteristics, to evaluate the safety level for earthquakes. For this purpose, the contributing elements in hazard, vulnerability, and response capacity have been assessed based on local conditions, and the IESI is determined for each urban zone. In addition, the applicability of the model to address potential improvement measures has also been evaluated. Development of an integrated model for seismic vulnerability assessment of residential buildings to Mahabad City, Iran was performed by Bahadori et al. [55]. This paper proposes an integrated model for the seismic vulnerability assessment of residential buildings based on the analytical hierarchy process (AHP) in geographic information system (GIS). The methodology integrates five main group-parameters—geotechnical and seismological, social, distance to dangerous facilities, and access to vital facilities—with their related sub-parameters. To evaluate the practicability and applicability of the newly developed model, it was used for Mahabad city, Iran. The obtained vulnerabilities for the city were mapped in GIS, and the same were visualized in the 3D city model for residential buildings.
In a separate paper, Zhang et al. [56] applied a rough set to construct an evaluation model of social vulnerability based on catastrophe progression. Following the in-depth literature, an assessment model of social vulnerability to the earthquake disaster in Sichuan Province, China, based on the catastrophe progression method, was established. A rough set attribute reduction method was adopted to eliminate irrelevant social vulnerability indicators and optimize the proposed model. Finally, a catastrophe progression method for social vulnerability to earthquake disaster was developed to overcome the subjectivity of the index weight assignment of social vulnerability indicators in the currently-used social vulnerability assessment method. The application of the method to Sichuan Province indicates large regional differences in terms of social vulnerability to earthquake disasters. Karimzadeh et al., [57] followed an indirect method to produce a Vs30 map of Iran from geological and topographical data. The outputs indicate that the hybrid Vs30 map has better performance than a single topography-based Vs30 map. The amplitude map, derived from Vs30 and geology maps, is then used for seismic microzonation of Tabriz City, and the extent of geographical distribution of damage for a possible deterministic scenario was investigated through considering different fragility curves to describe the damaging behavior of ordinary building types in the city. A variety of data to identify the most vulnerable areas in Bucharest for the earthquake was investigated by [58]. Socio-economic data from censuses in 2002 and 2011 were used to generate an overall spatial vulnerability index, while other variables such as earthquake scenarios and distance to resilience-enhancing points in space (e.g., parks, fire stations, etc.), helped to fine-tune the analysis and offered a comprehensive picture of where vulnerability hotspots could be found in an urban environment. The top three most vulnerable hotspots are analyzed, and two underlying reasons for their vulnerability are proposed and discussed in more detail, namely, education and connectedness. They applied uncertainty and sensitivity analyses to assess the stability of the results for vulnerability hotspots. The general outcome of the research is an increase in the overall socioeconomic vulnerability in the city in spite of the upward economic trend in the period of time under analysis.
More recently, Zebardast [59] presented the development of a hybrid factor analysis and analytic network process model for aggregating vulnerability indicators into a composite index of social vulnerability (SV) to earthquake hazards. The objective of the study was to construct a hybrid FA and ANP (F’ANP) model for social vulnerability assessment and apply it at the county level in Iran. In another paper, Pradhan [60] used remote sensing and a GIS and ANN model to propose a landslide hazard and risk analysis method. GIS and image processing tools were used to assemble a spatial database from topographical, geological and satellite images data. Panakkat and Adeli [61] predicted earthquake time and location in Southern California, this time using an improved version of the recurrent neural network. In particular, they computed several sets of earthquakes regarding the latitude and longitude of the epicentral location, as well as time of occurrence of the following earthquake. A probabilistic neural network was also tested.
3. Materials and Methods
3.1. Study Area Characteristic
Tabriz City, with a population of more than 1.5 million people and consisting of nine regions, is located in the northwestern part of Iran (Figure 1). It is the second largest city of Iran in terms of land area, and encompasses about 25 km2 area of old texture. The North Tabriz Fault (NTF) is the most noticeable tectonic structure in the vicinity of Tabriz City (Figure 2 and Figure 3) [62]. It encircles an area of extreme deformation. The seismicity is situated between a couple of fold-and-thrust belts of the Caucasus to the north and the Zagros Mountains to the south, covering a distance of 150 km in the Northwest-Southeast direction in the Northwest of Iran [63,64]. Although the NTF has been seismically inactive over the past few decades, it has historically generated large surface-rupture earthquakes (Table 1).
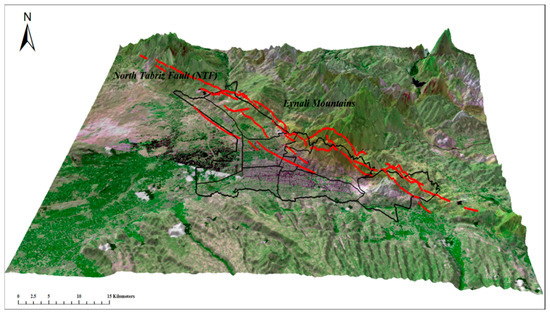
Figure 2.
Three-dimensional perspectives of Tabriz area (black lines) and the position of the North Tabriz Fault (NTF) (red lines). Image generated using SPOT 5 satellite images and digital elevation model (DEM).
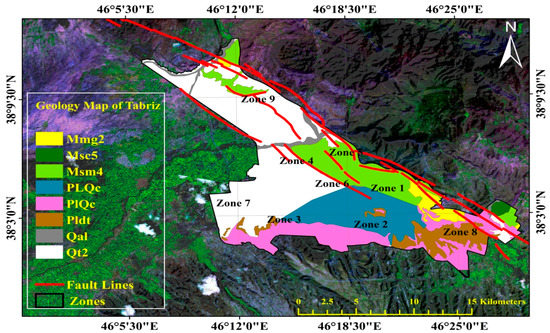
Figure 3.
Geology Map of Tabriz City. Legend: Mmg2 = Interlayer of greenish grey marl associated with interlayer of gypsum- bring sandy marl; Msc5 = Interbedded red conglomerate with sandstone and red marl; Msm4 = Sandstone and red marl; Pldt = Diatomic and fish interbedded with fine particles sediment; Plqc = Interlayer of semi-hard conglomerate associated with sandstone and pumice; Plqc = Interlayer of semi-hard conglomerate associated with sandstone and pumice. Qal = Quaternary alluvium; Qt2 = Young terrace and alluvium deposits [62].
In the last 65 years, three large earthquakes have ruptured the NTF system and adjacent reverse faults from southeast to northwest region. These earthquakes are the Shebli earthquake, Tabriz earthquake, and the Marand-Mishu earthquake. In 1721, the Shebli earthquake (M∼7.3) occurred on the south-eastern NTF with a surface rupture length of more than 35 km. The Tabriz earthquake (M∼7.4) occurred in 1780 on the north-western NTF, with surface rupture length of 42 km. Marand-Mishu earthquake (M∼6.3) occurred in 1786 on the Mishu reverse fault and the Sufian segment [65].
3.2. Data Acquisition, Classification and Standardization
Vulnerability maps are difficult to produce without taking into account of the criteria and indicators, which cause the heterogeneity of the study area [66]. This is the most vital part of the overall approach, which ensures that the selected criteria and the indicators are adequate to reflect the overall vulnerability of urban areas in Tabriz City. Selecting indicators is an extremely time-consuming part of the method, because it consists of constructing and preparing a GIS spatial database that will later be used during earthquake vulnerability analyses and served as input to urban earthquake scenarios. There are several criteria and indicators employed for urban vulnerability assessments (See Table 2). According to the purpose of the study, data collection was conducted based on the indicators derived from the literature and an expert questionnaire survey. As mentioned in Table 2 of this study, 44 indicators associated with urban vulnerability to earthquake hazard in Tabriz City were presented. The academic staff of the department of geography and urban planning (Tabriz’s University) were chosen as experts for this study. The experts were asked to rank the importance and relevance of discovered vulnerability indicators associated with urban vulnerability to the earthquake in Tabriz City from the most important to the least [67]. As a result, 20 indicators were highlighted as vulnerability indicators associated with urban vulnerability to the earthquake in Tabriz City. The importance index of the individual indicators was calculated based on Equation (1), the range of relative importance index (RII) is from zero to one, and indicators with RII of less than 0.50 are removed from the research.
Table 2.
Summary of the aforementioned and relevant literature according to the main indicators which influence urban earthquake vulnerability.
Relative Importance Index:
where,
- W: Weight given by respondents to each factor and range between 1 and 5,
- A: Maximum weight, in this case, A = 5,
- N: Number of respondents.
As shown, 24 indicators which had obtained the Relative Importance Index (RII) with values of less than 0.50 were obtained; the rest were emphasized as almost equally important (RII ≥ 0.50). As highlighted [68,69,70], those indicators with less than 0.5 are considered unimportant. Therefore, they cannot be considered for analysis.
Mathematical methods for data classification based on equal intervals, manual or natural breaks, or statistical consideration, are default processes in GIS software [71]. The manual classifier method has been applied to classify the values into five different vulnerability classes. Initially, for this purpose, the classification of all required layers based on the density of buildings, residential building, buildings floors, materials, quality of buildings, age of buildings, commercial buildings, and the number of literate people, employed people, unemployed people, population, household and size of building blocks, is required. The logic of these factors is similar to a bigger density leading to a greater vulnerability. The other metric of classification is the distance to the area such as road network, faults, danger centers, relief centers, and open spaces. With the exception of the slope that is represented in percent and geology, all the features of the layers were divided into five classes. To calculate density, a kernel density function was used. To calculate distance, a Euclidean function with a cell size of 10 m (pixel size 10 × 10 m) was applied in the Arc GIS environment (version 10.3). However, to calculate slope, a Digital Elevation Model (DEM) (generated from contours on 1:50,000 topographical maps) was used, and classification was based on the percentage. A geology map was evaluated by expert judgment and based on the features of texture, stone type, stone material, soil type, water permeability, and also the presence of faults and fractures. All twenty indicators (quantities and qualities) (see Table 3) were converted to raster format in the Arc GIS environment by using the feature to raster, vector to raster and/or polygon to raster.
Table 3.
Selected Criteria and Indicators for Vulnerability Assessment in this Study.
Each of indicators holds a definite range scale value; hence, it needs to be standardized. Standardization is a procedure to determine membership value according to the usage of each criterion. Thus, all the twenty indicators were standardized at this stage. Suitable weights based on importance in the earthquake hazard vulnerability were given, namely very unfavorable, unfavorable, moderate, favorable and very favorable. Figure 4 shows the standardized input layers derived from the GIS procedure for the indicators used in this study for Tabriz City.
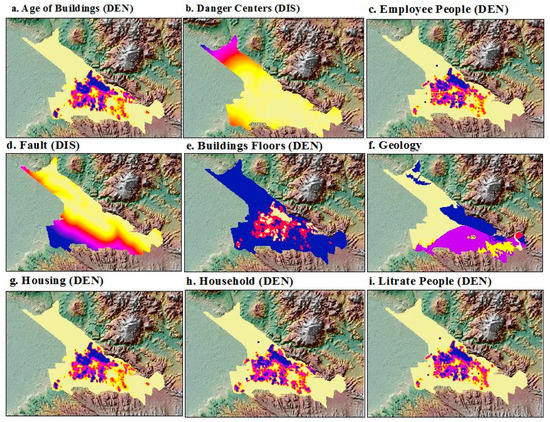
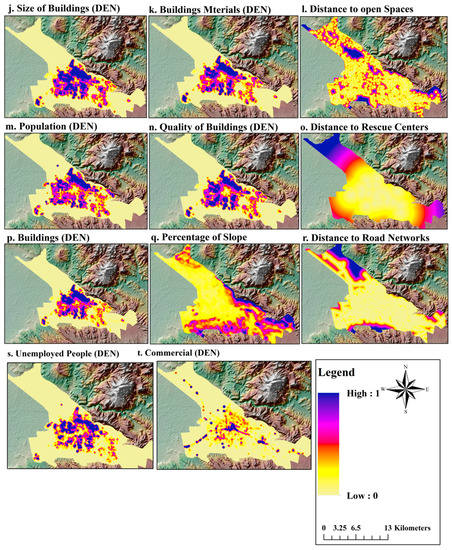
Figure 4.
Standardized input layers derived from GIS procedure for the indicators used in this study; (a) Age of buildings density; (b) Danger centers; (c) Employed density; (d) Distance to fault (e) Buildings floors; (f) Features of geology (g) Housing density; (h) Household density; (i) Literate density; (j) Size of building; (k) Building materials; (l) Distance to open spaces; (m) Population density; (n) Quality of buildings; (o) Distance to rescue centers; (p) Buildings density; (q) Percentage of slope; (r) Distance to roads network; (s) Unemployed people; (t) Commercial density.
3.2.1. Description of the Selected Indicators
Environmental Indicators
Geology of Tabriz: The city of Tabriz is geologically composed of red marl along with young alluvial barracks and ridge sandstones. The red marls comprise of an alternation of green, gray and red marls with the inner layers of sandy, gypseous and saltine marls. However, the contemporary alluvial consists of clastic granule sediments with layers of diatom fish. In addition, the semi-rigid conglomerate consists of layers of sandstones, puns, pyroclastic rocks, basic and ultra-basic stones, and red conglomerate with an alternation of sandstone and red marl [97].
Percent of slope: Based on its position the city of Tabriz is ideally located on lands with less than 5% gradient. Consequently, large northern parts of the city include marginal zones with high population density located on lands with gradients higher than 5%. Similarly, the southern regions do not show favourable conditions in terms of the gradient. However, better conditions exist due to the relatively large distance from fault lines, low population and structural density [83].
Distance to fault: One of the most important measures to prevent the devastating effects of earthquakes is to avoid high risk zones. Therefore, the choice of location is a very crucial step in designing buildings or planning for settlements in seismic prone areas. The importance of site location is a vital approach to risk assessment and hence high risk areas should be avoided [106].
Social Indicators
The population density: During the decades (1976–2011), the population density in the north, north-east (Baghmisheh and Roshdieh) and north-west (Eram town) has increased. In other words, increasing population density has unfortunately occurred toward the North Tabriz Fault (NTF). Therefore, significant sections of the population are surrounded by major and minor fault branches. This indicates that zones 1, 4 and 5 are located in the remote earthquake prone areas, whereas zones 2 and 3 show better circumstances [108].
Household density: Household vulnerability assessments are typically used by scientists and policy makers to ascertain the potential impacts of environmental change in particular places, and plan effective responses during crises. Therefore assessing the vulnerability of household population density to earthquake is crucial. This is because high household density increases vulnerability particularly when disparities exist between households and residential building size [88,110].
Literate people density: Literacy itself cannot reduce or increase the vulnerability caused by an earthquake. However, higher literacy levels can raise awareness about hazard and improve response to official alarms in crises periods in communities. Furthermore, education can potentially enhance knowledge and perception of risks and appropriate responses during disasters [107].
Economic Indicators
Employed people density: The highest density of employed people on the average was observed in zones 1, 4 and 5, despite the unsuitable condition to fault line, undesirable demographics and texture of urban housing. Hence, it can be inferred that full time employment does not guarantee desirable conditions in the zones examined despite the significance of income. However, only household job status is considered sufficient due to the lack of income statistics of households [93].
Unemployed density: Socio-economic conditions have significant impact on vulnerability. Hence, research on economic vulnerability principally highlight income (or lack of) as key characteristic of the differential aspects of disasters. Furthermore, low-income groups are typically more exposed to obstacles during the response, recovery, and reconstruction phase of disasters [111,112].
Physical Indicators
Building density: One of the most important policies undertaken under the second five-year plan for socio-economic and cultural development in Iran aims to lower building construction density in cities. As a result, land allocation for the housing sector particularly in low-density regions will be abridged. This based on the consideration those factors such as urban population growth, high cost of urban infrastructures and lands constraints for future expansion in cities influence density [38].
Residential buildings density: Land use and nighttime population density are important considerations for vulnerability studies. In other words, during an earthquake, the highest number of casualties occur at night. Therefore, the characteristic features of this type of uses are greatly important as presented in this research. Consequently, an increase in the number of residential units means reduction of other uses such as open spaces for circulation and escape. Therefore, reducing density and providing spaces for free movement will reduce vulnerability [75,76,77,78,79,80,81,82,83,84,85,86,87,88,89,90,91,92,93,94,95,96,97,98,99,100,101].
Commercial buildings density: Commercial spaces are important both from an economic and physical perspective. Therefore, such spaces are considered standards for assessing economic prosperity. In contrast, over increasing density in such spaces will increase vulnerability during earthquakes [99].
Distance to relief centers: The proximity to relief centers is an important factor during and after the disaster (crisis). This issue is more critical to discussions on vulnerability caused by earthquakes since most deaths from burial under building debris or indirectly through fire outbreaks. However, the survival of casualties can be greatly enhanced by provision of adequate rescue and relief structures such as hospitals, medical centers and firefighting stations [38,97,98].
Distance to danger centers: The earthquakes can lead to accidents such as fire, landslide, explosion of fuel tanks and dams breaking among others. Therefore, proximity to high-risk areas such as fuel tanks, water tanks, gas stations, have tremendous impacts on vulnerability [101].
Distance to open space: The location and distribution of open spaces can greatly reduce potential vulnerability. Earthquakes typically damage low quality structures in a short period. Consequently, buildings with fully occupied residents are more vulnerable compared to occupants in open spaces [80].
Distance to street network: The network of streets is also an important factor in disaster management. Furthermore, classification of the network of streets by width is more important than the performance system of the network in the context of vulnerability to earthquakes. In the micro-zonation scheme of Tabriz, which was prepared by consultant engineers of Tehran-Padir, the city’s streets are divided into two namely; first-grade street (collecting) and distributing streets) [38,97,98].
Quality of buildings density: The quality of newly constructed, repaired or destroyed buildings is a major indicator for vulnerability assessment. Based on this, parts of zones 2 ,3, 4 and northern parts of the city comprising zones 1 and 5 also showed unfavourable conditions [77].
Buildings materials density: The seismic resistance of buildings plays a key role in protection against earthquakes. Most earthquake casualties are due to the rupture and collapse of buildings. In addition, the destruction of buildings during earthquakes may also be due man-made phenomena such as economic stagnations and social collapses [98,99].
Age of buildings density: In general, the age of buildings cannot indicate the quality regardless of the materials used as observed using the methodology of the Kernel model. By increasing the values obtained more undesirable conditions can be expected. Consequently, zones l and 5 are located in relatively worse conditions. In addition, zone 4 has similar conditions with only slight connivance. However, other areas have relatively favourable conditions except in a few cases [103].
Buildings floor density: The vulnerability of buildings increases with increase in the height and number of floors. At present, it is noteworthy to state that despite advancements in building technology, higher altitude does not diminish vulnerability. In any case, the number of floors on buildings is also an important factor in seismic vulnerability [78,105].
Size of buildings density: The geometry of land and its properties need to be comprehensively assessed during evaluation and segmentation of lands. The effect of building specifications directly influence structure performance, construction characteristics, and road networks vital for vulnerability index evaluation. In assessing earthquake vulnerability, the size and geometrical shape of the lands scheme are crucial. Typically, vulnerability is lower for parcels of land with large but regular shapes and sizes [74,75,76].
3.3. Transferring Layers to IDRISI Software
In this step, all the standardized layers produced in the previous stage were transferred to the IDRISI environment. The most important point in this stage was to consider the similar extent of all layers. For this purpose, raster calculator was used, and similar display was considered for all the layers. Then, all of the maps with identical extents were entered into IDRISI software in the ENVI format. The development of a hybrid ANP-ANN model requires a number of stages, as shown in Figure 5.
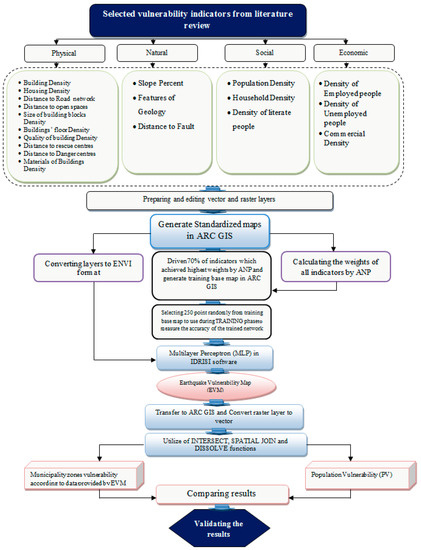
Figure 5.
The framework of the hybrid ANP-ANN model.
3.4. Analytic Network Process (ANP) Approach
Analytical Network Process (ANP) [113] is a more general form and extension of the Analytical Hierarchy Process (AHP) developed by [114,115,116,117]. ANP represents hierarchical relationships, whereas AHP is based on a hierarchical structure. In practice, numerous decision issues are hard to form into a hierarchical structure, as they include interaction dependence with a bottom-up approach. ANP was applied to handle dependence among criteria and alternatives without assuming that they were independent [118]. The approach of ANP feedback results in the substitution of hierarchies with networks. It also accentuates inter-dependent relationships among different criteria for decisions [119]. The ANP analysis can be represented in four steps (A to D), and is described in the next section.
3.4.1. Step A: ANP Model Construction and Problem Structuring
A problem should be well presented and divided into a set network of logical systems. Consequently, a framework that represents the network can be specified according to the decision maker’s opinion using appropriate methods.
3.4.2. Step B: Paired Comparisons
In ANP, like AHP, the problem is defined in terms of clusters and decision elements within them at multiple levels of abstraction. For example, in this study, the first cluster is the goal (e.g., creating vulnerability index), and the second is the dimensions or criteria (with elements of social, economic, environmental and physical). The third cluster is the indicators (containing the twenty selected indicators). A comparison among the pairs of decision elements in each cluster is made with respect to their significance for the control criterion. Also, inter-dependencies among cluster indicators are also inspected pair-wise. Hence, as [115] suggested, eigenvectors can represent the measure of elements’ influences on each other; relative significance is measured on a scale of 1 to 9, where the former bound represents equal significance and the latter shows extreme significance. This measure is based on one indicator, a row component in the matrix, over the other, a column component in the matrix [115]. A mutual value was set for the purpose of reverse comparison, illustrating the significance of the element as associated with the element. Similar to AHP, the pair-wise comparison values are assigned in the comparison matrix, and a local priority vector was gained from the eigenvector, computed with the following formula:
Matrix A is a pair-wise comparison matrix whose largest eigenvalue is denoted as . W demonstrates the eigenvector. Eigenvector X of a consistency matrix A can be determined using:
The value is an important validation parameter in ANP. This measure serves as a reference index for evaluating estimated vector using the information by finding the Consistency Ratio .
Consistency index is used as a measure of pair-wise matrix consistency. Accepted Value of consistency, , must be less than 0.1.
For similar order reciprocal matrices of any random entries, RI represents the average consistency index. The estimate is acceptable if ; if not, until this range of this measure is not achieved, a new comparison matrix is sought repeatedly.
3.4.3. Step C: Super Matrix Calculation
Pair-wise comparison assists to calculate the super matrix, which is partitioned according to clusters and their elements. The super matrix consisting of N clusters is presented as follows (Figure 6):
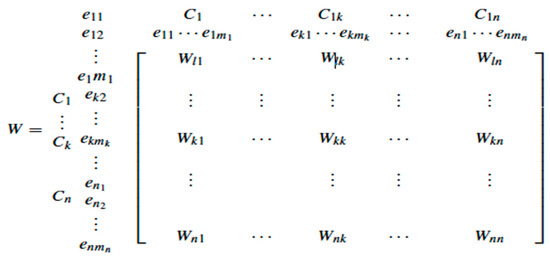
Figure 6.
The super matrix consisting of N clusters.
where, represents kth cluster where the number of items in each kth cluster is . These items are denoted as . Identical pair-wise comparisons are used to find the priority vector, where each column is the priority vector denoted as . It indicates the elements’ significance in ith cluster with respect to an element in cluster j [120,121,122].
3.4.4. Step D: Selection
These step goals are used to assess each indicator in order to choose the most suitable one for final decision making. The selection criterion is the weights of alternatives which can be obtained from the synthesized super matrix.
3.5. Artificial Neural Network
The Artificial Neural Network (ANN), a computational model, has the ability to conclude non-linear associations among variables in input and output datasets. It is founded on a learning route (training; calibration) and is able to provide estimated values of output variables for input data [123,124]. The simplest conceptual definition of an artificial neural network is a model whose output is some linear or non-linear combination of the inputs [124]. The mathematical interpretation of ANN is well explained by many researchers [113,125]. In brief, ANN consists of layers of a number of neurons or nodes that transform input data into output. The most popular type of ANN is the multilayer Perceptron (MLP) network. An MLP is made up of three layers, including input, hidden and output layers, and the area between them [124]. Figure 7 shows the architecture of MLP used in this analysis. Data from different sources, such as thematic sources, feed into the input layer in which the neurons exist. The neurons rely on the quantity of input data sources. This input data is vigorously processed in the hidden layers, and initial output layers and so on. Trial and error determines what will be the number of hidden layers and how many neurons each will have [125,126,127,128,129]. A number of output layer neurons is determined by the application and shown by the type of class analysis. Each hidden neuron interacts with the weighted inputs, which it gained from the earlier input layers’ linked neurons [129]. After determining the weighted sum of inputs to each hidden neuron, a transfer function is used to find the initiation at the current neuron. Figure 6 illustrates the signal flow from inputs i.e., and unidirectional nature, as shown by arrows. Similarly, output signal flow (0) of the neuron is also shown with the flow direction. The neuron output signal 0 is given by the following relationship:
where, is the weight vector and the function f (net) is referred to as an activation (transfer) function. The variable net is defined as a scalar net product of the weight and input vectors,
where, T is the transpose of a matrix, and, in the simplest case, the output value 0 is computed as:
where, is called the threshold level; and this type of node is called a linear threshold unit [129].
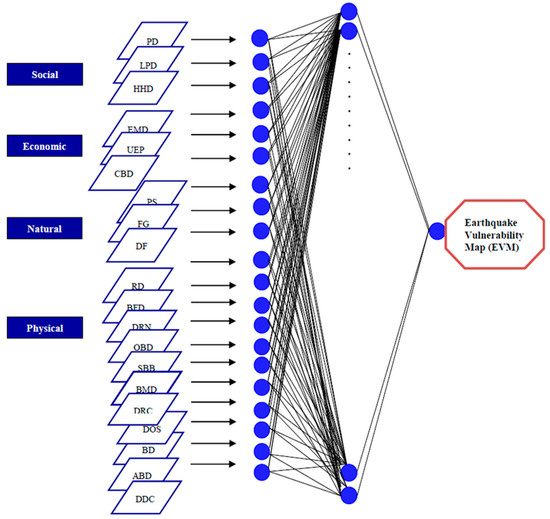
Figure 7.
The architecture of ANN as a multi-layered Perceptron (MLP) used in this study.
4. Results
4.1. Applying ANP for Training Site
Figure 8 presents the established network where the first cluster depicts the overall objective of the study that is the social, economic, environmental, and physical vulnerability index creation. The second cluster elements are the four major dimensions of vulnerability. The third level clusters are the primary indicators of the four dimensions of vulnerability. After a network is established, the pair-wise comparison is carried out among the decision elements of the network in accordance with the experts’ opinion. Then a super matrix is formed. The first super matrix for the proposed network has three levels:
where, the vector shows the effect of goal on V dimensions. The matrix, denotes the influence of dimensions of vulnerability on the indicators of vulnerability, and the matrix signifies the inner dependence (interdependence) between the V indicators. The method of calculating the corresponding local priority vector or is illustrated in Table 4. The indicators selected for the study are given by the limit super matrix that provides a meaningful influential weight for each of the 20 indicators, including social, economic, natural, and physical. These weights, or , are the elements in super matrix that belong to the goal column. These elements were normalized and are shown in Table 5.
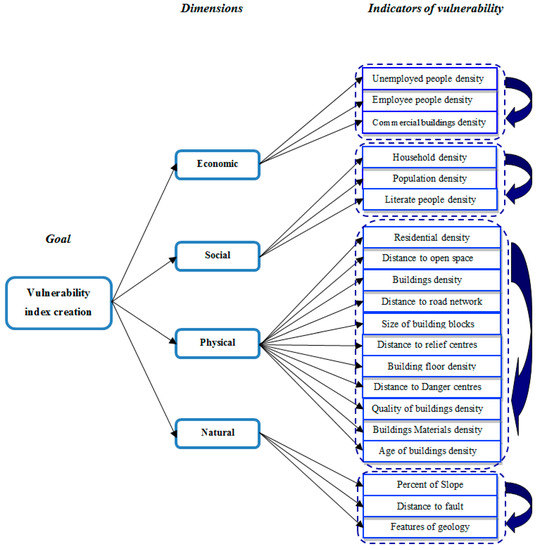
Figure 8.
The ANP model for constructing vulnerability index.
Table 4.
The pair-wise comparison between various dimensions of vulnerability.
Table 5.
The relative importance of vulnerability indicators.
4.2. Calculating Vulnerability Index Score for Training Site
There are two sets of data, namely the “training set” and “test set”, which are necessary to perform ANN analyses. The ‘‘training set’’ is utilized by the learning algorithm to create a suitable set of network weights, precisely illustrating the links between input and output. Its performance is then verified on the “test set” of data with recognized results, something not presented before to the network. Preparing suitable data for the training site plays an important role in the accuracy of the obtained vulnerability map. Actually, the first step of neural networks’ training consists of collection, analysis, selection, and pre-processing of the training data. To effectively achieve this objective, suitable parameter selection should be done in the training phase.
Due to the non-availability of earthquake records from 1780 and lack of enough sampling and databases at sites, the proposed method in this research employs a new training strategy. As explained in the previous section, the purpose of applying the ANP model in this study is to create a suitable training database for the neural network. To achieve this aim, 70% of those indicators with the highest weight driven from ANP model (Table 4) were transferred to Arc GIS to create the base map (Figure 9). Thereafter, 250 points were selected randomly from the base map to produce a final training site map, and were subsequently used during the training phase of the feedforward Multilayer Perceptron (MLP) model, and also to measure the accuracy of the trained network. After being standardized, the obtained training map, along with 20 layers maps, are transferred to IDRISI software as the input and of neural network after converting the format.
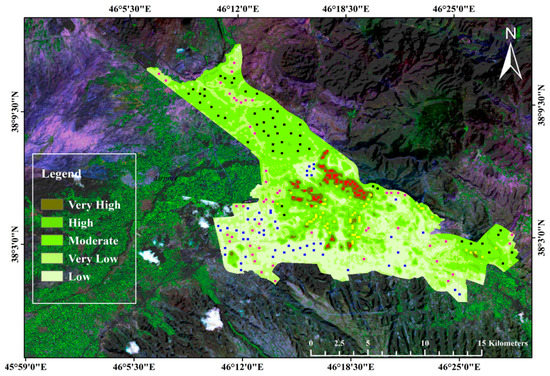
Figure 9.
Training site map extracted from ANP model.
4.3. Applying Multi-Layer Perceptron (MLP) Network for Earthquake Vulnerability Map (EVM)
MLP classifies the remotely-sensed imagery using the back propagation (BP) algorithm. The calculation is based on information from training data. MLP performs a non-parametric regression analysis between input variables and one dependent variable, which is represented by one output neuron in the network [130].
To model the urban vulnerability to earthquake hazard in Tabriz City, the MLP was run in hard classification mode (threshold transfer function for output neurons), using IDRISI Selva software (Version 17.1) (Clark Labs, Clark University 950 Main St., Worcester, MA, USA). According to the research goal, we used classification option for the output. The 20 input layers were then specified and their names entered in the grid. The mask image contains Boolean values containing 1s in all cells and 0s elsewhere. For training data, the raster file containing the weights of the selected (14 indicators) values were entered. The training process reduces the error between ANN output and the real data by adjusting the weights according to the BP algorithm [131]. For each class in the training data, the number of training and testing sample sizes are randomly divided. The actual number of pixels used for training and testing is also determined by the ratio between the numbers specified for the maximum training and testing pixels. Using the same values for each entry, it divides the pixels at a 1:1 ratio. In general, it is specified as hundreds to thousands, rather than a large number of pixels per category. In this study, an average of 500 pixels per class was used for training and testing. The training pixels are used in training, and the testing pixels are used to validate the results. The network topology includes 1 hidden layer with 7 nodes, 20 input layer nodes and 5 output layer nodes (Table 6).
Table 6.
Network, data and training parameters used for ANP-ANN for vulnerability map in the IDRISI Selva software.
The number of input layers is identified through the number of images, and the number of outputs is the training data categories in the training file. The next several steps deal with training parameters, and the critical part is the learning rate, which is a positive constant that controls adjustment done to the connection weights. Automatic training and dynamic learning rate were used; automatic training adjusts the learning rate during training. With the use of dynamic learning, starting and ending learning rates must be entered. Entered learning rates and momentum factors are 0.001, 0.0001, and 0.5 respectively. Small learning rates tend to increase the time in the training phase, and large training rates produce poor results with fluctuating adjustments. The momentum factor is used in this study to speed up the convergence procedure. Adjustments can be made with the criteria to terminate the procedure. The acceptable error is measured through root mean square (RMS) associated with the learning of the network.
The extracted RMS in this study is 0.1534, which is acceptable per IDRISI default values, which is 0.5. When an acceptable error is defined as very small, the convergence is hard to obtain. Thus additional iterations may lead to over-training. Specified iterations were (10,000) at which the training procedure was terminated (Table 6). Lastly, the sampling specifications of the training and testing data determined the accuracy rate per category. According to this analysis, ANN recorded 90.01% overall accuracy with testing data. In the final step of ANN analysis, the earthquake vulnerability map (EVM) was prepared by using the trained and tested ANN model and applying it to the derivative data sets, and subsequently, the EVM of the study area was produced.
After producing the EVM from the ANP-ANN method, the resultant map was transferred to GIS environment. Then, the raster map was converted to vector format and dissolve function was processed to calculate the vulnerability of Tabriz City (Table 7). Tabriz has been broadly classified into five zones, including very high, high, moderate, low, and very low classes concerning the occurrence of future earthquakes. The results indicate that 1.19% of the total area is found to be highly vulnerable. High, moderate, and low vulnerable zones represent 5.60%, 34.11%, and 52.74% of the area, respectively (see Table 7). Very low vulnerability was recorded for 6.35% of the total study area. By adding municipality zones map to EVM of Tabriz City, the level of vulnerability in various zones was obtained (Figure 10 and Table 8). The seismic vulnerability of nine zones of Tabriz indicates that most parts of this city are located in low and medium damage ranges. However, some parts of Tabriz fall in seismically moderate to high hazard areas. South and southeast regions of Tabriz City are in low to moderate vulnerability conditions, whereas some parts of the zones 1, 4, and 5 in the northeastern part are under critical vulnerability conditions (Figure 10).
Table 7.
The level of vulnerability in Tabriz City according to ANP-ANN model.
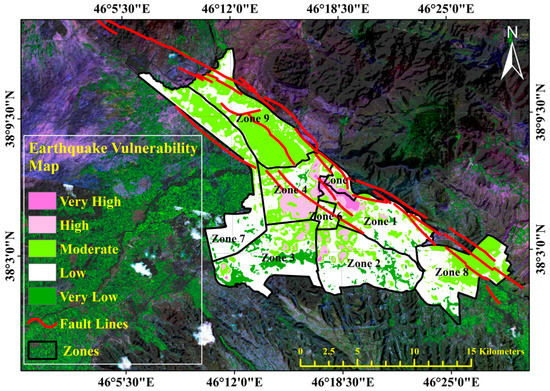
Figure 10.
Final earthquake vulnerability map extracted from ANP-ANN model.
Table 8.
The level of the vulnerability of municipality zones according to ANP-ANN model.
Zone 5 is classified as highly vulnerable, having 16.14 % very high and 14.26% high vulnerability areas. Zone 4 is the second most vulnerable zone, with 1.08% and 25.75% in very high and high vulnerability categories, respectively. Finally, zone 1 with 5.74% very high and 9.80% high vulnerability classes is the third most critical area in Tabriz City (see Table 8). On the other hand, zone 7 with 67.55% low and 3.65% very low vulnerability exhibit the lowest vulnerable zone. Zone 3 with 58.20% low and 22.10% very low vulnerability is the second lowest vulnerable zone. After that, zone 2, with 68.30% and 10.14% in low and very low vulnerability classes, is categorized as third lowest vulnerable zone (see Table 8).
Merely knowing the size and area of the vulnerable zones cannot indicate the impact level of the probable event. Hence, population data of the municipality zones of Tabriz City was used for assessing the impact of the vulnerability. Therefore, the amount of population vulnerability (PV) in various zones of Tabriz City was obtained, as illustrated in Figure 11. Table 8 shows the comparative vulnerability of the zones in Tabriz City based on the data provided by EVM and population vulnerability (PV). The most vulnerable zones are clustered in zones 5, 4, and 1 of Tabriz City, respectively. Overall, these three zones are considered as highly vulnerable areas; the main reason is their geographical location along the North Tabriz Fault (NTF). In addition, there is a high percentage of the marginal settlement, informal settlements, and old textures in these zones. The dominance of residential density compared to the other land uses (30% of the total land uses) and the highest density of population (lowest education and income) are other factors in these highly vulnerable areas. Particularly, the north of zone 1 is a critical vulnerable area to future earthquake hazards.
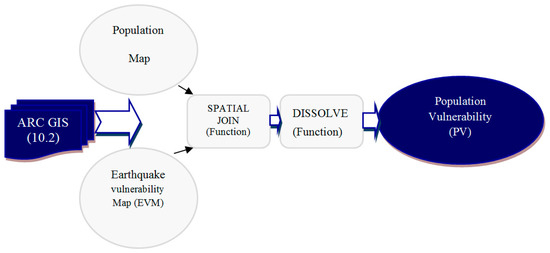
Figure 11.
The procedure of determining population vulnerability.
The most dominant type of structure in the city of Tabriz is masonry brick buildings, distributed from high to low, in zones 5, 4 and 1, respectively. Over 50% of buildings in zones 5 and 1 are made of masonry bricks, and most of them have been constructed without considering seismic regulations. Therefore, a particular plan is required to reconstruct buildings in these areas. The number of high-quality steel and concrete buildings in Tabriz City is low. The largest number of steel and concrete buildings can be found in zone 5, and most of these buildings have a low quality of construction without observing the requirements of the standard. Therefore, it is necessary to comply with the requirements of the construction standards or new buildings. In terms of geotechnical and seismological parameters, zones 5 and 1 face inappropriate situations. Owing to a combination of factors, including the high level of PGA, the possibility of high slope, and proximity to seismic faults (NTF), these zones are susceptible to seismic damage. Overlapping EVM with PV indicates that the lowest vulnerable zones are found in zones 7, 3, and 2 of Tabriz City (see Table 9).
Table 9.
Assessment of Population Vulnerability (PV) in Tabriz City according to ANP-ANN model.
4.4. Investigating the Accuracy of the Obtained Results
Model validation was performed in order to examine the validity of the developed earthquake vulnerability assessment and the overall vulnerability of the Tabriz City at municipality zones. A well-constructed model should represent the domain of interest fairly accurately. It should be noted that there is a probability that such accuracy may not be achieved with the standardized/classified data. However, it is preferable that the mentioned domain is acquired in the output of the model because it represents a flexibility of the model and its compatibility with a human perspective, which was proved in this study.
Accordingly, to validate the hybrid ANP-ANN model findings, EVM results were compared with the results obtained by PV. Scatter-plots were applied for the results obtained from both methods (Figure 12 and Figure 13). These scatter-plots indicate that there is a strong positive relationship between the most vulnerable zones (including zones 5, 4 and 1) and lowest vulnerable zones (including zones 2, 3 and 7) of the EVM and PV. Additionally, Spearman correlation coefficients between the most and lowest vulnerable zones were calculated. Table 10 and Table 11 show the statistical results for both outputs. A correlation coefficient of 0.976 and 0.940 (statistically significant at 0.01 levels) between most and lowest vulnerable zones indicates that both outputs are compatible with the level of vulnerability in the identified zones.
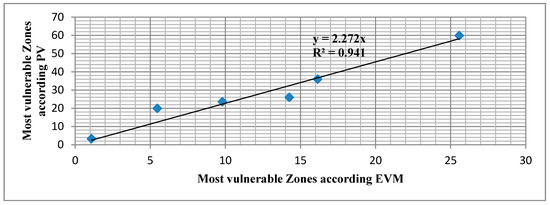
Figure 12.
The scatter-plot between the PV and EVM according to most vulnerable zones.
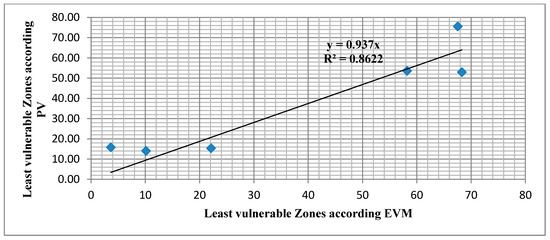
Figure 13.
The scatter-plot between the PV and EVM according to least vulnerable zones.
Table 10.
Correlation between the EVM and PV for the most vulnerable zones.
Table 11.
Correlation between the EVM and PV for the least vulnerable zones.
5. Discussion
Vulnerability is multi-dimensional differential, and varies across physical space and within social groups. In addition, it is scale-dependent with regards to space and units of analysis such as individual, household, region, or system with dynamic characteristics and driving forces of vulnerability change over time. Vulnerability assessment is a broad concept that can be discussed in several different contexts. However, it is not a variable that can be measured directly; rather, it can be assessed indirectly according to a set of dimensions. For assessing urban vulnerability, it is necessary to consider all main dimensions of vulnerability including environmental, physical, and socio-economic [131,132].
Physical factors are usually materially-oriented, arising from the field of engineering, architecture, and land use planning. Vulnerability from a physical perspective, despite its broad scope, refers mainly to the consideration and susceptibilities of location and building environment. Environmental vulnerability includes the fraction of the slope, geological features, drainage and distance to the fault. The social dimension is multi-faceted and cross-cutting. It focuses primarily on the social organization and collective aspects rather than individuals. Lastly, economic vulnerability describes the susceptibility of an economic system, including public and private sectors, to potential (or direct) disaster damage and loss. Furthermore, it refers to the inability of affected individuals, communities, businesses, and governments to absorb or cushion the damage [132]. In this research, a new hybrid framework of ANP-ANN model was established for earthquake vulnerability assessment by constructing a composite social, economic, environmental, and physical vulnerability index and applied to Tabriz City as a case study. Results demonstrate that it is a robust approach to construct a composite vulnerability index using the four categories of vulnerability factors. The application of the vulnerability index derived from various aspects of earthquake hazard and vulnerability is more accurate than using only physical and/or socio-economic characteristics of urban areas at local [55,133,134]. The outline of the hybrid ANP-ANN model developed in this contribution is flexible, as it is an integrated approach to earthquake vulnerability assessment. Due to its robust nature, it can be broadly applicable to any urban environments on different geographical scales and mapping units.
The identification of vulnerability and understanding of related methodologies helps the development of policies and action plans for mitigation. The assessment of main criteria of vulnerability indices in relation to earthquake risks improves research studies on natural hazards. The assessment procedure of social, economic, environmental, and physical vulnerability was found to be more reliable. Hence, the results can enhance urban policy and scientific based debates as a possible key-element for urban public policies. The main advantage of the research was its simplicity in applying the applying the indices, which could be a solution for different stakeholders in vulnerability studies. Thus, vulnerability assessment fits into the general approach of informed decision making which links academic research, policy, and practice [133]. Since all indicators have neither equal importance value nor play an effective role in vulnerability, assessing vulnerability cannot be reviewed only by an individual inspection of each element. Therefore, all elements must be considered simultaneously to achieve the correct results.
The EVM derived from the hybrid model can provide substantial information for the development of the city. In addition, the EVM is strategic to planning design of future land infrastructure, crises confrontation procedures, and public protection services of the state. For example, the EVM can provide information on the proper location for the construction of vital infrastructure (such as hospitals or fire services) during crises. Considering that, modern construction techniques can provide solid anti-seismic buildings. One of the most important issues in selecting the location for the construction of a new infrastructure is to provide free access during crises situations. Based on the information provided from the EVM for the case study (Tabriz City), such locations can be selected at the perimeter of the city and along main roads entering the city center without crossing high-risk sections. In addition, the EVM can be used by the public protection services for the definition of proper concentration and distribution points to correctly cover high-risk sections. Currently, the selected concentration points sufficiently cover the perimeters of the high-risk sections, although their distribution is not uniform across the city.
According to the EVM generated by MLP for Tabriz City, zones 5, 4, and 1 are recognized as the most vulnerable areas. These zones were identified as the most crowded areas with high building and population densities. In addition, the absence of spatial planning in the construction of buildings in these zones has worsened the condition. The percentage results in terms of vulnerability show that these zones are in greatly undesirable conditions; hence, the important rule of planning before construction is inevitable. Statistics revealed that more than 400,000 people in Tabriz City live in informal settlements located in the three zones with undesirable conditions. The informal settlements around the aforementioned zones are characterized by poor conditions based on criteria such as land cover. Other factors include the age, material, and density of buildings. In the context of land cover, more than 52% of the region is at the rate of +75%. In terms of building age, around 48% of the buildings in these zones are more than 20 years old, which is rather undesirable. In the case of building materials, around 55% of the buildings are constructed with poor materials such as bricks and iron structures, increasing the vulnerability of these zones to earthquakes. However, this is not the case in the southern part of zone 1, where occupants reside in desirable conditions. Essentially, this zone is considered a planned area with different conditions. In this manner, the existence of systematic planning, such as creating ample green spaces and modern urbanism, has improved the safety of the region. Based on land cover statistics, over 80% of the region is at the rate of −75%. In case of building date, nearly 70% of the area is newly built-up, whereas, in terms of materials used for building, about 80% of buildings in the region have appropriate materials (steel and concrete structure). This has made the region less vulnerable.
In zones 5, 4, and 1, it is evident that building codes, policies, and zoning regulations are neglected due to expansion in areas prone to seismic activity. It should be noted that buildings are not designed to be ruined under the pressure of an earthquake. Therefore, it is pertinent to enforce and observe building codes (or policies) during design, to ensure stronger and safer buildings. In addition, building codes can be adjusted during the design and construction of buildings to ensure health and safety in communities. The purpose of seismic provisions in building codes is to protect people’s lives and ensure their safety during evacuation from ruined or damaged buildings. Hence, the aim of this new design is to evaluate survival of buildings against a moderate earthquake without noticeable damage, and a major earthquake without collapsing.
In order to be well-prepared for an earthquake, the adoption and enforcement of modern building codes is a crucial factor. Building codes provide the minimum acceptable standards for regulating the design, construction and maintenance of buildings required to protect the health, safety and general welfare of residents. Modern codes are unified documents established based on scientific knowledge and engineering principles, as ratified by technical experts. Conversely, some actions should be taken to prevent future disasters. Early response to natural disasters and socio-economic vulnerabilities are cost-effective and manageable; it is time to take action. The post-disaster period is a good time to commence disaster and vulnerability reduction programs. These policies are based on two factors: public awareness and political will to enforce policies.
6. Conclusions
A new hybrid framework of ANP-ANN model was established for earthquake vulnerability assessment and applied to Tabriz City as a case study. Results demonstrate that it is a robust approach to construct a composite vulnerability index using four categories of vulnerability, including social, economic, physical, and environmental factors. The outline of the hybrid ANP-ANN model developed in this contribution is flexible, and it can be used for any urban environments with different geographical scales. In the hybrid ANP-ANN model, ANP would be conducted to extract training data for the network. This extracted training data are then entered into a network model using ANN to produce EVM. This was made possible by taking into consideration the combined strengths of two multi-criteria decision and statistical methods: (i) The ANP provided the framework, to take into consideration the hierarchical as well as network structure (interdependencies of variables) of the complex problem at hand, through which the relative and appropriate weights for the different variables selected to depict main dimensions of vulnerability were calculated; (ii) The relationship of variables in input and output datasets that is not linear could be detected through artificial neural network (ANN) modeling that uses a learning (training) process to estimate values of output variables in input data; (iii) The model validation showed that there is a strong positive relationship between the most vulnerable zones and least vulnerable zones of the EVM and PV.
The results of its application in municipality zones in Tabriz City highlight the finding that the main aspects differ greatly in terms of city’s susceptibility to earthquake hazards. The resultant EVM and its overlay with PV provides a foundation for analyzing spatial variation and identifying the hot-spots of vulnerability and pointing out zones that need more in-depth attention. The results show that the most vulnerable zones are clustered in zones 5, 4, and 1 (northeastern tract) of Tabriz City. Other zones in the rest of the city exhibit relatively low to moderate levels of earthquake vulnerability. Reviews of the development plans and master plan of the study area indicate that the expansion of Tabriz City was toward the North Tabriz Fault (NTF), and a huge volume of marginal areas and informal settlements are located in the vicinity of the fault. Unplanned construction in the form of mass-housing and lack of monitoring of constructions in informal settlements point to a lack of attention being paid to the fault risk and its consequences. Moreover, the existence of narrow passages and their irregularity in zones 5, 4, and 1, compaction of urban fabric in these zones, poor quality of buildings materials, lack of open spaces, and lack of access to relief centers have added to the critical nature of the situation. The pronounced regional variations in vulnerability to earthquake hazards in the Tabriz warrants special attention by both local authorities and the national government to reconsider current natural disaster management strategies. The ANP and ANN Models can be broadly replicated, and are applicable to other urban regions around the world for sustainability and environmental management.
Author Contributions
M.A. and I.N. designed the study, performed experiments, analysis the data, and wrote the manuscript. M.H. and B.P. and A.B.P. contributed to re-constructing and re-writing the research to the manuscript and professional optimized edition in the manuscript.
Funding
This research is supported by UTS grant number 321740.2232335.
Acknowledgments
The authors would like to express their thanks to Universiti Teknologi Malaysia for providing the funds for this project and supporting remote sensing and laboratory analysis. Department of Urban Regional Planning, Faculty of Built Environment, Universiti Teknologi Malaysia is acknowledged for providing all the facilities for this investigation. We are thankful to Korea Polar Research Institute (KOPRI) and Faculty of Engineering and Information Technology (FEIT), the University of Technology Sydney (UTS) for scientific cooperation in producing the final version of the manuscript.
Conflicts of Interest
Declare conflicts of interest or state “The authors declare no conflict of interest.”
References
- Chang, L.F.; Huang, S.L. Assessing urban flooding vulnerability with an emergy approach. Landsc. Urban Plan. 2015, 143, 11–24. [Google Scholar] [CrossRef]
- Cutter, S.L. Vulnerability to environmental hazards. Prog. Hum. Geogr. 1996, 20, 529–539. [Google Scholar] [CrossRef]
- De Andrade, M.M.N.; Claudio, F.S. Vulnerability assessment including tangible and intangible components in the index composition: An Amazon case study of flooding and flash flooding. Sci. Total Environ. 2018, 630, 903–912. [Google Scholar] [CrossRef] [PubMed]
- De Lange, H.J.; Sala, S.; Vighi, M.; Faber, J.H. Ecological vulnerability in risk assessment—A review and perspectives. Sci. Total Environ. 2010, 408, 3871–3879. [Google Scholar] [CrossRef] [PubMed]
- GLP. Science Plan and Implementation Strategy; IGBP Report No.53/IHDP Report No. 19; GLP: Stockholm, Sweden, 2005. [Google Scholar]
- Hagenlocher, M.; Renaud, F.G.; Haas, S.; Sebesvari, Z. Vulnerability and risk of deltaic social-ecological systems exposed to multiple hazards. Sci. Total Environ. 2018, 631–632, 71–80. [Google Scholar] [CrossRef] [PubMed]
- Hinkel, J. Indicators of vulnerability and adaptive capacity: Towards a clarification of the science–policy interface. Glob. Environ. Chang. 2011, 21, 198–208. [Google Scholar] [CrossRef]
- Urbanization and Global Environmental Change (UGEC). Science Plan; IHDP Report No. 15; UGEC: Bonn, Germany, 2005. [Google Scholar]
- Turner, B.L.; Kasperson, R.E.; Matson, P.A.; McCarthy, J.J.; Corell, R.W.; Christensen, L.; Eckley, N.; Kasperson, J.X.; Luers, A.; Martello, M.L.; et al. A framework for vulnerability analysis in sustainability science. Proc. Natl. Acad. Sci. USA 2003, 100, 8074–8079. [Google Scholar] [CrossRef] [PubMed]
- Wisner, B.; Blaikie, P.; Cannon, T.; Davis, I. At Risk: Natural Hazards, People’s Vulnerability, and Disasters; Routledge: London, UK, 2004. [Google Scholar]
- Rashed, T.; Weeks, J. Assessing vulnerability to earthquake hazards through spatial multicriteria analysis of urban areas. Int. J. Geogr. Inf. Sci. 2003, 17, 547–576. [Google Scholar] [CrossRef]
- Morales-Esteban, A.; Martínez-Álvarez, F.; Reyes, J. Earthquake prediction in seismogenic areas of the Iberian Peninsula based on computational intelligence. Tectonophysics 2013, 593, 121–134. [Google Scholar] [CrossRef]
- Oliveira, C.S. Seismic vulnerability of historical constructions: A contribution. Bull. Earthq. Eng. 2003, 1, 37–82. [Google Scholar] [CrossRef]
- D’Ayala, D.F.; Carriero, A.; Sabbadini, F.; Fanciullacci, D.; Ozelik, P.; Akdogan, M.; Kaya, Y. Seismic Vulnerability and Risk Assessment of Cultural Heritage Buildings in Istanbul, Turkey. In Proceedings of the 14th World Conference on Earthquake Engineering, Beijing, China, 12–17 October 2008; Volume 3. [Google Scholar]
- Bakirtas, T.; Akpolat, A.G. The relationship between energy consumption, urbanization, and economic growth in new emerging-market countries. Energy 2018, 147, 110–121. [Google Scholar] [CrossRef]
- Duzgun, H.S.B.; Yucemen, M.S.; Kalaycioglu, H.S.; Celik, K.; Kemec, S.; Ertugay, K.; Deniz, A. An integrated earthquake vulnerability assessment framework for urban areas. Nat. Hazards 2011, 59, 917–947. [Google Scholar] [CrossRef]
- He, C.; Chen, T.; Mao, X.; Zhou, Y. Economic transition, urbanization and population redistribution in China. Habitat Int. 2016, 51, 39–47. [Google Scholar] [CrossRef]
- Hendricksa, M.D.; Meyerb, M.A.; Gharaibehc, N.G.; Zandtd, S.V.; Mastersond, J.; Cooper, J.T.; Horneye, J.A.; Berked, P. The development of a participatory assessment technique for infrastructure: Neighborhood-level monitoring towards sustainable infrastructure systems. Sustain. Cities Soc. 2018, 38, 265–274. [Google Scholar] [CrossRef]
- Marrone, S.; Nardone, R.; Tedesco, A.; D’Amore, P.; Vittorini, V.; Setola, R.; De Cillis, F.; Mazzocca, N. Vulnerability modeling and analysis for critical infrastructure protection applications. Int. J. Crit. Infrastruct. Protect. 2013, 6, 217–227. [Google Scholar] [CrossRef]
- Tucker, B.E.; Trumbull, J.G.; Wyss, S.J. Some remarks concerning worldwide urban earthquake hazard and earthquake hazard mitigation. In Issues in Urban Earthquake Risk; Springer: Dordrecht, The Netherlands, 1994; pp. 1–10. [Google Scholar]
- Alarifi, A.S.; Alarifi, N.S.; Al-Humidan, S. Earthquakes magnitude predication using artificial neural network in northern Red Sea area. J. King Saud Univ. Sci. 2012, 24, 301–313. [Google Scholar] [CrossRef]
- Adeli, H.; Panakkat, A. A probabilistic neural network for earthquake magnitude prediction. Neural Netw. 2009, 22, 1018–1024. [Google Scholar] [CrossRef] [PubMed]
- Erzin, Y.; Cetin, T. The use of neural networks for the prediction of the critical factor of safety of an artificial slope subjected to earthquake forces. Sci. Iran. 2012, 19, 188–194. [Google Scholar] [CrossRef]
- Mirrashid, M. Earthquake magnitude prediction by adaptive neuro-fuzzy inference system (ANFIS) based on fuzzy C-means algorithm. Nat. Hazards 2014, 74, 1577–1593. [Google Scholar] [CrossRef]
- Moustra, M.; Avraamides, M.; Christodoulou, C. Artificial neural networks for earthquake prediction using time series magnitude data or Seismic Electric Signals. Expert Syst. Appl. 2011, 38, 15032–15039. [Google Scholar] [CrossRef]
- Prajapati, S.K.; Dadhich, H.K.; Chopra, S. Isoseismal map of the 2015 Nepal earthquake and its relationships with ground-motion parameters, distance and magnitude. J. Asian Earth Sci. 2017, 133, 24–37. [Google Scholar] [CrossRef]
- Tavakoli, B. Sensitivity of seismic hazard evaluations to uncertainties determined from seismic source characterization. J. Seismol. 2002, 6, 525–545. [Google Scholar] [CrossRef]
- Yousefi, M.; Taghikhany, T. Incorporation of directivity effect in probabilistic seismic hazard analysis and disaggregation of Tabriz city. Nat. Hazards 2014, 73, 277–301. [Google Scholar] [CrossRef]
- Zamani, A.; Sorbi, M.R.; Safavi, A.A. Application of neural network and ANFIS model for earthquake occurrence in Iran. Earth Sci. Inf. 2013, 6, 71–85. [Google Scholar] [CrossRef]
- Menoni, S. Chains of damages and failures in a metropolitan environment: Some observations on the Kobe earthquake in 1995. J. Hazard. Mater. 2001, 86, 101–119. [Google Scholar] [CrossRef]
- Giacinto, G.; Paolucci, R.; Roli, F. Application of neural networks and statistical pattern recognition algorithms to earthquake risk evaluation. Pattern Recognit. Lett. 1997, 18, 1353–1362. [Google Scholar] [CrossRef]
- Irwansyah, E.; Hartati, S. Zonation of Earthquake Building Damage Hazard Area Using Kohonen Neural Network (NN) and Kriging Algorithm. Adv. Nat. Appl. Sci. 2014, 8, 120–124. [Google Scholar]
- Karimzadeh, S.; Cakir, Z.; Osmanoğlu, B.; Schmalzle, G.; Miyajima, M.; Amiraslanzadeh, R.; Djamour, Y. Interseismic strain accumulation across the North Tabriz Fault (NW Iran) deduced from InSAR time series. J. Geodyn. 2013, 66, 53–58. [Google Scholar] [CrossRef]
- Karimzadeh, S.; Miyajima, M.; Hassanzadeh, R.; Amiraslanzadeh, R.; Kamel, B. A GIS-based seismic hazard, building vulnerability and human loss assessment for the earthquake scenario in Tabriz. Soil Dyn. Earthq. Eng. 2014, 66, 263–280. [Google Scholar] [CrossRef]
- Kappos, A.J.; Panagopoulos, G.K.; Sextos, A.G.; Papanikolaou, V.K.; Stylianidis, K.C. Development of comprehensive earthquake loss scenarios for a Greek and a Turkish city-structural aspects. Earthq. Struct. 2010, 1, 197–214. [Google Scholar] [CrossRef]
- McGowan, S.M.; Jaiswal, K.S.; Wald, D.J. Using structural damage statistics to derive macroseismic intensity within the Kathmandu valley for the 2015 M7.8 Gorkha, Nepal earthquake. Tectonophysics 2017, 714–715, 158–172. [Google Scholar] [CrossRef]
- Tavakoli, B.; Ghafory-Ashtiany, M. Seismic hazard assessment of Iran. Ann. Geophys. 1999, 42, 123–135. [Google Scholar]
- Vicente, R.; Parodi, S.; Lagomarsino, S.; Varum, H.; Silva, J.M. Seismic vulnerability and risk assessment: Case study of the historic city centre of Coimbra, Portugal. Bull. Earthq. Eng. 2011, 9, 1067–1096. [Google Scholar] [CrossRef]
- Aradag, S.; Genc, Y.; Turk, C. Comparative gasketed plate heat exchanger performance prediction with computations, experiments, correlations and artificial neural network estimations. Eng. Appl. Comput. Fluid Mech. 2017, 11, 467–482. [Google Scholar] [CrossRef]
- Taormina, R.; Chau, K.W.; Sivakumar, B. Neural network river forecasting through baseflow separation and binary-coded swarm optimization. J. Hydrol. 2015, 529, 1788–1797. [Google Scholar] [CrossRef]
- Hajihassani, M.; Armaghani, D.J.; Marto, A.; Mohamad, E.T. Ground vibration prediction in quarry blasting through an artificial neural network optimized by imperialist competitive algorithm. Bull. Eng. Geol. Environ. 2015, 74, 873–886. [Google Scholar] [CrossRef]
- Chau, K.W. Reliability and performance-based design by artificial neural network. Adv. Eng. Softw. 2007, 38, 145–149. [Google Scholar] [CrossRef]
- Gordan, B.; Armaghani, D.J.; Hajihassani, M.; Monjezi, M. Prediction of seismic slope stability through combination of particle swarm optimization and neural network. Eng. Comput. 2016, 32, 85–97. [Google Scholar] [CrossRef]
- Hinton, G.E. How neural networks learn from experience. Sci. Am. 1992, 267, 145–151. [Google Scholar] [CrossRef]
- Jensen, B. Expert systems-neural networks. In Instrument Engineers’ Handbook, 3rd ed.; Chilton: Radnor, PA, USA, 1994. [Google Scholar]
- Bishop, C.M. Neural Networks for Pattern Recognition; Oxford University Press: Oxford, UK, 1995. [Google Scholar]
- Liang, Z.; Shan, S.; Liu, X.; Wen, Y. Fuzzy prediction of AWJ turbulence characteristics by using typical multi-phase flow models. Eng. Appl. Comput. Fluid Mech. 2017, 11, 225–257. [Google Scholar] [CrossRef]
- Islam, M.S.; Mohandes, M.; Rehman, S. Vertical extrapolation of wind speed using artificial neural network hybrid system. Neural Comput. Appl. 2017, 28, 2351–2361. [Google Scholar] [CrossRef]
- Sharma, M.; Purohit, G.N.; Mukherjee, S. Information Retrieves from Brain MRI Images for Tumor Detection Using Hybrid Technique K-means and Artificial Neural Network (KMANN). In Networking Communication and Data Knowledge Engineering; Springer: Singapore, 2018; pp. 145–157. [Google Scholar]
- Haykin, S. Multilayer perceptrons. Neural Netw. 1999, 2, 156–255. [Google Scholar]
- Lee, S.; Ryu, J.H.; Lee, M.J.; Won, J.S. Use of an artificial neural network for analysis of the susceptibility to landslides at Boun, Korea. Environ. Geol. 2003, 44, 820–833. [Google Scholar] [CrossRef]
- Lee, S.; Ryu, J.H.; Won, J.S.; Park, H.J. Determination and application of the weights for landslide susceptibility mapping using an artificial neural network. Eng. Geol. 2004, 71, 289–302. [Google Scholar] [CrossRef]
- Field, E. Urban Property Rights and Labor Supply in Peru. Q. J. Econ. 2007, 122, 1561–1602. [Google Scholar] [CrossRef]
- Mili, R.R.; Hosseini, K.A.; Izadkhah, Y.O. Developing a holistic model for earthquake risk assessment and disaster management interventions in urban fabrics. Int. J. Disaster Risk Reduct. 2018, 27, 355–365. [Google Scholar] [CrossRef]
- Bahadori, H.; Hasheminezhad, A.; Karimi, A. Development of an integrated model for seismic vulnerability assessment of residential buildings: Application to Mahabad City, Iran. J. Build. Eng. 2017, 12, 118–131. [Google Scholar] [CrossRef]
- Zhang, Y.; van den Berg, A.E.; Dijk, T.V.; Weitkamp, G. Quality over Quantity: Contribution of Urban Green Space to Neighborhood Satisfaction. Int. J. Environ. Res. Public Health 2017, 14, 535. [Google Scholar] [CrossRef] [PubMed]
- Karimzadeh, S.; Kadas, K.; Askan, A.; Erberik, M.A.; Yakut, A. A study on fragility analyses of masonry buildings in Erzincan (Turkey) utilizing simulated and real ground motion records. Procedia Eng. 2017, 199, 188–193. [Google Scholar] [CrossRef]
- Armas, I.; Toma-Danila, D.; Ionescu, R.; Gavirs, A. Vulnerability to Earthquake Hazard: Bucharest Case Study, Romania. Int. J. Disaster Risk Sci. 2017, 8, 182–192. [Google Scholar] [CrossRef]
- Zebardast, E. Constructing a social vulnerability index to earthquake hazards using a hybrid factor analysis and analytic network process (F’ANP) model. Nat. Hazards 2013, 65, 1331–1359. [Google Scholar] [CrossRef]
- Pradhan, B.; Lee, S. Landslide risk analysis using artificial neural network model focussing on different training sites. Int. J. Phys. Sci. 2009, 4, 1–15. [Google Scholar]
- Panakkat, A.; Adeli, H. Recurrent neural network for approximate earthquake time and location prediction using multiple seismicity indicators. Comput. Aided Civ. Infrastruct. Eng. 2009, 24, 280–292. [Google Scholar] [CrossRef]
- Ghayamghamian, M.R.; Rajool, A. Long-period Ground Motion Simulation for NTF Fault Near-source energy released. In Proceedings of the Fifteenth World Conference on Earthquake Engineering, Lisbon, Portugal, 23–25 March 2012. [Google Scholar]
- Berberian, M. Contribution to the Seismotectonics of Iran (Part II–III): In Commemoration of the 50th Anniversary of the Pahlavi Dynasty; No. 39; Ministry of Industry and Mines, Geological Survey of Iran, Tectonic and Seismotectonic Section: Tehran, Iran, 1976. [Google Scholar]
- Jackson, J. Partitioning of strike-slip and convergent motion between Eurasia and Arabia in eastern Turkey and the Caucasus. J. Geophys. Res. Solid Earth 1992, 97, 12471–12479. [Google Scholar] [CrossRef]
- Wilson, A. Earthquakes in Persia. Bull. Sch. Orient. Stud. Lond. Inst 1930, 6, 103–131. [Google Scholar] [CrossRef]
- Wu, Q.; Ye, S.; Wu, X.; Chen, P. Risk assessment of earth fractures by constructing an intrinsic vulnerability map, a specific vulnerability map, and a hazard map, using Yuci City, Shanxi, China as an example. Environ. Geol. 2004, 46, 104–112. [Google Scholar] [CrossRef]
- Kurttila, M.; Pesonen, M.; Kangas, J.; Kajanus, M. Utilizing the analytic hierarchy process (AHP) in SWOT analysis—A hybrid method and its application to a forest-certification case. For. Policy Econ. 2000, 1, 41–52. [Google Scholar] [CrossRef]
- Kometa, S.T.; Olomolaiye, P.; Harris, F.C. Validation of the model for evaluating client-generated risk by project consultants. Constr. Manag. Econ. 1996, 14, 131–145. [Google Scholar] [CrossRef]
- Shash, A.A.; Abdul-Hadi, H.N. The effect of contractor size on mark-up size decision in Saudi Arabia. Constr. Manag. Econ. 1993, 11, 421–429. [Google Scholar] [CrossRef]
- Adeoye, D.O. Challenges of Urban Housing Quality: Insights and Experiences of Akure, Nigeria. Procedia Soc. Behav. Sci. 2016, 216, 260–268. [Google Scholar] [CrossRef]
- ESRI. Arc GIS Network Analyst Routing, Closest Facility, and Service Area Analysis; ESRI: Redlands, CA, USA, 2005. [Google Scholar]
- Sandi, H. Vulnerability and risk analysis for individual structures and systems. In Proceedings of the 8th European Conference on Earthquake Engineering, Lisbon, Portugal, 7–12 September 1986; pp. 11–60. [Google Scholar]
- Bahrainy, H. Natural disaster management in Iran during the 1990s-need for a new structure. J. Urban Plan. Dev. 2003, 129, 140–160. [Google Scholar] [CrossRef]
- Văcăreanu, R.; Cornea, T.; Lungu, D. Evaluarea comportãrii structurale si a ulnerabilitãtii seismice folosind metodologiile HAZUS si ATC-40 modificat. In A doua Conferintã Nationalã de Inginerie Seismicã; Technical University of Civil Engineering of Bucharest Press: Bucharest, Romania, 2001; Volume 2, pp. 2–16. [Google Scholar]
- Cutter, S.L.; Mitchell, J.T.; Scott, M.S. Revealing the vulnerability of people and places: A case study of Georgetown County, South Carolina. Ann. Assoc. Am. Geogr. 2000, 90, 713–737. [Google Scholar] [CrossRef]
- Cutter, S.L.; Boruff, B.J.; Shirley, W.L. Social vulnerability to environmental hazards. Soc. Sci. Q. 2003, 84, 242–261. [Google Scholar] [CrossRef]
- Cutter, S.L.; Finch, C. Temporal and spatial changes in social vulnerability to natural hazards. Proc. Natl. Acad. Sci. USA 2008, 105, 2301–2306. [Google Scholar] [CrossRef] [PubMed]
- Ebert, A.; Kerle, N.; Stein, A. Urban social vulnerability assessment with physical proxies and spatial metrics derived from air-and spaceborne imagery and GIS data. Nat. Hazards 2009, 48, 275–294. [Google Scholar] [CrossRef]
- Alinia, H.S.; Delavar, M. Tehran’s seismic vulnerability classification using granular computing approach. Appl. Geomat. 2011, 3, 229–240. [Google Scholar] [CrossRef]
- Yildiz, S.; Karaman, H. Post-earthquake ignition vulnerability assessment of Küçükçekmece District. Nat. Hazards Earth Syst. Sci. 2013, 13, 3357–3368. [Google Scholar] [CrossRef]
- Panahi, M.; Rezaie, F.; Meshkani, S.A. Seismic vulnerability assessment of Atmospheric Open Access Atmospheric Measurement school buildings in Tehran city based on Techniques Open Access Discussions AHP and GIS. Nat. Hazards Earth Syst. Sci. 2013, 14, 4511–4538. [Google Scholar] [CrossRef]
- Zaharia, B.; Radulian, M.; Popa, M.; Grecu, B.; Bala, A.; Tataru, D. Estimation of the local response using Nakamura method for Bucharest area. Roman. Rep. Phys. 2008, 60, 131–144. [Google Scholar]
- Tate, E. Social vulnerability indices: A comparative assessment using uncertainty and sensitivity analysis. Nat. Hazards 2012, 63, 325–347. [Google Scholar] [CrossRef]
- Bakhtiari, A. Country Report: The Islamic Republic of Iran on Disaster Risk Management; Iranian National Disaster Management Organization (NDMO) and Visiting Researcher at ADRC: Kobe, Japan, 2014. [Google Scholar]
- Rezaie, F.; Panahi, M. GIS modeling of seismic vulnerability of residential fabrics considering geotechnical, structural, social and physical distance indicators in Tehran using multi-criteria decision-making techniques. Nat. Hazards Earth Syst. Sci. 2015, 15, 461–474. [Google Scholar] [CrossRef]
- Holand, I.S.; Lujala, P.; Rød, J.K. Social vulnerability assessment for Norway: A quantitative approach. Norsk Geografisk Tidsskrift-Norwegian J. Geogr. 2011, 65, 1–17. [Google Scholar] [CrossRef]
- Armaș, I.; Gavriș, A. Social vulnerability assessment using spatial multi-criteria analysis (SEVI model) and the Social Vulnerability Index (SoVI model)—A case study for Bucharest, Romania. Nat. Hazards Earth Syst. Sci. 2013, 13, 1481–1499. [Google Scholar] [CrossRef]
- Binita, K.; Shepherd, J.M.; Gaither, C.J. Climate change vulnerability assessment in Georgia. Appl. Geogr. 2015, 62, 62–74. [Google Scholar]
- Brooks, N.; Adger, W.N.; Kelly, P.M. The determinants of vulnerability and adaptive capacity at the national level and the implications for adaptation. Glob. Environ. Chang. 2005, 15, 151–163. [Google Scholar] [CrossRef]
- Martins, V.N.; e Silva, D.S.; Cabral, P. Social vulnerability assessment to seismic risk using multicriteria analysis: The case study of Vila Franca do Campo (Sao Miguel Island, Azores, Portugal). Nat. Hazards 2012, 62, 385–404. [Google Scholar] [CrossRef]
- Peng, Y. Regional earthquake vulnerability assessment using a combination of MCDM methods. Ann. Oper. Res. 2015, 234, 95–110. [Google Scholar] [CrossRef]
- Asadzadeh, A.; Kötter, T.; Zebardast, E. An augmented approach for measurement of disaster resilience using connective factor analysis and analytic network process (F’ANP) model. Int. J. Disaster Risk Reduct. 2015, 14, 504–518. [Google Scholar] [CrossRef]
- Beck, E.; André-Poyaud, I.; Davoine, P.-A.; Chardonnel, S.; Lutoff, C. Risk perception and social vulnerability to earthquakes in Grenoble (French Alps). J. Risk Res. 2012, 15, 1245–1260. [Google Scholar] [CrossRef]
- Eakin, H.; Bojorquez-Tapia, L.A. Insights into the composition of household vulnerability from multicriteria decision analysis. Glob. Environ. Chang. 2008, 18, 112–127. [Google Scholar] [CrossRef]
- Lungu, D.; Aldea, A.; Arion, C.; Cornea, T.; Vacareanu, R. European distinctive features inventory database and typology. In Proceedings of the International Conference Earthquake Loss Estimation and Risk Reduction 2004, Bucuresti, Romania, 24–26 October 2004; Volume 2, pp. 251–272. [Google Scholar]
- Tanaka, K. The impact of disaster education on public preparation and mitigation for earthquakes: A cross-country comparison between Fukui, Japan and the San Francisco Bay Area, California, USA. Appl. Geogr. 2005, 25, 201–225. [Google Scholar] [CrossRef]
- Sarris, A.; Loupasakis, C.; Soupios, P.; Trigkas, V.; Vallianatos, F. Earthquake vulnerability and seismic risk assessment of urban areas in high seismic regions: Application to Chania City, Crete Island, Greece. Nat. Hazards 2010, 54, 395–412. [Google Scholar] [CrossRef]
- Debnath, R. An assessment of spatio-temporal pattern of urban earthquake vulnerability using GIS: A study on Dhaka City. Ann. GIS 2013, 19, 63–78. [Google Scholar] [CrossRef]
- Armaş, I. Earthquake risk perception in Bucharest, Romania. Risk Anal. 2006, 26, 1223–1234. [Google Scholar] [CrossRef] [PubMed]
- Armaş, I. Social vulnerability and seismic risk perception. Case study: The historic center of the Bucharest Municipality/Romania. Nat. Hazards 2008, 47, 397–410. [Google Scholar] [CrossRef]
- Armaş, I.; Avram, E. Perception of flood risk in Danube Delta, Romania. Nat. Hazards 2009, 50, 269–287. [Google Scholar] [CrossRef]
- Armaş, I. Multi-criteria vulnerability analysis to earthquake hazard of Bucharest, Romania. Nat. Hazards 2012, 63, 1129–1156. [Google Scholar] [CrossRef]
- Armaş, I.; Ionescu, R.; Garivs, A.; Toma-Danila, D. Identifying seismic vulnerability hotspots in Bucharest. Appl. Geogr. 2016, 77, 49–63. [Google Scholar] [CrossRef]
- Ma, J.; Qin, S. Automatic depicting algorithm of earthquake collapsed buildings with airborne high resolution image. In Proceedings of the IEEE International Geoscience and Remote Sensing Symposium, Munich, Germany, 22–27 March 2012; pp. 939–942. [Google Scholar]
- Hizbaron, D.R.; Baiquni, M.; Sartohadi, J.; Rijanta, R. Urban Vulnerability in Bantul District, Indonesia—Towards Safer and Sustainable Development. Sustainability 2012, 4, 2022–2037. [Google Scholar] [CrossRef]
- Toro, J.; Duarte, O.; Requena, I.; Zamorano, M. Determining vulnerability importance in environmental impact assessment: The case of Colombia. Environ. Impact Assess. Rev. 2012, 32, 107–117. [Google Scholar] [CrossRef]
- Davidson, R.A.; Shah, H.C. An Urban Earthquake Disaster Risk Index; Blume, J.H., Ed.; Standford University, Earthquake Engineering Center: Standford, CA, USA, 1997. [Google Scholar]
- Davidson, D.J.; Freudenburg, W.R. Gender and environmental risk concern a review and analysis of available research. Environ. Behav. 1996, 28, 302–339. [Google Scholar] [CrossRef]
- Krishnamurthy, P.K.; Krishnamurthy, L. Social Vulnerability Assessment through GIS Techniques: A Case Study of Flood Risk Mapping in Mexico. In Geospatial Techniques for Managing Environmental Resources; Springer: Dordrecht, The Netherlands, 2011; pp. 276–291. [Google Scholar]
- Shepard, C.C.; Agostini, V.N.; Gilmer, B.; Allen, T.; Stone, J.; Brooks, W.; Beck, M.W. Assessing future risk: Quantifying the effects of sea level rise on storm surge risk for the southern shores of Long Island, New York. Nat. Hazards 2012, 60, 727–745. [Google Scholar] [CrossRef]
- Granger, K.; Jones, T.G.; Leiba, M.; Scott, G. Community Risk in Cairns: A Multi-Hazard Risk Assessment; Australian Geological Survey Organisation: Canberra, Australian, 1999; pp. 678–689.
- King, D.; MacGregor, C. Using social indicators to measure community vulnerability to natural hazards. Aust. J. Emerg. Manag. 2000, 15, 52–67. [Google Scholar]
- Saaty, T.L. Analytical Network Process; RWS Publications: Pittsburgh, PA, USA, 1996. [Google Scholar]
- Marasco, A. Third-party logistics: A literature review. Int. J. Prod. Econ. 2008, 113, 127–147. [Google Scholar] [CrossRef]
- Chung, S.H.; Lee, A.H.I.; Pearn, W.L. Analytic network process (ANP) approach for product mix planning in semiconductor fabricator. Int. J. Prod. Econ. 2005, 96, 15–36. [Google Scholar] [CrossRef]
- Bojórquez, E.; Bojórquez, J.; Ruiz, S.E.; Reyes-Salazar, A. Prediction of inelastic response spectra using artificial neural networks. Math. Probl. Eng. 2012, 34, 236–248. [Google Scholar] [CrossRef]
- Cheng, J.; Li, Q.S. Reliability analysis of structures using artificial neural network based genetic algorithms. Comput. Methods Appl. Mech. Eng. 2008, 197, 3742–3750. [Google Scholar] [CrossRef]
- Günaydın, K.; Günaydın, A. Peak ground acceleration prediction by artificial neural networks for northwestern Turkey. Math. Probl. Eng. 2008, 2008, 919420. [Google Scholar] [CrossRef]
- Ergu, D.; Kou, G.; Shi, Y.; Shi, Y. Analytic network process in risk assessment and decision analysis. Comput. Oper. Res. 2014, 42, 58–74. [Google Scholar] [CrossRef]
- Meade, L.M.; Sarkis, J. Analyzing organizational project alternatives for agile manufacturing processes: An analytical network approach. Int. J. Prod. Res. 1999, 37, 241–261. [Google Scholar] [CrossRef]
- Lee, H.; Kim, M.S.; Park, Y. An analytic network process approach to operationalization of five forces model. Appl. Math. Model. 2012, 36, 1783–1795. [Google Scholar] [CrossRef]
- Sahoo, S.; Dhar, A.; Kar, A. Environmental vulnerability assessment using Grey Analytic Hierarchy Process based model. Environ. Impact Assess. Rev. 2016, 56, 145–154. [Google Scholar] [CrossRef]
- Antanasijević, D.Z.; Pocajt, V.V.; Povrenović, D.S.; Ristić, M.Đ.; Perić-Grujić, A.A. PM 10 emission forecasting using artificial neural networks and genetic algorithm input variable optimization. Sci. Total Environ. 2013, 443, 511–519. [Google Scholar] [CrossRef] [PubMed]
- Nedic, V.; Despotovic, D.; Cvetanovic, S.; Despotovic, M.; Babic, S. Comparison of classical statistical methods and artificial neural network in traffic noise prediction. Environ. Impact Assess. Rev. 2014, 49, 24–30. [Google Scholar] [CrossRef]
- Hagan, M.T.; Demuth, H.B.; Beale, M. Neural Network Design; PWS Pub.: Boston, MA, USA, 1996. [Google Scholar]
- Paola, J.D.; Schowengerdt, R.A. A review and analysis of backpropagation neural networks for classification of remotely-sensed multi-spectral imagery. Int. J. Remote Sens. 1995, 16, 3033–3058. [Google Scholar] [CrossRef]
- Atkinson, P.M.; Tatnall, A.R.L. Introduction neural networks in remote sensing. Int. J. Remote Sens. 1997, 18, 699–709. [Google Scholar] [CrossRef]
- Gong, P. Integrated analysis of spatial data for multiple sources: Using evidential reasoning and artificial neural network techniques for geological mapping. Photogramm. Eng. Remote Sens. 1996, 62, 513–523. [Google Scholar]
- Abraham, A. Artificial neural networks. In Handbook of Measuring System Design; Wiley: Chichester, UK, 2005. [Google Scholar]
- Pradhan, B.; Lee, S. Regional landslide susceptibility analysis using back-propagation neural network model at Cameron Highland, Malaysia. Landslides 2010, 7, 13–30. [Google Scholar] [CrossRef]
- Cardona, O.D.; van Aalst, M.K.; Birkmann, J.; Fordham, M.; McGregor, G.; Mechler, R. Determinants of Risk: Exposure and Vulnerability; Cambridge University Press: Cambridge, UK, 2012; pp. 54–76. [Google Scholar]
- Pelling, M.; Wisner, B. Disaster Risk Reduction: Cases from Urban Africa; Routledge: London, UK, 2012. [Google Scholar]
- Villegas-González, P.A.; Ramos-Cañón, A.M.; González-Méndez, M.; González-Salazar, R.E.; De Plaza-Solórzano, J.S. Territorial vulnerability assessment frame in Colombia: Disaster risk management. Int. J. Disaster Risk Reduct. 2017, 21, 384–395. [Google Scholar] [CrossRef]
- Steinführer, A. Social Vulnerability and the 2002 Flood; Country Report Germany (Mulde River); Helmholz Unweltforschungszentrum (UFZ): Berlin, Germany, 2007. [Google Scholar]


© 2018 by the authors. Licensee MDPI, Basel, Switzerland. This article is an open access article distributed under the terms and conditions of the Creative Commons Attribution (CC BY) license (http://creativecommons.org/licenses/by/4.0/).