Abstract
China is one of the countries with the most abundant bamboo forest resources in the world, and Zhejiang province is among the top-3 Chinese provinces with richest bamboo forests. For rational bamboo forests management, it is of great significance to study the spatiotemporal dynamic changes of Aboveground Carbon (AGC) stocks of bamboo forest in Zhejiang. In this study, remote sensing variables, such as spectral, vegetation indices and texture features of bamboo forest in Zhejiang, were extracted from 32 Landsat TM and OLI images got from four different years (2000, 2004, 2008 and 2014). These variables were subsequently selected with stepwise regression method to build an estimation model of AGC of the bamboo forests. The results showed that (1) the accuracy of bamboo forest remote sensing information extracted from the four different years was high with a classification accuracy of >76.26% and an accuracy of users of >91.62%. The classification area of bamboo forest was highly consistent with the area from forest resource inventory, and the area accuracy was over 96.50%; (2) the estimation model performed well in predicting the AGC in Zhejiang for different years. The correlation coefficient for estimated and measured AGC was between 63% and 72% with low root mean square error; (3) the derived AGC of the bamboo forests in Zhejiang province increased gradually from 2000 to 2014, with the AGC density of 6.75 Mg·ha−1, 10.95 Mg·ha−1, 15.25 Mg·ha−1 and 19.07 Mg·ha−1 respectively, and the average annual growth of 0.88 Mg·ha−1. The spatiotemporal evolution of bamboo forest AGC in Zhejiang province had a close relationship with the gradual expansion of bamboo forest in the province and the differentiation of management levels in different regions.
1. Introduction
Bamboos are naturally distributed in the tropical, subtropical and temperate regions of all the continents except Europe and western Asia, from lowland up to 4000 m in altitude [1], and mainly in Asia [2,3,4,5,6,7]. China locates in the center of world’s bamboo distribution area, and is the most important bamboo industry country in the world. Bamboo area in China reached 6.01 million hectares, accounting for approximately 20% of the total area of bamboo forests in the world [8]. Zhejiang, locating in the middle-east of China, has more than 0.9 million hectares of bamboo forest, being one of the top-3 Chinese provinces with richest bamboo forest resource. Such abundant bamboo forest resources in Zhejiang is mainly attributed to high level of management and developed bamboo industry. Therefore, it is said that “World bamboo forests focus on China, and Chinese bamboo forests focus on Zhejiang”.
Bamboo forest is an important part of subtropical ecosystem. Previous studies reported that bamboo forest, e.g., Moso Bamboo, has higher carbon dioxide sequestration than other subtropical forests [7,9]. With much effort focused on estimating carbon stocks of bamboo forest [10,11,12,13,14,15,16,17,18,19], it has showed that bamboo forest played an important role in coping with climate change [20,21,22,23,24,25,26].
Remote sensing data has been widely used for estimates of AGC in forests [27,28,29,30,31], and in recent years, high-resolution satellite imageries were used due to the development of technologies [32,33,34,35,36,37,38,39], e.g., the multi-resolution remote sensing imagery satellites [40,41,42,43,44,45]. Although the application of high spatial and spectral resolution sensors succeed in AGC estimation, there are still limitations such as high acquisition costs, small area coverage, multicollinearity, limited availability and a narrow bandwidth [46]. The above limitations lead to more workload and lower efficiency in estimating AGC of large-scale forest. Researches of the spatiotemporal evolution and the carbon storage estimation of bamboo forest by using medium-resolution remote sensing data has achieved plenteous results [47,48,49,50,51,52]. Meanwhile, algorithms for estimating carbon stocks/biomass based on remote sensing data have also been developed. In early studies, carbon stocks/biomass estimation was mostly conducted with linear or nonlinear regression models. For example, Anaya et al. [53] constructed a linear model using enhanced vegetation index (EVI) and related characteristics to estimate AGC in different vegetation types. Du et al. [49] used Partial Least Squares (PLS) method to estimate the carbon storage of bamboo forest in Anji County. Xu et al. [54] estimated the carbon storage of Phyllostachys praecox using the PLS regression. In recent years, machine learning algorithms have been widely used not only for inversion of land use changes but also for carbon storage estimation. Zhou et al. [26] used the K-Nearest Neighbor (KNN) method to estimate carbon storage in bamboo forests. Vafaei et al. [41] used Random Forests (RF), Support Vector Regression (SVR), Multi-Layer Perceptron Neural Networks (MPL Neural Net) and Gaussian Processes (GP) methods to estimate the forest AGC, and proved high accuracy of the methods. Gao et al. [55] combined Artificial Neural Network (ANN), SVR, RF, KNN, and Linear Regression (LR) methods to estimate forest AGC.
However, the previous studies mainly focused on small-scale area e.g., protected areas and countries. Estimation of spatiotemporal variation of bamboo forest carbon stocks on a large scale is of great significance for understanding the function of bamboo forest on climate change. In this study, we took Zhejiang province as a case study to establish AGC models of bamboo forest using the remote sensing information from Landsat5 TM and Landsat8 OLI data. The spatiotemporal dynamics of bamboo AGC was estimated and analyzed based on the extraction of spatial and temporal distribution of bamboo forests in four years (2000, 2004, 2008 and 2014) in Zhejiang Province. The study aimed at providing an insight into the spatiotemporal dynamics of bamboo forest carbon stocks in a long-time series at a national or global scale.
2. Materials and Methods
2.1. Study Area
Zhejiang province (Figure 1) is located in south of Yangtze River Delta in southeast coast, China (118–123°E and 27–31°N). Under subtropical monsoon climate, it has clearly demarcated seasons, suitable temperature with abundant rainfall. The annual mean temperature for Zhejiang is between 15 °C to 18 °C, and the annual precipitation varies in a range of 980–2000 mm. Zhejiang province has a rich forest resource, covering approximately 6.06 million hectares of forest land, 0.9 million hectares of which are occupied by bamboo forest [56]. Moso bamboo forest accounted for 87.22% of the total bamboo forest area, with 0.79 million hectares [57].
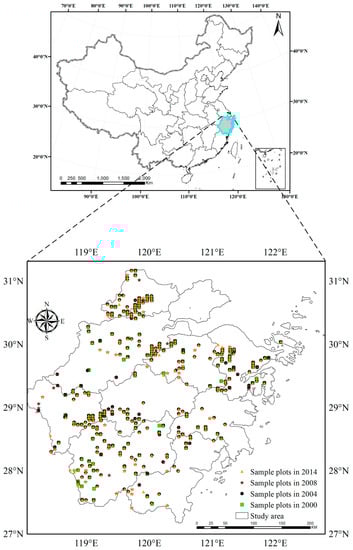
Figure 1.
Study area and location of bamboo forest carbon storage sample plots.
2.2. Dataset and Landsat TM Image Preprocessing
In this study, we selected 8 scene remote sensing images per year (2000, 2004, 2008 and 2014), and each of these 32 images covered the whole province (Table 1). In order to reduce the influence of acquisition time, vegetation spectral reflectance, cloud thickness and other factors on classification results, we selected the images with cloud cover below 10%, smallest observational zenith angle, and consistent time interval.

Table 1.
Acquisition date of the image data sets.
We used the FLAASH method to make atmospheric correction for each image, with consideration of eliminating two major kinds of influence factors: (1) those such as water vapor, aerosol, bidirectional reflection and data transmission, which may influence the trend analysis and information extraction in time series [58,59]; and (2) the radiation difference between multi-temporal remote sensing data. Then, the corrected images were furtherly geometrically corrected using ground control points (GCPs) to splice the remote sensing data of Zhejiang Province [60].
2.3. Mapping of Bamboo
In this study, land use was classified into six types: bamboo, broad-leaved forest, coniferous forest, farmland, barren land, and water bodies [61]. Based on the fifth to eighth forest resource inventories (1994–1998, 1999–2003, 2004–2008 and 2009–2013) in Zhejiang Province, the spectral reflectance characteristics of samples were used to select Regions of Interest (ROIs) as the training samples for maximum likelihood classification based on visual interpretation, and the sampling data that derived from the continuous forest resource inventory data of Zhejiang Province, were used to validate the classification results. Table 2 shows the numbers of validation samples for bamboo, broad-leaved forest, coniferous forest, farmland, barren land and water bodies indifferent years.
Table 2.
Validation samples in different years.
2.4. AGC Estimation
As bamboo forest was dominated by Moso bamboo in Zhejiang province, the Moso bamboo sample plots were used for spatiotemporal estimation of carbon stocks on bamboo forest from 2000 to 2014 in this study. The numbers of bamboo forest plots were 137, 189, 203 and 139, respectively (Figure 1). Above Ground Biomass (AGB) of individual Moso bamboo was calculated based on the Equation (1) [62]:
where M, D, and A denote AGB (dry weight in Kg), DBH (cm), and age (du), respectively. For each plot, the AGB is a sum of all individual Moso bamboo AGB within the plot, and the expansion factor for the conversion from biomass to carbon for Moso bamboo forestis 0.5042 [9].
2.5. Construction of Estimation Model for Carbon Storage of Bamboo Forest
2.5.1. Setting of Remote Sensing Variables
The variables of bamboo forest AGC model consisted of three types, i.e., original band combinations, vegetation indices and band texture (Table 3). Five different window sizes (3 × 3, 5 × 5, 7 × 7, 9 × 9, and 11 × 11) were set for calculation of texture variables. Due to different numbers between Landsat5 and Landsat8 bands, the number of variables was 250 in 2000, 2004 and 2008, while 290 in 2014. When the sample plot coordinates were matched with the pixel values of remote sensing variables, they might not fully matched with each other due to geometric correction and positioning error. In order to reduce the matching error, a window size of 3 × 3 pixels was used to extract the mean values of the selected remote sensing variables for each plot [63,64,65,66].
Table 3.
Information of remote sensing variables.
2.5.2. Method of Model Construction
Stepwise regression screening variables method, one of the most widely used methods in regression models [67,68], was used to establish a remote sensing information model of AGC in bamboo forests. 70% of the sample plots were randomly selected for developing the model, and the others for evaluating the established model. AGC may have high or weak relationships with remote sensing variables. Because of the strong correlations among some explanatory variables, it was critical to eliminate the variables that have a high correlation between themselves and nonsignificant correlations between variables and AGC [55,69]. The advantage of stepwise regression is to determine the importance of explanatory variables and eliminate the influence of collinearity on accuracy of models. Correlation analysis can be used to examine the relationship between AGB and remote sensing variables. The basic idea of stepwise regression is to introduce the variables one by one into the model. After each of the explanatory variables was introduced, the F-test must be conducted and the explanatory variables that have been selected must be t-test one by one. When the originally introduced explanatory variable becomes less significant due to the introduction of later explanatory variables, it was deleted to ensure that the regression equation contained only significant variables before each new variable was introduced. The process did not stopped until there was no significant explanatory variable to choose the regression equation, and no significant explanatory variables were excluded from the regression equation. After applying stepwise regression, the obtained explanatory variables were optimal, and there was no serious collinearity among variables.
2.5.3. Model Evaluation
The model evaluation indexes mainly included Relative Error (RE), Mean Relative Error (MRE) and root mean square error (RMSE), as well as the analysis and evaluation of the extreme values of the model predictive value. Formulas were listed as follows, where i represents the ith sample:
where represent the observed AGC of the ith sample, represent the predicted AGC of the ith sample, n represent the number of sample, respectively.
3. Results
3.1. Spatiotemporal Distribution of Bamboo
The accuracies of bamboo forest remote sensing information extraction in 2000, 2004, 2008 and 2014 are shown in Table 4. Table 4 shows that the overall accuracy of land use types at different times is above 76.26%, kappa coefficient is higher than 0.75. The overall classification accuracy is high. Producer’s accuracy of bamboo forest is above 75.86%, and the user’s accuracy is above 91.62%. In addition, the accuracy of area extraction is over 96.50%, which is a satisfying result according to the actual area of the forest management inventory. Figure 2 shows the spatial distribution of bamboo forests in Zhejiang Province. According to Figure 2, the area of bamboo forests in Zhejiang Province showed a gradually increasing trend in time and space from the year of 2000 to 2014.
Table 4.
Accuracy of classification and bamboo forest extraction in Zhejiang Province.
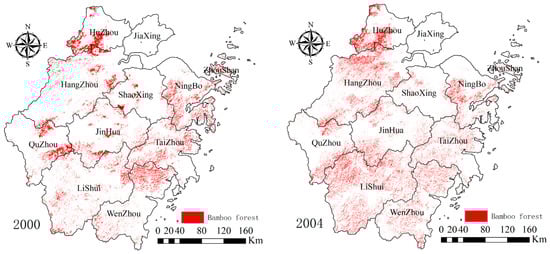
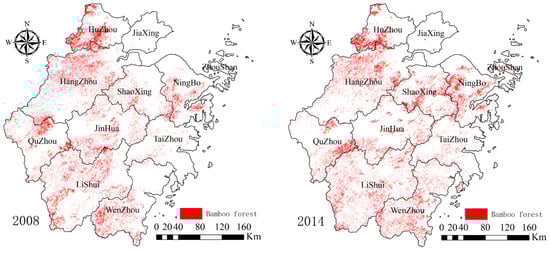
Figure 2.
The bamboo forest information extraction in different years throughout Zhejiang Province.
Based on the time-series Landsat data, the distribution information of bamboo forests in Zhejiang Province was extracted, which exhibited high accuracies in terms of both classification results and area statistics. The spatiotemporal distribution characteristics of bamboo forests are consistent with the actual situation, which provide a more accurate data.
3.2. AGC Model of Bamboo
Estimation models of AGC from the year of 2000 to 2014 were obtained by the stepwise regression method (Formulas (5)–(8)):
AGC model of 2000:
AGC model of 2004:
AGC model of 2008:
AGC model of 2014:
Here, C is bamboo carbon storage; Wi for texture window, i = 3, 5, 7, 9, 11; bi is i band, i = 1, 2, …, 7, and the band 7 was unique for 2014.
3.3. Accuracy Assessment of AGC Model
Figure 3 shows the correlation between the predicted AGC and the observed AGC for the model. All of the correlation coefficients R of training and testing data values range from 0.63 to 0.72 in different years (Figure 3; p < 0.01), and Mean Relative Error (MRE) is less than 0.377, and the highest accuracy of the AGB model was achieved in the year of 2014 (R = 0.72, RMSE = 2.9, MRE = 0.314). Both the model accuracy and the verifying accuracy pointed to good performance of the models.
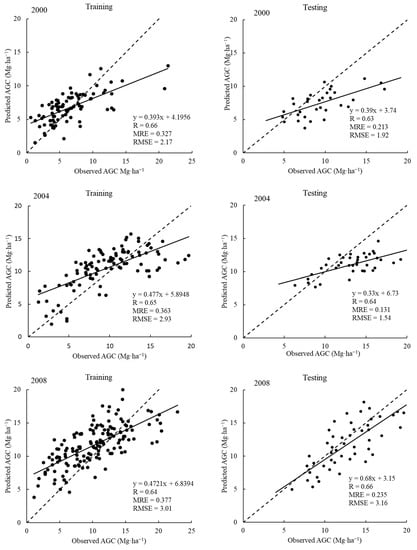
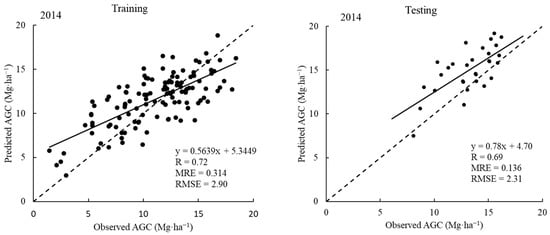
Figure 3.
Relationship between Observed AGC and Predicted AGC in different years (significance at the 0.01 level).
Further analysis were statistics of model predicting ability (Table 5). According to the model predicted value, (1) the maximum, minimum and average value of model predicted value exhibited increasing trends over time from 2000 to 2014. As the economic benefit increasing of bamboo forest, and the management level of bamboo forests in Zhejiang Province has been improved year by year. Meanwhile, the biomass has also increased [70,71]. Therefore, the predicted value of AGC maximum, minimum and mean value are consistent with the actual situation; (2) Predicted STD and MRE value of bamboo forest AGC are relatively stable from 2.2 to 2.9, which indicates that the model is stable and has good performance in predicting the spatiotemporal distribution of AGC in bamboo forest.
Table 5.
Statistical analysis of the model prediction and residual.
3.4. AGC Spatiotemporal Evolution of Bamboo Forest
According to the AGC model of bamboo forest in Zhejiang Province, the spatial distribution of AGC in different periods from 2000 to 2014 is shown in Figure 4. As is known, the carbon density of bamboo Zhejiang province has been continuously increasing over time, especially in Hangzhou, Shaoxing, Quzhou, Ningbo, Lishui, Jinhua, and Wenzhou. Table 6 shows the statistical results of bamboo forest AGC at different periods in 11 cities of Zhejiang. According to the statistics, the carbon density in Zhejiang Province increased from 6.75 Mg·ha−1 in 2000 to 19.07 Mg·ha−1 in 2014, with a growth rate of 182.52%. Carbon storage increased from 5.14 Tg in 2000 to 16.94 Tg in 2014.
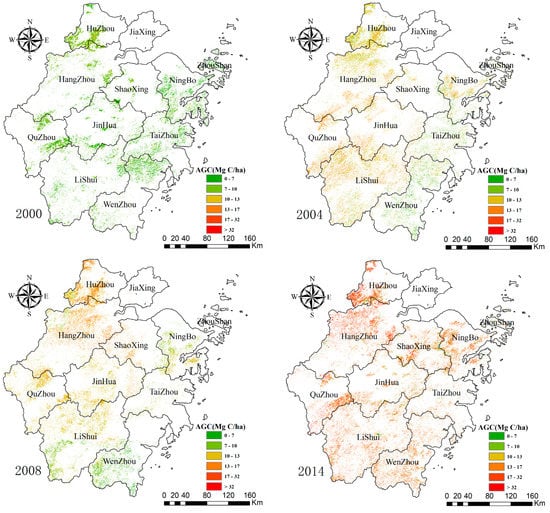
Figure 4.
The AGC spatial Distribution map of bamboo forest in Zhejiang Province in different years.
Table 6.
The Spatial and Temporal Changes of Aboveground Carbon Storage in Bamboo Forest from 2000 to 2014 in Zhejiang Province.
From the spatiotemporal distribution of bamboo forest carbon stock in 11 cities, the cities with the highest and lowest increase in total carbon storage in four periods are Hangzhou and Jiaxing. The carbon storage in Hangzhou City increased from 0.81 Tg C in 2000 to 3.47 Tg C in 2014, more than quadrupled with an average annual increase of 0.19 Tg C; Jiaxing City has low carbon storage because of the small bamboo area; otherwise, Zhoushan City has maintained a relatively stable total carbon stock. At the same time, the carbon density of bamboo forests in all counties and cities maintained a continuous growth pattern at different periods (Table 6), but the difference in growth ranged greatly. Among them, the growth of carbon stock density in Huzhou and Hangzhou was the most obvious, from 7.99 And 7.62 Mg·ha−1 in 2000 increased to 22.44 and 21.98 Mg·ha−1 in 2014, a threefold increase. Jiaxing City, on the other hand, showed the smallest increase from 0.6 to 2.4 Mg·ha−1 from 2000 to 2014.
The relationships between the Observed AGC and several factors established the models in different years are shown in Figure 5, Figure 6, Figure 7 and Figure 8. As is seen, W9B1En had the highest coefficient (R = 0.3608) with the Observed AGC in 2000, followed by W9B5En (R = 0.2209), W5B2Mean (R = 0.1794), W7B4En (R = 0.1676), W7B3Con (R = 0.1658), W11B6Mean (R = 0.1360), W3B6Corr (R = 0.1058) and W7B2En (R = 0.0824). Meanwhile, SAVI (R = 0.6368, R = 0.5790), NDVI (R = 0.4007) had the highest coefficient with the Observed AGC in 2004, 2008 and 2014, respectively.
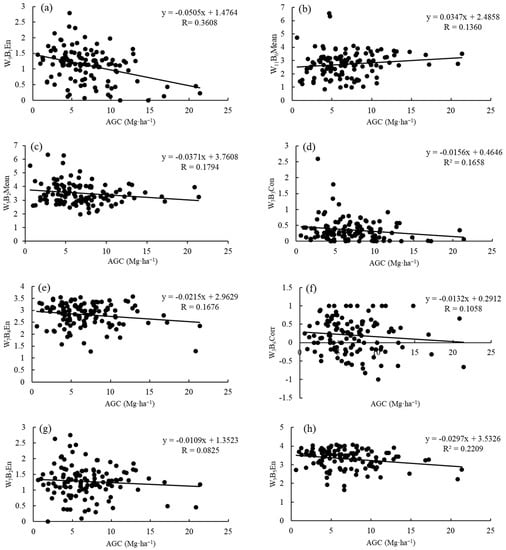
Figure 5.
The AGC (Mg·ha−1) versus eight variables derived from the AGC model of 2000: (a) AGC versus W9B1En; (b) AGC versus W11B6Mean; (c) AGC versus W5B2Mean; (d) AGC versus W7B3Con; (e) AGC versus W7B4En; (f) AGC versus W3B6Corr; (g) AGC versus W7B2En; (h) AGC versus W9B5En.
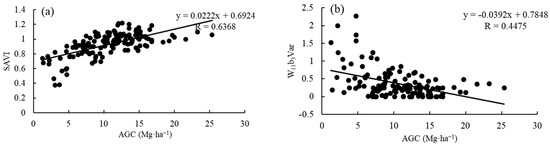
Figure 6.
The AGC (Mg·ha−1) versus variables derived from the AGC model of 2004: (a) AGC versus SAVI; (b) AGC versus W11B3Var.
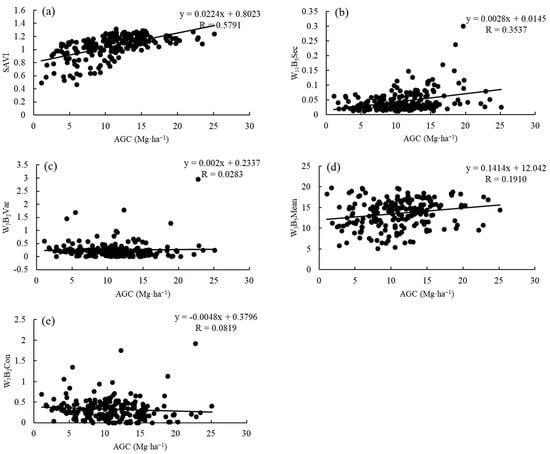
Figure 7.
The AGC (Mg·ha−1) versus eight variables derived from the AGC model of 2008: (a) AGC versus SAVI; (b) AGC versus W11B5Sec; (c) AGC versus W7B2Var; (d) AGC versus W3B5Mean; (e) AGC versus W7B2Con.
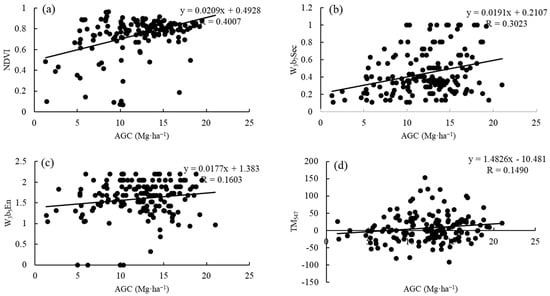
Figure 8.
The AGC (Mg·ha−1) versus eight variables derived from the AGC model of 2014: (a) AGC versus NDVI; (b) AGC versus W3B7Sec; (c) AGC versus W3B5En; (d) AGC versus TM547; (e) AGC versus W11B2Sec; (f) AGC versus W9B7Corr.
The role of the predictive variable for the AGC estimation in this study of different years was assessed using factor analysis method in the SPSS.20 software (Statistical Product and Service Solutions, SPSS; International Business Machines Corporation, IBM; Chicago, America). Accordingly, the correlation coefficient was used to calculate the merit of the variables. The result is listed in Table 7. It can be seen that W7B3Con, SAVI, W7B2Con, and NDVI were the most important variables for predicting the bamboo forest AGC in different years. Meanwhile, we could realize that the most important variables in different years were derived from vegetable indexes and texture, and they could improve the accuracy. The results are inconsistent with the recent study reported by Vafaei et al. [41] and Eckert [37].
Table 7.
The importance of the variables for the AGC estimation in different years.
4. Discussion
The study shows that the stepwise regression method of Zhejiang province AGC spatiotemporal estimation of remote sensing information model has a good performance. The predicting ability of the model is strong. Errors such as RMSE and predicted error are small. Figure 5 shows the analysis of the residual distribution of the model prediction residual error when the standardization residual threshold of the test sample was 2. As is shown in Figure 9, the STD of all test samples were within the threshold range, which further illustrated that the model had good stability and reliability in predicting AGC of bamboo forests at the provincial scale.
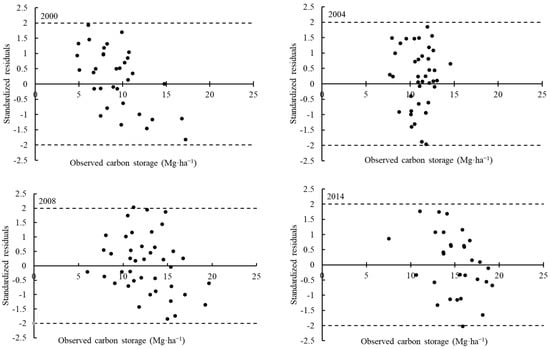
Figure 9.
The test sample standardized residual in different years.
The results shows that the bamboo forest AGC and carbon density both had an increasing trend from 2000 to 2014 in Zhejiang province. The study has great consistency with the previous researches by plot sampling [9] or ecological process model simulations [72] (Table 8, Except for the lack of data on related studies in 2000). Certainly, there are some discrepancies mainly coursed by different methods or models of estimation. The remote sensing information model is a kind of spatial information model [73]. There are some differences on spectrum, texture, and vegetation index in a same background object that may influence the estimation results; however, the remote sensing has obvious advantages in large-scale dynamic monitoring. The results of this study and previous studies provide a guarantee for using the remote sensing information to accurately monitor the spatiotemporal dynamics of bamboo carbon storage in a wide range.
Table 8.
The results were compared on the AGC of Bamboo Forest in Zhejiang Province.
The previous researches showed that there was obvious relationship between the trend of gradual increase of bamboo forest carbon stocks and carbon density, bamboo forest area gradual expansion and improving management level of Zhejiang province [51,71]. Based on Table 6, Figure 10 showed the relationship between spatiotemporal changes in carbon stocks and carbon densities and bamboo forest area in 2000–2004, 2004–2008, 2014–2008 and 2000–2014 in different counties and cities in Zhejiang Province. As we can see from Figure 10, there is a significant linear correlation between the change of bamboo forest carbon storage and bamboo forest area. The main reason why there was no obvious linear relationship between the change of carbon density and the area of bamboo forest was that average carbon storage per unit area was affected by management level. As is shown in Table 6, the general change of bamboo forest area in Huzhou was small, especially the year of 2008–2014, but the carbon density of bamboo forest remained relatively high, and the highest of 2014 was 22.44 Mg C/ha, which was related to the long-term intensive management in the region and the high biomass of bamboo forests [75,76,77,78]. Therefore, the management level of bamboo forests in different regions will also affect the spatial and temporal evolution of carbon storage to a huge extent.
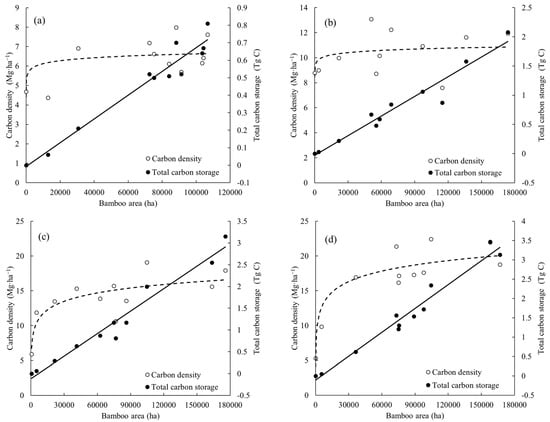
Figure 10.
Relationship between bamboo forest area and carbon density, total carbon storage in different years. (a–d) represents the year of 2000, 2004, 2008 and 2014, respectively.
In this paper, the estimation accuracy R of carbon storage models for different years range from 0.63 to 0.69 compared with previous studies. For instance, Shang et al. [22] used MODIS images to estimate bamboo forest AGC and reported an R of 0.68. Shang et al. [47] estimated the AGC of Moso bamboo forests in combination with Landsat and MODIS data, and the estimation accuracy R was 0.70. Zhu et al. [79] estimated forest biomass using time series Landsat data and the model accuracy was 0.69. Sandra Eckert [37] used WorldView-2 data estimated forest AGB and model accuracy R is up to 0.93. Vafaei et al. [41] used ALOS-2 PALSAR-2 and Sentinel-2A data to estimate above-ground biomass in forests, with a highest estimated accuracy R = 0.85. The estimation accuracy in this study is similar to those studies based on medium resolution images, and it was less accurate than models based on high-resolution images. In this research, the satellite remote sensing image used to estimate the carbon stocks were Landsat time series of medium resolution data with a spatial resolution of 30 × 30 m, and there were many disadvantages compared to the high-resolution satellite data used to estimate forest AGC [80]. Previous studies showed that the combination with multi-source remote sensing data could effectively improve the estimation accuracy of AGC [81]. Remote sensing data were affected by their own spectral resolution, resulting in differences in the extraction accuracy of the band spectrum, vegetation index, texture information compared with high-resolution images [37,38,42,81]. In addition, due to the large span of date and time acquisition of the eight scenes in the same period, although atmospheric correction was performed, radiation differences could not be completely eliminated, resulting in errors in bamboo forest information extraction [82]. This is what we might improve in the future study.
5. Conclusions
Based on the time series imageries of Landsat 5 TM and Landsat 8 OLI in 2000, 2004, 2008 and 2014, we took Zhejiang province as study area, as a precondition to extract bamboo forest distribution information in different periods of Zhejiang province. Model of remote sensing variables were constructed to estimate the spatiotemporal evolution of bamboo forest AGC in Zhejiang province. The results shows that:
- (1)
- The spatiotemporal distribution of bamboo forests in Zhejiang Province at different periods had a higher accuracy of information extraction, of which the classification accuracy reached above 76.36%, the user’s accuracy was above 91.62% and the area accuracy was above 96.50%.
- (2)
- Bamboo forest AGC spatiotemporal estimation model built by the stepwise regression method in Zhejiang Province has good performance and robustness. RMSE and prediction error are small. The estimated carbon storage results have a good consistency with the previous research.
- (3)
- Bamboo forest AGC storage shows gradually increased tend in Zhejiang province from 2000 to 2014, and the average carbon stock density at different years was 6.75 Mg·ha−1, 10.95 Mg·ha−1, 15.25 Mg·ha−1 and 19.07 Mg·ha−1, and an average annual growth was 0.88 Mg·ha−1. Spatiotemporal evolution of bamboo forest carbon stocks has close relationships with the expansion of bamboo forest area and the differences in management level in various regions of Zhejiang province.
Author Contributions
Y.L. implemented the methods, analyzed the data and wrote the manuscript. N.H., X.L. designed the field experiment and contributed at all phases of the investigation. H.D. realized this idea and reviewed the manuscript. F.M. and L.C. provided suggestions about the field logistic and design. T.L. and L.X. contributed to the field investigation and data processing. All authors read and approved the final manuscript.
Acknowledgments
The authors gratefully acknowledge the support of National Natural Science Foundation (Grant No. 31670644, 31370637, 31300535), Natural Science Foundation of Zhejiang Province (Grant No. LR14C160001), Joint Research Fund of Department of Forestry of Zhejiang Province and Chinese Academy of Forestry (Grant No. 2017SY04), and Zhejiang Provincial Collaborative Innovation Center for Bamboo Resources and High-efficiency Utilization (Grant No. S2017011).
Conflicts of Interest
The authors declare no conflict of interest.
References
- Thokchom, A. Comparing aboveground carbon sequestration between bamboo forest and dipterocarpus forests of manipur, north east india. Int. J. Ecol. Environ. Sci. 2015, 22, 651. [Google Scholar]
- Inoue, A.; Sakamoto, S.; Suga, H.; Kitazato, H.; Sakuta, K. Construction of one-way volume table for the three major useful bamboos in japan. J. For. Res. 2013, 18, 323–334. [Google Scholar] [CrossRef]
- Scurlock, J.M.O.; Dayton, D.C.; Hames, B. Bamboo: An overlooked biomass resource? Biomass Bioenergy 2000, 19, 229–244. [Google Scholar] [CrossRef]
- Shanmughavel, P.; Peddappaiah, R.S.; Muthukumar, T. Biomass production in an age series of bambusa bambos plantations. Biomass Bioenergy 2001, 20, 113–117. [Google Scholar] [CrossRef]
- Tianming, Y.; Ji, Y.J.; Jooushian, L. Estimating biomass production and carbon storage for a fast-growing makino bamboo (Phyllostachys makinoi) plant based on the diameter distribution model. For. Ecol. Manag. 2010, 260, 339–344. [Google Scholar]
- Yang, Y.; Wang, K.; Pei, S.; Hao, J. Bamboo diversity and traditional uses in Yunnan, China. Mt. Res. Dev. 2004, 24, 157–165. [Google Scholar]
- Yen, T.M.; Lee, J.S. Comparing aboveground carbon sequestration between moso bamboo (Phyllostachys heterocycla) and China fir (Cunninghamia lanceolata) forests based on the allometric model. For. Ecol. Manag. 2011, 261, 995–1002. [Google Scholar] [CrossRef]
- Zhou, G.; Jiang, P.; Du, H.; Shi, Y. Technology for the Measurement and Enhancement Carbon Sinks in Bamboo Forest Ecosystems; Science Press: Beijing, China, 2017; pp. 1–6. [Google Scholar]
- Zhou, G.; Jiang, P. Density, storage and spatial distribution of carbon in phyllostachy pubescens forest. Sci. Silvae Sin. 2004, 40, 20–24. [Google Scholar]
- Düking, R.; Gielis, J.; Liese, W. Carbon flux and carbon stock in a bamboo stand and their relevance for mitigating climate change. Bamboo Sci. Cult. 2011, 24, 1–16. [Google Scholar]
- Henley, G.; Lou, Y. The Climate Change Challenge and Bamboo: MITIGATION and Adaptation; International Network for Bamboo and Rattan: Beijing, China, 2009; pp. 1–5. [Google Scholar]
- Janssen, J.; Lou, Y. Capturing carbon with bamboo. In INBAR Environment Factsheet; INBAR: Shenzhen, China, 2010. [Google Scholar]
- Lobovikov, M.; Lou, Y.P.; Schoene, D.; Widenoja, R. The poor man’s carbon sink: Bamboo in climate change and poverty alleviation. In Non-Wood Forest Products; Working Document; FAO: Rome, Italy, 2009. [Google Scholar]
- Lou, Y.; Henley, G.; Li, Y. Capturing carbon with bamboo: fast and effective in managed stands. In INBAR Environment Factsheet; INBAR: Shenzhen, China, 2009. [Google Scholar]
- INBAR. Bamboo and Mitigating Climate Change: A Comparative Study of Carbon Fixation. In Proceedings of the 2010 United Nations Climate Change Conference, Cancun, Mexico, 10 December 2010. [Google Scholar]
- Widenoja, R. Sub-Optimal Equilibriums in the Carbon Forestry Game: Why Bamboo should Win but Will Not; The Fletcher School of Law and Diplomacy: Medford, MA, USA, 2007. [Google Scholar]
- Chen, X.; Zhang, Y.; Zhang, X.; Ying, G. Carbon stock changes in bamboo stands in China over the last 50 years. Acta Ecol. Sin. 2008, 28, 5218–5227. [Google Scholar]
- Chen, X.; Zhang, X.; Zhang, Y.; Trevor, B.; He, X. Changes of carbon stocks in bamboo stands in China during 100 years. For. Ecol. Manag. 2009, 258, 1489–1496. [Google Scholar] [CrossRef]
- Dong, D. Remote Sensing-Based Monitor Phyllostachys Praecox Forest and Its Dynamic of Carbon Stocks. Master’s Thesis, Zhejiang A&F Univetsity, Zhejiang, China, 2011. [Google Scholar]
- Feng, S.; Li, X.; Huang, C.; Lai, Y.; Zhang, B.; Yin, C. Biomass and carbon stock of dendrocalamus latiflorus munro established on the land converted from farmland at Hongya county, Sichuan province. J. Siehuan Agric. Univ. 2010, 28, 296–301. [Google Scholar]
- Gao, G. Object-Based Estimation Method of Multi-Scale Bamboo Forest Carbon Storage Using Remote Sensing Imagery with High Spatial Resolution. Master’s Thesis, Zhejiang A&F Univetsity, Zhejiang, China, 2016. [Google Scholar]
- Shang, Z.-Z. Moso Bamboo Forest Extraction Andagc Estimation Based on Multi—Source Remote Sensor Images. Master’s Thesis, Zhejiang A&F Univetsity, Zhejiang, China, 2012. [Google Scholar]
- Wang, B.; Wei, W.; Xing, Z.; Li, S.; Bai, X. Carbon storage of bamboo forest ecosystem in China. Ecol. Environ. 2008, 17, 1680–1684. [Google Scholar]
- Wang, B.; Wei, W.J.; Liu, C.J.; You, W.Z.; Niu, X.; Man, R.Z. Biomass and carbon stock in moso bamboo forests in subtropical China: Characteristics and implications. J. Trop. For. Sci. 2013, 25, 137–148. [Google Scholar]
- Ying, W.; Jin, J.; Jiang, H.; Zhang, X.; Lu, X.; Chen, X.; Zhang, J. Satellite-based detection of bamboo expansion over the past 30 years in mount Tianmushan, China. Int. J. Remote Sens. 2016, 37, 2908–2922. [Google Scholar] [CrossRef]
- Zhou, G.; Xu, X.; Du, H.; Ge, H.; Shi, Y.; Zhou, Y. Estimating aboveground carbon of moso bamboo forests using the k nearest neighbors technique and satellite imagery. Photogramm. Eng. Remote Sens. 2011, 77, 1123–1131. [Google Scholar] [CrossRef]
- Latifi, H.; Fassnacht, F.E.; Hartig, F.; Berger, C.; Hernández, J.; Corvalán, P.; Koch, B. Stratified aboveground forest biomass estimation by remote sensing data. Int. J. Appl. Earth Obs. Geoinform. 2015, 38, 229–241. [Google Scholar] [CrossRef]
- Timothy, D.; Onisimo, M.; Cletah, S.; Adelabu, S.; Tsitsi, B. Remote sensing of aboveground forest biomass: A review. Trop. Ecol. 2016, 57, 125–132. [Google Scholar]
- Chen, Q.; Mcroberts, R.E.; Wang, C.; Radtke, P.J. Forest aboveground biomass mapping and estimation across multiple spatial scales using model-based inference. Remote Sens. Environ. 2016, 184, 350–360. [Google Scholar] [CrossRef]
- Duan, Z.; Dan, Z.; Yuan, Z.; Zhao, Y.; Bingfang, W.U.; Zhu, J. Estimation of the forest aboveground biomass at regional scale based on remote sensing. Geomatics Inf. Sci. Wuhan Univ. 2015, 10. [Google Scholar] [CrossRef]
- Fayad, I.; Baghdadi, N.; Guitet, S.; Bailly, J.S.; Hérault, B.; Gond, V.; Hajj, M.E.; Minh, D.H.T. Aboveground biomass mapping in french guiana by combining remote sensing, forest inventories and environmental data. Int. J. Appl. Earth Obs. Geoinform. 2016, 52, 502–514. [Google Scholar] [CrossRef]
- Su, Y.; Guo, Q.; Xue, B.; Hu, T.; Alvarez, O.; Tao, S.; Fang, J. Spatial distribution of forest aboveground biomass in China: Estimation through combination of spaceborne lidar, optical imagery, and forest inventory data. Remote Sens. Environ. 2016, 173, 187–199. [Google Scholar] [CrossRef]
- Ningthoujam, R.; Balzter, H.; Tansey, K.; Feldpausch, T.; Mitchard, E.; Wani, A.; Joshi, P. Relationships of s-band radar backscatter and forest aboveground biomass in different forest types. Remote Sens. 2017, 9, 1116. [Google Scholar] [CrossRef]
- Sheridan, R.; Popescu, S.; Gatziolis, D.; Morgan, C.; Ku, N.W. Modeling forest aboveground biomass and volume using airborne lidar metrics and forest inventory and analysis data in the pacific northwest. Remote Sens. 2014, 7, 229–255. [Google Scholar] [CrossRef]
- Hu, T.; Su, Y.; Xue, B.; Liu, J.; Zhao, X.; Fang, J.; Guo, Q. Mapping global forest aboveground biomass with spaceborne lidar, optical imagery, and forest inventory data. Remote Sens. 2016, 8, 565. [Google Scholar] [CrossRef]
- Pargal, S.; Fararoda, R.; Rajashekar, G.; Balachandran, N.; Réjou-Méchain, M.; Barbier, N.; Jha, C.S.; Pélissier, R.; Dadhwal, V.K.; Couteron, P. Inverting aboveground biomass—Canopy texture relationships in a landscape of forest mosaic in the western ghats of India using very high resolution cartosat imagery. Remote Sens. 2017, 9, 228. [Google Scholar] [CrossRef]
- Eckert, S. Improved forest biomass and carbon estimations using texture measures from worldview-2 satellite data. Remote Sens. 2012, 4, 810–829. [Google Scholar] [CrossRef]
- Sarker, M.L.R.; Nichol, J.; Iz, H.B.; Ahmad, B.B.; Rahman, A.A. Forest biomass estimation using texture measurements of high-resolution dual-polarization c-band sar data. IEEE Trans. Geosci. Remote Sens. 2013, 51, 3371–3384. [Google Scholar] [CrossRef]
- Zhang, L.; Shao, Z.; Wang, Z. Estimation forest aboveground biomass using the integration spectral and textural features from gf-1 satellite image. In Proceedings of the International Workshop on Earth Observation and Remote Sensing Applications, Guangzhou, China, 4–6 July 2016; pp. 353–357. [Google Scholar]
- Mangla, R.; Kumar, S.; Nandy, S. Random forest regression modelling for forest aboveground biomass estimation using risat-1 polsar and terrestrial lidar data. In Lidar Remote Sensing for Environmental Monitoring XV; SPIE: Bellingham, WA, USA, 2016; p. 98790. [Google Scholar]
- Vafaei, S.; Soosani, J.; Adeli, K.; Fadaei, H.; Naghavi, H.; Pham, T.; Bui, D.T. Improving accuracy estimation of forest aboveground biomass based on incorporation of alos-2 palsar-2 and sentinel-2a imagery and machine learning: A case study of the hyrcanian forest area (Iran). Remote Sens. 2018, 10, 172. [Google Scholar] [CrossRef]
- Nichol, J.E.; Sarker, M.L.R. Improved biomass estimation using the texture parameters of two high-resolution optical sensors. IEEE Trans. Geosci. Remote Sens. 2011, 49, 930–948. [Google Scholar] [CrossRef]
- Qiu, S.; Xing, Y.; Weihua, X.U.; Ding, J.; Tian, J. Estimation of regional forest aboveground biomass combining spaceborne large footprint li dar and hj-1a hyperspectral images. Acta Ecol. Sin. 2016, 36. [Google Scholar] [CrossRef]
- Xing, Y.; Qiu, S.; Ding, J.; Tian, J. Estimation of regional forest aboveground biomass combining icesat-glas waveforms and hj-1a/hsi hyperspectral imageries. Int. Arch. Photogramm. Remote Sens. Spat. Inf. Sci. 2016, XLI-B7, 731–737. [Google Scholar]
- Urbazaev, M.; Thiel, C.; Cremer, F.; Dubayah, R.; Migliavacca, M.; Reichstein, M.; Schmullius, C. Estimation of forest aboveground biomass and uncertainties by integration of field measurements, airborne lidar, and sar and optical satellite data in mexico. Carbon Balance Manag. 2018, 13, 5. [Google Scholar] [CrossRef] [PubMed]
- Dube, T.; Mutanga, O. Investigating the robustness of the new landsat-8 operational land imager derived texture metrics in estimating plantation forest aboveground biomass in resource constrained areas. ISPRS J. Photogramm. Remote Sens. 2015, 108, 12–32. [Google Scholar] [CrossRef]
- Shang, Z.; Zhou, G.; Du, H.; Xu, X.; Shi, Y.; Zhou, Y.; Gu, C. Moso bamboo forest extraction and aboveground carbon storage estimation based on multi-source remotely sensed images. Int. J. Remote Sens. 2013, 34, 5351–5368. [Google Scholar] [CrossRef]
- Tang, J.; Li, X.; Lai, Y.; Feng, S.; Wang, P.; Huang, C. Spatial and temporal patterns of bamboo carbon storage in forest land converted from farmland in Hongya, Sichuan. Sci. Silvae Sin. 2011, 47, 1–7. [Google Scholar]
- Du, H.; Zhou, G.; Ge, H.; Fan, W.; Xu, X.; Fan, W.; Shi, Y. Satellite-based carbon stock estimation for bamboo forest with a non-linear partial least square regression technique. Int. J. Remote Sens. 2012, 33, 1917–1933. [Google Scholar] [CrossRef]
- Xu, X.; Zhou, G.; Du, H.; Partida, A. Bamboo forest change and its effect on biomass carbon stocks: A case study of Anji County, Zhejiang Province, China. J. Trop. For. Sci. 2012, 24, 426–435. [Google Scholar]
- Han, N.; Du, H.; Zhou, G.; Xu, X.; Cui, R.; Gu, C. Spatiotemporal heterogeneity of moso bamboo aboveground carbon storage with landsat thematic mapper images: A case study from Anji County, China. Int. J. Remote Sens. 2013, 34, 4917–4932. [Google Scholar] [CrossRef]
- Xu, X.; Du, H.; Zhou, G.; Ge, H.; Shi, Y.; Zhou, Y.; Fan, W.; Fan, W. Estimation of aboveground carbon stock ofmosobamboo (Phyllostachys heterocyclavar. Pubescens) forest with a landsat thematic mapper image. Int. J. Remote Sens. 2011, 32, 1431–1448. [Google Scholar] [CrossRef]
- Anaya, J.A.; Chuvieco, E.; Palacios-Orueta, A. Aboveground biomass assessment in colombia: A remote sensing approach. For. Ecol. Manag. 2009, 257, 1237–1246. [Google Scholar] [CrossRef]
- Xu, X.; Zhou, G.; Du, H.; Dong, D.; Cui, R.; Zhou, Y.; Shen, Z. Estimation of aboveground biomass of Phyllostachys praecox forest based on landsat thematic mapper image. Sci. Silvae Sin. 2011, 47, 1–6. [Google Scholar]
- Gao, Y.; Lu, D.; Li, G.; Wang, G.; Chen, Q.; Liu, L.; Li, D. Comparative analysis of modeling algorithms for forest aboveground biomass estimation in a subtropical region. Remote Sens. 2018, 10, 627. [Google Scholar] [CrossRef]
- Department of Forestry of Zhejiang Province. Announcement of Value of Forest Resources and Ecologicalfunctions of Zhejiang Province in 2014; Department of Forestry of Zhejiang Province: Zhejiang, China, 2015.
- Mao, F.; Li, X.; Du, H.; Zhou, G.; Han, N.; Xu, X.; Liu, Y.; Chen, L.; Cui, L. Comparison of two data assimilation methods for improving modis lai time series for bamboo forests. Remote Sens. 2017, 9, 401. [Google Scholar] [CrossRef]
- Cui, K. Monitoring of Crop Phenology with Remote Sensing and Dynamic Change Analysis. Master’s Thesis, Central South University, Changsha, China, 2012. [Google Scholar]
- Los, S.O.; Justice, C.O.; Tucker, C.J. A Global 1° by 1° ndvi data set for climate studies derived from the gimms continental ndvi data. Int. J. Remote Sens. 1994, 15, 3493–3518. [Google Scholar] [CrossRef]
- Wu, L.; Luo, X.; Zhang, Y.; Zhang, B.; Feng, Z. Geometric precision correction of medium-low resolution images. J. Beijing For. Univ. 2008, 30, 78–82. [Google Scholar]
- Shi, Y. Research on Technologies of Forest Classification by Remote Sensing—A Case Study of Northwest Mountainous Area in Zhejiang. Master’s Thesis, Zhejiang University, Zhejiang, China, 2003. [Google Scholar]
- Zhou, G. Carbon Storage, Fixation and Distribution in Mao Bamboo (Phyllostachys pubescens) Stands Ecosystem. Ph.D. Thesis, Zhejiang University, Zhejiang, China, 2006. [Google Scholar]
- Calvão, T.; Palmeirim, J.M. Mapping mediterranean scrub with satellite imagery: Biomass estimation and spectral behaviour. Int. J. Remote Sens. 2004, 25, 3113–3126. [Google Scholar] [CrossRef]
- Du, H.; Zhou, G.; Xu, X. Quantitative Methods Using Remote Sensing in Estimating Biomass and Carbon Storage Bamboo Forest; Science Press: Beijing, China, 2012; pp. 65–66. [Google Scholar]
- Jong, S.M.D.; Pebesma, E.J.; Lacaze, B. Above-ground biomass assessment of mediterranean forests using airborne imaging spectrometry: The dais peyne experiment. Int. J. Remote Sens. 2003, 24, 1505–1520. [Google Scholar] [CrossRef]
- Lu, D.; Batistella, M. Exploring tm image texture and its relationships with biomass estimation in rond? Nia, Brazilian Amazon. Acta Amaz. 2005, 35, 249–257. [Google Scholar] [CrossRef]
- Liu, K.; Wang, J.; Zeng, W.; Song, J. Comparison and evaluation of three methods for estimating forest above ground biomass using tm and glas data. Remote Sens. 2017, 9, 341. [Google Scholar] [CrossRef]
- Zhu, J.; Huang, Z.; Sun, H.; Wang, G. Remote sensing mapping forest ecosystem biomass density for xiangjiang river basin by combining plot and remote sensing data and comparing spatial extrapolation methods. Remote Sens. 2017, 9, 241. [Google Scholar] [CrossRef]
- Lu, D.; Chen, Q.; Wang, G.; Liu, L.; Li, G.; Moran, E. A survey of remote sensing-based aboveground biomass estimation methods in forest ecosystems. Int. J. Digit. Earth 2016, 9, 63–105. [Google Scholar] [CrossRef]
- Mao, F.; Li, P.; Zhou, G.; Du, H.; Xu, X.; Shi, Y.; Mo, L.; Zhou, Y.; Tu, G. Development of the biome-bgc model for the simulation of managed moso bamboo forest ecosystems. J. Environ. Manag. 2016, 172, 29–39. [Google Scholar] [CrossRef] [PubMed]
- Mao, F.; Zhou, G.; Li, P.; Du, H.; Xu, X.; Shi, Y.; Mo, L.; Zhou, Y.; Tu, G. Optimizing selective cutting strategies for maximum carbon stocks and yield of moso bamboo forest using biome-bgc model. J. Environ. Manag. 2017, 191, 126. [Google Scholar] [CrossRef] [PubMed]
- Mao, F. Model Development and Application to Simulate the Temporospatial Carbon Cycle of Moso Bamboo Forest Ecosystem. Ph.D. Thesis, Zhejiang A&F University, Zhejiang, China, 2016. [Google Scholar]
- Ma, A. Remote Sensing Information Model; The Peking University Publishing House: Beijing, China, 1997; pp. 266–271. [Google Scholar]
- Liu, E.; Shi, Y.; Li, Y.; Zhou, G. Carbon sequestration potential of moso bamboo forest in zhejiang province based on the non-spatial structure. Sci. Silvae Sin. 2012, 48, 9–14. [Google Scholar]
- Meng, H.; Liu, Q.; Wu, W. Study on the cost-benefit and carbon sequestration capacities of phyllostachys edulis plantation under different types of management. J. Zhejiang A F Univ. 2014, 31, 959–964. [Google Scholar]
- Wang, K.; Yang, J.; Shen, J.; Gu, Z.; Chen, B.; Chen, X.; Yu, Y. Innovation and practices of moso forest management technique in Huzhou city, Zhejiang. World Bamboo Rattan 2016, 14, 25–30. [Google Scholar]
- Zhu, W.; Wang, B.; Shen, Q.; Xhu, Z.; Wu, J.; Ji, W.; Yu, T.; Zhang, X. Practice and benefit of different management types in moso bamboo forest. Pract. For. Technol. 2015, 21–25. [Google Scholar] [CrossRef]
- Du, H.; Cui, R.; Zhou, G.; Shi, Y.; Xu, X.; Fan, W.; Lü, Y. The responses of moso bamboo (Phyllostachys heterocycla var. Pubescens) forest aboveground biomass to landsat tm spectral reflectance and ndvi. Acta Ecol. Sin. 2010, 30, 257–263. [Google Scholar] [CrossRef]
- Zhu, X.; Liu, D. Improving forest aboveground biomass estimation using seasonal landsat ndvi time-series. Isprs J. Photogramm. Remote Sens. 2015, 102, 222–231. [Google Scholar] [CrossRef]
- Li, W.; Chen, E.; Li, Z.; Zhang, W.; Jiang, C. Assessing performance of tomo-sar and backscattering coefficient for hemi-boreal forest aboveground biomass estimation. J. Indian Soc. Remote Sens. 2016, 44, 41–48. [Google Scholar] [CrossRef]
- Zhao, P.; Lu, D.; Wang, G.; Liu, L.; Li, D.; Zhu, J.; Yu, S. Forest aboveground biomass estimation in Zhejiang province using the integration of landsat tm and alos palsar data. Int. J. Appl. Earth Obs. Geoinform. 2016, 53, 1–15. [Google Scholar] [CrossRef]
- López-Serrano, P.; Corral-Rivas, J.; Díaz-Varela, R.; Álvarez-González, J.; López-Sánchez, C. Evaluation of radiometric and atmospheric correction algorithms for aboveground forest biomass estimation using landsat 5 tm data. Remote Sens. 2016, 8, 369. [Google Scholar] [CrossRef]
© 2018 by the authors. Licensee MDPI, Basel, Switzerland. This article is an open access article distributed under the terms and conditions of the Creative Commons Attribution (CC BY) license (http://creativecommons.org/licenses/by/4.0/).