Next Issue
Volume 17, November-2
Previous Issue
Volume 17, October-2
 
 
remotesensing-logo

Journal Browser

Journal Browser

Remote Sens., Volume 17, Issue 21 (November-1 2025) – 153 articles

Cover Story (view full-size image): 
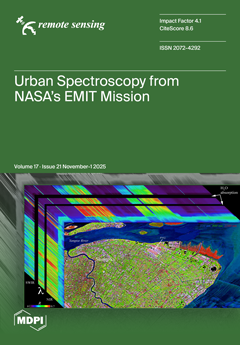
With the launch of NASA’s EMIT imaging spectrometer in 2022, comparative spectroscopic characterization of built environments using atmospherically corrected imagery became feasible.  Imaging visible through shortwave infrared (VSWIR ~380 to 2500 nm) radiance at ~50 m spatial resolution allows EMIT to resolve narrow-band absorption features, not possible with broadband multispectral sensors. Spectroscopic characterization quantifies the spectral dimensionality and topology of the spectral feature space, revealing spectral endmembers and mixing continua within it. Combining linear and nonlinear dimensionality reduction facilitates visualization of low-dimensional projections of the higher-dimensional mixing space. This informs the development of both continuous physical and discrete thematic models of natural and anthropogenic land cover. View this paper
  • Issues are regarded as officially published after their release is announced to the table of contents alert mailing list.
  • You may sign up for e-mail alerts to receive table of contents of newly released issues.
  • PDF is the official format for papers published in both, html and pdf forms. To view the papers in pdf format, click on the "PDF Full-text" link, and use the free Adobe Reader to open them.
Order results
Result details
Section
Select all
Export citation of selected articles as:
16 pages, 4273 KB  
Article
Mapping Green Roofs on Buildings Using Vegetation Indices and Deep Learning Techniques
by Ana Paula Falcão, Joana Pernes, Vasco Miranda and Cristina Matos Silva
Remote Sens. 2025, 17(21), 3657; https://doi.org/10.3390/rs17213657 - 6 Nov 2025
Viewed by 954
Abstract
The identification of strategies to mitigate climate change and address urban challenges is nowadays a priority for urban planners. The installation of green roofs (GR), as a natural-based solution, is widely promoted. Despite this recognition, most installations result from individual initiatives, and their [...] Read more.
The identification of strategies to mitigate climate change and address urban challenges is nowadays a priority for urban planners. The installation of green roofs (GR), as a natural-based solution, is widely promoted. Despite this recognition, most installations result from individual initiatives, and their mapping and monitoring remains absent. Over time, the installation of green roofs has followed the building construction sector, moving from individual to groups of buildings organ, grouped in condominiums, on which common shared areas at ground level are covered with GR. The identification of those GRs is important, as they represent the majority of the GR installations in urban areas; however, this task is still very challenging due to the lack of information about the condominium boundaries. This work proposes a methodology for mapping GR at a top and ground level, and monitoring them, through the use of Support Vector Machine classification process, deep learning models, and GIS-based spatial analysis. Applied to the Lisbon Municipality, the methodology enabled the identification and validation of 196 GR. The results demonstrate the effectiveness and scalability of the proposed approach, which surpasses existing methods and is adaptable to diverse urban contexts without reliance on location-specific characteristics. Full article
Show Figures

Figure 1

18 pages, 12919 KB  
Article
Impact of Increased Satellite Observation Frequency on Mapping of Long-Term Tidal Flat Area Changes
by Jinqing Wang, Xiao Zhang, Tingting Zhao and Liangyun Liu
Remote Sens. 2025, 17(21), 3656; https://doi.org/10.3390/rs17213656 - 6 Nov 2025
Viewed by 604
Abstract
Remote sensing of tidal flats and their dynamic changes is essential for understanding and conserving intertidal ecosystems. As a highly dynamic land cover type influenced by tidal variations, tidal flats present challenges for consistent long-term monitoring. The tidal flat area may be inflated [...] Read more.
Remote sensing of tidal flats and their dynamic changes is essential for understanding and conserving intertidal ecosystems. As a highly dynamic land cover type influenced by tidal variations, tidal flats present challenges for consistent long-term monitoring. The tidal flat area may be inflated in long-term remote sensing datasets due to the increasing observation frequency in recent decades. Although significant progress has been made in time-series mapping of tidal flats using Landsat imagery, the relationship between tidal flat dynamics and satellite observation frequency remains poorly understood. In this study, we aimed to quantify the impact of increased Landsat observations on long-term time series of tidal flat area changes using two widely used global tidal flat products (GTF30 and Murray’s product). Specifically, we first used a regression analysis to investigate the relationship between observation frequency, tide level, and tidal flat area; the result revealed that higher observation frequency is more likely to capture lower tides and thus detect larger tidal flat areas. Next, we developed a weighted statistical regression method to quantify the influence of observation frequency on the mapped tidal flat area at the selected 45 tidal stations. Our analysis indicates that both products exhibit significant inflated increases due to the increased observation frequency during 2000–2022. Specifically, the GTF30 product shows a spurious increase of 12.83 ± 6.51 km2 attributable to the increased observation frequency, accounting for 17.57% of the total observed change. Similarly, the Murray product also exhibits a spurious increase of 13.92 ± 7.45 km2, which is approximately 1.95 times the mapped change in tidal flat area. Therefore, this study emphasizes the presence of substantial inflation effects in long-term tidal flat remote sensing datasets caused by the increasing observation frequency. Quantifying this bias is essential for accurate interpretation of the long-term tidal flat dynamics and ecological assessments. Full article
Show Figures

Figure 1

19 pages, 1483 KB  
Article
ISAR Super-Resolution and Clutter Suppression Using Deep Learning
by Elor Malul and Shlomo Greenberg
Remote Sens. 2025, 17(21), 3655; https://doi.org/10.3390/rs17213655 - 6 Nov 2025
Cited by 1 | Viewed by 908
Abstract
Inverse Synthetic Aperture Radar (ISAR) plays a vital role in the high-resolution imaging of marine targets, particularly under non-cooperative scenarios. However, resolution degradation due to limited observation angles and marine clutter such as wave-induced disturbances remains a major challenge. In this work, we [...] Read more.
Inverse Synthetic Aperture Radar (ISAR) plays a vital role in the high-resolution imaging of marine targets, particularly under non-cooperative scenarios. However, resolution degradation due to limited observation angles and marine clutter such as wave-induced disturbances remains a major challenge. In this work, we propose a novel deep learning-based framework to enhance ISAR resolution in the presence of marine clutter and additive Gaussian noise, which performs direct restoration in the ISAR image domain after an IFFT2 back projection. Under small aspect sweeps with coarse range alignment, the network implicitly compensates for residual defocus and cross-range blur, while suppressing clutter and noise, to recover high-resolution complex ISAR images. Our approach leverages a residual neural network trained to learn a non-linear mapping between low-resolution and high-resolution ISAR images. The network is designed to preserve both magnitude and phase components, thereby maintaining the physical integrity of radar returns. Extensive simulations on synthetic marine vessel data demonstrate significant improvements in cross-range, outperforming conventional sparsity-driven methods. The proposed method also exhibits robust performance under conditions of low signal-to-noise ratio (SNR) and signal-to-wave ratio (SWR), effectively recovering weak scatterers and suppressing false artifacts. This work establishes a promising direction for data-driven ISAR image enhancement in noisy and cluttered maritime environments with minimal pre-processing. Full article
(This article belongs to the Section AI Remote Sensing)
Show Figures

Figure 1

30 pages, 2612 KB  
Article
Uncrewed Aerial Vehicle (UAV)-Based High-Throughput Phenotyping of Maize Silage Yield and Nutritive Values Using Multi-Sensory Feature Fusion and Multi-Task Learning with Attention Mechanism
by Jiahao Fan, Jing Zhou, Natalia de Leon and Zhou Zhang
Remote Sens. 2025, 17(21), 3654; https://doi.org/10.3390/rs17213654 - 6 Nov 2025
Viewed by 900
Abstract
Maize (Zea mays L.) silage’s forage quality significantly impacts dairy animal performance and the profitability of the livestock industry. Recently, using uncrewed aerial vehicles (UAVs) equipped with advanced sensors has become a research frontier in maize high-throughput phenotyping (HTP). However, extensive existing [...] Read more.
Maize (Zea mays L.) silage’s forage quality significantly impacts dairy animal performance and the profitability of the livestock industry. Recently, using uncrewed aerial vehicles (UAVs) equipped with advanced sensors has become a research frontier in maize high-throughput phenotyping (HTP). However, extensive existing studies only consider a single sensor modality and models developed for estimating forage quality are single-task ones that fail to utilize the relatedness between each quality trait. To fill the research gap, we propose MUSTA, a MUlti-Sensory feature fusion model that utilizes MUlti-Task learning and the Attention mechanism to simultaneously estimate dry matter yield and multiple nutritive values for silage maize breeding hybrids in the field environment. Specifically, we conducted UAV flights over maize breeding sites and extracted multi-temporal optical- and LiDAR-based features from the UAV-deployed hyperspectral, RGB, and LiDAR sensors. Then, we constructed an attention-based feature fusion module, which included an attention convolutional layer and an attention bidirectional long short-term memory layer, to combine the multi-temporal features and discern the patterns within them. Subsequently, we employed multi-head attention mechanism to obtain comprehensive crop information. We trained MUSTA end-to-end and evaluated it on multiple quantitative metrics. Our results showed that it is capable of practical quality estimation results, as evidenced by the agreement between the estimated quality traits and the ground truth data, with weighted Kendall’s tau coefficients (τw) of 0.79 for dry matter yield, 0.74 for MILK2006, 0.68 for crude protein (CP), 0.42 for starch, 0.39 for neutral detergent fiber (NDF), and 0.51 for acid detergent fiber (ADF). Additionally, we implemented a retrieval-augmented method that enabled comparable prediction performance, even without certain costly features available. The comparison experiments showed that the proposed approach is effective in estimating maize silage yield and nutritional values, providing a digitized alternative to traditional field-based phenotyping. Full article
Show Figures

Figure 1

25 pages, 2896 KB  
Article
A Multi-Scale Windowed Spatial and Channel Attention Network for High-Fidelity Remote Sensing Image Super-Resolution
by Xiao Xiao, Xufeng Xiang, Jianqiang Wang, Liwen Wang, Xingzhi Gao, Yang Chen, Jun Liu, Peng He, Junhui Han and Zhiqiang Li
Remote Sens. 2025, 17(21), 3653; https://doi.org/10.3390/rs17213653 - 6 Nov 2025
Viewed by 909
Abstract
Remote sensing image super-resolution (SR) plays a crucial role in enhancing the quality and resolution of satellite and aerial imagery, which is essential for various applications, including environmental monitoring and urban planning. While recent image super-resolution networks have achieved strong results, remote-sensing images [...] Read more.
Remote sensing image super-resolution (SR) plays a crucial role in enhancing the quality and resolution of satellite and aerial imagery, which is essential for various applications, including environmental monitoring and urban planning. While recent image super-resolution networks have achieved strong results, remote-sensing images present domain-specific challenges—complex spatial distribution, large cross-scale variations, and dynamic topographic effects—that can destabilize multi-scale fusion and limit the direct applicability of generic SR models. These features make it difficult for single-scale feature extraction methods to fully capture the complex structure, leading to the presence of artifacts and structural distortion in the reconstructed remote sensing images. Therefore, new methods are needed to overcome these challenges and improve the accuracy and detail fidelity of remote sensing image super-resolution reconstruction. This paper proposes a novel Multi-scale Windowed Spatial and Channel Attention Network (MSWSCAN) for high-fidelity remote sensing image super-resolution. The proposed method combines multi-scale feature extraction, window-based spatial attention, and channel attention mechanisms to effectively capture both global and local image features while addressing the challenges of fine details and structural distortion. The network is evaluated on several benchmark datasets, including WHU-RS19, UCMerced and RSSCN7, where it demonstrates superior performance in terms of peak signal-to-noise ratio (PSNR) and structural similarity index (SSIM) compared to state-of-the-art methods. The results show that the MSWSCAN not only enhances texture details and edge sharpness but also reduces reconstruction artifacts. To address cross-scale variations and dynamic topographic effects that cause texture drift in multi-scale SR, we combine windowed spatial attention to preserve local geometry with a channel-aware fusion layer (FFL) that reweights multi-scale channels. This stabilizes cross-scale aggregation at a runtime comparable to DAT and yields sharper details on heterogeneous land covers. Averaged over WHU–RS19, RSSCN7, and UCMerced_LandUse at ×2/×3/×4, MSWSCAN improves PSNR (peak signal-to-noise ratio, dB)/SSIM (structural similarity index measure, 0–1) by +0.10 dB/+0.0038 over SwinIR and by +0.05 dB/+0.0017 over DAT. In conclusion, the proposed MSWSCAN achieves state-of-the-art performance in remote sensing image SR, offering a promising solution for high-quality image enhancement in remote sensing applications. Full article
(This article belongs to the Special Issue Artificial Intelligence for Optical Remote Sensing Image Processing)
Show Figures

Figure 1

33 pages, 1942 KB  
Review
Satellite-Derived Approaches for Coal Mine Methane Estimation: A Review
by Akshansha Chauhan and Simit Raval
Remote Sens. 2025, 17(21), 3652; https://doi.org/10.3390/rs17213652 - 6 Nov 2025
Cited by 1 | Viewed by 1771
Abstract
Methane emissions from coal mines, especially surface operations, are spatially diffuse, presenting significant challenges for accurate quantification. Satellites such as TROPOMI, GHGSat, PRISMA, GaoFen-5, and GOSAT have been extensively used for detecting methane emissions at various scales, from individual point sources to regional [...] Read more.
Methane emissions from coal mines, especially surface operations, are spatially diffuse, presenting significant challenges for accurate quantification. Satellites such as TROPOMI, GHGSat, PRISMA, GaoFen-5, and GOSAT have been extensively used for detecting methane emissions at various scales, from individual point sources to regional and global assessments. Despite various advancements, methane quantification via satellite observations remains subject to several challenges. Various quantification methods for the same observation can produce variable results. Also, meteorological conditions, terrain complexity, and surface heterogeneity introduce uncertainties in emission estimates. The selection of wind speed and direction, along with retrieval-algorithm limitations, can lead to significant discrepancies in reported emissions. Additionally, satellite-based observations capture emissions only at specific overpass times, which may introduce temporal uncertainties compared to inventories derived from continuous emission estimations. This study provides a comprehensive review of satellite-based coal mine methane (CMM) monitoring, evaluating current methodologies, their limitations, and recent technological advancements. We discussed the potential of emerging machine-learning techniques, improved atmospheric modelling, and integrated observational approaches to enhance methane emission quantification. By refining satellite-based monitoring techniques and addressing existing challenges, this research will support the development of more accurate emission inventories and effective mitigation strategies for the coal mining sector. Full article
(This article belongs to the Special Issue Using Remote Sensing Technology to Quantify Greenhouse Gas Emissions)
Show Figures

Figure 1

24 pages, 6994 KB  
Article
Satellite-Based Machine Learning for Soil Moisture Prediction and Land Conservation Practice Assessment in West African Drylands
by Meron Lakew Tefera, Ethiopia B. Zeleke, Mario Pirastru, Assefa M. Melesse, Giovanna Seddaiu and Hassan Awada
Remote Sens. 2025, 17(21), 3651; https://doi.org/10.3390/rs17213651 - 5 Nov 2025
Viewed by 1418
Abstract
In semiarid, fragmented landscapes where data scarcity challenges effective land management, accurate soil moisture monitoring is critical. This study presents a high-resolution analysis that integrates remote sensing, in situ data, and machine learning to predict soil moisture and evaluate the impact of land [...] Read more.
In semiarid, fragmented landscapes where data scarcity challenges effective land management, accurate soil moisture monitoring is critical. This study presents a high-resolution analysis that integrates remote sensing, in situ data, and machine learning to predict soil moisture and evaluate the impact of land conservation practices. A Long Short-Term Memory (LSTM) model combined with Random Forest gap-filling achieved strong predictive performance (R2 = 0.84; RMSE = 0.103 cm3 cm−3), outperforming SMAP satellite estimates by approximately 30% across key accuracy metrics. The model was applied to 222 field sites in northern Ghana to quantify the effects of stone bunds on soil moisture retention. The results revealed that fields with stone bunds maintained 4–6% higher moisture than non-bunded fields, particularly on steep slopes and in areas with low to moderate topographic wetness. These findings demonstrate the capability of combining remote sensing and deep learning for fine-scale soil-moisture prediction and provide quantitative evidence of how nature-based solutions enhance water retention and climate resilience in dryland agricultural systems. Full article
(This article belongs to the Special Issue Earth Observation Satellites for Soil Moisture Monitoring)
Show Figures

Figure 1

22 pages, 57371 KB  
Article
Individual Planted Tree Seedling Detection from UAV Multimodal Data with the Alternate Scanning Fusion Method
by Taoming Qi, Yaokai Liu, Junxiang Tan, Pengyu Yin, Changping Huang, Zengguang Zhou and Ziyang Li
Remote Sens. 2025, 17(21), 3650; https://doi.org/10.3390/rs17213650 - 5 Nov 2025
Viewed by 749
Abstract
Detection of planted tree seedlings at the individual level is crucial for monitoring forest ecosystems and supporting silvicultural management. The combination of deep learning (DL) object detection algorithms and remote sensing (RS) data from unmanned aerial vehicles (UAVs) offers efficient and cost-effective solutions. [...] Read more.
Detection of planted tree seedlings at the individual level is crucial for monitoring forest ecosystems and supporting silvicultural management. The combination of deep learning (DL) object detection algorithms and remote sensing (RS) data from unmanned aerial vehicles (UAVs) offers efficient and cost-effective solutions. However, current methods predominantly rely on unimodal RS data sources, overlooking the multi-source nature of RS data, which may result in an insufficient representation of target features. Moreover, there is a lack of multimodal frameworks tailored explicitly for detecting planted tree seedlings. Consequently, we propose a multimodal object detection framework for this task by integrating texture information from digital orthophoto maps (DOMs) and geometric information from digital surface models (DSMs). We introduce alternate scanning fusion (ASF), a novel multimodal fusion module based on state space models (SSMs). The ASF can achieve global feature fusion while maintaining linear computational complexity. We embed ASF modules into a dual-backbone YOLOv5 object detection framework, enabling feature-level fusion between DOM and DSM for end-to-end detection. To train and evaluate the proposed framework, we establish the planted tree seedling (PTS) dataset. On the PTS dataset, our method achieves an AP50 of 72.6% for detecting planted tree seedlings, significantly outperforming the original YOLOv5 on unimodal data: 63.5% on DOM and 55.9% on DSM. Within the YOLOv5 framework, comparative experiments on both our PTS dataset and the public VEDAI benchmark demonstrate that the ASF surpasses representative fusion methods in multimodal detection accuracy while maintaining relatively low computational cost. Full article
Show Figures

Figure 1

26 pages, 7433 KB  
Article
Evaluating the German Ground Motion Service for Operational Dam Monitoring: A Comparison of InSAR Data with In Situ Measurements
by Jannik Jänichen, Jonas Ziemer, Carolin Wicker, Katja Last, Christiane Schmullius, Andre Cahyadi Kalia, Thomas Lege and Clémence Dubois
Remote Sens. 2025, 17(21), 3649; https://doi.org/10.3390/rs17213649 - 5 Nov 2025
Viewed by 742
Abstract
This study evaluates the applicability of Sentinel-1 Persistent Scatterer Interferometry (PSI) data from the Ground Motion Service Germany (BBD) for monitoring dams by comparing it with terrestrial measurements at dams of the Ruhrverband in North Rhine-Westphalia (NRW), Germany. The analysis focuses on the [...] Read more.
This study evaluates the applicability of Sentinel-1 Persistent Scatterer Interferometry (PSI) data from the Ground Motion Service Germany (BBD) for monitoring dams by comparing it with terrestrial measurements at dams of the Ruhrverband in North Rhine-Westphalia (NRW), Germany. The analysis focuses on the accuracy and reliability of BBD data in detecting movements, considering two observation periods and two satellite observation geometries (Ascending and Descending orbit). BBD data showed high correlations with in situ measurements, particularly for long-term deformation trends. However, weak correlations are observed, especially in the Ascending direction. These inconsistencies highlight the influence of structural characteristics of the dams, observation conditions like incidence angles and changes of the study period on data reliability. Key findings show that BBD data provides valuable insights for observing long-term deformation trends (r up to 0.7) but has limitations in capturing short-term deformations due to its annual update rate. A clear difference was observed when extending the observation period by one year, from 2015–2020 to 2015–2021: although the number of PS (Persistent Scatterers) decreased by up to 60%, the PS showed an improved agreement with in situ measurements, indicating higher data quality (r up to 0.8). However, the precision of BBD data depends on inherent factors from the PSI method such as the satellites’ observation geometry, observation period, and site-specific conditions, underscoring the importance of tailored feasibility assessments. The BBD offers a complementary tool to support the maintenance and safety of dam infrastructures. The study follows an observational multi-site design with predefined, DIN-aligned evaluation criteria and statistical tests and is intended as an assessment of operational support rather than a full operational qualification, outlining conditions under which BBD PSI can complement standards-aligned monitoring. Full article
(This article belongs to the Special Issue Dam Stability Monitoring with Satellite Geodesy II)
Show Figures

Figure 1

29 pages, 43932 KB  
Article
Study on the Surface Deformation Pattern Induced by Mining in Shallow-Buried Thick Coal Seams of Semi-Desert Aeolian Sand Area Based on SAR Observation Technology
by Tao Tao, Xin Yao, Zhenkai Zhou, Zuoqi Wu and Xuwen Tian
Remote Sens. 2025, 17(21), 3648; https://doi.org/10.3390/rs17213648 - 5 Nov 2025
Viewed by 620
Abstract
In the semi-desert aeolian sand areas of Northern China, surface deformation monitoring with SAR is challenged by loss of coherence due to mobile dunes, seasonal vegetation changes, and large-gradient, nonlinear subsidence from underground mining. This study utilizes PALSAR-2 (L-band, 3 m resolution) and [...] Read more.
In the semi-desert aeolian sand areas of Northern China, surface deformation monitoring with SAR is challenged by loss of coherence due to mobile dunes, seasonal vegetation changes, and large-gradient, nonlinear subsidence from underground mining. This study utilizes PALSAR-2 (L-band, 3 m resolution) and Sentinel-1 (C-band, 30 m resolution) data, applying InSAR and Offset tracking methods combined with differential, Stacking, and SBAS techniques to analyze deformation monitoring effectiveness and propose an efficient dynamic monitoring strategy for the Shendong Coalfield. The main conclusions can be summarized as follows: (1) PALSAR-2 data, which has advantages in wavelength and resolution (L-band, multi-look spatial resolution of 3 m), exhibits better interference effects and deformation details compared to Sentinel-1 data (C-band, multi-look spatial resolution of 30 m). The highly sensitive differential-InSAR (D-InSAR) can promptly detect new deformations, while Stacking-InSAR can accurately delineate the range of rock strata movement. SBAS-InSAR can reflect the dynamic growth process of the deformation range as a whole, and SBAS-Offset is suitable for observing the absolute values and morphology of the surface moving basin. The combined application of Stacking-InSAR and Stacking-Offset methods can accurately acquire the three-dimensional deformation field of mining-induced strata movement. (2) The spatiotemporal process of surface deformation caused by coal mining-induced strata movement revealed by InSAR exhibits good correspondence with both the underground mining progress and the development of ground fissures identified in UAV images. (3) The maximum displacement along the line of sight (LOS) measured in the mining area is approximately 2 to 3 m, which is close to the 2.14 m observed on site and aligns with previous studies. The calculated advance influence angle of the No. 22308 working face in the study area is about 38.3°. The influence angle on the solid coal side is 49°, while that on the goaf side approaches 90°. These findings further deepen the understanding of rock movement and surface displacement parameters in this region. The dynamic monitoring strategy proposed in this study is cost-effective and operational, enhancing the observational effectiveness of InSAR technology for surface deformation due to coal mining in this area, and it enriches the understanding of surface strata movement patterns and parameters in this region. Full article
Show Figures

Figure 1

26 pages, 5403 KB  
Article
A Novel Composite Drought Index with Low Lag Response for Monitoring Drought Features on the Mongolian Plateau
by Lizhi Pan, Juanle Wang, Jing Han, Kai Li, Mengmeng Hong and Yating Shao
Remote Sens. 2025, 17(21), 3647; https://doi.org/10.3390/rs17213647 - 5 Nov 2025
Viewed by 847
Abstract
Drought represents one of the most critical environmental hazards in arid and semi-arid regions, exerting profound impacts on ecological security and sustainable development. Nevertheless, many existing drought indices exhibit delayed responses to precipitation and soil moisture anomalies, thereby constraining their ability to characterize [...] Read more.
Drought represents one of the most critical environmental hazards in arid and semi-arid regions, exerting profound impacts on ecological security and sustainable development. Nevertheless, many existing drought indices exhibit delayed responses to precipitation and soil moisture anomalies, thereby constraining their ability to characterize the rapid onset and evolution of drought events. To address this limitation, we propose the Standardized Temperature–Vegetation Drought Index (STVDI), which integrates precipitation, evapotranspiration, temperature, and vegetation dynamics within a Euclidean space framework and explicitly incorporates lag-response analysis. Taking the Mongolian Plateau (MP)—a key transition zone from taiga forest to desert steppe—as the study region, we constructed a 1 km resolution STVDI dataset spanning 2000–2021. Results reveal that over 88% of the MP is highly susceptible to flash droughts, with an average lag time of only 0.52 days, underscoring the index’s capacity for rapid drought detection. Spatial analysis indicates that drought severity peaks during March and April, with moderate drought conditions concentrated in central Mongolia and severe droughts prevailing across southwestern Inner Mongolia. Although trend analysis suggests a slight long-term alleviation of drought intensity, nearly 70% of the MP is projected to experience further intensification in the future. This study delivers the first high-resolution, low-lag drought monitoring dataset for the MP and advances theoretical understanding of drought propagation and lag mechanisms in arid and semi-arid ecosystems. Full article
Show Figures

Figure 1

34 pages, 8163 KB  
Article
ICI-YOLOv8 Rapid Identification of Antarctic Sea Ice Cracks and Numerical Analysis of Monte Carlo Simulation Under Probability Distribution
by Xiaomin Chang, Lulin Zhang, Yuchen Wang, Fuqiang Li, Xu Yao and Yinke Dou
Remote Sens. 2025, 17(21), 3646; https://doi.org/10.3390/rs17213646 - 5 Nov 2025
Viewed by 812
Abstract
Labeling ice cracks in Antarctic near-shore sea ice aerial orthophotos is critical for sea ice cargo route development; rapid, accurate identification and labeling of cracks in UAV imagery aids safe goods transfer between icebreakers and expedition stations, and studying ice crack distribution provides [...] Read more.
Labeling ice cracks in Antarctic near-shore sea ice aerial orthophotos is critical for sea ice cargo route development; rapid, accurate identification and labeling of cracks in UAV imagery aids safe goods transfer between icebreakers and expedition stations, and studying ice crack distribution provides a key basis for assessing sea ice route reliability. Ice cracks have complex morphologies that traditional recognition methods struggle to handle, so this study proposes the ICI-YOLOv8 algorithm to improve sea ice crack detection near Antarctica’s Zhongshan Station, using crack density and fractal dimension to characterize spatial distribution and a Monte Carlo-based numerical model to quantify distribution probability. The algorithm achieves 0.628 accuracy and 0.662 mAP@0.5 (outperforming comparable methods in speed and accuracy) and reaches 0.933 accuracy and 0.657 mAP@0.5 with better generalization than similar models when tested on general remote sensing water datasets; a positive correlation exists between fractal dimension and ice crack density, and Monte Carlo simulation and probability distribution models verify their distribution properties. The proposed algorithm is suitable for rapid summer Antarctic near-shore sea ice crack identification, the numerical model effectively quantifies crack distribution to aid route development, and this study is important for understanding polar ice stability and sea ice route development. Full article
Show Figures

Figure 1

25 pages, 11033 KB  
Article
MSDT-Net: A Multi-Scale Smoothing Attention and Differential Transformer Encoding Network for Building Change Detection in Coastal Areas
by Weitong Ma, Lebao Yang, Yuxun Chen, Yangyu Zhao, Zheng Wei, Xue Ji and Chengyao Zhang
Remote Sens. 2025, 17(21), 3645; https://doi.org/10.3390/rs17213645 - 5 Nov 2025
Cited by 1 | Viewed by 748
Abstract
Island building change detection is a critical technology for environmental monitoring, disaster early warning, and urban planning, playing a key role in dynamic resource management and sustainable development of islands. However, the imbalanced distribution of class pixels (changed vs. unchanged) undermines the detection [...] Read more.
Island building change detection is a critical technology for environmental monitoring, disaster early warning, and urban planning, playing a key role in dynamic resource management and sustainable development of islands. However, the imbalanced distribution of class pixels (changed vs. unchanged) undermines the detection capability of existing methods and severe boundary misdetection. To address issue, we propose the MSDT-Net model, which makes breakthroughs in architecture, modules, and loss functions; a dual-branch twin ConvNeXt architecture is adopted as the feature extraction backbone, and the designed Edge-Aware Smoothing Module (MSA) effectively enhances the continuity of the change region boundaries through a multi-scale feature fusion mechanism. The proposed Difference Feature Enhancement Module (DTEM) enables deep interaction and fusion between original semantic and change features, significantly improving the discriminative power of the features. Additionally, a Focal–Dice–IoU Boundary Joint Loss Function (FDUB-Loss) is constructed to suppress massive background interference using Focal Loss, enhance pixel-level segmentation accuracy with Dice Loss, and optimize object localization with IoU Loss. Experiments show that on a self-constructed island dataset, the model achieves an F1-score of 0.9248 and an IoU value of 0.8614. Compared to mainstream methods, MSDT-Net demonstrates significant improvements in key metrics across various aspects. Especially in scenarios with few changed pixels, the recall rate is 0.9178 and the precision is 0.9328, showing excellent detection performance and boundary integrity. The introduction of MSDT-Net provides a highly reliable technical pathway for island development monitoring. Full article
(This article belongs to the Section Urban Remote Sensing)
Show Figures

Figure 1

21 pages, 3459 KB  
Article
Enhanced Amazon Wetland Map with Multi-Source Remote Sensing Data
by Carlos M. Souza, Jr., Bruno G. Ferreira, Ives Medeiros Brandão, Sandra Rios, John Aguilar-Brand, Juliano Schirmbeck, Emanuel Valero, Miguel A. Restrepo-Galvis, Eva Mollinedo-Veneros, Esteban Terneus, Nelly Rivero, Lucimara Wolfarth Schirmbeck, María A. Oliveira-Miranda, Cícero Cardoso Augusto, Jose Eduardo Victorio Gonzales, Juan Espinosa, Juan Carlos Amilibia, Tony Vizcarra Bentos, Suelma Ribeiro Silva, Judith Rosales Godoy and Helga C. Wiederheckeradd Show full author list remove Hide full author list
Remote Sens. 2025, 17(21), 3644; https://doi.org/10.3390/rs17213644 - 5 Nov 2025
Viewed by 1396
Abstract
The Amazon wetlands are the largest and most diverse freshwater ecosystem globally, characterized by various flooded vegetation and the Amazon River’s estuary. This critical ecosystem is vulnerable to land use changes, dam construction, mining, and climate change. While several studies have utilized remote [...] Read more.
The Amazon wetlands are the largest and most diverse freshwater ecosystem globally, characterized by various flooded vegetation and the Amazon River’s estuary. This critical ecosystem is vulnerable to land use changes, dam construction, mining, and climate change. While several studies have utilized remote sensing to map wetlands in this region, significant uncertainty remains, which limits the assessment of impacts and the conservation priorities for Amazon wetlands. This study aims to enhance wetland mapping by integrating existing maps, remote sensing data, expert knowledge, and cloud computing via Earth Engine. We developed a harmonized regional wetland classification system adaptable to individual countries, enabling us to train and build a random forest model to classify wetlands using a robust remote sensing dataset. In 2020, wetlands spanned 151.7 million hectares (Mha) or 22.0% of the study area, plus an additional 7.4 Mha in deforested zones. The four dominant wetland classes accounted for 98.5% of the total area: Forest Floodplain (89.0 Mha; 58.6%), Lowland Herbaceous Floodplain (29.6 Mha; 19.6%), Shrub Floodplain (16.7 Mha; 11.0%), and Open Water (14.1 Mha; 9.3%). The overall mapping accuracy was 82.2%. Of the total wetlands in 2020, 52.6% (i.e., 79.8 Mha) were protected in Indigenous Territories, Conservation Units, and Ramsar Sites. Threats to the mapped wetlands included 7.4 Mha of loss due to fires and deforestation, with an additional 800,000 ha lost from 2021 to 2024 due to agriculture, urban expansion, and gold mining. Notably, 21 Mha of wetlands were directly affected by both reduced precipitation and surface water in 2020. Our mapping efforts will help identify priorities for wetland protection and support informed decision-making by local governments and ancestral communities to implement conservation and management plans. As 47.4% of the mapped wetlands are unprotected and have some level of threats and pressure, there are also opportunities to expand protected areas and implement effective management and conservation practices. Full article
(This article belongs to the Section Environmental Remote Sensing)
Show Figures

Graphical abstract

20 pages, 31876 KB  
Article
PhixCam: A Tool to Georeference Images Captured by Visible Cameras with Applications for Volcano Monitoring
by Alvaro Aravena, Gabriela Pedreros, Francisco Bucchi, Miguel Gutiérrez-Riquelme and Raffaello Cioni
Remote Sens. 2025, 17(21), 3643; https://doi.org/10.3390/rs17213643 - 5 Nov 2025
Viewed by 623
Abstract
Visible cameras are widely adopted low-cost instruments for volcano monitoring. Images can be used to characterize volcanic activity of variable intensity and style and to estimate key eruption source parameters that are essential for assessing volcanic hazards. Nevertheless, the analysis of images from [...] Read more.
Visible cameras are widely adopted low-cost instruments for volcano monitoring. Images can be used to characterize volcanic activity of variable intensity and style and to estimate key eruption source parameters that are essential for assessing volcanic hazards. Nevertheless, the analysis of images from visible cameras is subject to significant sources of uncertainty and operational limitations. In addition to visibility issues caused by meteorological phenomena and variable illumination, assigning the pixel position of an object of interest (e.g., volcanic plumes, ballistic projectiles) to a specific geographic location and elevation is not straightforward, introducing substantial uncertainty in the estimation of eruption parameters. We present PhixCam, a Python tool that allows the user to georeference in the 3D space the visual field of surveillance cameras from minimal input data: a DEM, the camera position, and a reference image where the framed relief can be outlined. The software includes functions to construct conversion matrices that can be adopted to translate the position of pixels into elevation above sea level when different emission directions of volcanic products are considered, thereby allowing users to assess the confidence of the results. This code was tested on a series of cameras of the Chilean Volcanic Surveillance Network, showing its operative potential in volcanic observatories, and on historical pictures, allowing us to estimate data of interest in volcanology for poorly monitored volcanic events. Full article
(This article belongs to the Section Earth Observation for Emergency Management)
Show Figures

Figure 1

23 pages, 17552 KB  
Article
Spectroscopic Characterization of Built Environments in China
by Christopher Small and Daniel Sousa
Remote Sens. 2025, 17(21), 3642; https://doi.org/10.3390/rs17213642 - 5 Nov 2025
Cited by 1 | Viewed by 686
Abstract
Spectral mixing space characterization is especially important for studies of built environments because of the range of materials around which humans establish residence. With the launch of NASA’s EMIT imaging spectrometer in 2022, spectroscopic characterization of a variety of built environments using atmospherically [...] Read more.
Spectral mixing space characterization is especially important for studies of built environments because of the range of materials around which humans establish residence. With the launch of NASA’s EMIT imaging spectrometer in 2022, spectroscopic characterization of a variety of built environments using atmospherically corrected imagery collected by a common instrument became feasible. The recent availability of four cloud-free EMIT granules imaging Beijing, Chongqing, Guangzhou and Shanghai in early 2025 allows us to address a critical limitation of a 2023 study of built environments using EMIT. The 3D topology of an EMIT mixing space combining all four cities and their surrounding environments shows the familiar ternary structure with Substrate, Vegetation, Dark endmember apexes but extends it to a 3D tetrahedral structure with the addition of a non-photosynthetic vegetation (NPV) endmember. In contrast to multispectral characterizations, EMIT spectra distinguish a variety of anthropogenic substrates not resolvable with broadband sensors. However, semivariogram analysis of coincident 10 m Sentinel-2 and 1.2 m WorldView-3 imagery confirms extensive spectral mixing at the ~50 m scale of the EMIT IFOV. As a result, some of the spectral diversity resolvable with meter resolution spectroscopy is certainly attenuated by decameter resolution sensors. Full article
Show Figures

Figure 1

23 pages, 3843 KB  
Article
Monitoring Maize Yield Variability over Space and Time with Unsupervised Satellite Imagery Features
by Cullen Molitor, Juliet Cohen, Grace Lewin, Steven Cognac, Protensia Hadunka, Jonathan Proctor and Tamma Carleton
Remote Sens. 2025, 17(21), 3641; https://doi.org/10.3390/rs17213641 - 4 Nov 2025
Viewed by 1105
Abstract
Recent innovations in task-agnostic imagery featurization have lowered the computational costs of using machine learning to predict ground conditions from satellite imagery. These methods hold particular promise for the development of imagery-based monitoring systems in low-income regions, where data and computational resources can [...] Read more.
Recent innovations in task-agnostic imagery featurization have lowered the computational costs of using machine learning to predict ground conditions from satellite imagery. These methods hold particular promise for the development of imagery-based monitoring systems in low-income regions, where data and computational resources can be limited. However, these relatively simple prediction pipelines have not been evaluated in developing-country contexts over time, limiting our understanding of their performance in practice. Here, we compute task-agnostic random convolutional features from satellite imagery and use linear ridge regression models to predict maize yields over space and time in Zambia, a country prone to severe droughts and crop failure. Leveraging Landsat and Sentinel 2 satellite constellations, in combination with district-level yield data, our model explains 83% of the out-of-sample maize yield variation from 2016 to 2021, slightly outperforming a model trained on Normalized Difference Vegetation Index (NDVI) features, a common remote sensing approach used by practitioners to monitor crop health. Our approach maintains an R2 score of 0.74 when predicting temporal variation alone, while the performance of the NDVI-based approach drops to an R2 of 0.39. Our findings imply that this task-agnostic featurization can be used to predict spatial and temporal variation in agricultural outcomes, even in contexts with limited ground truth data. More broadly, these results point to imagery-based monitoring as a promising tool for assisting agricultural planning and food security, even in contexts where computationally expensive methodologies remain out of reach. Full article
(This article belongs to the Special Issue Crop Yield Prediction Using Remote Sensing Techniques)
Show Figures

Figure 1

27 pages, 5186 KB  
Article
Detailed Hierarchical Classification of Coastal Wetlands Using Multi-Source Time-Series Remote Sensing Data Based on Google Earth Engine
by Haonan Xu, Shaoliang Zhang, Huping Hou, Haoran Hu, Jinting Xiong and Jichen Wan
Remote Sens. 2025, 17(21), 3640; https://doi.org/10.3390/rs17213640 - 4 Nov 2025
Cited by 1 | Viewed by 1009
Abstract
Accurate and detailed mapping of coastal wetlands is essential for effective wetland resource management. However, due to periodic tidal inundation, frequent cloud cover, and spectral similarity of land cover types, reliable coastal wetland classification methods remain limited. To address these issues, we developed [...] Read more.
Accurate and detailed mapping of coastal wetlands is essential for effective wetland resource management. However, due to periodic tidal inundation, frequent cloud cover, and spectral similarity of land cover types, reliable coastal wetland classification methods remain limited. To address these issues, we developed an integrated pixel- and object-based hierarchical classification strategy based on multi-source remote sensing data to achieve fine-grained coastal wetland classification on Google Earth Engine. With the random forest classifier, pixel-level classification was performed to classify rough wetland and non-wetland types, followed by object-based classification to differentiate artificial and natural attributes of water bodies. In this process, multi-dimensional features including water level, phenology, variation, topography, geography, and geometry were extracted from Sentinel-1/2 time-series images, topographic data and shoreline data, which can fully capture the variability and dynamics of coastal wetlands. Feature combinations were then optimized through Recursive Feature Elimination and Jeffries–Matusita analysis to ensure the model’s ability to distinguish complex wetland types while improving efficiency. The classification strategy was applied to typical coastal wetlands in central Jiangsu in 2020 and finally generated a 10 m wetland map including 7 wetland types and 3 non-wetland types, with an overall accuracy of 92.50% and a Kappa coefficient of 0.915. Comparative analysis with existing datasets confirmed the reliability of this strategy, particularly in extracting intertidal mudflats, salt marshes, and artificial wetlands. This study can provide a robust framework for fine-grained wetland mapping and support the inventory and conservation of coastal wetland resources. Full article
Show Figures

Figure 1

31 pages, 16651 KB  
Article
Heterogeneous Ensemble Landslide Susceptibility Assessment Method Considering Spatial Heterogeneity
by Yiran Yao and Yimin Lu
Remote Sens. 2025, 17(21), 3639; https://doi.org/10.3390/rs17213639 - 4 Nov 2025
Viewed by 785
Abstract
Landslide susceptibility mapping (LSM) is an effective means of assessing landslide risk and has been widely applied. However, current landslide susceptibility assessment studies have not fully considered the spatial heterogeneity characteristics between landslide assessment factors. The performance of a single model is limited [...] Read more.
Landslide susceptibility mapping (LSM) is an effective means of assessing landslide risk and has been widely applied. However, current landslide susceptibility assessment studies have not fully considered the spatial heterogeneity characteristics between landslide assessment factors. The performance of a single model is limited by the structural characteristics of the model itself, and there is a significant limitation on the space for performance improvement. Based on these issues, this paper proposes a heterogeneous ensemble landslide susceptibility assessment method considering spatial heterogeneity. This method first combines the frequency ratio (FR), geographically weighted regression model (GWR), and clustering to partition the study area. Then, Geodetector is used to select the dominant factors for each subregion. Random forest (RF), support vector machine (SVM), and extreme gradient boosting (XGBoost) are selected as the base models, and logistic regression (LR) is selected as the metamodel. The stacking ensemble strategy is used to construct the model to complete a landslide susceptibility assessment in Fujian Province. The results show that compared with other methods, the GWR-S-Geo model considering spatial heterogeneity proposed in this study performs best in the evaluation effect, and performance is improved by 3.2% compared with the stacking ensemble model. This study provides a certain reference value for exploration of the spatial heterogeneity of landslide susceptibility, and also provides a scientific basis for the prevention and control of landslide disasters in Fujian Province. Full article
Show Figures

Figure 1

36 pages, 24572 KB  
Article
Remote Sensing Monitoring of Phragmites Treatment and Fish Habitat Restoration in Long Point, Lake Erie, Canada
by Zhaohua Chen, Yongjun He, Matthew Roffey, Heather Braun, Madeline Sutton, Jason Duffe and Jon Pasher
Remote Sens. 2025, 17(21), 3638; https://doi.org/10.3390/rs17213638 - 4 Nov 2025
Viewed by 777
Abstract
The invasive expansion of Phragmites australis in coastal wetlands, including the Long Point wetland complex in Ontario, has led to significant declines in plant and wildlife diversity, impacting ecosystem functions. Despite ongoing management efforts, the long-term ecological outcomes of Phragmites control remain poorly [...] Read more.
The invasive expansion of Phragmites australis in coastal wetlands, including the Long Point wetland complex in Ontario, has led to significant declines in plant and wildlife diversity, impacting ecosystem functions. Despite ongoing management efforts, the long-term ecological outcomes of Phragmites control remain poorly understood. This study developed a framework to evaluate the long-term efficacy of herbicide treatment by tracking changes in target and non-target plant species and fish habitats in Long Point, Ontario, over an eight-year period (2016–2024). High-resolution satellite imagery from WorldView sensors was classified using a random forest algorithm, achieving over 94% mapping accuracy. Results showed a decrease in Phragmites cover (3–21%) and an increase in fish habitat area (7–58%) within treatment areas. However, some sites also experienced increases in Dead Vegetation (up to 23.6%) and declines in Grass/Herbaceous and Typha (up to 20.5% and 32%, respectively). These findings highlight both the success of Phragmites Best Management Practices and the temporary non-target effects on wetland vegetation. Full article
Show Figures

Figure 1

26 pages, 5512 KB  
Article
Infrared-Visible Image Fusion Meets Object Detection: Towards Unified Optimization for Multimodal Perception
by Xiantai Xiang, Guangyao Zhou, Ben Niu, Zongxu Pan, Lijia Huang, Wenshuai Li, Zixiao Wen, Jiamin Qi and Wanxin Gao
Remote Sens. 2025, 17(21), 3637; https://doi.org/10.3390/rs17213637 - 4 Nov 2025
Cited by 2 | Viewed by 3375
Abstract
Infrared-visible image fusion and object detection are crucial components in remote sensing applications, each offering unique advantages. Recent research has increasingly sought to combine these tasks to enhance object detection performance. However, the integration of these tasks presents several challenges, primarily due to [...] Read more.
Infrared-visible image fusion and object detection are crucial components in remote sensing applications, each offering unique advantages. Recent research has increasingly sought to combine these tasks to enhance object detection performance. However, the integration of these tasks presents several challenges, primarily due to two overlooked issues: (i) existing infrared-visible image fusion methods often fail to adequately focus on fine-grained or dense information, and (ii) while joint optimization methods can improve fusion quality and downstream task performance, their multi-stage training processes often reduce efficiency and limit the network’s global optimization capability. To address these challenges, we propose the UniFusOD method, an efficient end-to-end framework that simultaneously optimizes both infrared-visible image fusion and object detection tasks. The method integrates Fine-Grained Region Attention (FRA) for region-specific attention operations at different granularities, enhancing the model’s ability to capture complex information. Furthermore, UnityGrad is introduced to balance the gradient conflicts between fusion and detection tasks, stabilizing the optimization process. Extensive experiments demonstrate the superiority and robustness of our approach. Not only does UniFusOD achieve excellent results in image fusion, but it also provides significant improvements in object detection performance. The method exhibits remarkable robustness across various tasks, achieving a 0.8 and 1.9 mAP50 improvement over state-of-the-art methods on the DroneVehicle dataset for rotated object detection and the M3FD dataset for horizontal object detection, respectively. Full article
Show Figures

Figure 1

22 pages, 57638 KB  
Article
Comparison of a Semiempirical Algorithm and an Artificial Neural Network for Soil Moisture Retrieval Using CYGNSS Reflectometry Data
by Hamed Izadgoshasb, Emanuele Santi, Flavio Cordari, Leila Guerriero, Leonardo Chiavini, Veronica Ambrogioni and Nazzareno Pierdicca
Remote Sens. 2025, 17(21), 3636; https://doi.org/10.3390/rs17213636 - 3 Nov 2025
Viewed by 777
Abstract
This research, carried out within the framework of the European Space Agency’s second Scout mission (HydroGNSS), seeks to utilize CYGNSS Level 1B products over land for soil moisture estimation. The approach involves a novel physically based algorithm, which inverts a semiempirical forward model [...] Read more.
This research, carried out within the framework of the European Space Agency’s second Scout mission (HydroGNSS), seeks to utilize CYGNSS Level 1B products over land for soil moisture estimation. The approach involves a novel physically based algorithm, which inverts a semiempirical forward model of surface reflectivity proposed in the literature. An Artificial Neural Network (ANN) algorithm has also been developed. Both methods are implemented in the frame of the HydroGNSS mission to make the most of the reliability of an approach rooted in a physical background and the power of a data-driven approach that may suffer from limited training data, especially right after launch. The study aims to compare the results and performance of these two methods. Additionally, it intends to evaluate the impact of auxiliary data. The static auxiliary data include topography, Above Ground Biomass (AGB), land cover, and surface roughness. Dynamic auxiliary data include Vegetation Water Content (VWC) and Vegetation Optical Depth (VOD) from Soil Moisture Active Passive (SMAP), as well as Normalized Difference Vegetation Index (NDVI) and Normalized Difference Water Index (NDWI) from Moderate Resolution Imaging Spectroradiometer (MODIS), on enhancing the accuracy of retrievals. The algorithms were trained and validated using target soil moisture values derived from SMAP L3 global daily products and in situ measurements from the International Soil Moisture Network (ISMN). In general, the ANN approach outperformed the semiempirical model with RMSE = 0.047 m3 m−3 and R = 0.91. We also introduced a global stratification framework by intersecting land cover classes with climate regimes. Results show that the ANN consistently outperforms the semiempirical model in most strata, achieving around RMSE = 0.04 m3 m−3 and correlations above 0.8. The semiempirical model, however, remained more stable in data-scarce conditions, highlighting complementary strengths for HydroGNSS. Full article
Show Figures

Figure 1

29 pages, 16291 KB  
Article
Analysis of the Current Situation of CO2 Satellite Observation
by Yuanbo Li, Kun Wu, Yuk Ling Yung, Xiaomeng Wang and Jixun Han
Remote Sens. 2025, 17(21), 3635; https://doi.org/10.3390/rs17213635 - 3 Nov 2025
Viewed by 1254
Abstract
Accurate quantification of carbon dioxide (CO2) sources and sinks is becoming a key aspect in recent carbon flux research; yet our understanding of satellite performance on regional scales remains insufficient. In this work, the column-averaged dry-air mole fraction of CO2 [...] Read more.
Accurate quantification of carbon dioxide (CO2) sources and sinks is becoming a key aspect in recent carbon flux research; yet our understanding of satellite performance on regional scales remains insufficient. In this work, the column-averaged dry-air mole fraction of CO2 retrieved from OCO-2 v11.1r and GOSAT v03.05 was evaluated against CarbonTracker (CT) using data from March 2022 to August 2023. Also, the satellite data were validated against those from the Total Carbon Column Observing Network (TCCON) for March 2022 to February 2024. Comparison with CT revealed that both satellites had a general negative bias over land and the best performance in spring. In Southern Hemisphere land regions, the satellites captured monthly variability reliably, with OCO-2 obtaining the most accurate monthly concentrations. In Northern Hemisphere land regions, CT demonstrated the best performance, although both satellites accurately quantified monthly variations in some regions. In tropical land regions, none of the satellites showed superior performance. OCO-2 data showed bias features in sub-regional areas such as East and South Asia. For ocean regions, the bias was the largest in spring. Phase offset, slight underestimation of concentrations, and seasonal biases were found over several ocean regions in OCO-2 time series, whereas GOSAT was unable to provide reasonable results. When comparing TCCON with OCO-2 and GOSAT data, we found systematic errors of −0.12 and −0.56 ppm and root mean square errors of 1.08 and 1.70 ppm, respectively, mainly contributed by topographic variation and aerosol load. The errors were the smallest in spring and larger in summer and winter. Both CT- and TCCON-based analyses indicated that current satellite products may have better performance in desert surfaces. Clouds, aerosols, and surface pressure still challenged OCO-2 retrieval, while the bias-correction process can be emphasized for GOSAT. Full article
Show Figures

Figure 1

26 pages, 4680 KB  
Article
Onboard Hyperspectral Super-Resolution with Deep Pushbroom Neural Network
by Davide Piccinini, Diego Valsesia and Enrico Magli
Remote Sens. 2025, 17(21), 3634; https://doi.org/10.3390/rs17213634 - 3 Nov 2025
Viewed by 1071
Abstract
Hyperspectral imagers on satellites obtain the fine spectral signatures that are essential in distinguishing one material from another but at the expense of a limited spatial resolution. Enhancing the latter is thus a desirable preprocessing step in order to further improve the detection [...] Read more.
Hyperspectral imagers on satellites obtain the fine spectral signatures that are essential in distinguishing one material from another but at the expense of a limited spatial resolution. Enhancing the latter is thus a desirable preprocessing step in order to further improve the detection capabilities offered by hyperspectral images for downstream tasks. At the same time, there is growing interest in deploying inference methods directly onboard satellites, which calls for lightweight image super-resolution methods that can be run on the payload in real time. In this paper, we present a novel neural network design, called Deep Pushbroom Super-Resolution (DPSR), which matches the pushbroom acquisition of hyperspectral sensors by processing an image line by line in the along-track direction with a causal memory mechanism to exploit previously acquired lines. This design greatly limits the memory requirements and computational complexity, achieving onboard real-time performance, i.e., the ability to super-resolve a line in the time that it takes to acquire the next one, on low-power hardware. Experiments show that the quality of the super-resolved images is competitive with or even surpasses that of state-of-the-art methods that are significantly more complex. Full article
(This article belongs to the Section AI Remote Sensing)
Show Figures

Figure 1

20 pages, 9125 KB  
Article
Spatiotemporal Dynamics of NEP and Its Influencing Factors: Exploring the Impact Mechanisms Under Extreme Climate Conditions
by Li Wang, Wei Chen, Wanjuan Song, Ni Huang, Yuelin Zhang, Guoxu Li, Xin Zhang, Yu Peng and Zheng Niu
Remote Sens. 2025, 17(21), 3633; https://doi.org/10.3390/rs17213633 - 3 Nov 2025
Viewed by 610
Abstract
Current research on net ecosystem productivity (NEP) still lacks sufficient attention to the impacts of extreme climate events, particularly in understanding the interactive response mechanisms of carbon sinks under extreme climate conditions. This study investigated the spatiotemporal dynamics of NEP and its interactive [...] Read more.
Current research on net ecosystem productivity (NEP) still lacks sufficient attention to the impacts of extreme climate events, particularly in understanding the interactive response mechanisms of carbon sinks under extreme climate conditions. This study investigated the spatiotemporal dynamics of NEP and its interactive mechanisms in Dongying, China, from 2001 to 2023 under extreme climate conditions. Using trend slope estimation, geographical detector, and XGBoost methods, we systematically revealed the responses of NEP to the factors including climatic changes, human activities, vegetation growth status, and topographic features. The results indicated that NEP exhibited an overall fluctuating yet increasing trend during 2001–2023. The normalized difference vegetation index (NDVI, for vegetation growth status) and the digital elevation model (DEM, for terrain features) were identified as the dominant factors influencing the spatial heterogeneity of NEP. However, extreme precipitation and high temperature events significantly diminished the positive contribution of the NDVI to NEP, while simultaneously amplifying the negative influence of the DEM on NEP. These two concurrent changes superimposed on each other, especially after 2017, further constrained the potential for carbon sequestration. Furthermore, a lag effect was observed in the response mechanisms of NEP to factors under the influence of precipitation and high-temperature climates. These findings highlight the critical and complex role of extreme climate in reorganizing the contributions of factors and intensifying pressure on the carbon sequestration capacity of ecosystems. Full article
Show Figures

Figure 1

20 pages, 17743 KB  
Article
Integrated Surveying for Architectural Heritage Documentation in Iraq: From LiDAR Scanner to GIS Applications
by Gehan Selim, Nabil Bachagha, Dhirgham Alobaydi, Sabeeh Lafta Farhan and Aussama Tarabeih
Remote Sens. 2025, 17(21), 3632; https://doi.org/10.3390/rs17213632 - 3 Nov 2025
Viewed by 1516
Abstract
In recent years, remote sensing technologies have become indispensable for the documentation, analysis, and virtual preservation of historical, architectural, and archaeological heritage. Advances in 3D scanning have enabled the precise digital recording of complex structures as large-scale point clouds, facilitating highly detailed virtual [...] Read more.
In recent years, remote sensing technologies have become indispensable for the documentation, analysis, and virtual preservation of historical, architectural, and archaeological heritage. Advances in 3D scanning have enabled the precise digital recording of complex structures as large-scale point clouds, facilitating highly detailed virtual reconstructions. This study evaluates the capability of LiDAR-based Terrestrial Laser Scanning (TLS) for documenting historical monument façades within a 3D environment and generating accurate visualisation models from registered, colourised point clouds. The integration of high-resolution RGB imagery, processed through Reality Capture 1.5 software, enables the automatic production of realistic 3D models that combine geometric accuracy with visual fidelity. Simultaneously, Geographic Information Systems (GIS), particularly cloud-based platforms like ArcGIS Pro Online, enhance spatial data management, mapping, and analysis. When combined with TLS, GIS is part of a broader remote sensing framework that improves heritage documentation regarding precision, speed, and interpretability. The digital survey of the Shanasheel house in Al-Basrah, Iraq, demonstrates the effectiveness of this interdisciplinary approach. These architecturally and culturally significant buildings, renowned for their intricately decorated wooden façades, were digitally recorded using CAD-based methods to support preservation and mitigation against urban and environmental threats. This interdisciplinary workflow demonstrates how remote sensing technologies can play a vital role in heritage conservation, enabling risk assessment, monitoring of urban encroachment, and the protection of endangered cultural landmarks for future generations. Full article
Show Figures

Figure 1

21 pages, 3859 KB  
Article
Low-Frequency Ground Penetrating Radar for Active Fault Characterization: Insights from the Southern Apennines (Italy)
by Nicola Angelo Famiglietti, Gaetano Memmolo, Antonino Memmolo, Robert Migliazza, Nicola Gagliarde, Daniela Di Bucci, Daniele Cheloni, Annamaria Vicari and Bruno Massa
Remote Sens. 2025, 17(21), 3631; https://doi.org/10.3390/rs17213631 - 3 Nov 2025
Viewed by 1562
Abstract
Ground Penetrating Radar (GPR) is a powerful tool for imaging shallow stratigraphic and structural features. This study shows that it is particularly effective also in detecting near-surface evidence of active faulting. In the Southern Apennines (Italy), one of the most seismically active regions [...] Read more.
Ground Penetrating Radar (GPR) is a powerful tool for imaging shallow stratigraphic and structural features. This study shows that it is particularly effective also in detecting near-surface evidence of active faulting. In the Southern Apennines (Italy), one of the most seismically active regions of the Mediterranean area, the shallow expression of active faults is often poorly constrained due to limited or ambiguous surface evidence. Low-frequency GPR profiles were acquired in the Calore River Valley (Campania Region), an area historically affected by large earthquakes and characterized by debated seismogenic sources. The surveys employed multiple antenna frequencies (30, 60, and 80 MHz) and both horizontal and vertical acquisition geometries, enabling penetration depths ranging from ~5 m to ~50 m. The acquired GPR profiles, integrated with high-precision georeferencing, were able to reveal the presence of shallow steeply dipping active normal faults striking E–W to ENE–WSW, here named the Postiglione Fault System. Therefore, this study highlights the methodological potential of low-frequency GPR for investigating active faults in carbonate substratum and fine-to-coarse-grained sedimentary units and thus contributing to refining the seismotectonic framework and improving seismic hazard assessment of seismically active areas such as the Southern Apennines. Full article
Show Figures

Figure 1

20 pages, 3046 KB  
Article
Integrating Remotely Sensed Thermal Observations for Calibration of Process-Based Land-Surface Models: Accuracy, Revisit Windows, and Implications in a Dryland Ecosystem
by Arnau Riba, Monica Garcia, Ana M. Tarquís, Francisco Domingo, Michal Antala, Sijia Feng, Jun Liu, Mark S. Johnson, Yeonuk Kim and Sheng Wang
Remote Sens. 2025, 17(21), 3630; https://doi.org/10.3390/rs17213630 - 3 Nov 2025
Viewed by 709
Abstract
Understanding land surface fluxes is essential for sustaining dryland ecosystem functioning and services. However, the scarcity of in situ measurements poses a significant challenge to dryland monitoring. Satellite optical and thermal remote sensing data can provide the instantaneous estimates of land surface fluxes, [...] Read more.
Understanding land surface fluxes is essential for sustaining dryland ecosystem functioning and services. However, the scarcity of in situ measurements poses a significant challenge to dryland monitoring. Satellite optical and thermal remote sensing data can provide the instantaneous estimates of land surface fluxes, such as surface temperature (LST), net radiation (Rn), sensible heat flux (H), evapotranspiration (latent heat flux, LE), and gross primary productivity (GPP). However, satellite-based estimates are often limited by sensor revisit frequencies and cloud-cover conditions. To facilitate temporally continuous estimation, process-based land surface models are often used to integrate sparse remote sensing observations and meteorological inputs, thereby generating continuous estimates of energy, water, and carbon fluxes. However, the impact of satellite thermal data accuracy and temporal resolutions on simulating land surface fluxes is under-explored, particularly in dryland ecosystems. Therefore, this study assessed the accuracy of Moderate Resolution Imaging Spectroradiometer (MODIS) thermal infrared data in a dryland tussock grassland ecosystem in southern Spain. We also assessed the incorporation and various temporal frequencies of thermal data into process-based modelling for simulating land surface fluxes. The model simulations were validated against in situ measurements from eddy covariance towers. Results show that MODIS LST has a high correlation but large bias with in situ measurements (R2 = 0.81, RMSE = 4.34 °C). After a linear correction of MODIS LST with in situ measurements, we found that the adjusted MODIS LST can effectively improve the half-hourly simulation of LST, Rn, H, LE, SWC, and GPP with relative RMSEs of 7.84, 5.67, 7.81, 11.32, 6.59, and 13.09%, respectively. Such performance is close to the flux simulations driven by in situ LST. We also found that by adjusting the revisit frequency of the satellite sensor to 8 days, the model performance of simulating surface fluxes did not change significantly. This study provides insights into how satellite thermal remote sensing can be integrated with the process-based model to understand dryland ecosystem functioning, which is critical for ecological management and climate adaptation strategies. Full article
(This article belongs to the Section Environmental Remote Sensing)
Show Figures

Figure 1

22 pages, 2311 KB  
Article
Integrated Rainfall Estimation Using Rain Gauges and Weather Radar: Implications for Rainfall-Induced Landslides
by Michele De Biase, Valeria Lupiano, Francesco Chiaravalloti, Giulio Iovine, Marina Muto, Oreste Terranova, Vincenzo Tripodi and Luca Pisano
Remote Sens. 2025, 17(21), 3629; https://doi.org/10.3390/rs17213629 - 2 Nov 2025
Viewed by 980
Abstract
The availability of reliable and spatially distributed rainfall data is a key element flood and landslide risk assessment, both for forecasting and post-event analysis. In this context, this study evaluates the contribution of radar-based rainfall estimates to enhancing the spatial accuracy of precipitation [...] Read more.
The availability of reliable and spatially distributed rainfall data is a key element flood and landslide risk assessment, both for forecasting and post-event analysis. In this context, this study evaluates the contribution of radar-based rainfall estimates to enhancing the spatial accuracy of precipitation fields with respect to those derived from rain gauge networks alone. The analysis was conducted over a ~100 km2 area in the Liguria Region, north-western Italy, characterized by a dense rain gauge network, with an average density of one gauge per 10 km2, and covers seven years of hourly rainfall observations. Radar-derived rainfall fields, available at a 1 × 1 km2 spatial resolution, were locally corrected across the study area by interpolating gauge-based local correction factors through an Inverse Distance Weighting (IDW) scheme. The corrected radar fields were then assessed through Leave-P-Out Cross-Validation and rainfall-intensity-based classification, also simulating scenarios with progressively reduced gauge density. The results demonstrate that radar-corrected estimates systematically provide a more accurate spatial representation of rainfall, especially for high-intensity events and in capturing the actual magnitude of local rainfall peaks, even in areas covered by a dense rain gauge network. Regarding the implications for rainfall-induced landslide hazard assessment, the analysis of 56 landslides from the ITALICA (Italian Rainfall-Induced Landslides Catalogue) database showed that including radar information can lead to significant differences in the estimation of rainfall thresholds for landslide initiation compared with gauge-only data. Full article
(This article belongs to the Section Remote Sensing in Geology, Geomorphology and Hydrology)
Show Figures

Graphical abstract

23 pages, 6936 KB  
Article
Assessing Subsidence in Remote Reclaimed Islands by Integrating PPP, Leveling, and InSAR
by Deming Ma, Yonggang Jia, Baoquan Cheng, Yabin Wang and Menghao Li
Remote Sens. 2025, 17(21), 3628; https://doi.org/10.3390/rs17213628 - 2 Nov 2025
Viewed by 996
Abstract
To address the urgent need for safety maintenance of remote reclaimed islands, we propose a novel monitoring framework integrating PPP, leveling, and InSAR technologies to comprehensively capture slow surface deformations across point, line, and area dimensions. This study also details the data interpretation [...] Read more.
To address the urgent need for safety maintenance of remote reclaimed islands, we propose a novel monitoring framework integrating PPP, leveling, and InSAR technologies to comprehensively capture slow surface deformations across point, line, and area dimensions. This study also details the data interpretation methods and critical processing workflow, using Shandong Haiyang Junzi-Lianli island as a case study. The monitoring results revealed maximum annual displacements of 2 mm for PPP reference points, 5 mm elevation variations for leveling benchmarks, and an average InSAR deformation rate of −0.34 mm/yr with peak deformation reaching 18.60 mm/yr. Meanwhile, cross-validation was performed on the results obtained from these three different techniques. The discrepancy between the benchmark PPP observation and the InSAR measurement was 3.81 mm. For the common monitoring points, the differences between leveling and InSAR ranged from 0.57 mm to 5.41 mm. The deformation trends observed in PPP reference points, leveling benchmarks, and corresponding InSAR time-series data demonstrated good consistency, indicating overall stability of the reclamation island. The proposed methodology accurately identifies minute surface deformations at different spatial scales (point, linear, and areal) of the artificial island, overcoming the limitations of single-technique approaches, thus proving to be an effective means for subsidence assessment of offshore artificial island structures. This study advances the technical framework for reclaimed island stability monitoring, offering data and solutions to identify subsidence risks and enhance disaster prevention. Full article
Show Figures

Figure 1

Previous Issue
Back to TopTop