Highlights
What are the main findings?
- The ICESat-2 photons distributed along the trajectory have difficulty controlling the entire bathymetry inversion area.
- Pixels with identical spectral properties in an image typically correspond to similar bathymetric values.
What is the implication of the main finding?
- Based on the spectral values of image pixels corresponding to ICESat-2 photons, bathymetric values can be obtained for other pixels with identical spectral properties.
- ICESat-2 photons and virtual control points can uniformly control the entire bathymetry inversion area.
Abstract
Satellite-derived bathymetry (SDB) using Ice, Cloud, and Land Elevation satellite-2 (ICESat-2) LiDAR data and remote sensing images faces challenges in the difficulty of uniform coverage of the inversion area by the bathymetric control points due to the linear sampling pattern of ICESat-2. This study proposes a novel virtual control point optimization framework integrating inverse distance weighting (IDW) and spectral confidence analysis (SCA). The methodology first generates baseline bathymetry through semi-empirical band ratio modeling (control group), then extracts virtual control points via SCA. An optimization scheme based on spectral confidence levels is applied to the control group, where high-confidence pixels utilized a residual correction-based strategy, while low-confidence pixels employed IDW interpolation based on a virtual control point. Finally, the preceding optimization scheme uses weighting-based fusion with the control group to generate the final bathymetry map, which is also called the optimized group. Accuracy assessments over the three research areas revealed a significant increase in accuracy from the control group to the optimized group. When compared with in situ data, the determination coefficient (R2), RMSE, MRE, and MAE in the optimized group are better than 0.83, 1.48 m, 12.36%, and 1.22 m, respectively, and all these indicators are better than those in the control group. The key innovation lies in overcoming ICESat-2’s spatial sampling limitation through spectral confidence stratification, which uses SCA to generate virtual control points and IDW to adjust low-confidence pixel values. It is also suggested that when applying ICESat-2 satellite data in active–passive-fused SDB, the distribution of training data in the research zone should be adequately considered.
1. Introduction
With increasing human activities in the ocean, such as marine military activities and coastal travel, the need for shallow bathymetric research has substantially increased [1,2]. The retrieval of shallow water depth data can improve research in multiple fields, including the oceanic environment and marine geology. Currently, typical bathymetric methods include shipboard single-beam or multibeam surveys and airborne laser bathymetry, but these methods have difficulty balancing bathymetric accuracy, efficiency, and cost [3]. Shipboard single-beam or multibeam surveys typically achieve high accuracy but require onboard operations and an abundance of labor, resulting in high-cost and time-consuming processes. Airborne laser bathymetry is less limited by the terrain environment and can obtain numerous bathymetric points with high efficiency. Nevertheless, due to its complex data processing, airborne bathymetry often results in greater operational difficulties and high measurement costs [4]. The launch of the Surface Water and Ocean Topography (SWOT) satellite represents a revolutionary breakthrough in satellite altimetry. Satellite altimetry technology enables the determination of the oceanic geoid. By leveraging the relationship between the geoid and gravitational anomalies, it acquires oceanic gravity anomalies and reconstructs seafloor topography. However, oceanic gravity anomalies are primarily employed for large-scale deep-sea seafloor topography inversion [5]. Currently, satellite-derived bathymetry (SDB) based on remote sensing images has become a popular method for shallow topography inversion in recent years, and the advantages of large detection ranges, low costs, and repeated observations have made it faster and more cost-effective to obtain bathymetric maps [6].
In the field of SDB, researchers have investigated many inversion models [7,8,9]. The transmission rate of the blue-green band is relatively high, and this band has excellent ability to penetrate the water column to a certain water depth and reflect the underwater topography [10]. This concept establishes the theoretical foundation for SDB, from which three dominant methodological frameworks have evolved, including physical models, semiempirical models, and statistical models [11]. Physical models rigorously solve radiative transfer equations but require intensive in situ optical parameters, limiting operational applications. The statistical models establish empirical depth–radiance relationships through regression, yet suffer from poor generalizability due to disregarded hydro-optical mechanisms. Semiempirical models, such as band-ratio techniques, synergize physical principles (exponential radiance-depth decay) with empirical corrections. By reducing sensitivity to environmental noise and optical parameter variability, semiempirical approaches balance theoretical rigor with practical feasibility, emerging as the dominant paradigm for SDB applications [12,13,14].
Recent studies have confirmed that the Ice, Cloud, and Land Elevation satellite-2 (ICESat-2) has excellent bathymetric mapping capabilities [15,16,17,18]. Launched in 2018 by NASA, the design of ICESat-2 included two decisions that enabled it to provide the advanced topographic laser altimeter system (ATLAS) with quantified bathymetric measurements: the selection of single photon-sensitive photomultiplier (PMT) detectors and the use of a visible, green (532 nm) laser [19,20]. These two factors are related, as the only available space-hardened PMTs for ATLAS are optimized at 532 nm [21]. After launch, as the initial ICESat-2 data became available, the bathymetric measurement performance of ICESat-2 clearly exceeded expectations. Multiple studies have confirmed the ability to retrieve bathymetry to ~1 Secchi depth or >40 m depth in very clear waters, with typical accuracies in the order of 0.5 m [22,23,24,25,26]. Therefore, a new Level-3a data product focusing on long-track bathymetry extraction was developed to fully utilize the bathymetric mapping capacity of ICESat-2 and provide training samples for semiempirical models to conduct shallow water inversion.
Substantial focus has been devoted to SDB in the literature based on ICESat-2 datasets. Babbel et al. generated bathymetric surface models using ICESat-2-aided SDB and compared the model results with airborne lidar data [27]. Hsu et al. developed an automatic surface detection algorithm for ICESat-2 ATL03 point clouds to obtain a set of depth measurements for SDB mapping [28]. Leng et al. proposed an ICESat-2 bathymetric signal reconstruction method based on active–passive data fusion to compensate for partially missing ICESat-2 bathymetric signals [29]. Xie et al. proposed a convolutional neural network model based on physical radiative transfer information to better reveal the correlation between spectral information and water depth [30]. Wicaksono et al. provided a comprehensive reference for developing robust automated mapping models for producing SDB, increasing the availability of optically shallow water bathymetry information worldwide while reducing the cost of conducting bathymetric surveys [31]. Li et al. proposed a multi-temporal image fusion-based shallow-water bathymetry inversion method using ICESat-2 laser data and sentinel-2 image [32]. Xie et al. used ICESat-2 and multispectral images to construct a neural network bathymetric inversion model to obtain bathymetric inversion results for the shallow water area of the Caribbean Sea [33]. Chen et al. proposed a high-accuracy bathymetric method fusing ICESat-2 datasets and the two-media photogrammetry model [34]. Xie et al. developed a physics-informed convolutional neural network to invert shallow ocean bathymetry based on ICESat-2 and Sentinel-2 imagery [35]. Li et al. constructed a random forest bathymetry inversion model to obtain the bathymetry in a shallow sea area based on ICESat-2 and multispectral images [36]. However, in existing studies, missing bathymetry control data are still a challenge, especially in locations far from training ICESat-2 data. The greatest problem is that ICESat-2 sample points are typically poorly distributed and occupy a smaller area than traditional sample points (Figure 1).
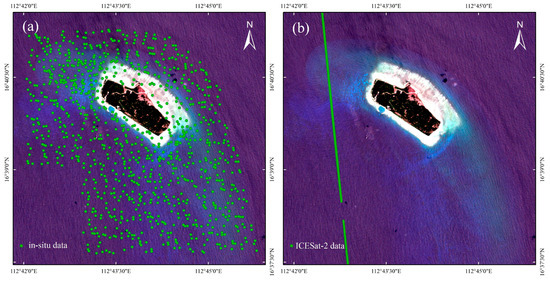
Figure 1.
Different distributions of sample points in bathymetry mapping. (a) Distribution of traditional sample points. (b) Distribution of ICESat-2 sample points.
To address this issue, this paper proposes an improved ICESat-2-based SDB strategy that generates virtual control points via spectral information analysis to ensure an improved distribution of sample points from ICESat-2. The novelty of this paper can be summarized as follows:
- On the basis of our known information, this is the first work to propose a bathymetry method based on virtual control points.
- This is also the first study to rectify bathymetry mapping via IDW of virtual control points and fuse spatial information in the resulting bathymetry.
- The proposed method fits well in areas with varying water depths and differing shallow seafloor terrains.
The remainder of this paper is organized as follows. In Section 2, we detail our method with a comprehensive process from data preprocessing to the assessment of accuracy. In Section 3, selected datasets and study areas are introduced individually, followed by the results of the experiments. In Section 4, the advantages and disadvantages of the proposed method are discussed and analyzed. Section 5 concludes our work and states the advantages, issues, and our future study interests.
2. Materials and Methods
2.1. Study Area
The South China Sea is located in the southern Chinese mainland region, where the abundant travel and natural resources reflect its immense value to related ocean research. In this work, we selected three areas in the South China Sea, namely, Dong Island, Ganquan Island, and Wuzhizhou Island, to test the effectiveness of our strategy. The study area selected includes both inshore and offshore islands. Each island has different water depths and varied topography. In addition, the water quality in the study area is both clear and turbid. Therefore, a diverse study area allows for full validation of the performance and effectiveness of the proposed method. The location and extent of the study area are shown in Figure 2.
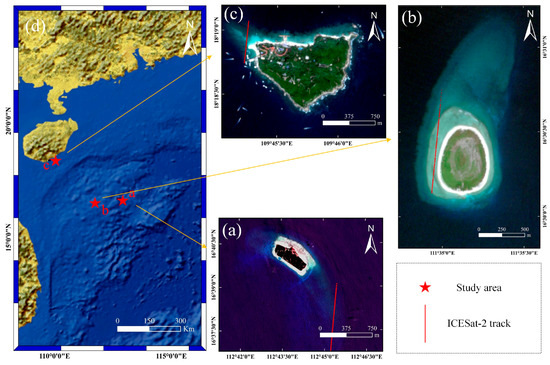
Figure 2.
Study area. (a) Dong Island. (b) Ganquan Island. (c) Wuzhizhou Island. (d) General distribution of the three experimental areas.
Dong Island, located east of the Paracel Islands, is located within 16°40′N and 112°44′E. The Paracel Islands are far from the mainland; thus, they are less affected by human activities, and there is less suspended particulate matter in the surrounding seawater. The water quality is clear, and the visibility is high, generally up to 20~30 m.
Ganquan Island is located in the South China Sea, and the surrounding waters are deep and suitable for the growth of a variety of marine life. The diverse topography of the island includes hills, sandy beaches, and coastlines, forming a rich natural landscape. Its overall coverage is approximately 300 m2.
Wuzhizhou Island is located off the coast of Hainan Province and covers an area of approximately 1.48 km2. The seawater around Wuzhizhou Island is slightly turbid with a wide variety of marine life, which is of great marine ecological significance and tourism value.
2.2. Data
2.2.1. ICESat-2 ALT03 Data
The ICESat-2 satellite, which was launched by the National Aeronautics and Space Administration (NASA), has been confirmed to be an effective instrument for measuring shallow water bathymetry, and data products from its primary sensor, the advanced topographic laser altimeter system (ATLAS), are increasingly widely used for satellite-derived bathymetry. The ATL03 data constitute the ICESat-2 Level-2 global geolocated photon product, which provides acquisition time, latitude, longitude, and other information for each individual photon. Therefore, we chose the ALT03 data as the training data for our experiment, and the data selection was performed according to the following criteria: (1) the consistency of the data presents an obvious terrain characteristic, and (2) the scope of the water depth in each study area covers a sufficient range to guarantee the validity of the resulting bathymetry. The visualization of the data trajectory we used is outlined in red in Figure 2, and its detailed information is listed in Table 1.

Table 1.
Detailed information on the experimental data.
2.2.2. Sentinel-2 Images
We selected Sentinel-2 images to implement bathymetry mapping. Sentinel-2 is missioned to provide open-access observation data of Earth; it is equipped with a multispectral instrument (MSI) and has spatial resolutions of 10 m, 20 m, and 60 m. The Sentinel-2 data cover 13 bands ranging from the visible spectrum to the near-infrared spectrum, among which we chose band 2 (blue, ~492 nm), band 3 (green, ~559 nm), band 4 (red, ~664.6 nm), and band 8 (infrared, ~832.8 nm) to construct the basic inversion model. Visualization and further information on the imagery we applied in this work are presented in Figure 2. All the imagery was chosen because of the following: (1) limited cloud cover, (2) preferable optical effect, and (3) limited image noise.
2.2.3. In Situ Bathymetry Data
To further examine the effectiveness of our results, we used in situ survey data to test the inversion result instead of cross-validating from training data. The in situ data were measured by a shipborne single-beam echosounder from the First Institute of Oceanography, Ministry of Natural Resources, in 2020, which has centimeter-level error in this area and higher spatial resolution (footprint diameter ≈ 10 m) than ICESat-2/ATLAS. Due to the different post-processing methods used for the in situ data, the data were recorded as points or DEMs, and the in situ points were interpolated using IDW to evaluate the fit to the inversion results, which were organized in grid format.
2.3. Methods
The overall steps of the workflow followed in this study are shown in Figure 3. Our strategy divides the main experiment into two groups and is composed of the following four steps: data preprocessing, preliminary bathymetry estimation via a basic semiempirical model, extraction of virtual control points, and bathymetry rectification based on virtual control points. The general strategy of rectification is exhibited in the teal zone of Figure 3.
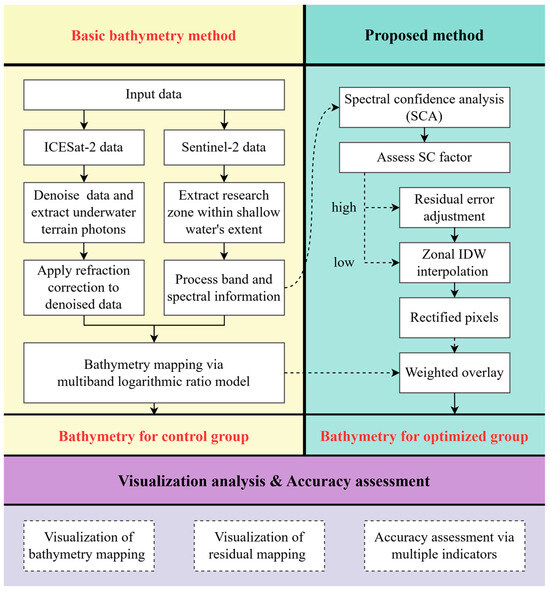
Figure 3.
Flowchart of this work.
2.3.1. ICESat-2 Data Preprocessing
The elevation datum of the ICESat-2 ATL03 data is the World Geodetic System-1984 Coordinate System (WGS84), whereas the bathymetric inversion results usually use mean sea level as the elevation datum. Therefore, the Egeoid parameter in the ATL03 data was used to convert the ATL03 data elevation datum from WGS84 to mean sea level. Typically, there is a large amount of noise in the ICESat-2 raw data, which results in the extraction of terrain photons [37,38,39]. In this work, the sea surface photons are first separated from the water column photons using kernel density estimation (KDE) [40]. Then, the water column photons are denoised using the density-based spatial clustering of applications with noise (DBSCAN) algorithm to obtain the seafloor photons, in which we empirically selected the eps and min-sample parameters through visual inspection to optimize DBSCAN’s noise suppression performance [19]. To obtain precise bathymetric information, refraction correction is necessary for seafloor photons because of the difference in refractive indices between the atmosphere and water bodies [41]. The law of refraction can be expressed as follows:
where is the angle difference between the incidence angle and the reflection angle; is the difference between and the angle of the gradient of the line segment between the predicted photon location and actual location; is the actual transmission distance of the laser under water; and is the length of the line between the predicted photon location and the actual location.
2.3.2. Sentinel-2 Image Preprocessing
In the basic inversion model used in this study, only the bands in the red, green, blue, and infrared channels of the Sentinel-2 image need to be preserved to reduce the time and storage requirements during data processing. Additionally, the region of interest of shallow water is masked by the normalized difference water index (NDWI). The definition of the NDWI is as follows:
where and represent the reflectance in the green and infrared bands, respectively. The NDWI value indicates a water feature, and when the pixel value is greater than 0.01 based on statistical analysis, the corresponding pixel can be regarded as a shallow water area.
2.3.3. Preliminary Bathymetry Inversion
The semiempirical model is widely employed for satellite bathymetry research [42]. The superiority of the semiempirical model is the simplification of radioactive transmission theory, which, to a large extent, mitigates the number of parameters needed and makes the model more operable in experiments [43]. In this work, we chose the multiband logarithmic ratio model as our basic model, which is expressed as follows:
where represents the bathymetric inversion value; represents the reflectance in the red, green, and blue bands; and and represent regression coefficients, which can be determined by training ICESat-2 points.
Traditional bathymetry modeling via a semiempirical model uses in situ sample points, whereas in this work, we use ICESat-2 data as sample points instead. Information on the water depth contained in ICESat-2 data will be applied to build a target model and then calculate the bathymetric results throughout the study area.
2.3.4. Extraction of Virtual Control Points
For the preliminary bathymetry inversion, also called the control group, there are two main problems that have deleterious influences on the inversion accuracy. First, spatial correlation is scarcely considered since a semiempirical model implements inversion on a pixel scale, which may demonstrate pixel inconsistencies due to randomly distributed noise [44]. Second, the track of ICESat-2 data is generally inadequate and does not provide sufficient distribution within the research area, and areas without ICESat-2 training data coverage typically have ineffective inversion accuracies.
To address these issues, we propose a strategy that uses virtual control points to optimize the control group. Pixels with identical spectral properties in an image typically correspond to similar bathymetric values. Therefore, the extraction of virtual control points is performed via an approach called spectral confidence analysis (SCA). In SCA, ICESat-2 photons corresponding to pixels in the image are called training pixels. SCA is the process of determining whether other pixels in an image have the same spectral properties as the training pixel. The subsequent optimization is determined based on these similar pixels. The SCA implementation process is as follows.
In the SCA process, pixels are classified into high-confidence pixels and low-confidence pixels based on spectral confidence values. Then, different optimization strategies are implemented for different types of pixels. This indicator is applied to calculate the uniformity of the spectral information between the training pixel and the target pixel. The definition is as follows:
where corresponds to the band channel used by the inversion model and represents the SC assessment in a specific band channel, and is calculated as follows:
In this formula, is the reflectance of the band of the target pixel, and is the set of all reflectance values in the ICESat-2 training pixels. If is contained in the sample set, which means that the target pixel shares the same reflectance value as the training pixel, the SC in this band channel is regarded as having high confidence, and is assigned a value of 1. Otherwise, will be set to 0 if is not equivalent to any of the elements within the sample set. In brief, only when values in all the band channels have high confidence can the target pixel be assessed with high SC (Figure 4). High-SC pixels commonly provide more precise bathymetric predictions, whereas pixels with low SC are more likely to perform poorly in experiments and need further rectification. In this work, we regard pixels with high SC as virtual control points (normally, the center of a single pixel).
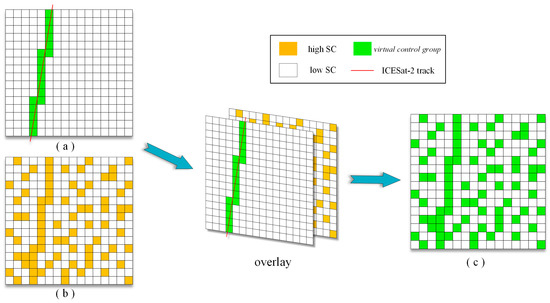
Figure 4.
Primary process of SCA. (a) Spatial relationship between image coverage and the straight track of ICESat-2. (b) SC mask. (c) The expansion of training data from high-SC pixels.
Building upon the workflow mentioned above, the process of SCA categorizes all pixels into high- or low-confidence groups by calculating spectral confidence values, thereby preparing for subsequent optimization of bathymetric estimations tailored to each confidence category. High-confidence pixels, after undergoing residual correction of corresponding spectral bands, are designated as virtual control points. This approach not only expands the quantity of control points in the experiment but also improves their spatial distribution across the study area, effectively mitigating the uneven sampling issue inherent in ICESat-2 data.
2.3.5. Bathymetry Rectification Based on Virtual Control Points
Further rectification is based on virtual control points through a defined workflow. For high-confidence pixels with virtual control points, the bathymetric result is substituted by the bathymetric value of the corresponding virtual control points because pixels sharing identical reflectance values are likely to obtain equal bathymetric results. Through the above processing, residual correction of initial bathymetric results for pixels with high confidence can be achieved.
After the adjustment for high-SC pixels, a local interpolation tactic is applied to low-SC pixels, which integrates spatial information to improve the effect of basic inversion. Since a pixel with virtual control points provides more precise predictions, we create a 5 × 5 neighboring window with the center being the low-SC pixel and implement inverse distance weighting (IDW) interpolation using virtual control points as known samples. The resulting IDW value can be calculated with the following formulas:
where is the number of virtual control points within a 5 × 5 neighborhood window. and represent the bathymetric value and weight of label virtual control point, respectively. represents the distance between the target point and the label virtual control point, where is usually set to 2. represents the bathymetric value of the low-SC pixels.
As a result, the different rectifications for high-SC pixels and low-SC pixels are combined into the optimized result. To integrate the spectral and spatial information into the final bathymetry, both the control group results and optimized results are taken into consideration using the following calculation:
where and represent the bathymetric value and weighted value in the control group and optimized group, respectively. In this work, both groups are weighted as 0.5. The weighted overlay of these two datasets jointly generates the final bathymetry map in the optimized group.
2.3.6. Evaluation Criteria
The experimental results are validated by comparing in situ points with the bathymetry maps. We adopt the determination coefficient (R2), root mean square error (RMSE), mean relative error (MRE), and mean absolute error (MAE) as quantitative evaluation indicators. We also demonstrate residual points to further study the distribution pattern of residual error. All the indicators can be defined as follows:
In Formulas (9)–(12), represents the predicted water depth in our experiment; represents the water depth of the in-situ data; and represents the total number of points used for the accuracy assessment. In Formula (13), represents the water depth at the in situ point, whereas represents the predicted water depth in the experimental group.
In addition, we visualize the quantitative results via scatter plots and marginal histograms. The distribution pattern and density of the scatter points can explain the extent to which the experimental results fit the in situ results. A centralized distribution surrounding a 1:1 regression line indicates high accuracy, and a light color near the 1:1 regression line reflects many experimental points fitting the in situ data. For residual points, two hues, red and blue, are used to express the relative diversity between the experimental group and in situ data. A red point indicates a positive residual error, which indicates an underestimation of the predicted water depth. In contrast, a blue point indicates that the experiment overestimated the water depth. The size of the point and the depth of the color indicate the magnitude of the absolute value of the residual. Generally, a point with greater error is larger in size and deeper in color.
3. Results
3.1. Bathymetry Results for Dong Island
3.1.1. Visualization of Bathymetric Mapping
The resulting bathymetry is shown in Figure 5, where in situ data were interpolated via the IDW method, as shown in Figure 5c. The comparison of the control group (Figure 5a) to the optimized group (Figure 5b) reveals more obvious and steady terrain visualization in the optimized group, whereas the bathymetric map in the control group lacks the consistency of terrain characteristics around the nearshore zone, especially northeast of the island. In Figure 5b,c, the water depth on the southeastern side of the island is shallower than that in the neighboring areas, and this terrain is also neglected by the control group. There is also a significant difference between Figure 5b,c in the shallow-water nearshore zone, which is generally delineated in red. We speculate that this discrepancy is primarily attributable to the relatively low resolution of the in situ bathymetric data used in our experiment. Though high-precision bathymetric data collected around Dong Island using a shipborne single-beam echo sounder was adopted as the validation dataset, the data is stored as discrete point measurements, and its sparse sampling density means the spatial resolution after IDW interpolation is slightly inferior to that of the Sentinel-2 imagery employed for inversion. This manifests as blurred topographic details in the visualization, particularly in localized features such as shallow-water zones, which exhibit lower fidelity compared to the results generated by the proposed method. However, this limitation pertains only to localized visual representation and does not compromise the high accuracy of the validation data in terms of reliability.
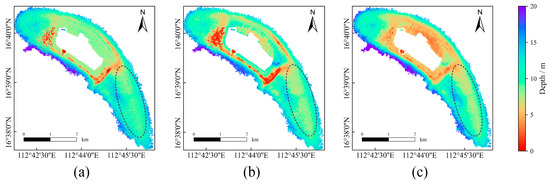
Figure 5.
Bathymetric map of Dong Island. (a) Control group. (b) Optimized group. (c) IDW interpolated map from in situ data. The dashed ellipse indicates the focus area.
3.1.2. Accuracy Assessment
To further validate the effectiveness of the suggested strategy, we compared the resulting bathymetry to in situ data using the quantitative evaluation indicators. A total of 537 in situ points were used to assess the accuracy, and the results are shown in Table 2. Notably, the optimized group has superior accuracy, as measured by all indicators, and significantly outperforms the control group. The results are also displayed as a scatterplot and histogram in Figure 6. The scatter plot in the main box graph is colored by point density, whereas the histogram, which indicates the distribution of point counts at different water depths, is drawn at the axis edges corresponding to the labels at its opposite orientation. Figure 6 reveals that the distribution of points in the optimized group better fits the 1:1 regression line than that in the control group, especially when the inversion deviation of the control group in shallow water (in situ depth < 5 m) is refined. The points in Figure 6a appear close to the predicted depth (namely, the Y-axis), explaining the darker-colored visualization in Figure 6a. For the general distribution in the histogram graph, there is no evident discrepancy in any of the drawn types.
Table 2.
Accuracy evaluation of the bathymetry inversion results for Dong Island.
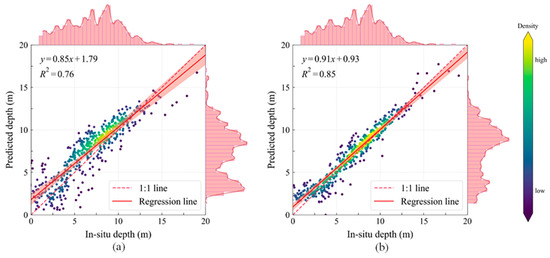
Figure 6.
1:1 line for Dong Island. (a) Control group. (b) Optimized group. The pink histogram represents the distribution density of sample points for in situ data and predicted results.
3.1.3. Residual Analysis Based on In-Situ Data
The residual distribution based on in situ points is shown in Figure 7. A residual value less than zero, which indicates a predicted water depth that is deeper than the in situ depth, is colored in a warm tone, whereas a residual value above zero is indicated by a cool color. The milder color hues in Figure 7b indicate a lower residual value in the optimized group overall. Nearly no residual points with absolute values greater than 5 m are found in the optimized group. The resulting bathymetry in the control group generally predicts deeper water depths, and the aggregation of high residual points also corresponds to the northeast regions (Figure 7a). Additionally, the proportion of water depth points with residual error more than 1 m in the optimization group was 48.9%, which was less than 55.1% in the control group.
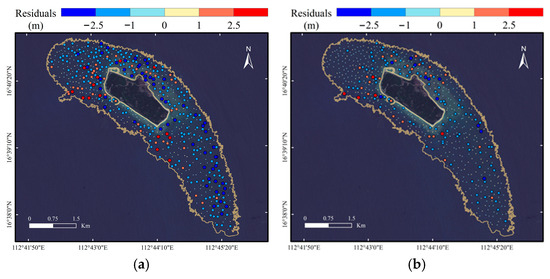
Figure 7.
Residual distribution of in situ points for Dong Island. (a) Control group. (b) Optimized group.
3.2. Bathymetry Results for Ganquan Island
3.2.1. Visualization of Bathymetric Mapping
In Figure 8, we show the bathymetry map for Ganquan Island, and the in situ bathymetry depicted in Figure 8c was interpolated by IDW, similar to the Dong Island experiment. Although there are no significant discrepancies in optical exhibition among the three bathymetric maps, the control group presents relatively coarse visualization, which indicates more hypsography in the zonal area (circled with a blue line). This is more likely to contribute to data noise, while the optimized group effectively smooths this noise. The optimized group also has better optical characteristics resembling the in situ bathymetric map, not only for the overall trend but also for some specific local areas (color-marked origins).
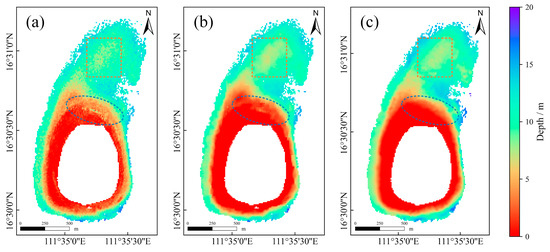
Figure 8.
Bathymetric map of Ganquan Island. (a) Control group. (b) Optimized group. (c) IDW-interpolated map from in-situ data. The dashed ellipse and rectangle indicate the focus area.
3.2.2. Accuracy Assessment
For the accuracy assessment of Ganquan Island, 4927 in situ points were applied, and the indicators (R2, RMSE, and MRE) are listed in Table 3. Due to the comparatively simple terrain on Ganquan Island, both experimental groups obtained decent bathymetry results, with R2 values above 0.9. The higher accuracy in the optimized group is attributed to the fact that the optimized group successfully removed a great deal of noise that is present in the control group. In Figure 9, the scatter plot shows a closely aggregated distribution with light colors and few dispersed points away from the 1:1 regression line. Nevertheless, it seems to be difficult to predict accurate bathymetric results at water depths deeper than 15 m. This problem may be attributed to the lack of ICESat-2 training points in deep water areas, which are rarely found near Ganquan Island. The histograms show that the distributions of both experimental groups are similar to the in situ distributions.
Table 3.
Accuracy evaluation of the bathymetry inversion results for Ganquan Island.
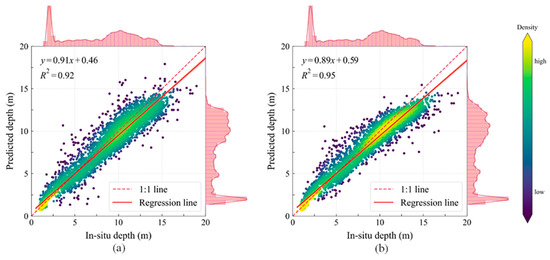
Figure 9.
1:1 line for Ganquan Island. (a) Control group. (b) Optimized group. The pink histogram represents the distribution density of sample points for in situ data and predicted results.
3.2.3. Residual Analysis Based on In-Situ Data
Figure 10 shows the distribution of residual points around Ganquan Island. In Figure 10b, there are a few residual points with absolute values greater than 1 m in the northern part of the experimental area, whereas Figure 10a generally has points that are deeper blue, indicating the underestimation of the predicted water depth. For the region on the edge of Ganquan Island, both experimental groups show unusually higher prediction values, which is represented by the deep blue color. We infer that this issue may be caused by the drastic change (such as grooves) in terrain in the corresponding area, which possibly affects bathymetric inversion due to inadequate spatial resolution. Bathymetric inversion also exhibits poor results for the optimized group since a diverse range of terrain within a zonal extent cannot be adequately simulated by simple spatial interpolation. In the control group, 49.4% of the water depth points had residual error greater than 1 m, while this value was 47.1% in the optimization group.
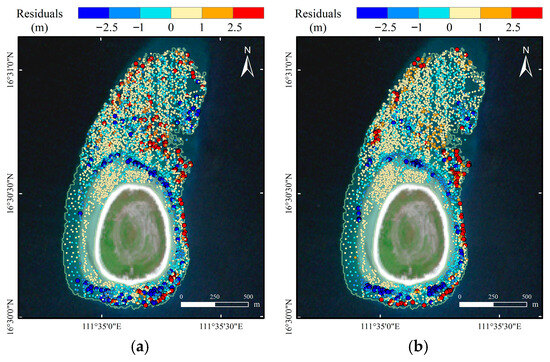
Figure 10.
Residual distribution of in situ points on Ganquan Island. (a) Control group. (b) Optimized group.
3.3. Bathymetry Results for Wuzhizhou Island
3.3.1. Visualization of Bathymetric Mapping
To facilitate comparisons among the different experimental areas, the in situ bathymetric map around Wuzhizhou Island was clipped to the extent of shallow water, and in situ points were extracted at intervals of 60 m in both the x- and y-axis orientations (2194 points in total). The visualization of the resulting bathymetry data is shown in Figure 11. Compared to the in situ group (Figure 11c), both experimental groups depict well-simulated bathymetric trends. However, the control group predicts lower bathymetric results in the area southeast of Wuzhizhou Island (marked by the dotted line), leading to the loss of more detailed terrain information. However, this terrain characteristic is ameliorated by the optimized group, which exhibits a good fit with the in situ group. The reason is that when SCA and IDW interpolation are applied, the pixels with deep water depths in the control group are more likely to be regarded as high-confidence pixels that then contribute increased confidence to their surroundings. In other words, the scatter-distributed high-confidence pixels (commonly in deeper blue for this region) expand to a large extent in the optimized group and present obvious bathymetric characteristics.
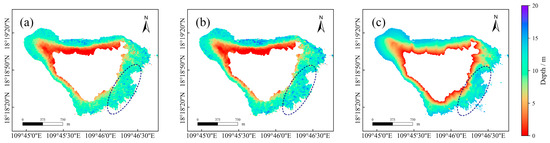
Figure 11.
Bathymetric map of Wuzhizhou Island. (a) Control group. (b) Optimized group. (c) In situ group. The dashed ellipse indicates the focus area.
3.3.2. Accuracy Assessment
We further applied the in situ points referred to above to assess the accuracy, and the results are shown in Table 4. It is evident that the optimized group performs better in all indicators, with an increase of 5% in R2. The scatter plots and edge histograms are shown in Figure 12. In addition to the fewer discrete points and higher scatter density in the optimized group than in the control group, there is also better agreement of the trend lines between the in situ data and the optimized predicted result. The control group tends to predict water depths with relatively low values, which presents an abnormal subpeak in shallow water. The R2 coefficient of the optimized group is larger than that of the control group, indicating that the water depth inversion results of the optimized group are closer to the in situ data.
Table 4.
Accuracy evaluation of the bathymetry inversion results for Wuzhizhou Island.
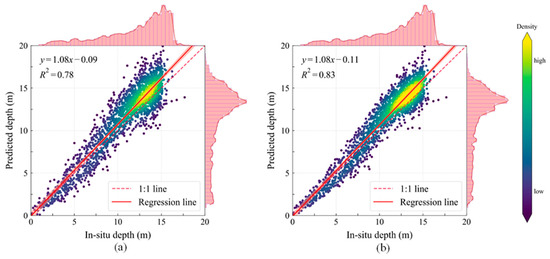
Figure 12.
1:1 line for Wuzhizhou Island. (a) Control group. (b) Optimized group. The pink histogram represents the distribution density of sample points for in situ data and predicted results.
3.3.3. Residual Analysis Based on In-Situ Data
A comparison of the visualization of residual points in Figure 13 indicates that the control group performs poorly over a fairly wide range around Wuzhizhou Island, whereas the optimized group displays gentler residual values, especially in the regions with highly autocorrelated residual points. Two main regions exhibit poor performance in bathymetry prediction. The first region is north of the island, and the result here is likely to be predicted with a value that is lower than the in situ value. The residuals here are primarily greater than 2.5 m, with some extreme values greater than 5 m in the control group. Although there are also a number of points with residuals greater than 2.5 m in the optimized group, extreme error points in red are rarely found here, which reflects neutralization of the error from the control group. The other region that is encircled near the southeast edge of the island demonstrates a bathymetric prediction that is obviously greater than the control group values. The difference between these two subgraphs is that in the optimized group, both the area and the degree of the residuals are smaller than those in the control group. In addition, the water depth points with residual error greater than 1 m in the control group are 61.6%, which is greater than 57.3% in the optimization group.
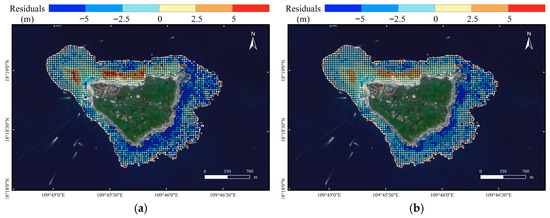
Figure 13.
Residual distribution of in situ points for Wuzhizhou Island. (a) Control group. (b) Optimized group.
4. Discussion
4.1. Comparative Analysis of Different Bathymetric Inversion Methods
To further evaluate the validation of the proposed method, some state-of-the-art methods are evaluated qualitatively and quantitatively in comparison with the proposed method. The state-of-the-art comparison methods include the band ratio model (BRM) [9], the multiband regression model (MRM) [45], and the band ratio quadratic fitting model (BRQFM) [46]. The bathymetric inversion results will be discussed in the following three parts: bathymetry visualization, accuracy evaluation, and accuracy analysis in different bathymetric intervals.
4.1.1. Bathymetry Visualization via Different Methods
The bathymetric inversion results of the four algorithms for the three islands are shown in Figure 14. With all four applied methods compared with the in situ bathymetry of Dong Island, the proposed method has the most similarity in general and also in certain local areas. Though the maps in the other three methods fit well in the shallow water areas surrounding the island, there may be some abnormal results in areas with mid-to-deep water depths. For example, BRM and BRQFM obviously mistook the bathymetric result in the west area of Dong Island, which should have had a shallower water depth, and MRM ignores the shallow water terrain in the southeast area (circled in a blue dashed line).
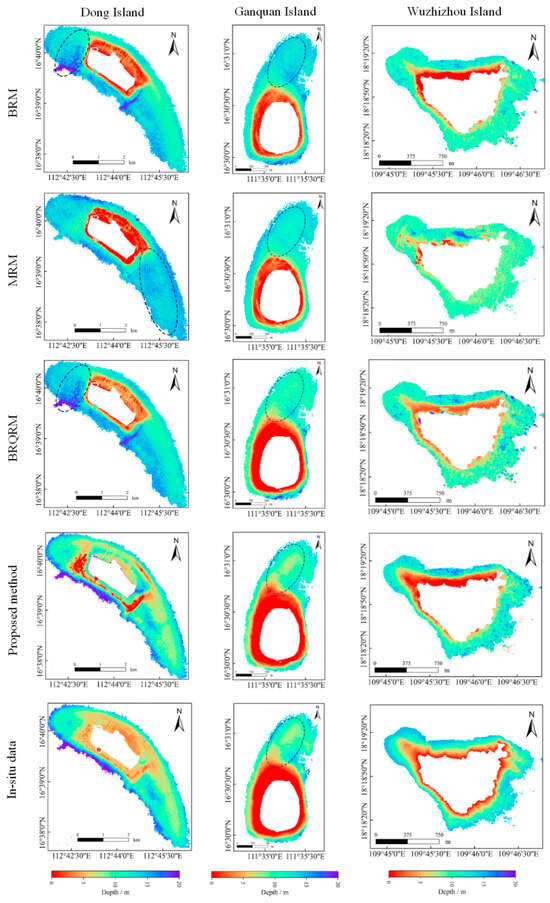
Figure 14.
Rows 1–4 show the bathymetric inversion results of the three islands by BRM, MRM, BRQRM, and the proposed method, respectively. Row 5 shows the in situ data for the three islands. The dashed ellipse indicates the focus area.
The bathymetric inversion results from the four methods are visually compared for Ganquan Island. In the dashed oval region, the inversion results of the other three algorithms are deeper than the in situ data. In contrast, the inversion results of the proposed method are generally consistent with the in situ data. Furthermore, BRM tends to generate a comprehensively higher water depth than in situ data, while MRM produces uneven terrain surrounding Ganquan Island, which is mixed with yellow visualization in the red ring-shaped area.
Based on field data from Wuzhizhou Island, the general trend in water depth measurements shows that as the distance from the island increases, water depth gradually deepens from shallow to deep. Regarding the other three methods, MRM neglects the shallow area and predicts a deeper result in the north area, while BRM and BRQFM fail to recognize the deep-water area in the southeast zone. The proposed method may show some salt-and-pepper noise due to the semantic-based inversion model, but it fits well with the trend in in situ mapping overall. In addition, Wuzhizhou Island is an offshore tourist island. Due to factors such as human activities, the shallow-water terrain near the coast undergoes significant changes compared to the deep-water terrain. The temporal difference between the in situ data and the inverted images further causes the inversion results to differ from the measured values in shallow water areas. In Figure 14, due to the presence of salt-and-pepper noise in the images, the water depth inversion results of all four algorithms are affected. However, the inversion results of the proposed method are closer to the in situ data in the shallow water area relative to other methods, which can reflect the trend of topographic changes in the shallow water area as a whole. The inversion results of the proposed method are obviously better than other methods.
The above visual evaluation results show that for the three islands with different types, the bathymetric inversion results of the proposed method are better than those of other algorithms and are basically consistent with the in situ data.
4.1.2. Overall Accuracy Evaluation for Different Methods
In this section, the accuracy of the four bathymetric inversion results is quantitatively evaluated. Table 5 indicates that the proposed method is superior to the other three methods to a significant extent in all four indicators. The R2 values of the three study areas in the proposed method reach values above 0.8 overall, which shows that the performance of the proposed method can be applied to areas with different underwater terrain features. On Wuzhizhou Island, MRM has a significantly poor performance in these assessment indicators, which is due to the poor accuracy of the bathymetric inversion results of the MRM in some local areas.
Table 5.
Accuracy evaluation of the different bathymetry inversion methods.
4.1.3. Accuracy Analysis in Different Bathymetric Intervals
The performance of the different methods is further verified by comparing and analyzing the inversion results for different bathymetric intervals. Figure 15 shows four indicators (R2, RMSE, MRE, and MAE) of the bathymetric inversion results for Dong Island, Ganquan Island, and Wuzhizhou Island in different bathymetric intervals. In particular, the thresholds are based on the maximum water depths of the corresponding areas to ensure that the accuracy assessment of the different water depth intervals is validated by a sufficient and uniformly distributed amount of in situ data. In general, the proposed method has a relatively lower RMSE, MRE, and MAE in all study areas with different water depths and relatively higher R2 compared with other methods. With increasing water depth, the four methods show a declining effect overall, indicating that the performance of these bathymetric approaches has a negative relation to water depth. This happens more obviously in the deep-water zone (>15 m or >10 m, specifically on Wuzhizhou Island), which is most likely due to the poor performance of ICESat-2 in the deep-water area. We assert that the reasons for the suboptimal experimental results in the deep-water area of Wuzhizhou Island are as follows: (1) compared to the other two study areas, the more complex terrain of Wuzhizhou Island leads to a higher inversion difficulty and (2) the lower photon penetration rate of ICESat-2 in deep-water areas results in relatively fewer sample photon points acquired during actual experiments. However, given that the overall area with water depths exceeding 15 m in the Wuzhizhou study region accounts for a relatively small proportion and considering that the experimental accuracy of our method remains superior compared to other approaches, this issue has not significantly impacted the primary conclusions of this study.
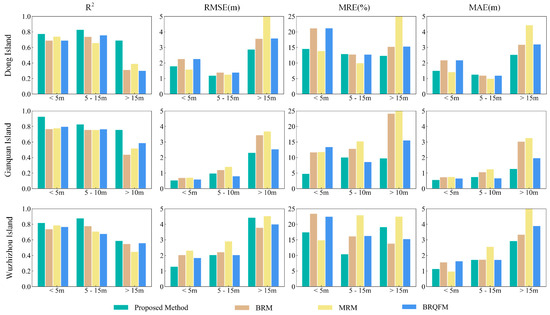
Figure 15.
Rows 1–3 show the quantitative evaluation of the inversion results of the four algorithms for Dong Island, Ganquan Island, and Wuzhizhou Island at different water depths, respectively.
4.2. Analysis of Advantages and Disadvantages of the Proposed Method
The analysis mentioned above demonstrates that our proposed methodology outperforms state-of-the-art approaches in terms of visual representation, overall accuracy, and accuracy across varying water depths. The superior performance of our method can be attributed to the following mechanisms:
- Virtual control point extraction: The extraction of virtual control points not only augments the quantity of control points but also ensures their homogeneous spatial distribution within the study area, thereby resolving the uneven distribution issue inherent in ICESat-2-derived sample points.
- Spectral confidence analysis: For low-confidence pixels, the SCA framework employs spatial interpolation of high-confidence neighboring pixels to estimate bathymetric values, which are used for weighting incorporation into the final bathymetric product. This integration enables the results to encapsulate both spectral information from the inversion model and spatial contextual information, with the multi-dimensional information input significantly enhancing the reliability of inversion outcomes compared to conventional spectral-only approaches.
- Our method only requires a small increase in computational complexity to greatly improve the accuracy of the basic water depth inversion model and obtain water depth inversion results that are closer to the in situ data. Our method can obtain reliable water depth values in remote areas that are difficult for humans to reach. However, our method still demonstrates noticeable deviations from in situ bathymetry maps in certain cases, particularly in regions with dramatic terrain variations. By correlating in situ bathymetry maps with residual distribution patterns, it is observed that high-error zones predominantly coincide with areas of abrupt water depth changes. This suggests that when performing spatial interpolation on low-confidence pixels, significant elevation differences within neighboring areas may lead to substantial deviations. Context-aware neighborhood size adjustment is used. For example, the interpolation window size is dynamically reduced in rugged terrains, which could potentially improve accuracy by better maintaining spatial correlation information. Additionally, ICESat-2 photons serve as bathymetric control points, and the accuracy of bathymetric inversion is directly influenced by ICESat-2 processing results, such as denoising and refraction correction. Therefore, ICESat-2 requires more refined processing to deliver high-precision bathymetric control points.
5. Conclusions
To address the problem that the track of the ICESat-2 satellite has a negative effect on passive–active-fused shallow bathymetry, this paper proposes an ameliorated satellite-based bathymetry method that integrates spatial and spectral information from the basic bathymetric inversion model and ICESat-2 training data. The proposed method finds virtual control points based on spectral confidence and applies these points to extend the training samples. Then, the basic bathymetry map is adjusted depending on the spectral confidence of the pixels. Comparative qualitative and quantitative evaluations of the proposed method are implemented around three islands with different terrain. The experimental results indicate that the proposed method achieves superior bathymetric inversion performance compared to the other three algorithms, with R2 values exceeding 0.83, RMSE below 1.48 m, MRE under 12.36%, and MAE less than 1.22 m. However, it should be noted that the proposed method may still underperform in specific scenarios, such as regional terrains with drastic deviations. In future work, more consideration will be given to integrating additional spatial-information-based analytical approaches with spatial interpolation into our methodology to improve the bathymetric inversion accuracy across more complex terrains.
Author Contributions
Methodology, software, writing—original draft, writing—review and editing, Z.D.; writing—original draft, writing—review and editing, visualization, J.T.; funding acquisition, supervision, writing—review and editing, project administration, Y.L.; writing—review and editing, Y.F.; data collection, formal analysis, Y.C. and Y.W. All authors have read and agreed to the published version of the manuscript.
Funding
This work was supported in part by the National Natural Science Foundation of China under Grant 42404056, in part by the Basic Scientific Fund for National Public Research Institutes of China under Grant 2025Q03, in part by the Shandong Provincial Natural Science Foundation under Grant ZR2025MS651 and ZR2023QD113, in part by the Key Laboratory of Ocean Geomatics, Ministry of Natural Resources, P. R. China under Grant 2024B01, and in part by the Technology Innovation Center for South China Sea Remote Sensing, Surveying and Mapping Collaborative Application, Ministry of Natural Resources, P. R. China under Grant RSSMCA-2024-B005.
Data Availability Statement
The underlying data for the results presented in this paper are not currently publicly available but may be obtained from the authors upon reasonable request.
Acknowledgments
The author acknowledges the National Aeronautics and Space Administration (NASA) for providing ICESat-2 data and the European Space Agency (ESA) for providing Sentinel-2 satellite imagery.
Conflicts of Interest
The authors declare no conflicts of interest.
References
- Mason, D.C.; Gurney, C.; Kennett, M. Beach topography mapping—A comparison of techniques. J. Coast Conserv. 2000, 6, 113–124. [Google Scholar] [CrossRef]
- Cesbron, G.; Melet, A.; Almar, R.; Lifermann, A.; Tullot, D.; Crosnier, L. Pan-european satellite-derived costal bathymetry—Review, user needs and future services. Front. Mar. Sci. 2021, 8, 1591. [Google Scholar] [CrossRef]
- Zhang, X.; Chen, Y.; Le, Y.; Zhang, D.; Yan, Q.; Dong, Y. Nearshore Bathymetry Based on ICESat–2 and Multispectral Images: Comparison Between Sentinel–2, Landsat–8, and Testing Gaofen–2. IEEE J. Sel. Top. Appl. Earth Obs. Remote Sens. 2022, 15, 2449–2462. [Google Scholar] [CrossRef]
- Jagalingam, P.; Akashaya, B.; Hegde, A.V. Bathymetry mapping using Landsat-8 satellite imagery. Procedia Eng. 2015, 116, 560–566. [Google Scholar] [CrossRef]
- Li, Y.; Zhou, J.; Li, J.; Li, N.; Zhu, F.; Sun, H. Global marine gravity from 27 cycles of SWOT satellite data: Accuracy and spatial resolution evaluation. J. Geod. 2025, 99, 51. [Google Scholar] [CrossRef]
- Kutser, T.; Hedley, J.; Giardino, C.; Roelfsema, C.; Brando, V.E. Remote sensing of shallow waters—A 50 year retrospective and future directions. Remote Sens. Environ. 2020, 240, 111619. [Google Scholar] [CrossRef]
- Melet, A.; Teatini, P.; Le, C.G.; Jamet, C.; Conversi, A.; Benveniste, J.; Almar, R. Earth observations for monitoring marine coastal hazards and their drivers. Surv. Geophys. 2020, 41, 1489–1534. [Google Scholar] [CrossRef]
- Duplančić, L.T.; Leder, N.; Peroš, J. Satellite derived bathymetry survey method—Example of Hramina Bay. Trans. Marit. Sci. 2019, 8, 99–108. [Google Scholar] [CrossRef]
- Lee, Z.; Carder, K.L.; Mobley, C.D.; Steward, R.G.; Patch, J.S. Hyperspectral remote sensing for shallow waters: 2. Deriving bottom depths and water properties by optimization. Appl. Opt. 1999, 38, 3831–3843. [Google Scholar] [CrossRef]
- Stumpf, R.P.; Holderied, K.; Sinclair, M. Determination of water depth with high-resolution satellite imagery over variable bottom types. Limnol. Oceanogr. 2003, 48, 547–556. [Google Scholar] [CrossRef]
- Vinayaraj, P.; Raghavan, V.; Masumoto, S. Satellite-derived bathymetry using adaptive geographically weighted regression model. Mar. Geod. 2016, 39, 458–478. [Google Scholar] [CrossRef]
- Mobley, C.D. Radiative transfer in the ocean. In Encyclopedia of Ocean Sciences; Academic Press: Cambridge, MA, USA, 2001; pp. 2321–2330. [Google Scholar]
- Vinayaraj, P. Development of Algorithms for Near-Shore Satellite Derived Bathymetry Using Multispectral Remote Sensing Images. Ph.D. Thesis, Osaka Municipal University, Osaka, Japan, 2017. [Google Scholar]
- Su, H. Geographically adaptive inversion model for improving bathymetric retrieval from satellite multispectral imagery. IEEE Trans. Geosci. Remote Sens. 2014, 52, 465–476. [Google Scholar] [CrossRef]
- Herrmann, J.; Magruder, L.A.; Markel, J.; Parrish, C.E. Assessing the ability to quantify bathymetric change over time using solely satellite-based measurements. Remote Sens. 2022, 14, 1232. [Google Scholar] [CrossRef]
- Le, Q.A.; Collin, A.; Jasinski, M.F.; Devillers, R. Very high-resolution satellite-derived bathymetry and habitat mapping using pleiades-1 and ICESat-2. Remote Sens. 2022, 14, 133. [Google Scholar]
- Selamat, M.B.; Muhiddin, A.H.; Yusuf, S.; Jompa, J. Toward geomorphic mapping of reef habitat by laser altimeter on ICESat-2 Satellite. IOP Conf. Ser. Earth Environ. Sci. 2021, 860, 012080. [Google Scholar] [CrossRef]
- Van, A.N.; Quang, N.H.; Son, T.P.H.; An, T.T. High-resolution benthic habitat mapping from machine learning on Planet Scope imagery and ICESat-2 data. Geocarto Int. 2023, 38, 2184875. [Google Scholar] [CrossRef]
- Ma, Y.; Xu, N.; Liu, Z.; Yang, B.; Yang, F.; Wang, X.; Li, S. Satellite-derived bathymetry using the ICESat-2 lidar and Sentinel-2 imagery datasets. Remote Sens. Environ. 2020, 250, 112047. [Google Scholar] [CrossRef]
- Xie, T.; Kong, R.; Nurunnbi, A.; Bai, S.; Zhang, X. Machine-learning-method-based inversion of shallow bathymetric maps using ICESat-2 ATL03 data. IEEE J Sel. Top. Appl. Earth Obs. Remote Sens. 2023, 16, 3697–3714. [Google Scholar] [CrossRef]
- Dietrich, J.T.; Rackley, R.A.; Gibbons, A.; Magruder, L.A.; Parrish, C.E. Analysis of ICESat-2 data acquisition algorithm parameter enhancements to improve worldwide bathymetric coverage. Earth Space Sci. 2024, 11, e2023EA003270. [Google Scholar] [CrossRef]
- Chen, Y.; Zhu, Z.; Le, Y.; Qiu, Z.; Chen, G.; Wang, L. Refraction correction and coordinate displacement compensation in nearshore bathymetry using ICESat-2 lidar data and remote sensing images. Opt. Express 2021, 29, 2411–2430. [Google Scholar] [CrossRef]
- Ranndal, H.; Sigaard, C.P.; Kliving, P.; Baltazar Andersen, O.; Nielsen, K. Evaluation of a statistical approach for extracting shallow water bathymetry signals from ICESat-2 ATL03 photon data. Remote Sens. 2021, 13, 3548. [Google Scholar] [CrossRef]
- Watkins, R.H.; Sayers, M.J.; Shuchman, R.A.; Bosse, K.R. Validation of ICESat-2 derived data products on freshwater lakes: Bathymetry, diffuse attenuation coefficient for downwelling irradiance (Kd), and particulate backscatter coefficient (bbp). IEEE Geosci. Remote Sens. Lett. 2023, 20, 1501405. [Google Scholar] [CrossRef]
- Zhang, D.; Chen, Y.; Le, Y.; Dong, Y.; Dai, G.; Wang, L. Refraction and coordinate correction with the JONSWAP model for ICESat-2 bathymetry. ISPRS J. Photogramm. Remote Sens. 2020, 86, 285–300. [Google Scholar] [CrossRef]
- Neumann, T.A.; Martino, A.J.; Markus, T.; Bae, S.; Bock, M.R.; Brenner, A.C.; Brunt, K.M.; Cavanaugh, J.; Fernandes, S.T.; Hancock, D.W.; et al. The ice, cloud, and land elevation satellite—2 mission: A global product derived from the advanced topographic laser altimeter system. Remote Sens. Environ. 2019, 233, 111325. [Google Scholar] [CrossRef] [PubMed]
- Babbel, B.J.; Parrish, C.E.; Magruder, L.A. ICESat-2 elevation retrievals in support of satellite derived bathymetry for global science applications. Geophys. Res. Lett. 2021, 48, e2020GL090629. [Google Scholar] [CrossRef]
- Hsu, H.; Huang, C.; Michael, J.; Li, Y.; Gao, H.; Tsutomu, Y.; Wang, C.; Chang, T.; Ren, H.; Kuo, C.; et al. A semi-empirical scheme for bathymetric mapping in shallow water by ICESat-2 and Sentinel-2: A case study in the South China Sea. ISPRS J. Photogramm. Remote Sens. 2021, 178, 1–19. [Google Scholar] [CrossRef]
- Leng, Z.; Zhang, J.; Ma, Y.; Zhang, J. ICESat-2 bathymetric signal reconstruction method based on a deep learning model with active–passive data fusion. Remote Sens. 2023, 15, 460. [Google Scholar] [CrossRef]
- Xie, C.; Chen, P.; Pan, D. Bathymetric inversion method for active-passive remote sensing fused radiative transfer information convolutional neural networks. Acta Photon. Sin. 2024, 53, 46–58. [Google Scholar]
- Wicaksono, P.; Harahap, S.D.; Hendriana, R. Satellite-derived bathymetry from WorldView-2 based on linear and machine learning regression in the optically complex shallow water of the coral reef ecosystem of Kemujan island. Remote Sens. Appl. 2024, 33, 101085. [Google Scholar] [CrossRef]
- Li, J.; Dong, Z.; Chen, L.; Tang, Q.; Hao, J.; Zhang, Y. Multi-temporal image fusion-based shallow-water bathymetry inversion method using active and passive satellite remote sensing data. Remote Sens. 2025, 17, 265. [Google Scholar] [CrossRef]
- Xie, C.; Chen, P.; Jamet, C.; Pan, D. New reference bathymetric point cloud datasets derived from ICESat-2 observations: A case in the Caribbean Sea. IEEE Trans. Geosci. Remote Sens. 2024, 62, 4200824. [Google Scholar] [CrossRef]
- Chen, Y.; Wu, L.; Le, Y.; Zhao, Q.; Zhang, D.; Qiu, Z. High-accuracy bathymetric method fusing ICESAT-2 datasets and the two-media photogrammetry model. Int. J. Appl. Earth Obs. Geoinf. 2024, 134, 104179. [Google Scholar] [CrossRef]
- Xie, C.; Chen, P.; Zhang, S.; Huang, H. Nearshore bathymetry from ICESat-2 LiDAR and Sentinel-2 imagery datasets using physics-informed CNN. Remote Sens. 2024, 16, 511. [Google Scholar] [CrossRef]
- Li, N.; Wang, M.; Yang, B.; Pan, J.; Pi, Y.; Fan, Z. SCBMLD: A photon signal extraction method for ICESat-2 satellite-derived bathymetry. Opt. Express 2025, 33, 9023–9040. [Google Scholar] [CrossRef] [PubMed]
- Huang, G.; Dong, Z.; Liu, Y.; Chen, Y.; Li, J.; Wang, Y.; Meng, W. An optimized denoising method for ICESat-2 photon-counting data considering heterogeneous density and weak connectivity. Opt. Express 2023, 31, 41496–41517. [Google Scholar] [CrossRef]
- Zhang, B.; Liu, Y.; Dong, Z.; Li, J.; Chen, Y.; Tang, Q.; Huang, G.; Tao, J. An optimal denoising method for spaceborne photon-counting LiDAR based on a multiscale quadtree. Remote Sens. 2024, 16, 2475. [Google Scholar] [CrossRef]
- Zhu, X.; Wang, C.; Xi, X.; Nie, S.; Yang, X.; Li, D. Research progress of ICESat-2/ATLAS data processing and applications. Infrared Laser Eng. 2020, 49, 76–85. [Google Scholar]
- Leng, Z.; Zhang, J.; Ma, Y.; Zhang, J.; Zhu, H. A novel bathymetry signal photon extraction algorithm for photon-counting LiDAR based on adaptive elliptical neighborhood. Int. J. Appl. Earth Obs. Geoinf. 2022, 115, 103080. [Google Scholar] [CrossRef]
- Parrish, C.E.; Magruder, L.A.; Neuenschwander, A.L.; Forfinski-Sarkozi, N.; Alonzo, M.; Jasinski, M. Validation of ICESat-2 ATLAS bathymetry and analysis of ATLAS’s bathymetric mapping performance. Remote Sens. 2019, 11, 1634. [Google Scholar] [CrossRef]
- Guo, X. Shallow Water Bathymetry Based on ICESat-2 and Sentinel-2. Master’s Thesis, Nanjing University of Information Science & Technology, Nanjing, China, 2023; pp. 20–24. [Google Scholar]
- Klonowski, W.; Fearns, P.; Lynch, M. Retrieving key benthic cover types and bathymetry from hyperspectral imagery. J. Appl. Remote Sens. 2007, 1, 011505. [Google Scholar] [CrossRef]
- Peng, K.; Xie, H.; Xu, Q.; Huang, P.; Liu, Z. Physics-assisted convolutional neural network for bathymetric mapping using ICESat-2 and Sentinel-2 data. IEEE Trans. Geosci. Remote Sens. 2022, 60, 4210513. [Google Scholar] [CrossRef]
- Lyzenga, D.R.; Malinas, N.P.; Tanis, F.J. Multispectral bathymetry using a simple physically based algorithm. IEEE Trans. Geosci. Remote Sens. 2006, 44, 2251–2259. [Google Scholar] [CrossRef]
- Huang, Y.; Yang, H.; Tang, S.; Liu, Y.; Li, Y. An appraisal of atmospheric correction and inversion algorithms for mapping high-resolution bathymetry over coral reef waters. IEEE Trans. Geosci. Remote Sens. 2023, 61, 4204511. [Google Scholar] [CrossRef]


Disclaimer/Publisher’s Note: The statements, opinions and data contained in all publications are solely those of the individual author(s) and contributor(s) and not of MDPI and/or the editor(s). MDPI and/or the editor(s) disclaim responsibility for any injury to people or property resulting from any ideas, methods, instructions or products referred to in the content. |
© 2025 by the authors. Licensee MDPI, Basel, Switzerland. This article is an open access article distributed under the terms and conditions of the Creative Commons Attribution (CC BY) license (https://creativecommons.org/licenses/by/4.0/).