Highlights
What are the main findings?
- A multi-modal framework combining GEDI LiDAR, Sentinel-1 SAR (PolSAR and InSAR), and Sentinel-2 multispectral data with machine learning effectively improved regional forest height estimation accuracy, with Random Forest achieving R2 = 0.708 (RMSE = 2.564 m) and Gradient Tree Boosting achieving R2 = 0.672 (RMSE = 2.697 m).
- Interferometric SAR (InSAR) coherence and phase features provided critical vertical structural information, significantly enhancing sensitivity to canopy heterogeneity and boosting model performance.
What is the implication of the main finding?
- Improved methodological understanding. By quantifying the contribution of different feature combinations, we demonstrate the potential benefits of multi-modal combination for forest height inversion. The analysis also provides valuable evidence on how different remote sensing modalities complement each other in capturing forest structural attributes. This offers practical insights for future large-scale mapping frameworks.
- Contribution of InSAR features. Our results show that incorporating InSAR features provides valuable complementary information on forest vertical structure, which significantly enhances the accuracy of height inversion. This highlights the important role of InSAR in improving forest structural characterization and strengthens the case for its inclusion in future inversion frameworks.
Abstract
Forest height is a key structural parameter for evaluating ecological functions, biodiversity, and carbon dynamics. While LiDAR and Synthetic Aperture Radar (SAR) provide vertical structure information, their large-scale use is restricted by sparse sampling (LiDAR) and temporal decorrelation (SAR). Optical remote sensing offers complementary spectral information but lacks direct height retrieval. To address these limitations, we developed a multi-modal framework integrating GEDI waveform LiDAR, Sentinel-1 SAR (InSAR and PolSAR), and Sentinel-2 multispectral data, combined with machine learning, to estimate forest canopy height across Jiangsu Province, China. GEDI L2A footprints were used as training labels, and a suite of structural and spectral features was extracted from SAR, GEDI, and Sentinel-2 data as input variables for canopy height estimation. The performance of two ensemble algorithms, Random Forest (RF) and Gradient Tree Boosting (GTB) for canopy height estimation, was evaluated through stratified five-fold cross-validation. RF consistently outperformed GTB, with the integration of SAR, GEDI, and optical features achieving the best accuracy (R2 = 0.708, RMSE = 2.564 m). The results demonstrate that InSAR features substantially enhance sensitivity to vertical heterogeneity, improving forest height estimation accuracy. These findings highlight the advantage of incorporating SAR, particularly InSAR with optical data, in enhancing sensitivity to vertical heterogeneity and improving the performance of RF and GTB in estimating forest height. The framework we proposed is scalable to other regions and has the potential to contribute to global sustainable forest monitoring initiatives.
1. Introduction
Global ecological changes and carbon cycle issues have become major concerns for researchers and policymakers. As vital components of terrestrial ecosystems, forests play key roles in carbon regulation, climate moderation, biodiversity conservation, and ecosystem services [1,2]. Forest structural parameters are crucial for assessing ecosystem functions, with forest height being a key indicator widely used in biomass estimation, carbon storage modeling, and global carbon cycle simulations [3,4]. Defined as the “mean height of trees within a stand/plot” [5], forest height reflects vertical heterogeneity and supports forest resource assessments and climate change studies. However, due to forest heterogeneity, topographic variability, and external disturbances, accurate forest height estimation remains a global challenge.
Current methods for forest height estimation rely on both ground-based and remote sensing approaches. Terrestrial surveys provide accurate measurements but are labor-intensive, spatially limited, and in the case of destructive ground sampling, disruptive to forest ecosystems. In contrast, remote sensing enables efficient mean monitoring over large areas. Airborne and UAV-mounted LiDAR systems can capture high-resolution canopy height data [6,7,8], but their use is often constrained by cost and limited coverage. For instance, airborne LiDAR systems and Unmanned Aerial Vehicle (UAV)-mounted laser scanners [9] can capture high-density discrete point clouds, but their operational scalability faces constraints in large-area forest height estimation. Meanwhile, spaceborne LiDAR missions such as GEDI provide valuable global forest structure data, though spatial gaps remain [10]. Optical imagery, rich in spectral and texture information, is also widely used for forest height retrieval [11,12]. Techniques such as tree shadow analysis leverage geometric models using sun angle and image geometry [13,14], but are limited by illumination sensitivity and canopy occlusion in dense forests [15]. Because optical data lack direct height information, forest height must be inferred via statistical models [16]. Synthetic Aperture Radar (SAR) offers the advantage of penetrating vegetation and operating under all-weather conditions. Polarimetric SAR (PolSAR) captures scattering and texture information for structure retrieval [17,18], while advanced X-band PolInSAR has demonstrated improved height estimates [19]. However, SAR-based approaches demand complex calibration and face scalability issues. Interferometric SAR (InSAR) and PolInSAR, although capable of high accuracy, are often constrained by temporal decorrelation and high data requirements, restricting their use to localized studies [20].
Additionally, with advances in machine learning, algorithms like Random Forest and Convolutional Neural Networks (CNNs) are increasingly used in remote sensing image analysis [21,22], enabling efficient multi-source data integration and model optimization. For instance, Zhang et al. combined satellite data with feature selection and machine learning methods, finding that Boruta and XGBoost achieved the best forest height estimation in Baoding, China (R2 = 0.67, RMSE = 2.2 m) [23]. Similarly, Schwartz et al. integrated GEDI LiDAR, Sentinel-1 SAR, and Sentinel-2 optical data with deep learning to produce high-resolution canopy height maps in France’s Landes Forest [24].
Although forest height estimation has made considerable progress, major methodological hurdles remain in remote sensing-based approaches. Various remote sensing studies analyze each data source in isolation and often overlook the complexities of fusing heterogeneous datasets with differing spatial resolutions, revisit frequencies, and observation geometries [25,26]. Moreover, existing fusion frameworks lack generalizability and robustness, particularly in heterogeneous environments or for short-stature forests where signal sensitivity differs [27,28]. Among a few recent studies that have explored the integration of multi-source data through machine learning, efforts have primarily concentrated on optical and LiDAR integration. In contrast, the application of InSAR data for forest height estimation, particularly coherence and interferometric phase, remains underexplored, especially at regional levels. Additionally, the interaction mechanisms between InSAR-derived features and forest structural parameters are not yet well understood, resulting in uncertainty in model performance. Addressing this critical gap requires the development of a robust and scalable framework that systematically integrates multi-source remote sensing datasets—optical, SAR, and LiDAR—to improve the accuracy of forest height estimation, especially in regions with fragmented terrain and limited ground measurements, such as Jiangsu Province.
Building upon these identified gaps, this study proposes a scalable multi-modal data integration framework for forest height estimation in Jiangsu Province. The province’s subtropical monsoon climate and complex landscape present both challenges and opportunities for remote sensing applications. Our framework combines Sentinel-1 SAR data, GEDI L2A footprint data, and Sentinel-2 multispectral imagery, with particular emphasis on the contribution of InSAR features, which capture valuable information on forest vertical structure. Unlike traditional forest height inversion methods that primarily rely on PolSAR, PolInSAR, or TomoSAR, our approach incorporates InSAR coherence and phase features directly into the modeling process. All multi-modal features are subsequently used to train machine learning models for forest height estimation.
Our specific objectives are to: (1) assess the contribution of InSAR coherence and phase features in forest height estimation; (2) evaluate the effectiveness of multi-modal integration for forest height inversion; (3) provide a practical solution for large-scale forest height estimation under complex environmental conditions, especially in regions lacking ground-based measurements.
2. Study Area
Jiangsu Province (30°45′~35°08′N, 116°18′~121°57′E) is located in the eastern coastal region of China, as shown in Figure 1. With a total area of approximately 107,200 square kilometers, Jiangsu exemplifies a typical coastal plain region in eastern China. The province’s topography is predominantly flat, with plains accounting for over 70% of the total area. Low mountains and hills are found in the southwestern part, while the coastal areas are characterized by alluvial plains. With elevations decreasing from the north and west to the south and east, the region’s terrain offers favorable geographic conditions for the acquisition and application of multi-modal remote sensing data.
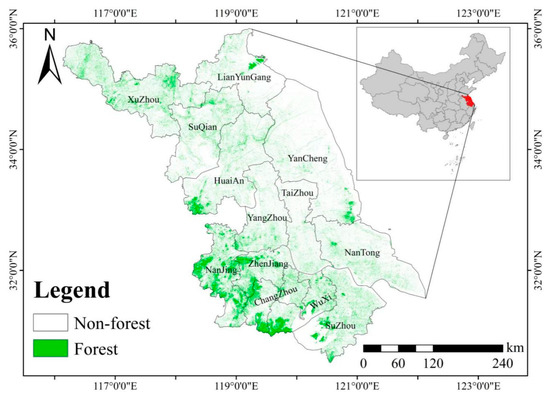
Figure 1.
Geographic location of the study area and spatial distribution of forests.
Jiangsu belongs to the northern subtropical humid monsoon climate zone, which is characterized by diverse vegetation types. The region’s humid climate and synchronization of precipitation and temperature create favorable conditions for vegetation growth, making it suitable for retrieving a variety of forest stand attributes [29]. In particular, areas with high vegetation cover, such as natural secondary forests and artificial plantations in the hilly regions, offer abundant observational samples for studies focused on forest stand height estimation. Forests in the region typically reach maximum heights of approximately 20–25 m. However, due to the large scale of urban development in Jiangsu Province, forest distribution is relatively sparse, with most forests concentrated in mountainous areas or large wetland parks. This presents significant challenges for the measurement of forest height in the region. At present, vertical spatial information of forests in Jiangsu Province remains insufficient and warrants further investigation.
3. Methods
This study proposed a sparse forest height estimation model leveraging multi-modal remote sensing datasets, structured into three core modules as illustrated in Figure 2—data preprocessing and analysis, multi-source feature extraction, and model development with performance evaluation.
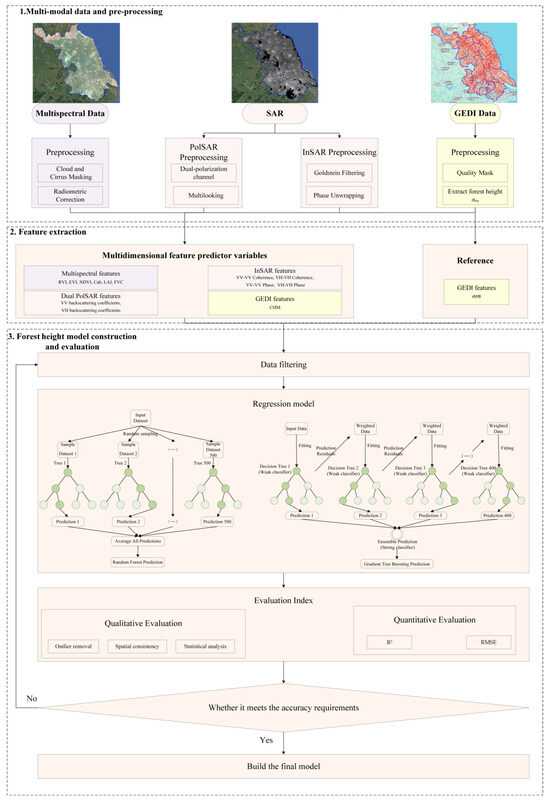
Figure 2.
Technical workflow of forest height estimation based on multi-modal remote sensing data.
The initial module undertook comprehensive preprocessing of GEDI (a scientific project led by NASA) LiDAR data to derive a Digital Elevation Model (DEM) from ground returns and a Digital Surface Model (DSM) from canopy returns, enabling the calculation of the Canopy Height Model (CHM) via their difference. Simultaneously, Sentinel-2 multispectral imagery undergone atmospheric and radiometric corrections to ensure consistency for vegetation parameter derivation. Sentinel-1 SAR data were subjected to polarization calibration and precise co-registration, with InSAR techniques applied to extract interferometric phase and coherence metrics that provide complementary vertical and structural forest information.
Building on these processed datasets, the second module focused on extracting a comprehensive suite of forest structural features. Vegetation indices and biophysical parameters derived from Sentinel-2 characterized canopy vigor and density, while dual SAR data contributed polarization-sensitive backscatter coefficients and incidence angles. InSAR-derived interferometric phase and coherence enhanced the feature set by capturing vertical canopy structure, reflecting the elevation of effective scattering centers within the canopy and the decorrelation effects associated with vegetation height. These multi-source variables collectively formed a multidimensional representation of forest architecture, sensitive to canopy height and biomass.
The final module involved constructing a regression model using Random Forest to predict canopy height from the integrated feature set. Various feature combinations were systematically evaluated, with hyperparameter tuning conducted via cross-validation to optimize model robustness and generalizability. Model accuracy was assessed through metrics such as Root Mean Square Error (RMSE) and coefficient of determination (R2). Furthermore, the model’s adaptability was scrutinized against variations in forest types and terrain complexity to assess its resilience in heterogeneous ecological settings. This integrative framework advanced the precision of forest height estimation in sparse forest environments and underscores the efficiency of multi-modal remote sensing data fusion for ecological monitoring.
3.1. Data Processing
To develop forest height estimation model, this study combined three types of remote sensing data: GEDI LiDAR data, Sentinel-2A multispectral imagery, and Sentinel-1 SAR imagery.
3.1.1. GEDI Data Processing
The GEDI sensor operated in the near-infrared band (1064 nm) and was highly sensitive to the reflectance differences between green vegetation and the underlying surface. Its ability to penetrate sparse canopies allowed for precise ground elevation measurements beneath vegetation, making it highly valuable in forest ecosystem studies and carbon stock estimation. The spatial footprint of GEDI pulses was approximately 25 m in diameter, providing detailed vertical structure information.
This study primarily employed the GEDI Level 2A ground and vegetation height products, with the RH98 metric adopted as the principal indicator of canopy height. RH98 represented the relative height corresponding to 98% of the waveform energy, and was widely recognized for its balance between sensitivity to canopy top detection and robustness against waveform noise, making it particularly suitable for height estimation in sparse forest environments. To enhance data reliability, low-confidence observations flagged in the GEDI product were excluded, thereby minimizing the influence of degraded waveforms and outliers. Given the inherent discreteness of GEDI waveform sampling, spatial gaps might persist in certain regions. To mitigate these effects and improve representativeness, regional averaging was applied, although this procedure may attenuate fine-scale structural heterogeneity. The resulting averaged RH98 values provided a high-precision reference for forest height across the study area, supporting subsequent regression modeling and enabling the generation of representative canopy height estimates [30].
Beyond canopy top measurements, GEDI data included surface elevation information, which facilitates the derivation of forest height through elevation differencing. Specifically, the DSM and DEM extracted from GEDI were differenced to compute the CHM, providing per-pixel estimates of canopy height. This approach effectively captured the spatial variability of vertical forest structure. However, its accuracy might be influenced by terrain complexity and errors in ground return measurements, which should be considered when interpreting the derived CHM.
3.1.2. Multispectral Data Processing
Sentinel-2A offered multispectral imagery with spatial resolutions ranging from 10 m (visible and near-infrared bands) to 20 m (red-edge and shortwave infrared bands) and up to 60 m (coastal aerosol and cirrus bands). The inclusion of red-edge and near-infrared bands made it suitable for calculating vegetation indices and biophysical parameters.
Sentinel-2A multispectral imagery was employed primarily to complement GEDI observations by providing spectral indicators of canopy vigor and density, thereby enriching the characterization of forest structural attributes. Unlike LiDAR, Sentinel-2 did not directly capture vertical canopy profiles. However, its high spectral resolution and red-edge bands enabled robust derivation of vegetation indices and biophysical parameters that are indirectly related to canopy height. In our study, the Sentinel-2 image collection was filtered to include data from 1 May to 31 December 2023, corresponding to the leaf-on season in the study area. This period was intentionally selected to ensure a strong and stable vegetation signal, which is essential for accurate vegetation analysis, particularly in regions dominated by deciduous species such as poplar. To ensure data reliability, only scenes with a cloud fraction below 10% were retained, reducing contamination effects and improving consistency in feature extraction.
Vegetation indices such as the Ratio Vegetation Index (RVI), Normalized Difference Vegetation Index (NDVI), and Enhanced Vegetation Index (EVI) were calculated to represent canopy greenness and density [31,32,33,34]. To ensure the indices were applied specifically to forested regions, a vegetation mask was generated using the ESA WorldCover v200 dataset [35]. NDVI time-series validation using the threshold method [36] confirmed that this mask was consistent with forest cover, supporting its use for isolating target regions. While this masking strategy effectively excluded non-forest areas, potential misclassifications in transitional landscapes remained a source of uncertainty.
In addition to vegetation indices, biophysical variables including Leaf Area Index (LAI), chlorophyll content (Cab), and Fractional Vegetation Cover (FVC) were estimated [37]. LAI and FVC provided key descriptors of canopy density and coverage, whereas Cab reflected vegetation physiological status. The inclusion of EVI, which integrated the blue band to mitigate soil background and saturation effects, is particularly valuable in dense vegetation settings, where NDVI often exhibits reduced sensitivity [38]. These parameters were integrated into the feature set to strengthen the link between spectral signals and canopy structural properties. Nevertheless, LAI retrieval from optical indices could be affected by saturation at high canopy densities, even when using EVI, which should be acknowledged as a limitation of multispectral-based predictors.
3.1.3. SAR Polarization and Interferometric Processing
Sentinel-1 SAR data were acquired using C-band (5.405 GHz) dual-polarized SAR sensors, which were capable of collecting high-resolution imagery under all-weather and all-day conditions. The spatial resolution of Sentinel-1 Interferometric Wide (IW) mode data typically ranged from 5 to 20 m, depending on processing level and look configuration.
This study employed Sentinel-1 SAR data, including Ground Range Detected (GRD) and Single Look Complex (SLC) products, to extract polarization- and interferometry-based structural features relevant to forest height estimation. All data were acquired in IW swath mode, which offered a balance between spatial resolution and coverage, making it well-suited for forest monitoring applications [39].
The GRD dataset provided amplitude information in ground range projection and was used to derive polarization-sensitive backscatter coefficients. VV and VH channels were selected due to their complementary sensitivities: VV primarily reflected canopy vertical structure, while VH enhanced sensitivity to multiple scattering and surface roughness. To improve data fidelity, preprocessing steps such as thermal noise removal, radiometric calibration, and terrain correction were applied. Adaptive filtering [40] was also used to suppress residual noise while preserving object boundaries and texture details. The calibrated backscatter coefficients (σ0) were expressed in decibel (dB) scale to facilitate interpretation and comparison. While such preprocessing is standard, its relevance lay in ensuring radiometric accuracy and geolocation consistency. The acquisition window (1–10 January 2023) was chosen to minimize temporal variability, but residual influences from soil moisture and surface roughness might still confound canopy-related backscatter signals, representing a limitation of PolSAR-based predictors.
SLC data preserved both amplitude and phase components, thereby enabling interferometric analyses such as high-resolution DEM and ground deformation monitoring. Unlike GRD products, the phase coherence in SLC imagery allowed retrieval of elevation and displacement information with sub-wavelength sensitivity. In this study, Sentinel-1B SLC datasets were employed, with acquisitions between 1–10 January 2023 serving as master images and those from 13–20 January 2023 as slave images. The relatively short temporal and perpendicular baselines of these acquisitions were chosen deliberately to maximize interferometric coherence and minimize decorrelation. Both VV and VH polarization channels were utilized to assess their relative contributions, as VV tends to emphasize surface scattering while VH is more responsive to vegetation and volumetric effects.
Data preprocessing was aimed at ensuring radiometric fidelity and geometric accuracy. Radiometric calibration converted raw pixel intensities into normalized backscatter (σ0), and geometric corrections aligned imagery with geospatial coordinates to enable inter-scene comparability. Noise suppression, including temporal and spatial filtering, further stabilized interferometric measurements. These steps were crucial for maintaining robust phase information, particularly in heterogeneous land-cover areas where coherence is easily degraded.
The interferometric workflow comprised image co-registration, interferogram formation, flat-earth phase removal, phase filtering, coherence estimation, phase unwrapping, and terrain correction. Image co-registration was particularly critical, as sub-pixel alignment ensures that the differential phase truly represents surface displacements rather than geometric misalignments. A third-order polynomial orbit interpolation model was employed, coupled with bilinear interpolation during image resampling, reflecting a balance between computational efficiency and geometric precision. Debursting was applied to eliminate discontinuities inherent in TOPS-mode acquisitions, yielding seamless phase information suitable for interferometric analysis.
To enhance phase quality, multilooking was applied with three looks in the range and one in the azimuth direction, resulting in an average ground range square pixel size of 13.26 m2. This configuration was selected to reduce speckle while maintaining sufficient resolution for deformation analysis. Interferogram filtering employed the Goldstein phase filter, which was widely recognized for improving fringe visibility in low-coherence areas by attenuating high-frequency noise while retaining geophysical signal. Flat-earth phase contributions, which arose from orbital geometry and Earth curvature, were removed using a fifth-degree polynomial model based on 501 estimation points, thereby isolating deformation-related phase components.
Interferometric coherence was estimated with a range window of 10 pixels and an azimuth window of 3 pixels. The coherence coefficient γ was defined as follows:
where n1 and n2 represented the complex pixel values of the master and slave images, respectively. E denoted the statistical expectation, and the superscript * denoted the complex conjugate operation. The coherence coefficient ranged from 0 to 1, with higher values indicating better interferometric phase stability.
To remove the topographic phase component, a DEM from the Shuttle Radar Topography Mission (SRTM) with 3-arcsecond resolution was used. DEM resampling was performed using bicubic interpolation to ensure geometric fidelity and accurate phase modeling during terrain correction.
This comprehensive InSAR processing strategy, with detailed parameter settings, ensured the generation of high-quality interferometric products and provided a robust foundation for subsequent deformation analysis.
3.2. Forest Height Regression Models
In this study, multiple data combination-based modeling strategies were developed to address the task of forest height inversion, leveraging GEDI LiDAR observations as reference and auxiliary information. Modeling analyses were conducted by combining optical features, SAR features, and their combined characteristics with GEDI data. Specifically, typical vegetation indices and biophysical parameters were extracted from Sentinel-2 multispectral imagery to represent the horizontal structural attributes of vegetation. These optical features were then paired with GEDI-observed canopy height data to construct regression models, thereby achieving the integration of optical features and GEDI data. This approach emphasized the use of GEDI as a ground-truth reference for height calibration, enhancing the predictive capability of optical features in forest height estimation.
Furthermore, for the SAR feature integration modeling, PolSAR and InSAR data were utilized to extract backscattering coefficients, coherence, and interferometric phase information, characterizing the vertical structural variations of vegetation. By combining these SAR features with GEDI canopy height observations, SAR and GEDI data integration models were established. Referencing GEDI measurements enabled the effective extraction and quantification of vegetation-related information from SAR data, thus enhancing the precision of forest height estimation derived from SAR data.
Moreover, to fully exploit the complementary strengths of different data sources in representing horizontal and vertical vegetation structures, a joint modeling strategy combining optical features, SAR features, and GEDI data were also developed. In this approach, GEDI observations served as the reference, while multispectral vegetation indices, biophysical parameters, and SAR scattering and coherence features were jointly incorporated to form a high-dimensional composite feature space. Machine learning methods were employed to construct the inversion models. This multi-modal data combination framework effectively captured both the spectral responses and structural characteristics of vegetation, demonstrating superior model fitting capability and predictive performance.
Before being input into the model, all features were resampled to a spatial resolution of 110 m using the bilinear method in order to avoid computational load exceeding the limitations of Google Earth Engine (GEE). Sample selection and partitioning were aimed at constructing effective training and testing datasets to support subsequent model training and evaluation. All pixels were randomly permuted and partitioned based on a predefined ratio, with 70% assigned to the training set and the remaining 30% allocated for model evaluation. A random sequence was generated to ensure the randomness of the partitioning process and to avoid data bias. The training set was used to build the models, while the testing set was employed for model validation and accuracy assessment. Notably, the use of a single 70/30 train-validation split might not provide a stable estimate of model performance across different data partitions. Therefore, we additionally employed five-fold cross-validation to improve the robustness and generalizability of the model and to obtain a more reliable evaluation of its predictive performance.
3.2.1. Random Forest Regression Model
The Random Forest (RF) regression model was a nonlinear method based on ensemble learning. It constructed multiple regression trees and aggregates their outputs to enhance prediction robustness and accuracy. Compared to a single decision tree, which tends to overfit, RF improved generalization by combining independently trained trees. This advantage made it suitable for complex nonlinear problems like surface biomass inversion [41].
In this study, the RF model employed Bootstrap Aggregating (Bagging) and random feature selection to increase diversity and robustness. Given a training dataset with input feature vectors and corresponding target variables, bootstrap sampling was applied to generate subsets by sampling with replacement. This randomness ensured each tree is trained on different data, reducing overfitting and model variance.
During tree construction, feature selection at each split was limited to a random subset of features, from which the best split is chosen. This mechanism further reduced overfitting and prevented highly correlated features from dominating decisions, thereby enhancing generalization.
The final prediction was the average of all regression tree outputs:
where denoted the total number of regression trees, and was the prediction from the t-th tree.
This ensemble approach reduced individual model bias while improving overall stability and accuracy. For regression, RF used Mean Squared Error (MSE) as the splitting criterion, choosing the split that minimizes target value variance within child nodes. For a given node, the optimal split minimized:
where was the mean of the target values within the node.
3.2.2. Gradient Tree Boosting Regression Model
Gradient Tree Boosting (GTB) was a nonlinear regression technique under the Boosting framework. It sequentially built multiple weak learners, such as regression trees, with each learner correcting the errors of its predecessor, thereby enhancing both fitting accuracy and generalization capability. Unlike single decision trees that were sensitive to noise, GTB achieved robust performance by minimizing a loss function iteratively.
In this study, GTB used an additive model combined with a forward stagewise algorithm. The initial model prediction was set to the mean of the target values. In each iteration, a new base learner was trained on the residuals of the current prediction and added to the model using a learning rate to minimize the overall loss.
The construction of the m-th base learner in each iteration was represented as follows:
where was the prediction model at iteration m, was the model from the previous iteration, was the learning rate, was the base learner fitted to the current residuals. Careful tuning of the learning rate enabled control over the convergence speed and generalization ability of the model, helping to prevent overfitting.
Each base learner fitted the negative gradient of the loss function to approximate the residuals:
where L denoted the loss function, commonly defined as Mean Squared Error (MSE) in regression tasks to maximize the model’s fitting accuracy.
The final prediction was the weighted sum of all base learners:
This iterative strategy captured complex feature relationships and improved prediction accuracy by gradually reducing residuals. To prevent overfitting, a small learning rate and early stopping (based on validation performance) were applied to determine the optimal number of iterations.
3.2.3. Evaluation Metrics
To assess the predictive capability of the model, several metrics were calculated, including Root Mean Square Error (RMSE) and the coefficient of determination (R2). A lower RMSE indicated smaller discrepancies between predicted and actual values; a lower relative RMSE implied better relative prediction accuracy. A higher R2 value signified better model fit and stronger agreement between predicted and observed trends. The formulas are as follows:
where n was the number of data points, was the actual value, was the predicted value, and was the mean of the observed values.
4. Results and Analysis
4.1. Feature Extraction Results
Based on multispectral remote sensing data from Sentinel-2, representative spectral vegetation indices were derived, including RVI, NDVI, and EVI. In addition, a series of surface biophysical parameters, LAI, Cab, and FVC, were retrieved through spectral inversion techniques. The results are presented in Figure 3, which illustrates the spatial distribution patterns of these vegetation indices and biophysical parameters.
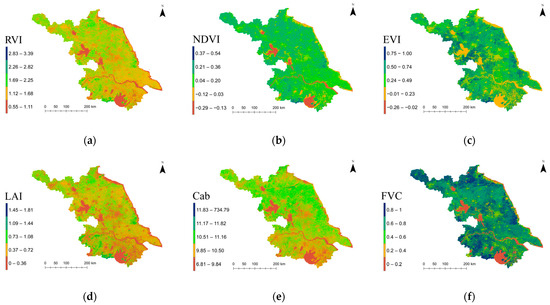
Figure 3.
Spectral vegetation indices and retrieved biophysical parameters: (a) RVI; (b) NDVI; (c) EVI; (d) LAI; (e) Cab; (f) FVC.
With Sentinel-1A GRD data, backscattering coefficients under two polarization modes (VV and VH), as well as coherence and interferometric phase maps for VV-VV and VH-VH polarization modes, were extracted. The combined results are shown in Figure 4, which provides a comparative view of backscattering intensity, coherence stability, and phase information across different polarization modes. During InSAR processing, although striping and data gaps reduced coherence in some regions, the coherence maps still demonstrate good spatial consistency in topographically stable areas, providing a solid foundation for forest structure estimation.
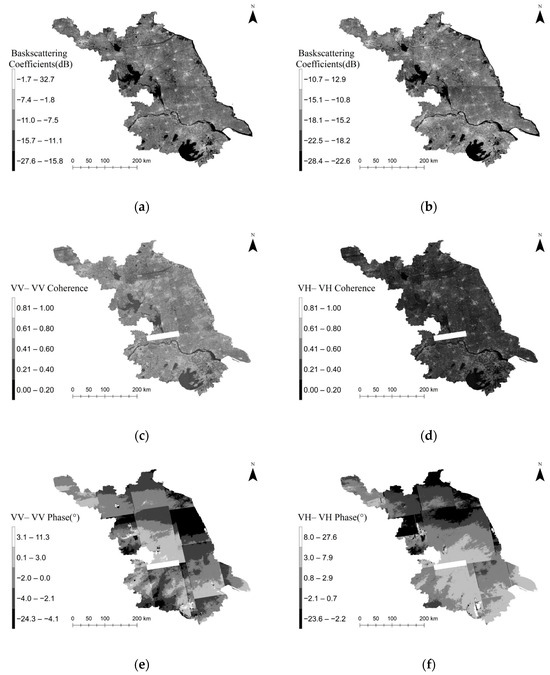
Figure 4.
Sentinel-1A backscattering coefficients, coherence, and interferometric phase maps: (a) VV backscattering coefficients; (b) VH backscattering coefficients; (c) VV-VV coherence; (d) VH-VH coherence; (e) VV-VV phase; (f) VH-VH phase.
4.2. Optical Features and GEDI Data Integration
Multispectral remote sensing data are primarily used to capture the horizontal structural information of vegetation. Consequently, regression models that rely solely on such data for tree height inversion often exhibit poor performance. In this study, three typical vegetation indices (NDVI, EVI, RVI) and three biophysical parameters (FVC, LAI, Cab) were selected to construct a six-dimensional feature vector. The model’s performance was subsequently evaluated using the validation set. The inversion results are presented in Table 1.

Table 1.
Estimated forest height results based on optical features and GEDI data (validation set).
An accuracy assessment based on the validation set revealed that the model exhibited suboptimal performance when relying solely on optical features, yielding an RMSE of 5.253 m and an R2 of 0.162, indicative of a weak relationship between the predicted and observed forest heights. Similarly, the model’s predictive capability remained limited when using only CHM, with an RMSE of 3.746 m and R2 of 0.334.
In contrast, the integration of CHM derived from GEDI LiDAR data markedly improved model performance. When CHM was combined with six optical variables, the RMSE decreased to 3.237 m, and R2 increased substantially to 0.572, demonstrating dramatical enhancement in both predictive accuracy and model robustness. The performance metrics of the random forest regression model for both the training and validation sets are illustrated in Figure 5.
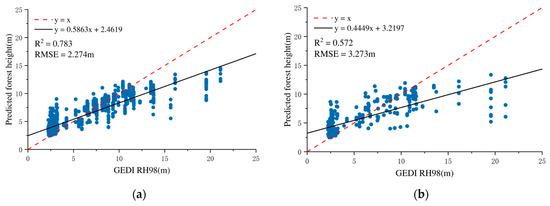
Figure 5.
Forest height inversion accuracy verification results based on optical features and GEDI data (random forest regression model): (a) training model accuracy; (b) validation set accuracy.
A similar trend was observed with the GTB model. When only optical features were used, the model yielded an RMSE of 5.506 m and an R2 of 0.100, confirming weak predictive ability. However, upon the addition of CHM, the model performance improved markedly, achieving an RMSE of 3.541 m and an R2 of 0.484. Although slightly lower than the RF model in R2, the GTB model showed a notable decrease in RMSE, indicating that it is more responsive to the structural information provided by CHM. The accuracy analysis results for the training and validation sets of the GTB model are presented in Figure 6.
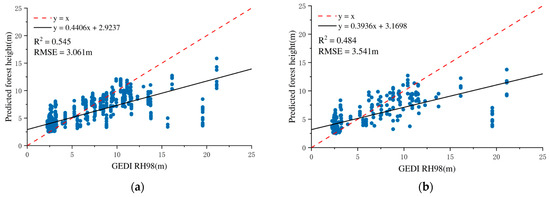
Figure 6.
Forest height estimation accuracy verification results based on optical features and GEDI data (gradient tree boosting regression model): (a) training model accuracy; (b) validation set accuracy.
Overall, both models exhibited enhanced performance when CHM was introduced, affirming the key role of GEDI-derived structural metrics in forest height estimation. Nonetheless, the limited contribution of optical features alone suggests that they may not adequately capture vertical forest heterogeneity. These findings emphasize the critical importance of integrating 3D structural data to improve forest height inversion accuracy and model robustness.
4.3. SAR and GEDI Data Combination
This study leverages the all-weather, all-time observation advantages of SAR data, combined with its strong penetration capability in vegetation-dense areas, to explore the applicability of RF regression and GTB models in forest height inversion. The study selected backscatter coefficients from VV and VH polarization, interferometric phase, and coherence as model input features from the main and secondary images, and performed model accuracy evaluation on 3000 sample data sets from the validation set. The results are shown in Table 2.
Table 2.
Estimated forest height results based on SAR and GEDI data (validation set).
The results demonstrate that different radar feature combinations significantly affect the model’s prediction performance. When VV polarization was used alongside CHM, the model achieved an RMSE of 3.162 m and an R2 of 0.488. Notably, replacing VV with VH polarization led to an improved RMSE of 2.999 m and a higher R2 of 0.507, suggesting that VH polarization is more sensitive in characterizing vegetation vertical structure.
Compared to the use of CHM alone, the integration of dual-polarized radar features with CHM further improved model performance, resulting in an RMSE of 3.059 m and an R2 of 0.551. Notably, the combination of InSAR-derived metrics with CHM yielded the highest predictive accuracy, with the random forest model achieving an RMSE of 2.265 m and an R2 of 0.732. This marked improvement highlights the critical contribution of InSAR parameters, which is likely attributable to their enhanced sensitivity to vertical forest structure and canopy closure, enabling the model to capture more detailed biophysical characteristics of forested areas.
However, when combining dual PolSAR, InSAR, and CHM features, model performance slightly declined (RMSE = 2.855 m, R2 = 0.601). This phenomenon may be attributed to the distinct types of structural information provided by the two data sources: InSAR primarily captures vertical forest structure, while PolSAR mainly reflects horizontal structural characteristics. In some cases, the addition of horizontal structural information contributes little to a model that already relies on vertical structure metrics, which may result in a slight reduction in overall predictive performance. Furthermore, the increased feature set also raises model complexity, which can potentially affect generalization on the validation dataset, particularly when training samples are limited. The accuracy analyses for training and validation sets are shown in Figure 7.
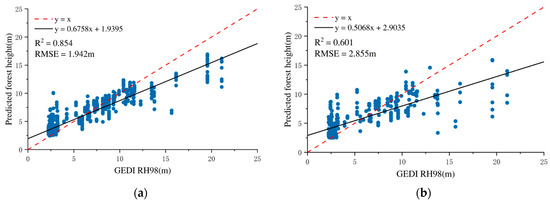
Figure 7.
Forest height inversion accuracy verification results based on SAR and GEDI data (random forest regression model): (a) training model accuracy; (b) validation set accuracy.
Similarly, the GTB model exhibited strong predictive capability with varying radar feature combinations. The integration of InSAR features with CHM resulted in the best model performance, with an RMSE of 2.619 m and an R2 of 0.643. This corroborates the pattern observed in the RF model, affirming the substantial contribution of InSAR in forest height estimation. However, the results obtained using SAR data alone were not satisfactory. This may due to the fact that SAR data provide only indirect information on forest vertical structure through interferometric phase and coherence features, whereas the CHM data derived from GEDI observations directly represent vertical height information.
When combining dual PolSAR, InSAR, and CHM features, the GTB model achieved an RMSE of 3.051 m and an R2 of 0.535, indicating its robust capacity to integrate heterogeneous remote sensing inputs. The model accuracy evaluation is illustrated in Figure 8.
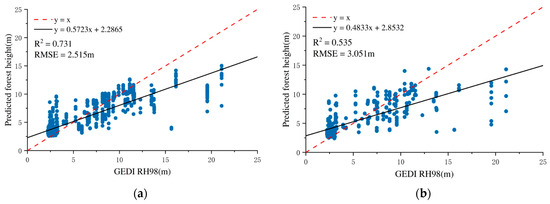
Figure 8.
Forest height estimation accuracy verification results based on SAR and GEDI data (gradient tree boosting model): (a) training model accuracy; (b) validation set accuracy.
Overall, using CHM as the sole input resulted in limited model performance in both RF and GTB frameworks, suggesting that CHM alone lacks comprehensive structural information. In contrast, the integration of InSAR features markedly improved model accuracy, particularly within the RF model, where R2 reached 0.732, significantly outperforming the GTB model, reflecting RF’s superior capability in structural modeling.
Moreover, for both regression models, the inclusion of InSAR-derived parameters consistently produced the lowest RMSE and highest R2 values, confirming the unique contribution of InSAR in capturing vertical vegetation structures. These results highlight the importance of advanced radar features, especially VH polarization and InSAR, for enhancing forest height modeling within multi-source data fusion frameworks.
In summary, the findings confirm that the SAR-based RF regression model exhibits strong potential in retrieving forest height, especially with the use of InSAR data, which provides more vertical information and improved accuracy.
4.4. Optical, SAR Features, and GEDI Integration
This study employs a multi-modal data combination framework to leverage the significant advantages of multi-modal data for surface parameter estimation. Optical features, with their high spatial resolution and rich spectral information, effectively capture the structural and biochemical characteristics of surface vegetation, providing critical surface information support for forest height inversion. SAR data, with its all-weather and all-time observation capability, particularly excels in providing stable backscatter information under complex weather conditions, significantly compensating for the observational deficiencies of optical data under cloudy or low-light environments. GEDI data offer high-precision vertical structural detection capabilities, ensuring crucial support for extracting three-dimensional information such as surface height and canopy density.
Three typical vegetation indices (NDVI, EVI, RVI) and three biophysical parameters (FVC, LAI, Cab) were selected as multispectral parameters in our study. SAR data, including the backscattering coefficients of VV polarization and VH polarization, along with the interferometric phase and coherence coefficient of the main and secondary images were used. GEDI data, processed to extract the CHM and RH98 were incorporated to construct multidimensional feature vectors. A total of 10,000 random samples were collected, and model accuracy was evaluated using 3000 samples from the validation set, as shown in Table 3.
Table 3.
Estimated forest height results based on SAR, Sentinel-2, and GEDI data (validation set).
The RF model achieves a lower training RMSE of 1.946 and a higher R2 of 0.864, indicating a strong fit to the training data. Nevertheless, its performance on the validation set declines, with the RMSE increasing to 2.564 and the R2 dropping to 0.708. This discrepancy suggests a degree of overfitting, whereby the model captures noise or non-generalizable patterns in the training data, thus reducing its predictive accuracy on unseen samples.
In contrast, the GTB model yields a higher training RMSE of 2.574 m and a lower R2 of 0.716, indicating a comparatively less complex fit to the training data. However, its performance on the validation set remains relatively stable, with an RMSE of 2.697 m and an R2 of 0.672. Although slightly lower than RF in absolute validation accuracy, the GTB model exhibits a smaller performance gap between training and validation stages, implying better generalization and reduced overfitting.
Additionally, the Maximum Direct Information (MDI) was used to quantify the importance of each feature vector, as shown in Figure 9. The results visually present the relative contribution of each input feature to forest height inversion in the model, providing an essential reference for further optimizing feature selection and improving inversion accuracy. From the figure, it is clear that the backscattering coefficient of VH polarization, along with several InSAR-derived features, stands out in the feature importance analysis, with significantly higher MDI values compared to other features. This indicates that SAR-derived features, particularly from InSAR, demonstrate strong explanatory and predictive capabilities for forest height estimation. The MDI values of CHM features also take the lead, demonstrating its important role in forest height estimation. In contrast, the MDI values for most of the multispectral features are relatively low, suggesting that these features contribute less to the model. Overall, in terms of MDI values, InSAR-derived features, and GEDI-derived features exhibit the most pronounced contribution to forest height estimation, whereas the influence of optical remote sensing imagery appears comparatively limited.
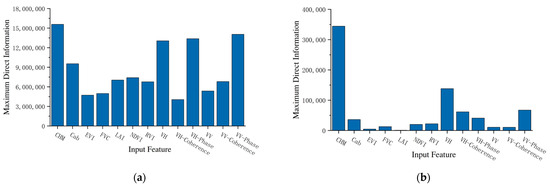
Figure 9.
Importance of features in regression models: (a) importance of features in RF; (b) importance of features in GTB.
Figure 10 presents a comparative analysis of the prediction accuracy of the RF and GTB models on both the training and validation datasets. This figure offers an intuitive representation of the models’ fitting capabilities and generalization performance, serving as a visual foundation for evaluating their robustness and predictive stability.
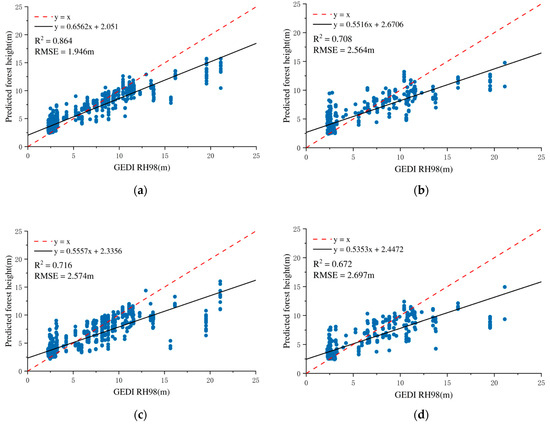
Figure 10.
Accuracy validation results for forest height inversion using multispectral, SAR, and GEDI data: (a) training model accuracy in RF; (b) validation set accuracy in RF; (c) training model accuracy in GTB; (d) validation set accuracy in GTB.
These results suggest that while the RF model can effectively capture complex nonlinear relationships within the training set, it may be more susceptible to overfitting under the current feature and data conditions. On the other hand, the GTB model, though less accurate on training data, maintains more consistent performance on the validation set, reflecting its potential advantage in practical applications requiring robust prediction across variable input distributions.
To visualize the prediction results of the regression models for forest height in Jiangsu Province, the predicted data were exported and mapped. However, since GEDI data is point-based, an interpolation method is required to convert point data into surface data for inversion over the entire study area. Therefore, the final predicted results were generated using the Inverse Distance Weighting (IDW) interpolation method, incorporating SAR data, multispectral data, and the CHM. The predicted results are shown in Figure 11.
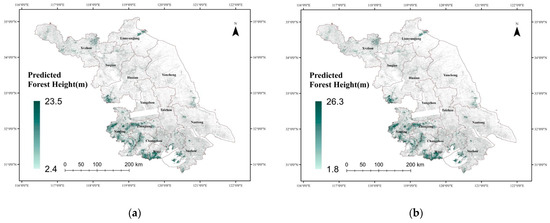
Figure 11.
The predicted results map: (a) the predicted results map produced by RF; (b) the predicted results map produced by GTB.
Forest height estimates across Jiangsu Province exhibit a clear spatial gradient, with elevations tending to be greater in the southern regions compared to the north. This overall distribution is significantly influenced by topography and the degree of urbanization. In southern Jiangsu, particularly in hilly and mountainous regions such as Nanjing, southern Wuxi and Zhenjiang, forest coverage is relatively dense, with forest heights commonly exceeding 20 m in certain localized areas. In contrast, the central and northern regions, dominated by flat plains, feature more fragmented forest distribution, primarily consisting of low-stature vegetation, with most forest heights falling below 10 m. Notable exceptions with higher vegetation occur only in limited mountainous areas, such as the Yuntai Mountain region in Lianyungang. Overall, forest resources in Jiangsu Province seemed to be predominantly concentrated in the southern mountainous zones, while the central and northern areas exhibit sparse and scattered forest cover.
5. Discussion
Among the various remote sensing inputs, the interferometric coherence and phase derived from Sentinel-1 SAR data proved especially influential. Compared with methods relying only on dual-polarized SAR backscatter or multispectral data, these InSAR features better capture canopy structural complexity, supporting the integration of heterogeneous remote sensing modalities. Their advantages lie in providing vertical structural information which is not available from optical or passive data. Interferometric phase and coherence are highly sensitive to forest vertical structure. They complement spectral indices, which describe canopy greenness and horizontal heterogeneity, and PolSAR backscatter coefficients, which capture scattering from canopy components. Together, these features support more accurate indirect estimation of canopy height. In addition, InSAR’s sensitivity to structural variability helps mitigate errors from illumination and shadow effects in complex terrain. Operating in the microwave domain, InSAR also acquires data regardless of weather or lighting, offering consistent observations particularly valuable in Jiangsu’s cloudy and rainy climate. By combining spectral, structural, and scattering information, the fusion models reduce reliance on a single data source, achieving higher predictive accuracy and stronger ecological interpretability.
In terms of model performance, the RF regression model demonstrated high accuracy on the training dataset (R2 = 0.864) but a significant drop on the validation dataset (R2 = 0.708), indicating a notable overfitting issue. This behavior may be attributed to several factors. Firstly, the model complexity, specifically the configuration of a large number of trees (500) and a small minimum leaf size (5), can cause the RF model to capture noise or specific patterns in the training data that do not generalize well to unseen data. Besides, the input features include highly correlated variables, such as multiple vegetation indices and radar metrics. This can cause the model to overemphasize minor variations and increase overfitting. Further feature selection, dimensionality reduction, or regularization could improve generalization. In contrast, the GTB model showed more balanced performance, with a smaller gap between training (R2 = 0.716) and validation (R2 = 0.672) datasets. Its sequential learning and built-in regularization likely helped handle feature redundancy and reduce overfitting.
The results show that SAR data can effectively offset the limitations of optical imagery, especially in Jiangsu’s cloudy and fragmented forest areas, where optical features alone are insufficient. By combining spectral, structural, and scattering data, multi-source fusion models achieve more stable and accurate canopy height predictions.
Despite these promising outcomes, several limitations persist. The availability and spatial continuity of GEDI LiDAR and InSAR data are restricted by acquisition conditions, leading to striping effects and incomplete coverage in some areas. Moreover, the SAR data, which are derived from C-band dual-polarization and interferometric techniques, have limited canopy penetration, which may cause underestimation in densely forested areas. Future work should incorporate SAR data from longer wavelengths and higher spatial resolutions, such as P-band from the Biomass satellite launched on 29 April 2025, or L-band from missions like Lutan-1, to address this limitation.
This paper focuses on enhancing the accuracy and efficiency of regional forest average height estimation in Jiangsu Province through the combination of multi-modal remote sensing data. The core innovation lies in the first systematic evaluation of the joint use of InSAR interferometric phase and coherence within two mainstream machine learning models: the Random Forest regression model and the Gradient Tree Boosting regression model.
First, single-source remote sensing data inevitably carry both advantages and limitations. Optical imagery provides spectral and textural information related to canopy greenness and horizontal heterogeneity, PolSAR backscatter coefficients capture scattering from canopy components, while GEDI LiDAR provides direct vertical structural references but suffers from sparse and discontinuous sampling. In contrast, interferometric coherence and phase are highly sensitive to vertical canopy structure, providing information not captured by optical or PolSAR data. Therefore, the integration of these complementary modalities is essential to obtain a more comprehensive representation of forest structure. In our study, the combination of spectral, scattering, and vertical structural information was particularly effective for Jiangsu Province, where the terrain is dominated by plains and low hills with relatively gentle undulations. In such landscapes, the fusion of multi-modal data can overcome the limitations of single-source datasets and yield more stable and accurate canopy height predictions.
Second, from the perspective of model adaptability, our framework relies on both direct and indirect vertical information (GEDI canopy height metrics and InSAR coherence/phase), spectral features (optical indices), and physical scattering metrics (dual PolSAR). Ablation experiments revealed that although GEDI and InSAR features made the strongest contributions to model performance, neither dataset alone achieved satisfactory accuracy. This highlights the mutual complementarity among data sources, which underpins the generalizability of the approach. While Random Forest tended to overfit, Gradient Tree Boosting showed stronger generalization ability across different datasets. Furthermore, given that Jiangsu Province is characterized by fragmented forests and modest terrain variability, the proposed framework demonstrates potential to be extended to other regions with similar environmental conditions. Nevertheless, the deeper mechanisms of cross-modal complementarity still need to be further explored by employing more advanced models.
Finally, the interferometric coherence and phase derived from Sentinel-1 SAR data proved especially influential among the various remote sensing inputs. Compared with methods relying only on dual-polarized SAR backscatter or multispectral data, these InSAR features better capture canopy structural complexity, supporting the integration of heterogeneous remote sensing modalities. Their advantages lie in providing vertical structural information which is not available from optical or passive data. In addition, InSAR’s sensitivity to structural variability helps mitigate errors from illumination and shadow effects in complex terrain, and its weather- and illumination-independent acquisition provides consistent observations particularly valuable in Jiangsu’s cloudy and rainy climate. However, despite these strengths, establishing robust quantitative relationships between InSAR observables and canopy height remains challenging. While multi-frequency InSAR approaches (such as using P- and X-band differences) have been successfully applied in airborne or repeat-track scenarios, the potential of spaceborne InSAR for forest height estimation is still limited by temporal baselines and requires further investigation.
In terms of model performance, the RF regression model demonstrated high accuracy on the training dataset (R2 = 0.864) but a significant drop on the validation dataset (R2 = 0.708), indicating a notable overfitting issue. This behavior may be attributed to model complexity, highly correlated input variables, and limited feature diversity. In contrast, the GTB model showed more balanced performance, with a smaller gap between training (R2 = 0.716) and validation (R2 = 0.672) datasets. Its sequential learning and built-in regularization likely helped handle feature redundancy and reduce overfitting.
Nevertheless, limitations persist due to the restricted availability and spatial continuity of GEDI and InSAR data. For instance, this study employed GEDI RH98 as the reference for canopy height, but its spatial distribution is inherently sparse and uneven. Even after interpolation, uncertainties remain, which may affect the accuracy of large-scale modeling. Future research could benefit from incorporating airborne or UAV-based LiDAR point clouds to derive CHM as denser ground truth, complemented by field plot measurements. Such improvements in reference data quality would further optimize the performance of large-scale forest height estimation models.
Future work should incorporate SAR data from longer wavelengths and higher spatial resolutions, such as P-band from the Biomass satellite (launched 29 April 2025) or L-band from missions like Lutan-1. Additionally, alternative ensemble models like XGBoost and LightGBM may offer further improvements in scalability [42,43], tuning efficiency, and robustness. To enhance spatial detail and overall estimation precision, high-resolution optical datasets (such as GaoFen-2, WorldView) may also be incorporated [44,45]. To address the issue of sparse GEDI point coverage, spatial interpolation methods or deep learning-based data augmentation approaches could be employed [46,47]. Lastly, incorporating time-series remote sensing data [48] could enable dynamic tracking of forest canopy changes and enhance the temporal generalization of the models [49,50].
6. Conclusions
This study demonstrates the value of integrating multi-source remote sensing data, especially InSAR-derived coherence and phase features, in improving regional forest canopy height estimation in Jiangsu Province. By systematically evaluating Random Forest and Gradient Tree Boosting models, we find that the inclusion of interferometric SAR features significantly improves model accuracy and robustness. While the RF model offers strong fitting ability, it is more prone to overfitting. In contrast, the GTB model achieves better generalization with relatively consistent performance across training and validation datasets.
In regions where optical data are limited by persistent cloud cover and fragmented forest landscapes, SAR and InSAR data provide essential structural information that enhances model performance. The proposed data combination strategies effectively compensate for the limitations of single-source approaches and represent a meaningful step toward more reliable and scalable forest structural monitoring.
Future research should prioritize addressing data continuity issues, integrating higher-penetration SAR bands, exploring advanced learning algorithms, and leveraging temporal information to further improve the accuracy and applicability of forest height estimation models at larger scales.
Author Contributions
Conceptualization: W.L., and Y.H.; methodology, W.L. and F.L.; software, F.L., Y.J., and Y.L.; validation, F.L.; formal analysis, F.L. and Y.J.; investigation, Y.L.; resources, F.L.; data curation, Y.J.; writing (original draft preparation), F.L.; writing (review and editing), W.L. and Y.H.; visualization, F.L.; supervision, W.L. and Y.H.; project administration, W.L.; funding acquisition, Y.H. and W.L. All authors have read and agreed to the published version of the manuscript.
Funding
This work was funded by the National Natural Science Foundation of China under Grant 42071414, 42571442, and 32371869, Key Laboratory of Land Satellite Remote Sensing Application, Ministry of Natural Resources of the People’s Republic of China (Grant No. KLSMNR-K202201), and the Student Innovation Training Program of Nanjing University of Posts and Telecommunications (STITP, 202410293052Z).
Data Availability Statement
The original data presented in this study are openly available in public repositories. The GEDI dataset is available in Google Earth Engine at LARSE/GEDI/GEDI02_A_002_MONTHLY (Rasterization by Google and the USFS Laboratory for Applications of Remote Sensing in Ecology, NASA GEDI mission, accessed via USGS LP DAAC, 25 March 2019–1 December 2024). The Sentinel-2 multispectral dataset is available in Google Earth Engine at COPERNICUS/S2 (European Union/ESA/Copernicus; dataset now deprecated, 1 May 2023–31 December 2023). The Sentinel-1 GRD dataset is available in Google Earth Engine at COPERNICUS/S1_GRD (European Union/ESA/Copernicus, 3 October 2014–28 October 2025). The Sentinel-1 SLC data (S1A_IW_SLC__1SDV) used in this study are openly available in the Copernicus Data Space Ecosystem at [https://browser.dataspace.copernicus.eu/ (accessed on 27 October 2025)]. The ESA WorldCover v200 (10 m, 2021) dataset is available at https://doi.org/10.5281/zenodo.7254221 [35].
Conflicts of Interest
The authors declare no conflicts of interest.
References
- Mo, L.; Zohner, C.M.; Reich, P.B.; Liang, J.; de Miguel, S.; Nabuurs, G.-J.; Renner, S.S.; Hoogen, J.v.D.; Araza, A.; Herold, M.; et al. Integrated global assessment of the natural forest carbon potential. Nature 2023, 624, 92–101. [Google Scholar] [CrossRef] [PubMed]
- Williams, B.A.; Beyer, H.L.; Fagan, M.E.; Chazdon, R.L.; Schmoeller, M.; Sprenkle-Hyppolite, S.; Griscom, B.W.; Watson, J.E.M.; Tedesco, A.M.; Gonzalez-Roglich, M.; et al. Global potential for natural regeneration in deforested tropical regions. Nature 2024, 636, 131–137. [Google Scholar] [CrossRef]
- Shaheen, B.; Zane, M.D.; Bui, B.-T.; Shubham; Huang, T.; Merello, M.; Scheelk, B.; Crooks, S.; Wu, M. ForestSplat: Proof-of-concept for a scalable and high-fidelity forestry mapping tool using 3D Gaussian splatting. Remote Sens. 2025, 17, 993. [Google Scholar] [CrossRef]
- Huang, X.; Cheng, F.; Wang, J.; Yi, B.; Bao, Y. Comparative Study on Remote Sensing Methods for Forest Height Mapping in Complex Mountainous Environments. Remote Sens. 2023, 15, 2275. [Google Scholar] [CrossRef]
- Chen, Y.; Yang, H.; Yang, Z.; Yang, Q.; Liu, W.; Huang, G.; Ren, Y.; Cheng, K.; Xiang, T.; Chen, M.; et al. Enhancing high-resolution forest stand height mapping in China through an individual tree-based approach with close-range lidar data. Earth Syst. Sci. Data 2024, 16, 5267–5285. [Google Scholar] [CrossRef]
- Alvites, C.; O’sullivan, H.; Francini, S.; Marchetti, M.; Santopuoli, G.; Chirici, G.; Lasserre, B.; Marignani, M.; Bazzato, E. High-Resolution Canopy Height Mapping: Integrating NASA’s Global Ecosystem Dynamics Investigation (GEDI) with Multi-Source Remote Sensing Data. Remote Sens. 2024, 16, 1281. [Google Scholar] [CrossRef]
- Wang, J.; Shen, X.; Cao, L. Upscaling Forest Canopy Height Estimation Using Waveform-Calibrated GEDI Spaceborne LiDAR and Sentinel-2 Data. Remote Sens. 2024, 16, 2138. [Google Scholar] [CrossRef]
- Liu, A.; Chen, Y.; Cheng, X. Improving Tropical Forest Canopy Height Mapping by Fusion of Sentinel-1/2 and Bias-Corrected ICESat-2–GEDI Data. Remote Sens. 2025, 17, 1968. [Google Scholar] [CrossRef]
- Uciechowska-Grakowicz, A.; Herrera-Granados, O.; Biernat, S.; Bac-Bronowicz, J. Usage of Airborne LiDAR Data and High-Resolution Remote Sensing Images in Implementing the Smart City Concept. Remote Sens. 2023, 15, 5776. [Google Scholar] [CrossRef]
- Dhargay, S.; Lyell, C.S.; Brown, T.P.; Inbar, A.; Sheridan, G.J.; Lane, P.N.J. Performance of GEDI Space-Borne LiDAR for Quantifying Structural Variation in the Temperate Forests of South-Eastern Australia. Remote Sens. 2022, 14, 3615. [Google Scholar] [CrossRef]
- Fang, G.; He, X.; Weng, Y.; Fang, L. Texture Features Derived from Sentinel-2 Vegetation Indices for Estimating and Mapping Forest Growing Stock Volume. Remote Sens. 2023, 15, 2821. [Google Scholar] [CrossRef]
- Sa, R.; Fan, W. Estimation of Forest Parameters in Boreal Artificial Coniferous Forests Using Landsat 8 and Sentinel-2A. Remote Sens. 2023, 15, 3605. [Google Scholar] [CrossRef]
- Brigante, R.; Baiocchi, V.; Calisti, R.; Marconi, L.; Proietti, P.; Radicioni, F.; Regni, L.; Vinci, A. GIS-Based Approach for Estimating Olive Tree Heights Using High-Resolution Satellite Imagery and Shadow Analysis. Appl. Sci. 2025, 15, 3066. [Google Scholar] [CrossRef]
- Fujiwara, T.; Takeuchi, W. Modeling Shadow with Voxel-Based Trees for Sentinel-2 Reflectance Simulation in Tropical Rainforest. Remote Sens. 2022, 14, 4088. [Google Scholar] [CrossRef]
- Zhu, W.; Li, Y.; Luan, K.; Qiu, Z.; He, N.; Zhu, X.; Zou, Z. Forest Canopy Height Retrieval and Analysis Using Random Forest Model with Multi-Source Remote Sensing Integration. Sustainability 2024, 16, 1735. [Google Scholar] [CrossRef]
- Li, T.; Lin, J.; Wu, W.; Jiang, R. Effects of Illumination Conditions on Individual Tree Height Extraction Using UAV LiDAR: Pilot Study of a Planted Coniferous Stand. Forests 2024, 15, 758. [Google Scholar] [CrossRef]
- Ji, Y.J.; Yang, C.R.; Zhang, W.F.; Zeng, P.; Zhang, F.X.; Qu, Y.N. Forest above ground biomass estimation using airborne P band polarimetric SAR data. J. Zhejiang AF Univ. 2022, 39, 971–980. [Google Scholar] [CrossRef]
- Nie, Y.; Hu, Y.; Sa, R.; Fan, W. Inversion of Forest above Ground Biomass in Mountainous Region Based on PolSAR Data after Terrain Correction: A Case Study from Saihanba, China. Remote Sens. 2024, 16, 846. [Google Scholar] [CrossRef]
- Xie, J.; Li, L.; Zhuang, L.; Zheng, Y. A New Strategy for Forest Height Estimation Using Airborne X-Band PolInSAR Data. Remote Sens. 2022, 14, 4743. [Google Scholar] [CrossRef]
- Xing, C.; Wang, H.; Zhang, Z.; Yin, J.; Yang, J. A Review of Forest Height Inversion by PolInSAR: Theory, Advances, and Perspectives. Remote Sens. 2023, 15, 3781. [Google Scholar] [CrossRef]
- Wang, B.; Chen, Y.; Yan, Z.; Liu, W. Integrating Remote Sensing Data and CNN-LSTM-Attention Techniques for Improved Forest Stock Volume Estimation: A Comprehensive Analysis of Baishanzu Forest Park, China. Remote Sens. 2024, 16, 324. [Google Scholar] [CrossRef]
- Saidi, S.; Idbraim, S.; Karmoude, Y.; Masse, A.; Arbelo, M. Deep-Learning for Change Detection Using Multi-Modal Fusion of Remote Sensing Images: A Review. Remote Sens. 2024, 16, 3852. [Google Scholar] [CrossRef]
- Zhang, N.; Chen, M.; Yang, F.; Yang, C.; Yang, P.; Gao, Y.; Shang, Y.; Peng, D. Forest Height Mapping Using Feature Selection and Machine Learning by Integrating Multi-Source Satellite Data in Baoding City, North China. Remote Sens. 2022, 14, 4434. [Google Scholar] [CrossRef]
- Schwartz, M.; Ciais, P.; Ottlé, C.; De Truchis, A.; Vega, C.; Fayad, I.; Brandt, M.; Fensholt, R.; Baghdadi, N.; Morneau, F.; et al. High-resolution canopy height map in the Landes forest (France) based on GEDI, Sentinel-1, and Sentinel-2 data with a deep learning approach. Int. J. Appl. Earth Obs. Geoinf. 2024, 128, 103711. [Google Scholar] [CrossRef]
- Tong, Y.; Liu, Z.; Fu, H.; Zhu, J.; Zhao, R.; Xie, Y.; Hu, H.; Li, N.; Fu, S. Forest Canopy Height Estimation Combining Dual-Polarization PolSAR and Spaceborne LiDAR Data. Forests 2024, 15, 1654. [Google Scholar] [CrossRef]
- Hosseiny, B.; Zaboli, M.; Homayouni, S. Forest change mapping using multi-source satellite SAR, optical, and LiDAR remote sensing data. ISPRS Ann. Photogramm. Remote Sens. Spat. Inf. Sci. 2024, 10, 163–168. [Google Scholar] [CrossRef]
- Zhang, H.; Yang, C.; Fan, X. MTCDNet: Multimodal Feature Fusion-Based Tree Crown Detection Network Using UAV-Acquired Optical Imagery and LiDAR Data. Remote Sens. 2025, 17, 1996. [Google Scholar] [CrossRef]
- Zheng, J.; Zhou, Z.; Zhu, M.; Wang, J.; Wan, J.; Long, Y. Integration of Optical Remote Sensing and Laser Point Cloud for Forest Stock Estimation in Karst Mountainous Areas. Forests 2024, 15, 2106. [Google Scholar] [CrossRef]
- Liu, H.; Zhang, Z.; Cao, L. Estimating forest stand characteristics in a coastal plain forest plantation based on vertical structure profile parameters derived from ALS data. Remote Sens. 2018, 22, 872–888. [Google Scholar]
- Li, Y.; Lu, D.; Lu, Y.; Li, G. Examining the Impact of Topography and Vegetation on Existing Forest Canopy Height Products from ICESat-2 ATLAS/GEDI Data. Remote Sens. 2024, 16, 3650. [Google Scholar] [CrossRef]
- Li, L.; Xin, X.; Zhao, J.; Yang, A.; Wu, S.; Zhang, H.; Yu, S. Remote Sensing Monitoring and Assessment of Global Vegetation Status and Changes during 2016–2020. Sensors 2023, 23, 8452. [Google Scholar] [CrossRef]
- Lin, S.; Wen, Q.; Wu, D.; Huang, H.; Zheng, X. Regional Forest Structure Evaluation Model Based on Remote Sensing and Field Survey Data. Forests 2024, 15, 533. [Google Scholar] [CrossRef]
- Fang, W.; Zhu, H.; Li, S.; Ding, H.; Bi, R. Rapid Identification of Main Vegetation Types in the Lingkong Mountain Nature Reserve Based on Multi-Temporal Modified Vegetation Indices. Sensors 2023, 23, 659. [Google Scholar] [CrossRef]
- Liu, M.; Zhan, Y.; Li, J.; Kang, Y.; Sun, X.; Gu, X.; Wei, X.; Wang, C.; Li, L.; Gao, H.; et al. Validation of Red-Edge Vegetation Indices in Vegetation Classification in Tropical Monsoon Region—A Case Study in Wenchang, Hainan, China. Remote Sens. 2024, 16, 1865. [Google Scholar] [CrossRef]
- Zanaga, D.; Van De Kerchove, R.; Daems, D.; De Keersmaecker, W.; Brockmann, C.; Kirches, G.; Wevers, J.; Cartus, O.; Santoro, M.; Fritz, S.; et al. ESA WorldCover 10 m 2021 v200. Zenodo 2022. [Google Scholar] [CrossRef]
- Yuan, Y.; Yin, Y.; Dai, E.; Liu, R.; Wu, S. Forest cover classification based on remote sensing threshold consistent with statistics in Heilongjiang Province. Prog. Geogr. 2016, 35, 655–663. [Google Scholar]
- Zhou, H.; Zhou, G.; Song, X.; He, Q. Dynamic Characteristics of Canopy and Vegetation Water Content during an Entire Maize Growing Season in Relation to Spectral-Based Indices. Remote Sens. 2022, 14, 584. [Google Scholar] [CrossRef]
- Furlanetto, J.; Ferro, N.D.; Longo, M.; Sartori, L.; Polese, R.; Caceffo, D.; Nicoli, L.; Morari, F. LAI estimation through remotely sensed NDVI following hail defoliation in maize (Zea mays L.) using Sentinel-2 and UAV imagery. Precis. Agric. 2023, 24, 1355–1379. [Google Scholar] [CrossRef] [PubMed]
- Li, Y.; Zhao, X.; Zhao, Q. Snow Depth Inversion in Forest Areas from Sentinel-1 Data Based on Phase Deviation Correction. Remote Sens. 2022, 14, 5930. [Google Scholar] [CrossRef]
- Zhang, J.; Chen, C.; Chen, K.; Ju, M.; Zhang, D. Local Adaptive Image Filtering Based on Recursive Dilation Segmentation. Sensors 2023, 23, 5776. [Google Scholar] [CrossRef]
- Wang, M.; Zhao, F.; Pang, Y.; Meng, R.; Jia, W.; Yue, C. Mapping forest type and tree species fractions in China’s cold-temperate forests based on synthetically mixed data and random forest regression. Natl. Remote Sens. Bull. 2025, 29, 118–133. [Google Scholar]
- Kushwaha, M.; Abirami, M. Intelligent Model for Avoiding Road Accidents Using Artificial Neural Network. Int. J. Comput. Commun. Control 2023, 18, 22. [Google Scholar] [CrossRef]
- Li, W.; Niu, Z.; Shang, R.; Qin, Y.; Wang, L.; Chen, H. High-resolution mapping of forest canopy height using machine learning by coupling ICESat-2 LiDAR with Sentinel-1, Sentinel-2 and Landsat-8 data. Int. J. Appl. Earth Obs. 2020, 92, 102163. [Google Scholar]
- Zhang, W.; Zhao, L.; Li, Y.; Shi, J.; Yan, M.; Ji, Y. Forest Above-Ground Biomass Inversion Using Optical and SAR Images Based on a Multi-Step Feature Optimized Inversion Model. Remote Sens. 2022, 14, 1608. [Google Scholar] [CrossRef]
- Luo, Y.; Qi, S.; Liao, K.; Zhang, S.; Hu, B.; Tian, Y. Mapping the Forest Height by Fusion of ICESat-2 and multi-modal Remote Sensing Imagery and Topographic Information: A Case Study in Jiangxi Province, China. Forests 2023, 14, 454. [Google Scholar] [CrossRef]
- Mitsuhashi, R.; Sawada, Y.; Tsutsui, K.; Hirayama, H.; Imai, T.; Sumita, T.; Kajiwara, K.; Honda, Y. Re-Estimating GEDI Ground Elevation Using Deep Learning: Impacts on Canopy Height and Aboveground Biomass. Remote Sens. 2024, 16, 4597. [Google Scholar] [CrossRef]
- Liu, X.; Su, Y.; Hu, T.; Yang, Q.; Liu, B.; Deng, Y.; Tang, H.; Tang, Z.; Fang, J.; Guo, Q. Neural network guided interpolation for mapping canopy height of China’s forests by integrating GEDI and ICESat-2 data. Remote Sens. Environ. 2022, 269, 112844. [Google Scholar] [CrossRef]
- Zhang, X.; Jia, W.; Sun, Y.; Wang, F.; Miu, Y. Simulation of Spatial and Temporal Distribution of Forest Carbon Stocks in Long Time Series—Based on Remote Sensing and Deep Learning. Forests 2023, 14, 483. [Google Scholar] [CrossRef]
- Wang, Y.; Zhang, N.; Chen, M.; Zhao, Y.; Guo, F.; Huang, J.; Peng, D.; Wang, X. Prediction and Spatiotemporal Dynamics of Vegetation Index Based on Deep Learning and Environmental Factors in the Yangtze River Basin. Forests 2025, 16, 460. [Google Scholar] [CrossRef]
- Niwa, H. Classification of Forest Stratification and Evaluation of Forest Stratification Changes over Two Periods Using UAV-LiDAR. Remote Sens. 2025, 17, 1682. [Google Scholar] [CrossRef]


Disclaimer/Publisher’s Note: The statements, opinions and data contained in all publications are solely those of the individual author(s) and contributor(s) and not of MDPI and/or the editor(s). MDPI and/or the editor(s) disclaim responsibility for any injury to people or property resulting from any ideas, methods, instructions or products referred to in the content. |
© 2025 by the authors. Licensee MDPI, Basel, Switzerland. This article is an open access article distributed under the terms and conditions of the Creative Commons Attribution (CC BY) license (https://creativecommons.org/licenses/by/4.0/).