Highlights
What are the main findings?
- NEP in Dongying showed an overall increasing but fluctuating trend from 2001 to 2023, with growth momentum weakening after 2017 due to increased extreme climate events.
- Extreme climate events reduced the positive role of NDVI and enhanced the negative influence of DEM on NEP, further constraining the potential for carbon sequestration since 2017.
What is the implication of the main finding?
- Extreme climate events were a critical driver of NEP changes, highlighting the need to quantify their impacts to support China’s “Dual Carbon” goals.
- The altered factor contributions underscore the importance of multi-factor synergy under climate extremes, providing key insights for adaptive ecosystem management.
Abstract
Current research on net ecosystem productivity (NEP) still lacks sufficient attention to the impacts of extreme climate events, particularly in understanding the interactive response mechanisms of carbon sinks under extreme climate conditions. This study investigated the spatiotemporal dynamics of NEP and its interactive mechanisms in Dongying, China, from 2001 to 2023 under extreme climate conditions. Using trend slope estimation, geographical detector, and XGBoost methods, we systematically revealed the responses of NEP to the factors including climatic changes, human activities, vegetation growth status, and topographic features. The results indicated that NEP exhibited an overall fluctuating yet increasing trend during 2001–2023. The normalized difference vegetation index (NDVI, for vegetation growth status) and the digital elevation model (DEM, for terrain features) were identified as the dominant factors influencing the spatial heterogeneity of NEP. However, extreme precipitation and high temperature events significantly diminished the positive contribution of the NDVI to NEP, while simultaneously amplifying the negative influence of the DEM on NEP. These two concurrent changes superimposed on each other, especially after 2017, further constrained the potential for carbon sequestration. Furthermore, a lag effect was observed in the response mechanisms of NEP to factors under the influence of precipitation and high-temperature climates. These findings highlight the critical and complex role of extreme climate in reorganizing the contributions of factors and intensifying pressure on the carbon sequestration capacity of ecosystems.
1. Introduction
Under the backdrop of global climate change and China’s “Dual Carbon” goals (peaking carbon emissions by 2030 and achieving carbon neutrality by 2060), Net Ecosystem Productivity (NEP), a core metric for assessing ecosystem carbon budgets, has become a scientific foundation for evaluating regional carbon sink potential and the effectiveness of ecological management [1]. A comprehensive understanding of the dynamic changes and response mechanisms of NEP is essential for achieving the Dual Carbon goals. However, in recent decades, global warming has led to a significant increase in the frequency and intensity of extreme climate events such as droughts, heatwaves, and heavy rainfall, which profoundly affect the carbon cycle of ecosystems and pose greater challenges to researching the dynamic balance of NEP [2,3].
The carbon sequestration potential of terrestrial ecosystems has gradually been recognized. Studies have shown that terrestrial ecosystems absorb approximately 30% of global anthropogenic CO2 emissions annually, playing a critical role in mitigating climate change [4]. Forest ecosystems, which cover about 30% of the Earth’s land surface, are particularly effective carbon sinks due to their high biomass and substantial soil carbon storage capacity. Meanwhile, the carbon sink potential of other ecosystems (such as grasslands, croplands, and even urban green spaces) is increasingly acknowledged and being re-evaluated as significant [5]. Nevertheless, under the influence of extreme climate events, the carbon sink potential of different ecosystems is affected in distinct ways and to varying degrees. For instance, extreme heat can trigger a series of human activities that significantly increase carbon emissions from terrestrial ecosystems, particularly from construction land [6]. Extreme precipitation events may lead to widespread soil moisture saturation, which severely restricts photosynthesis and impairs regional carbon sink capacity [7]. Thus, some extreme events may transiently but significantly alter CO2 release and absorption [8], and they can substantially impact the accuracy of carbon sink predictions [9]. However, current research on carbon sink potential under extreme climate events remains insufficient, particularly in understanding the dynamic changes under long-term sequential and compound extreme events.
Investigating the driving factors and mechanisms behind changes in carbon sinks (NEP) is equally as important as quantifying the carbon sink potential of ecosystems. Existing research indicates that the understanding of NEP driving mechanisms varies significantly depending on ecosystem type and locational conditions [10]. In grassland systems, relative humidity and soil pH exhibit strong explanatory power over carbon sink capacity [11]. In urban ecosystems, urban expansion has resulted in NEP losses of 89.63% in urban areas and 75.04% in suburban areas, where changes in land cover type and intensity of human activities play decisive roles [12]. The Enhanced Vegetation Index and Land Surface Water Index are key parameters for quantifying carbon sinks in forest ecosystems [13]. Terrestrial ecosystems such as forests, grasslands, and croplands each have unique drivers and pathways influencing their carbon sequestration processes [14]. In summary, despite significant differences in carbon sink mechanisms across ecosystems, each plays a crucial role.
Against the background of increasing global carbon emissions driven by climate change and urban expansion, research on the driving mechanisms of NEP is gradually shifting from single-factor dominance to multi-factor coupling, providing critical support for further unraveling carbon sink mechanisms and alleviating carbon sink pressure [15,16]. Studies have demonstrated that nitrogen addition significantly enhanced the carbon sink capacity of terrestrial ecosystems under increased precipitation [17]. On a global scale, drought and extreme heat suppress carbon sinks, with effects varying across climate zones such as boreal shrublands, mediterranean forests, and tropical savannas [18]. In temperate forests, the interaction between annual mean temperature and precipitation explains the spatial variation of NEP significantly better than any single factor [19]. These findings reveal that carbon sink dynamics are not driven by isolated factors but arise from complex interactions among multiple global change factors, particularly linked to climate change. However, against the increasing frequency of extreme climate events, it remains unclear how extreme climate change constrains other influencing factors of carbon sinks and what impacts these constraints may impose.
In response to the paradigm shift towards multi-factor coupling in NEP driving mechanism research and the growing demand for higher spatiotemporal accuracy, multi-source remote sensing and machine learning have become key technological enablers. Advances in satellite technologies (e.g., Landsat, Sentinel) support multi-source remote sensing data fusion, which integrates information from diverse sensors, platforms, and temporal sequences to improve monitoring accuracy of dynamic surface variables like vegetation growth and land use and cover change, especially in complex regions [20]. Meanwhile, machine learning methods integrated with such data, such as Random Forest (RF) and Extreme Gradient Boosting (XGBoost), excel in modeling multivariate interactions and identifying key drivers via variable importance ranking [21]. Together, these approaches help overcome technical bottlenecks in analyzing NEP dynamics under multi-factor coupling and provide a methodological foundation for assessing the constraining effects of extreme climate on driving factors.
Compared to other regions, Dongying, situated in the ecologically significant Yellow River Delta, is a focal area for ecological protection, restoration, and the implementation of the Dual Carbon goals in China. Over the past decades, Dongying has experienced more intense human activities (e.g., industrial development) [22], climate change [23], and land cover changes [24]. Therefore, investigating its carbon sink potential and driving mechanisms is of great importance, especially under the dual pressures of terrestrial ecosystem disturbances and external extreme environmental stressors.
To address the aforementioned research gaps, this study focused on Dongying and integrates multi-source remote sensing, geographical detectors, and machine learning methods. The objectives are threefold: (1) to analyze the spatiotemporal dynamics of NEP and reveal its variation from 2001 to 2023 under the influence of extreme climate events; (2) to identify the driving factors of NEP, quantify their contributions and interactive mechanisms across four categories, including climate, topography, vegetation, and human activities, so as to discern dominant factors and their types of interactions (nonlinear or bivariate enhancement); and (3) to deeply investigate the modulating effects of extreme climate by examining the reorganization of driving factor contributions during extreme climate years and to elucidate potential reversal processes in the dominant driving factors of NEP. By systematically coupling the interactive effects of extreme climate and multiple factors, this study elucidated the dynamic changes and response mechanisms of NEP in Dongying, thereby providing mechanistic support for the implementation of China’s Dual Carbon goals in this critical ecological functional zone of the Yellow River Delta.
2. Materials and Methods
2.1. Study Area
Dongying City (37.43°N, 118.67°E) is located in the Yellow River Delta region of China, representing a typical metropolis experiencing rapid urbanization and ecological conservation efforts. This region is characterized by diverse land-use types (Figure 1). The rationale for selecting Dongying as the study area is twofold: Over the past decades, Dongying has experienced more intense human activities (e.g., industrial development) [22], climate change [23], and land cover changes [24], which exhibit high susceptibility to climate change and anthropogenic disturbances, thereby serving as an ideal study area for investigating the coupling mechanisms between NEP and multi-factors. Dongying is currently piloting national initiatives for “Wetland City” certification and carbon-neutrality demonstration. Precise assessment of NEP spatiotemporal trends and their drivers will inform differentiated governance strategies to enhance carbon-sink capacity in Dongying and similar regions.
Figure 1.
Cartographic representation of land use types in Dongying, China.
2.2. Data Sources
Two categories of data were utilized in this study, and detailed parameters as well as sources of these data are presented in Table 1.

Table 1.
Introduction and source of data used in this study.
The first category refers to data used for calculating Net Ecosystem Productivity (NEP), which was applied to generate the NEP dataset covering the period from 2001 to 2023. This category includes Landsat remote sensing band data from 2001 to 2023, Sentinel remote sensing band data from 2015 to 2023, monitoring data of Net Ecosystem Exchange (NEE), and meteorological data obtained from meteorological stations. The meteorological data specifically includes air temperature and solar radiation.
The second category consists of data related to potential factors influencing NEP variations. All data in this category are stored in the form of geospatial rasters, and they integrate four types of variables to quantify the factors that affect NEP changes. The first type is climate change variables, which include annual mean precipitation (PRE) and mean air temperature (AT). The second type is topographic characteristic variables, covering Digital Elevation Model (DEM) and slope that reflect the topographic conditions of the study area. The third type is the vegetation growth variable, represented by the Normalized Difference Vegetation Index (NDVI), which indicates the growth status of vegetation. The fourth type is human activity variables, including population density (PD) and nighttime light (NTL), both of which are used to characterize the intensity of human activities in the study region.
2.3. Research Framework
The primary objective of this study is to investigate the dynamic distribution of NEP and quantify the changes in contributions of key factors contributing to NEP changes under the influence of extreme climate (Figure 2). The research framework is structured as follows:
Figure 2.
Research framework.
First, in the data preprocessing phase, multiple datasets are integrated, including NEP, human activity indicators (POP, NTL), topographic constraints (DEM, Slope), vegetation growth (NDVI), and climate change factors (PRE, AT). Second, the spatiotemporal distribution of NEP from 2001 to 2023 is analyzed using the Theil–Sen median slope estimator and Mann–Kendall test. Simultaneously, extreme climate years are identified by determining an extreme threshold value (95%) based on the climate normal period (typically defined as the preceding three decades adjacent to the observation period, e.g., the climate normal period for 2001–2010 is 1971–2000). Third, for the long-term time series overall change analysis, the Geographical Detector method is employed to conduct factor detection and interaction detection. This involves assessing factors highly explanatory for NEP changes from four dimensions: anthropogenic activities (POP, NTL), climate conditions (PRE, AT), vegetation growth (NDVI), and topographic features (DEM, Slope). Finally, in the long-term time series annual analysis, the annual and growing season distributions (2001–2023) of NEP and its associated factors (POP, NTL, DEM, Slope, NDVI) are examined. The XGBoost model is used to evaluate the impact of extreme climate disturbances (PRE, AT) on the dynamic changes of NEP and the contribution weights of its key factors. Meanwhile, the lag effect of climate disturbances is analyzed using the method of cross-correlation analysis.
2.4. Methods
2.4.1. Data Preprocessing
- (1)
- NEP
Net Ecosystem Productivity (NEP), as the key dependent variable in this study, is defined as the net carbon accumulation after deducting all biological respiration consumption (including plant autotrophic respiration and soil heterotrophic respiration) from the total carbon fixed by an ecosystem per unit time. The NEP data referenced the research methodology proposed by Huang et al. [25]. First, Net Ecosystem Exchange (NEE) monitoring data was obtained from four flux towers in Dongying City. A Random Forest (RF) regression model was applied to capture the non-linear relationships between NEE and predictor variables. The set of predictor variables included three vegetation indices and two meteorological indicators. The vegetation indices, namely Normalized Difference Vegetation Index (NDVI), Enhanced Vegetation Index (EVI), and Land Surface Water Index (LSWI), were calculated from band reflectance data extracted from remote sensing images. The meteorological indicators were air temperature and solar radiation, which were obtained by filling data gaps through spatial interpolation of meteorological station data. The RF model was evaluated using a five-fold cross-validation method, and the coefficient of determination (R2) was 0.71. This result confirms the model’s robust predictive ability for NEE estimation across the entire study area.
It should be noted that NEP and NEE are closely associated with opposite sign conventions in carbon flux quantification: NEE describes the net carbon exchange between the ecosystem and the atmosphere, while NEP represents the net carbon accumulation within the ecosystem. Thus, the final NEP data in this study were derived by converting the NEE values estimated by the RF model, following the numerical relationship of NEP = −NEE.
- (2)
- Key factors
Independent variables were selected across four categories: climatic change, including PRE and AT; topographic constraint, quantified using DEM and Slope; vegetation growing, primarily represented by the NDVI; and human activity, characterized by PD and NTL. Through geospatial processing, all variables were converted into 1 km resolution raster datasets covering the administrative area of Dongying for the period 2001–2023.
The annual NTL data used in this study cover 2001–2023, with data from 2001–2012 sourced from the DMSP/OLS satellite and data from 2013 onward from the NPP/VIIRS satellite due to original data source constraints. To ensure consistency across the entire time series, annual DMSP/OLS data from 2000–2012 were iteratively calibrated and harmonized to align with “NPP/VIIRS-like” characteristics for their respective years, resulting in a dataset with parametric attributes and data quality comparable to standard NPP/VIIRS nighttime light products. Since this research requires monthly temporal resolution, temporal disaggregation was conducted on the annual NTL data. For annual DMSP/OLS data prior to 2013 (2000–2012), a downscaling approach was applied to generate monthly values by utilizing intra-annual variation patterns derived from monthly NPP/VIIRS data available from 2013 onward; for annual NTL data after 2013—originally synthesized from NPP/VIIRS observations—monthly values were disaggregated based on the specific monthly profile of NPP/VIIRS data from the corresponding year.
Extensive studies have confirmed a strong correlation between NTL intensity and PD [26], so PD data were similarly temporally disaggregated to monthly values using the intra-annual fluctuation pattern inherent in NTL data.
2.4.2. Spatiotemporal Trend Analysis of NEP
To characterize the spatiotemporal variation patterns of NEP from 2001 to 2023, this study integrated the Theil–Sen median slope estimator with the Mann–Kendall (MK) test for detecting temporal variation characteristics [27,28]. This combined approach enabled robust identification of monotonic trends and abrupt change points.
The Theil–Sen median slope estimator is a non-parametric statistical technique designed for quantifying long-term trends in time series data. It operates by calculating the median of slopes between all pairwise combinations of data points, thereby minimizing sensitivity to outliers. This robustness makes it particularly suitable for analyzing climate-sensitive variables such as NEP, which often exhibit complex, non-stationary fluctuations over extended periods.
Unlike conventional trend tests that only assess overall monotonicity, MK test can analyze the phased variation characteristics of elements and pinpoint abrupt change points. Its core principle involves statistically evaluating the time series from both forward and reverse directions, with change points detected through the intersection points of the progressive and retrograde series statistics. It is commonly used in conjunction with the Theil–Sen median slope estimator to characterize the degree of change in long-term time series of variables.
2.4.3. Analysis of Driving Factors and Impact Mechanisms of NEP
To elucidate the interrelationships between NEP and the key factors contributing to its changes, the Geodetector method was employed to analyze the driving characteristics of these factors on NEP. The Geodetector is a statistical method grounded in the principle of spatial stratified heterogeneity, designed to identify driving factors and their interactions in geographical phenomena [29,30]. Its core premise posits that if an independent variable (X) significantly influences a dependent variable (Y), the spatial distributions of X and Y should exhibit congruence. This method does not assume linear relationships between variables, accommodates nonlinear or complex associations, and is insensitive to multicollinearity among independent variables.
The Geodetector comprises four modules: (1) Factor detector quantifies the explanatory power of independent variables on the dependent variable using the q-statistic (q ∈ [0, 1]), where higher q-values indicate stronger explanatory capacity; (2) Interaction detector identifies interaction types between paired factors (X1 and X2) by comparing individual q-values (q(X1), q(X2)) with the combined q-value (q(X1 ∩ X2)), categorizing interactions as nonlinear enhancement, bivariate enhancement, weakening, and independence; (3) Risk detector detects significant spatial differences in the dependent variable across strata derived from independent variables (Table 2); and (4) Ecological detector assesses whether the explanatory powers of two independent variables on Y differ significantly. Finally, this study utilized the first three modules to analyze the influence intensity, influence direction, and interactive mechanisms of factors highly explanatory for NEP changes [31].
Table 2.
Criteria for interaction type classification in the Interaction detector.
2.4.4. Interactive Effects of Various Factors on NEP Under Extreme Climate Conditions
The dynamics of NEP exhibit significant complexity, with multifaceted variables including climatic change, topographic constraint, vegetation growth, and human activity involved. These variables further interact through intricate mechanisms. Based on monthly data from 2001 to 2023, this study identified extreme climate events and employed the XGBoost method and cross-correlation analysis to systematically investigate the complex interactive relationships between NEP changes and various variables at both annual and growing season scales under different climatic conditions, as well as the lag effects of climate conditions’ interference on the relationships between these variables and NEP.
- (1)
- Definition of extreme climate years
For the definition of extreme climates, particularly for data with months as the minimum temporal scale, previous studies have mostly adopted statistical analysis to determine extreme thresholds. For example, months with precipitation amounts exceeding the 90th or 95th percentile of historical precipitation records are identified as extreme precipitation months [32]. In China, the national standards Monitoring Indices of Precipitation Extremes (GB/T 33669-2017) and Monitoring Indices of High Temperature Extremes (QX/T 280-2015) respectively recommend the 95th percentile threshold for defining extreme precipitation and extreme high-temperature events.
Specifically, these standards specify a two-step statistical process for threshold calculation: first, within the designated climate normal period, the annual maximum values and second maximum values of precipitation and high temperature are derived for each year. The 95th percentile threshold is then calculated based on this combined dataset of annual maxima and second maxima.
Additionally, the standards require that the data used to calculate this 95th percentile threshold should be sourced from a climate normal period—defined as the most recent preceding three decades relative to the current decade. For instance, the climate normal period for the 2001–2010 decade is 1971–2000. Consistent with these national standards, this study also adopted this same methodological approach: extreme precipitation and extreme high-temperature events were determined by first deriving the annual maxima and second maxima within the corresponding climate normal periods of the 2011–2023 study period, then calculating the 95th percentile thresholds from these values. The years in which these extreme events occurred were further defined as extreme climate years.
- (2)
- Analysis of Interaction Mechanisms
To understand the importance of the characteristics of various variables in NEP dynamics, this study employed the extreme Gradient Boosting (XGBoost) algorithm—an efficient machine learning method based on gradient-boosted decision trees, widely applied to classification, regression, and ranking tasks for structured data [21]. XGBoost was utilized to quantify the interannual differences in the explanatory power of variables on NEP, thereby clarifying how extreme climatic conditions modulate the effects of these variables on NEP. Regarding the parameter configuration of XGBoost, this study referred to previous literature [33] and set four sets of commonly used parameter combinations, considering parameters such as the number of trees, max depth, learning rate, and subsample, and selected the configuration with the best fitting performance by comparison (Table 3).
Table 3.
Parameter settings of XGBoost.
Since NEP dynamics are constrained by vegetation growth status [34], this study considered both the annual average and growing-season average levels of variables from 2001 to 2023 when analyzing interannual variation patterns. The growing season refers to the months within a year when plants are in their growth cycle, typically determined by comparing NDVI or NEP levels (e.g., NDVI during the growing season is significantly higher than that in non-growing seasons, or NEP values are usually much greater than 0 during the growing season). Through monthly comparisons of NDVI and NEP, this study found that NDVI and NEP from April to September were significantly higher than those in other months, thus defining April–September as the growing season.
- (3)
- Analysis of lag effects
To analyze the lag effects of climatic factors on the contributions of variables to NEP, a time-series-based cross-correlation analysis method was adopted [35], and the analysis scale was refined to the monthly level (consistent with the identification scale of extreme climate events). The specific implementation steps were as follows:
First, based on the monthly datasets of PRE, AT, NEP, and other related variables from 2001 to 2023, analysis samples with different lag periods (ranging from 0 to 12 months) were established. Here, the independent variables were PRE or AT, and the dependent variable was the feature importance results of each variable on NEP changes obtained from XGBoost analysis. Second, Pearson correlation analysis was used to analyze the cross-correlation coefficients of all samples. Finally, based on the cross-correlation results, the lag effects of precipitation and high-temperature climates on the contributions of various variables to NEP were analyzed.
3. Results
3.1. Spatiotemporal Dynamics of NEP from 2001 to 2023
The Theil–Sen slope estimates for NEP in Dongying from 2001 to 2023 ranged between −15.66 and 15.14 gC/m2. Spatially, the majority of the study area (green zones in Figure 3a) exhibited increasing NEP trends, reflecting the effectiveness of ecological conservation and restoration initiatives. In contrast, localized declines in NEP (red zones in Figure 3a) were observed primarily in central and peripheral zones dominated by built-up areas and coastal industrial developments. These reductions were likely attributable to intensified anthropogenic activities, including urban expansion and coastal economic development.
Figure 3.
The change trends of NEP in Dongying from 2001 to 2023. (a) is the spatial distribution of NEP trends derived from the Theil–Sen slope estimator, (b) is the categorical patterns of NEP changes classified by MK test (where statistical significance is set at the 0.05 level), and (c) is the inter-annual variation curve of NEP.
Further analysis via the MK test revealed heterogeneous significance levels in NEP trends across the study area (Figure 3b). Non-significant increase trends constituted the largest proportion (42.9% of the total area), followed by highly significant increase (15.7%). Regions exhibiting declining trends (encompassing highly significant, significant, slightly significant, and non-significant decrease) accounted for 17.0% of the area, while stable trends (no change) covered 8.14% (Table 4).
Table 4.
Classification criteria for NEP trend types in Dongying (2001–2023) based on Theil–Sen slope estimator and MK test.
Temporally, the annual mean NEP in Dongying displayed a fluctuating upward trajectory from 2001 to 2023 (Figure 3c). The lowest NEP value (93.18 gC/m2) occurred in 2003, whereas the peak (165.63 gC/m2) was recorded in 2020. However, this increasing trend showed uncertainty during the period from 2017 to 2023. A noticeable decline in NEP was observed during these years (Figure 3c), which may be attributed to the influence of extreme climate events, as this timeframe coincided with the frequent occurrence of extreme climate years (see Section 3.3.1).
3.2. Potential Key Factors and Their Explanatory Power for NEP
3.2.1. Potential Key Factors
The p-values from the factor detector underscored the statistical significance of all factors with explanatory significance for NEP, with significance levels consistently below 0.05. Analysis showed that all factors exhibited strong significant explanatory power for NEP. The five-fold cross-validation further validated this conclusion. The q-values revealed the explanatory capacity of different factors for NEP (Figure 4a): NDVI exhibited the highest explanatory power (q = 0.15), followed by Slope (q = 0.082) and DEM (q = 0.075). In contrast, AT and PD showed the lowest explanatory power (q = 0.027 and 0.032, respectively).
Figure 4.
The analysis results of multiple explanatory factors related to NEP using Geodetector. (a) is the factor detector results showing q-values of individual explanatory factors (reflecting their explanatory significance for NEP changes), (b) is the interaction detector results illustrating interaction types between paired factors, and (c) is the risk detector results identifying zoning based on NEP heterogeneity across strata.
3.2.2. Interactive Effects of Multi-Factors on NEP
The key factors with high explanatory significance for NEP on NEP primarily encompassed two types: nonlinear enhancement and bivariate enhancement (Figure 4b). Specifically, four combinations exhibited bivariate enhancement (PRE-NDVI, PRE-Slope, NDVI-Slope, and NDVI-DEM). Interactions involving NDVI ranked highest in magnitude, predominantly manifesting as bivariate enhancement (e.g., NDVI-Slope, NDVI-DEM, NDVI-PRE). These combinations generated positive synergistic effects in explaining NEP but did not achieve a “nonlinear leap”. Notably, climatic factors (represented by PRE and AT) consistently yielded higher interaction levels and a greater frequency of nonlinear enhancement when combined with other variables. This underscored that the interaction mechanisms between climatic conditions and other explanatory factors constitute a critical research focus for understanding multiple explanatory factors related to NEP.
3.2.3. Response Patterns of Key Factors Related to NEP
Risk detector results revealed that the association of explanatory factors with NEP exhibited no strictly monotonic trends (Figure 4c). AT, PD, and NTL generally demonstrated negative associations, whereas PRE and NDVI showed positive associations. DEM and Slope exhibited a nonlinear association characterized by an initial increase followed by a decrease. Specifically for DEM, as its levels gradually increased, the nature of its association with NEP shifted toward a negative correlation, indicating a more pronounced negative linkage between higher DEM values and NEP.
Besides, NTL featured only five stratification levels (fewer than other factors) due to its spatially limited distribution primarily confined to built-up areas, which occupy a minor proportion of the study area. Therefore, NTL dynamics from 2001 to 2023 exhibited limited temporal variability, resulting in a simplified stratification scheme. Nevertheless, this limitation did not compromise the validity of directional inferences regarding factor–NEP relationships derived from the risk detector analysis.
3.3. Impacts of Extreme Climate Conditions on NEP
3.3.1. Distribution of Extreme Climate
Statistical analysis showed that the rainfall in Dongying City presented periodic fluctuations. Specifically, July or August of each year was the month with the highest rainfall volume, and the rainfall distribution was highly concentrated. It could be clearly observed that the rainfall in July and August was significantly higher than that in other months, showing a trend of sharp increase and sharp decrease (Figure 5a). When compared with the 95th percentile extreme climate threshold derived from the climate normal period, it was found that no extreme rainfall events occurred during 2001–2010, as the rainfall in all months was below 517.96 mm. The extreme climate thresholds calculated based on the climate normal periods for the 2011–2020 and 2021–2023 periods were the same (Figure 5c), both at 507.17 mm. Through comparison, the extreme rainfall years were identified as 2023, 2021, and 2022.
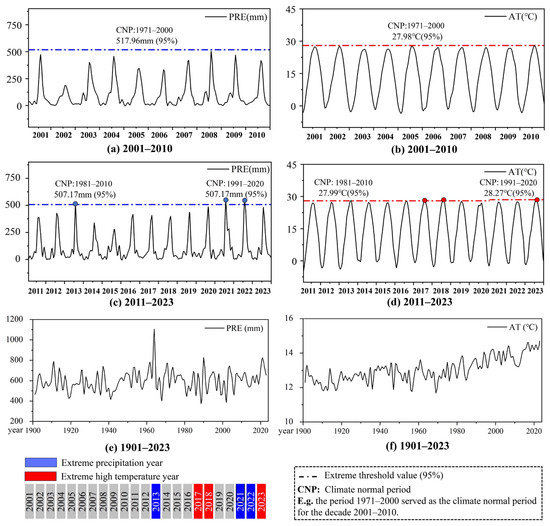
Figure 5.
Distribution of extreme climate years and statistics of historical climate change in Dongying, China. (a,b) respectively show the monthly distribution characteristics of precipitation and temperature, along with extreme climate thresholds, for the period 2001–2010; (c,d) respectively represent the monthly distribution characteristics of precipitation and temperature, as well as extreme climate thresholds, for 2011–2023; (e,f) respectively display the interannual variation curves of precipitation and temperature from 1900 to 2023.
Similar to the rainfall situation, the temperature distribution in Dongying City also exhibited periodic fluctuations, and the high-temperature months were mainly concentrated in July and August. However, compared with rainfall, the monthly variation of temperature was relatively stable (Figure 5b). By comparing with the 95th percentile extreme climate threshold from the climate normal period, it was noted that no extreme high-temperature events occurred during 2001–2010, as the temperature in all months was below 27.98 °C. The extreme climate thresholds based on the climate normal periods for the 2011–2020 and 2021–2023 periods were 27.99 °C and 28.27 °C, respectively (Figure 5d). The comparison results indicated that the extreme high-temperature years were 2017, 2018, and 2023.
There were differences in extreme thresholds across different climate normal periods, which were related to the historical distribution characteristics of rainfall and temperature. Compared with the historical distribution of rainfall, the overall upward trend of temperature in Dongying City was more obvious. Moreover, as the years progressed, the values of the highest temperature had been continuously broken (Figure 5e,f).
3.3.2. Effects of Extreme Climate
Compared with other factors, NDVI was a key explanatory factor for NEP variations, especially during the growing season (Figure 6). During 2001–2023, the annual average importance eigenvalue of NDVI for NEP variations reached 0.478 in the growing season, which was higher than the annual average of 0.343 year-round. Regarding the variation trend, the importance of growing season NDVI exhibited an overall long-term increasing trend from 2001 to 2023. However, significant short-term declines were observed after 2013 and particularly after 2017. These short-term declines might be affected by extreme climate events, as their timing highly coincides with the occurrence of such events, which have disrupted the long-term upward trajectory. From the year-round perspective, the importance of NDVI also exhibited a downward trend in the later period.
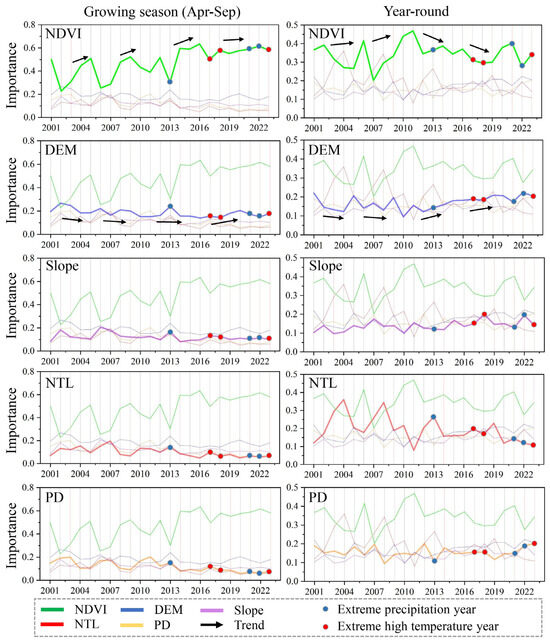
Figure 6.
Response characteristics of NEP to the key factors under extreme climate conditions in Dongying.
The importance level of DEM for NEP variations was lower than that of NDVI, especially in the growing season, with an annual average of 0.169, which was lower than the 0.183 at the annual scale. However, its annual fluctuation was opposite to that of NDVI. Thus, its importance to NEP increased significantly in the later period when extreme climates were concentrated. Combined with the negative correlation between DEM and NEP (Figure 4c), this increase further increased the difficulty of NEP enhancement and limited carbon sequestration capacity.
The importance levels of the remaining factors in both the growing season and the year-round were lower than those of NDVI and DEM, except for NTL. At the annual scale, the importance of NTL’s contribution to NEP variations reached 0.193, exceeding that of DEM but lower than that of NDVI. This indicated that human activities also played an important role in the formation process of NEP. Moreover, compared with the low and stable distribution of NTL in the growing season, the dynamic interference of human activities on NEP might occur more frequently in the non-growing season. In contrast, for the growing season, the interference of climatic conditions was stronger.
3.3.3. Lag Effects of Extreme Climate
The results of cross-correlation analysis showed that the characteristics of precipitation and temperature changes in the study area had a significant lag effect on the importance of each key factor to NEP variations. From the perspective of lag impacts (Figure 7): For Slope, PD, and DEM, the slopes of their lag correlations with precipitation and high temperature first decreased and then increased as the number of lag months increased. In contrast, the slopes of the lag correlations between NDVI, NTL, and the two climatic factors (precipitation and high temperature) first increased and then decreased, with the inflection points all occurring around June. From the perspective of optimal lag effects (Table 5), the optimal lag months for precipitation were January and November, while those for high temperature were concentrated in April–June.
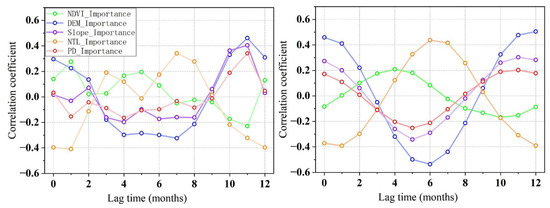
Figure 7.
The lag effect of extreme climate on the response mechanisms of NEP, with the horizontal axis representing the average explanatory power of driving factors on NEP.
Table 5.
Optimal lag months of PRE and AT.
4. Discussion
4.1. Interactive Effects of Factors: Key to Decoding NEP Dynamics
The formation of NEP constitutes a complex biogeophysical process, with prior studies confirming the significance of multifaceted drivers, including climatic conditions, anthropogenic activities, land cover, and geographical context in governing NEP variability [36]. To further dissect the impact roles of these drivers, this study adopted a dual analysis from the perspective of long-term temporal variation and year-by-year from 2001 to 2023. For the long-term temporal variation dimension, the Geodetector model was utilized to systematically quantify the explanatory power and interaction mechanisms of multi-variate driving factors on NEP. For the year-by-year comparative analysis dimension, XGBoost was employed to reveal the importance of the characteristics of core factors influencing NEP variations across different years in response to climatic conditions, with a particular focus on extreme events. Collectively, our findings indicated that synergistic interactions among multiple factors were a crucial determinant for analyzing the spatiotemporal dynamics of NEP.
Previous studies have emphasized the significance of NDVI, DEM, and anthropogenic activities (PD and NTL) as drivers of NEP [37,38,39]. This study corroborated that NDVI and DEM exhibited the highest explanatory power for spatial heterogeneity of NEP, while anthropogenic factors (PD) demonstrated substantially weaker influence. Furthermore, prior research indicated that synergistic interactions between PRE and DEM generated additive effects, particularly under extreme precipitation events that critically impaired NEP [37,40]. Our findings validated this conclusion, where Geodetector-based interaction analysis revealed not only a nonlinear enhancement effect between PRE and DEM but also consistently significant nonlinear enhancements involving climatic factors (PRE, VPD, and AT) paired with other factors. This underscored that climatic conditions constituted a pivotal component in dissecting interactive mechanisms governing NEP variability.
To advance the investigation of drive factor interactions, this study incorporated multiple climatic variables (including PRE and AT) and defined extreme climate thresholds (95%) for Dongying from 2001 to 2023. This study found that extreme high precipitation and high temperature events severely attenuate the positive contribution of NDVI to NEP while amplifying the negative impact of DEM. This dual-factor synergy exacerbated the inhibitory effects of extreme climates on carbon sequestration potential. Notably, the increased frequency of extreme climate years (2017–2023) has posed significant challenges to NEP enhancement, indicating that climatic extremes now demand unprecedented attention in carbon management strategies.
4.2. Potential Mechanisms Under Extreme Climate Conditions
Statistical analyses revealed distinct impacts of human activities, vegetation growth, and topographic features on NEP, manifested through differential directional effects, explanatory power, and response patterns to extreme climate elements. The mechanistic framework was synthesized as follows (Figure 8):
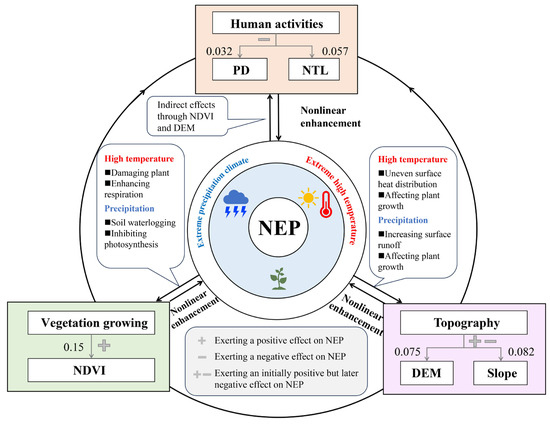
Figure 8.
Potential driving mechanisms of anthropogenic activities, land cover, and topographic conditions on NEP under extreme climatic conditions.
- (1)
- NDVI
NDVI exhibited the highest explanatory power for NEP variability and exerts a consistent positive effect on NEP. However, this positive contribution was significantly attenuated under extreme high-temperature and high-precipitation events. Previous studies indicated that extreme heat would impact photosynthesis, impairing vegetation’s carbon fixation functionality and thereby reducing NDVI’s explanatory contribution [41,42]. Concurrently, elevated temperatures amplified autotrophic respiration rates, diminishing net carbon assimilation benefits from photosynthesis and further suppressing NEP [43]. Extreme precipitation events induced soil waterlogging, triggering stomatal closure, and substantially inhibiting photosynthetic efficiency [7].
- (2)
- DEM and Slope
DEM demonstrated stronger explanatory power for NEP than Slope, with both factors exhibiting nonlinear response curves characterized by initial positive effects transitioning to negative influences beyond threshold elevations. Crucially, DEM’s influence was markedly amplified by extreme high-temperature and high-precipitation events under frequent climatic extremes (2017–2023 years). During heatwaves, high DEM values exacerbated heterogeneous surface radiation and thermal stress, restricting vegetation growth vigor [44]. Under heavy rainfall, slope gradients derived from DEM accelerated surface runoff, inducing nutrient leaching and soil erosion, which critically compromise plant health and carbon assimilation, particularly in high-rainfall scenarios [45,46]. Collectively, extreme climatic conditions magnify DEM-mediated constraints on vegetation vitality, indirectly exacerbating NEP decline.
- (3)
- PD and NTL
PD and NTL exhibited comparatively lower explanatory capacity for NEP variability relative to other drive factors. Consequently, their direct responsiveness to extreme climatic events was minimal. Observed fluctuations in PD and NTL contributions during extreme conditions were predominantly indirect consequences of NDVI suppression and DEM amplification rather than intrinsic anthropogenic response mechanisms. Our findings were consistent with previous studies indicating that PD and NTL, as proxy indicators of human activity intensity and urbanization level, exerted indirect and complex influences on NEP [47]. These effects were primarily mediated through alterations in other driving factors such as vegetation status and land use types.
4.3. Limitations and Uncertainty
This study has four primary limitations. First, due to data constraints, the minimum temporal scale of the current study is monthly. In future research, efforts will be made to achieve a daily scale, which would facilitate a deeper understanding of the interactive characteristics between climate and carbon sinks. Second, the analysis incorporated a limited set of driving factors. Future studies should integrate additional variables (such as wind speed, atmospheric pressure) to refine the mechanistic understanding of NEP responses to multifactorial stressors. Third, the scope of climatic disturbances was confined to precipitation and temperature. Other disturbance regimes, including land desertification, soil salinization, and geohazards, may also significantly modulate NEP dynamics. Systematically incorporating these factors would substantially advance our comprehension of the complex mechanisms governing NEP variability under global change scenarios. Fourth, although the random forest regression model demonstrated robust predictive performance (R2 = 0.71), uncertainties associated with input data resolution and model structure may influence absolute NEP estimates. However, these uncertainties are unlikely to substantially alter the main conclusions regarding long-term trends and dominant drivers, as the analysis primarily relies on relative spatial-temporal patterns and comparative outputs.
5. Conclusions
This study employed integrated geospatial analysis and long-term statistical modeling to investigate NEP dynamics, key factors, and drive mechanistic, particularly under extreme climatic conditions. The principal findings were synthesized as follows:
(1) From 2001 to 2023, the NEP in Dongying exhibited a fluctuating upward trajectory, however, the growth momentum was constrained due to the increased frequency of extreme climate events from 2017 to 2023.
(2) Climatic conditions, human activities, vegetation growing, and topographic features collectively exerted statistically significant correlation on the variability of NEP (p < 0.01). Among these factors, the NDVI demonstrated the highest explanatory power (q = 0.15), followed by slope (q = 0.082) and DEM (q = 0.075).
(3) Non-linear enhancement and bivariate enhancement were the dominant interaction types, with climate factors paired with other drivers exhibiting the strongest synergistic effects. In particular, extreme precipitation and high-temperature events significantly diminished the positive contribution of NDVI to NEP, while simultaneously amplifying the negative influence of DEM. These two concurrent changes superimposed on each other further constrain the potential for carbon sequestration.
(4) Between 2017 and 2023, the inhibitory effect of extreme climate events on NEP intensified, coinciding with an increase in the frequency of compound extreme climate events. Additionally, the disturbance caused by extreme climate events on the NEP response mechanism exhibited a lag effect.
Author Contributions
Conceptualization, L.W.; methodology, W.C.; software, Y.Z.; validation, W.S.; data curation, G.L.; writing—original draft preparation, L.W.; writing—review and editing, L.W. and W.C.; visualization, N.H.; supervision, Z.N.; funding acquisition, X.Z. and Y.P. All authors have read and agreed to the published version of the manuscript.
Funding
This research was funded by the National Key Research and Development Project of China (grant number: 2021YFB3901305), the Ministry-Province Cooperative Project under the Ministry of Natural Resources (grant number: 2024ZRBSHZ098), and the Self-Deployment Project of the Aerospace Information Research Institute, Chinese Academy of Sciences (grant number: E4Z202021F).
Data Availability Statement
The data supporting the findings of this study were obtained from multiple public sources. Precipitation (PRE) and air temperature (AT) data were obtained from the Tibetan Plateau Data Center (https://data.tpdc.ac.cn/home) for the period 1901–2023. DVI data were obtained from the Tibetan Plateau Data Center (https://data.tpdc.ac.cn/home) for the period 2001–2023. DEM data were accessed from the Copernicus PANDA portal (https://doi.org/10.5069/G9028PQB) with an acquisition year of 2015. Population density (PD) data came from the LandScan Global Population Database (https://landscan.ornl.gov) for 2001–2023. Night-time light (NTL) data were provided by the National Earth System Science Data Center (http://geodata.nnu.edu.cn) from 2001 to 2023.
Acknowledgments
We confirm that all individuals mentioned in the acknowledgements section have consented to their inclusion.
Conflicts of Interest
The authors declare no conflicts of interest.
Abbreviations
The following abbreviations are used in this manuscript:
| NEP | Net ecosystem productivity |
| NDVI | Normalized difference vegetation index |
| DEM | Digital elevation model |
| PRE | Precipitation |
| AT | Air temperature |
| PD | Population density |
| NTL | Nighttime light |
| NEE | Net ecosystem exchange |
References
- Chapin, F.S.; Woodwell, G.M.; Randerson, J.T.; Rastetter, E.B.; Lovett, G.M.; Baldocchi, D.D.; Clark, D.A.; Harmon, M.E.; Schimel, D.S.; Valentini, R.; et al. Reconciling Carbon-Cycle Concepts, Terminology, and Methods. Ecosystems 2006, 9, 1041–1050. [Google Scholar] [CrossRef]
- Liu, Q.; Peng, C.; Schneider, R.; Cyr, D.; McDowell, N.G.; Kneeshaw, D. Drought-Induced Increase in Tree Mortality and Corresponding Decrease in the Carbon Sink Capacity of Canada’s Boreal Forests from 1970 to 2020. Glob. Chang. Biol. 2023, 29, 2274–2285. [Google Scholar] [CrossRef]
- Yi, K.; Zhang, J.; Lei, H.; Chen, W.; Zhang, Y.; Fu, S.; Wang, K. Response of Ecological Condition in Ecologically Fragile Areas to Disturbance from Extreme Precipitation Event: An Empirical Analysis from the Loess Plateau. J. Clean. Prod. 2025, 512, 145701. [Google Scholar] [CrossRef]
- Bar-On, Y.M.; Li, X.; O’Sullivan, M.; Wigneron, J.P.; Sitch, S.; Ciais, P.; Frankenberg, C.; Fischer, W.W. Recent Gains in Global Terrestrial Carbon Stocks Are Mostly Stored in Nonliving Pools. Science 2025, 387, 1291–1295. [Google Scholar] [CrossRef]
- Wigneron, J.-P.; Li, X.; Frappart, F.; Fan, L.; Al-Yaari, A.; De Lannoy, G.; Liu, X.; Wang, M.; Le Masson, E.; Moisy, C. SMOS-IC data record of soil moisture and L-VOD: Historical development, applications and perspectives. Remote Sens. Environ. 2021, 254, 112238. [Google Scholar] [CrossRef]
- Zhao, L.; Zhang, C.; Wang, Q.; Yang, C.; Suo, X.; Zhang, Q. Climate Extremes and Land Use Carbon Emissions: Insight from the Perspective of Sustainable Land Use in the Eastern Coast of China. J. Clean. Prod. 2024, 452, 142219. [Google Scholar] [CrossRef]
- Feldman, A.F.; Konings, A.G.; Gentine, P.; Cattry, M.; Wang, L.; Smith, W.K.; Biederman, J.A.; Chatterjee, A.; Joiner, J.; Poulter, B. Large Global-Scale Vegetation Sensitivity to Daily Rainfall Variability. Nature 2024, 636, 380–384. [Google Scholar] [CrossRef]
- Meng, Z.; Guan, Y.; Feng, Y. Simulating the Impact of Typhoons on Air—Sea Co2 Fluxes on the Northern Coastal Area of the South China Sea. Environ. Res. Lett. 2024, 19, 044008. [Google Scholar] [CrossRef]
- Resplandy, L.; Hogikyan, A.; Müller, J.D.; Najjar, R.G.; Bange, H.W.; Bianchi, D.; Weber, T.; Cai, W.-J.; Doney, S.C.; Fennel, K.; et al. A Synthesis of Global Coastal Ocean Greenhouse Gas Fluxes. Glob. Biogeochem. Cycles 2024, 38, e2023GB007803. [Google Scholar] [CrossRef]
- Choudhary, B.; Dhar, V.; Pawase, A.S. Blue Carbon and the Role of Mangroves in Carbon Sequestration: Its Mechanisms, Estimation, Human Impacts and Conservation Strategies for Economic Incentives. J. Sea Res. 2024, 199, 102504. [Google Scholar] [CrossRef]
- Liu, X.; Zhang, R.; Guo, J.; Xu, H.; Miao, Y.; Niu, F.; Gao, Z.; Yang, X.; Xiong, F.; Zhang, J. Analysis of the Spatiotemporal Dynamics of Grassland Carbon Sinks in Xinjiang Via the Improved Casa Model. Ecol. Indic. 2025, 170, 113062. [Google Scholar] [CrossRef]
- Jiang, C.; Wu, Z.; Cheng, J.; Yu, Q. Impacts of Urbanization on Net Primary Productivity in the Pearl River Delta, China. Int. J. Plant Prod. 2015, 9, 581–598. [Google Scholar]
- Xiao, X.; Hollinger, D.; Aber, J.; Goltz, M.; Davidson, E.A.; Zhang, Q.; Moore, B. Satellite-Based Modeling of Gross Primary Production in an Evergreen Needleleaf Forest. Remote Sens. Environ. 2004, 89, 519–534. [Google Scholar] [CrossRef]
- Wei, D.; Tao, J.; Wang, Z.; Zhao, H.; Zhao, W.; Wang, X. Elevation-dependent pattern of net CO2 uptake across China. Nat. Commun. 2024, 15, 2489. [Google Scholar] [CrossRef]
- McLeod, E.; Chmura, G.L.; Bouillon, S.; Salm, R.; Björk, M.; Duarte, C.M.; Lovelock, C.E.; Schlesinger, W.H.; Silliman, B.R. A Blueprint for Blue Carbon: Toward an Improved Understanding of the Role of Vegetated Coastal Habitats in Sequestering CO2. Front. Ecol. Environ. 2011, 9, 552–560. [Google Scholar] [CrossRef]
- Valentine, K.; Herbert, E.R.; Walters, D.C.; Chen, Y.; Smith, A.J.; Kirwan, M.L. Climate-Driven Tradeoffs between Landscape Connectivity and the Maintenance of the Coastal Carbon Sink. Nat. Commun. 2023, 14, 1137. [Google Scholar] [CrossRef] [PubMed]
- Wang, Z.; Zhang, J.; Luo, P.; Sun, D.; Li, J. Revealing the Spatio-Temporal Characteristics and Impact Mechanism of Carbon Emission in China’s Urban Agglomerations. Urban Clim. 2023, 52, 101733. [Google Scholar] [CrossRef]
- Tang, S.; Tian, D.; Wang, J.; Zhang, R.; Wang, S.; Song, J.; Wan, S.; Zhang, J.; Zhang, S.; Li, Z.; et al. Synergistic Effects of Multiple Global Change Drivers on Terrestrial Ecosystem Carbon Sink. Sci. Total Environ. 2024, 906, 167554. [Google Scholar] [CrossRef] [PubMed]
- Buttlar, J.v.; Zscheischler, J.; Rammig, A.; Sippel, S.; Reichstein, M.; Knohl, A.; Jung, M.; Menzer, O.; Arain, M.A.; Buchmann, N.; et al. Impacts of Droughts and Extreme Temperature Events on Gross Primary Production and Ecosystem Respiration: A Systematic Assessment across Ecosystems and Climate Zones. Biogeosciences Discuss. 2018, 15, 1293–1318. [Google Scholar] [CrossRef]
- Liu, L.; Zhang, X. Glc_Fcs10: Global 10 M Land-Cover Dataset with Fine Classification System from Sentinel-1 and 2 Time-Series Data. Zenodo 2025, 17, 14729665. [Google Scholar]
- Khan, S.; Juvigny-Khenafou, N.P.D.; Dalu, T.; Milham, P.J.; Hamid, Y.; Eltohamy, K.M.; Ullah, H.; Amiri, B.J.; Chen, H.; Wu, N. The Influence of Ph and Temperature on Benthic Chlorophyll-A: Insights from Shap-Xgboost and Random Forest Models. Ecol. Inform. 2025, 91, 103355. [Google Scholar] [CrossRef]
- Zhang, J.; Hao, X.; Hao, H.; Fan, X.; Li, Y. Climate Change Decreased Net Ecosystem Productivity in the Arid Region of Central Asia. Remote Sens. 2021, 13, 4449. [Google Scholar] [CrossRef]
- Guo, X.; Liu, Y.; Xie, T.; Li, Y.; Liu, H.; Wang, Q. Impact of Ecological Restoration on Carbon Sink Function in Coastal Wetlands: A Review. Water 2025, 17, 488. [Google Scholar] [CrossRef]
- Herbert, E.R.; Windham-Myers, L.; Kirwan, M.L. Sea-Level Rise Enhances Carbon Accumulation in United States Tidal Wetlands. One Earth 2021, 4, 425–433. [Google Scholar] [CrossRef]
- Huang, N.; Wang, L.; Zhang, Y.; Gao, S.; Niu, Z. Estimating the Net Ecosystem Exchange at Global Fluxnet Sites Using a Random Forest Model. IEEE J. Sel. Top. Appl. Earth Obs. Remote Sens. 2021, 14, 9826–9836. [Google Scholar] [CrossRef]
- Wen, C.; Long, T.; He, G.; Jiao, W.; Jiang, W. Temporally enhanced RSEI and nighttime lights reveal long-term ecological changes and effective protection in China’s inaugural national parks. Ecol. Indic. 2025, 170, 112981. [Google Scholar] [CrossRef]
- Sen, P.K. Estimates of the Regression Coefficient Based on Kendall’s Tau. J. Am. Stat. Assoc. 1968, 63, 1379–1389. [Google Scholar] [CrossRef]
- Okafor, C.G.; Jimoh, O.D.; Larbi, K.I. Detecting Changes in Hydro-Climatic Variables During the Last Four Decades (1975–2014) on Downstream Kaduna River Catchment, Nigeria. Atmos. Clim. Sci. 2017, 7, 161–175. [Google Scholar] [CrossRef]
- Wang, J.-F.; Li, X.-H.; Christakos, G.; Liao, Y.-L.; Zhang, T.; Gu, X.; Zheng, X.-Y. Geographical Detectors--Based Health Risk Assessment and Its Application in the Neural Tube Defects Study of the Heshun Region, China. Int. J. Geogr. Inf. Sci. 2010, 24, 107–127. [Google Scholar] [CrossRef]
- Zhang, Z.; Song, Y.; Wu, P. Robust Geographical Detector. Int. J. Appl. Earth Obs. Geoinf. 2022, 109, 102782. [Google Scholar] [CrossRef]
- Kovačević, J.; Cvijetinović, Ž.; Lakušić, D.; Kuzmanović, N.; Šinžar-Sekulić, J.; Mitrović, M.; Stančić, N.; Brodić, N.; Mihajlović, D. Spatio-Temporal Classification Framework for Mapping Woody Vegetation from Multi-Temporal Sentinel-2 Imagery. Remote Sens. 2020, 12, 2845. [Google Scholar] [CrossRef]
- Saki, S.A.; Sofia, G.; Anagnostou, E.N. Characterizing Conus-Wide Spatio-Temporal Changes in Daily Precipitation, Flow, and Variability of Extremes. J. Hydrol. 2023, 626, 130336. [Google Scholar] [CrossRef]
- Zhou, M.; Zhou, S.; Hei, J.; Yang, S.; Liu, Q.; Yang, T.; Zhiqiang, W. Impact of innovation drivers in Chinese cities: Machine learning analysis using XGBoost. Cities 2025, 167, 106347. [Google Scholar] [CrossRef]
- Qi, S.; Zhang, H.; Zhang, M. Evolutionary characteristics of carbon sources/sinks in Chinese terrestrial ecosystems regarding to temporal effects and geographical partitioning. Ecol. Indic. 2024, 160, 111923. [Google Scholar] [CrossRef]
- He, L.; Wang, J.; Peltier, D.M.P.; Ritter, F.; Ciais, P.; Peñuelas, J.; Xiao, J.; Crowther, T.W.; Li, X.; Ye, J.-S.; et al. Lagged precipitation effects on plant production across terrestrial biomes. Nat. Ecol. Evol. 2025, 9, 1800–1811. [Google Scholar] [CrossRef]
- Yang, R.; Yuan, H.; Du, R.; Zhou, L.; Wu, J.; Gao, L.; Mao, T. Temperature-Vpd-Evapotranspiration Interactions Modulated Asynchronous Dynamics of Vegetation Photosynthesis and Net Ecosystem Production in Eurasia. Ecol. Indic. 2025, 174, 113445. [Google Scholar] [CrossRef]
- Hoylman, Z.H.; Jencso, K.G.; Hu, J.; Martin, J.T.; Holden, Z.A.; Seielstad, C.A.; Rowell, E.M. Hillslope Topography Mediates Spatial Patterns of Ecosystem Sensitivity to Climate. J. Geophys. Res. Biogeosci. 2018, 123, 353–371. [Google Scholar] [CrossRef]
- Zhang, Y.; Wang, Z.; Shi, X.; Sun, P.; Xiao, P.; Xu, J.; Shen, D. Impacts of Climate Change and Vegetation Greening Driven by Natural and Anthropogenic Factors on Carbon Sink in Chinese Loess Plateau after Ecological Restoration. Catena 2025, 258, 109310. [Google Scholar] [CrossRef]
- Wang, C.; Zhao, W.; Zhang, Y. The Change in Net Ecosystem Productivity and Its Driving Mechanism in a Mountain Ecosystem of Arid Regions, Northwest China. Remote Sens. 2022, 14, 4046. [Google Scholar] [CrossRef]
- Guo, D.; Song, X.; Hu, R.; Cai, S.; Zhu, X.; Hao, Y. Grassland Type-Dependent Spatiotemporal Characteristics of Productivity in Inner Mongolia and Its Response to Climate Factors. Sci. Total Environ. 2021, 775, 145644. [Google Scholar] [CrossRef]
- Adamsa, H.D.; Guardiola-Claramonte, M.; Barron-Gafford, G.A.; Villegas, J.C.; David, D.B.; Zoug, C.B.; Troch, P.A.; Huxman, T.E. Temperature Sensitivity of Drought-Induced Tree Mortality Portends Increased Regional Die-Off under Global-Change-Type Drought. Proc. Natl. Acad. Sci. USA 2009, 106, 7063–7066. [Google Scholar] [CrossRef]
- Zeng, Z.L.; Wang, X.Q.; Zhang, S.B.; Huang, W. Mesophyll Conductance Limits Photosynthesis in Fluctuating Light under Combined Drought and Heat Stresses. Plant Physiol. 2024, 194, 1498–1511. [Google Scholar] [CrossRef]
- Bernacchi, C.J.; Long, S.P.; Ort, D.R. Safeguarding Crop Photosynthesis in a Rapidly Warming World. Science 2025, 388, 1153–1160. [Google Scholar] [CrossRef]
- Chen, R.; Yin, G.; Liu, G.; Li, J.; Verger, A. Evaluation and Normalization of Topographic Effects on Vegetation Indices. Remote Sens. 2020, 12, 2290. [Google Scholar] [CrossRef]
- Tang, C.; Liu, Y.; Li, Z.; Guo, L.; Xu, A.; Zhao, J. Effectiveness of Vegetation Cover Pattern on Regulating Soil Erosion and Runoff Generation in Red Soil Environment, Southern China. Ecol. Indic. 2021, 129, 107956. [Google Scholar] [CrossRef]
- Xing, W.; Sun, G.; Zou, Z.; Li, Y.; Yang, P.; Ao, C. Mathematical Model of Ammonia Nitrogen Transport from Soil to Runoff on Irregular Slopes. J. Hydrol. 2023, 620, 129440. [Google Scholar] [CrossRef]
- Kang, J.; Zhang, Q.; Zhang, B.; Hu, Y.; Zhang, C.; Li, C. Dual Impacts of Urban Expansion on the Carbon Sequestration Capacity of Urban Vegetation: A Multi-Scale Global Study. Ecol. Indic. 2025, 176, 113746. [Google Scholar] [CrossRef]


Disclaimer/Publisher’s Note: The statements, opinions and data contained in all publications are solely those of the individual author(s) and contributor(s) and not of MDPI and/or the editor(s). MDPI and/or the editor(s) disclaim responsibility for any injury to people or property resulting from any ideas, methods, instructions or products referred to in the content. |
© 2025 by the authors. Licensee MDPI, Basel, Switzerland. This article is an open access article distributed under the terms and conditions of the Creative Commons Attribution (CC BY) license (https://creativecommons.org/licenses/by/4.0/).