Highlights
What are the main findings?
- The Mongolian Plateau is revealed to be under persistent threat from frequent flash droughts (2000–2021).
- The standard precipitation evapotranspiration–temperature–vegetation drought index (STVDI) proves highly effective due to its rapid response to precipitation and soil moisture changes.
What are the implication of the main finding?
- The STVDI is established as a robust drought monitoring tool specifically for arid and semi-arid regions.
- A new, fine-resolution (1-km) monthly drought dataset was provided to aid ecological and disaster management.
Abstract
Drought represents one of the most critical environmental hazards in arid and semi-arid regions, exerting profound impacts on ecological security and sustainable development. Nevertheless, many existing drought indices exhibit delayed responses to precipitation and soil moisture anomalies, thereby constraining their ability to characterize the rapid onset and evolution of drought events. To address this limitation, we propose the Standardized Temperature–Vegetation Drought Index (STVDI), which integrates precipitation, evapotranspiration, temperature, and vegetation dynamics within a Euclidean space framework and explicitly incorporates lag-response analysis. Taking the Mongolian Plateau (MP)—a key transition zone from taiga forest to desert steppe—as the study region, we constructed a 1 km resolution STVDI dataset spanning 2000–2021. Results reveal that over 88% of the MP is highly susceptible to flash droughts, with an average lag time of only 0.52 days, underscoring the index’s capacity for rapid drought detection. Spatial analysis indicates that drought severity peaks during March and April, with moderate drought conditions concentrated in central Mongolia and severe droughts prevailing across southwestern Inner Mongolia. Although trend analysis suggests a slight long-term alleviation of drought intensity, nearly 70% of the MP is projected to experience further intensification in the future. This study delivers the first high-resolution, low-lag drought monitoring dataset for the MP and advances theoretical understanding of drought propagation and lag mechanisms in arid and semi-arid ecosystems.
1. Introduction
Drought is widely recognized as a prolonged period of below-average precipitation, leading to water scarcity and a significant reduction in land productivity [1]. The term encompasses distinct phenomena with different onset and impacts: meteorological drought signals precipitation deficits, agricultural drought reflects soil moisture shortages affecting crops, hydrological drought manifests as reduced water resources with a time lag, and socioeconomic drought arises when water shortages affect human activities. Among these, meteorological and agricultural droughts are most relevant in arid and semi-arid regions and form the focus of this study. Frequent and prolonged droughts can cause the collapse of water resource systems, land degradation, ecological imbalance, and pose threats to social security [2,3], thereby constituting one of the most critical challenges to global sustainable development. The 2024 United Nations report, “The Global Threat of Drying Lands: Regional and Global Aridity Trends and Future Projections,” highlights that over three-quarters of the Earth’s terrestrial surface is at risk of experiencing permanent drought conditions [4]. In recent decades, climate change has globally intensified the frequency, duration, and severity of drought events, implying the urgent need for accurate and timely drought monitoring system [5,6].
Meteorological and agricultural droughts are the most prevalent types in arid and semi-arid regions, numerous drought indices have been developed to reflect actual drought conditions [7]. The meteorological drought index is primarily derived from meteorological data, including precipitation, temperature, and evaporation, to reflect the precipitation deficit in a given region over a specified time period [8]. Standardized Precipitation Evapotranspiration Index (SPI) [9], Effective Drought Index (EDI) [10], Rainfall Anomaly Index [11], National Rainfall Index [12], and Bhalme–Mooley Drought Index [13] rely solely on precipitation data, showing a weak correlation with actual drought conditions. Palmer Drought Severity Index (PDSI) [14] incorporates factors, such as precipitation, temperature, and soil moisture (SM), thereby providing a reflection of the long-term effects of drought on SM conditions. The Standardized Precipitation Evapotranspiration Index (SPEI) [15] assessed the impact of potential evapotranspiration on drought using SPI. However, due to the low density and uneven distribution of meteorological stations, it struggles to accurately depict the spatial distribution of droughts [16].
Modeling is typically performed using remote sensing data, especially Moderate-resolution Imaging Spectroradiometer (MODIS) data [17]. With the rapid development of large areas remote sensing monitoring, MODIS data is widely used in drought monitoring due to its advantages of high temporal resolution (daily), wide coverage (global cover), and easy accessibility (free access). Crop Water Stress Index [18], Vegetation Condition Index (VCI) [19], Temperature Condition Index (TCI) [20], Vegetation Health Index (VHI) [21], SM Index [22], SM Deficit Index [23] are predominantly anchored in remote sensing data, encompassing indicators, such as normalized difference vegetation index (NDVI), temperature, vegetation health, and SM, painting a comprehensive picture of the environmental dynamics. Normalized Multi-band Drought Index [24], United States Drought Monitor [25], Vegetation Drought Response Index [26] integrates multiple indices (e.g., SPI, PDSI, etc.) and indicators (e.g., NDVI, SM, etc.), providing a more comprehensive reflection of the drought process. Nevertheless, these indices are constrained by regional boundaries and exhibit insufficient robustness when delineating drought phenomena across diverse climatic zones [27]. Furthermore, the existing drought indices often fail to adequately account for the lagged response between precipitation and soil moisture, leading to the potential loss of early warning signals for drought onset.
The mathematical models used to simulate a composite drought index primarily encompass the empirical allocation method (EAM) [28], principal component analysis (PCA) [29], entropy weight method (EWM) [30], and machine learning (ML) approaches [31]. The EAM is highly sensitive to specific regions and thus difficult to apply universally. The PCA may lead to information loss owing to data dimensionality reduction, thereby affecting the reliability of drought monitoring outcomes. The EWM involves complex calculations, which limits its practical application. ML methods depend heavily on large datasets and exhibit limited extensibility. The fusion of multi-source data (meteorological and agricultural droughts) and modeling methods poses a significant challenge in developing a universally applicable drought index. Thus, it is necessary to select multiple appropriate parameters tailored to specific regions and time periods to construct an efficient and straightforward composite drought index.
Mongolian Plateau (MP) plays important role for regional sustainable development because it has vast grassland areas and serves as an ecological barrel from the northern taiga forest to the southern dessert steppe. Drought is a serious risk in MP under global warming and more frequent extreme weather events. By utilizing the aforementioned drought indices and modeling approaches, the spatiotemporal distribution of drought on the MP have been studied. Using the long-term SPEI sequence, Wang [32] reported that drought intensity increased and then decreased from 1901 to 2014, while Tong [33] observed that nearly 80% of the region experienced intensified drought during 1980–2014. Li [34] attributed 57% of the long-term aridification trend to atmospheric circulation changes., whereas Cao [35] highlighted progressive drought intensification from 1982 to 2018 with clear seasonal differences. Other studies predicted worsening drought trends toward mid-century [36]. While these findings are valuable, most analyses rely on indices with inherent lag responses, limiting their ability to capture rapid drought dynamics. In recent years, numerous international studies have developed drought indices using single or dual-variable approaches based on SPI, SPEI, NDVI, soil moisture (SM), TCI, or their combinations [37,38]. Although models such as SPEI-VCI and Vegetation Health Index (VHI) have been widely used, many suffer from limitations including time-lagged responses to precipitation anomalies, low spatial resolution [39], and limited effectiveness in detecting flash droughts [40], especially in arid regions like the Mongolian Plateau.
To address this gap, the present study introduces the Standardized Temperature–Vegetation Drought Index (STVDI), developed within a three-dimensional Euclidean space constructed from SPEI, TCI, and VCI. This formulation comprehensively integrates precipitation, evapotranspiration, temperature, and vegetation conditions while accounting for lag responses, thereby combining the strengths of meteorological and agricultural drought indices. The central hypothesis is that combining SPEI, TCI, and VCI in a Euclidean framework reduces lag effects and improves the capacity for near real-time drought detection compared to existing indices. The objectives of this study are therefore to: (1) evaluate the performance and responsiveness of the proposed STVDI for drought monitoring on the MP; (2) analyze the spatiotemporal distribution and seasonal variations of drought on the MP from 2000 to 2021 at 1 km resolution; (3) examine drought propagation and lag characteristics based on STVDI; and (4) evaluate long-term drought trends and persistence using statistical approaches including the Hurst index. By achieving these objectives, this study seeks to provide both a practical drought monitoring tool and new theoretical insights into drought lag mechanisms in arid and semi-arid ecosystems.
2. Materials and Methods
2.1. Study Area
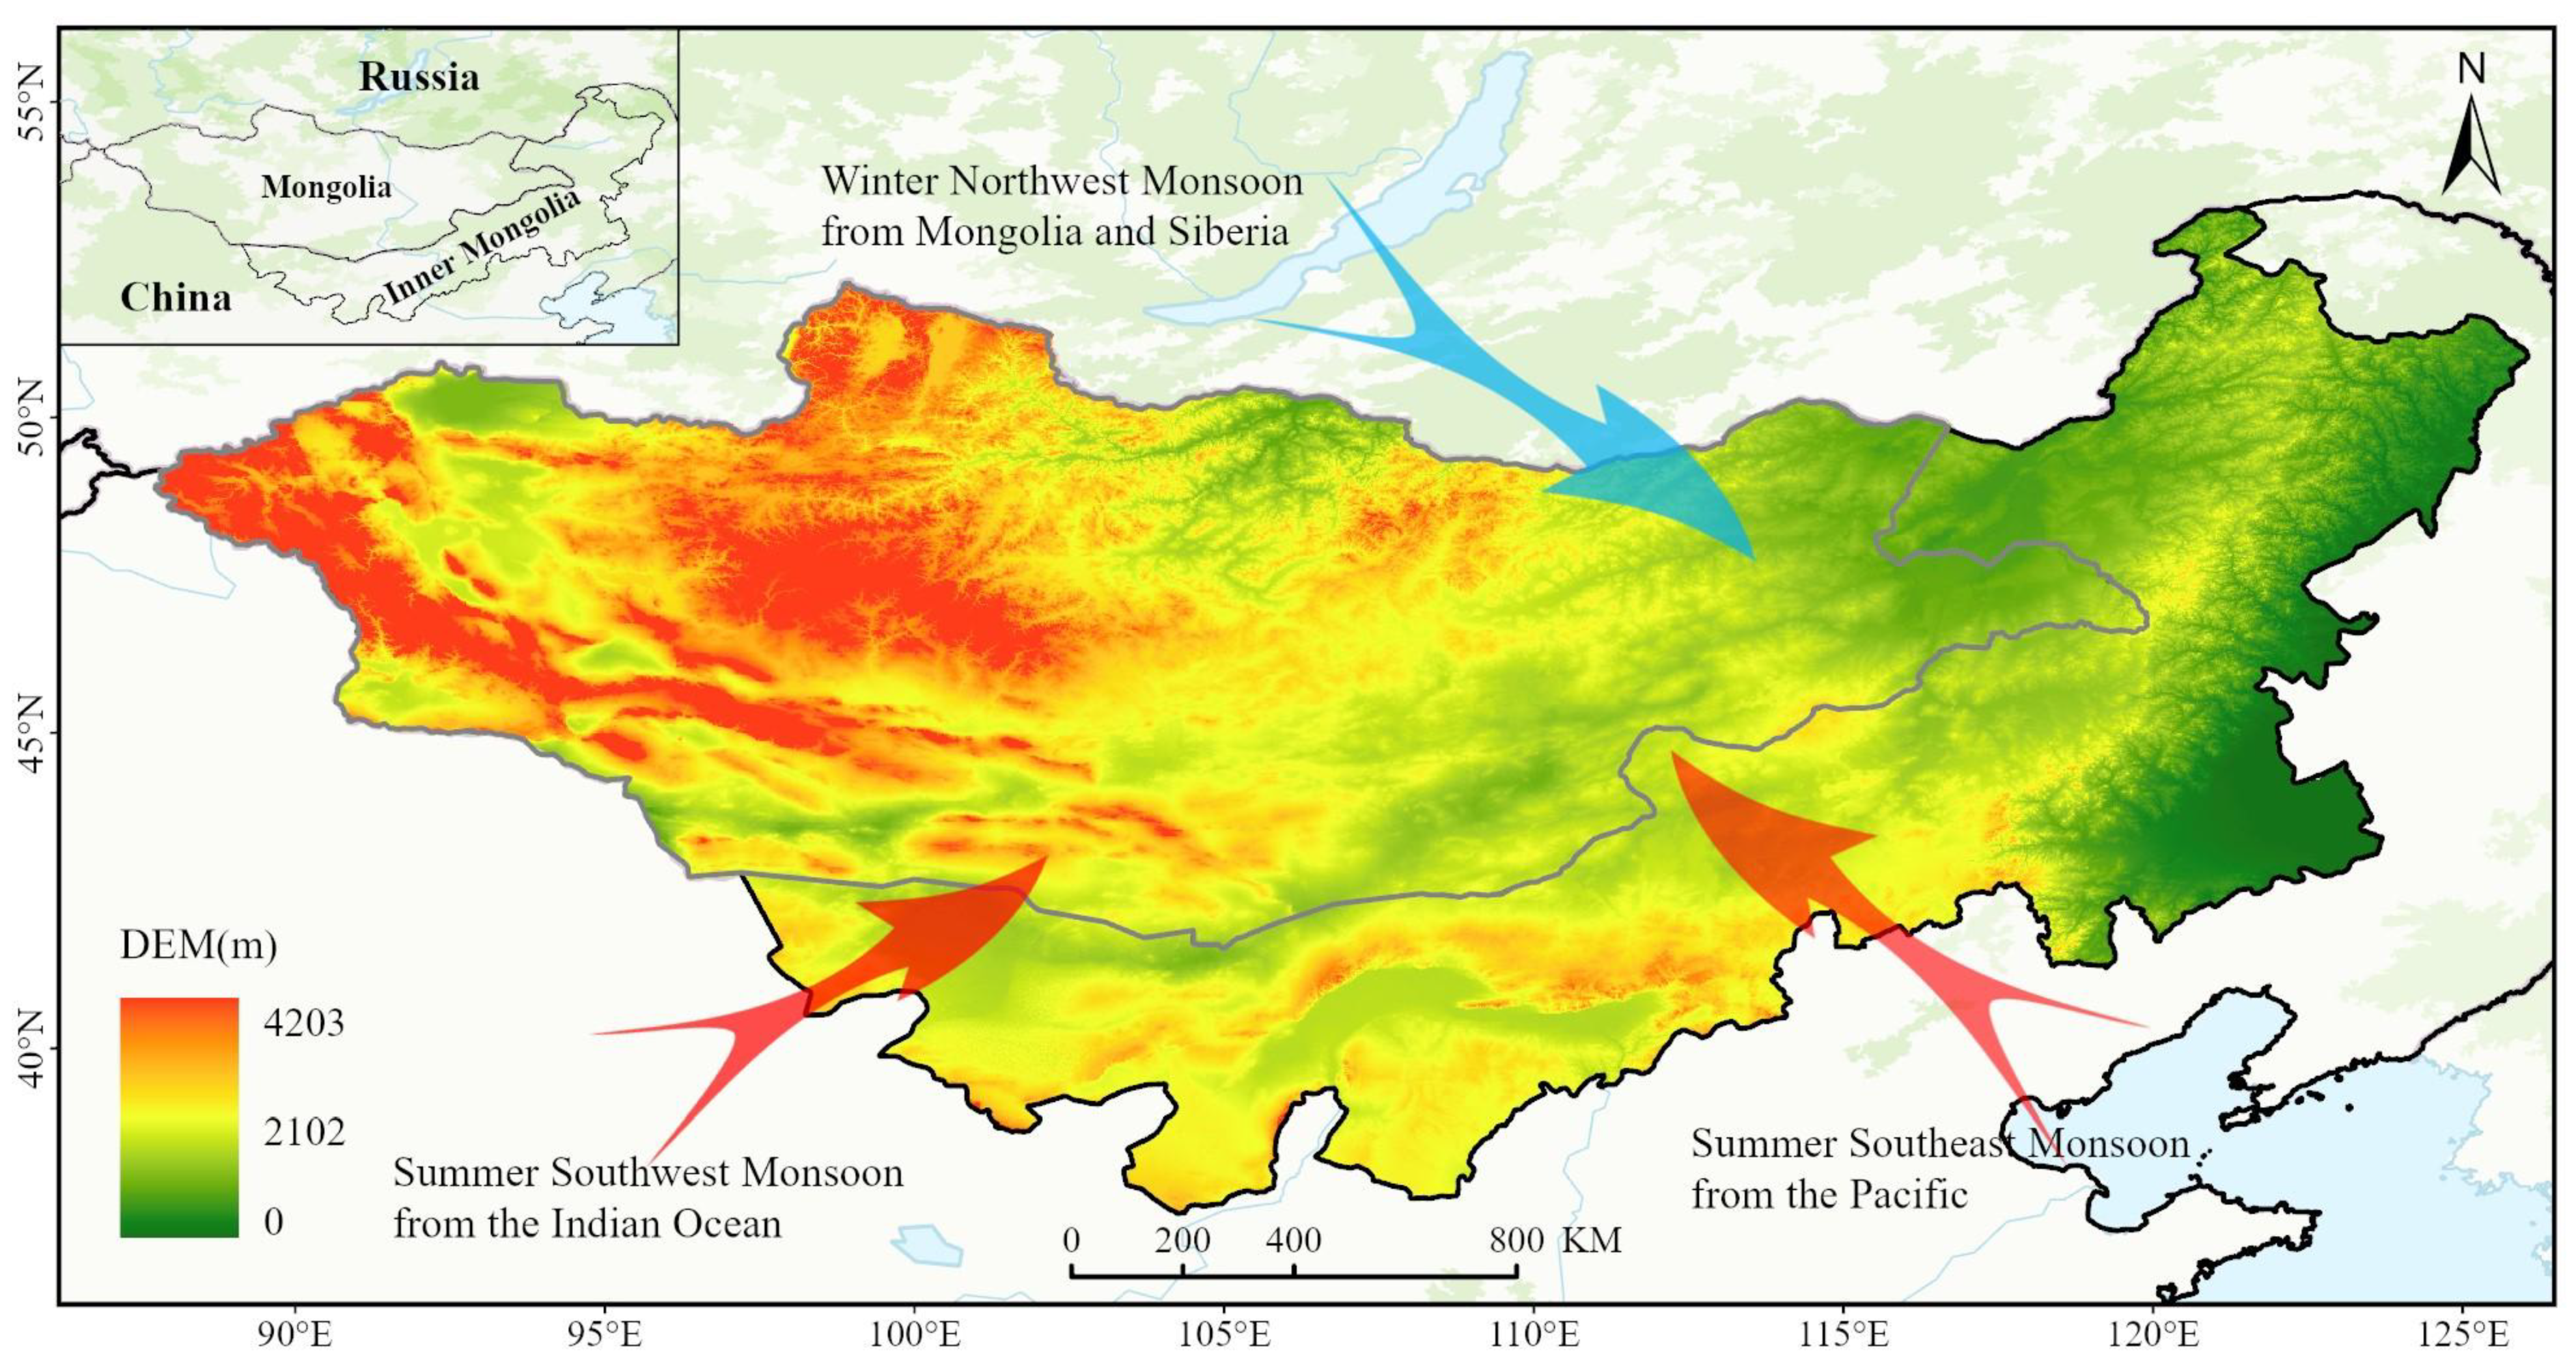
The Mongolian Plateau (87°43′–126°04′E, 37°22′–53°20′N) is an inland plateau in Asia. The total area of the study region is ~2,747,116 km2, comprising 1,183,000 km2 of Inner Mongolia and 1,564,116 km2 of Mongolia (Figure 1). Mountains dominate the northwest, hills occupy central and eastern regions, and the Gobi Desert spans the southwest, with an average elevation of 1580 m. Vegetation shows a north–south gradient from forest and forest-steppe to typical steppe, desert steppe, and Gobi Desert. Soil types vary accordingly, including chestnut and dark brown soils in steppe areas, meadow soils in forest-steppe zones, and sandy or saline soils in deserts, influencing water retention and drought propagation. The climate transitions from subhumid zones in the north and east to semi-arid, arid, and hyper-arid zones in the southwest. Annual precipitation ranges from 250 to 450 mm, decreasing north to south and east to west, while high evapotranspiration in arid zones exacerbates drought severity. Land use patterns further shape vulnerability: northern areas support forestry and cropland, central and eastern regions are dominated by grazing, and overgrazing in steppe and desert-steppe zones reduces vegetation resilience. The Gobi region is sparsely populated but ecologically fragile, with sandy soils and limited water heightening drought risks. The interactions among topography, soil types, vegetation cover, climate, and land use drive the spatial heterogeneity of drought occurrence and propagation across the MP.
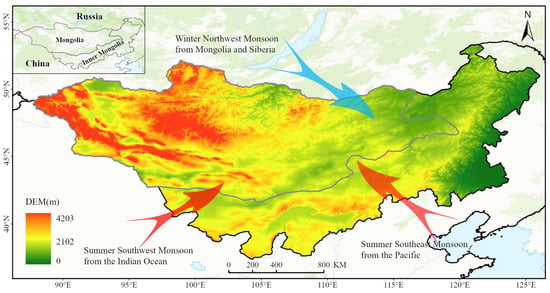
Figure 1.
Map of the Mongolian Plateau.
Figure 1.
Map of the Mongolian Plateau.
2.2. Data and Processing
The simplified table of all the input data used in this study is shown in Table 1 below.

Table 1.
Data sources and description.
2.2.1. MODIS Data
The MOD11A2 product (global 1 km 8 d land surface temperature, LST), MOD13Q1 product (global 250 m 16 d NDVI), and MOD16A2 (global 500 m 8 d potential evapotranspiration, PET) were obtained from NASA Earth Observation System Data Gateway. To maintain the same spatiotemporal resolution, the PET (500 m) and NDVI (250 m) were resampled to 1000 m through the bicubic interpolation and the 16 d NDVI, 8 d LST, and PET values are averaged to obtain their monthly products. Using Google Earth Engine, batch computations were performed on these MODIS products to derive the monthly LST, NDVI, and PET from 2000 to 2021. These monthly products were then used to calculate the Temperature Condition Index (TCI) using LST, the Vegetation Condition Index (VCI) using NDVI, and the Standardized Precipitation Evapotranspiration Index (SPEI) using PET.
2.2.2. Meteorological Data
Meteorological data mainly included monthly average precipitation (Pre) and SM data. Pre data was obtained from the Centre for Environmental Data Analysis with Climatic Research Unit Time-Series (CRU TS) dataset (https://crudata.uea.ac.uk/cru/data/hrg/cru_ts_4.06/, accessed on 12 September 2025), which is a regular latitude-longitude grid of 0.5° × 0.5°, derived through spatial interpolation based on the observation data from global meteorological stations. To ensure the consistency of spatiotemporal resolution in the data, the Pre data was downscaled to align with the spatial resolution of MODIS datasets. The downscaling process used the proportional method with fine-resolution auxiliary data (elevation, slope, and aspect) to distribute precipitation while maintaining precipitation totals within each 0.5° grid. This method achieved a correlation of 0.85 with ground observations (RMSE = 12.3 mm/month). The downscaling uncertainty was assessed using cross-validation, with relative errors typically within ±15% for monthly values. The monthly downscaled Pre data with a resolution of 1000 m were obtained through this rigorously validated method [41,42,43].
ERA5-Land was achieved by replaying the land component of the European Centre for Medium-Range Weather Forecasts ERA5 climate reanalysis. ERA5-Land monthly aggregated SM data are a regular latitude-longitude grid of 0.1° × 0.1°. We employed Volumetric Soil Water Layer 1 from the ERA5-Land dataset as SM, which represents the water volume in the first soil layer (0–7 cm, with the soil surface regarded as 0 cm). The SM data were resampled to a resolution of 1000 m using the nearest neighbor method. Nearest neighbor resampling is adopted to enhance computational efficiency and avoid non-physical values (e.g., negative soil moisture) that may occur when using bilinear interpolation in regions with strong spatial heterogeneity [44]. The accuracy of SM data from ERA5-Land has been verified and applied in various drought studies [45,46].
2.3. Methods
2.3.1. Drought Indices
Meteorological drought is primarily attributed to the decrease in precipitation and increase in PET, while agricultural drought focuses more on the capacity of SM to sustain vegetation growth. The Standardized Precipitation Evapotranspiration Index (SPEI) integrates the water balance between precipitation and PET, making it a widely used indicator for meteorological drought assessment. In contrast, the Temperature Condition Index (TCI) and Vegetation Condition Index (VCI) are remote sensing-based indicators derived from MODIS LST and NDVI products, respectively, and are particularly suitable for agricultural drought monitoring due to their sensitivity to vegetation water stress and thermal conditions. Compared with other possible indices, SPEI, VCI, and TCI together provide complementary perspectives on atmospheric, thermal, and vegetation conditions, enabling a more comprehensive evaluation of drought characteristics across regions. Their calculation formulas, based on MODIS data and meteorological observations, are expressed as follows:
denotes the monthly precipitation, while represents the potential evapotranspiration.
The parameters , , and were estimated using linear moments to fit a log-logistic probability distribution.
:
:
when the cumulative probability (), transform into . The constants are defined as, = 2.515517, = 0.802853, = 0.010328, = 1.432788, = 0.189269, and = 0.001308.
denotes the LST within the current time period. and represent the maximum and minimum LST recorded from 2000 to 2021, respectively. Similarly, indicates NDVI value for the current time period, while and correspond to the highest and lowest NDVI values observed during the same time span. The a and b are weighting coefficients and their values are commonly set to 0.5.
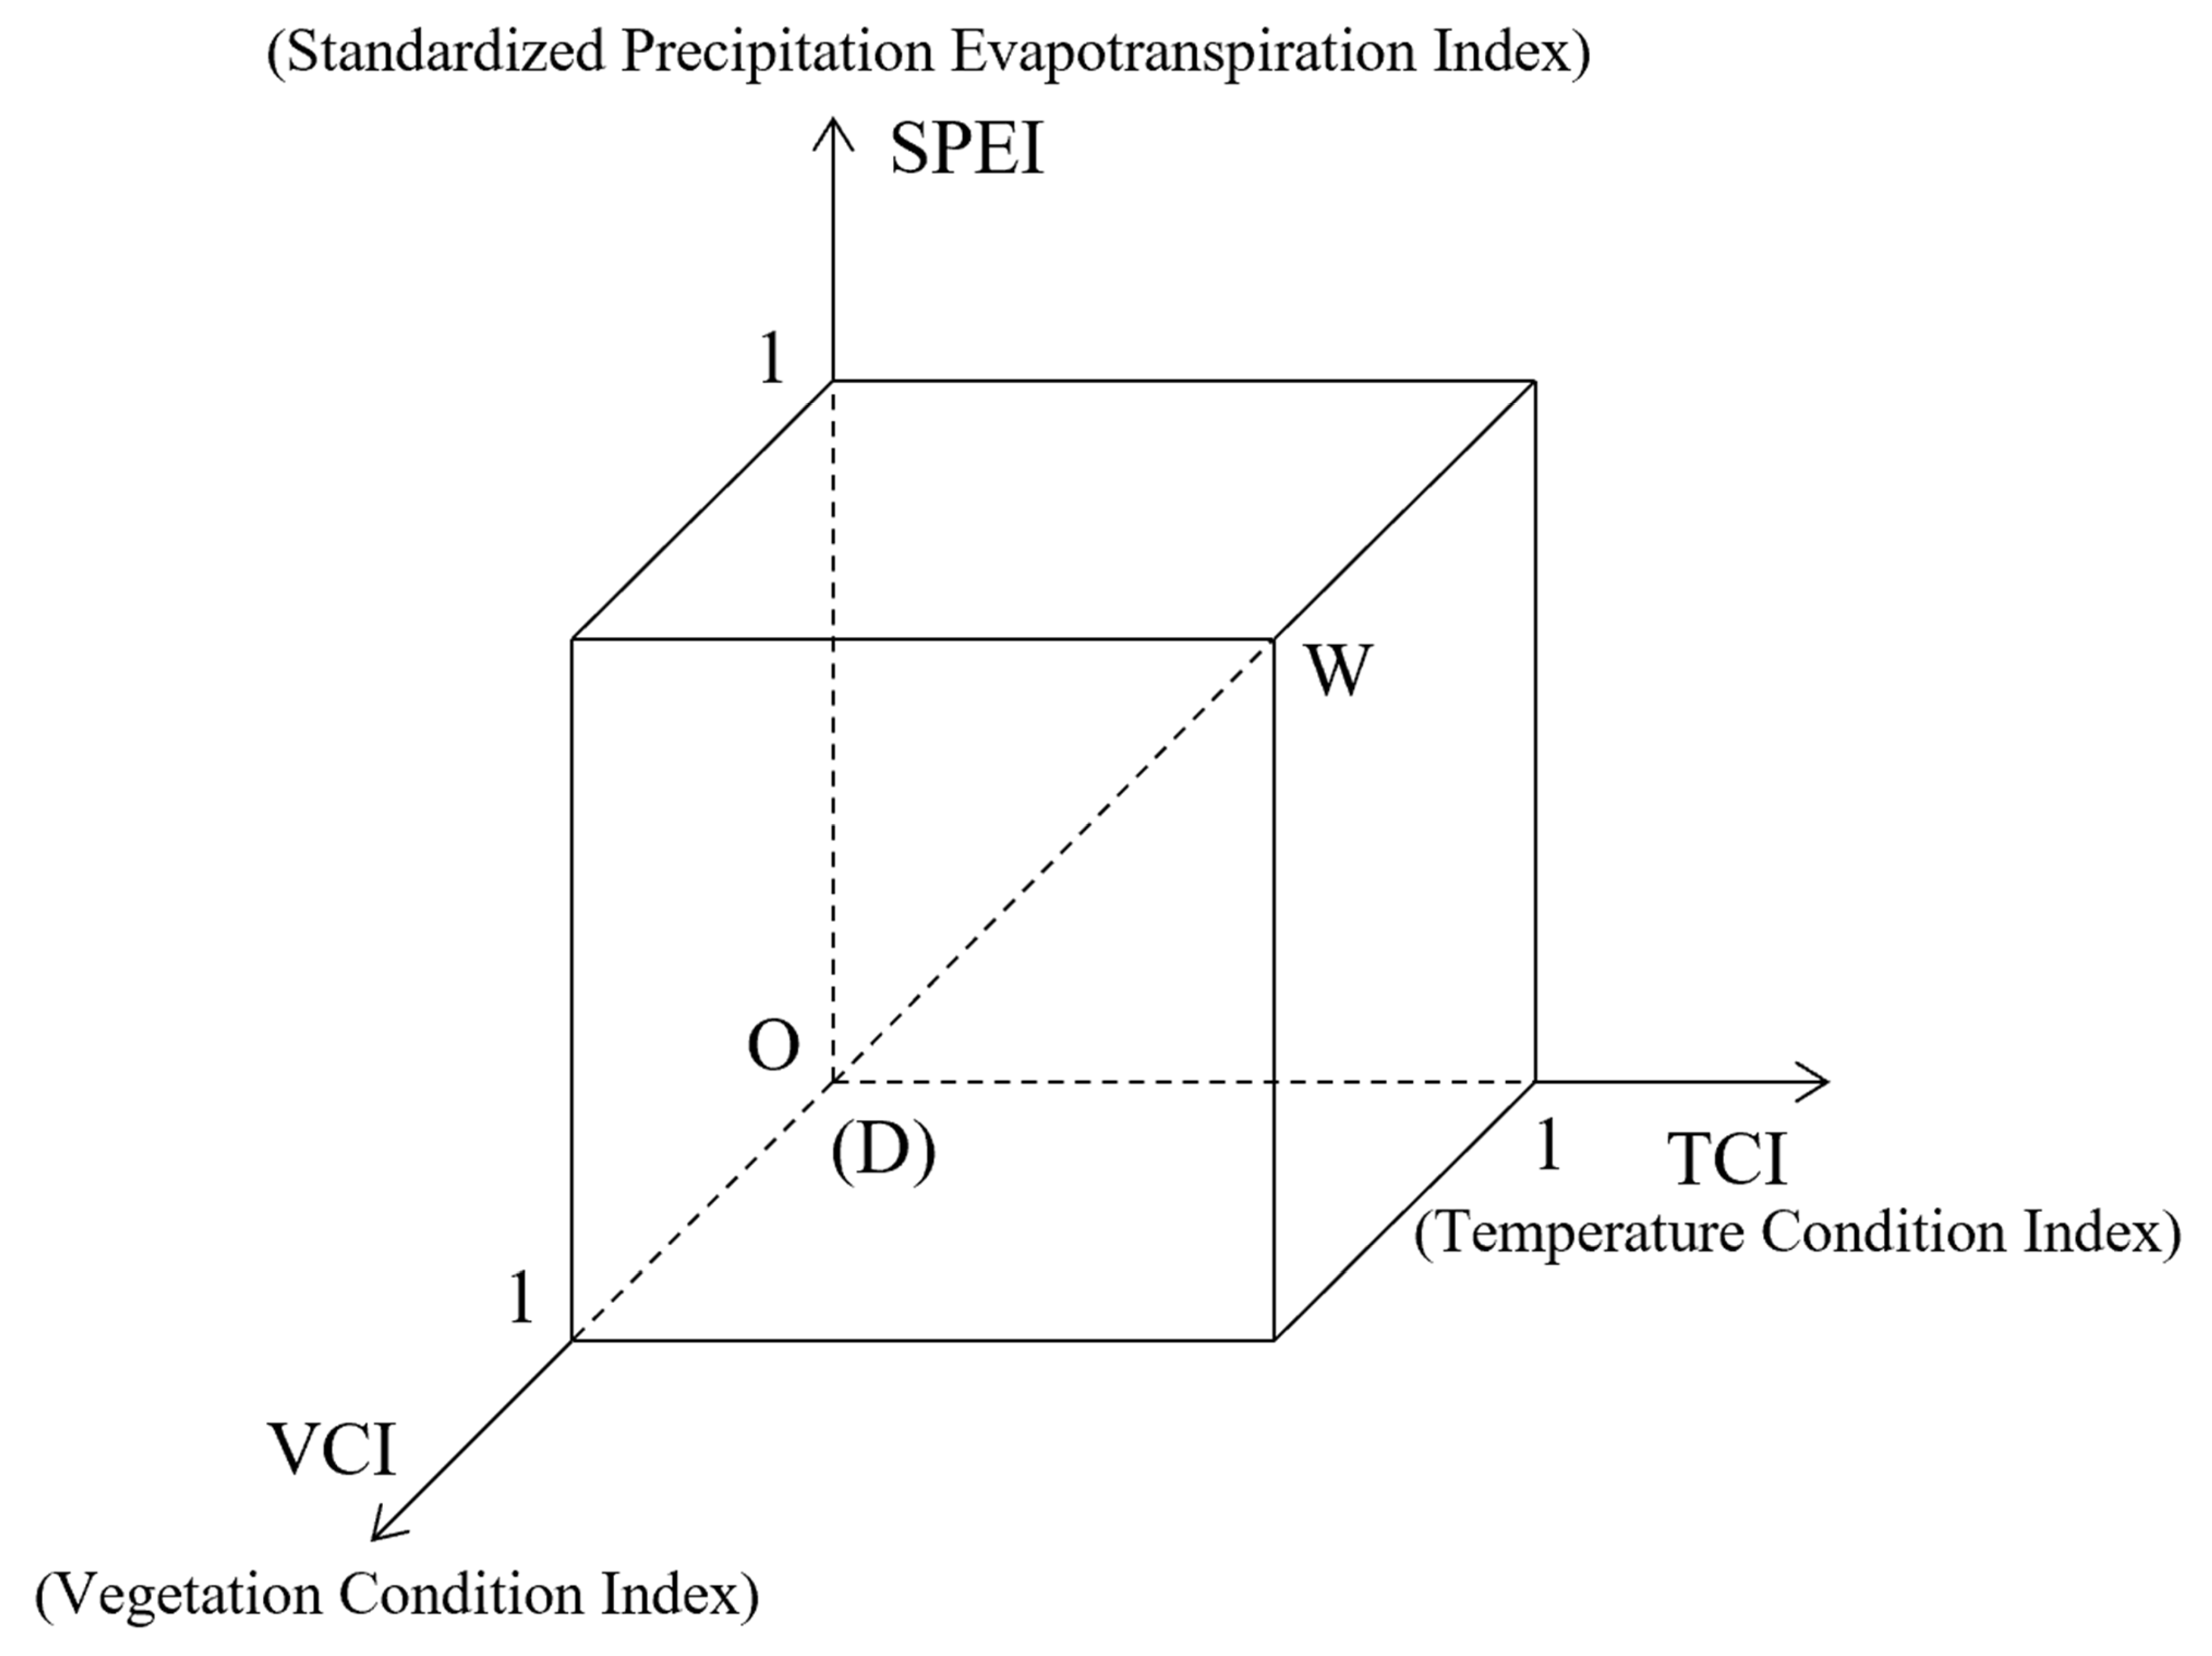
The modeling process of STVDI involves the following three steps. First, a three-dimensional Euclidean space is constructed using SPEI, TCI, and VCI as components, namely the SPEI-TCI-VCI space (Figure 2). Before constructing the space, SPEI values are normalized to a 0–1 range using min–max normalization based on their historical minimum and maximum over the study period, ensuring compatibility with TCI and VCI values. This normalization allows all three indices to contribute equally to the Euclidean distance calculation, representing the combined drought severity.
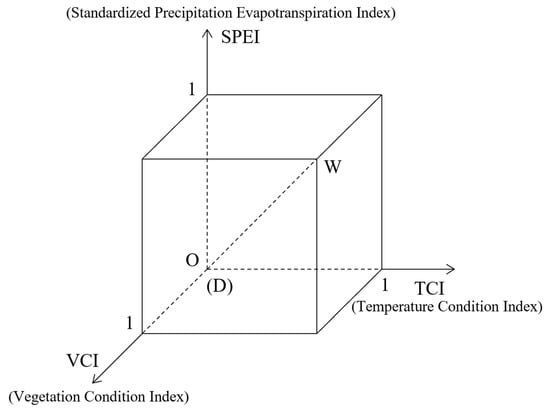
Figure 2.
STVDI modeling. The line DW represents the dry-wet gradient. Point D (0, 0, 0) corresponds to the driest condition, indicating the highest degree of drought (STVDI = 0); Point W (1, 1, 1) corresponds to the wettest condition, indicating the lowest degree of drought (STVDI = 1).
Figure 2.
STVDI modeling. The line DW represents the dry-wet gradient. Point D (0, 0, 0) corresponds to the driest condition, indicating the highest degree of drought (STVDI = 0); Point W (1, 1, 1) corresponds to the wettest condition, indicating the lowest degree of drought (STVDI = 1).
Second, every point in the space can be represented by its corresponding vector STVDI = (SPEI, TCI, VCI). The magnitude of the STVDI vector () was utilized as the quantitative value for the drought index. The STVDI was obtained through the following formula, where SPEI, TCI and VCI are all normalized values.
Finally, in conjunction with the national standards for drought grading (GB/T 32136-2015), the actual drought conditions in the study area, and the statistical data of pixel-based STVDI monitoring results, STVDI was divided into five levels (Table 2). To verify the rationality of the STVDI classification standard, this paper selected the severe drought year on the Mongolian Plateau in 2007 and conducted pixel-level cross-comparison analysis using the Global SPEI Database (version 2.08). The five levels of SPEI classified according to national standards (GB/T 20481-2017) [47] were combined with STVDI to construct a five-category confusion matrix. The verification results showed that STVDI and SPEI had good consistency, and the overall classification accuracy reached 78.6%.

Table 2.
Classification of the STVDI.
2.3.2. Spatial Correlation Coefficient
The spatial correlation analysis method within the Geographic Information System was employed to calculate the correlation coefficient (r), systematically analyzing and comparing the relationships between various drought indices and both precipitation and SM. The correlation coefficient r (usually referring to the Pearson correlation coefficient) is a statistic that measures the strength and direction of the linear relationship between two variables. The calculation formula is as follows:
and are, respectively, the ith observations of the two variables X and Y. and are, respectively, the averages of the variables X and Y. The value range of r is from −1 to 1, where r = 1 indicates perfect positive correlation; r = −1: Indicates a complete negative correlation; r = 0: Indicates no linear correlation.
2.3.3. Sen’s Slope Estimator
Sen’s slope estimator was used to represent the temporal variation trend of drought, which can effectively monitor the changing trend of the drought time series. Its calculation method is as follows:
and represents the time series data, j = 2021, i = 2000. A value of > 0 indicates an increasing trend in drought conditions, whereas < 0 suggests a decreasing trend.
2.3.4. Nash–Sutcliffe Efficiency Coefficient
Nash–Sutcliffe efficiency coefficient (NSE) is a model evaluation index employed to gauge the degree of fit between simulated values and observed values. NSE can effectively evaluate the degree of model fitting (STVDI fitting efficiency).
, , and , respectively, represent the observed values, simulated values, and the average of the observed values, and stands for the length of the time series. The closer the NSE is to 1, the higher the efficiency of fitting for the simulated values. NSE was employed to evaluate the degree of deviation between STVDI and the drought index utilized in modeling.
2.3.5. Coefficient of Variation
The coefficient of variation (CV) is commonly used to quantify the relative degree of dispersion of a variable by normalizing the standard deviation to the mean value. It provides a dimensionless measure that enables comparisons of variability among datasets with different units or magnitudes.
and are the mean and standard deviation of the STVDI. Generally, a smaller CV value indicates less fluctuation and greater temporal stability, vice versa. Specifically, when STVDICV < 0.3, the temporal variation in STVDI is considered low and stable; 0.3–0.5 suggests moderate variability, and values greater than 0.5 indicate high instability. This method quantitatively validates the stability of drought indices across time and regions.
2.3.6. Cross-Correlation Function
The Cross-Correlation Function (CCF) is a statistical measure utilized to quantify the correlation between two time series at various lag times. CCF computes the correlations between and under various lag time and determines the range of the optimal lag time by identifying the maximum correlation coefficient:
is the standard deviation, and represent the means of and , respectively. In this study, a positive lag > 0, indicates that STVDI responds after precipitation or soil moisture, while a negative lag < 0, suggests that STVDI leads these variables. A lag of zero implies that the two variables change in synchrony. To capture the short-term memory of precipitation and soil moisture on drought evolution, we applied a ±3-month lag window, which corresponds to the typical seasonal response time of soil moisture and vegetation growth in semi-arid ecosystems such as the Mongolian Plateau. For this study, x was STVDI and y represented precipitation or SM.
2.3.7. Hurst Index
Hurst index characterizes the behavioral properties of time series data via rescaled range analysis. The Hurst index was used to describe the future evolution trend of drought and its calculation process is relatively simple. The Hurst index values range from 0 to 1. When 0 < Hurst < 0.5, it indicates that the STVDI time series exhibits anti-persistent behavior, implying that its future behavior tends deviate from its past behavior. When Hurst = 0.5, it implies that the STVDI time series is random, signifying that its future trend is independent of its past behavior. When 0.5 < Hurst < 1, it suggests that the STVDI time series is consistent, with the future trend expected to align with its past behavior. The Hurst index, when integrated with Sen’s slope analysis, can effectively identify the potential direction and persistence of future drought trends.
3. Results
3.1. Evaluation of the STVDI
3.1.1. Spatiotemporal Consistency of the STVDI, SPEI, TCI and VCI
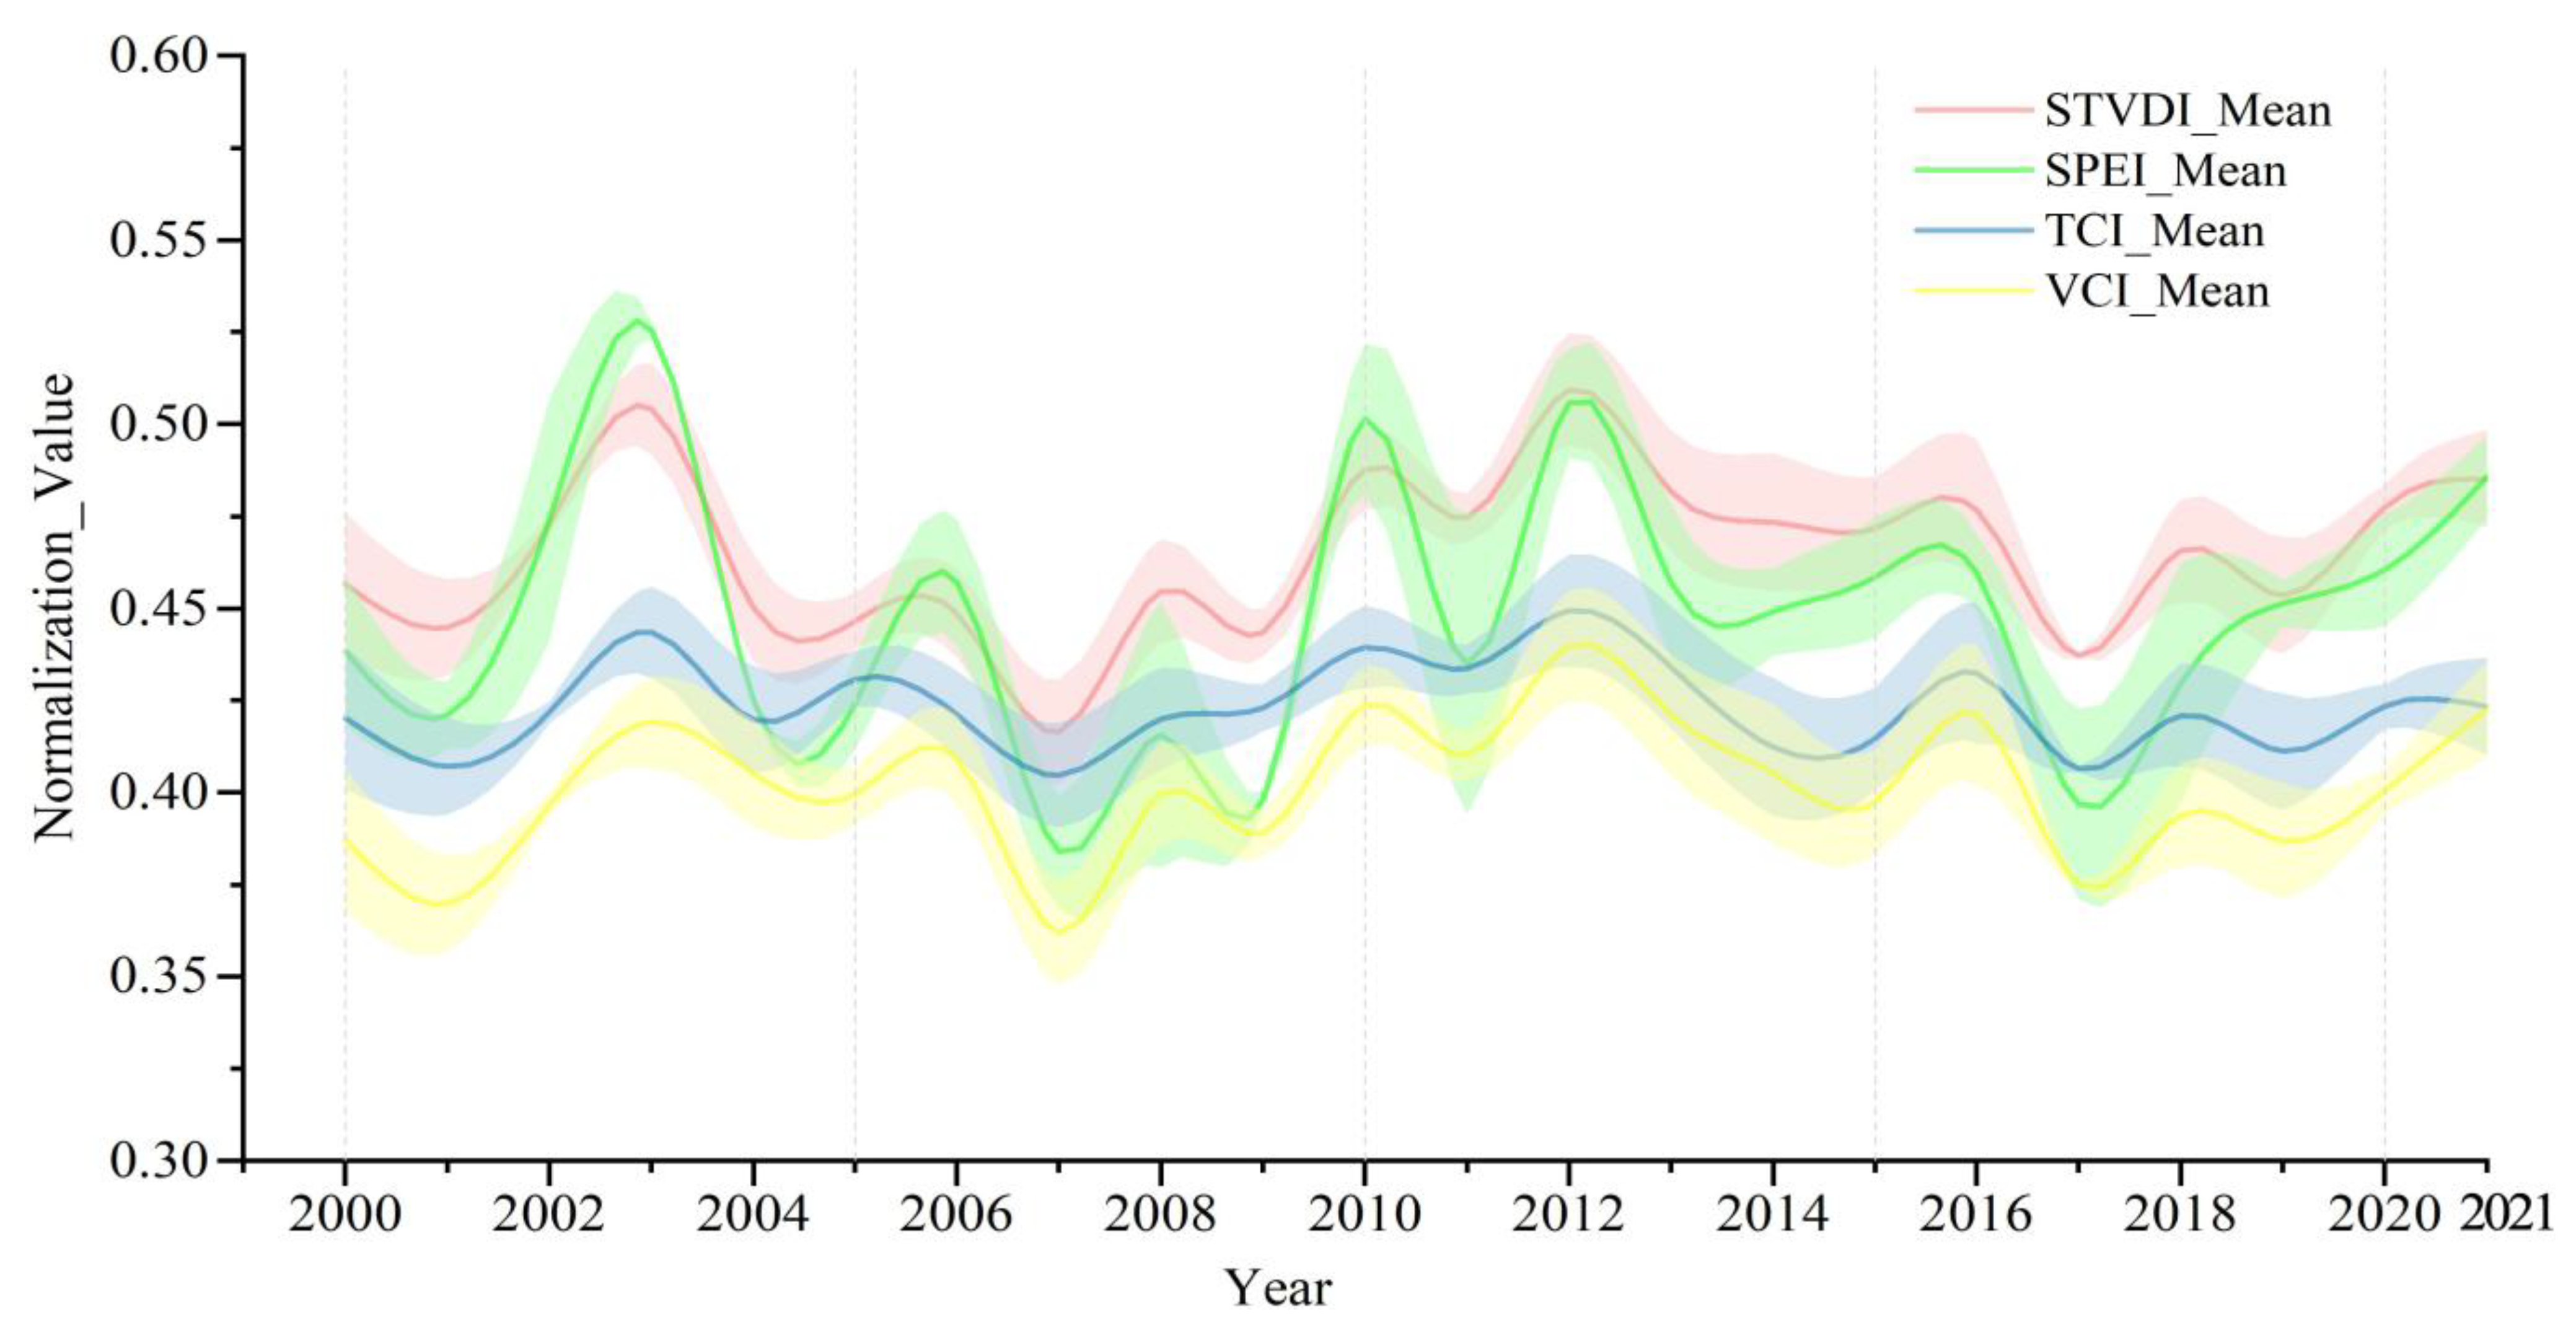
The STVDI was proposed based on the magnitude of the vector in the SPEI-TCI-VCI space. VHI is a widely recognized drought monitoring index used to evaluate the effectiveness of drought indices [48,49,50]. Spatiotemporal consistency of the STVDI and SPEI, TCI, VCI, and VHI plays a crucial role in determining the fitting performance of the STVDI modeling. STVDI exhibits a high correlation with SPEI, TCI, and VCI in the south-central and western regions of the MP, where drought events occur frequently (Figure 3). Notably, a high correlation was observed between STVDI and VHI (rmean = 0.88) across the MP. Figure 4 shows the temporal variations in the average values and its standard deviation (SD) of STVDI, SPEI, TCI, and VCI from 2000 to 2021. It is evident that the data exhibit strong temporal consistency over the 22-year period, demonstrating the same trends with only slight variations in the magnitudes of change. The average values are 0.46, 0.45, 0.42, and 0.4, respectively (mild drought).
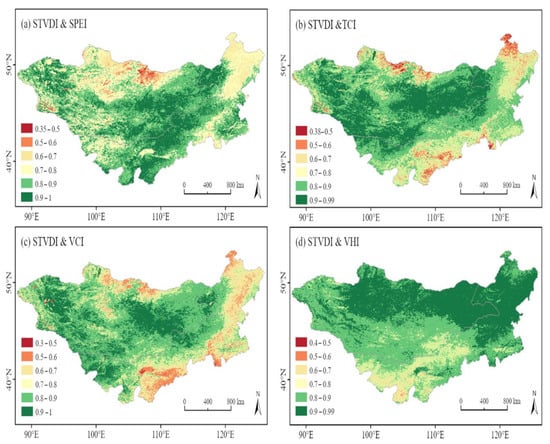
Figure 3.
Spatial correlation between STVDI and SPEI, TCI, VCI, and VHI.
Figure 3.
Spatial correlation between STVDI and SPEI, TCI, VCI, and VHI.
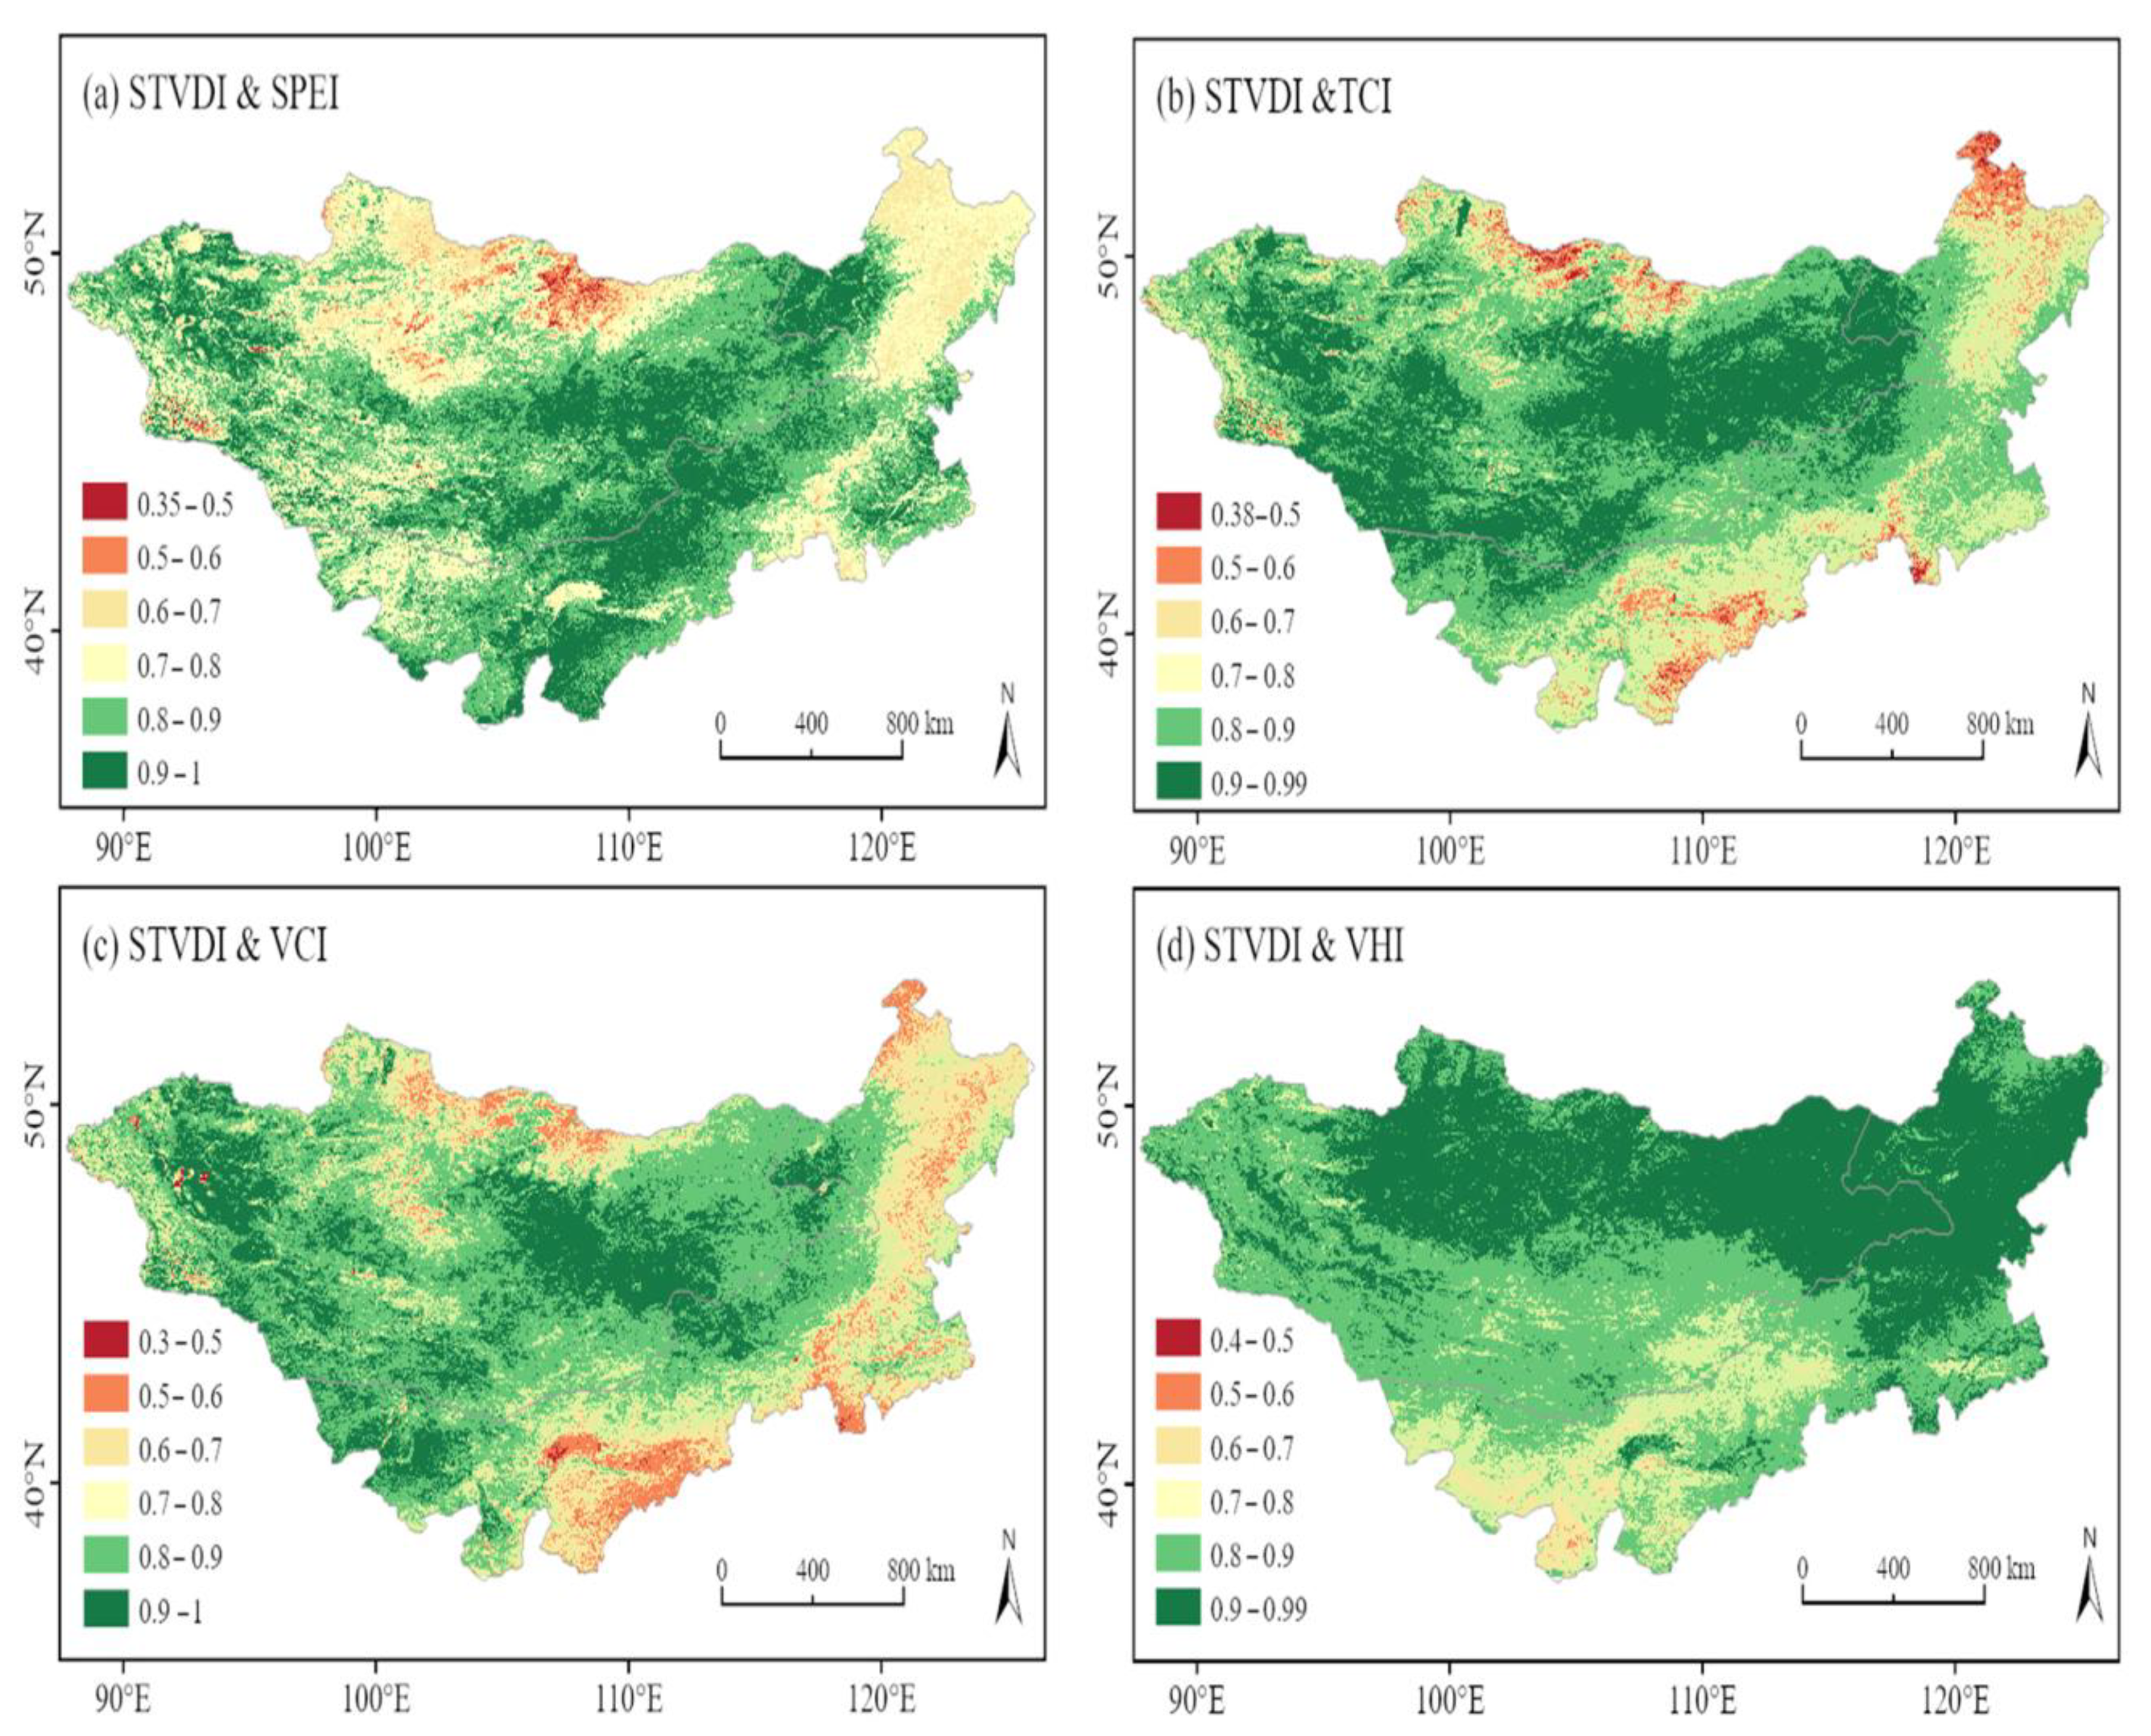
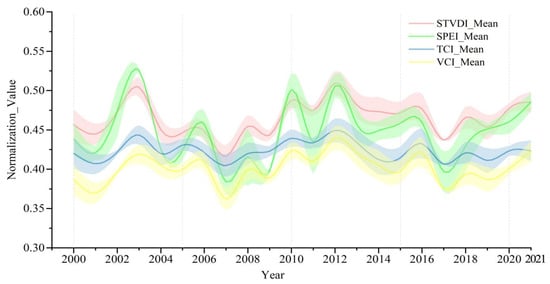
Figure 4.
Temporal variation trends of STVDI, SPEI, TCI, and VCI; the color band is within the range of standard deviation (SD range: 0–0.015).
Figure 4.
Temporal variation trends of STVDI, SPEI, TCI, and VCI; the color band is within the range of standard deviation (SD range: 0–0.015).
The consistency assessment was further substantiated by the evidence presented in Figure 7. With an increase in timescale, although the median value in the boxplot remains basically unchanged, the lower quartile progressively shifts upward. This indicates that the fitting performance of STVDI is remarkably effective (NSE > 0.66), with the consistency of the STVDI increasing with time. However, according to the correlation coefficient (CC), the median value exhibited a gradual decrease with time scale. Notably, both the median and the lower quartile of VCI exhibited a significant decline. This pattern reflects the spatial heterogeneity of drought responses across the MP: the south-central and western grassland regions show strong correlations because precipitation variability directly constrains soil moisture and vegetation activity, whereas the northeastern and southern areas—characterized by denser forest cover, wetter climatic conditions, and human disturbances such as irrigation—display weaker correlations between STVDI and VCI. These contextual factors explain the relatively low performance of STVDI in those regions (Figure 3c).
3.1.2. Relationships Between the STVDI, Pre, SM, SPEI, and VHI
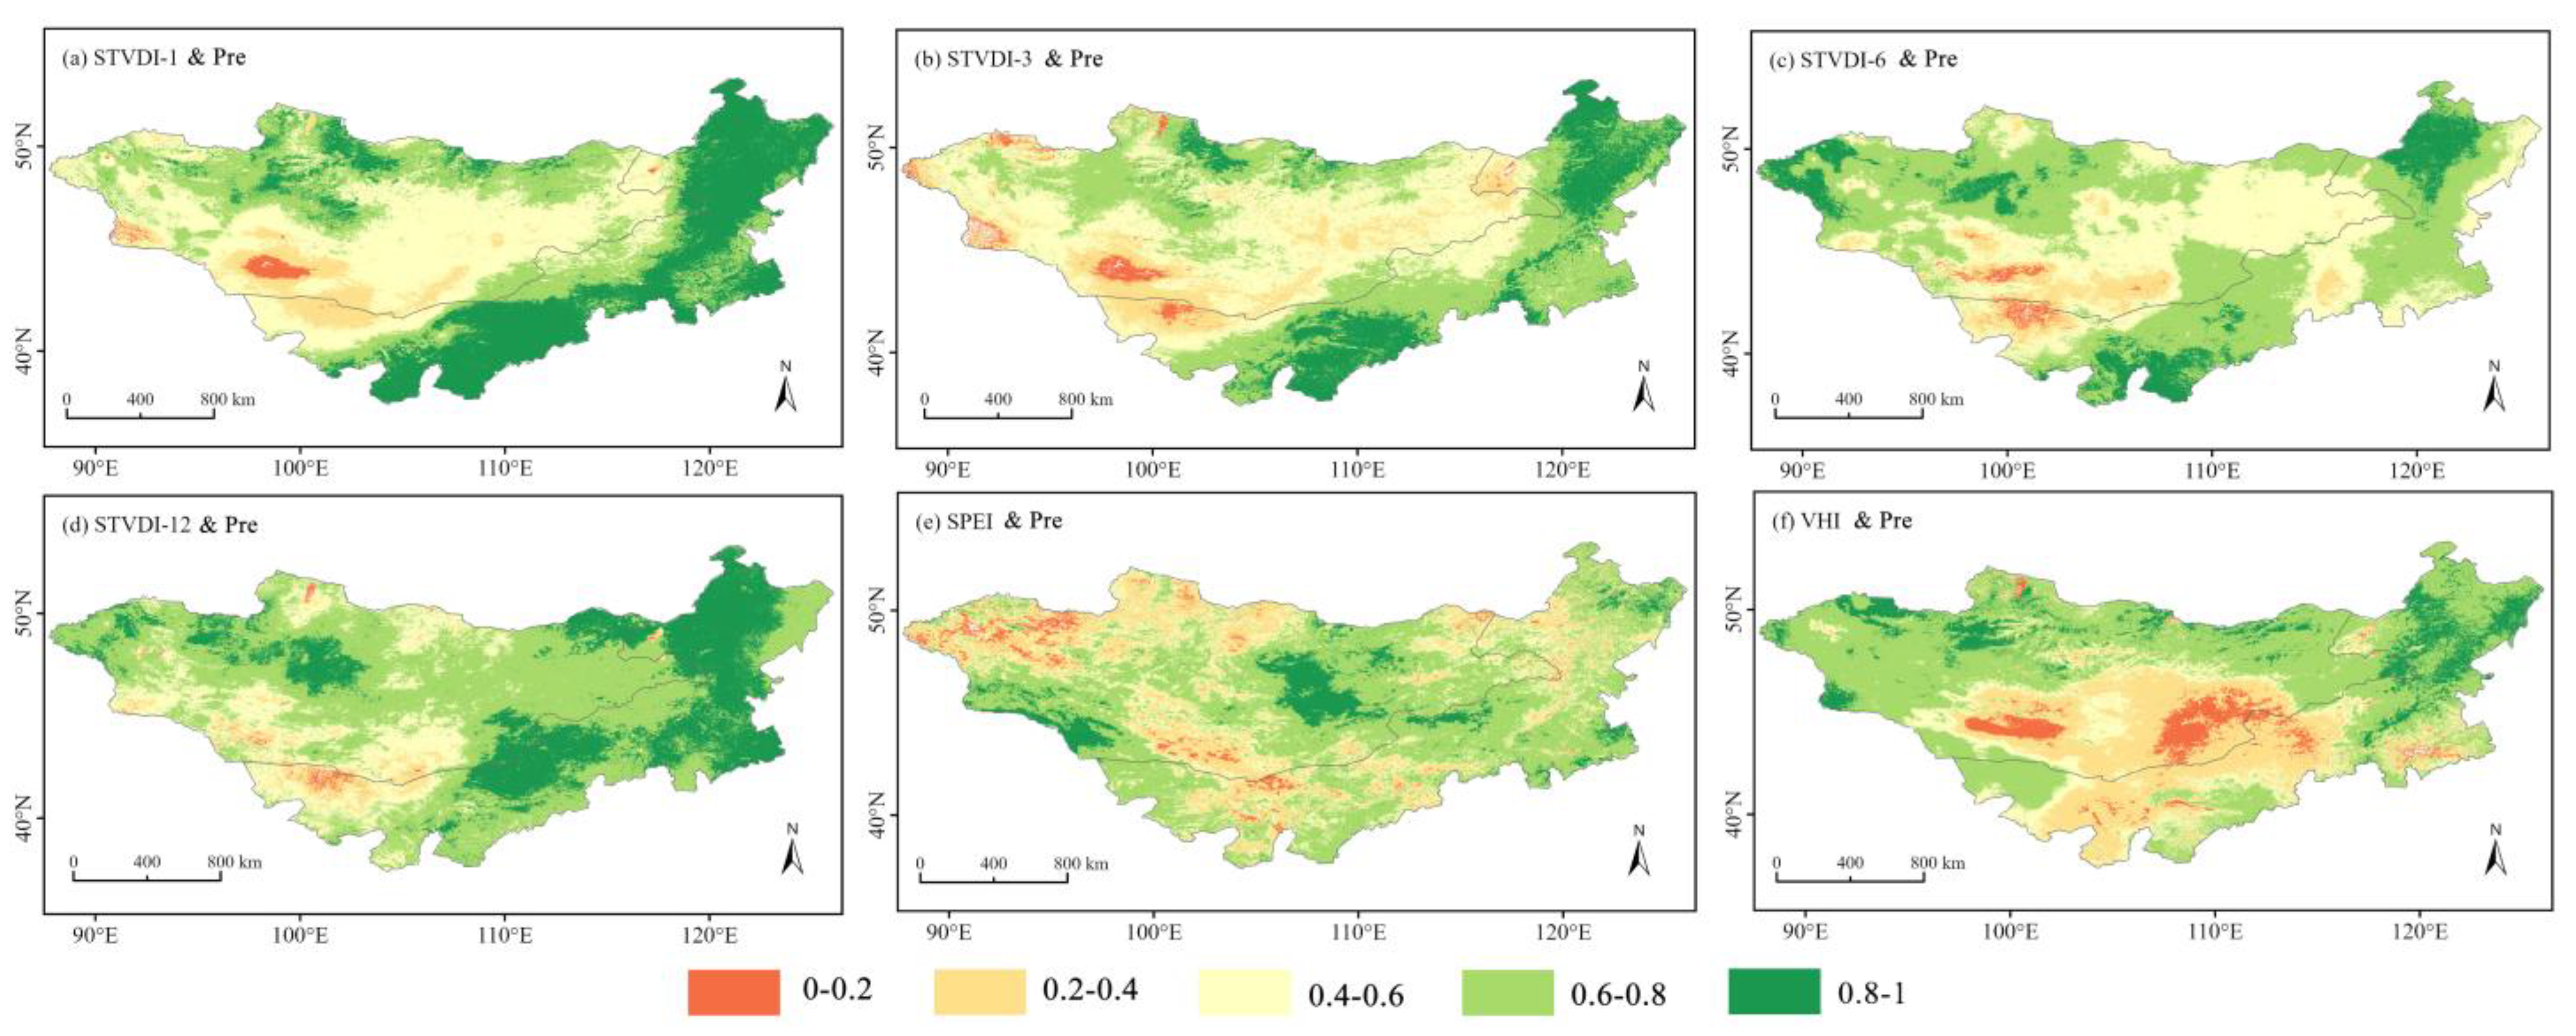
The decrease in precipitation over short term serves as the most direct factor contributing to meteorological drought. Figure 5a–d illustrates the spatial correlation distribution between STVDI at various time scales and precipitation, thereby validating the efficacy of STVDI in monitoring meteorological drought. STVDI has a relatively low correlation low in the southwestern part of the MP, while it is relatively high in other regions (r > 0.6). Notably, as the time scale of STVDI increases, the overall correlation gradually increased with the timescale of the STDVI. This abnormal phenomenon may result from the lag effect of STVDI with Pre and SM. However, the overall correlation of SPEI was high but relatively poor in the north–south trending zonal area in the west. Conversely, the VHI has a very poor correlation in the central and southern parts since it does not consider the precipitation factor.
Figure 5.
Spatial correlation between STVDI-1, 3, 6, 12, SPEI, VHI, and Pre.
Figure 5.
Spatial correlation between STVDI-1, 3, 6, 12, SPEI, VHI, and Pre.
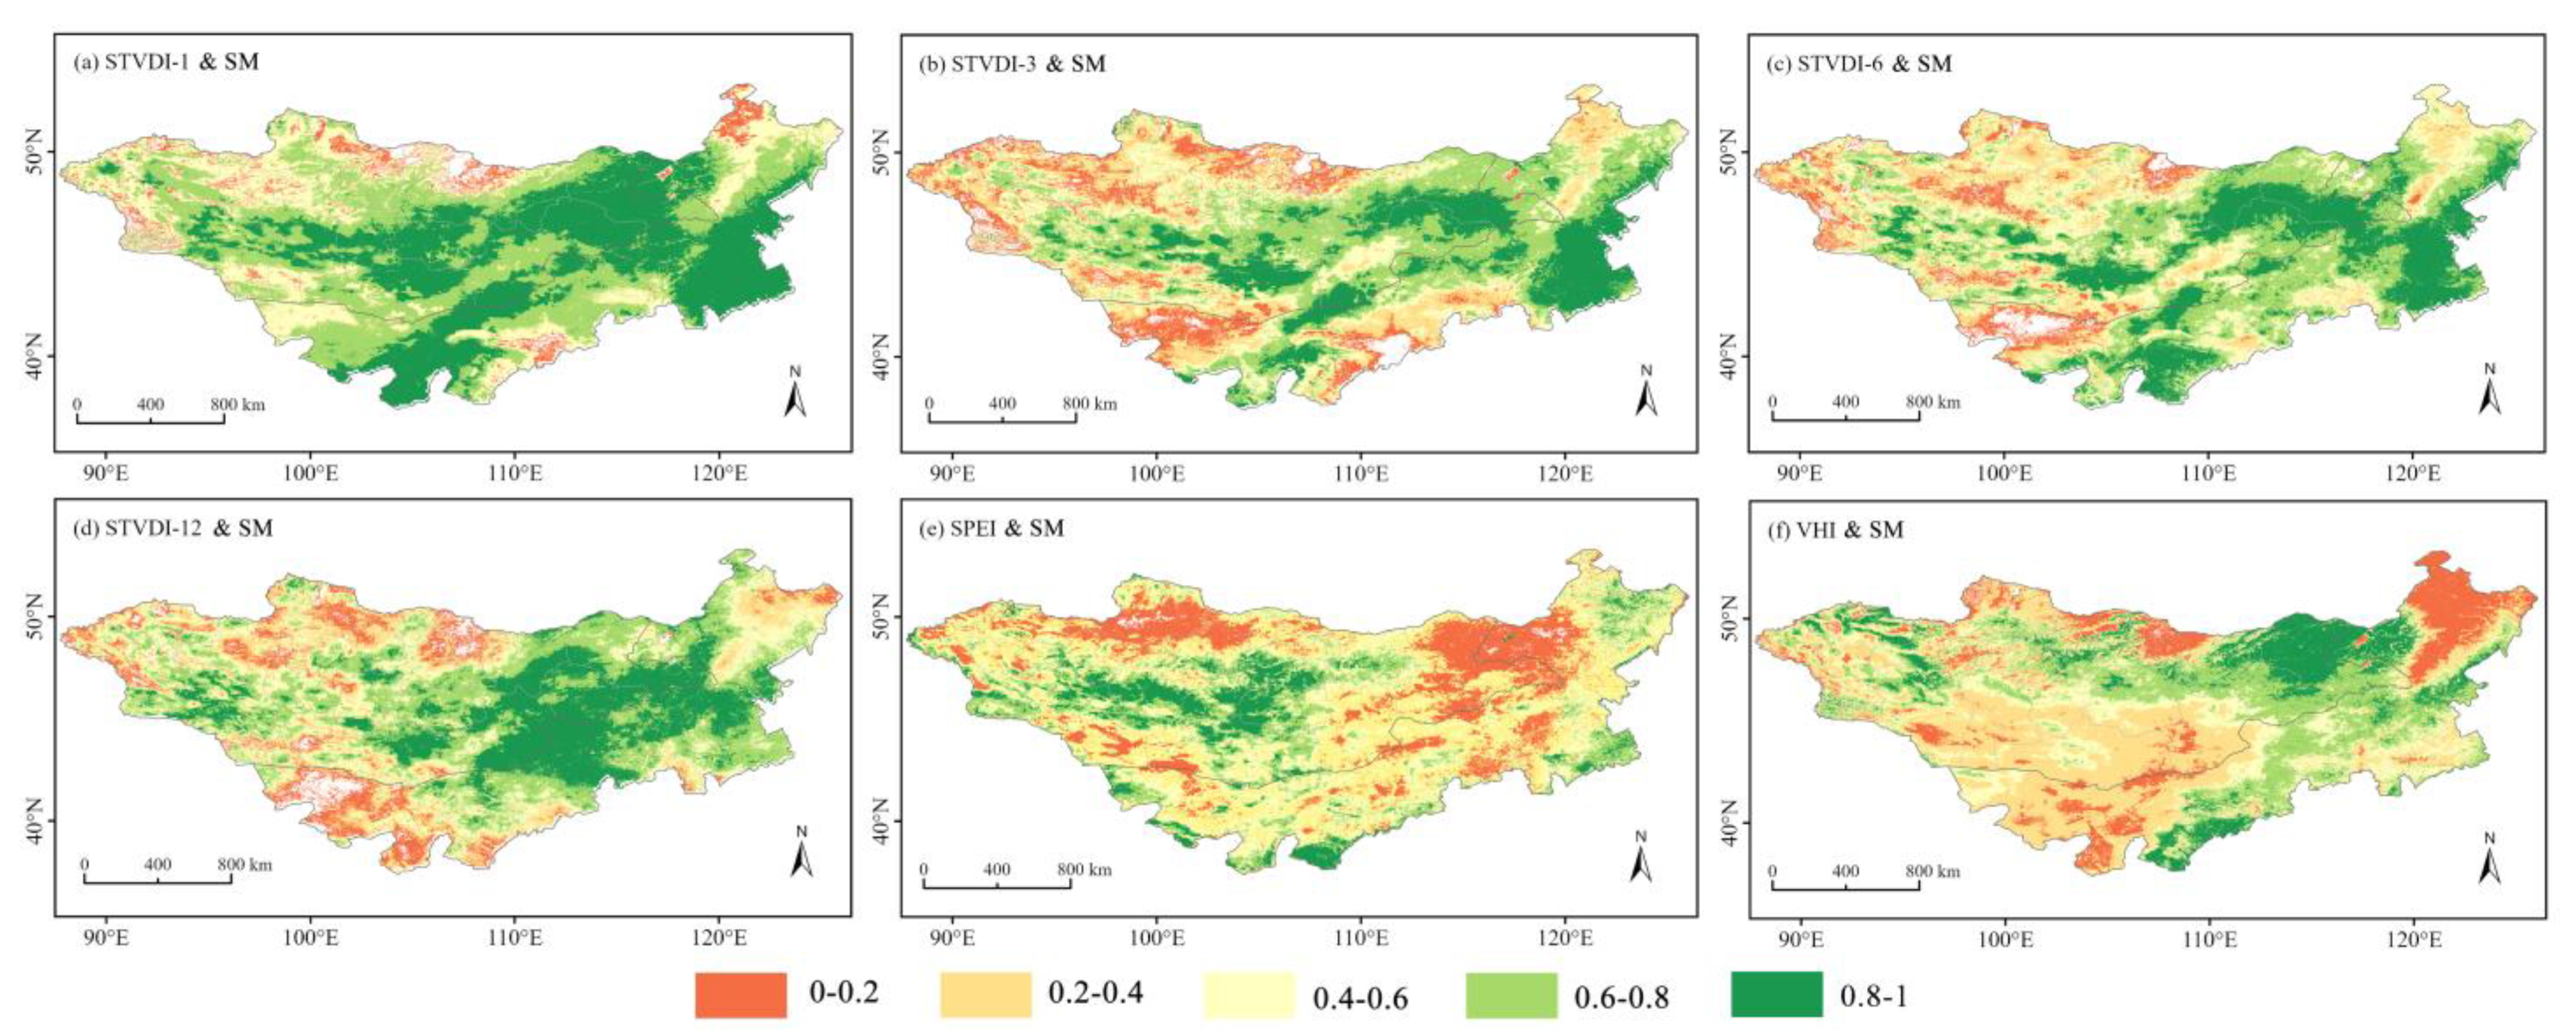
SM is the core variable in agricultural drought monitoring. Figure 6 presents the spatial correlations of STVDI, SPEI, and VHI with SM to validate the effectiveness of STVDI in agricultural drought monitoring. The correlation between STVDI and SM was relatively low in the southwest and northeast of the MP. The overall correlation of STVDI-12 was the highest and significantly superior to that of other scales. SPEI was more inclined towards precipitation and evapotranspiration, yielding a generally poor correlation with SM. In contrast, the correlation of VHI was significantly higher. Compared with SPEI and VHI, STVDI demonstrated better correlation with Pre and SM.
Figure 6.
Spatial correlation between STVDI-1, 3, 6, 12, SPEI, VHI, and SM.
Figure 6.
Spatial correlation between STVDI-1, 3, 6, 12, SPEI, VHI, and SM.
3.1.3. Comparison Between the STVDI Across Different Time Scales
The consistency assessment at different timescales is shown in Figure 7. The integration of NSE and CC is frequently employed to assess the goodness of fit for model simulation outcomes. With an increase in timescale, although the median value of CC (0.85) and NSE (0.81) in the boxplot remains basically unchanged, the lower quartile progressively shifted upward progressively. Especially, both the upper and lower quartiles of the NSE for STVDI-12 were minimal, while the median and mean values remained relatively high. This suggests that STVDI-12 exhibits the optimal fitting performance with the highest stability. Nevertheless, the spatial correlation of STVDI is inversely related to the time scale, with a particularly notable decrease in correlation with the VCI. This could serve as compelling evidence that STVDI-12 demonstrates greater sensitivity to precipitation and the cumulative lag effect of SM.

Figure 7.
Boxplots of the CC and NSE of STVDI and three drought indices (SPEI, TCI, and VCI) at different monthly scales (1, 3, 6, and 12 months). The middle line within each box indicates the median, white dots are averages, the upper and the lower edges mark the 25th and 75th percentiles, and the whiskers show the 2.5th and 97.5th percentiles.

To further verify the significance and stability of STVDI in drought monitoring, the spatial distribution of Sen’s slope and CV of STVDI were estimated (Figure 8). The STVDI exhibited highly consistent spatial distributions of drought trends at all four times (all passed the significance test with p < 0.05). The value of Sen’s slope (>0) implies an alleviation of drought conditions; conversely, Sen’s slope (<0) signifies an aggravation of the drought. The greater the absolute value of Sen’s slope, the more distinct the trend of change becomes. No significant trend was observed in drought changes across most regions. However, the intensity of drought has increased markedly in the central, southern, and western areas, whereas drought conditions have slightly improved only in the eastern region. The CV gradually decreased with time (a smaller CV indicates a more stable STVDI); it remained ~10% in the southwest (arid region). This suggests that the stability of STVDI for drought monitoring improves with time, particularly in the northern and southeastern regions of the MP.
The optimal lag time (±3 months) was determined by calculating the maximum spatial correlation (Table 3). Figure 9 illustrates the lag response times of the STVDI with respect to precipitation (panels a-d) and SM (panels e–h). Overall, the STVDI exhibited no lag in its response to precipitation and SM across most regions of the MP. More than 97% of the regions exhibited a timely response to precipitation changes based on the STVDI and the proportion of areas without lag gradually decreased with time. STDVI indicated that the Lag Days (Pre) of the STVDI-1 (−1) indicated that precipitation changes one day after the occurrence of drought. The Lag Days (SM) of the STVDI-12 (−7.6) suggested that SM changes 7.6 days after the drought signal detected by the STVDI. All other positive values indicated that the STVDI exhibits a delayed response to precipitation and SM, yet the lag duration remains relatively short and falls within an acceptable range. The CCs between the STVDI and both Pre and SM gradually increased with time. Conversely, the CV decreased with time, while stability of the STVDI improved gradually. The NSEPre of STVDI-1and NSESM of STVDI-12 were relatively the highest, indicating the best fitting performance. To ensure robustness, statistical significance of the lag correlations was assessed using a Student’s t-test, and most of the correlations were significant at the 95% confidence level (p < 0.05).

Table 3.
CC, CV, NSE, Root Mean Square Error (RMSE), and lag days of different drought indices.
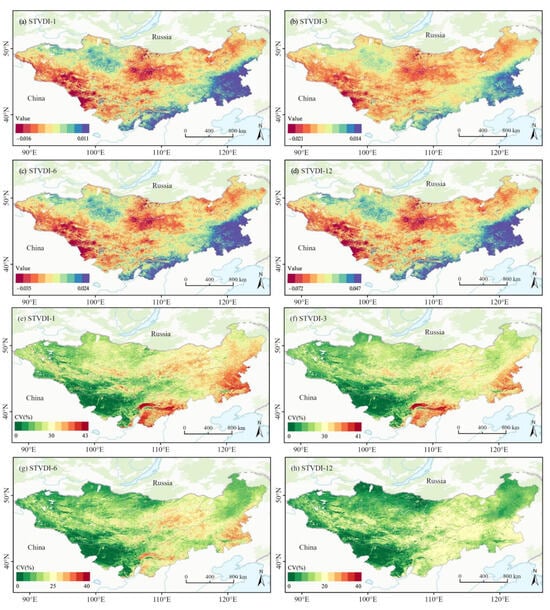
Figure 8.
Spatial distribution of the Sen’s slope trend and coefficient of variation.
Figure 8.
Spatial distribution of the Sen’s slope trend and coefficient of variation.
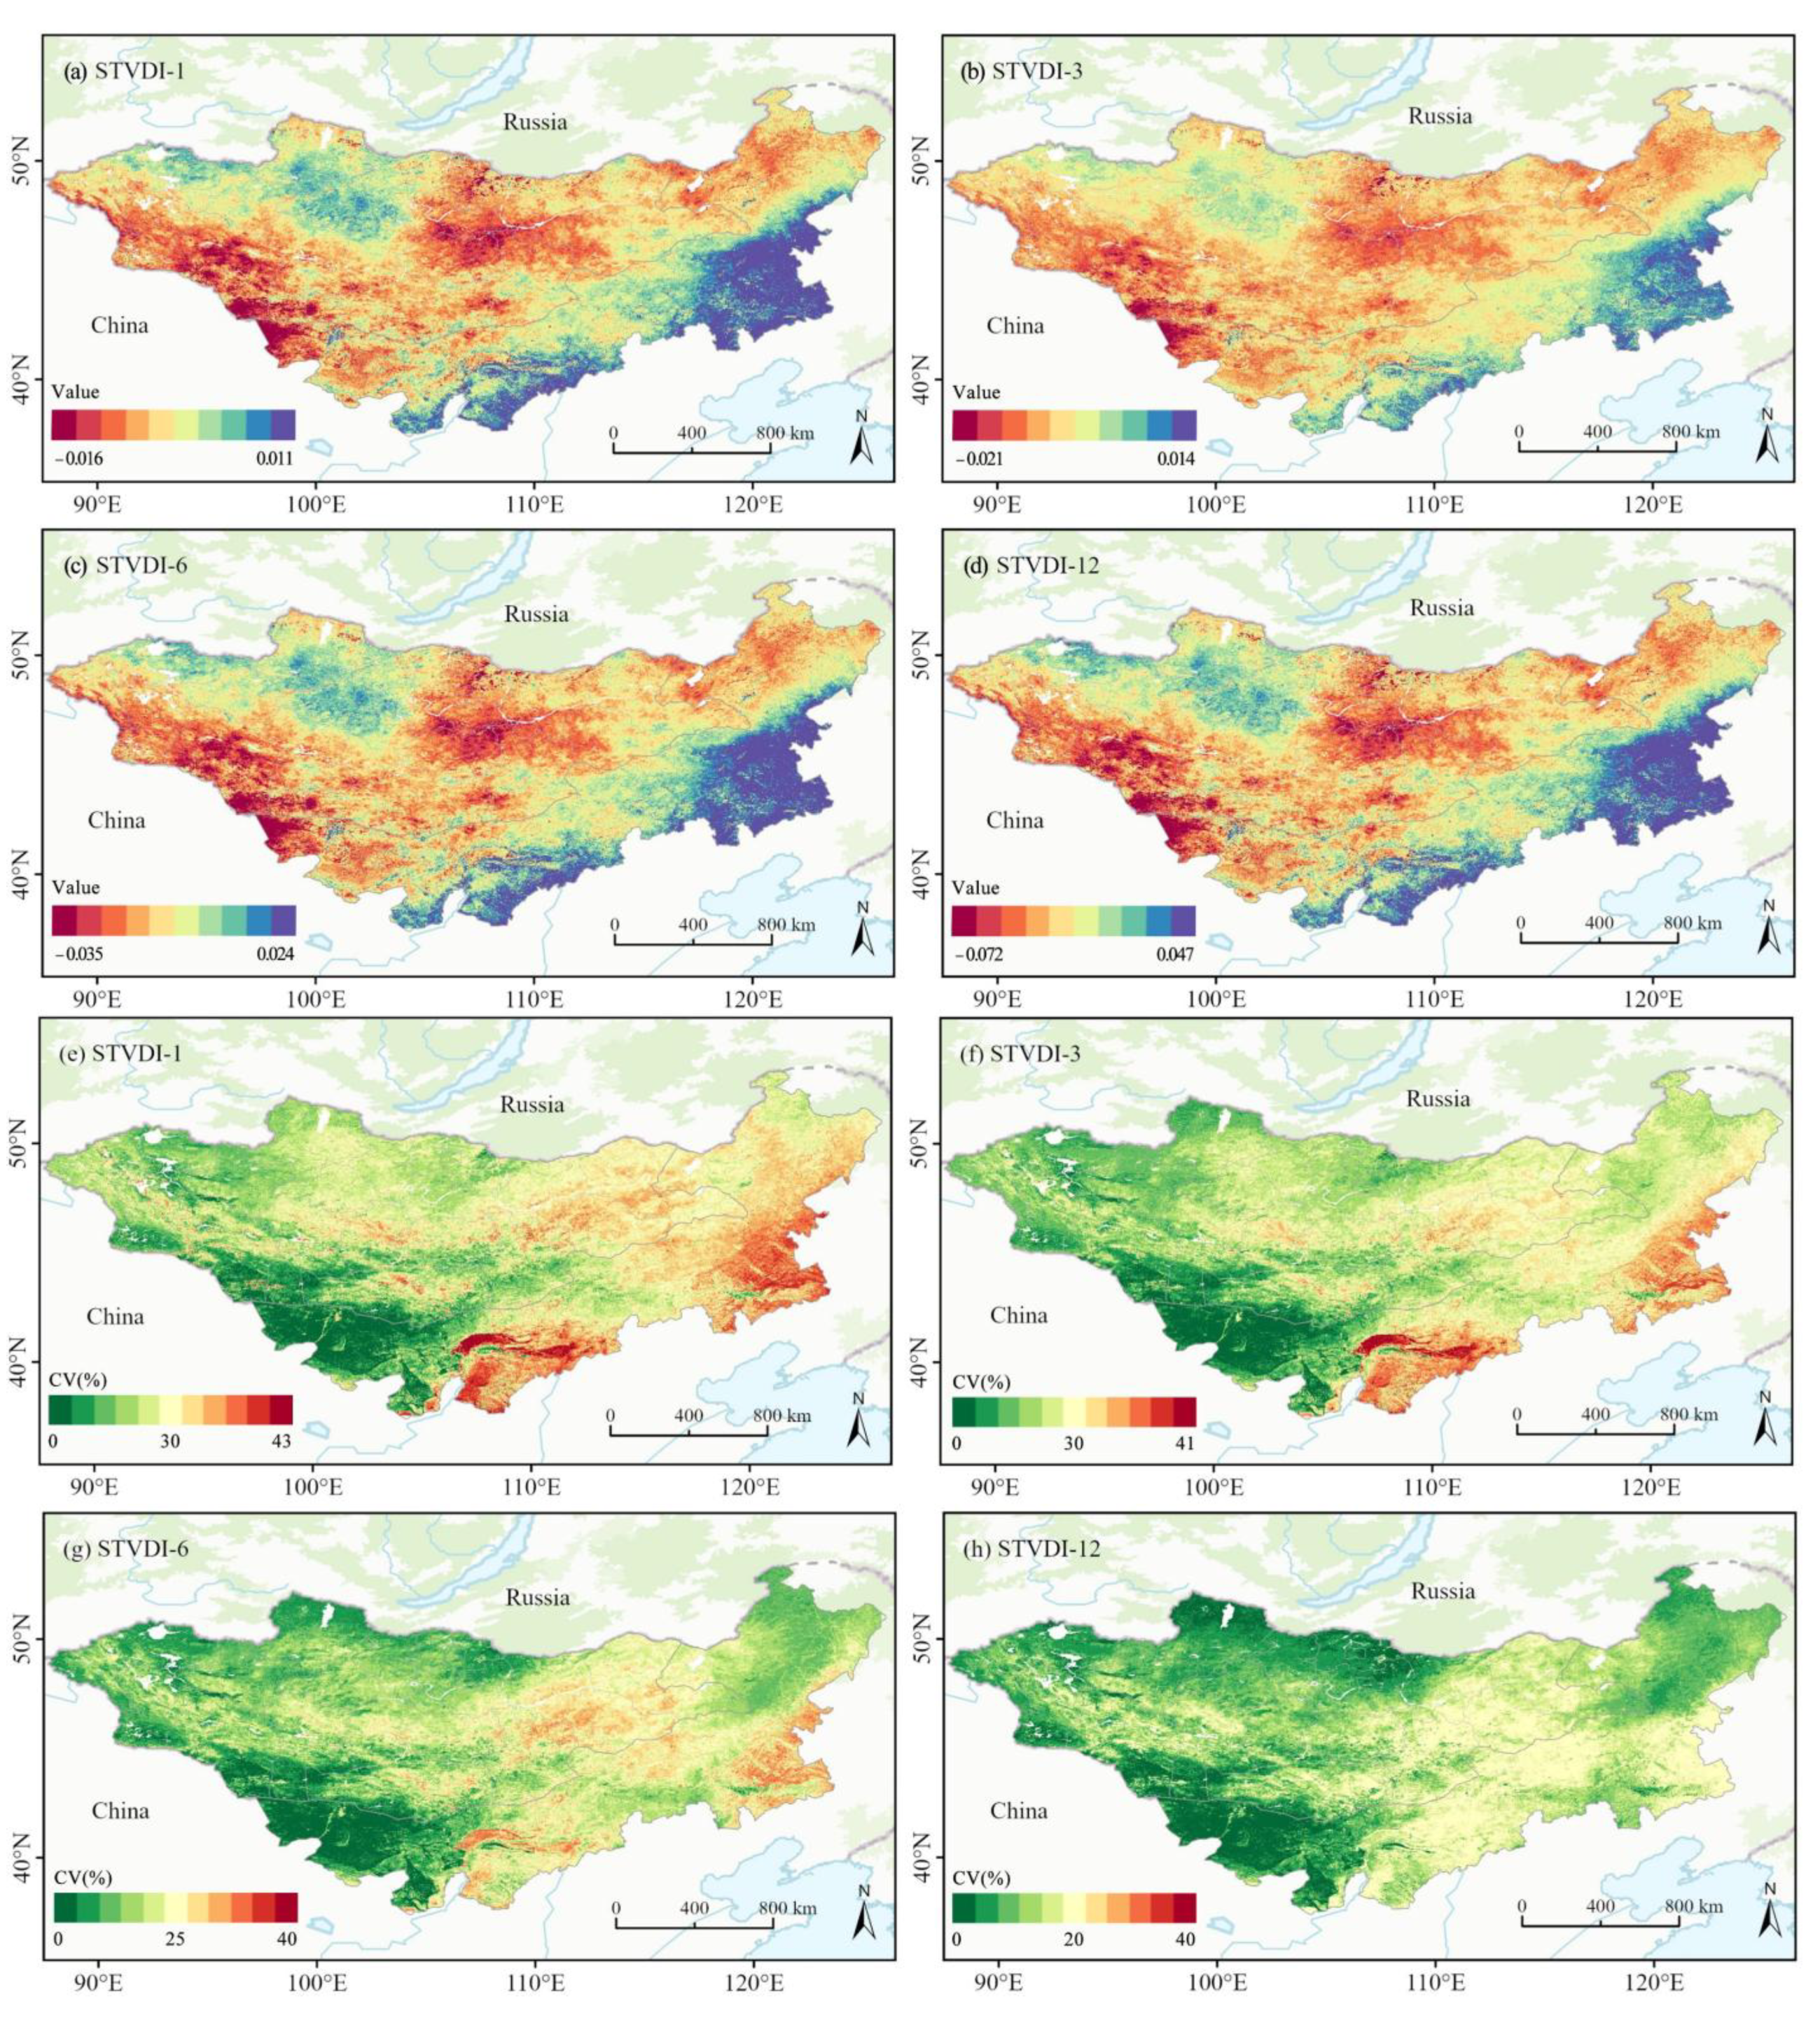
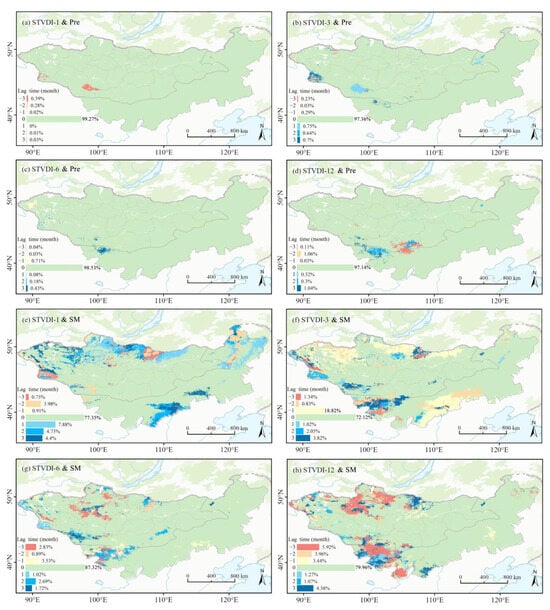
Figure 9.
Spatial distribution of drought lag response (±3 months) between STVDI and Pre (a–d), SM (e–h). The lag days are calculated on the basis of a 30-day month.
Figure 9.
Spatial distribution of drought lag response (±3 months) between STVDI and Pre (a–d), SM (e–h). The lag days are calculated on the basis of a 30-day month.
3.2. Spatiotemporal Distribution and Change Trend of Drought
3.2.1. Drought Monitoring Based on Monthly STVDI
Figure 10a shows how the monthly mean STVDI values in the MP changed over time between 2000 and 2021. The STVDI values range from 0.4 to 0.55, with no drought in January, November, and December, and mild drought in other months. Figure 10b offers a comprehensive overview of the drought conditions that have been observed over the past 264 months. More than 70% of the months are characterized by drought conditions, predominantly occurring in typical drought years, such as 2000, 2001, 2005, 2007, 2017, and 2020. Spring droughts are prevalent in the MP, while summer droughts have intensified over the past two decades due to the synergistic interaction between heatwaves and drought events.
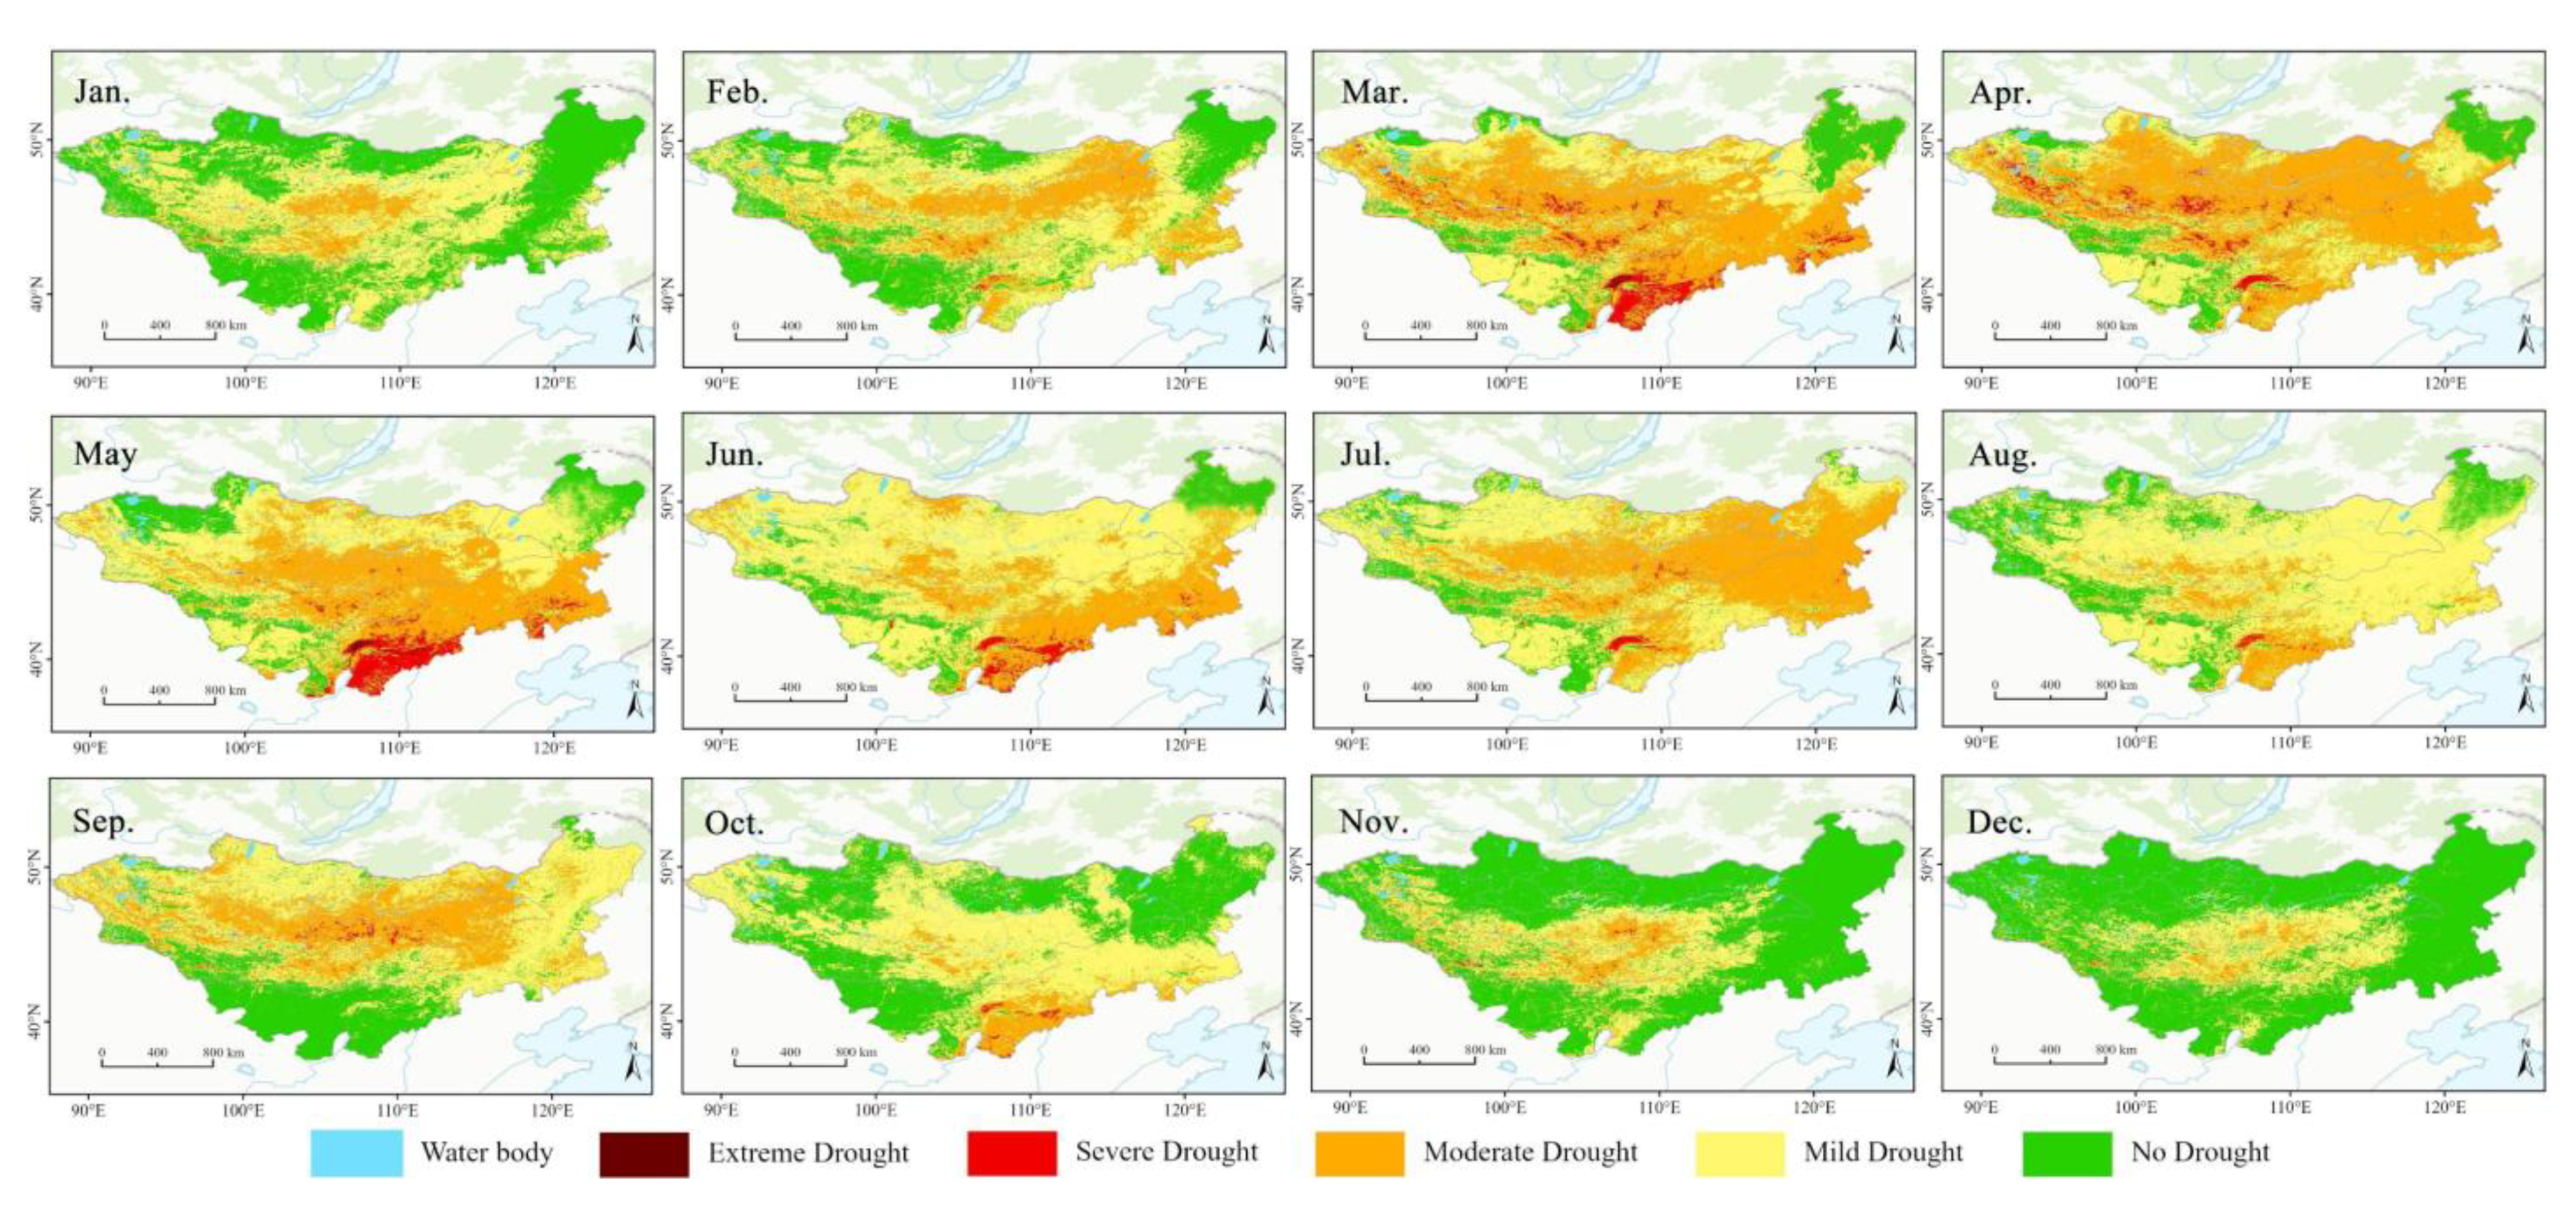
The areas affected by different drought levels exhibit monthly variations (Table 4). The areas of Extreme Drought and Severe Drought in May and March were substantially larger compared to other months. Specifically, the extent of Extreme Drought was the largest and most severe in May, whereas the area of Severe Drought peaked in March. Moderate Drought was most severe in April, with its area accounting for ~60%. Approximately 60% and 70% of the Mild Drought occurred in June and August, respectively. In contrast, No Drought predominantly covered the majority of the area during winter (November, December, and January).

Table 4.
Area and proportion of different drought levels during 2000–2021.
The spatial pattern exhibited by drought levels within the study region, spanning the 22-year mean from January to December, is elucidated in Figure 11. In the central and southern regions of the MP, drought persisted throughout all 12 months, with varying severity and spatial extent across different months. From November to February of the following year, these regions were predominantly characterized by mild and moderate drought conditions, while the area classified as no-drought gradually diminished. In March, extreme and severe droughts emerged, leading to an explosive increase in the affected area. The situation improved slightly in April. However, in May, the drought intensified once again, particularly in the southern region of the MP, where it reached its peak severity. The northward movement of warm and humid air currents from the Pacific and Indian Oceans during summer bring precipitation that alleviates the overall drought conditions. However, high summer temperatures lead to intensified evapotranspiration, resulting in an increased proportion of areas affected by mild and moderate drought. In September and October, with the decrease in temperature, the overall drought conditions alleviated, and the area classified as no-drought increased substantially.

Figure 10.
Monthly variation in STVDI values. (a) Monthly mean STVDI values during 2000–2021 and (b) monthly STVDI values in 264 months.
Figure 10.
Monthly variation in STVDI values. (a) Monthly mean STVDI values during 2000–2021 and (b) monthly STVDI values in 264 months.

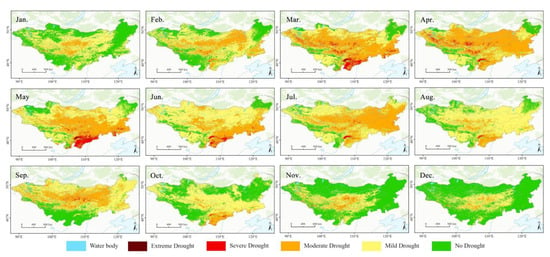
Figure 11.
Spatial distribution of drought levels from January to December with STVDI-1.
Figure 11.
Spatial distribution of drought levels from January to December with STVDI-1.
3.2.2. Drought Monitoring Based on Annually STVDI
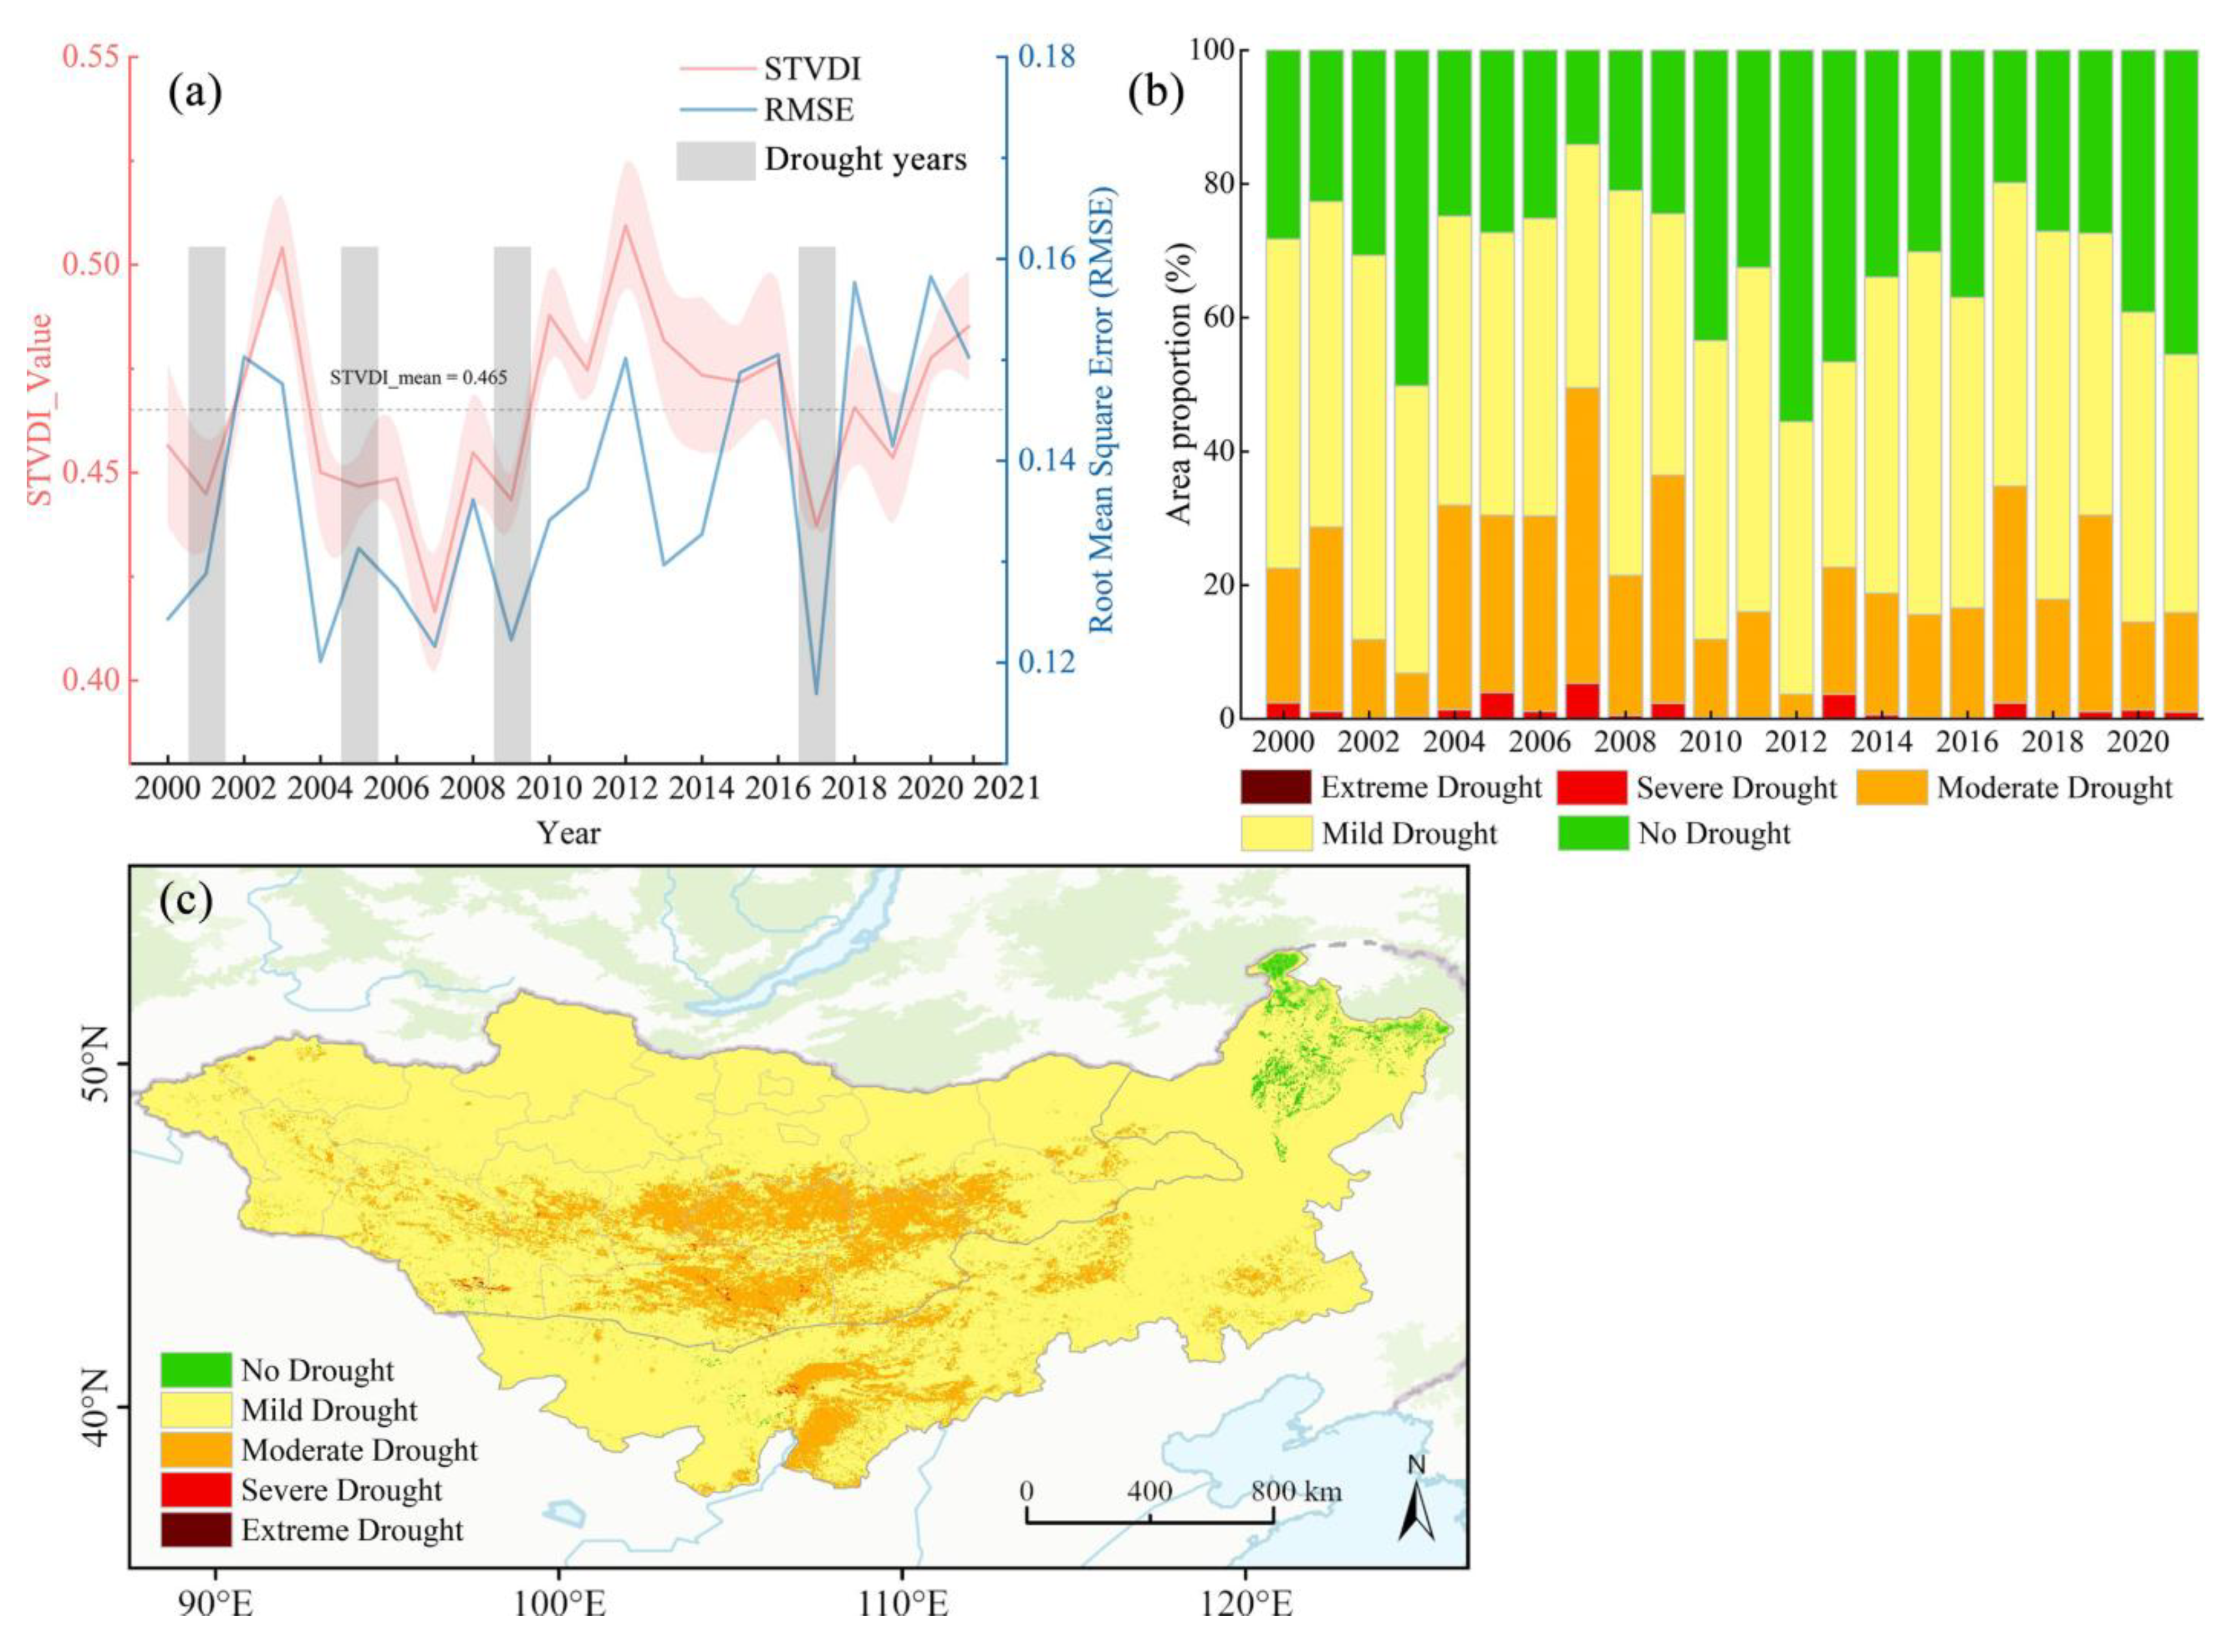
The inter-annual changes in the STVDI with SD and Root Mean Square Error (RMSE) is shown in Figure 12a. During 2000–2021, the STVDI values range from 0.41 to 0.51, with an average of 0.465, with no apparent periodicity. The RMSE values were all below 0.15; as the STVDI value decreases (indicating more severe drought conditions), the RMSE also decreases. This suggests that during years with more intense droughts, the STVDI demonstrates greater stability. The severe drought events primarily occurred in 2003, 2005, 2007, and 2017 [35], and the STVDI effectively captures the occurrence of these events. Furthermore, the independent validation of the monthly ERA5-Land soil moisture and STVDI revealed an average linear correlation coefficient (r2) of 0.83 between two variables during 2007 and 2017. Figure 12b depicts the area proportion of different drought levels from 2000 to 2021. All years were predominantly characterized by mild drought and no drought conditions (accounting for >50% of the total area). However, the years 2000, 2005, 2007, 2013, 2015, 2019, 2020, and 2021 experienced all drought categories, with extreme drought affecting only 0.01–0.05% of the total area. In 2007, >50% of the regions were impacted by moderate and severe drought, whereas only 14% remained unaffected. Conversely, only in 2003 and 2012 did >50% of the regions experience no drought, which might be attributed to the fact that both years were preceded by relatively severe drought events. As demonstrated in Figure 12c, the spatial distribution of the 22-year average STVDI is illustrated. A total of 83.7% of the MP is characterized by mild drought, with 14.2% of the central and southern land experiencing moderate drought.
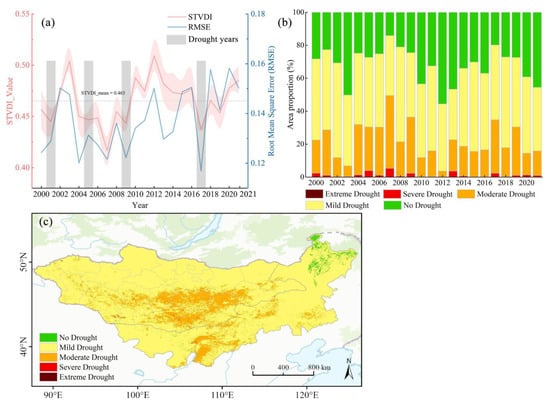
Figure 12.
Interannual variation in the STVDI during 2000–2021. (a) Annual change in the STVDI and RMSE (the color band is within the range of standard deviation), (b) Area proportion of different drought grades, and (c) Spatial distribution of annual average STVDI.
Figure 12.
Interannual variation in the STVDI during 2000–2021. (a) Annual change in the STVDI and RMSE (the color band is within the range of standard deviation), (b) Area proportion of different drought grades, and (c) Spatial distribution of annual average STVDI.
In order to further investigate the STVDI change trend during 2000–2021, the Hurst index was determined for every pixel, complementing the analysis results of Sen’s slope. Figure 8d illustrates the geographical variation in Sen’s slope, featuring an average value of 0.002 in the MP region, which suggests a minor reduction in drought conditions. From the spatial perspective, 67% of Sen’s slope values are between −0.005 and 0.005, indicating a lack of obvious change trend in drought for most regions. The spatial distribution of the Hurst index is shown in Figure 13a, with an average value of 0.53. The area with Hurst values >0.5 accounts for 68% of the MP, indicating that the STVDI persistence trend in the future is stronger than the anti-persistence trend. The Hurst values in the northwest, south and northeast of the MP are relatively low, showing an anti-persistent trend.
The future drought trend can be obtained by combining the Sen’s slope and Hurst index. Future drought trends for the four categories are shown in Table 5. Spatial distribution of future STVDI trends in the MP (Figure 13b). The areas marked with +− and −+ taken together account for 47%, suggesting that nearly half of MP is likely to suffer from more serious drought in the coming years. In particular, 21% of these regions are predicted to experience drought, ranging from mitigation to aggravation. Furthermore, the region under continuous mitigation (++, 42%) is mainly concentrated in the northeast and northwest of the MP, while the region from aggravation to mitigation (−−, 11%) is predominantly distributed across the central and western area.

Table 5.
Classification of future drought change trend.

Figure 13.
Spatial distributions of (a) STVDI Hurst index, and (b) future trend of STVDI.
Figure 13.
Spatial distributions of (a) STVDI Hurst index, and (b) future trend of STVDI.

4. Discussion
4.1. Performance Evaluations of the STVDI
The STVDI effectively captures both meteorological and agricultural drought characteristics by integrating precipitation, PET, LST, and NDVI into a Euclidean space. Comparative analysis shows that STVDI has the strongest correlation with VHI (r = 0.88), indicating its robust ability to reflect surface water stress [51]. Its high correlation with SPEI highlights sensitivity to atmospheric water balance [52], while the strong alignment with TCI emphasizes responsiveness to surface temperature dynamics [53]. The correlation between STVDI and VCI is the lowest because NDVI (greenness of the vegetation canopy) has a lagged response to drought changes [54]. The spatiotemporal correlations between STVDI and SPEI, TCI, and VCI demonstrate its effectiveness in drought monitoring. Furthermore, the high consistency (Sen’s slope), stability (CVmean = 15.52%) and high fitting efficiency (NSEmean = 86.5, RMSEmean = 0.14) of STVDI (1, 3, 6 and 12 months) in indicating drought highlight its robustness.
STVDI exhibits stronger correlations with precipitation and SM compared to those with SPEI or VHI, confirming its dual applicability in both meteorological and agricultural drought monitoring. Precipitation is a direct driving factor of drought and serves as a key variable for evaluating the applicability of drought indices in meteorological drought monitoring [55]. The essence of agricultural drought revolves around the water deficiency experienced by vegetation or crops, while SM serves as a direct indicator of crop water availability [56]. STVDI-12 exhibits the highest correlation with precipitation, where the cumulative effect of precipitation is more pronounced [57], thus providing a better reflection of long-term meteorological drought trends. Conversely, the rapid response of SM to precipitation enables STVDI-1 to exhibit superior performance in agricultural drought monitoring. SM is significantly influenced by multiple factors, including evaporation, temperature, and soil structure, leading to substantial long-term fluctuations and a pronounced decoupling effect [58]. This explains the relatively low correlation between STVDI-12 and SM. Overall, STVDI demonstrates greater sensitivity to the long-term trends in precipitation as well as the lagged effects of SM.
Lag analysis further confirms the rapid and accurate responsiveness of STVDI: >97% and >80% of the regions can respond promptly to the changes in precipitation and SM, respectively. Specifically, The STVDI-1 exhibits the smallest lag area and lag value relative to precipitation, which makes it particularly suitable for meteorological drought monitoring. Meanwhile, the STVDI-12 demonstrates the smallest lag area and lag value relative to SM, thereby enhancing its effectiveness in agricultural drought monitoring. The optimal lag time of STVDI-1 relative to precipitation is 1 day, while the optimal lag time of STVDI-12 relative to SM is 7.6 days. These lag times are both reasonable and acceptable at the monthly and annual scales [59]. Due to the presence of residual soil moisture, the response of the drought index to drought conditions exhibits a lagged effect. Moreover, a certain lag effect exists between precipitation and SM, which further increases the lag in the agricultural drought index’s response to drought [60]. This also explains why the lag days of STVDI relative to SM are longer. However, regional variations are evident in Figure 9, where some areas exhibit positive lag values. These discrepancies can be attributed to several factors: (1) residual soil moisture and local ecological conditions, such as vegetation type, soil texture, and land cover, which modulate the speed at which drought conditions propagate [61]; (2) heterogeneity in precipitation and soil moisture distribution, which can delay the local response of vegetation [62]; and (3) data quality and measurement uncertainty in remote sensing and meteorological datasets [63]. Despite these localized variations, the overall lag remains minimal, and STVDI captures drought dynamics effectively across most regions. Additionally, STVDI-12 is the most stable (STVDICV = 8.21%), which can be attributed to the fact that the drought index data at an annual timescale tend to smooth out fine-frequency fluctuations.
The 1 km monthly STVDI dataset developed in this study could be utilized for regional drought risk assessment, rangeland and water resource management, as well as ecological protection efforts. The STVDI framework is fully dependent on globally available, open-access datasets (e.g., MODIS, CRU), which ensures high reproducibility and transferability to other regions. It can be integrated into regional or national drought monitoring systems (e.g., China’s National Disaster Reduction Center, Mongolia’s Environmental Monitoring Networks), with deployment supported by Google Earth Engine to enable cost-efficient, automated processing. While this study focused on the Mongolian Plateau, the STVDI methodology can be generalized to other regions with similar semi-arid climatic conditions, such as Central Asia and African savannas.
4.2. Spatiotemporal Features and Lag Response of Drought on the MP
An analysis was conducted on the monthly 1 km resolution drought dataset product for the MP from 2000 to 2021 that was produced in this paper. Drought mainly occurs in spring and summer at the monthly scale with STVDI-1. From March to May, the precipitation is low and the precipitation variability is large, the temperature rises rapidly and evaporation increases [64], which leads to an imbalance between water supply and demand and causes drought. With the increase in precipitation, drought conditions alleviate to some extent. However, the high temperatures from June to August, combined with ongoing drought effects, primarily result in mild and moderate droughts in the study area. The spring and summer monsoons may lead to severe droughts; anomalies in atmospheric circulation and the occurrence of heatwave-drought compound events further intensify this severity [33]. From November to February of the following year, the extremely low temperatures and minimal evaporation limit SM depletion [65], result in relatively mild drought conditions. Numerous studies have indicated that the southwestern region of MP experiences severe drought conditions on an annual basis [35,45]. However, when analyzed from a monthly standpoint, the southwestern area tends to be largely no drought during the autumn and winter months. The annual analysis based on STVDI-12 shows that the MP experienced a prolonged period of light to moderate drought from 2000 to 2021. This can be attributed to the difficulty of monsoon-derived moisture reaching the central region. Additionally, some studies indicate that climate change and human activities are the primary driving factors behind this phenomenon [36,66].
Although some drought-affected areas exhibit a certain alleviation trend, the future persistence of drought is expected to remain relatively strong. Particularly, in the northwest and central-southern regions, 47% of the land continues to experience persistent drought conditions. Global warming, coupled with heatwaves and droughts, renders the future drought trend on the MP increasingly concerning. Cai [67] suggested that climate variability may transform the MP into a permanently arid region. Therefore, in March, it is necessary to plan irrigation facilities in advance and enhance the allocation of water resources to mitigate the potential impact of drought on agricultural and livestock production. From June to August, increasing vegetation coverage can help retain SM and alleviate the synergistic effects of high temperatures and drought [68]. Rational management of winter snowpack, such as promoting early spring snowmelt or redirecting snowmelt runoff to drought-affected areas, can enhance SM replenishment.
Regarding rapid-onset droughts, our analysis indicates that over 88% of the MP exhibits near-zero lag between STVDI and both soil moisture and precipitation, reflecting highly synchronized drought development. It is important to clarify that this finding represents potential susceptibility to rapid-onset (flash) drought events rather than actual occurrences. Flash droughts are typically defined based on specific criteria such as rapid soil moisture decline or vegetation stress over a short period (e.g., 5–30 days) [69,70]. Thus, while the near-zero lag highlights regions where drought signals can develop quickly, additional event-based validation would be required to confirm actual flash drought events. STVDI integrates precipitation, evapotranspiration, temperature, and vegetation conditions, and is capable of quickly capturing rapid responses to water and heat changes. Moreover, in arid and semi-arid ecosystems such as the Mongolian Plateau, vegetation is highly sensitive to short-term precipitation events due to thin soil layers and limited water storage capacity. The observed average lag time of 0.52 days further emphasizes the rapid propagation of drought signals in these susceptible regions. Compared with traditional drought indices such as SPEI, which typically lag behind by 1 to 3 months in capturing drought responses [71], STVDI demonstrates a more immediate response (0.52 days on average). The relative precipitation lag area of STVDI is less than 3% (Temperature-SIF-Water Balance Dryness Index, TWSDI is about 11%) [72], shows superior low-lag performance.
4.3. Limitations
To further advance the scientific understanding and monitoring of drought dynamics, it is crucial to improve the spatial precision of input data and ensure comprehensive drought characterization under complex climates. First, considering the limited spatial resolution (0.5°) of the CRU TS precipitation product, it is essential to conduct spatial refinement. The precision of the refined dataset is determined by the downscaling method and its associated parameters. However, precipitation downscaling inevitably introduces uncertainties, particularly in regions with sparse observation networks, where interpolation errors or parameter selection may propagate into STVDI calculations. Future efforts should include cross-validation with independent ground-based measurements to quantify these uncertainties. Second, although the SPEI, VHI, Pre, and SM indices largely reflect the dry and wet conditions of the surface, they are insufficient to comprehensively describe the drought condition. The MODIS products used in STVDI construction also have inherent limitations, such as cloud contamination, gaps in high-latitude winter retrievals, and NDVI saturation in dense vegetation canopies. These limitations may weaken the reliability of STVDI in certain regions or seasons, suggesting the need for blending with alternative remote sensing products (e.g., Sentinel or VIIRS). Drought in the study area is closely associated with climate change, cyclone circulation patterns, and high-temperature heatwave events. Finally, the Euclidean distance framework effectively integrates multiple drought-related variables, but it may risk overfitting if too many indicators are included or their weights are unbalanced. This could inflate correlations with reference indices. Validation and sensitivity testing are therefore essential to ensure robustness. Consequently, there is a need to propose an effective approach to rigorously assess the newly developed drought index, accounting for both input data limitations and methodological uncertainties.
5. Conclusions
Accurately assessing drought and elucidating the mechanisms underlying drought propagation and lag effects remain a scientific challenge in arid and semi-arid regions. Our findings reveal a previously unrecognized synchronization between precipitation, soil moisture, vegetation stress, and drought, offering new theoretical insights into drought propagation mechanisms. Nearly 90% of the Mongolian Plateau exhibited potential susceptibility, suggesting a potential susceptibility to rapid-onset drought events. However, it should be noted that this conclusion is based on index-based lag analysis, and further validation against ground observations or historical drought records is required. The proposed multi-scale composite drought index (STVDI) enables timely and dynamic drought detection with minimal lag (0.52 days on average) and shows strong spatiotemporal consistency with established drought indices. It demonstrates stable performance across multiple timescales, capturing both short-term meteorological droughts and longer-term agricultural droughts. Monthly STVDI captures distinct seasonal drought variations on the MP, with events predominantly occurring in spring and summer. On the annual scale, drought conditions from 2000 to 2021 remained relatively mild and stable, with a slight overall alleviation trend. Spatially, drought intensified in some southeastern areas, and projections suggest that 47% of the region may experience worsening drought in the future, with 21% moving from mitigation to deterioration. It is important to note that the southwestern region of MP exhibits relatively mild drought conditions during the autumn and winter months. The 1 km monthly STVDI dataset developed in this study offers a useful reference for regional drought monitoring and climate impact assessment, but its broader application will require validation against independent ground data and comparison with historical drought events. Future work should focus on integrating higher-resolution climate and remote sensing datasets, applying the STVDI framework to other drought-prone regions, and testing its robustness under different climate scenarios.
Author Contributions
L.P.: Writing—original draft, Visualization, Methodology, Formal analysis, and Data curation. J.W.: Writing—review and editing, Resources, Conceptualization, and Funding acquisition. J.H.: Methodology, Formal analysis, Conceptualization. K.L.: Methodology, Formal analysis. M.H.: Methodology. Y.S.: Writing—Review and editing. All authors have read and agreed to the published version of the manuscript.
Funding
This research was funded by the Science & Technology Fundamental Resources Investigation Program (Grant No. 2022FY101902), Key Project of Innovation LREIS (grant number KPI006), the Key R&D and Achievement Transformation Program of the Inner Mongolia Autonomous Region (2023KJHZ0027), Construction Project of China Knowledge Center for Engineering Sciences and Technology (CKCEST-2023-1-5), and The IRDR workflow “Spatial and Temporal distribution Correlation Analysis, and Climate Change Adaptation Strategies for 4D Hazards in the Mongolian Plateau”.
Data Availability Statement
Data will be made available on request.
Acknowledgments
Thank IRDR for the support and assistance provided for this thesis.
Conflicts of Interest
The authors declare no conflicts of interest.
References
- Nairizi, S. Drought and Water Scarcity; International Commission on Irrigation and Drainage: New Delhi, India, 2017. [Google Scholar]
- Ault, T.R. On the essentials of drought in a changing climate. Science 2020, 368, 256–260. [Google Scholar] [CrossRef]
- Yuan, X.; Wang, Y.; Ji, P.; Wu, P.; Sheffield, J.; Otkin, J.A. A global transition to flash droughts under climate change. Science 2023, 380, 187–191. [Google Scholar] [CrossRef] [PubMed]
- Baluch, H. Global Aridity Trends, Impacts, and Adaptation Strategies. In The Global Threat of Drying Lands: Regional and Global Aridity Trends and Future Projections; UNCCD: Bonn, Germany, 2024. [Google Scholar]
- Hoover, D.L.; Smith, W.K. The growing threat of multiyear droughts. Science 2025, 387, 246–247. [Google Scholar] [CrossRef] [PubMed]
- Wu, H.; Su, X.; Huang, S.; Singh, V.P.; Zhou, S.; Tan, X.; Hu, X. Decreasing dynamic predictability of global agricultural drought with warming climate. Nat. Clim. Change 2025, 15, 411–419. [Google Scholar] [CrossRef]
- Monjo, R.; Royé, D.; Martin-Vide, J. Meteorological drought lacunarity around the world and its classification. Earth Syst. Sci. Data 2020, 12, 741–752. [Google Scholar] [CrossRef]
- Guo, Y.; Huang, S.; Huang, Q.; Leng, G.; Fang, W.; Wang, L.; Wang, H. Propagation thresholds of meteorological drought for triggering hydrological drought at various levels. Sci. Total Environ. 2020, 712, 136502. [Google Scholar] [CrossRef]
- McKee, T.B.; Doesken, N.J.; Kleist, J. The relationship of drought frequency and duration to time scales. In Proceedings of the 8th Conference on Applied Climatology, Anaheim, CA, USA, 17–22 January 1993; Volume 17, pp. 179–183. [Google Scholar]
- Byun, H.-R.; Wilhite, D.A. Objective Quantification of Drought Severity and Duration. J. Clim. 1999, 12, 2747–2756. [Google Scholar] [CrossRef]
- Van-Rooy, M.P. A rainfall anomaly index (RAI) independent of time and space. Notos 1965, 14, 43–48. [Google Scholar]
- Gommes, R.A.; Petrassi, F. Rainfall Variability and Drought in Sub-Saharan Africa Since 1960; FAO: Rome, Italy, 1994; 100p. [Google Scholar]
- Bhalme, H.N.; Mooley, D.A. Large-Scale Droughts/Floods and Monsoon Circulation. Mon. Wea. Rev. 1980, 108, 1197–1211. [Google Scholar] [CrossRef]
- Palmer Wayne, C. Meteorological drought, U.S. Weather Bur. Res 1965, 45, 1–58. [Google Scholar]
- Vicente-Serrano, S.M.; Beguería, S.; López-Moreno, J.I. A Multiscalar Drought Index Sensitive to Global Warming: The Standardized Precipitation Evapotranspiration Index. J. Clim. 2010, 23, 1696–1718. [Google Scholar] [CrossRef]
- West, H.; Quinn, N.; Horswell, M. Remote sensing for drought monitoring & impact assessment: Progress, past challenges and future opportunities. Remote Sens. Environ. 2019, 232, 111291. [Google Scholar]
- Zhang, Y.; Hao, Z.; Feng, S.; Zhang, X.; Xu, Y.; Hao, F. Agricultural drought prediction in China based on drought propagation and large-scale drivers. Agric. Water Manag. 2021, 255, 107028. [Google Scholar] [CrossRef]
- Idso, S.B.; Jackson, R.D.; Pinter, P.J.; Reginato, R.J.; Hatfield, J.L. Normalizing the stress-degree-day parameter for environmental variability. Agric. Meteorol. 1981, 24, 45–55. [Google Scholar] [CrossRef]
- Kogan, F.N. Remote sensing of weather impacts on vegetation in non-homogeneous areas. Int. J. Remote Sens. 1990, 11, 1405–1419. [Google Scholar] [CrossRef]
- Kogan, F.N. Application of vegetation index and brightness temperature for drought detection. Adv. Space Res. 1995, 15, 91–100. [Google Scholar] [CrossRef]
- Zeng, J.; Zhou, T.; Qu, Y.; Bento, V.A.; Qi, J.; Xu, Y.; Li, Y.; Wang, Q. An improved global vegetation health index dataset in detecting vegetation drought. Sci. Data 2023, 10, 338. [Google Scholar] [CrossRef]
- Thornthwaite, C.W. An Approach toward a Rational Classification of Climate. Geogr. Rev. 1948, 38, 55. [Google Scholar] [CrossRef]
- Narasimhan, B.; Srinivasan, R. Development and evaluation of Soil Moisture Deficit Index (SMDI) and Evapotranspiration Deficit Index (ETDI) for agricultural drought monitoring. Agric. For. Meteorol. 2005, 133, 69–88. [Google Scholar] [CrossRef]
- Wang, L.; Qu, J.J. NMDI: A normalized multi-band drought index for monitoring soil and vegetation moisture with satellite remote sensing. Geophys. Res. Lett. 2007, 34, 2007GL031021. [Google Scholar] [CrossRef]
- Svoboda, M.; LeComte, D.; Hayes, M.; Heim, R.; Gleason, K.; Angel, J.; Rippey, B.; Tinker, R.; Palecki, M.; Stooksbury, D.; et al. The Drought Monitor. Bull. Amer. Meteor. Soc. 2002, 83, 1181–1190. [Google Scholar] [CrossRef]
- Brown, J.F.; Wardlow, B.D.; Tadesse, T.; Hayes, M.J.; Reed, B.C. The Vegetation Drought Response Index (VegDRI): A New Integrated Approach for Monitoring Drought Stress in Vegetation. GIScience Remote Sens. 2008, 45, 16–46. [Google Scholar] [CrossRef]
- Alahacoon, N.; Edirisinghe, M. A comprehensive assessment of remote sensing and traditional based drought monitoring indices at global and regional scale. Geomat. Nat. Hazards Risk 2022, 13, 762–799. [Google Scholar] [CrossRef]
- Chang, F.J.; Wang, K.W. A systematical water allocation scheme for drought mitigation. J. Hydrol. 2013, 507, 124–133. [Google Scholar] [CrossRef]
- Zhan, C.; Liang, C.; Zhao, L.; Jiang, S.; Zhang, Y. Differential responses of crop yields to multi-timescale drought in mainland China: Spatiotemporal patterns and climate drivers. Sci. Total Environ. 2024, 906, 167559. [Google Scholar] [CrossRef] [PubMed]
- Zhu, X.; Huang, S.; Singh, V.P.; Huang, Q.; Zhang, H.; Leng, G.; Gao, L.; Li, P.; Guo, W.; Peng, J. Terrestrial ecosystem resilience to drought stress and driving mechanisms thereof in the Yellow River Basin, China. J. Hydrol. 2025, 649, 132480. [Google Scholar] [CrossRef]
- En-Nagre, K.; Aqnouy, M.; Ouarka, A.; Ali Asad Naqvi, S.; Bouizrou, I.; Eddine Stitou El Messari, J.; Tariq, A.; Soufan, W.; Li, W.; El-Askary, H. Assessment and prediction of meteorological drought using machine learning algorithms and climate data. Clim. Risk Manag. 2024, 45, 100630. [Google Scholar] [CrossRef]
- Wang, Y.; Liu, G.; Guo, E. Spatial distribution and temporal variation of drought in Inner Mongolia during 1901–2014 using Standardized Precipitation Evapotranspiration Index. Sci. Total Environ. 2019, 654, 850–862. [Google Scholar]
- Tong, S.; Lai, Q.; Zhang, J.; Bao, Y.; Lusi, A.; Ma, Q.; Li, X.; Zhang, F. Spatiotemporal drought variability on the Mongolian Plateau from 1980–2014 based on the SPEI-PM, intensity analysis and Hurst exponent. Sci. Total Environ. 2018, 615, 1557–1565. [Google Scholar]
- Li, H.; Hu, Y.; Ao, Z. Identification of critical drought thresholds affecting vegetation on the Mongolian Plateau. Ecol. Indic. 2024, 166, 112507. [Google Scholar] [CrossRef]
- Cao, X.; Feng, Y.; Shi, Z. Spatio-temporal Variations in Drought with Remote Sensing from the Mongolian Plateau During 1982–2018. Chin. Geogr. Sci. 2020, 30, 1081–1094. [Google Scholar] [CrossRef]
- Bole, Y.; Guga, S.; Riao, D.; Zhang, J.; Tong, Z.; Liu, X. Emergency constraint-based CMIP6 predictions for future droughts on the Mongolian Plateau. J. Hydrol. 2024, 645, 132156. [Google Scholar] [CrossRef]
- Tirivarombo, S.O.D.E.; Osupile, D.; Eliasson, P. Drought monitoring and analysis: Standardised precipitation evapotranspiration index (SPEI) and standardised precipitation index (SPI). Phys. Chem. Earth 2018, 106, 1–10. [Google Scholar] [CrossRef]
- Bento, V.A.; Gouveia, C.M.; DaCamara, C.C.; Trigo, I.F. A climatological assessment of drought impact on vegetation health index. Agric. For. Meteorol. 2018, 259, 286–295. [Google Scholar] [CrossRef]
- Tyagi, S.; Zhang, X.; Saraswat, D.; Sahany, S.; Mishra, S.K.; Niyogi, D. Flash drought: Review of concept, prediction and the potential for machine learning, deep learning methods. Earth’s Future 2022, 10, e2022EF002723. [Google Scholar] [CrossRef]
- Christian, J.I.; Hobbins, M.; Hoell, A.; Otkin, J.A.; Ford, T.W.; Cravens, A.E.; Powlen, K.A.; Wang, H.; Mishra, V. Flash drought: A state of the science review. Wiley Interdiscip. Rev. Water 2024, 11, e1714. [Google Scholar] [CrossRef]
- Shi, H.; Li, T.; Wei, J. Evaluation of the gridded CRU TS precipitation dataset with the point raingauge records over the Three-River Headwaters Region. J. Hydrol. 2017, 548, 322–332. [Google Scholar] [CrossRef]
- Ullah, S.; You, Q.; Sachindra, D.A.; Nowosad, M.; Ullah, W.; Bhatti, A.S.; Jin, Z.; Ali, A. Spatiotemporal changes in global aridity in terms of multiple aridity indices: An assessment based on the CRU data. Atmos. Res. 2022, 268, 105998. [Google Scholar] [CrossRef]
- Zhang, J.; Wei, W.; Pang, S.; Guo, Z.; Li, Z.; Zhang, X.; Wang, J. Monitoring and assessment of drought in arid area in northwest China based on FY-3C and TRMM Data. Chin. J. Ecol. 2020, 39, 690–702. [Google Scholar]
- Sharma, V.; Kilic, A.; Irmak, S. Impact of scale/resolution on evapotranspiration from Landsat and MODIS images. Water Resour. Res. 2016, 52, 1800–1819. [Google Scholar] [CrossRef]
- Li, Y.; Gong, H.; Chen, W.; Wang, L. Attribution of drought trends on the Mongolian Plateau over the past decades. Environ. Res. Lett. 2024, 19, 074034. [Google Scholar] [CrossRef]
- Guan, Y.; Gu, X.; Slater, L.J.; Li, J.; Kong, D.; Zhang, X. Spatio-temporal variations in global surface soil moisture based on multiple datasets: Intercomparison and climate drivers. J. Hydrol. 2023, 625, 130095. [Google Scholar] [CrossRef]
- Zhang, L.; Jiao, W.; Zhang, H.; Huang, C.; Tong, Q. Studying drought phenomena in the Continental United States in 2011 and 2012 using various drought indices. Remote Sens. Environ. 2017, 190, 96–106. [Google Scholar] [CrossRef]
- Zeng, J.; Zhang, R.; Qu, Y.; Bento, V.A.; Zhou, T.; Lin, Y.; Wu, X.; Qi, J.; Shui, W.; Wang, Q. Improving the drought monitoring capability of VHI at the global scale via ensemble indices for various vegetation types from 2001 to 2018. Weather. Clim. Extrem. 2022, 35, 100412. [Google Scholar] [CrossRef]
- Pei, F.; Wu, C.; Liu, X.; Li, X.; Yang, K.; Zhou, Y.; Wang, K.; Xu, L.; Xia, G. Monitoring the vegetation activity in China using vegetation health indices. Agric. For. Meteorol. 2018, 248, 215–227. [Google Scholar] [CrossRef]
- Bento, V.A.; Gouveia, C.M.; DaCamara, C.C.; Libonati, R.; Trigo, I.F. The roles of NDVI and Land Surface Temperature when using the Vegetation Health Index over dry regions. Glob. Planet. Change 2020, 190, 103198. [Google Scholar] [CrossRef]
- Almouctar, M.A.S.; Wu, Y.; Zhao, F.; Qin, C. Drought analysis using normalized difference vegetation index and land surface temperature over Niamey region, the southwestern of the Niger between 2013 and 2019. J. Hydrol. Reg. Stud. 2024, 52, 101689. [Google Scholar] [CrossRef]
- Gumus, V. Evaluating the effect of the SPI and SPEI methods on drought monitoring over Turkey. J. Hydrol. 2023, 626, 130386. [Google Scholar] [CrossRef]
- Li, J.; Li, Y.; Zhao, Q. Land Surface Temperature Based Soil Moisture Dynamics Modeling for Chinese Mainland. IEEE Geosci. Remote Sens. Lett. 2022, 19, 1–5. [Google Scholar] [CrossRef]
- Yin, M.; Yin, Y.; Zong, X.; Deng, H. Global vegetation vulnerability to drought is underestimated due to the lagged effect. Agric. For. Meteorol. 2025, 364, 110451. [Google Scholar] [CrossRef]
- Li, C.; Fu, Y.; Zhao, Q.; Zhang, X.; Ding, R.; Hao, F.; Yin, G. Climatic driving mechanisms of the propagation from meteorological drought to agricultural and ecological droughts. J. Environ. Manag. 2025, 383, 125445. [Google Scholar] [CrossRef]
- Cao, M.; Chen, M.; Liu, J.; Liu, Y. Assessing the performance of satellite soil moisture on agricultural drought monitoring in the North China Plain. Agric. Water Manag. 2022, 263, 107450. [Google Scholar] [CrossRef]
- Pei, W.; Hao, L.; Fu, Q.; Ren, Y.; Li, T. The standardized precipitation evapotranspiration index based on cumulative effect attenuation. J. Hydrol. 2024, 635, 131148. [Google Scholar] [CrossRef]
- Wang, S.; Fu, B.J.; Gao, G.Y.; Yao, X.L.; Zhou, J. Soil moisture and evapotranspiration of different land cover types in the Loess Plateau, China. Hydrol. Earth Syst. Sci. 2012, 16, 2883–2892. [Google Scholar] [CrossRef]
- Jeong, M.-S.; Park, S.-Y.; Kim, Y.-J.; Yoon, H.-C.; Lee, J.-H. Identification of propagation characteristics from meteorological drought to hydrological drought using daily drought indices and lagged correlations analysis. J. Hydrol. Reg. Stud. 2024, 55, 101939. [Google Scholar] [CrossRef]
- Shi, X.; Chen, F.; Shi, M.; Ding, H.; Li, Y. Construction and application of Optimized Comprehensive Drought Index based on lag time: A case study in the middle reaches of Yellow River Basin, China. Sci. Total Environ. 2023, 857, 159692. [Google Scholar] [CrossRef]
- Li, M.; Wang, P.; Tansey, K.; Sun, Y.; Guo, F.; Zhou, J. Improved field-scale drought monitoring using MODIS and Sentinel-2 data for vegetation temperature condition index generation through a fusion framework. Comput. Electron. Agric. 2025, 234, 110256. [Google Scholar] [CrossRef]
- Ivanov, V.Y.; Fatichi, S.; Jenerette, G.D.; Espeleta, J.F.; Troch, P.A.; Huxman, T.E. Hysteresis of soil moisture spatial heterogeneity and the “homogenizing” effect of vegetation. Water Resour. Res. 2010, 46, W09521. [Google Scholar] [CrossRef]
- Batini, C.; Blaschke, T.; Lang, S.; Albrecht, F.; Abdulmutalib, H.M.; Barsi, Á.; Szabó, G.; Kugler, Z. Data quality in remote sensing. The International Archives of the Photogrammetry. Remote Sens. Spat. Inf. Sci. 2017, 42, 447–453. [Google Scholar]
- Zhang, W.; Zhou, T.; Wu, P. Anthropogenic amplification of precipitation variability over the past century. Science 2024, 385, 427–432. [Google Scholar] [CrossRef]
- Cao, X.; Feng, Y.; Wang, J. An improvement of the Ts-NDVI space drought monitoring method and its applications in the Mongolian plateau with MODIS, 2000–2012. Arab J. Geosci. 2016, 9, 433. [Google Scholar] [CrossRef]
- Nandintsetseg, B.; Boldgiv, B.; Chang, J.; Ciais, P.; Davaanyam, E.; Batbold, A.; Bat-Oyun, T.; Stenseth, N.C. Risk and vulnerability of Mongolian grasslands under climate change. Environ. Res. Lett. 2021, 16, 034035. [Google Scholar] [CrossRef]
- Cai, Q.; Chen, W.; Chen, S.; Xie, S.-P.; Piao, J.; Ma, T.; Lan, X. Recent pronounced warming on the Mongolian Plateau boosted by internal climate variability. Nat. Geosci. 2024, 17, 181–188. [Google Scholar] [CrossRef]
- Zhang, K.; Zuo, Z.; Mei, W.; Zhang, R.; Dai, A. A westward shift of heatwave hotspots caused by warming-enhanced land–air coupling. Nat. Clim. Change 2025, 15, 546–553. [Google Scholar] [CrossRef]
- Xu, S.; Wang, Y.; Liu, Y.; Li, J.; Qian, K.; Yang, X.; Ma, X. Evaluating the cumulative and time-lag effects of vegetation response to drought in Central Asia under changing environments. J. Hydrol. 2023, 627, 130455. [Google Scholar] [CrossRef]
- Gu, L.; Schumacher, D.L.; Fischer, E.M.; Slater, L.J.; Yin, J.; Sippel, S.; Knutti, R. Flash drought impacts on global ecosystems amplified by extreme heat. Nat. Geosci. 2025, 18, 709–715. [Google Scholar] [CrossRef]
- Wei, W.; Liu, T.; Zhou, L.; Wang, J.; Yan, P.; Xie, B.; Zhou, J. Drought-Related Spatiotemporal Cumulative and Time-Lag Effects on Terrestrial Vegetation across China. Remote Sens. 2023, 15, 4362. [Google Scholar] [CrossRef]
- Liu, Y.; Yu, X.; Dang, C.; Yue, H.; Wang, X.; Niu, H.; Zu, P.; Cao, M. A dryness index TSWDI based on land surface temperature, sun-induced chlorophyll fluorescence, and water balance. ISPRS J. Photogramm. Remote Sens. 2023, 202, 581–598. [Google Scholar] [CrossRef]
Disclaimer/Publisher’s Note: The statements, opinions and data contained in all publications are solely those of the individual author(s) and contributor(s) and not of MDPI and/or the editor(s). MDPI and/or the editor(s) disclaim responsibility for any injury to people or property resulting from any ideas, methods, instructions or products referred to in the content. |
© 2025 by the authors. Licensee MDPI, Basel, Switzerland. This article is an open access article distributed under the terms and conditions of the Creative Commons Attribution (CC BY) license (https://creativecommons.org/licenses/by/4.0/).
