Article

Bidirectional Reflectance Sensitivity to Hemispherical Samplings: Implications for Snow Surface BRDF and Albedo Retrieval

by
Jing Guo
1,2,
Ziti Jiao
1,2,*,
Anxin Ding
3,
Zhilong Li
1,2,
Chenxia Wang
1,2,
Fangwen Yang
1,2,
Ge Gao
1,2,
Zheyou Tan
1,2,
Sizhe Chen
1,2 and
Xin Dong
1,2
1
State Key Laboratory of Remote Sensing and Digital Earth, Faculty of Geographical Science, Beijing Normal University, Beijing 100875, China
2
Institute of Remote Sensing Science and Engineering, Faculty of Geographical Science, Beijing Normal University, Beijing 100875, China
3
School of Resources and environment engineering, Hefei University of Technology, Hefei 230009, China
*
Author to whom correspondence should be addressed.
Remote Sens. 2025, 17(21), 3614; https://doi.org/10.3390/rs17213614 (registering DOI)
Submission received: 2 September 2025 / Revised: 25 October 2025 / Accepted: 28 October 2025 / Published: 31 October 2025

Highlights

What are the main findings?
  • Different illuminating–observing sampling distribution schemes can influence BRDF and albedo more for longer wavelengths.
  • An angular information index (AII) was proposed based on a kernel-driven model, in cooperation with a weighting mechanism and information effectiveness to evaluate the information content of various sampling distribution schemes.
What are the implications of the main findings?
  • The angular sampling configuration is demonstrated to be a key factor influencing the accuracy of BRDF and albedo derived from the kernel-driven model.
  • The AII provides a practical metric for guiding future sensor parameterization and for evaluating the quality of multi-angular data before operational application.

Abstract

Multi-angular remote sensing plays a critical role in the study domains of ecological monitoring, climate change, and energy balance. The successful retrieval of the surface Bidirectional Reflectance Distribution Function (BRDF) and albedo from multi-angular remote sensing observations for various applications relies on the sensitivity of an appropriate BRDF model to both the number and the sampling distribution of multi-angular observations. In this study, based on selected high-quality multi-angular datasets, we designed three representative angular sampling schemes to systematically analyze different illuminating–viewing configurations of the retrieval results in a kernel-driven BRDF model framework. We first proposed an angular information index (AII) by incorporating a weighting mechanism and information effectiveness to quantify the angular information content for the angular sampling distribution schemes. In accordance with the principle that observations on the principal plane (PP) provide the most representative anisotropic scattering features, the assigned weight gradually decreases from the PP towards the cross-principal plane (CPP). The information effectiveness is determined based on the cosine similarity between the observations, effectively reducing the information redundancy. With such a method, we assess the AII of the different sampling schemes and further analyze the impact of angular distribution on both BRDF inversion and the estimation of snow surface albedo, including White-Sky Albedo (WSA) and Black-Sky Albedo (BSA) based on the RossThick-LiSparseReciprocal-Snow (RTLSRS) BRDF model. The main conclusions are as follows: (1) The AII approach can serve as a robust indicator of the efficiency of different sampling schemes in BRDF retrieval, which indicates that the RTLSRS model can provide a robust inversion when the AII value exceeds a threshold of −2. (2) When the AII value reaches such a reliable level, different sampling schemes can reproduce the BRDF shapes of snow across different bands to somehow varying degrees. Specifically, observations with smaller view zenith angle (VZA) ranges can reconstruct a BRDF shape that amplifies the anisotropic effect of snow; in addition, the forward scattering tends to be more pronounced at larger solar zenith angles (SZAs), while the variations in BRDF shape reconstructed from off-PP observations depend on both wavelength and SZAs. (3) The relative differences in both BSA and WSA grow with increasing wavelength for all these sampling schemes, mostly within 5% for short bands but up to 30% for longer wavelengths. With this novel AII method to quantify the information contribution of multi-angular sampling distributions, this study offers valuable insights into several main multi-angular BRDF sampling strategies in satellite sensor missions, which relate to most of the fields of multi-angular remote sensing applications in engineering.

1. Introduction

The BRDF is a fundamental theoretical tool that characterizes the anisotropic reflectance behavior of natural surfaces [1,2,3,4]. It is essential for radiative transfer modeling and the retrieval of surface parameters in quantitative remote sensing applications [3,5]. Accurate modeling of snow BRDF is particularly important for interpreting satellite-based multi-angular and hyperspectral observations, as it directly influences the estimation of surface albedo [6], snow grain size [7], and surface roughness [8]. Moreover, reliable BRDF representation contributes to improved ecosystem modeling [9,10,11], climate change assessment and global radiation budget analysis [12,13,14]. Since BRDF cannot be directly measured by remote sensing instruments, it is typically estimated by using BRDF models [15]. Among various models, the semi-empirical kernel-driven model based on the Ross–Li framework has been widely used due to its simple functional form and computation [3,4,5,16]. According to the definition, the BRDF is strongly dependent on illuminating–viewing geometry, specifically the solar zenith angle (SZA), view zenith angle (VZA), and relative azimuth angle (RAA). Different angular sampling strategies lead to significant differences because of the quality of BRDF information captured, which, in turn, affects the accuracy of the retrieved BRDF parameters. Therefore, the configuration of multi-angular observations plays a critical role in determining the reliability of BRDF inversion.
The multi-angular data acquisition strategies employed by their primary onboard sensors can generally be categorized as follows: (1) Simultaneous multi-angular observations: This type of observation enables a satellite to capture reflectance from multiple viewing angles almost simultaneously during a single overpass, ensuring consistent atmospheric and surface conditions. For example, CERES (Cloud and the Earth’s Radiant Energy System) can simultaneously sample from different azimuth angles and viewing angles ranging from 0° to 90° in RAP mode, as well as 0°–80° viewing in cross-track mode [17]. The CHRIS (Compact High Resolution Imaging Spectrometer) is capable of acquiring up to five images at different VZAs at ±55°, ±36° and 0° for a given target during one orbital overpass by maneuvering four reaction wheels of the onboard platform [18]. MISR (Multi-angle Imaging SpectroRadiometer) utilizes a unique instrument design to observe the surface from nine different view angles, ranging from 26.1° to 70.5° in both forward and backward directions, as well as the nadir, within a short time frame [19]. The POLDER (Polarization and Directionality of the Earth’s Reflectance) multi-angular database collects observations to a maximum FOV (field of view) of ±57°. It can observe the same target from 16 directions at most (14 directions on average) on the same orbit [20]. Similarly, the DPC (Directional Polarimetric Camera) onboard GF-5 (Gaofen-5) can observe up to 12 directions, covering a range of −50° to 50° along the track [21]. (2) Accumulation observations within a specific time series: This approach relies on the accumulation of observations during multiple satellite overpasses within a specific time window. MODIS (Moderate Resolution Imaging Spectroradiometer) can acquire observations at VZAs up to ±55°, and, because of its orbital convergence, it provides frequent revisit opportunities at higher latitudes. Over a 16-day cycle, both the Terra and Aqua platforms together enable multi-angular sampling, capturing reflectance along two distinct azimuthal viewing directions [22]. The VIIRS (Visible Infrared Imaging Radiometer Suite) built on the MODIS legacy, offers similar angular observations but operates with a single viewing geometry. It can obtain more observations than a single MODIS platform (Terra or Aqua only) at large view zenith angles (to 60°) due to the wider swath [23]. The AVHRR (Advanced Very High Resolution Radiometer) collects observations that can reach a maximum VZA of 60°off-nadir over different temporal coverages [24]. Based on the spatial distribution patterns of the observations, they can be generally categorized into two types according to the relative position between sun and sensor. The first category includes MODIS, VIIRS, CHRIS, and MISR, whose observations exhibit relatively consistent RAA. The second category includes instruments like CERES, POLDER and DPC, which capture observations with a wide range of RAAs, offering more diverse angular sampling geometries. Due to the limited availability of multi-angular remote sensing data with high spatial resolution, most current studies on large-scale BRDF information retrieval still rely predominantly on medium- and low-resolution datasets, such as MODIS, VIIRS, and POLDER [25]. In recent years, with the increasing demand for high-resolution surface reflectance characterization, some high-resolution sensors have been utilized to collect multi-angular information, owing to their design characteristics, e.g., a wide FOV and a high revisit frequency. The VEGETATION onboard the SPOT (Satellite Pour l’Observation de la Terra) and its successor, VGT onboard PROBA-V (Project for Onboard Autonomy-Vegetation), have been used for monitoring surface reflectance anisotropy because the sensors can provide off-nadir observations up to ±23°, along with daily global coverage, allowing for the accumulation of angularly diverse observations within a short period [26]. The Sentinel-2 MSI (multispectral instrument) and the Landsat-8 and -9 OLIs (Operational Land Imagers) are in sun-synchronous low earth polar orbits, and can acquire images at VZAs ±10.3° and ±7.5° from nadir that can result in directional effects [27]. In addition, the data from some geostationary satellites, e.g., Himawari-8 [28] and GF-4 [29], have also been utilized to retrieve BRDF information, because of the high temporal resolution, and are expected to reveal BRDF intra-daily variations. The methods of collecting multi-angular data in these studies generate more varied sampling patterns, especially for the small VZA range. However, the BRDF and albedo variabilities induced by angular sampling patterns have not been thoroughly investigated in current studies, particularly for snow surface. This research gap poses a significant challenge to subsequent applications that rely on accurate characterization of anisotropic reflectance features. Therefore, there is a high demand to assess the quality of different angular sampling configurations and evaluate their impact on the retrieval accuracy of BRDF and albedo.
Early efforts by Barnsley et al. systematically evaluated the angular sampling capabilities of various multi-angular satellite sensors, emphasizing that a sensor’s ability to characterize BRDF is primarily determined by its accessible VZA range and orbital configuration [30]. Lucht and Lewis further investigated the effects of angular sampling strategies and observational uncertainty on BRDF model parameterization, proposing the “Weight of Determination” (WoD) to characterize the noise-amplifying effect. This metric has since been widely adopted to assess the adequacy of angular sampling schemes [31,32]. Jin et al. introduced the concept of “Net Information Content” to evaluate whether MISR observations can provide additional angular information beyond that of MODIS [33]. Zhang et al. introduced the angular information content (AIC) metric to quantitatively assess the contribution of angular sampling geometry to BRDF retrieval, identifying optimal sampling strategies for most land cover types other than snow [34]. Despite their utility, both WoD and AIC approaches are subject to two key limitations. First, the different information contribution of observations on different azimuthal planes is neglected. Second, they fail to account for potential information redundancy among spatially adjacent observations. These shortcomings may lead to an overestimation of information gain with increasing observation numbers, even in cases where the additional observations provide minimal or no new information.
Focusing on snow surface, this study aims to investigate the extent to which variations in angular sampling configurations affect the estimation of snow BRDF and albedo. To address this issue, we designed three representative angular sampling schemes based on typical multi-angular remote sensing acquisition modes. First, the angular information content provided by each scheme is quantitatively assessed and analyzed. Subsequently, using the RTLSRS BRDF model, we systematically compare the reconstructed BRDFs and their corresponding WSA and BSA under different sampling strategies to reference results. Finally, explanations and limitations of this paper are discussed.

2. Data

2.1. CAR Multi-Angular Data

The Cloud Absorption Radiometer (CAR) is an airborne instrument that has been widely used over the past several decades to measure the angular distribution of solar radiation reflected in global natural ecosystems [35,36,37]. These observations enable the derivation of complete BRF measurements across the full range of zenith and azimuth angles. The CAR performs repeated measurements over the target area in a clockwise flight pattern, capturing multi-angular observations from numerous viewing directions. The VZA ranges from −90° to 90° with a 0.5° interval, while the RAA covers 0° to 360° with a 1° interval. Under this sampling configuration, each flight yields between 76,400 and 114,600 directional observations. Azimuth angles of 0–90°, 270–360° and 90–270° correspond to backward and forward scattering, respectively. The data used in this study were acquired during the ARCTAS (Arctic Research of the Composition of the Troposphere from Aircraft and Satellites) spring field campaign, conducted by NASA on 7 April 2008, near Elson Lagoon (71°18′N, 156°24′W) in Barrow, Alaska [35]. The dataset used in this study is a Level 1D product, specifically selected from flight observations at an altitude of 200 m, which helps to minimize atmospheric interference with surface reflectance measurements. The dataset covers eight spectral bands: 339 nm, 382 nm, 677 nm, 873 nm, 1032 nm, 1222 nm, 1275 nm, and 2196 nm. The high-density observations provide valuable support for angular sensitivity analysis and sampling strategy evaluation, and are particularly valuable for assessing the accuracy of satellite-derived BRDF products. We selected four representative bands in this study and the fitting accuracy of the RTLSRS model is presented as shown in Table 1; the RTLSRS model performs well with an RMSE below 0.02, indicating that these data can reliably serve as the standard dataset.

2.2. Dome-C Multi-Angular Data

The Dome-C dataset was collected during the austral summers of 2003–2004 and 2004–2005 at a measurement site located atop a 32 m tower on the eastern Antarctic Plateau (75°06′N, 123°18′E). The site features a flat surface with minimal slope and low wind speed, providing ideal conditions for BRF observations. Measurements were collected by using the FieldSpec Pro JR spectroradiometer with a 15° field of view, covering a spectral range of 350–2400 nm with a spectral resolution of 3–30 nm. Within the hemispherical observation space, data were sampled at 15° intervals in both VZA and RAA. VZA sampling was conducted at ±82.5°, ±67.5°, ±52.5°, ±37.5°, ±22.5°, and 7.5°, while the SZA ranged from 51.57° to 86.56° and 66 observations were provided for each SZA. A total of 6336 valid BRF measurements were obtained per spectral band, providing a comprehensive dataset with dense angular and spectral coverage. This dataset was published as anisotropic reflectance factors, and needed to be processed to BRF format before performing BRDF retrieval [38]. This dataset serves as a solid foundation for the angular sampling analysis and BRDF modeling. Considering the high uncertainty in the large VZAs, the observations at VZA = ±82.5° were excluded, resulting in a new dataset containing 5088 observations for further application. In this study, we use this dataset in two ways, as shown in Figure 1: (i) using all 5088 observations under 96 SZAs; and (ii) dividing the 5088 observations by SZA to obtain 96 datasets, each with 53 observations. We selected four representative bands as standard datasets and the fitting accuracies are listed in Table 2.

3. Methods

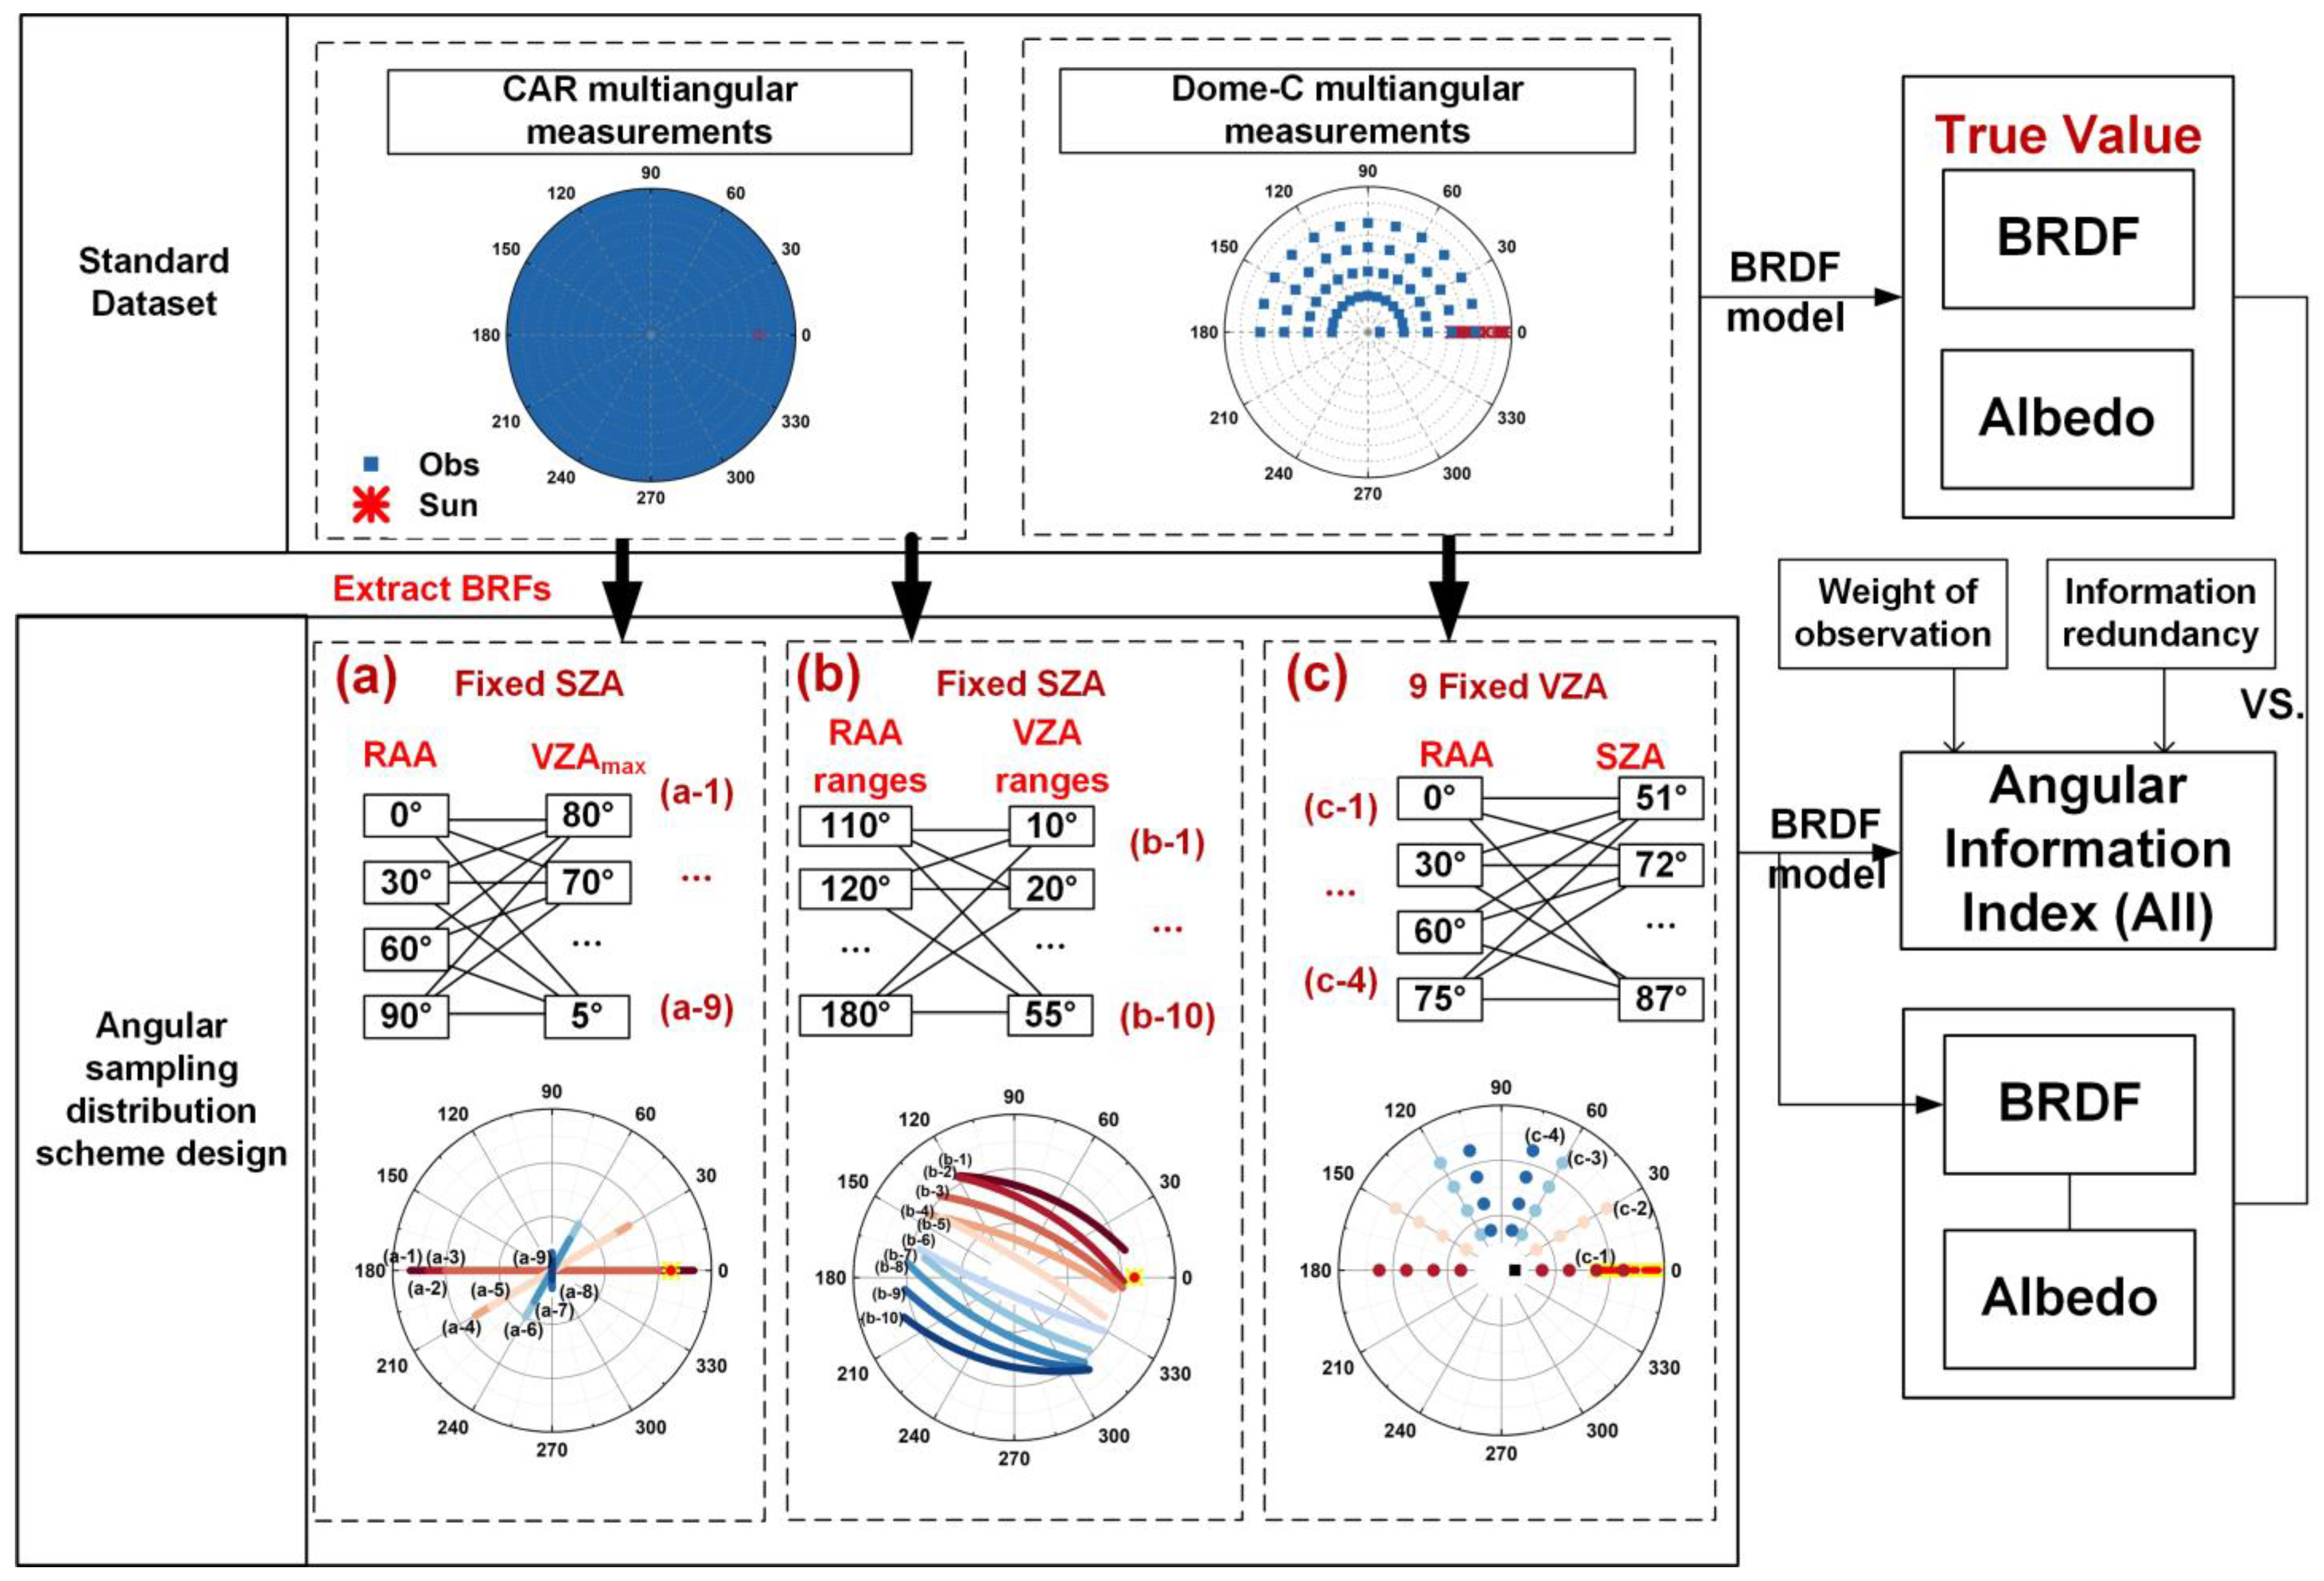
The method framework is shown in Figure 2. With the standard dataset results serving as the reference, we compared the different BRDFs and albedos derived from different angular sampling distribution schemes. These sampling schemes were designed with VZA, RAA, and SZA as variables to assess how different angular combinations influence the ability to capture the anisotropic properties of the snow surface. The information content provided by the scheme was described by the AII method proposed in this study.

3.1. Angular Sampling Scheme Design

In this study, angular sampling schemes were designed based on the relative positions of the sun and the sensor. The sampling schemes are categorized into three types: (a) and (b) investigate the effects of different sampling configurations under a fixed SZA. Using the high-angular-resolution and high-accuracy CAR dataset as the standard, two sampling modes were simulated. (c) explores the impact of SZA variation on BRDF retrieval by using the Dome-C dataset, which includes a wide range of SZAs, as the reference data source. In this study, we define forward-scattering angles as negative, corresponding to an RAA range of [90–270°], and backward-scattering angles as positive, corresponding to RAA ranges of [0–90°] or [270–360°]. Overall, the three angular sampling configurations can be summarized as:
  • Observations sampled along a single RAA under a fixed SZA:
Scheme (a) is designed based on the observation configuration with single azimuthal direction, where the relative position between the sun and sensor remains relatively stable, and this sampling strategy is similar to that of MODIS. The sampling schemes are defined as (a-1), (a-2), …, (a-9), corresponding to VZA ranges of ±80°, ±70°, …, down to ±5°. Note that every (a) series scheme includes 4 schemes with 4 RAAs, including forward/backward-scattering directions of 0°/180° (PP), 30°/210°, 60°/240°, and 90°/270° (CPP), respectively. With these angular sampling schemes, we investigate the impact of different VZA ranges at 4 azimuthal directions on BRDF and albedo retrieval.
2.
Observations sampled along multiple RAA and VZA ranges under a fixed SZA:
Scheme (b) is designed based on the observation configuration with various VZA ranges and azimuthal directions, where the relative position between the sun and sensor varied frequently. Guided by the typical geometric distribution patterns observed in actual POLDER orbits, the angular sampling patterns obtained during a single orbit typically exhibit a fan-shaped distribution. Based on a statistical analysis of all snow and ice pixels in the POLDER dataset, the relative azimuth coverage ranges from approximately 110° to 180° and the maximum VZA reaches up to 67°; 10 representative angular sampling configurations are considered here. Specifically, the (b-1) to (b-10) scheme corresponds to VZA ranges of 10° (i.e., [−60°, −50°] and [50°, 60°]), 20° (i.e., [−60°, −40°] and [40°, 60°]), ……, 50° (i.e., [−60°, −10°] and [10°, 60°]). The corresponding observations are distributed across different azimuthal coverages ranging from 110° to 180°. The number of observations of these schemes in the forward-scattering direction gradually decreases, while observations in the backward-scattering direction increase accordingly.
3.
Sampling along a single RAA under varied SZAs:
Scheme (c) is based on the Dome-C dataset, from which observations under various SZA conditions were extracted. For each SZA scenario, observations were selected along specific azimuth directions: 0°/180°, 30°/150°, 60°/120°, and 75°/105°. Within each configuration, the VZA range varies from [−62.5°, 62.5°], and kept 9 observations for each scheme.

3.2. Kernel-Driven Model

The Asymptotic Radiative Transfer (ART) model is a physical model for describing the snow reflectance function, and it involves two parameters: L, which is related to snow grain size, and M, which is associated with snow pollutants [39,40]. It has been reported that the model can effectively reproduce the spectral and directional signatures of the snow surface; however, it tends to underestimate reflectance in the forward-scattering direction, particularly at large VZAs. Jiao et al. introduced a correction term to adjust the forward-scattering characteristics, aiming to mitigate the underestimation of reflectance at large VZAs in the PP. The corrected ART model was then incorporated into the semi-empirical kernel-driven Ross–Li framework as an additional SNOW scattering kernel (RTLSR-Snow model, RTLSRS) [5,16]. This extension enabled the kernel-driven model to be applied from vegetation–soil systems to snow. As a result, the RTLSRS model can be expressed as a weighted sum of four kernels.
R θ i , θ v , φ , λ = f iso + f vol K vol θ i , θ v , φ + f geo K geo θ i , θ v , φ + f snw K snw ( θ i , θ v , φ )
where fiso, fvol, fgeo and fsnw are the anisotropy factors of the model, representing the non-Lambertian characteristics of the surface, corresponding to the weight coefficients of the isotropic, volumetric, geometric-optical and SNOW scattering kernel, respectively. The value of the isotropic kernel is constant (equals to 1), the other three kernels can be expressed as trigonometric functions of three angles (SZA, θi; VZA, θv; and RAA, φ). In this study, the volumetric and geometric-optical kernel are specified as RossThick and LiSparseReciprocal kernel, expressed as follows:
K vol θ i , θ v , φ = π / 2 ξ cos ξ + sin ξ cos θ i + cos θ v π 4
cos ξ = cos θ i cos θ v + sin θ i sin θ v cos φ
K geo θ i , θ v , φ = O θ i , θ v , φ sec θ i sec θ v + 1 2 ( 1 + cos ξ ) sec θ i sec θ v
O θ i , θ v , φ = 1 π ( arccos X X 1 X 2 ) ( sec θ i + sec θ v )
X = h b D 2 + ( tan θ i tan θ v sin φ ) ( sec θ i + sec θ v )
D = tan 2 θ i tan 2 θ v 2 tan θ i tan θ v cos φ
θ = arctan ( b r tan θ )
K snw θ i , θ v , φ = R 0 θ i , θ v , φ 1 α · cos ξ · exp cos ξ + 0.4076   α 1.1081
where ξ denotes the phase angle, O(θi,θv,φ) represents the overlap function, h is the mean height of the canopy center, b is the average vertical semi-axis of the ellipsoid, and r is the average horizontal semi-axis. When both the sun and the sensor are in the nadir direction (i.e., θi = θv = 0), the values of all three kernels are zero which can ensure that fiso corresponds to the reflectance in the nadir direction. α serves as a regulating factor to control the strength of forward scattering in the SNOW kernel, with prior knowledge suggesting that the value lies within the range of 0–0.3 [16].
Figure 3 illustrates the variation in three kernel functions at 9 SZAs along the PP. The results clearly demonstrate that different kernel functions exhibit distinct response patterns with changing angular configurations. Increasing SZA markedly enhances the anisotropic characteristics across all kernels. The RT kernel represents a bowl-shaped scattering feature, enhancing in both forward and backward directions with increasing SZA. The LSR kernel describes a roof-shaped scattering pattern, decreasing in the forward but increasing in the backward direction. The SNOW kernel highlights a distinctive strong forward-scattering characteristic.
Inputting the multi-angular data, the kernel-driven model can retrieve the optimal values of the four model parameters (i.e., fiso, fvol, fgeo and fsnw) by using the least squares method. This allows us to simulate directional reflectance for arbitrary combinations of illuminating and viewing geometry. In the further calculation of BSA and WSA, since the volumetric (RT) and geometric-optical (LSR) kernels are analytical functions independent of the parameters to be retrieved, their integrals can be precomputed. Once these kernel integrals are precomputed, the albedo values can be efficiently derived as a linear combination of the pre-integrated kernels weighted by their corresponding retrieved weight coefficients. Also, these values can help users quantify the relative contributions of each kernel to the overall albedo [41].
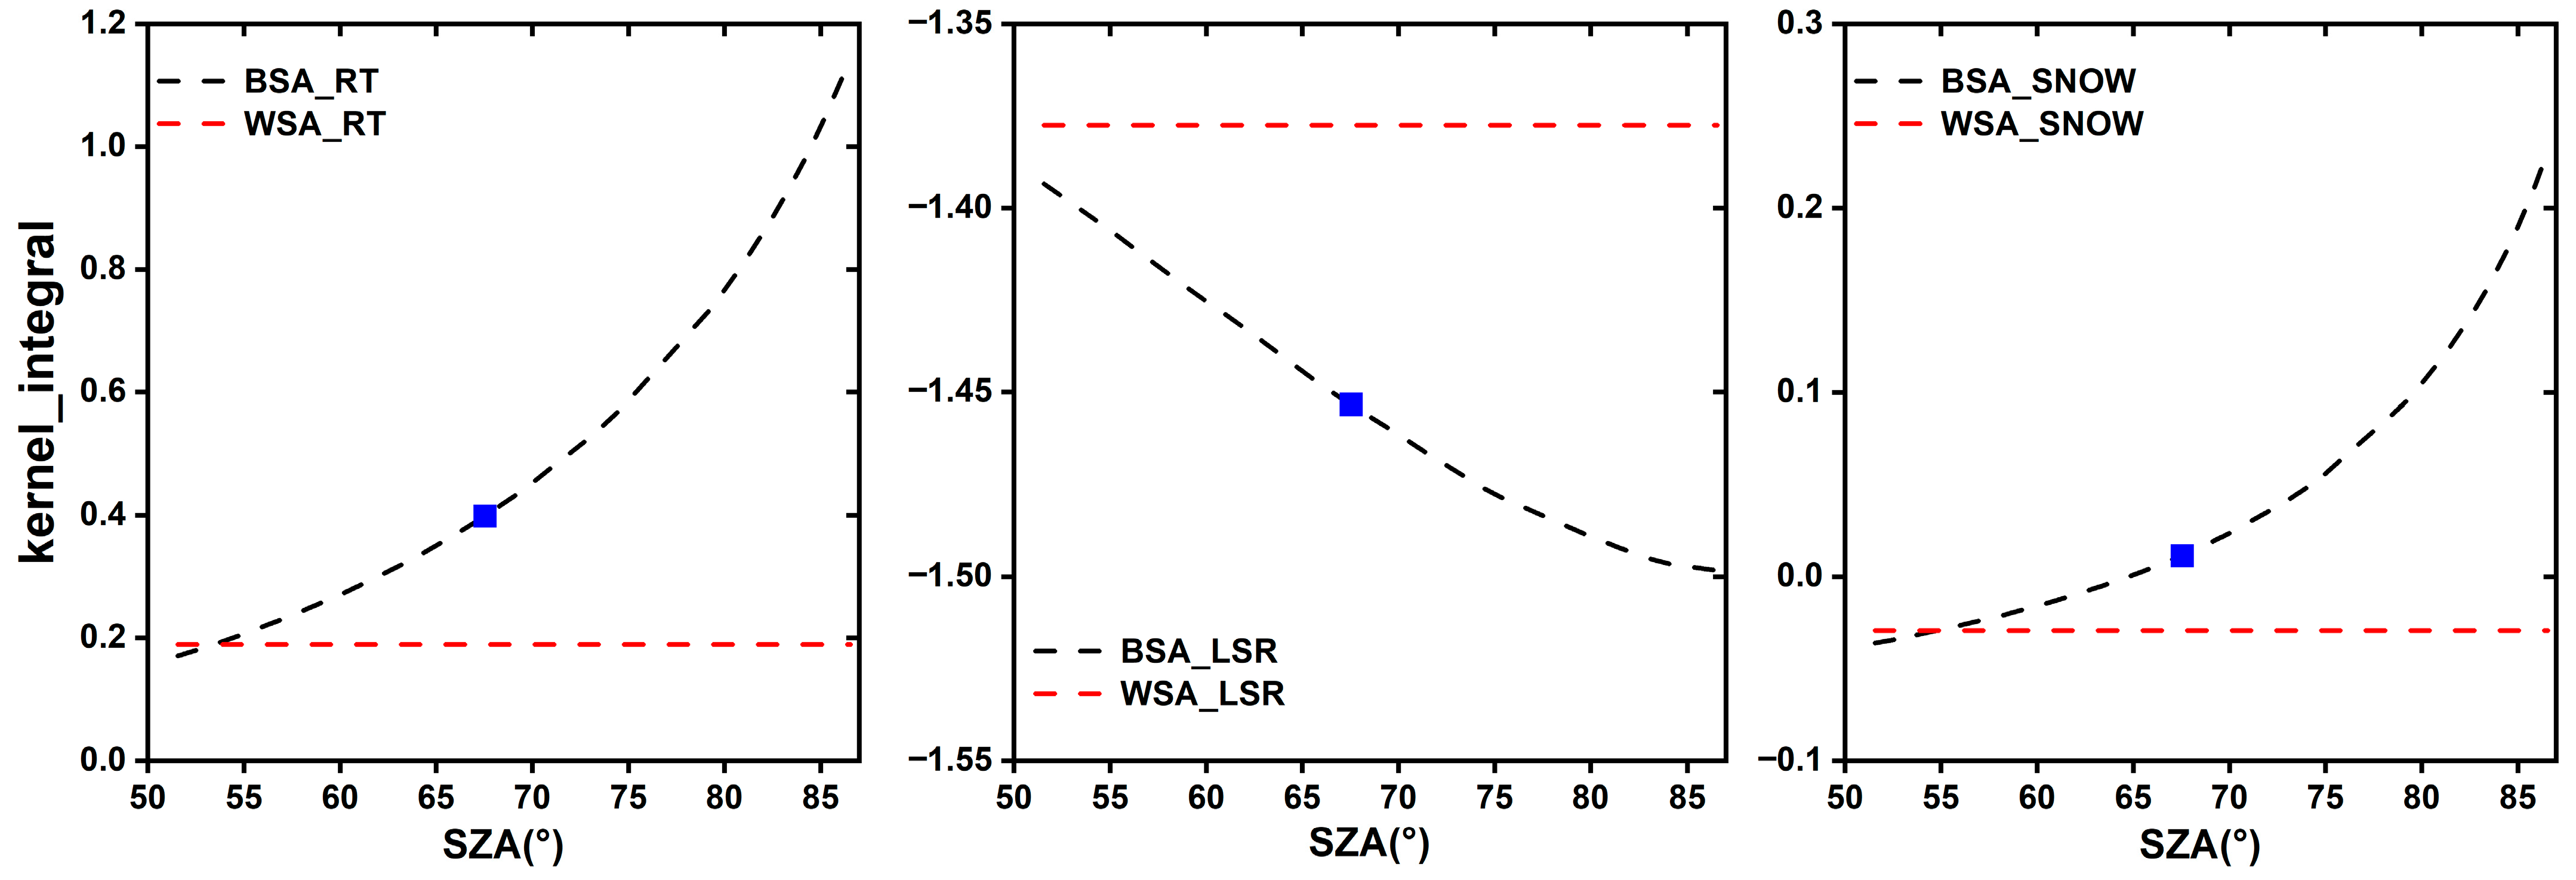
The BSA represents the directional–hemispherical reflectance of a surface under purely direct illumination, quantifying the fraction of incident solar radiation reflected by the surface when the incoming light is restricted to a parallel beam of light, corresponding to an idealized clear-sky situation. Mathematically, BSA is defined as the hemispherical integration of the BRDF over the entire exitant hemisphere, as in Equation (10) [2]. The sensitivity of the kernel integrals to the SZA differs markedly, as shown in Figure 4. For RT, the integral value increases substantially with larger SZA, with an enhancement of 85.1% at SZA = 86.56° relative to 51.57°. In contrast, the LSR kernel shows the opposite behavior and exhibits minor variation with SZA, with its integral value decreasing by approximately 8% as SZA increases from 51.7° to 86.56°. The SNOW kernel integral exhibits a positive correlation with the SZA, indicating that the integral systematically increases with larger SZAs.
BSA θ i , λ = R ( θ i , φ , 2 π , λ ) = 0 2 π 0 π / 2 R θ i , θ v , φ , λ cos θ v sin θ v d θ v d φ
In contrast, WSA corresponds to the bi-hemispherical reflectance of a surface under pure diffuse isotropic incident radiation, where incoming radiation is uniformly distributed across all directions in the hemisphere, corresponding to overcast sky conditions (e.g., sky is covered by a thick cloud or aerosol layer) and can be defined as the integral of BRDF over both the incident and exitant hemispheres, as in Equation (11) [42]. The kernel integrals are independent of the SZA, yielding constant values of 0.18919, −1.37757, and −0.02938 for three kernels, respectively.
WSA λ = R ( 2 π , 2 π , λ ) = 1 π 0 2 π 0 π / 2 BSA ( θ i , λ ) sin θ i cos θ i d θ i

3.3. Angular Information Index (AII)

Based on the above description of the kernel-driven model, it can be expressed in a matrix form as follows:
R n × 1   =   F 4 × 1 K n × 4   +   E n × 1
R represents the reflectance values in n different viewing and illuminating geometries; K, F, and E denote the kernel matrix, the kernel coefficients matrix, and the observation noise matrix, respectively. The analytical solution for the kernel coefficients is obtained using the least squares method as follows:
F 4 × 1 = ( K T C E 1 K ) 1 K T C E 1 M
KT is the transpose of the kernel value matrix, CE represents the covariance matrix of the observation errors, and M denotes the measurements vector. Assuming that the observational noise is independently distributed with equal variance σ2, the solution for the kernel coefficients can be simplified as follows:
F 4 × 1   =   ( K T K ) 1 K T M
And its covariance matrix (CF) can be expressed as follows:
C F   =   ( K T K ) 1 σ 2
The information content can be characterized by the inverse of the CF:
C F 1   =   K T K σ 2
The KTK can be composed as follows:
K T K   =   G VG
where V represents the eigenvalue diagonal matrix and G is the eigenvectors. Neglecting the error between the observations and retrieval results, an angle-dependent information index I can be defined as follows:
I   = ln λ 1 + ln λ 2 +   ln λ 3 + ln λ 4
where λ1–4 denote the diagonal elements of V.
We further improved this method through two steps:
(1)
Based on the principle that the PP carries the most informative BRDF signals [16,40,43,44], a weighting mechanism was introduced for each observation. Specifically, different weights were assigned according to the varying levels of information effectiveness. The new eigenvalues are denoted as λ1W–4W, then IW can be calculated:
I W = ln λ 1 W + ln λ 2 W + ln λ 3 W + ln λ 4 W
(2)
Cosine similarity was employed to quantify the redundancy between the observations [45].
sim i ,   j = x i · x j x i · x j = k = 1 n x ik · x jk k = 1 n x ik 2 ·   k = 1 n x jk 2
R info = k = 1 n sim n   ×   n
where i and j represent different observations, and n represents the total number of observations. By calculating the cosine similarity between each observation and all others, the information redundancy Rinfo is quantified. Finally, the improved angular information content (AICi) can be calculated:
AIC i   =   I W   ×   ( 1 R info )
To reduce the disparity in magnitude during the analysis, we performed a logarithmic transformation on the AICi, which ultimately yielded the angular information index (AII).
AII = log AIC i
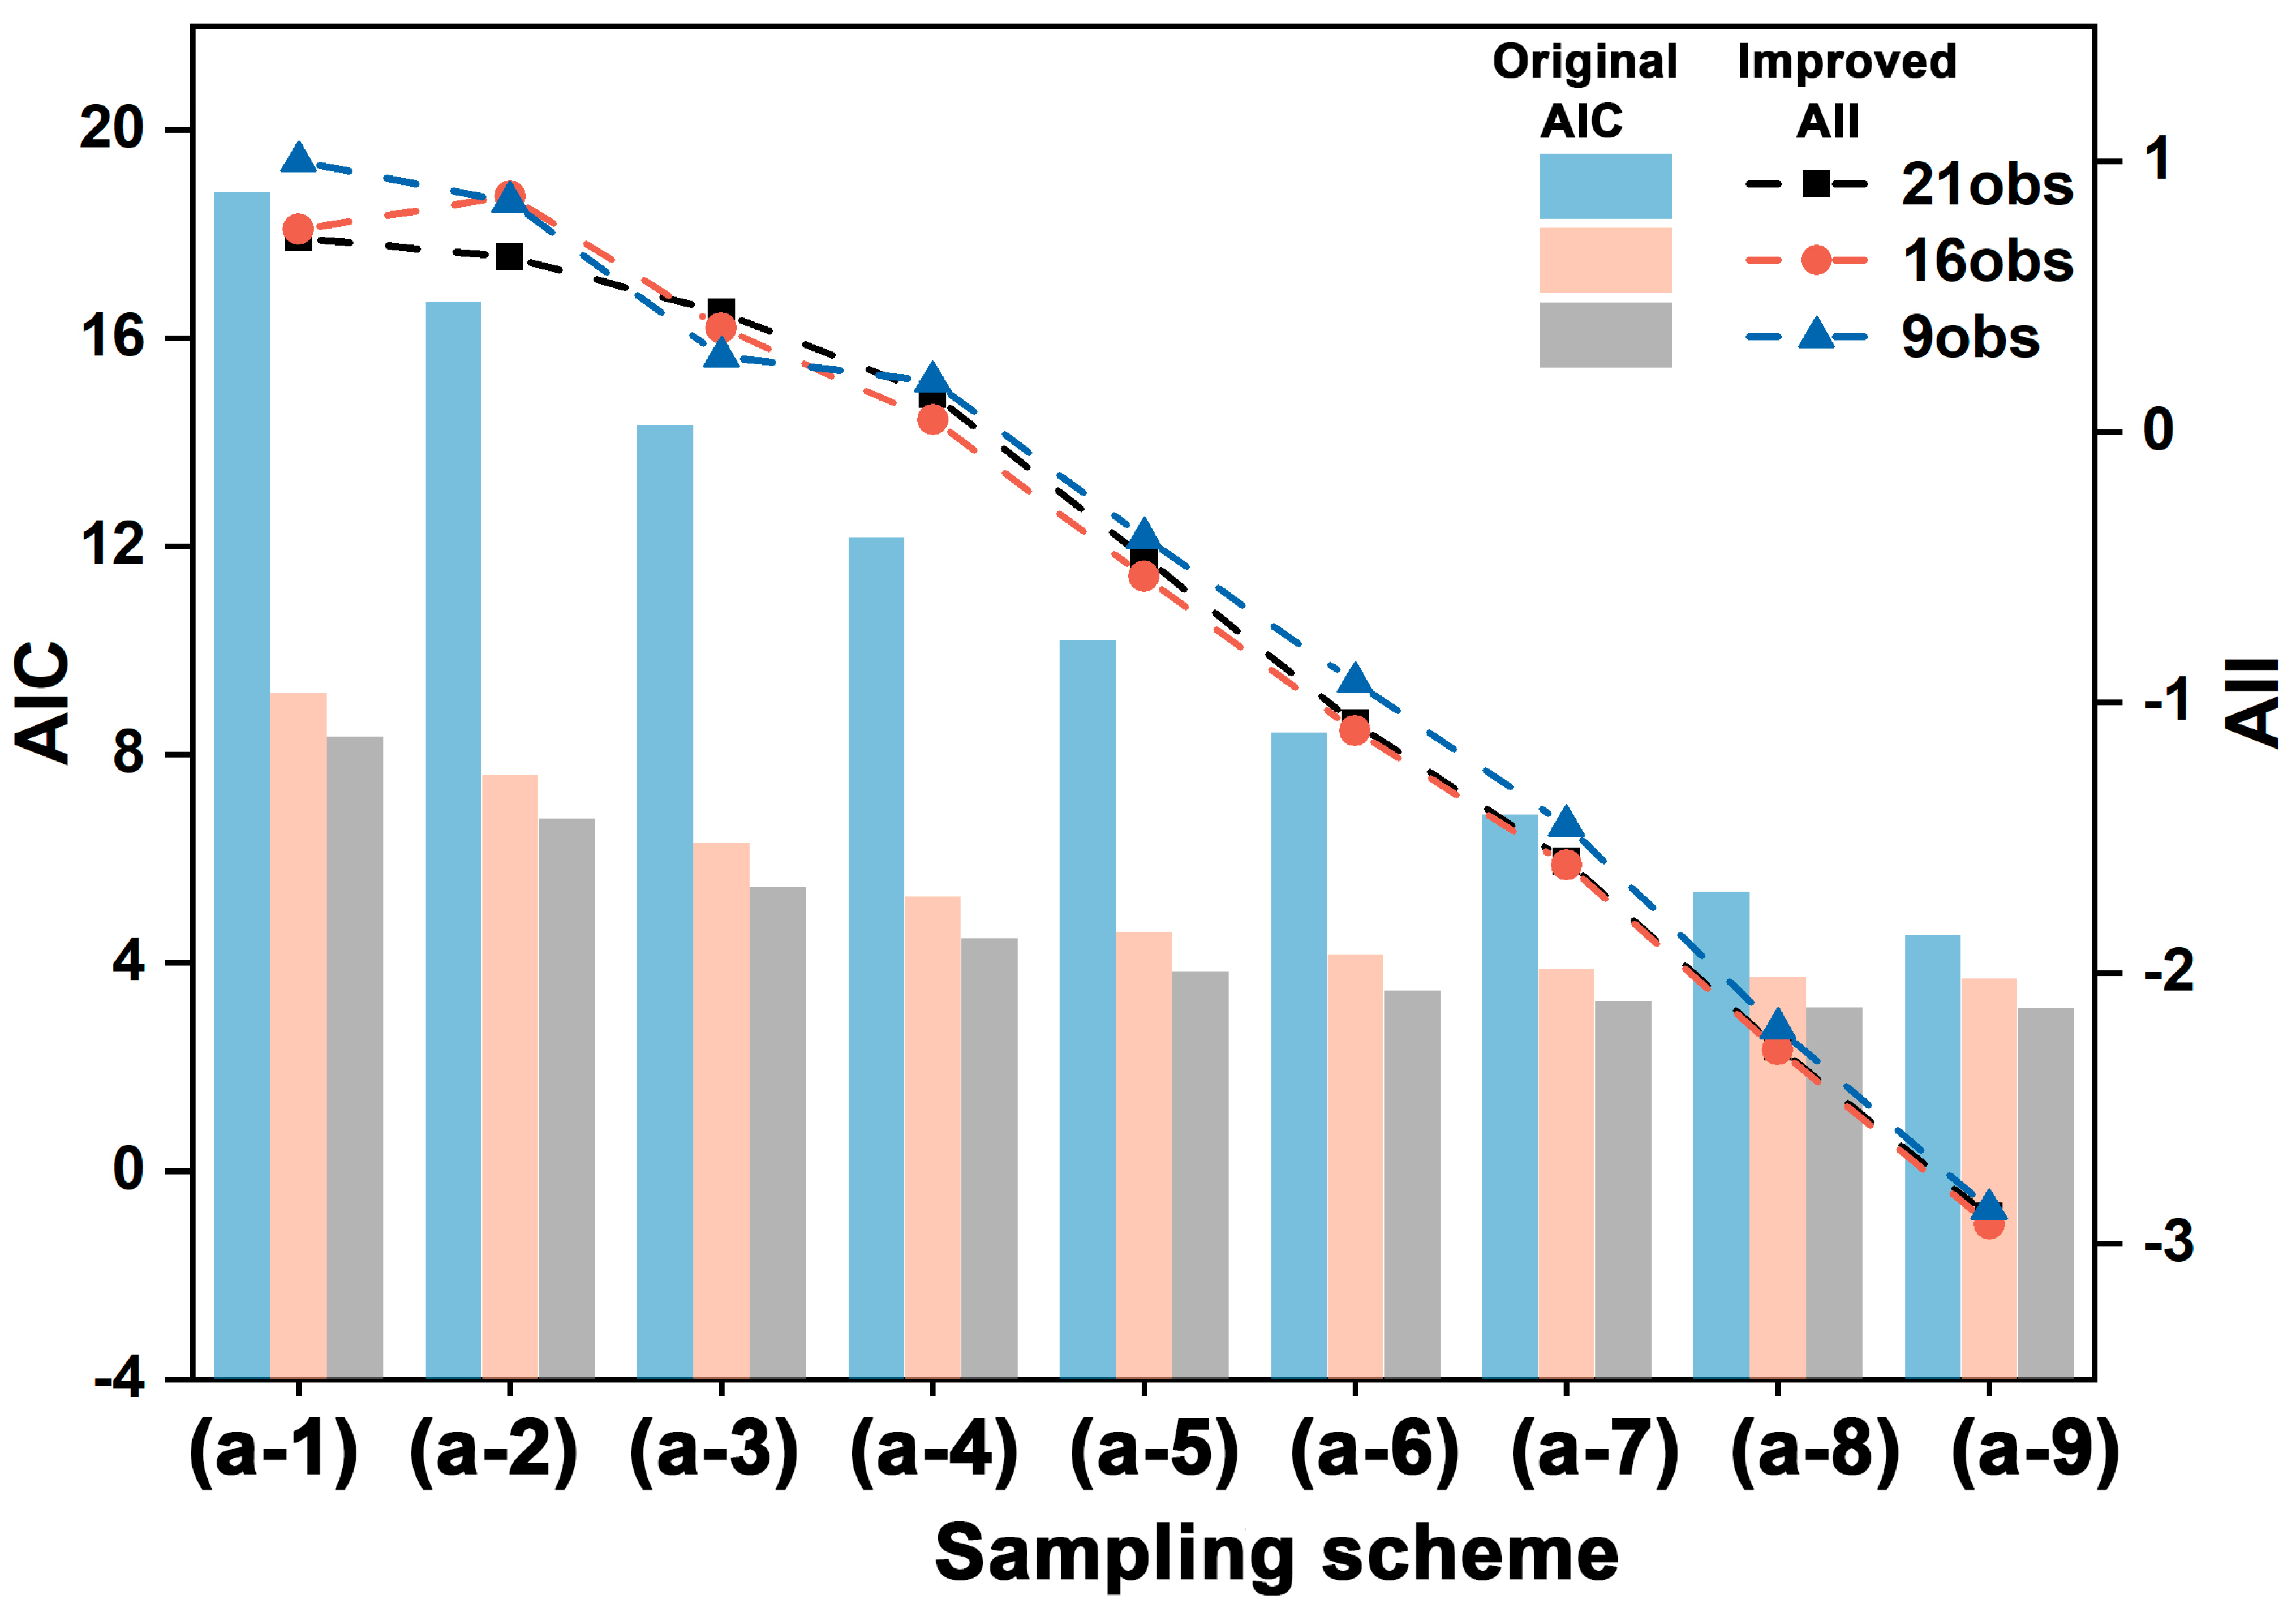
The AII is formulated according to a snow-specific BRDF model and explicitly incorporates the anisotropic scattering characteristics of snow; therefore, it can be well suited to snow-covered surfaces. Taking the (a) sampling schemes as an example, Figure 5 illustrates the AIC results proposed in a previous study (bar chart) and the AII (dashed line) corresponding to different numbers of observations of different sampling schemes on the PP. Both the AIC and AII exhibit a downward trend as the VZA ranges decrease, indicating reduced information availability. However, in the AIC method, under identical illumination and viewing geometry, the number of observations largely determines the AIC; i.e., the AIC values systematically increase with increasing number of observations. As a result, some schemes with a large number of observations (e.g., (a-6)) may provide more information than sampling schemes with larger VZA coverage but fewer observations (e.g., (a-1)). On the other hand, the AIC becomes less effective at representing the information content variance across different sampling schemes with less observations (nearly constant from (a-4) to (a-9)). However, the anisotropic scattering feature becomes pronounced when VZA > 40° in the forward direction [16], indicating that (a-4) and (a-5) can provide more angular information than (a-9), at least theoretically. In contrast, the AII is devised to quantify the marginal information contributed by additional observations rather than their sheer number. By weighting azimuthal sensitivity and penalizing angular redundancy, it determines whether extra observations can supply additional informative content; if a new observation is located highly similarly to existing ones, its contribution is strongly discounted and the AII changes little.

4. Results and Analysis

4.1. The AII of Different Sampling Schemes

In light of the results above, nine observations were uniformly retained for each sampling scheme in the subsequent analysis. We firstly calculated the AII values for all the sampling schemes used in this study, as shown in Figure 6. The figures from top to bottom correspond to sampling schemes (a), (b), and (c), respectively. For scheme (a), the AII values decrease significantly as the VZA range progressively reduces; also, the deviation of RAA can lead to a loss of angular information. When the sampling scheme includes a wide VZA range (e.g., (a-1), (a-2), (a-3)), the off-PP schemes can provide richer information than that of PP schemes limited to a smaller VZA range. This phenomenon is consistent with the fact that the anisotropic characteristics of the snow surface is more pronounced at large VZAs [16]. In scheme (b), as the sampling pattern transitions from (b-1) to (b-10), the coverage of the forward-scattering direction progressively decreases and the corresponding AII increases. This result indicates that forward-direction observations contribute greater information gain than those in the backward-scattering direction. Scheme (c) illustrates the impact of SZA variations on the information content, showing an overall trend that AII values increase with larger SZAs under four RAAs. This can be attributed to two factors: first, the anisotropic characteristics of the snow are more pronounced under larger SZAs [37]; second, due to the reciprocal of the BRDF model, the observations at large SZAs are to some extent equivalent to those at high VZAs, resulting in additional angular information gain.
Mathematically, although the KTK (defined as Equation (13)) corresponding to all sampling schemes in this study are invertible, the instability in the retrieval results for certain schemes indicates ill-posed inversions [46], implying that the solutions are highly sensitive to perturbations and may lack numerical robustness. Therefore, we used the condition number of the matrix as a criterion to determine the AII threshold. In practice, we found that, when the condition number of the KTK becomes excessively large (on the order of 1.0 × 10⁸), the ill-posed inversion problems could happen. The corresponding AII value under this condition is approximately −2; therefore, we set AII > −2 as the threshold for determining the applicability of angular sampling schemes. According to this threshold, when the maximum VZA decreases to 10°, sampling configurations under 4 RAAs yield ill-posed inversions, indicating that the angular information is insufficient for reliable retrievals. In addition, when observations are sampled along the CPP direction, the results become unreliable when the maximum VZA is limited to 50° ((a-4) to (a-9)).

4.2. The BRDF and Albedo Difference Analysis for Scheme (a) and Scheme (b)

4.2.1. The BRDF Difference

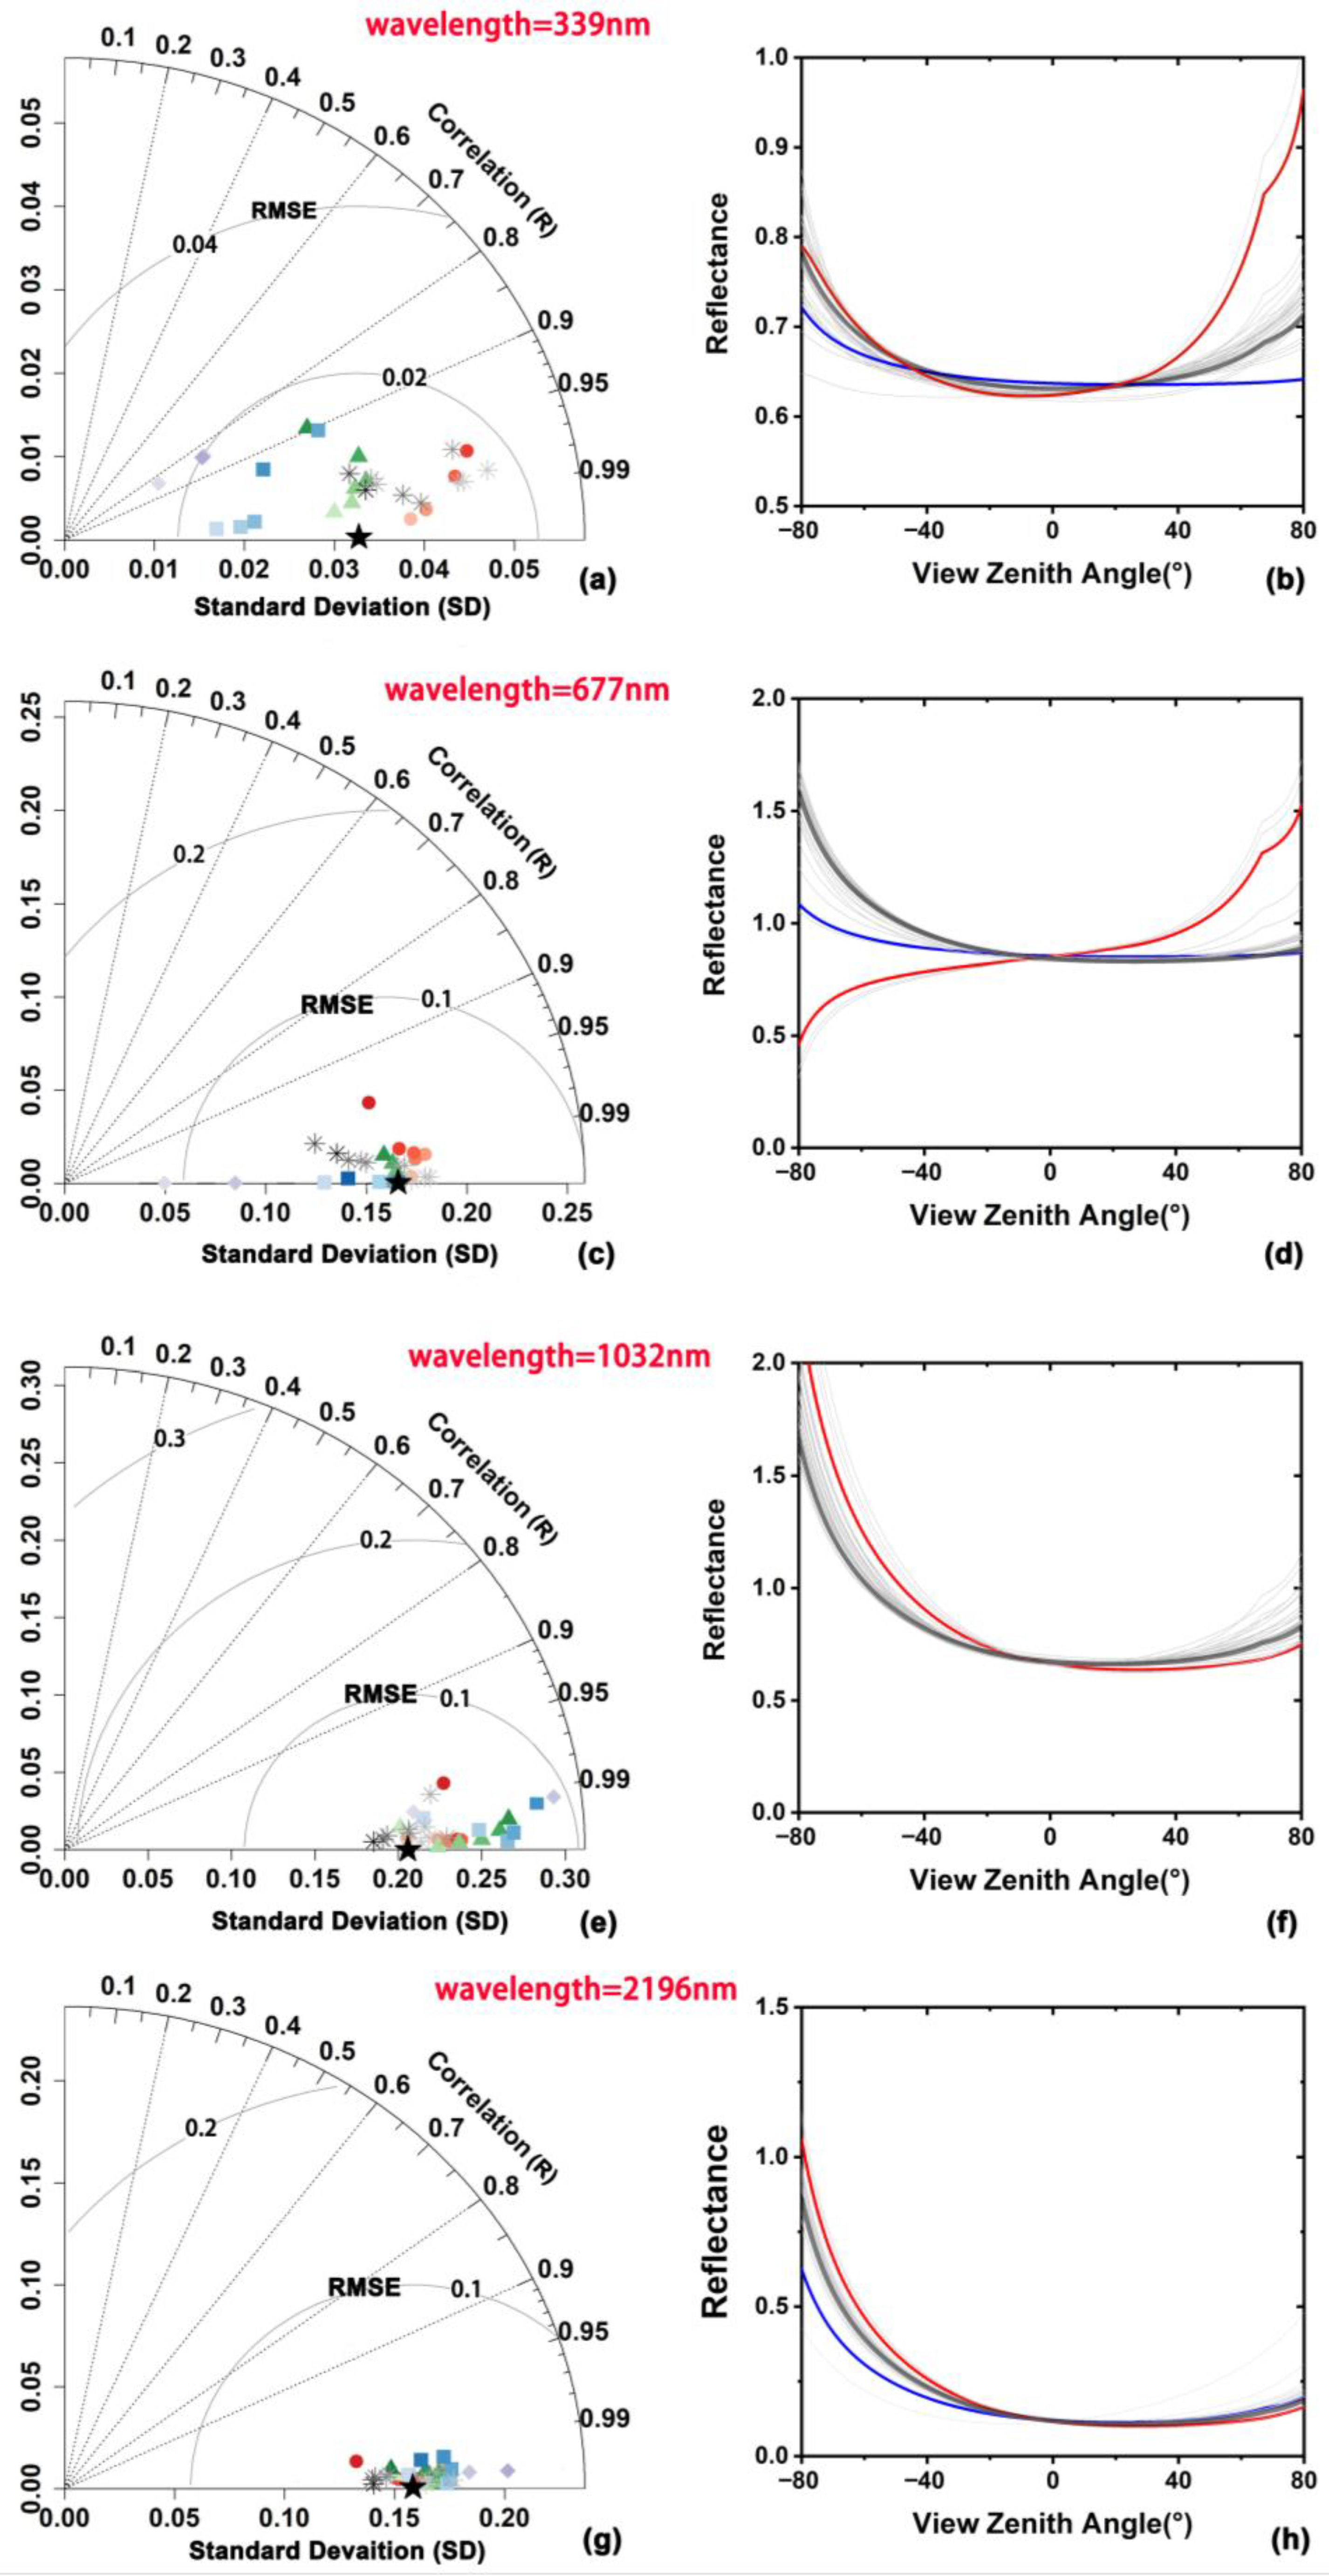
The BRDF reconstructed from the standard dataset (all observations in CAR dataset) was regarded as the reference, against which the BRDFs were reconstructed spectrally under different sampling schemes. Figure 7 provides a comprehensive comparison of the differences between each reconstructed BRDF and the standard BRDF, along with their corresponding BRDF curves in PP. The first column of the figure presents Taylor diagrams, where the black star denotes the reference value, and the various colored markers represent the results of different angular sampling schemes. In general, most angular sampling schemes demonstrate a high level of agreement with the standard BRDF, with R exceeding 0.9. This result suggests that these schemes can largely reproduce the shape of the BRDF, and successfully capture the strong forward-scattering characteristics of snow. However, inevitable RMSEs indicate discrepancies in scattering intensity, whereas SDs reflect the distortion or shift of the scattering characteristics.
Specifically, at shorter wavelengths (339 nm and 677 nm), the BRDF curves of the snow surface are relatively flat, but the peak reflectance still located in the forward-scattering direction. Nonetheless, some angular sampling schemes tend to amplify backward-scattering features, causing a shift in the peak reflectance toward the backward-scattering direction. Consequently, two types of typical BRDF patterns that are different from the standard BRDF are obtained: (1) The first type of BRDF exhibits enhanced scattering features in both forward- and backward-scattering directions, compared with the standard BRDF shown as a red line in Figure 7b. In some extreme cases, the forward-scattering characteristics are even reversed. In such angular sampling schemes, the model is exaggeratedly sensitive to directional variations, amplifying the anisotropic features, especially for the schemes with smaller VZA ranges, resulting in a higher SD value than the reference value. (2) The second type of BRDF shows an overall weakening of anisotropic features, with both forward- and backward-scattering intensities reduced. The reconstructed BRDF curves are flatter, with SD values lower than the reference value. In addition, for the (a) schemes, when observations are located on the PP only, the reconstructed BRDF tends to be slightly overestimated in the forward direction. Within the same VZA range, as the observations deviate from the PP, the forward scattering becomes weaker, approaching isotropy when to CPP. At longer wavelengths (1032 nm and 2196 nm), the anisotropic features become more pronounced. The differences introduced by angular sampling schemes exhibit a similar amplified effect, with the SD values of the reconstructed BRDFs almost exceeding the standard values, and both forward- and backward-scattering intensity are enhanced; i.e., constraining the VZA range biases the retrieval toward stronger anisotropy. Notably, unlike the shortwave conditions, when the observations deviate from the PP, stronger forward scattering is reproduced at longer wavelengths. Moreover, the results of the (b) schemes indicate that more observations in the forward direction generally led to an overestimation of the forward-scattering intensity; similarly, when the backward-direction observations dominate in the angular scheme, the backward scattering is likewise overestimated.

4.2.2. The Albedo Difference

We further calculated the BSA and WSA of different angular sampling schemes and calculated the relative difference compared with the reference values, as shown in Figure 8. Clearly, as the wavelength increases, the differences in albedo induced by varying angular configurations become more pronounced for these four bands, which is consistently observed for both BSA and WSA. At shorter wavelengths (339 nm and 677 nm), the relative difference in BSA across different sampling schemes remains mostly below 5%. By contrast, at longer wavelengths (1032 nm and 2196 nm), especially for 2196 nm, the relative difference frequently exceeds 10% and can do so by up to 30%, highlighting the increasing sensitivity of the BSA to angular sampling configurations as wavelength increases. Under identical SZA and VZA configurations, the albedo differences caused by deviations from the PP are relatively small, particularly in the calculation of WSA, where such differences become even less pronounced. Moreover, the BSA/WSA have no significant differences in varied VZA coverage at specific azimuthal directions. For (b) schemes, pronounced relative difference variations are evident at 339 nm and 2196 nm, with the latter showing relative differences greater than 5% for all sampling schemes in BSA results. For both WSA and BSA, the results at the red and near-infrared bands (677 nm and 1032 nm) tend to be more stable across different sampling schemes, with most relative differences remaining within the acceptable threshold of 5%.
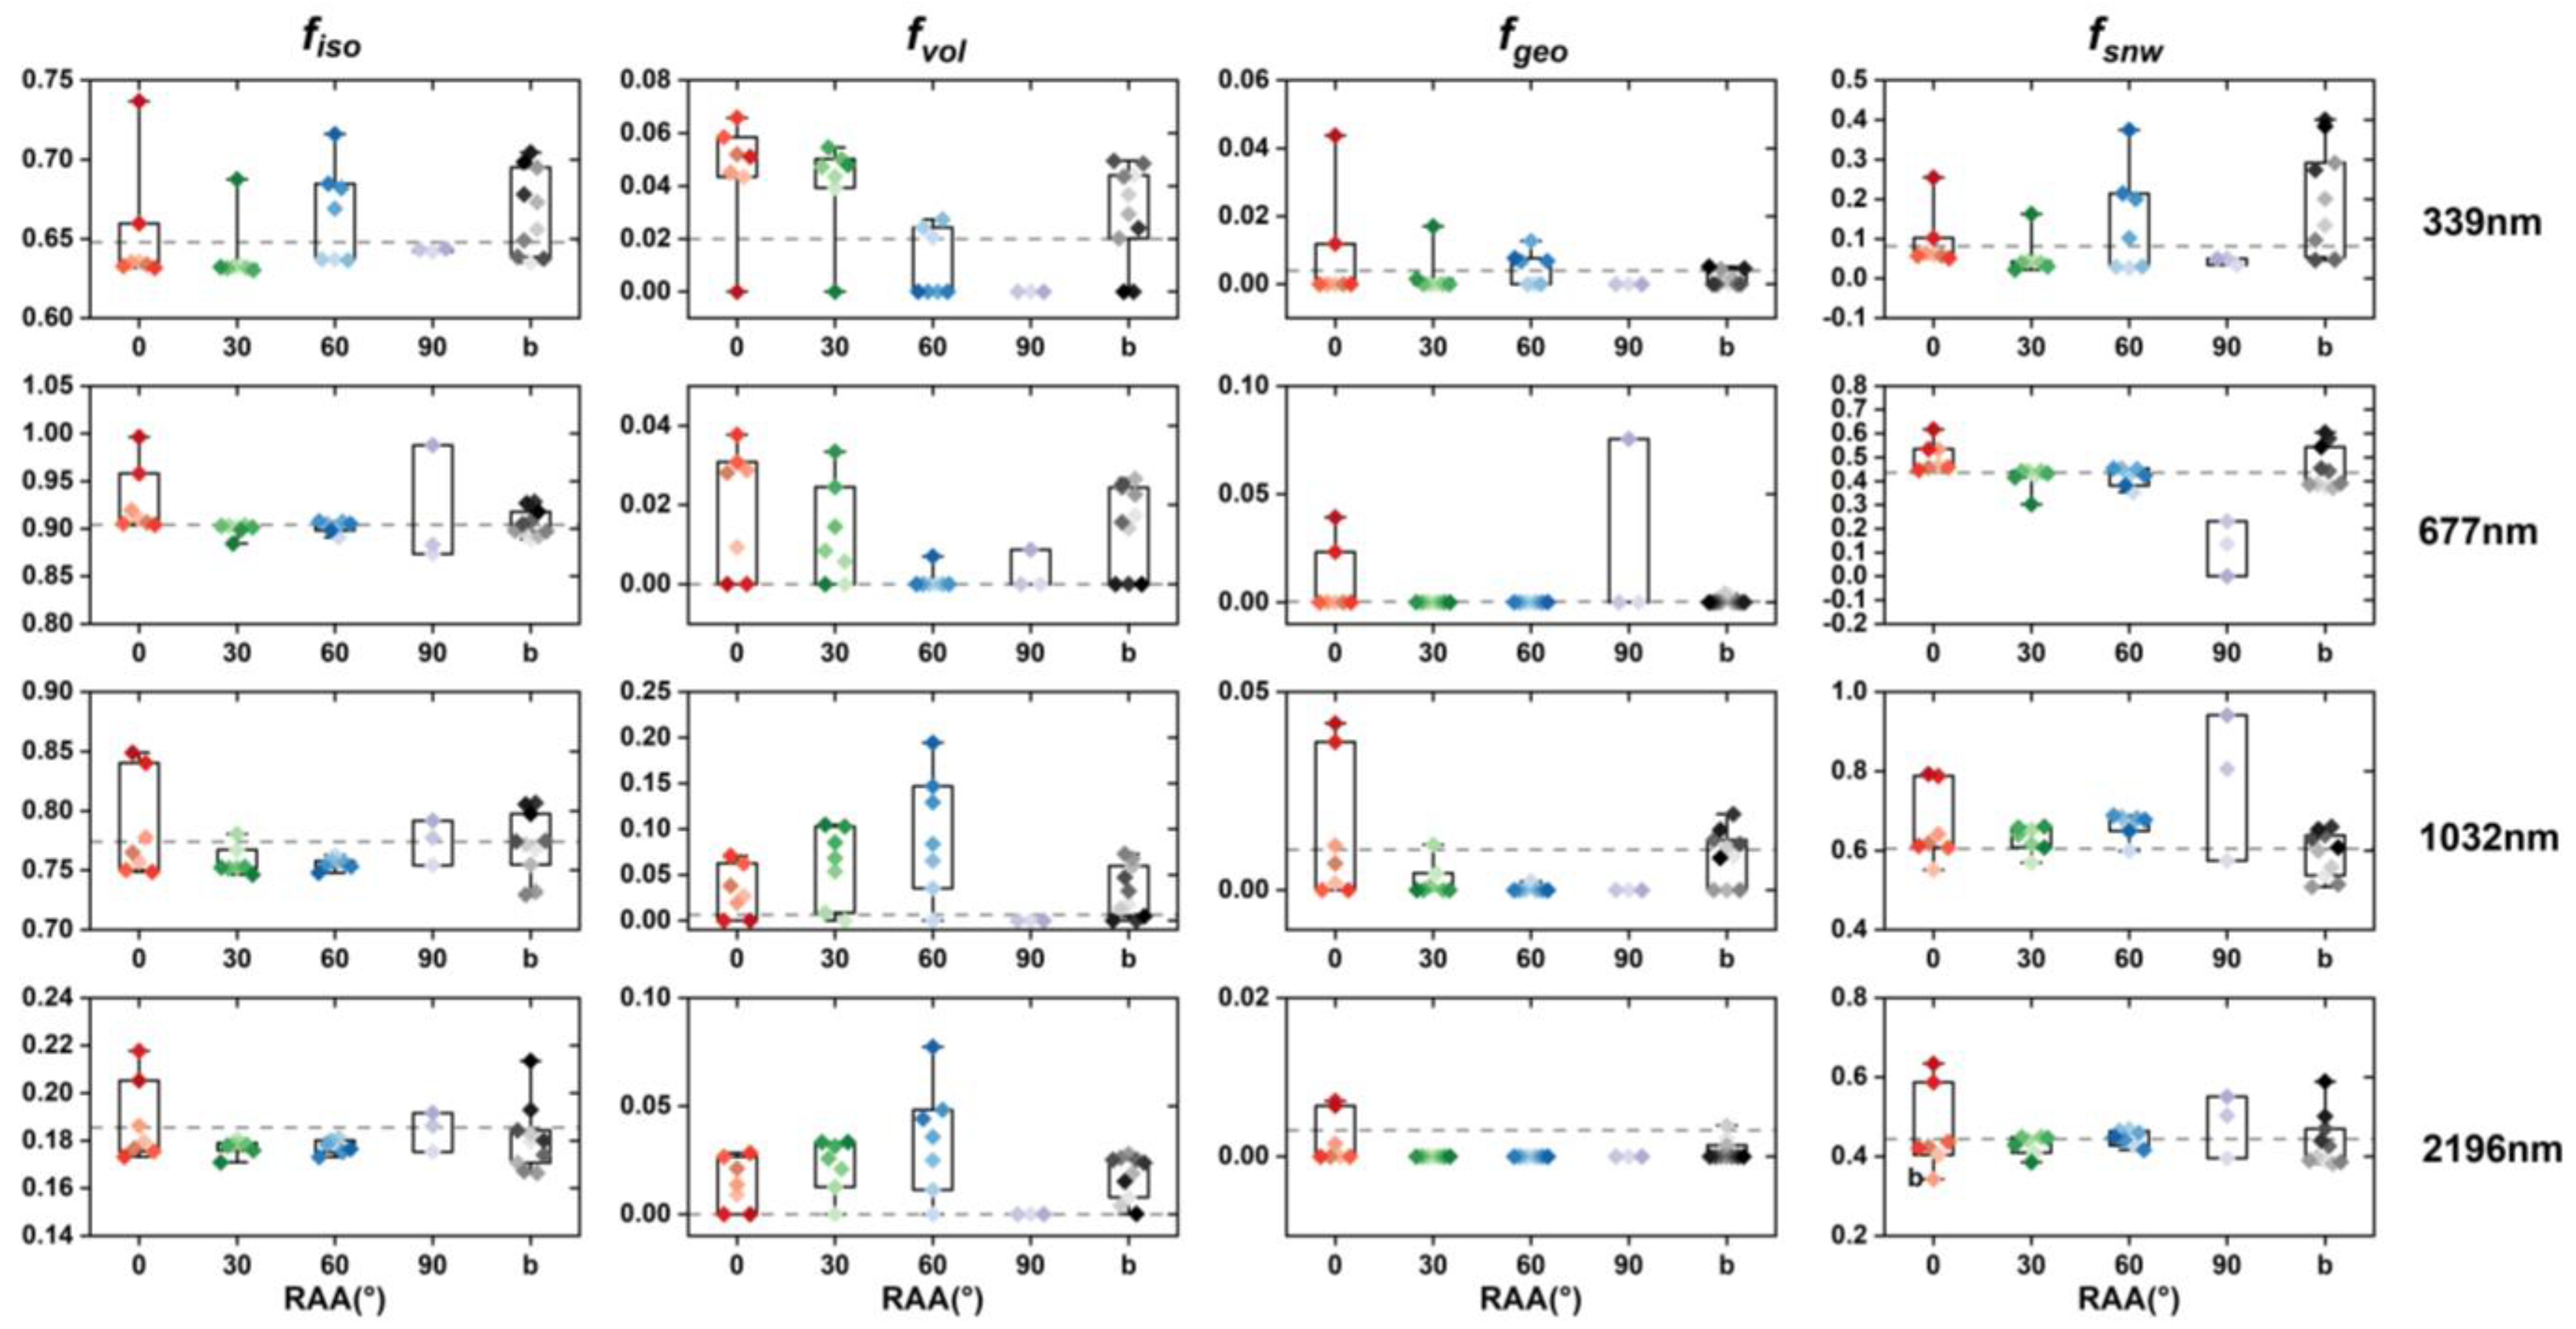
To investigate the sources of discrepancies among the reconstructed BRDF and albedo, we additionally examined the model parameters corresponding to different sampling schemes, as illustrated in Figure 9. Combined with the data in Figure 3, the directional responses of different kernels indicate that the RT kernel can cause variations in both forward- and backward-scattering directions and the LSR kernel also functions at both directions, particularly at large VZAs, whereas the SNOW kernel primarily affects the forward direction. The isotropic term (fiso) represents the non-directional component of surface reflectance and serves as the baseline of the BRDF. In almost all schemes, fvol values are generally greater than the reference value, thereby contributing to the intensified forward- and backward-scattering effects. The fgeo are close to zero, indicating a negligible influence of the geometric scattering kernel on snow surface. Although, from a mathematical perspective, the information provided by these sampling schemes is sufficient for BRDF inversion, on the PP, when the observed range decreases to 30° (i.e., (a-6) and (a-7)), it tends to result in a systematic overestimation of fiso and fsnw, thereby reconstructing BRDF curves with more pronounced anisotropic features.
Although the BRDF reconstructed from different sampling schemes exhibits notable discrepancies compared with the standard reference, the corresponding differences in the BSA and WSA mostly remain within an acceptable range (<5%), especially for shorter wavelengths. The WSA results are relatively more stable and reliable than those of the BSA. This may primarily trace to the different contributions of different kernels to the BSA and WSA. Firstly, the isotropic kernel contributes the largest proportion effect BSA and WSA estimation equally. However, the RT contributes less than 5% to the WSA, whereas its contribution to the BSA is approximately twice as large as the integrals of RT shown in Figure 4.

4.3. The BRDF and Albedo Difference Analysis for Scheme (c)

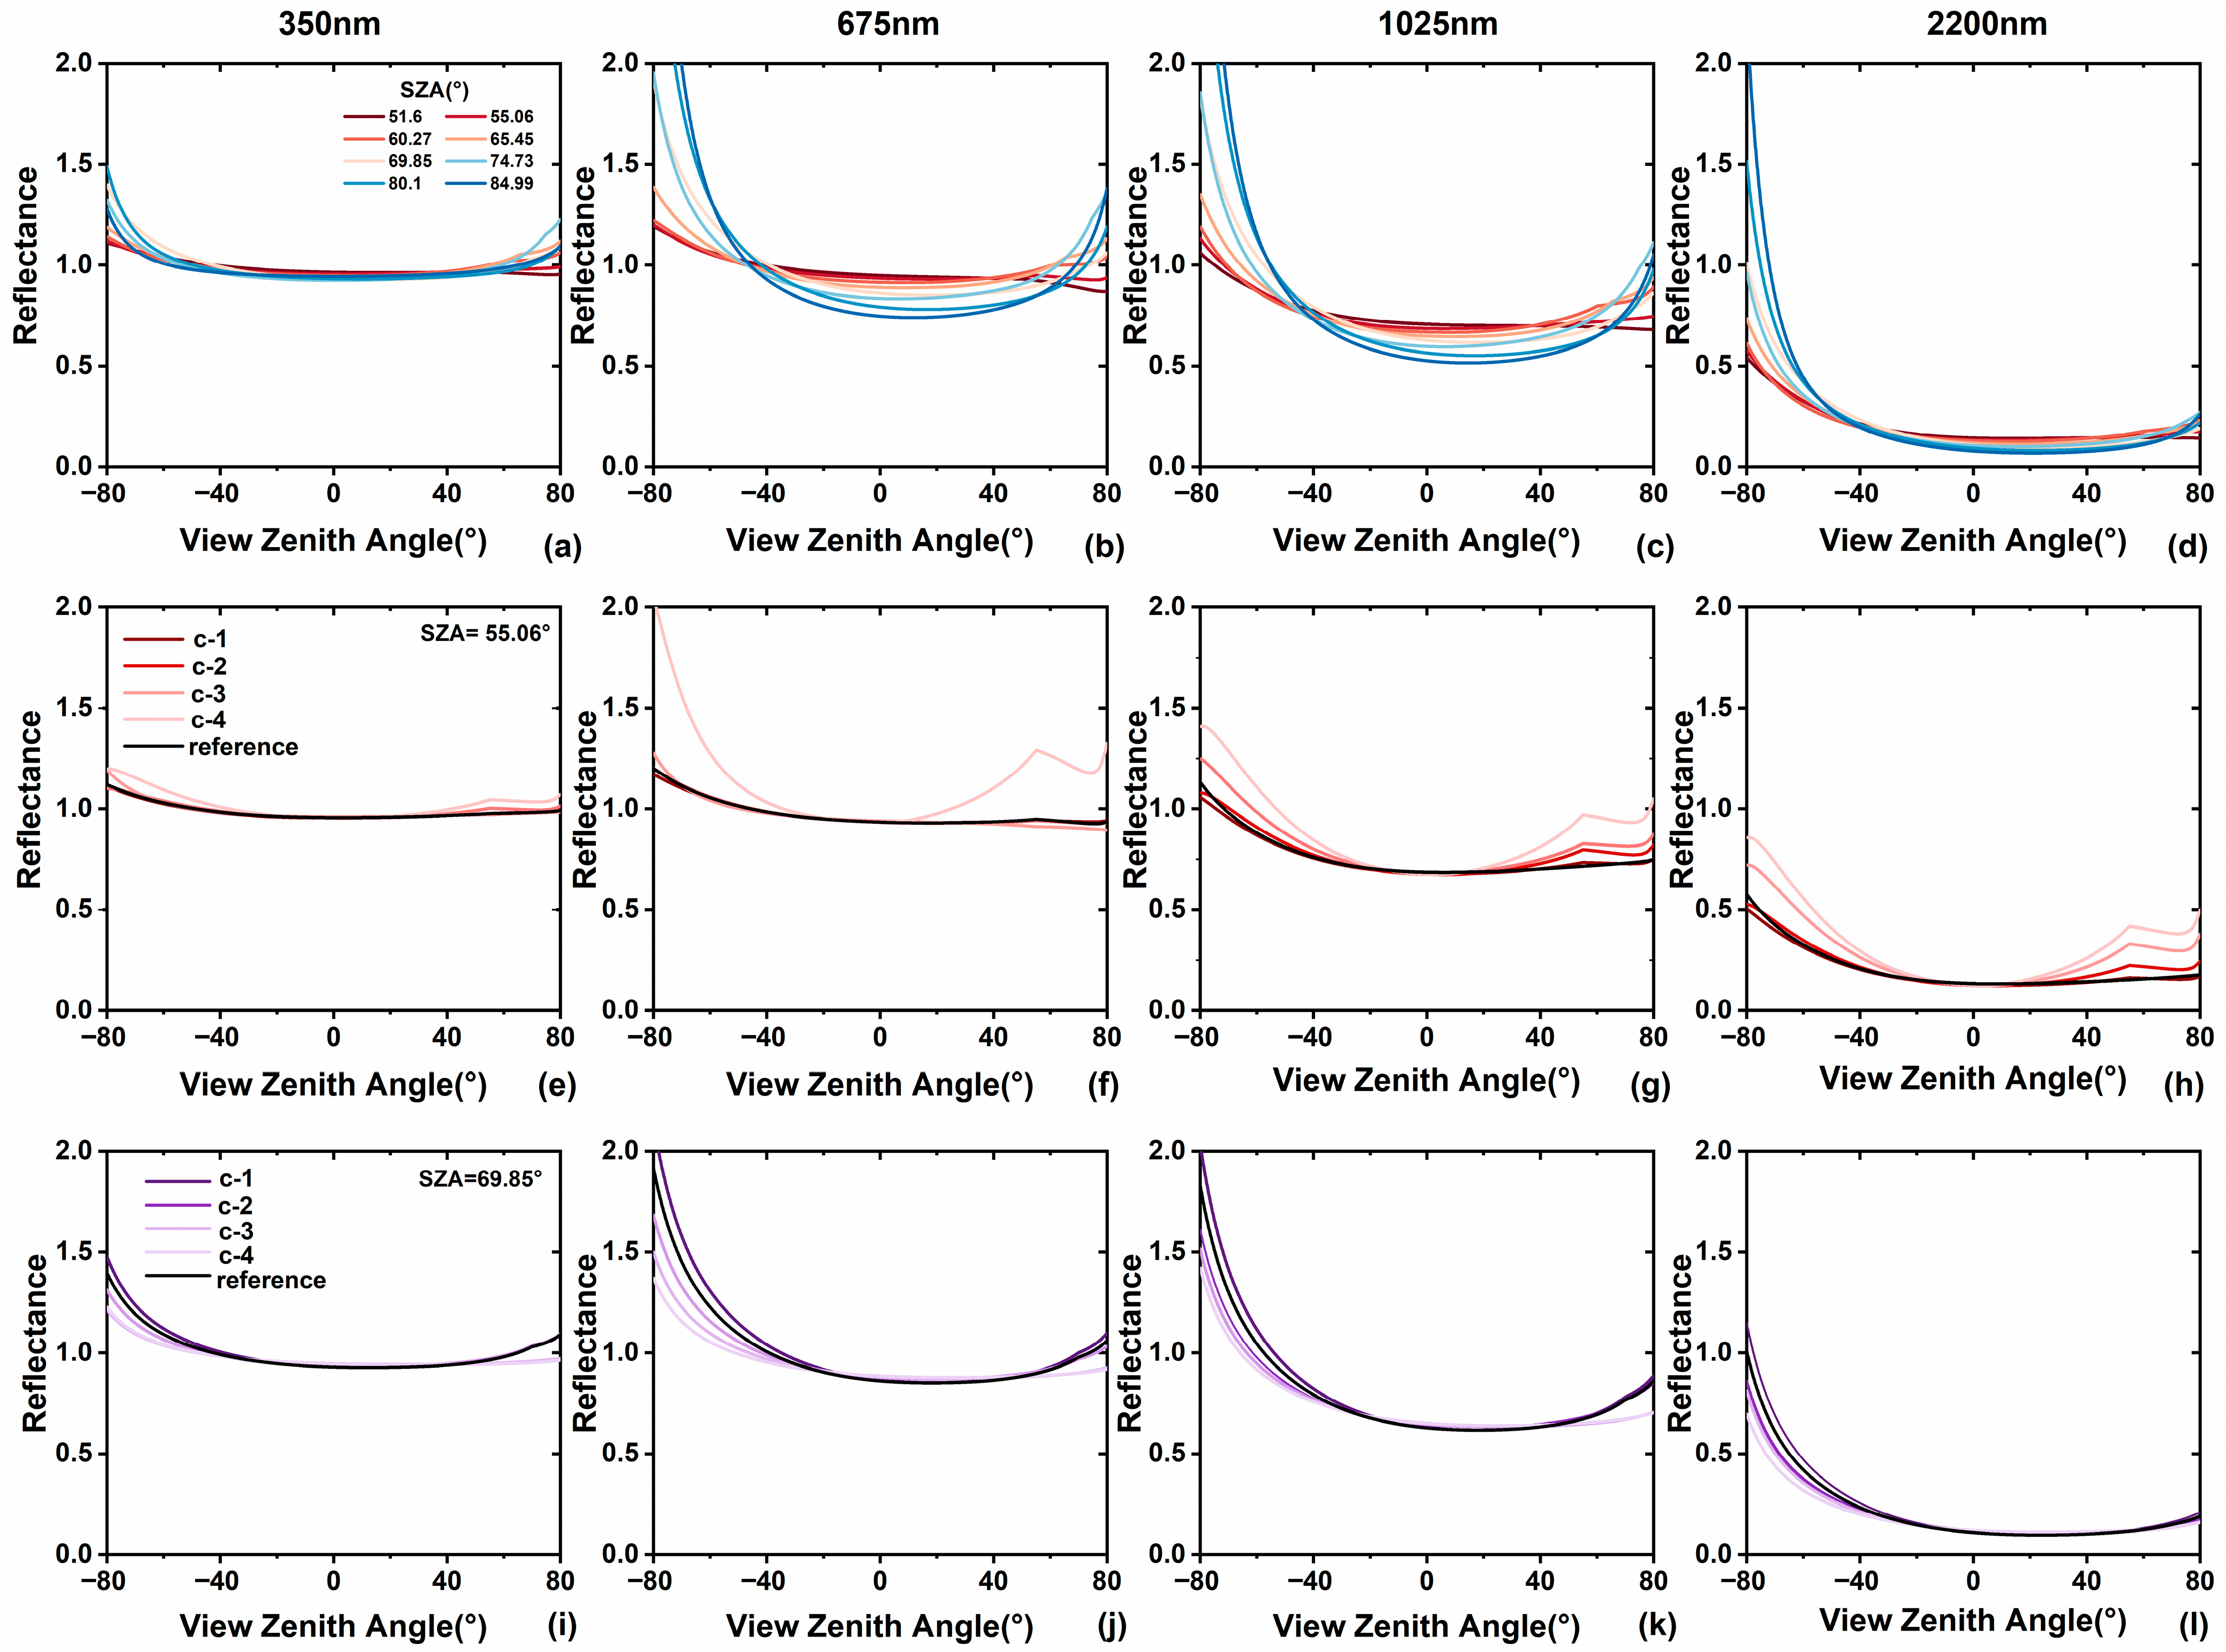
We further investigated the sensitivity of BRDF and albedo to the SZA under identical viewing geometries. Various sampling schemes in scheme (c) maintain a common VZA distribution, with variability introduced via SZA and RAA. Firstly, we reconstructed the BRDF curves on PP by using 53 observations at each SZA to investigate the BRDF difference introduced by SZA. The BRDF curves corresponding to eight SZAs are as shown in Figure 10 (row 1). It is clear that increasing the SZA enhances BRDF features, yielding stronger forward- and backward-scattering intensities and simultaneously lowering the nadir reflectance (VZA = 0°), particularly at longer wavelengths. This is because the larger SZAs effectively lengthen the path of obliquely incident photons interacting with snow grains, favoring multiple scattering and less penetration and absorption and, therefore, reflecting a greater proportion of solar radiation [47]. Additionally, we investigated the discrepancies in BRDF reconstructions ((c-1) to (c-4)) under varying SZA conditions. The results from two representative SZAs (55.05° and 69.85°) are illustrated as examples in Figure 10 (row 2 and 3); we find that, at smaller SZAs, the anisotropic scattering is not that pronounced; therefore, off-PP observations can reproduce stronger scattering anisotropy, with a peak reflectance in the backward direction, where the sun is positioned directly behind the sensor; at larger SZAs, the strong forward scattering gradually weakens as the observations deviate from the PP.
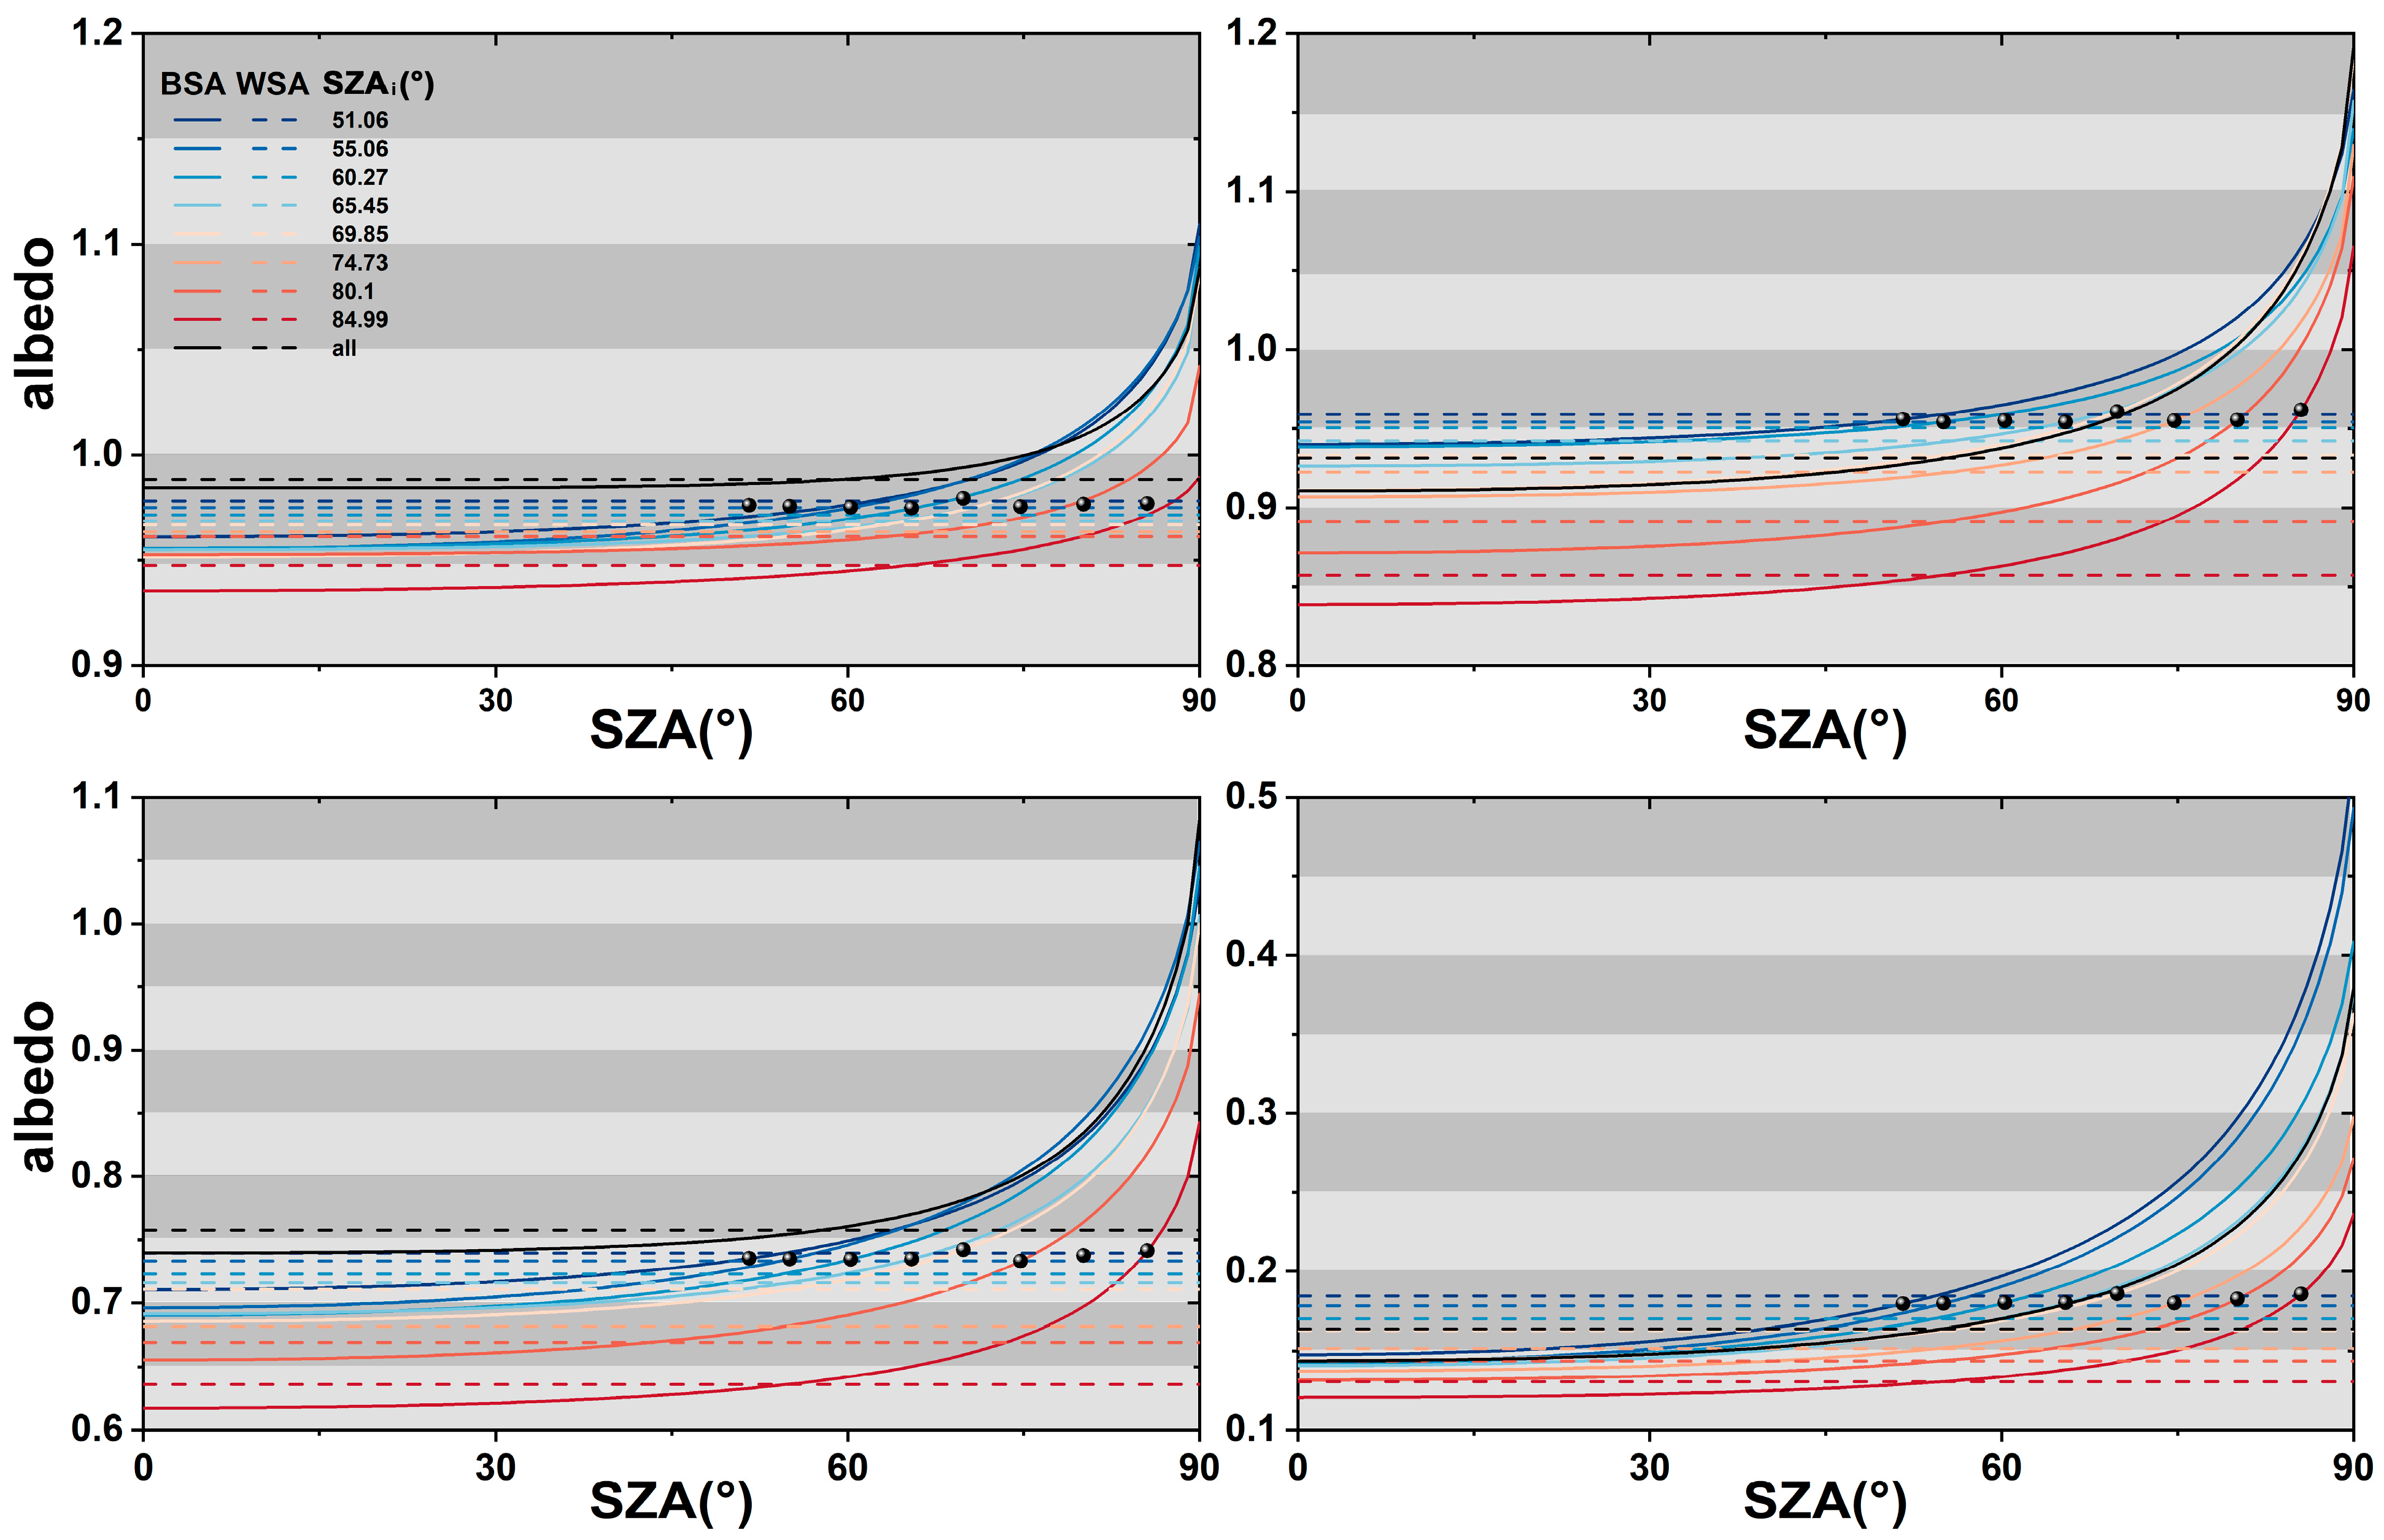
To distinguish the quantities in this analysis, the actual illumination zenith angle is denoted by “SZAi”. Figure 11 shows the BSA of snow relative to the SZA with the associated WSA. We present the results by using (i) the full set of 5088 observations (black lines) and (ii) 53 observations of each SZAi (lines colored from red to blue; 8 SZAis were chosen as examples). Take the results from (i) as examples (black lines), the BSA integrates the BRDF over the observing hemisphere for a given incident angle and increases with increasing SZA, and this increase is far greater in relative reflectance at longer wavelengths, specifically at 10.56%, 30.91%, 46.43% and 163.8% between the SZA = 0° and SZA = 90°, respectively. While the WSA is independent of the SZA, since it is an integral value from both the illuminating and observing hemisphere, it is therefore constant at 0.9884, 0.9314, 0.7576 and 0.1638 at the four bands along the SZA series (dashed lines).
However, although WSA is theoretically invariant with respect to SZA, the WSA retrieved by using observations at varying SZAis shows substantial difference across different wavelengths; a larger SZAi yields lower WSA, and the difference becomes more pronounced at longer wavelengths, specifically at 3.13%, 10.61%, 13.99% and 29.24% between SZAi = 51.57° and 86.56°. In the three shorter wavelength bands (350 nm, 675 nm and 1025 nm), a 5° variation in SZAi induces a WSA change of less than 5% and less than 10% at 2200 nm. The BSA-SZA variation curve derived from different SZAis shows the same trend, increasing with increasing SZA but with relatively lower values. The reason why both WSA and BSA from larger SZAis decreased can be attributed to the kernel weight parameter of the isotropic scattering kernel fiso, which contributes most to WSA decreases for lower sun. Therefore, extrapolating from observations at small SZAis to larger SZAs yields positively biased (overestimated) BSAs; conversely, extrapolating from large SZAis to smaller SZAs yields negatively biased (underestimated) BSAs. For each SZAi, the BSA at the corresponding incidence was marked as a black sphere and these values are relatively stable over the SZA series from 51.57° to 86.56°. This also can be attributed to the variation in retrieved parameters; the BSA loss introduced by the isotropic component can be compensated for by the RT and SNOW kernels, producing small net differences.
In summary, both WSA and BSA exhibit pronounced differences under varying illumination conditions, which in turn affect the estimation of actual albedo. Consequently, accounting for the actual illumination geometry is indispensable when calculating albedo with BRDF models.
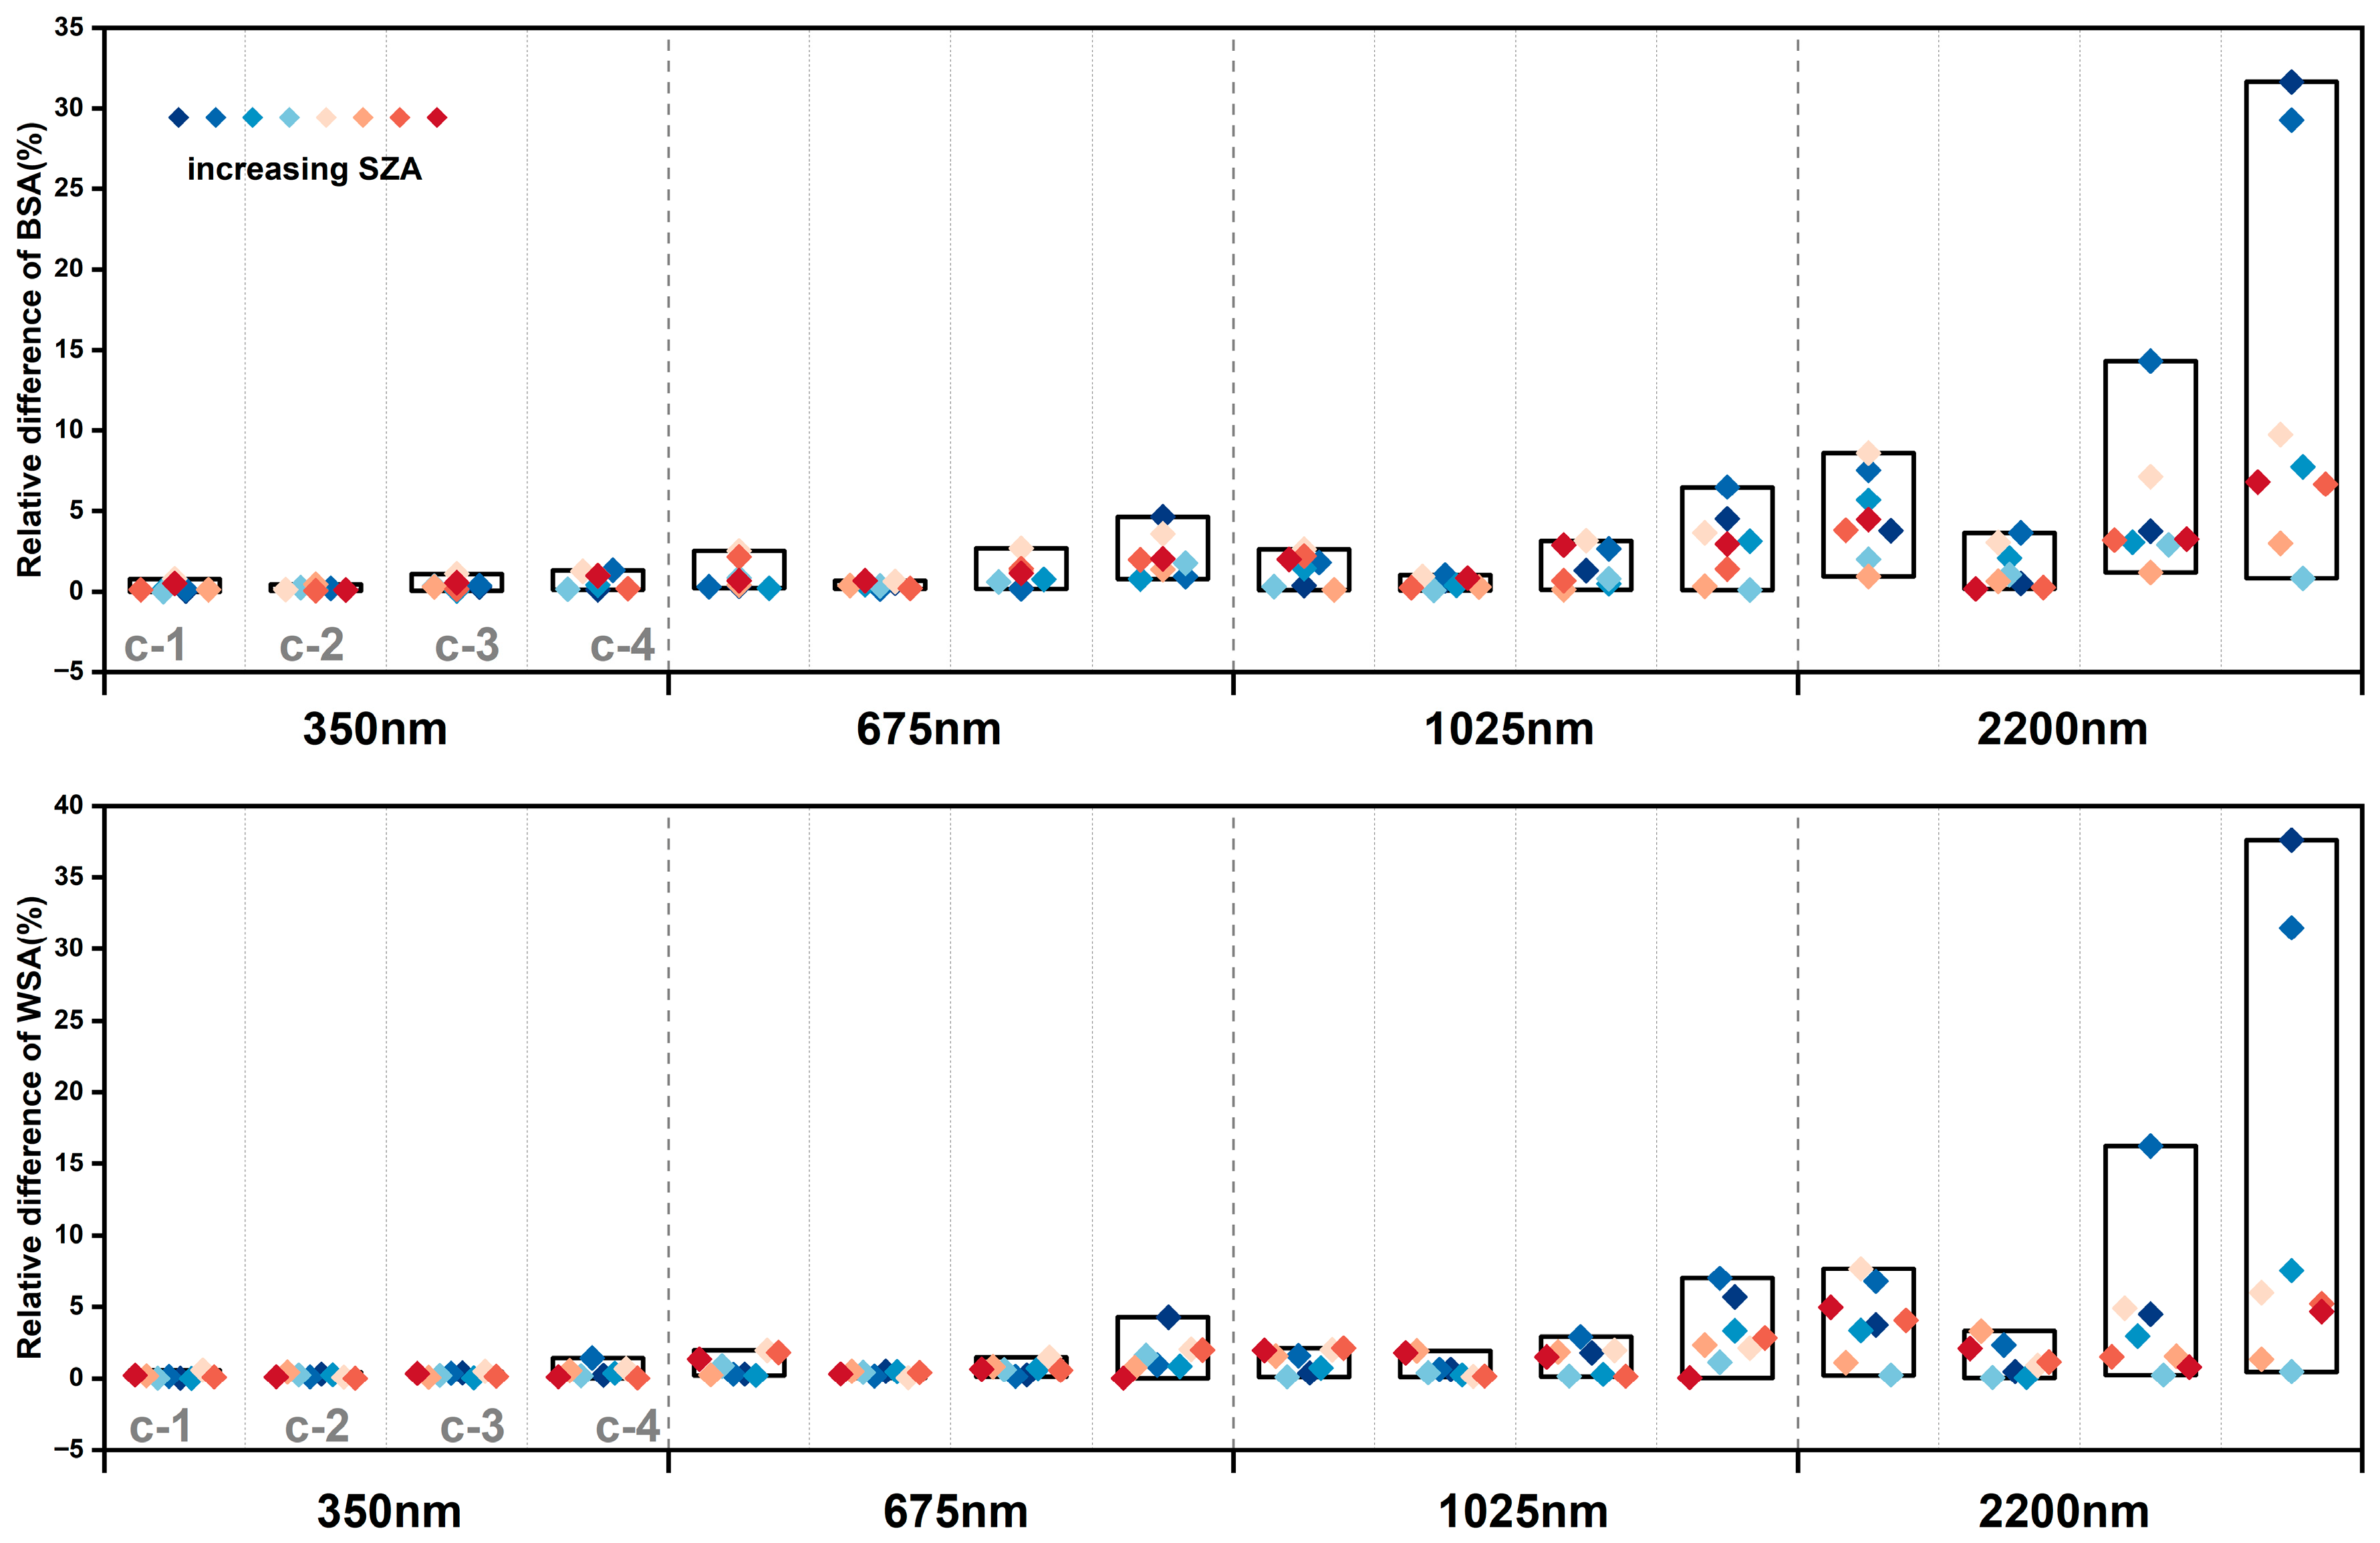
We further examined how different observing-distribution patterns affect albedo across different SZAs, as shown in Figure 12. Using the result derived from 53 observations as the reference, we calculated the relative differences of the scheme (c) sampling distribution with respect to this baseline. Consistent with the result in Section 4.2, at shorter wavelengths (350, 675 and 1025 nm), the variations in both WSA and BSA induced by different angular sampling remain small across all SZAs, mostly within 5% even for the RAA up to 75°. By contrast, at 2200 nm the sensitivity increases markedly—particularly when the RAA is offset to 60° and 75°. With small SZAs (<60°), the impact of the sampling scheme becomes substantial, with relative differences in both BSA and WSA exceeding 30%.

5. Conclusions

Based on the airborne CAR and tower-based Dome-C measurements, we designed different angular sampling schemes, mainly involving three variables—VZA, RAA, and SZA—as the factors of interest, to investigate the sensitivity of snow BRDF and the corresponding albedo to different illuminating–observing geometries.
The main conclusions are as follows,
(1) Robust inversion of snow BRDF/albedo requires an appropriate multiangle sampling distribution. Using the AII to measure information content, we concluded that the RTLSRS model can be stably invertible when AII < −2. Specifically, limiting VZA coverage to [−20°, 20°] fails to provide sufficient information at any azimuth (including PP), yielding unreliable BRDF reconstructions; when the RAA is deviated to the CPP, even a wide VZA range of [−50°, 50°] is inadequate for retrieval and tends to reproduce BRDF curves even with reversed anisotropy features.
(2) With the appropriate BRDF model, the key snow anisotropic (i.e., stronger forward scattering) can generally be captured by most sampling schemes designed in this study, while the intensity of forward scattering differs in a systematic fashion. Specifically, the anisotropic scattering tends to be amplified for both forward and backward scattering when the VZA range decreases; as the RAA deviates from the PP, the forward-scattering signature weakens at shorter wavelengths (339 nm and 677 nm) but strengthens at longer wavelengths (1032 nm and 2196 nm); when observations are distributed across wider VZA and RAA ranges, the BRDF shape is comparatively stable, although an overestimation can happen in the forward direction when there are more observations in this direction. In addition, BRDF is also sensitive to SZA; a larger SZA yields more pronounced BRDF anisotropy and a lower nadir-view reflectance (i.e., VZA = 0°).
(3) The influence of angular sampling on retrieved albedo, including BSA and WSA, exhibits clear spectral dependence. Specifically, at shorter wavelengths, the relative differences in BSA/WSA resulting from different VZAs/RAAs are generally confined to ~5% (never exceeding 10%). However, at longer wavelengths, the albedo becomes markedly sensitive to both VZA range and RAA, with maximum relative discrepancies of up to 30%. The differences between spectral bands can be attributed to variations in BRDF characteristics, with longer wavelengths exhibiting more pronounced anisotropic reflectance behavior compared to shorter wavelengths.
(4) The albedo is highly sensitive to SZA across all wavelengths. This study confirms previous conclusions that the WSA relative to SZA is a constant, and the corresponding BSA increases with increasing SZA [2]. However, the new finding is that WSA and BSA retrieved from observations under different illumination conditions show significant divergences in both WSA and BSA. Specifically, as the actual illumination zenith angle increases from 51.57° to 86.56°, WSA decreases, with relative differences of 4.14%, 7.96%, 16.05%, and 20.33% at the four wavelengths, respectively. Similarly, BSA estimations exhibit an overall downward trend along with this SZA series, which is more pronounced at longer wavelengths when the actual illumination zenith angle increases.

6. Discussion

However, there are some limitations that need to be discussed.
Firstly, AII is defined for snow surface, independently of the measured reflectances. Accordingly, meeting the AII threshold signifies geometric solvability but is not necessarily, by itself, sufficient to ensure reliable retrievals, because a successful model inversion is generally a complicated mathematic problem. Similarly, a larger AII value is not necessarily equal to more reliable results; the credibility of the results depends on the quality of the observations (e.g., noise, calibration, angular coverage) and on the applicability and accuracy of the BRDF model. In addition, AII is derived from three kernel values that are not strictly orthogonal within the kernel-driven model framework, and the resulting uncertainty in the AII value has not been considered in this study. Furthermore, due to that, this threshold is derived from the specific angular sampling schemes proposed in this study; a more comprehensive determination would require broader validation across a wider range of sampling configurations.
Secondly, this study is based on currently available observational data. We only consider the angular sampling schemes with uniformly distributed viewing geometries and do not cover non-uniform designs, and the potential noise sources during data acquisition (e.g., random noise and systematic errors) were difficult to explicitly quantify and model. In addition, although this study was conducted using a limited number of spectral bands and we believe these selected bands are sufficient to reflect the general trends in multispectral analysis, access to multi-angular data across a broader spectral range would enable a more comprehensive and robust characterization of spectral variation. Accordingly, future work should systematically extend the sampling configurations within a simulation framework, e.g., the bic-PT [48], LESS [49], etc., and incorporate diverse noise scenarios to quantify sensitivity analyses and uncertainty propagation within a wider range of wavelengths, thereby further assessing the robustness and generalizability of the conclusions.
Finally, we need to discuss the modeled BSA values at a large SZA range. Although true albedo is theoretically less than 1.0, our study indeed produces a few extreme BSA values exceeding 1.0 for a special case of Dome-C snow dataset on the eastern Antarctic Plateau, at large SZAs. This behavior can be explained through two aspects. On the one hand, the uncertainty of the observations at large SZAs and the inversion performance of the model need to be further discussed, especially concerning the performance of the model when extrapolating results derived from results under small SZA observations to conditions with larger SZAs. On the other hand, at large SZAs, the likelihood of photons escaping the snowpack before absorption increases for direct radiation [50]. Therefore, when summing the direct reflected component and all scattered radiation in the viewing hemisphere, the BSA calculated using the semi-empirical kernel-driven BRDF model can exceed 1.0 under several extreme conditions for snow surfaces.
Despite the limitations, this study isolates the roles of VZA, RAA, and SZA in shaping snow-surface BRDF and the derived albedos. The findings offer practical guidance for the design of future multi-angle sensors (e.g., emphasizing principal-plane coverage and azimuthal balance) and, although BSA and WSA are theoretical ideal definitions rather than observable quantities, they provide a rigorous foundation for estimating actual albedo. More broadly, the analysis clarifies how sampling geometry and model structure propagate into snow albedo uncertainty, furnishing a framework to diagnose and mitigate underlying error sources.

Author Contributions

Conceptualization, J.G. and Z.J.; methodology, J.G. and Z.J.; formal analysis, J.G. and A.D.; investigation, J.G. and Z.L.; data extraction and process, J.G., Z.L., C.W., F.Y., G.G., Z.T., S.C. and X.D.; writing, J.G.; supervision, A.D. and Z.L.; funding acquisition, Z.J., A.D. and J.G. All authors have read and agreed to the published version of the manuscript.

Funding

This work was funded by the Major program of the National Natural Science Foundation of China (No. 42090013), the General Program of the National Nature Science Foundation of China (No. 42471352), the Open Fund of State Key Laboratory of Remote Sensing Science (Grant No. OFSLRSS202412), the National Natural Science Foundation of China (No. 42301363, No. 42501422), Xiamen Natural Science Foundation Project under (Grant 3502Z202473059) and Beijing Natural Science Foundation (No. QY25415).

Data Availability Statement

All remote sensing data used in this study are openly and freely available. The CAR database is available at https://disc.gsfc.nasa.gov/datasets?keywords=CAR (accessed on 22 November 2022), and the Dome-C data is available at https://atmos.uw.edu/~sgwgroup/DC/brdfPaper.html (accessed on 16 March 2023).

Acknowledgments

The analysis data of this study includes CAR and Dome-C multi-angular data. We sincerely appreciate contributors to these data. We thank Hudson’s insightful clarifications regarding issues we faced while using the Dome-C data. We thank the contribution from Jiyou Jiao during the process of reviewing.

Conflicts of Interest

The authors declare no conflicts of interest.

References

  1. Nicodemus, F.E.; Richmond, J.C.; Hsia, J.J.; Ginsberg, I.W.; Limperis, T. Geometrical Considerations and Nomenclature for Reflectance (National Bureau of Standards (U.S.). 1977. Available online: http://www.researchgate.net/publication/313489884_Geometrical_considerations_and_nomenclature_for_reflectance_National_bureau_of_standards_U_S (accessed on 26 November 2023).
  2. Schaepman-Strub, G.; Schaepman, M.E.; Painter, T.H.; Dangel, S.; Martonchik, J.V. Reflectance quantities in optical remote sensing—Definitions and case studies. Remote Sens. Environ. 2006, 103, 27–42. [Google Scholar] [CrossRef]
  3. Dong, Y.; Jiao, Z.; Cui, L.; Zhang, H.; Zhang, X.; Yin, S.; Ding, A.; Chang, Y.; Xie, R.; Guo, J. Assessment of the Hotspot Effect for the PROSAIL Model with POLDER Hotspot Observations Based on the Hotspot-Enhanced Kernel-Driven BRDF Model. IEEE Trans. Geosci. Remote Sens. 2019, 57, 8048–8064. [Google Scholar] [CrossRef]
  4. Chang, Y.; Jiao, Z.; Zhang, X.; Mei, L.; Dong, Y.; Yin, S.; Cui, L.; Ding, A.; Guo, J.; Xie, R.; et al. Assessment of Improved Ross–Li BRDF Models Emphasizing Albedo Estimates at Large Solar Angles Using POLDER Data. IEEE Trans. Geosci. Remote Sens. 2021, 59, 9968–9986. [Google Scholar] [CrossRef]
  5. Roujean, J.-L.; Leroy, M.; Deschamps, P.-Y. A bidirectional reflectance model of the Earth’s surface for the correction of remote sensing data. J. Geophys. Res. Atmos. 1992, 97, 20455–20468. [Google Scholar] [CrossRef]
  6. Aoki, T.; Aoki, T.; Fukabori, M.; Hachikubo, A.; Tachibana, Y.; Nishio, F. Effects of snow physical parameters on spectral albedo and bidirectional reflectance of snow surface. J. Geophys. Res. Atmos. 2000, 105, 10219–10236. [Google Scholar] [CrossRef]
  7. Zege, E.P.; Katsev, I.L.; Malinka, A.V.; Prikhach, A.S.; Heygster, G.; Wiebe, H. Algorithm for retrieval of the effective snow grain size and pollution amount from satellite measurements. Remote Sens. Environ. 2011, 115, 2674–2685. [Google Scholar] [CrossRef]
  8. Nolin, A.; Fetterer, F.; Scambos, T. Surface roughness characterizations of sea ice and ice sheets: Case studies with MISR data. IEEE Trans. Geosci. Remote Sens. 2002, 40, 1605–1615. [Google Scholar] [CrossRef]
  9. Colgan, M.S.; Baldeck, C.A.; Féret, J.-B.; Asner, G.P. Mapping Savanna Tree Species at Ecosystem Scales Using Support Vector Machine Classification and BRDF Correction on Airborne Hyperspectral and LiDAR Data. Remote Sens. 2012, 4, 3462–3480. [Google Scholar] [CrossRef]
  10. Buchhorn, M.; Raynolds, M.K.; Walker, D.A. Influence of BRDF on NDVI and biomass estimations of Alaska Arctic tundra. Environ. Res. Lett. 2016, 11, 125002. [Google Scholar] [CrossRef]
  11. Jensen, D.J.; Simard, M.; Cavanaugh, K.C.; Thompson, D.R. Imaging Spectroscopy BRDF Correction for Mapping Louisiana’s Coastal Ecosystems. IEEE Trans. Geosci. Remote Sens. 2018, 56, 1739–1748. [Google Scholar] [CrossRef]
  12. Viterbo, P.; Betts, A.K. Impact on ECMWF forecasts of changes to the albedo of the boreal forests in the presence of snow. J. Geophys. Res. Atmos. 1999, 104, 27803–27810. [Google Scholar] [CrossRef]
  13. Wang, K.; Liu, J.; Zhou, X.; Sparrow, M.; Ma, M.; Sun, Z.; Jiang, W. Validation of the MODIS global land surface albedo product using ground measurements in a semidesert region on the Tibetan Plateau. J. Geophys. Res. Atmos. 2004, 109, D05107. [Google Scholar] [CrossRef]
  14. Gao, F.; He, T.; Wang, Z.; Ghimire, B.; Shuai, Y.; Masek, J.G.; Schaaf, C.; Williams, C. Multiscale climatological albedo look-up maps derived from moderate resolution imaging spectroradiometer BRDF/albedo products. JARS 2014, 8, 083532. [Google Scholar] [CrossRef]
  15. Liang, S.; Strahler, A.H. Retrieval of surface BRDF from multiangle remotely sensed data. Remote Sens. Environ. 1994, 50, 18–30. [Google Scholar] [CrossRef]
  16. Jiao, Z.; Ding, A.; Kokhanovsky, A.; Schaaf, C.; Bréon, F.-M.; Dong, Y.; Wang, Z.; Liu, Y.; Zhang, X.; Yin, S.; et al. Development of a snow kernel to better model the anisotropic reflectance of pure snow in a kernel-driven BRDF model framework. Remote Sens. Environ. 2019, 221, 198–209. [Google Scholar] [CrossRef]
  17. Loeb, N.G.; Smith, N.M.; Kato, S.; Miller, W.F.; Gupta, S.K.; Minnis, P.; Wielicki, B.A. Angular distribution models for top-of-atmosphere radiative flux estimation from the Clouds and the Earth’s Radiant Energy System instrument on the Tropical Rainfall Measuring Mission Satellite. Part I: Methodology. J. Appl. Meteorol. 2003, 42, 240–265. [Google Scholar] [CrossRef]
  18. Barnsley, M.J.; Settle, J.J.; Cutter, M.A.; Lobb, D.R.; Teston, F. The PROBA/CHRIS mission: A low-cost smallsat for hyperspectral multiangle observations of the Earth surface and atmosphere. IEEE Trans. Geosci. Remote Sens. 2004, 42, 1512–1520. [Google Scholar] [CrossRef]
  19. Diner, D.J.; Beckert, J.; Reilly, T.; Bruegge, C.; Conel, J.; Kahn, R.; Martonchik, J.; Ackerman, T.; Davies, R.; Gerstl, S.; et al. Multi-angle Imaging SpectroRadiometer (MISR) instrument description and experiment overview. IEEE Trans. Geosci. Remote Sens. 1998, 36, 1072–1087. [Google Scholar] [CrossRef]
  20. Leroy, M.; Deuzé, J.L.; Bréon, F.M.; Hautecoeur, O.; Herman, M.; Buriez, J.C.; Tanré, D.; Bouffiès, S.; Chazette, P.; Roujean, J.L. Retrieval of atmospheric properties and surface bidirectional reflectances over land from POLDER/ADEOS. J. Geophys. Res. Atmos. 1997, 102, 17023–17037. [Google Scholar] [CrossRef]
  21. Chen, L.; Shang, H.; Fan, M.; Tao, J.; Husi, L.; Zhang, Y.; Wang, H.; Cheng, L.; Zhang, X.; Wei, L.; et al. Mission overview of the GF-5 satellite for atmospheric parameter monitoring. J. Remote Sens. 2021, 25, 1917–1931. [Google Scholar] [CrossRef]
  22. Nishihama, M.; Wolfe, R.; Solomon, D.; Patt, F.; Blanchette, J.; Fleig, A.; Masuoka, E. MODIS Level 1A Earth Location: Algorithm Theoretical Basis Document Version 3.0. NASA GSFC. 26 August 1997. Available online: https://modis.gsfc.nasa.gov/data/atbd/atbd_mod28_v3.pdf (accessed on 10 September 2023).
  23. Baker, N.; Kilcoyne, H. Joint Polar Satellite System (JPSS) VIIRS Geolocation Algorithm Theoretical Basis Document (ATBD). NASA GSFC. 5 December 2011. Available online: https://www.star.nesdis.noaa.gov/jpss/documents/ATBD/D0001-M01-S01-004_JPSS_ATBD_VIIRS-Geolocation_B.pdf (accessed on 10 September 2023).
  24. Hu, B.; Lucht, W.; Strahler, A.H.; Schaaf, C.B.; Smith, M. Surface Albedos and Angle-Corrected NDVI from AVHRR Observations of South America. Remote Sens. Environ. 2000, 71, 119–132. [Google Scholar] [CrossRef]
  25. Yan, G.; Jiang, H.; Yan, K.; Cheng, S.; Song, W.; Tong, Y.; Liu, Y.; Qi, J.; Mu, X.; Zhang, W.; et al. Review of optical multi-angle quantitative remote sensing. J. Remote Sens. 2021, 25, 83–108. [Google Scholar] [CrossRef]
  26. Durpaire, J.-P.; Gentet, T.; Phulpin, T.; Arnaud, M. Spot-4 vegetation instrument: Vegetation monitoring on a global scale. Acta Astronaut. 1995, 35, 453–459. [Google Scholar] [CrossRef]
  27. Roy, D.P.; Li, J.; Zhang, H.K.; Yan, L.; Huang, H.; Li, Z. Examination of Sentinel-2A multi-spectral instrument (MSI) reflectance anisotropy and the suitability of a general method to normalize MSI reflectance to nadir BRDF adjusted reflectance. Remote Sens. Environ. 2017, 199, 25–38. [Google Scholar] [CrossRef]
  28. Matsuoka, M.; Takagi, M.; Akatsuka, S.; Honda, R.; Nonomura, A.; Moriya, H.; Yoshioka, H. Bidirectional Reflectance Modeling of the Geostationary Sensor Himawari-8/Ahi Using a Kernel-Driven Brdf Model. ISPRS Ann. Photogramm. Remote Sens. Spat. Inf. Sci. 2016, III-7, 3–8. [Google Scholar] [CrossRef]
  29. Sun, Y.; Wang, Z.; Qin, Q.; Han, G.; Ren, H.; Huang, J. Retrieval of surface albedo based on GF-4 geostationary satellite image data. J. Remote Sens. 2018, 22, 220–233. [Google Scholar] [CrossRef]
  30. Schaaf, C.B.; Gao, F.; Strahler, A.H.; Lucht, W.; Li, X.; Tsang, T.; Strugnell, N.C.; Zhang, X.; Jin, Y.; Muller, J.-P.; et al. First operational BRDF, albedo nadir reflectance products from MODIS. Remote Sens. Environ. 2002, 83, 135–148. [Google Scholar] [CrossRef]
  31. Lucht, W.; Lewis, P. Theoretical noise sensitivity of BRDF and albedo retrieval from the EOS-MODIS and MISR sensors with respect to angular sampling. Int. J. Remote Sens. 2000, 21, 81–98. [Google Scholar] [CrossRef]
  32. Zhang, X.; Jiao, Z.; Zhao, C.; Guo, J.; Zhu, Z.; Liu, Z.; Dong, Y.; Yin, S.; Zhang, H.; Cui, L.; et al. Evaluation of BRDF Information Retrieved from Time-Series Multiangle Data of the Himawari-8 AHI. Remote Sens. 2022, 14, 139. [Google Scholar] [CrossRef]
  33. Jin, Y.; Gao, F.; Schaaf, C.; Li, X.; Strahler, A.; Bruegge, C.; Martonchik, J. Improving MODIS surface BRDF/Albedo retrieval with MISR multiangle observations. IEEE Trans. Geosci. Remote Sens. 2002, 40, 1593–1604. [Google Scholar] [CrossRef]
  34. Zhang, T.; You, D.; Wen, J.; Tang, Y. The Optimal Angular Sampling for Bi-directional Reflectance Distribution Function Retrieval. Remote Sens. Technol. Appl. 2023, 38, 66–77. [Google Scholar] [CrossRef]
  35. Gatebe, C.K.; King, M.D. Airborne spectral BRDF of various surface types (ocean, vegetation, snow, desert, wetlands, cloud decks, smoke layers) for remote sensing applications. Remote Sens. Environ. 2016, 179, 131–148. [Google Scholar] [CrossRef]
  36. Dong, Y.; Jiao, Z.; Ding, A.; Zhang, H.; Zhang, X.; Li, Y.; He, D.; Yin, S.; Cui, L. A modified version of the kernel-driven model for correcting the diffuse light of ground multi-angular measurements. Remote Sens. Environ. 2018, 210, 325–344. [Google Scholar] [CrossRef]
  37. Mei, L.; Rozanov, V.; Jiao, Z.; Burrows, J.P. A new snow bidirectional reflectance distribution function model in spectral regions from UV to SWIR: Model development and application to ground-based, aircraft and satellite observations. ISPRS J. Photogramm. Remote Sens. 2022, 188, 269–285. [Google Scholar] [CrossRef]
  38. Hudson, S.R.; Warren, S.G.; Brandt, R.E.; Grenfell, T.C.; Six, D. Spectral bidirectional reflectance of Antarctic snow: Measurements and parameterization. J. Geophys. Res. Atmos. 2006, 111, D18106. [Google Scholar] [CrossRef]
  39. Kokhanovsky, A.A.; Zege, E.P. Scattering optics of snow. Appl. Opt. 2004, 43, 1589–1602. [Google Scholar] [CrossRef] [PubMed]
  40. Kokhanovsky, A.; Breon, F.-M. Validation of an Analytical Snow BRDF Model Using PARASOL Multi-Angular and Multispectral Observations. IEEE Geosci. Remote Sens. Lett. 2012, 9, 928–932. [Google Scholar] [CrossRef]
  41. Jin, Y.; Schaaf, C.B.; Gao, F.; Li, X.; Strahler, A.H.; Lucht, W.; Liang, S. Consistency of MODIS surface bidirectional reflectance distribution function and albedo retrievals: 1. Algorithm performance. J. Geophys. Res. Atmos. 2003, 108, D5. [Google Scholar] [CrossRef]
  42. Ding, A.; Jiao, Z.; Dong, Y.; Zhang, X.; Peltoniemi, J.I.; Mei, L.; Guo, J.; Yin, S.; Cui, L.; Chang, Y.; et al. Evaluation of the Snow Albedo Retrieved from the Snow Kernel Improved the Ross-Roujean BRDF Model. Remote Sens. 2019, 11, 1611. [Google Scholar] [CrossRef]
  43. Breon, F.-M.; Maignan, F. A BRDF–BPDF database for the analysis of Earth target reflectances. Earth Syst. Sci. Data 2017, 9, 31–45. [Google Scholar] [CrossRef]
  44. Ding, A.; Jiao, Z.; Dong, Y.; Qu, Y.; Zhang, X.; Xiong, C.; He, D.; Yin, S.; Cui, L.; Chang, Y. An assessment of the performance of two snow kernels in characterizing snow scattering properties. Int. J. Remote Sens. 2019, 40, 6315–6335. [Google Scholar] [CrossRef]
  45. Lee, H.; Lee, K.; Kim, J.H.; Na, Y.; Park, J.; Choi, J.P.; Hwang, J.Y. Local Similarity Siamese Network for Urban Land Change Detection on Remote Sensing Images. IEEE J. Sel. Top. Appl. Earth Obs. Remote Sens. 2021, 14, 4139–4149. [Google Scholar] [CrossRef]
  46. Li, X.; Gao, F.; Wang, J.; Strahler, A. A priori knowledge accumulation and its application to linear BRDF model inversion. J. Geophys. Res. Atmos. 2001, 106, 11925–11935. [Google Scholar] [CrossRef]
  47. Wang, X.; Zender, C.S. MODIS snow albedo bias at high solar zenith angles relative to theory and to in situ observations in Greenland. Remote Sens. Environ. 2010, 114, 563–575. [Google Scholar] [CrossRef]
  48. Xiong, C.; Shi, J. Simulating polarized light scattering in terrestrial snow based on bicontinuous random medium and Monte Carlo ray tracing. J. Quant. Spectrosc. Radiat. Transf. 2014, 133, 177–189. [Google Scholar] [CrossRef]
  49. Qi, J.; Xie, D.; Yin, T.; Yan, G.; Gastellu-Etchegorry, J.-P.; Li, L.; Zhang, W.; Mu, X.; Norford, L.K. LESS: LargE-Scale remote sensing data and image simulation framework over heterogeneous 3D scenes. Remote Sens. Environ. 2019, 221, 695–706. [Google Scholar] [CrossRef]
  50. Warren, S.G. Optical properties of snow. Rev. Geophys. 1982, 20, 67–89. [Google Scholar] [CrossRef]
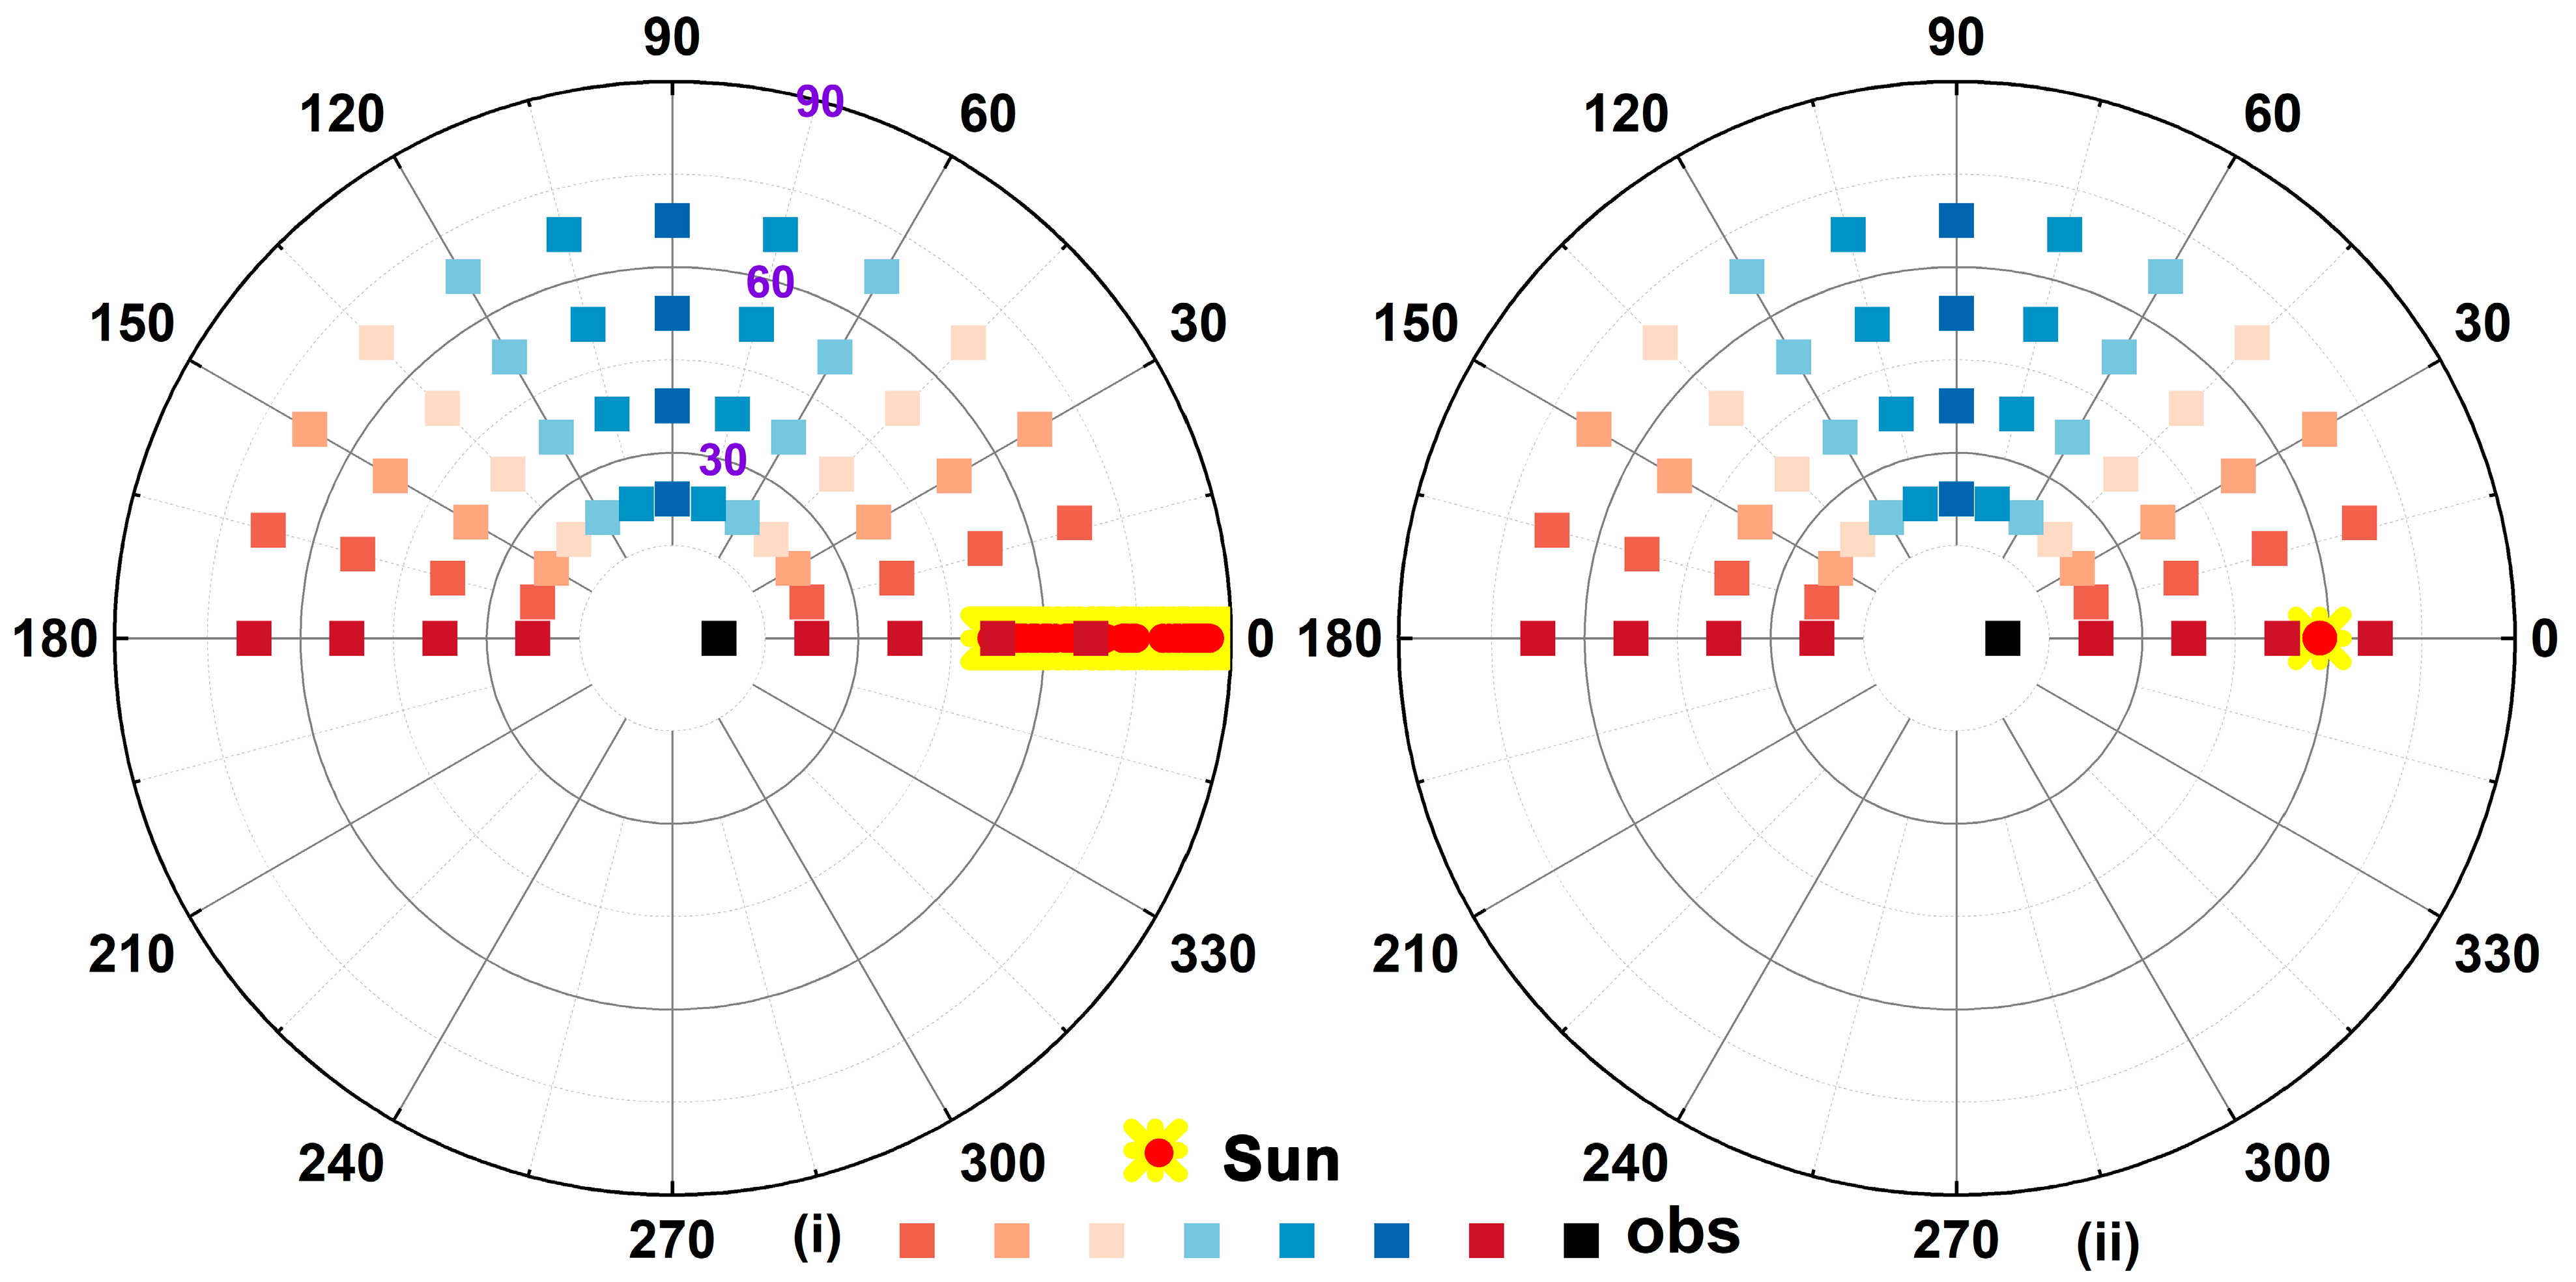
Figure 1. The angular sampling distribution of the Dome-C dataset. (i) includes all the 5088 observations, every square representing 96 observations at 96 SZAs; (ii) the angular distribution for observations under a single SZA.
Remotesensing 17 03614 g001
Figure 2. The method framework of this study. The BRDF and albedo derived from the standard dataset are to be regarded as the “true values”. Three new configured multi-angle datasets were formed by extracting measurements from the standard dataset to explore the sensitivity of VZA, RAA, and SZA to snow BRDF and albedo.
Remotesensing 17 03614 g002
Figure 3. The kernel values of RT (a), LSR (b), and SNOW (c) (α = 0.3) scattering kernels as a function of the VZA at 9 SZAs on the PP. The results clearly demonstrate that different kernel functions exhibit distinct response patterns with changing angular configurations. It should be noted that the values of snow kernel in (c) are the original values, rather than the value shown in Figure 1 of [16], which has been shifted upward by 1.0.
Remotesensing 17 03614 g003
Figure 4. Variations of three kernel integral values relative to SZA. The red dashed lines represent the kernel integral values for WSA; three kernel integrals remain constant at 0.18919, −1.37757, and −0.02938, respectively. The black dashed lines represent the kernel integral values for BSA, the RT, and SNOW kernel integral, increasing with SZA, while the LSR kernel integral decreases with SZA. The blue squares represent the corresponding kernel integral values at SZA = 67.5°.
Remotesensing 17 03614 g004
Figure 5. The comparison of AIC (bar chart) and AII (dashed dot-line) for scheme (a-1)–(a-9) with different numbers of observations on PP. Three colors correspond to the results derived from 21, 16, and 9 observations. AIC varies markedly with the number of observations, whereas AII is only weakly sensitive to the number of observations and varies very little, because it emphasizes the marginal information provided by additional views rather than their count.
Remotesensing 17 03614 g005
Figure 6. The AII values for sampling schemes of (ac). The sun is located at a zenith angle of 67.5°. In (a), the sequence from left to right represents schemes (a-1) to (a-9), the red colors represent the result on the PP, green for RAA = 30°, blue for RAA = 60°, and purple for RAA = 90°; the angle configurations of scheme (b) are labeled at the top of figure (b); (c) is the AII values as a function of SZA, increasing with increasing SZA at 4 RAAs.
Remotesensing 17 03614 g006
Figure 7. The comparison between BRDFs reconstructed from different angular sampling schemes and the standard BRDF. The first column (a,c,e,g) is the Taylor diagrams at 4 bands, displaying the R, RMSE, and SD between the BRDF and standard BRDF. The black star represents the reference value, the markers with different shapes represent different RAAs; specifically, the circle represents the PP, the triangle represents RAA = 30°, the square represents RAA = 60°, the diamond represents CPP, and the asterisk represents the scheme (b). The colors from light to dark represent (a-1), (a-2), …, (a-9) and (b-1), …, (b-10). The marker closer to the reference indicates better agreement. The second column (b,d,f,h) is the reconstructed BRDF curves at 4 bands, where the gray bold lines represent the standard BRDF and the blue and red curves represent the typical BRDF curves that are very different from the standard BRDF.
Remotesensing 17 03614 g007
Figure 8. The relative differences in BSA and WSA for scheme (a1,a2) and scheme (b1,b2) at four bands. The relative difference exhibits an tendency to increase with longer wavelengths.
Remotesensing 17 03614 g008
Figure 9. The four model parameters of different angular sampling schemes at four bands. In each subpanel, the results are shown sequentially from left to right for the (a) schemes under RAA = 0°, 30°, 60°, 90° and (b) schemes, respectively. The different colors represent different sampling schemes, as described in Figure 8. The box represents the interquartile range (IQR) of the parameters, the whiskers extend to the lower and upper bounds, typically defined as the maximum and minimal value. The gray dashed lines represent the reference value of the standard datasets.
Remotesensing 17 03614 g009
Figure 10. The BRDF curves as a function of SZA at four bands. The first row (ad) shows the reference BRDF curves at 8 SZAs at 4 bands. The second (eh) and third rows (il) display the BRDF curves reconstructed from 4 azimuthally distinct angular sampling schemes at 2 specified SZAs.
Remotesensing 17 03614 g010
Figure 11. The variation in BSA and WSA of snow surface at various SZAis by using Dome-C measurements at four wavelengths. Black spheres represent the BSA values of 8 selected SZAs in the results of each SZAi. The WSAs stay constant, while BSAs tend to increase with SZA, increasing for every single SZAi; however, multi-angular observations under different SZAis tend to generate different WSAs and BSAs, generally decreasing with increasing SZAi.
Remotesensing 17 03614 g011
Figure 12. The relative differences in BSA and WSA between the reference value and the results of a different scheme (c) under 8 SZAs at four bands. The box represents the IQR of the relative difference.
Remotesensing 17 03614 g012
Table 1. The fitting accuracy of the RTLSRS model to the CAR standard dataset at four bands.
Wavelength (nm)SZAR2RMSE
33967.5°0.90140.0076
6770.96850.0187
10320.98050.0193
21960.98880.0109
Table 2. The fitting accuracy of the RTLSRS model to Dome-C standard datasets at 4 bands, including the results for (i) using 5088 observations and (ii) using 53 observations of each SZA.
Wavelength (nm)R2 (i)RMSE (i)R2 (ii)RMSE (ii)
3500.720.019[0.87, 0.99][0.0077, 0.038]
6750.620.070[0.82, 0.99][0.006, 0.045]
10250.720.069[0.58, 0.99][0.004, 0.032]
22000.880.030[0.94, 0.99][0.004, 0.025]
Disclaimer/Publisher’s Note: The statements, opinions and data contained in all publications are solely those of the individual author(s) and contributor(s) and not of MDPI and/or the editor(s). MDPI and/or the editor(s) disclaim responsibility for any injury to people or property resulting from any ideas, methods, instructions or products referred to in the content.