You are currently viewing a new version of our website. To view the old version click .
Remote Sensing
  • Article
  • Open Access

3 November 2025

Integrated Surveying for Architectural Heritage Documentation in Iraq: From LiDAR Scanner to GIS Applications

,
,
,
and
1
School of Civil Engineering, University of Leeds, Leeds LS2 9LG, UK
2
Department of Architecture Engineering, College of Engineering, University of Baghdad (UB), Jamia St., First Floor, Office 2-04, Karrada District, Baghdad 100069, Iraq
3
Department of Architecture Engineering, Wasit University, Wasit 52001, Iraq
4
Virtual World Lines, Main Road, Beirut 1100, Lebanon
This article belongs to the Special Issue Remote Sensing Technologies for the Conservation and Preservation of Cultural Heritage Sites

Highlights

What are the main findings?
  • Remote sensing technologies, particularly Terrestrial Laser Scanning (TLS) combined with GIS, generated highly accurate 2D and 3D documentation of the endangered Shanasheel house in Iraq.
  • The workflow demonstrated reliable documentation of intricate wooden structures and enabled comprehensive spatial analysis for heritage management.
What is the implication of the main finding?
  • The application of remote sensing technologies provides a scalable, non-invasive methodology for documenting and preserving wooden architectural heritage.
  • TLS–GIS integration strengthens digital archiving, condition assessment, and conservation planning, offering a sustainable framework for safeguarding cultural heritage in Iraq and other countries.

Abstract

In recent years, remote sensing technologies have become indispensable for the documentation, analysis, and virtual preservation of historical, architectural, and archaeological heritage. Advances in 3D scanning have enabled the precise digital recording of complex structures as large-scale point clouds, facilitating highly detailed virtual reconstructions. This study evaluates the capability of LiDAR-based Terrestrial Laser Scanning (TLS) for documenting historical monument façades within a 3D environment and generating accurate visualisation models from registered, colourised point clouds. The integration of high-resolution RGB imagery, processed through Reality Capture 1.5 software, enables the automatic production of realistic 3D models that combine geometric accuracy with visual fidelity. Simultaneously, Geographic Information Systems (GIS), particularly cloud-based platforms like ArcGIS Pro Online, enhance spatial data management, mapping, and analysis. When combined with TLS, GIS is part of a broader remote sensing framework that improves heritage documentation regarding precision, speed, and interpretability. The digital survey of the Shanasheel house in Al-Basrah, Iraq, demonstrates the effectiveness of this interdisciplinary approach. These architecturally and culturally significant buildings, renowned for their intricately decorated wooden façades, were digitally recorded using CAD-based methods to support preservation and mitigation against urban and environmental threats. This interdisciplinary workflow demonstrates how remote sensing technologies can play a vital role in heritage conservation, enabling risk assessment, monitoring of urban encroachment, and the protection of endangered cultural landmarks for future generations.

1. Introduction

The importance of documenting world heritage sites has risen dramatically because they continue to suffer from threats caused by wars and natural disasters in addition to environmental deterioration and climate change effects [,], To address these challenges, the past decade has witnessed remarkable advancements in remote sensing technologies, particularly in Light Detection and Ranging (LiDAR) systems, which have become essential tools for the three-dimensional (3D) documentation of complex heritage structures [,,]. Terrestrial Laser Scanning (TLS), a form of LiDAR, captures the precise geometry of objects by generating dense point clouds that represent surfaces based on accurate distance measurements between the scanner and target [,]. These datasets enable the creation of realistic and metrically accurate 3D models that reproduce both geometric form and surface texture, making them suitable for conservation, monitoring, and restoration purposes []. Despite their high acquisition rates and exceptional spatial resolution, TLS instruments can exhibit minor inaccuracies along edges due to variations in angular increments, laser spot sizes, reflectivity, distance, or occlusion effects [,]. Nevertheless, continuous technological progress in digital surveying has diversified the range of available tools and methods, offering varying levels of accuracy and affordability [,,,]. These non-contact approaches are particularly well suited to recording delicate or inaccessible heritage assets, such as archaeological sites and historic buildings []. LiDAR’s capacity to emit active laser pulses and analyze reflected signals allows the acquisition of high-density spatial data and supports the reconstruction of endangered cultural heritage with outstanding precision and quality [,]. Recent studies [,,] have highlighted the transformative potential of TLS as an advanced LiDAR technology capable of rapidly capturing the geometric and material characteristics of built environments with millimetric accuracy. The integration of TLS with Geographic Information Systems (GIS) [,,] and image-based modeling further enhances documentation workflows by combining geometric precision with spatial and environmental contextualization []. This synergy facilitates detailed architectural documentation, heritage risk assessment, condition monitoring, and proactive conservation planning []. Moreover, when integrated into GIS platforms, TLS-derived 3D datasets can be transformed into immersive virtual environments, enabling remote exploration, spatial analysis, and public engagement [,,]. This technological convergence is redefining digital heritage documentation, promoting accessibility, education, and data-driven preservation strategies. Building on these advances, the present study proposes an integrated TLS–GIS methodology to document and analyze the endangered Shanasheel houses in Al-Basrah, Iraq—historic wooden architectural structures renowned for their intricate façades and cultural significance. By combining high-resolution TLS data with GIS-based spatial analytics, this research achieves both geometric accuracy and spatial contextualization. The resulting georeferenced and metrically reliable 2D drawings and 3D models serve multiple purposes: (1) the digital preservation and archiving of Shanasheel houses to safeguard their architectural identity, and (2) the facilitation of damage assessment and conservation planning through the visualization of deterioration patterns and environmental threats, thereby informing sustainable restoration strategies. In this study, terrestrial laser scanning (TLS) was employed to produce comprehensive 3D digital documentation of endangered Shanasheel houses in Al-Basrah. The acquired point clouds were processed, validated for accuracy, and integrated using specialized software to generate precise 3D models of the structures. The overall workflow of 3D data fusion and the potential applications of the resulting digital models are analyzed in detail. The findings advance current methods of accurate 3D documentation and spatial analysis for cultural heritage sites. Ultimately, this research demonstrates a fully integrated survey framework, linking remote sensing, spatial analysis, and heritage conservation, that offers a scalable, non-invasive, and reproducible approach to documenting and managing at-risk cultural heritage assets.

2. Historical Background and Regional Comparisons

Shanasheel (singular sanshool) wooden houses are a prominent vernacular architecture that responded to social, cultural, and economic needs across centuries and are significant heritage landmarks in Iraq []. The houses include unique wooden structures extensively decorated with geometric patterns and appear as extruded structures from the frontal façade of domestic buildings. The 16th-century Shanasheel houses were first built in Al-Basrah and spread across Iraqi cities [,]. Many factors have contributed to the emergence of the Shanasheel timber houses: a. they were built in port cities which were sites for imported timber from other destinations; b. the port cities had soft clay soil, making building a two-story house challenging; and the availability of professional wooden craftsmanship from India and China who spent their livelihood in Iraq and settled permanently []. The design, structure and wooden materials are influenced by their Persian, Turkish and Indian counterparts. Historians described the Shanasheel heritage neighborhoods as “miniature Iraq” due to their structural, aesthetic, and artistic forms. Historically, wealthy Iraqi Jews were known for building these houses, and only 5 of them are the last remaining buildings of the Jewish heritage in Baghdad. The house structure (ceiling, beams, roof, columns, etc.) and construction methods reflected a rich cultural diversity that captured the remnants of historic communities and architectural styles (e.g., Abbasids, Ottomans, Christian, Nestorian, Jewish and Yazidis) []. They also display complex patterns, calligraphic texts, and artistic expressions peculiar to various ethnic, religious, and social classes. Three aspects are unique from their construction that have developed into wooden craftsmanship: a. the houses evidence the depth of the transferable skills of local vernacular craftsmanship utilising local wood that contributes to Iraq’s economy across generations; b. the availability of wood with exceptional lightweight and resistance, such as Teak wood (Baghdad & Al-Basrah) [], Mulberry and Pistachio trees (Mosul), contributed to reducing the weight of the buildings and eased carving of the wooden architecture patterns and inscriptions which led to the diverse shapes and content of the columns, beams, walls and roofs; c. the construction methods and materials feature technological building solutions that prevent damage for many years, such as shrinkage, warping, and cracks. The small pieces of wood are dovetailed into one another without glue or nails in the structural components, enabling the wood to expand, contract, and adjust without disturbing the overall assembly. The tight pattern of the façades prevented direct sunlight from entering the house through windows with triangular wooden lattices and provided shade for the alley or the street. Therefore, they were a suitable way to reduce the heat inside homes during hot summers. Numerous houses have been substantially damaged and subject to irreversible disappearance []. A limited number of these houses are documented using traditional architectural drawings, videos, and images [,].
The endangered Shanasheel houses in Iraq (only 400 intact out of 1500) are disappearing due to severe hot weather, climate change and neglect. In Mosul, many houses were destroyed during the recent conflict, although elsewhere, some limited restoration was undertaken (e.g., Al-Basrah Provincial Antiquities Inspectorate Building). The UNESCO 2019 project ‘Reviving the Spirit of Mosul and Al-Basrah’ restored a limited number of houses as part of the urban revitalisation of the old cities []. However, the majority are at high risk: neglect of protective paint coatings and maintenance exposes structural timbers to the destructive impact of rapid climate change in Iraq; most of Iraq’s Shanasheel houses already show signs of severe splitting of structural timbers and risk of collapse. There remains no programme for broader digital recording to enable future restoration. Following our comprehensive damage and value assessment of Iraq’s tangible heritage [,], we identified alarming threats that pose a high risk of the Shanasheel houses’ permanent loss as follows: 1. Imminent collapse and permanent disappearance of the timber structures that shaped the spirit and identity of Iraq for centuries; 2. Underrepresentation of a comprehensive and digital record in archives and Museums locally and worldwide risks undervaluing this unique architectural heritage and limits the future potential for intervention to restore/preserve them by local enterprises; and 3. The loss of the intangible heritage of local skills and knowledge due to the displacement of local carpenters after recent conflict, representing an additional risk of loss of the built heritage and questioning the authenticity and sustainability of reconstruction.

3. Methods and Data

3.1. Study Area

History books call the land now called Iraq “Mesopotamia.” Iraq lies in the heart of the Middle East, bordered by Turkey, Syria, Iran, Jordan, Saudi Arabia, and Kuwait (Figure 1). The country covers about 437,072 km2, spanning roughly between longitudes 38°45′ and 48°45′E and latitudes 29°5′ and 37°15′N. Its terrain is largely arid and desert-like, with the exception of the mountainous north, where winters are cold []. Climate varies with topography from subtropical to continental: winters are cool to cold, often dipping below 0 °C, with low and uneven precipitation, typically less than 100 mm annually across central and southern regions, rising to 900 mm in the northeastern mountains. Summers are long, hot, and dry, with temperatures commonly reaching up to 48 °C, while spring and autumn are short transitional seasons. This has been a tough climatic environment, which has exponentially affected architectural responses in Iraq, with the most prominent of these being the Shanasheel house.
Figure 1. Study area overview for Iraq. (A) National and governorate boundaries with the Al-Basrahh location. (B) Iraq SRTM 30 m Digital Elevation Model with governorate labels. (C) Regional context map showing Iraq within the Middle East (Esri imagery basemap).

3.2. Methodological Approach

The documentation of the endangered Shanasheel house in Al-Basrah, officially known as the Al-Basrah Antiquities Inspectorate Headquarters House (BAIH) (Geographic Coordinates: X = 30.501607, Y = 47.81553) (Figure 2), was undertaken through a comprehensive research design integrating Terrestrial Laser Scanning (TLS), high-resolution photography, and GIS-based spatial analysis to produce accurate and sustainable digital records. Fieldwork conducted in 2025 employed a FARO Focus Premium Laser Scanner (LS9 H 150 New Unit) to capture 105 high-resolution scans of both the interior and exterior of the building, generating a dense point cloud dataset. The TLS survey was meticulously planned using historical architectural drawings to optimize station placement and minimize blind spots, ensuring line-of-sight visibility between scanning positions for accurate point cloud alignment with minimal and acceptable margins of error. Most scans were acquired at medium resolution to accommodate the relatively confined interior spaces and capture the intricate wooden details characteristic of Shanasheel architecture. Complementary high-resolution photographs documented the ornate wooden latticework, façade ornamentation, and material textures, providing essential data for texturing and visual reconstruction. Challenges arose from reflective glass elements and complex wooden screens, which occasionally introduced noise and occlusions in the data; however, these limitations did not affect the overall processing workflow, as the resulting point cloud was primarily intended to generate an accurate 3D reconstruction of the building’s geometric structure and decorative façade rather than fully replicate interior furnishings. The final dataset provided a robust basis for the detailed analysis of wall thicknesses, structural deformations, and spatial relationships, forming the foundation for precise digital modeling and long-term heritage conservation assessment.
Figure 2. Schematic flow chart of the proposed methodology.
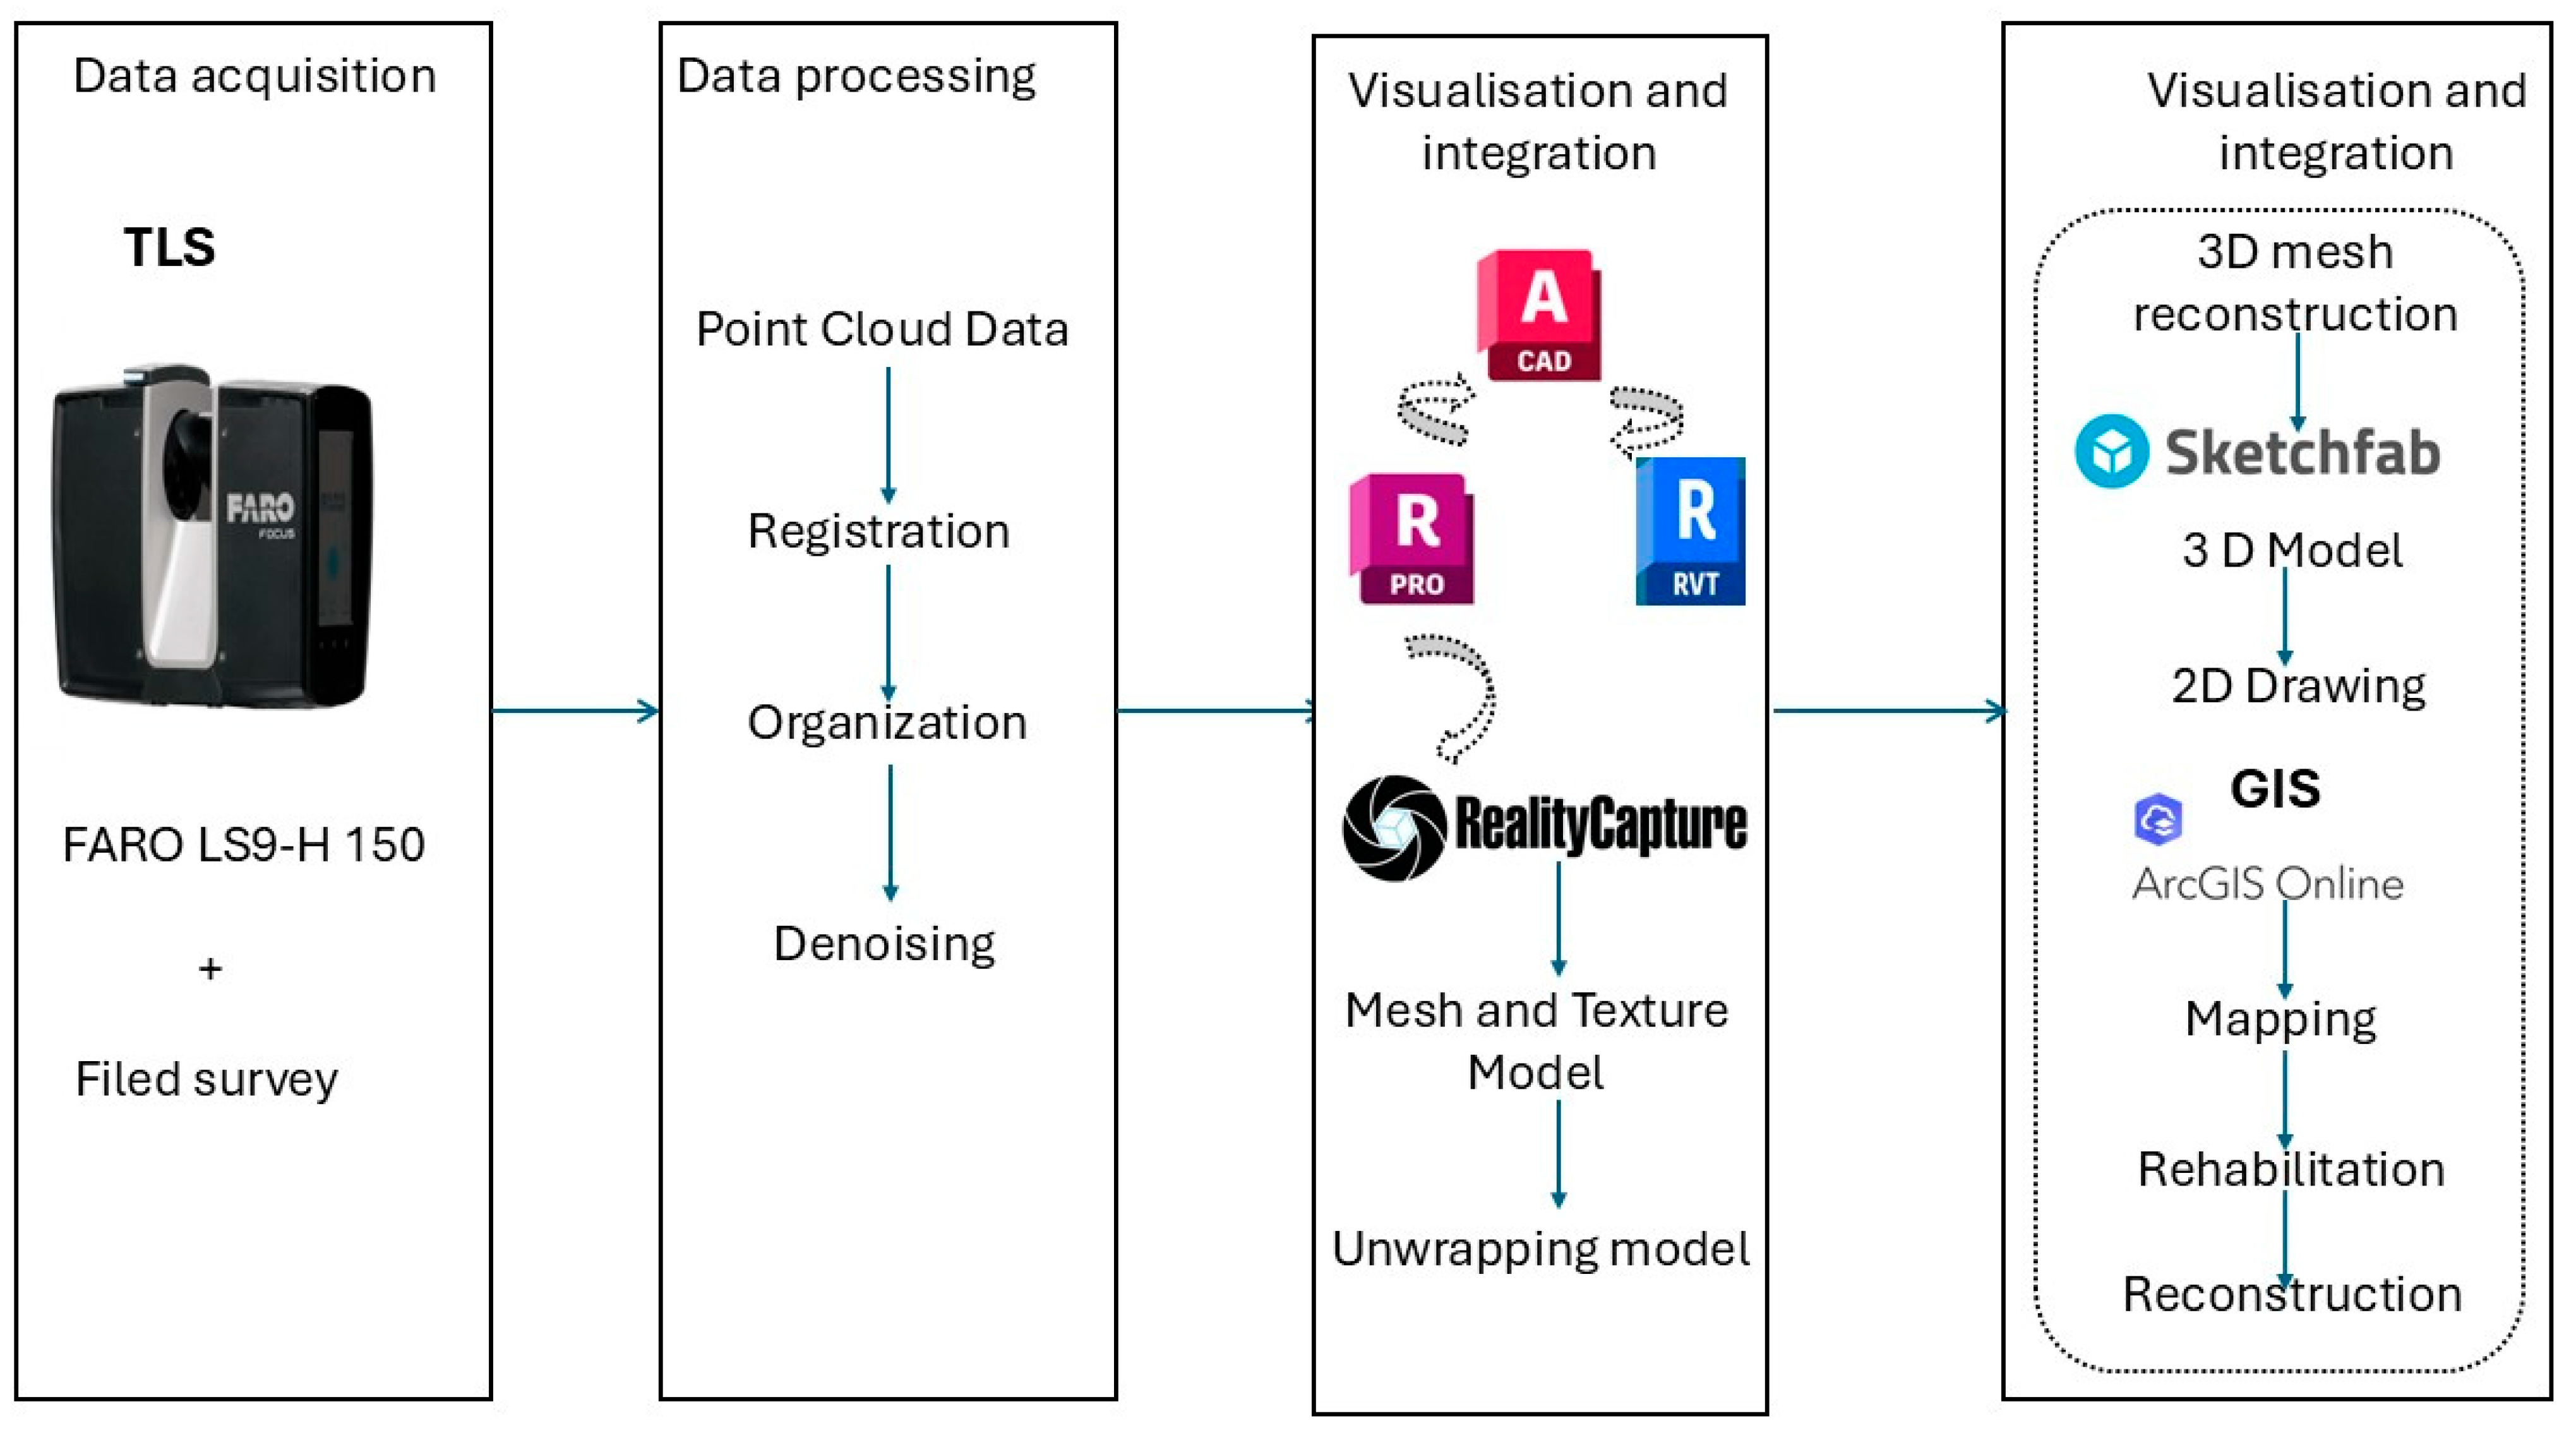
All datasets were systematically organised under a unique Master Record Number (MRN), with daily backups to dual 4Tb drives in the field and subsequent archiving on a Lacie 10Tb Big Dock in Iraq. Following acquisition, the TLS data underwent registration, organisation, and denoising before being processed using specialised 3D modelling applications, including Reality Capture 1.5 and ReCap 2025 (RCP), to generate structured E57 point cloud files and highly accurate 3D representations of the structure. From these point clouds, 2D architectural plans were extracted as precise, measurable documentation to support future (re)analysis and conservation. The drawings were refined in Autodesk AutoCAD/Revit 2025 to enhance precision and detail. The outputs were then converted into interoperable formats. Three-dimensional models (OBJ), annotated drawings (PDF), photographic datasets (JPG/.TIF), and video records (MP4)—all accompanied by metadata to ensure long-term accessibility. These digital assets were subsequently integrated with GIS techniques, using ArcGIS Online to georeference spatial datasets alongside historical maps and environmental information. Ultimately, the creation of this comprehensive digital archive provides a sustainable resource for informed decision-making in heritage management and contributes to the long-term preservation of Iraq’s Shanasheel architecture. Figure 2 illustrates the methodological framework, outlining the workflow from data acquisition and processing to GIS integration and digital archiving.

3.3. Three-Dimensional Survey and Modeling of Shanasheel Houses

It is essential to document Shanasheel houses using advanced LiDAR-based surveying technologies, as these structures require precise measurement of their decorative wooden frameworks, complex lattice screens, and free-standing architectural elements. Historic wooden buildings demand millimetric accuracy in capturing their geometry and material condition to support informed preservation and restoration planning. To achieve a high-resolution and metrically accurate 3D model, a terrestrial LiDAR survey was conducted using the FARO Focus Premium Laser Scanner (Model LS9-H 150), manufactured by FARO Technologies Inc. (Munich, Germany) and sourced from Multipath Inspection (Erbil, Iraq) (Table 1). The progressive FARO Focus Premium Laser Scanner LS9-H 150 combines a wide 360° × 270° viewing capacity with distant to close 0.1 m to 300 m scanning capability to deliver dense point data for all delicate wooden structures and building elements. An optimal scanning plan was executed because Shanasheel houses have improvised geometry along with complex wooden screens (Shanasheel), which required total area coverage. The TLS scanner received deployment at different spots to avoid overlapping obstacles, which affected interior spaces and areas with architectural barriers. As detailed in the methodology, we collected 105 scans, focusing on interior spaces, wooden architectural features, and key structural elements. Our team placed artificial targets throughout the site to guarantee three matching reference points between consecutive scans for enhanced accuracy of their alignment. The alignment targets serve an essential role in point cloud registration to produce a single and accurate 3D spatial dataset. The assessment of TLS-generated point cloud accuracy depended on the root mean square error (RMSE) calculation method to guarantee precision levels [,]:
R M S E = 1 n i = 1 ( d m e a s u r e d , i d t r u e , i ) 2
where
  • d m e a s u r e d , i represents individual measured distances;
  • d t r u e , i denotes the reference (true) distances;
  • n is the total number of scanned points.
According to the technical specifications of the LS9-H 150 scanner, the distance measurement accuracy is ±1 mm at 10 m, ±2 mm at 25 m, and ±3.5 mm at 50 m. For example, assuming 100 scanned points at 25 m with a Gaussian error distribution, the total RMSE was computed accordingly. A similar analysis was conducted at 50 m to ensure reliability across various scanning distances. The angular accuracy of the scanner, rated at ±19 arcseconds (±0.0053°), introduces a potential deviation in the measured angles. The resulting linear displacement error at a given scanning distance L was calculated using the following relation:
E θ = L . T a n g ( θ )
where
  • E θ is the displacement error;
  • L is the scanning distance;
  • θ is the angular deviation.
At a scanning distance of 50 m, this angular misalignment was considered in the final 3D model to preserve spatial accuracy. To further improve the dataset, the iterative closest point (ICP) algorithm was employed for scan alignment and point cloud registration. The ICP registration error was calculated using [,]:
E I C P = 1 n i = 1 n P i Q i
where
P i and Q i represent the corresponding points in the overlapping scans.
Following ICP-based optimization, the mean alignment error was reduced to ≤5 mm, ensuring the production of a high-precision merged point cloud.
After data collection, the postprocessing phase was conducted using Autodesk ReCap 2025 to refine and optimize the point cloud dataset. This process involves noise reduction to eliminate unwanted data points, point cloud alignment to increase spatial accuracy, and artifact removal to correct scanning errors. These refinements ensured a clean and structured dataset suitable for detailed architectural analysis. The processed dataset enabled an in-depth assessment of various architectural and structural aspects of Shanasheel houses. Key evaluations included façade deterioration and weathering patterns, which helped identify material degradation over time, structural integrity analysis of both wooden and masonry components, ensuring their stability, and preservation strategies for the intricate wooden elements that define these historic structures. The final 3D scanning point cloud model serves as a scientific foundation for heritage conservation, providing a highly precise and reliable reference for restoration planning and long-term monitoring. By integrating high-accuracy geometric data with advanced computational analysis, this study plays a crucial role in the documentation, preservation, and sustainable conservation of Shanasheel houses, demonstrating the importance of LiDAR as a remote sensing technology and its role as a cornerstone for modern heritage management.
Table 1. Technical Specifications of the LS9 H 150 Laser Scanner.
FeatureFARO Focus Premium Laser Scanner
Scanning SpeedUp to 50% faster, ~1 min per scan
Color ResolutionUp to 266 megapixels for photorealistic 3D scans
Maximum Range300 m
Minimum Range0.1 m
Field of View360° × 270°
Environmental ProtectionResistant to dirt, dust, fog, rain, heat, and cold
Cloud IntegrationConnects to FARO Stream app and FARO Sphere cloud

4. Results

4.1. Data Registration

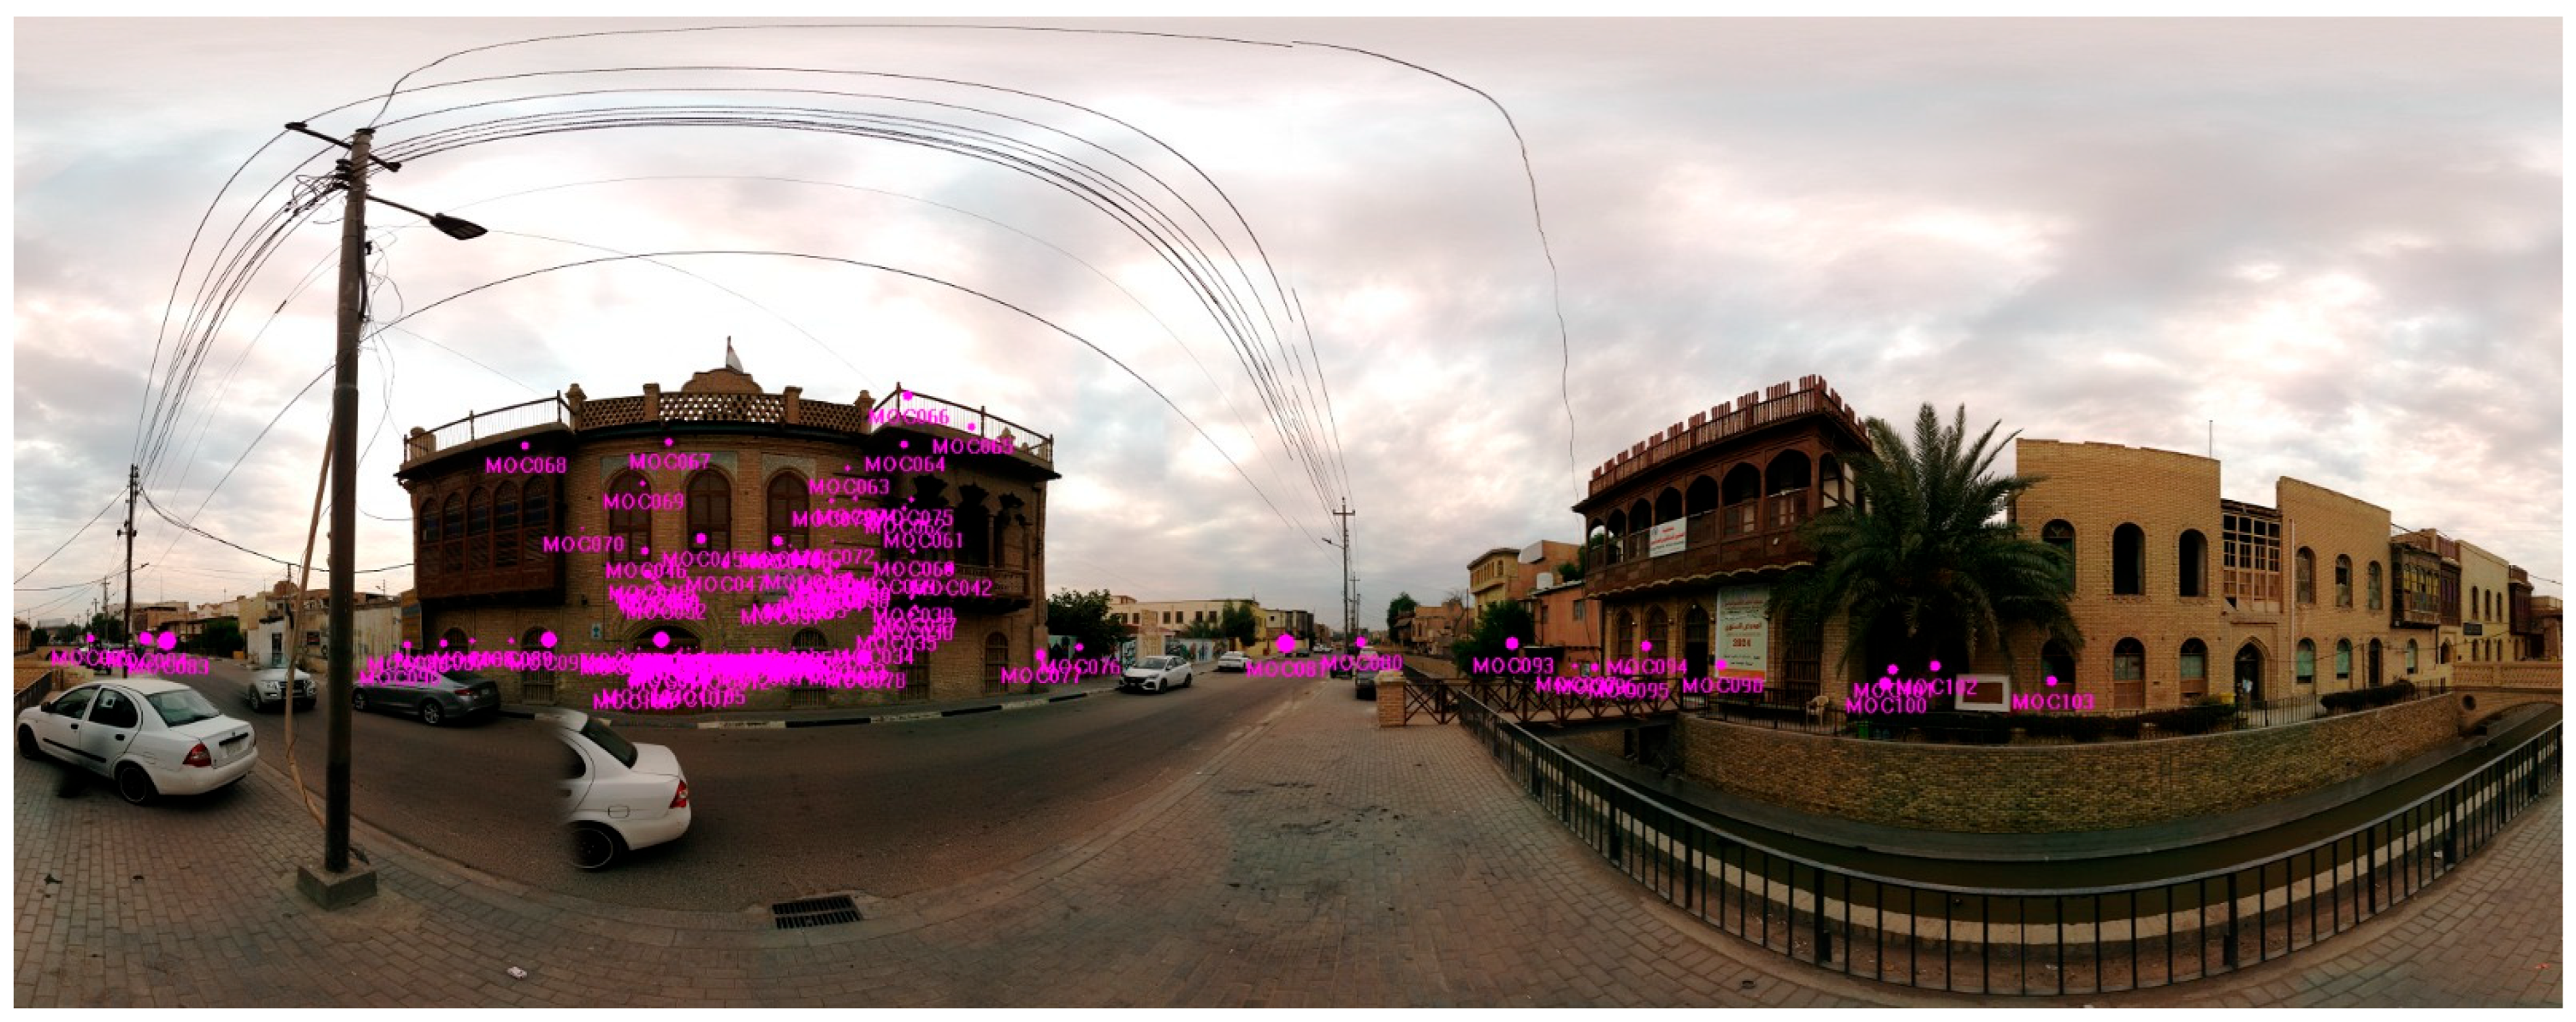
Using LS9 H 150 laser scanning technology, researchers produced a geometrically flawless three-dimensional heritage model that delivered accurate dimensional measurements for documentation purposes. The LS9 H 150 system creates highly accurate point clouds from which it collects fine architectural details together with accurate dimensional data of scanned structures. Laser scanning provides self-contained, precise data because it eliminates image-based reconstruction methods, making it suitable for complex architectural element representation. The position estimation was performed through corresponding scan points according to Figure 3 to achieve precise alignment and unified data integration. The defined mathematical principles enable this process to determine where individual scans exist within a common geometric reference system and their proper orientation. The scanner received its positional calculations and orientation parameters before the scans were matched through reference targets, along with overlapping features for building a continuous, complete 3D model. The precise laser scanning system delivers superior documentation quality for analyses studying Shanasheel houses both architecturally and historically, and for conservation planning purposes. The high-density point cloud data allowed researchers to minimize coverage gaps while precisely documenting intricate structural elements, including the ornate wooden latticework and complex façade details. The methodology serves as a vital tool for heritage preservation by generating important data that supports restoration planning and structural assessment, and condition monitoring and digital archiving.
Figure 3. In Pink, the positions of the laser scans according to the subsequently processed point cloud in Autodesk ReCap. The laser scanner survey included the ground floor, first floor, the main facade, and the surrounding context.

4.2. Accuracy Assessment

In this paper, we focused on analyzing the reliability of the point cloud data derived from Terrestrial Laser Scanning (TLS) to enhance the convergent usability of the dataset by assessing the positional accuracy of the recorded points. The registration process was performed using a cloud-to-cloud alignment approach, and the resulting numerical metrics were evaluated to quantify positional precision. The average registration error was 1.2 mm, with a maximum deviation of 5.9 mm and a minimum overlap of 16.2% between scans (Table 2). These results confirm that the TLS dataset exhibits high geometric fidelity and internal consistency, primarily due to the robust scanning workflow, which ensures sub-centimeter-level precision across the entire structure.
Table 2. Registration Accuracy Metrics for Selected Scans.
In addition, the values of the Root Mean Square Error (RMSE) also prove the high quality of registration and general accuracy of the Terrestrial Laser Scanning (TLS) data. Table 3 provides a summary of the RMSE and density results of the TLS data, where the average RMSE is 1.2 mm, and this confirms that there is an accuracy of less than a centimeter in the alignment process. The density of point clouds was 3500 to 4200 points/m2, with a minimum of 2800 points/m2 and a maximum of 4500 points/m2, which indicates that a lot of geometric detail was recorded on surfaces that were scanned. The overlap percentage was between 16.2 and 90.8, which means that the individual scans were very well and stably integrated. Moreover, the precision of scan alignment was within the range of 2.0 mm, which shows the strength and inter-test reliability of the TLS registration process.
Table 3. Root Mean Square Error (RMSE) and Point Cloud Density Metrics.

4.3. Point Cloud Registration

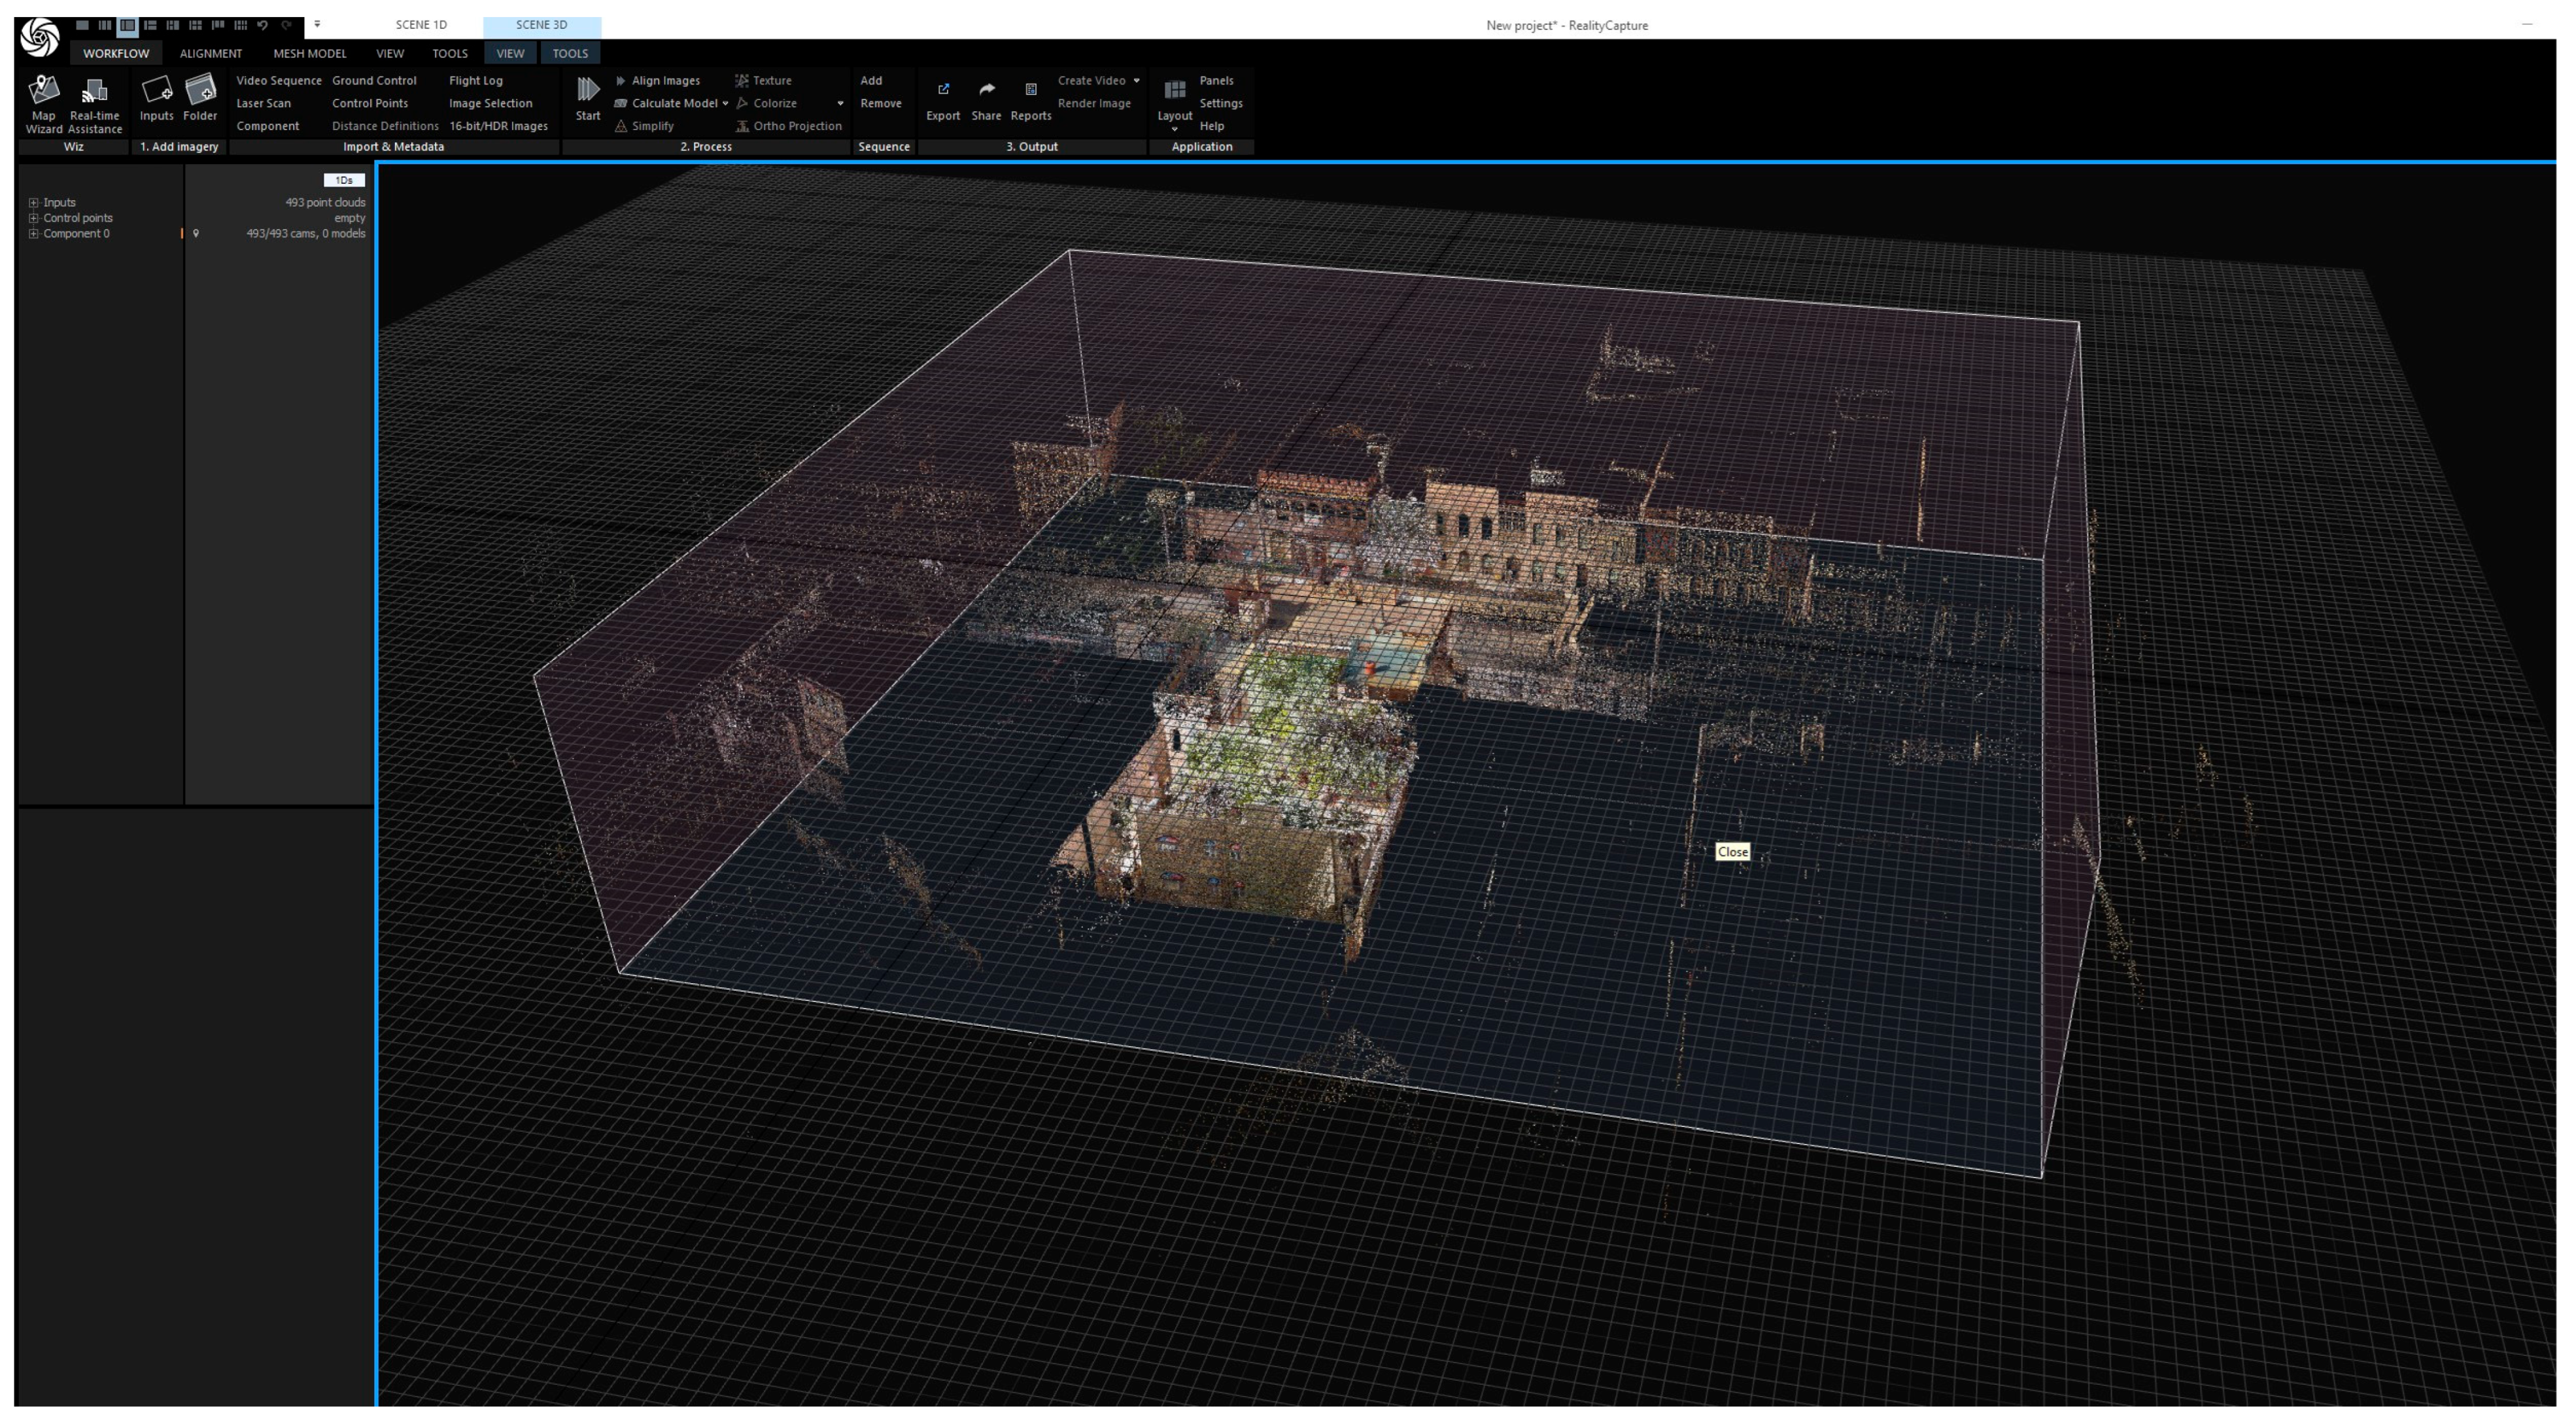
After the field data collection, the LiDAR (Terrestrial Laser Scanning, TLS) dataset was processed to generate a precise 3D digital model of the Shanasheel house. The raw scans, exported in .e57 format, were first registered, aligned, and cleaned to remove noise and redundant points. The registered scans were then merged into a single structured .e57 file and imported into RealityCapture 1.5 for visualization and model refinement (Figure 4). The concept of alignment is used in this workflow to denote the process of registering laser scans only. The registration procedure was also optimized with survey targets, the coordinates of which were accurately determined to make the procedure very spatial. It should be stressed that the photogrammetric reconstruction was not carried out in this case because the field conditions in Iraq were not easy. The texturing of the laser-generated 3D model using high-resolution images taken in the field was only applied to increase its visual realism, but did not interfere with its geometry.
Figure 4. Point clouds processed in RealityCapture 1.5 from the laser scanner survey. The alignment of scans begins from a master station that controls the entire project, with subsequent scans progressively aligned to it.
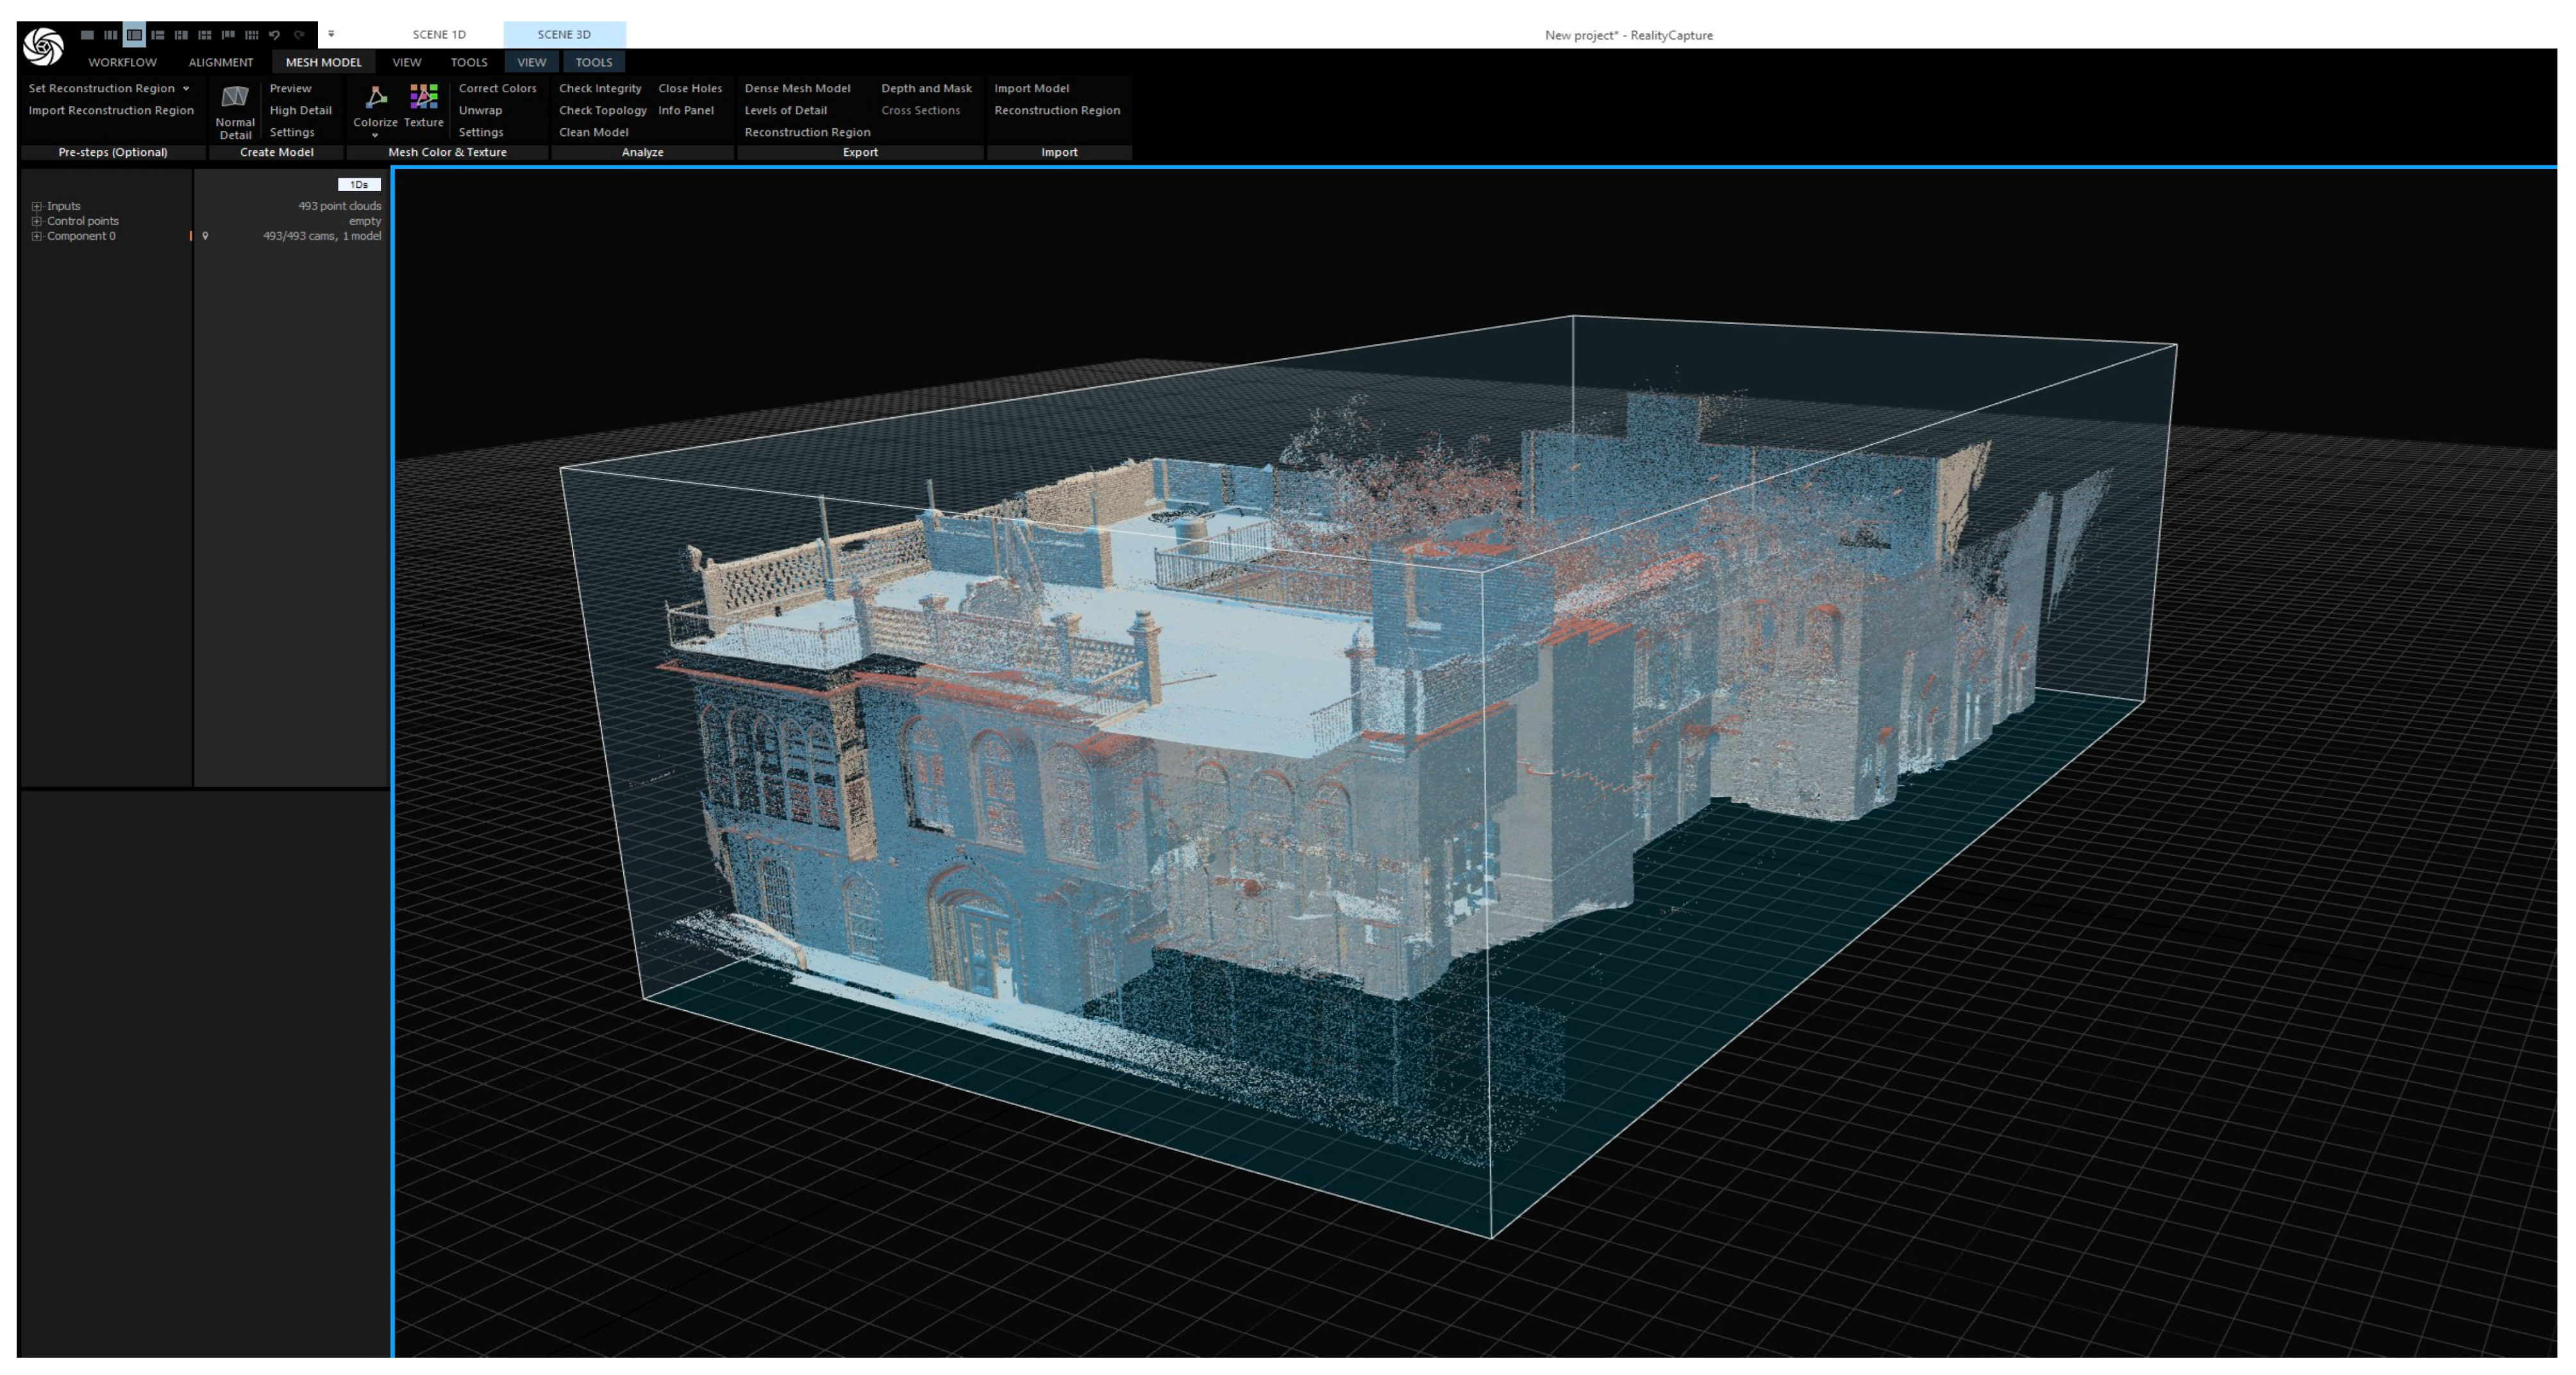
The outcome of the registration phase enabled the software to accurately align all LiDAR scans within a unified spatial reference system. Point cloud registration was performed in RealityCapture 1.5 to ensure that all scan stations collected during the survey were properly aligned and spatially consistent. The registration process involved two complementary methods: cloud-to-cloud registration, which relied on overlapping geometry between adjacent scans, and target-based registration, which utilized reference objects such as spheres and planar targets to enhance alignment precision. The workflow was carried out in two stages. In the automatic registration stage, RealityCapture aligned the scans through surface matching, assessing parameters such as point density, station elevation, and spatial distribution to detect and minimize potential misalignments. In the manual refinement stage, a reference scan was designated, and the relative positioning of the remaining scans was adjusted to achieve optimal surface correspondence. This refinement significantly reduced alignment errors and improved the overall geometric integrity of the dataset. As illustrated in Figure 5, the resulting 3D mesh generated in RealityCapture required additional cleaning and optimization to ensure both geometric accuracy and analytical usability. The process began with the removal of unwanted or misaligned geometry, followed by topological integrity checks to identify non-manifold edges, holes, and isolated vertices. The Clean Model tool was used to correct these issues, while the Close Holes function produced a continuous, watertight surface suitable for further modeling. Subsequent refinement was performed in Autodesk ReCap 2025, where cleaning, smoothing, and detail enhancement tools were applied to recover fine architectural features. The final mesh was then exported and paired with the original .rcinfo metadata file from RealityCapture—renamed to correspond with the new mesh filename—before being re-imported for validation and integration into the digital reconstruction workflow.
Figure 5. Point cloud alignment and registration in RealityCapture 1.5. The left panel shows the meshed point cloud derived from the laser scanner survey, while the right panel displays the registered scans with bounding boxes defining the reconstruction region.
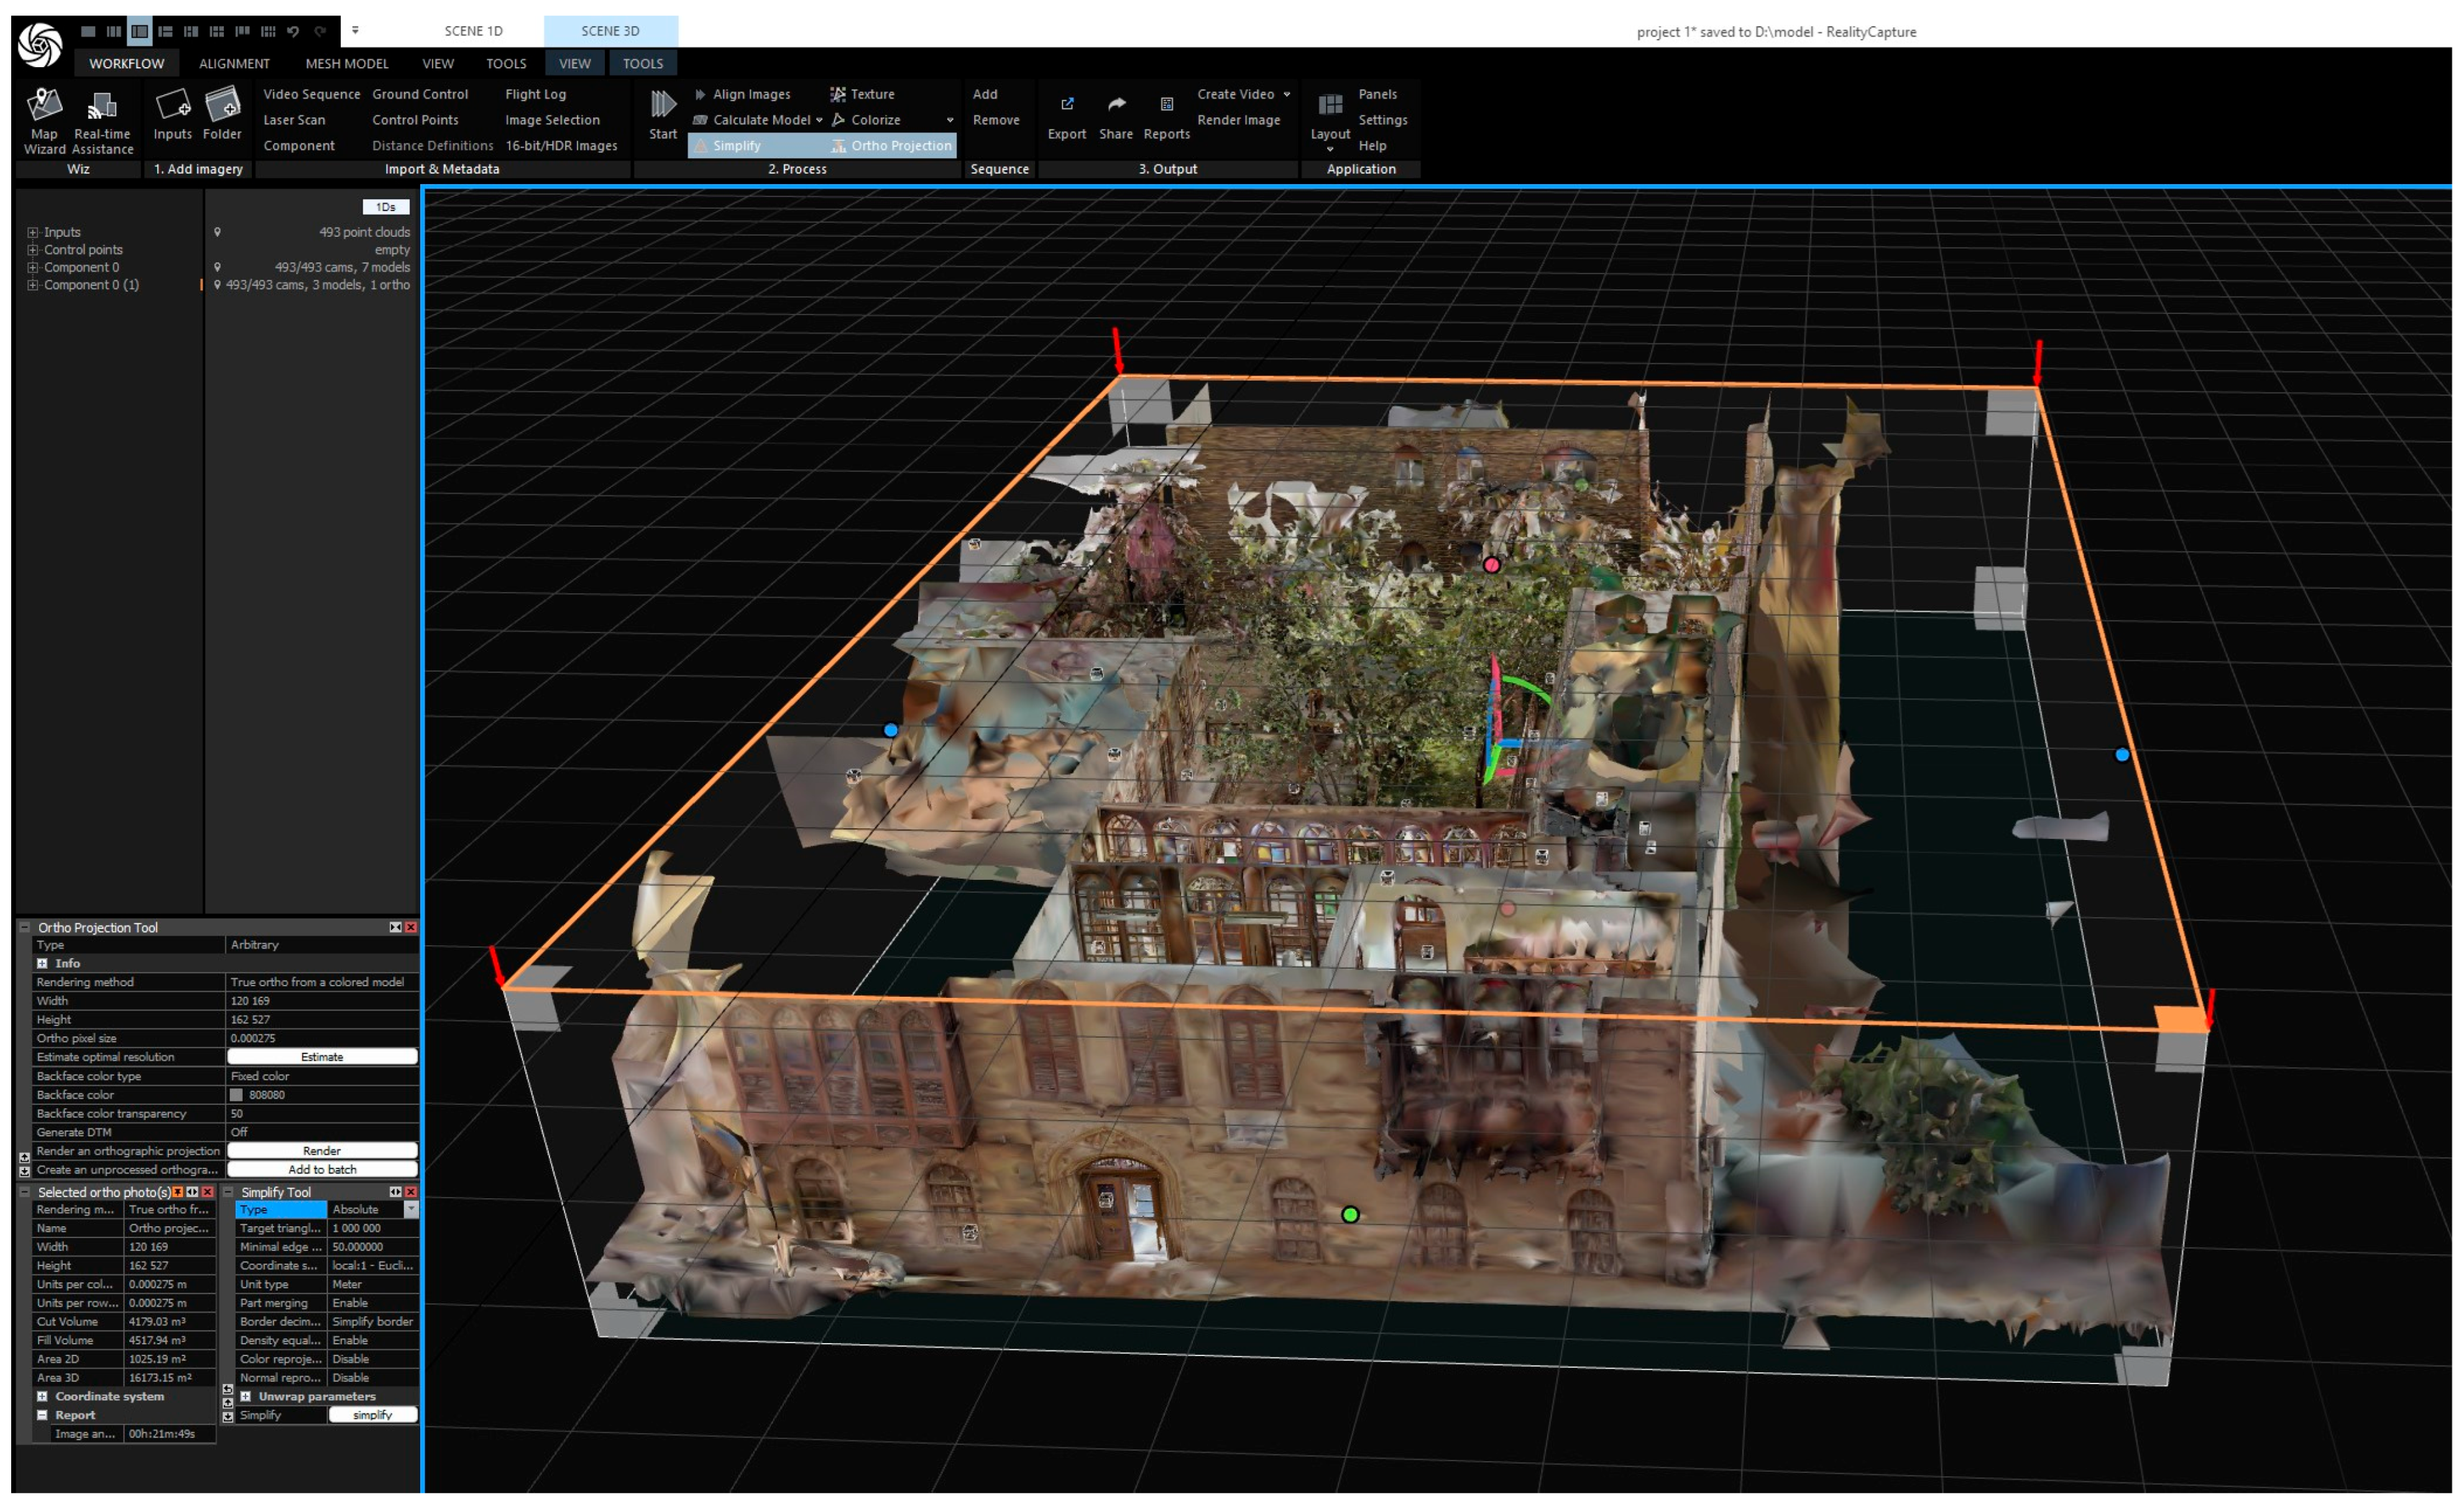
The next stage involved unwrapping and texturing the 3D model to achieve a realistic visual representation of the Shanasheel house. Unwrapping created a UV map, a flattened representation of the model’s surface, allowing textures to be applied with precision. The process began by selecting the model and using the Unwrap function in the Reconstruction ribbon, which automatically calculated an optimal texel size, although custom values (4 mm) could be defined for terrestrial models to control resolution (See Figure 6 for details). Two approaches were then available: coloring (F8), which assigns colours directly to model vertices and produces smaller file sizes, or texturing (F9), which generates detailed surface textures for a more realistic result. To optimise the process, only high-quality input images were retained, with irrelevant or poorly aligned images disabled in the SCENE 3D/TOOLS tab; custom weight values could also be assigned to prioritise specific images. Texturing options were then configured, with users able to select between linear or multi-band coloring methods, visibility-based, photo-consistency, or mosaicing styles, and performance optimisations such as image downscaling or automatic filling of untextured areas. For additional flexibility, the Texture Reprojection Tool allowed colour data from a textured source model to be transferred onto simplified or reprocessed versions of the mesh, avoiding the need for complete re-texturing. Finally, the textured model was exported in interoperable formats such as .FBX or .OBJ, with embedded textures stored in .JPG format.
Figure 6. Unwrapping and texturing stage of the 3D Shanasheel model in RealityCapture 1.5. The reconstruction region is defined around the model, and UV unwrapping is applied to generate a flattened surface representation for accurate texture mapping. This process ensures precise alignment of high-quality images onto the geometry, resulting in a realistic and visually consistent model.

4.4. Point Cloud Denoising and CAD-Based Style Analysis

The generation of orthophotos from the LiDAR scans in RealityCapture began with defining the region of interest, setting orientation parameters, and configuring the output resolution to ensure that the resulting images preserved the true scale and proportions of the scanned structure. This workflow was designed to maximize the geometric fidelity of the TLS point cloud, producing orthographic images that accurately represented the Shanasheel house for use in architectural documentation, GIS analysis, and CAD modeling. Each orthophoto was generated to correspond precisely with the section planes defined in the CAD environment, maintaining spatial alignment with the 3D scan data. As illustrated in Figure 7A, the TLS point cloud was rigidly aligned with the point cloud generated in Autodesk ReCap, and the registered dataset was exported in .e57 format for downstream use. This co-registration allowed us to work simultaneously on the sectioned point cloud and its co-registered raster derived from the mesh, giving a clearer view of façade material qualities during the 2D redrawing phase. The complete point cloud, imported into AutoCAD 2025, was intersected by a section plane created for the floor plan. To obtain each façade, three markers were positioned on the mesh and used to define the horizontal and vertical axes of the projection plane. Using the mesh as the reference surface and enabling automatic hole filling, all orthophotos were subsequently produced.
Figure 7. Workflow of the digital documentation of a Shanasheel house in Al-Basrah, Iraq: (A) TLS-based colorized point cloud of the façade; (B) CAD-generated architectural elevation; (C) 3D reconstruction of the main entrance with detailed geometry; (D) extracted architectural elements, including entrance and interior doors and wooden decorative details.
Each mage was imported as a raster reference into the respective CAD file, positioned on the correct section plane, and carefully scaled and aligned with the orthogonal views generated from the point cloud. For every redrawn façade, two versions of the image were prepared: the first serving as a direct base for CAD tracing, and the second with a white background beneath the redrawn areas, leaving the surrounding context to emphasise the two-dimensional representation. The final stage of the process involved the 2D reconstruction of surveyed floor plans and elevations (Figure 7B), developed in detail by integrating data from images, point clouds.
Consequently, a coherently built 3D model was obtained, with each TLS dataset—representing individual scanning stations—accurately registered and aligned with minimal residual error. The registration process ensured full spatial coherence among all scans, forming a unified point cloud suitable for mesh reconstruction. A 3D mesh reconstruction was subsequently generated by initiating the mesh modelling process, during which specific parameters were applied to simplify and optimise the dataset for online visualisation. The workflow began with the edited reference model derived from the registered TLS scans, rather than the raw high-polygon version, and utilised the Simplify Tool in the reconstruction tab of RealityCapture. Relative Simplification was first applied in 50% increments, repeated over multiple steps until the model reached slightly above one million triangles. This was followed by Absolute Simplification, fixing the polygon count at 1,000,000 to ensure consistency across models. The Clean Model tool was then used to correct mesh irregularities, and the optimised version was saved as the “Sketchfab” model (see Figure 8). High-resolution textures from the original reference mesh were subsequently reprojected onto the simplified model using the Texture Reprojection tool. Finally, the model was exported as an .fbx file with embedded textures, with the texture format standardised to .jpg to ensure efficiency and compatibility with web-based visualisation platforms.
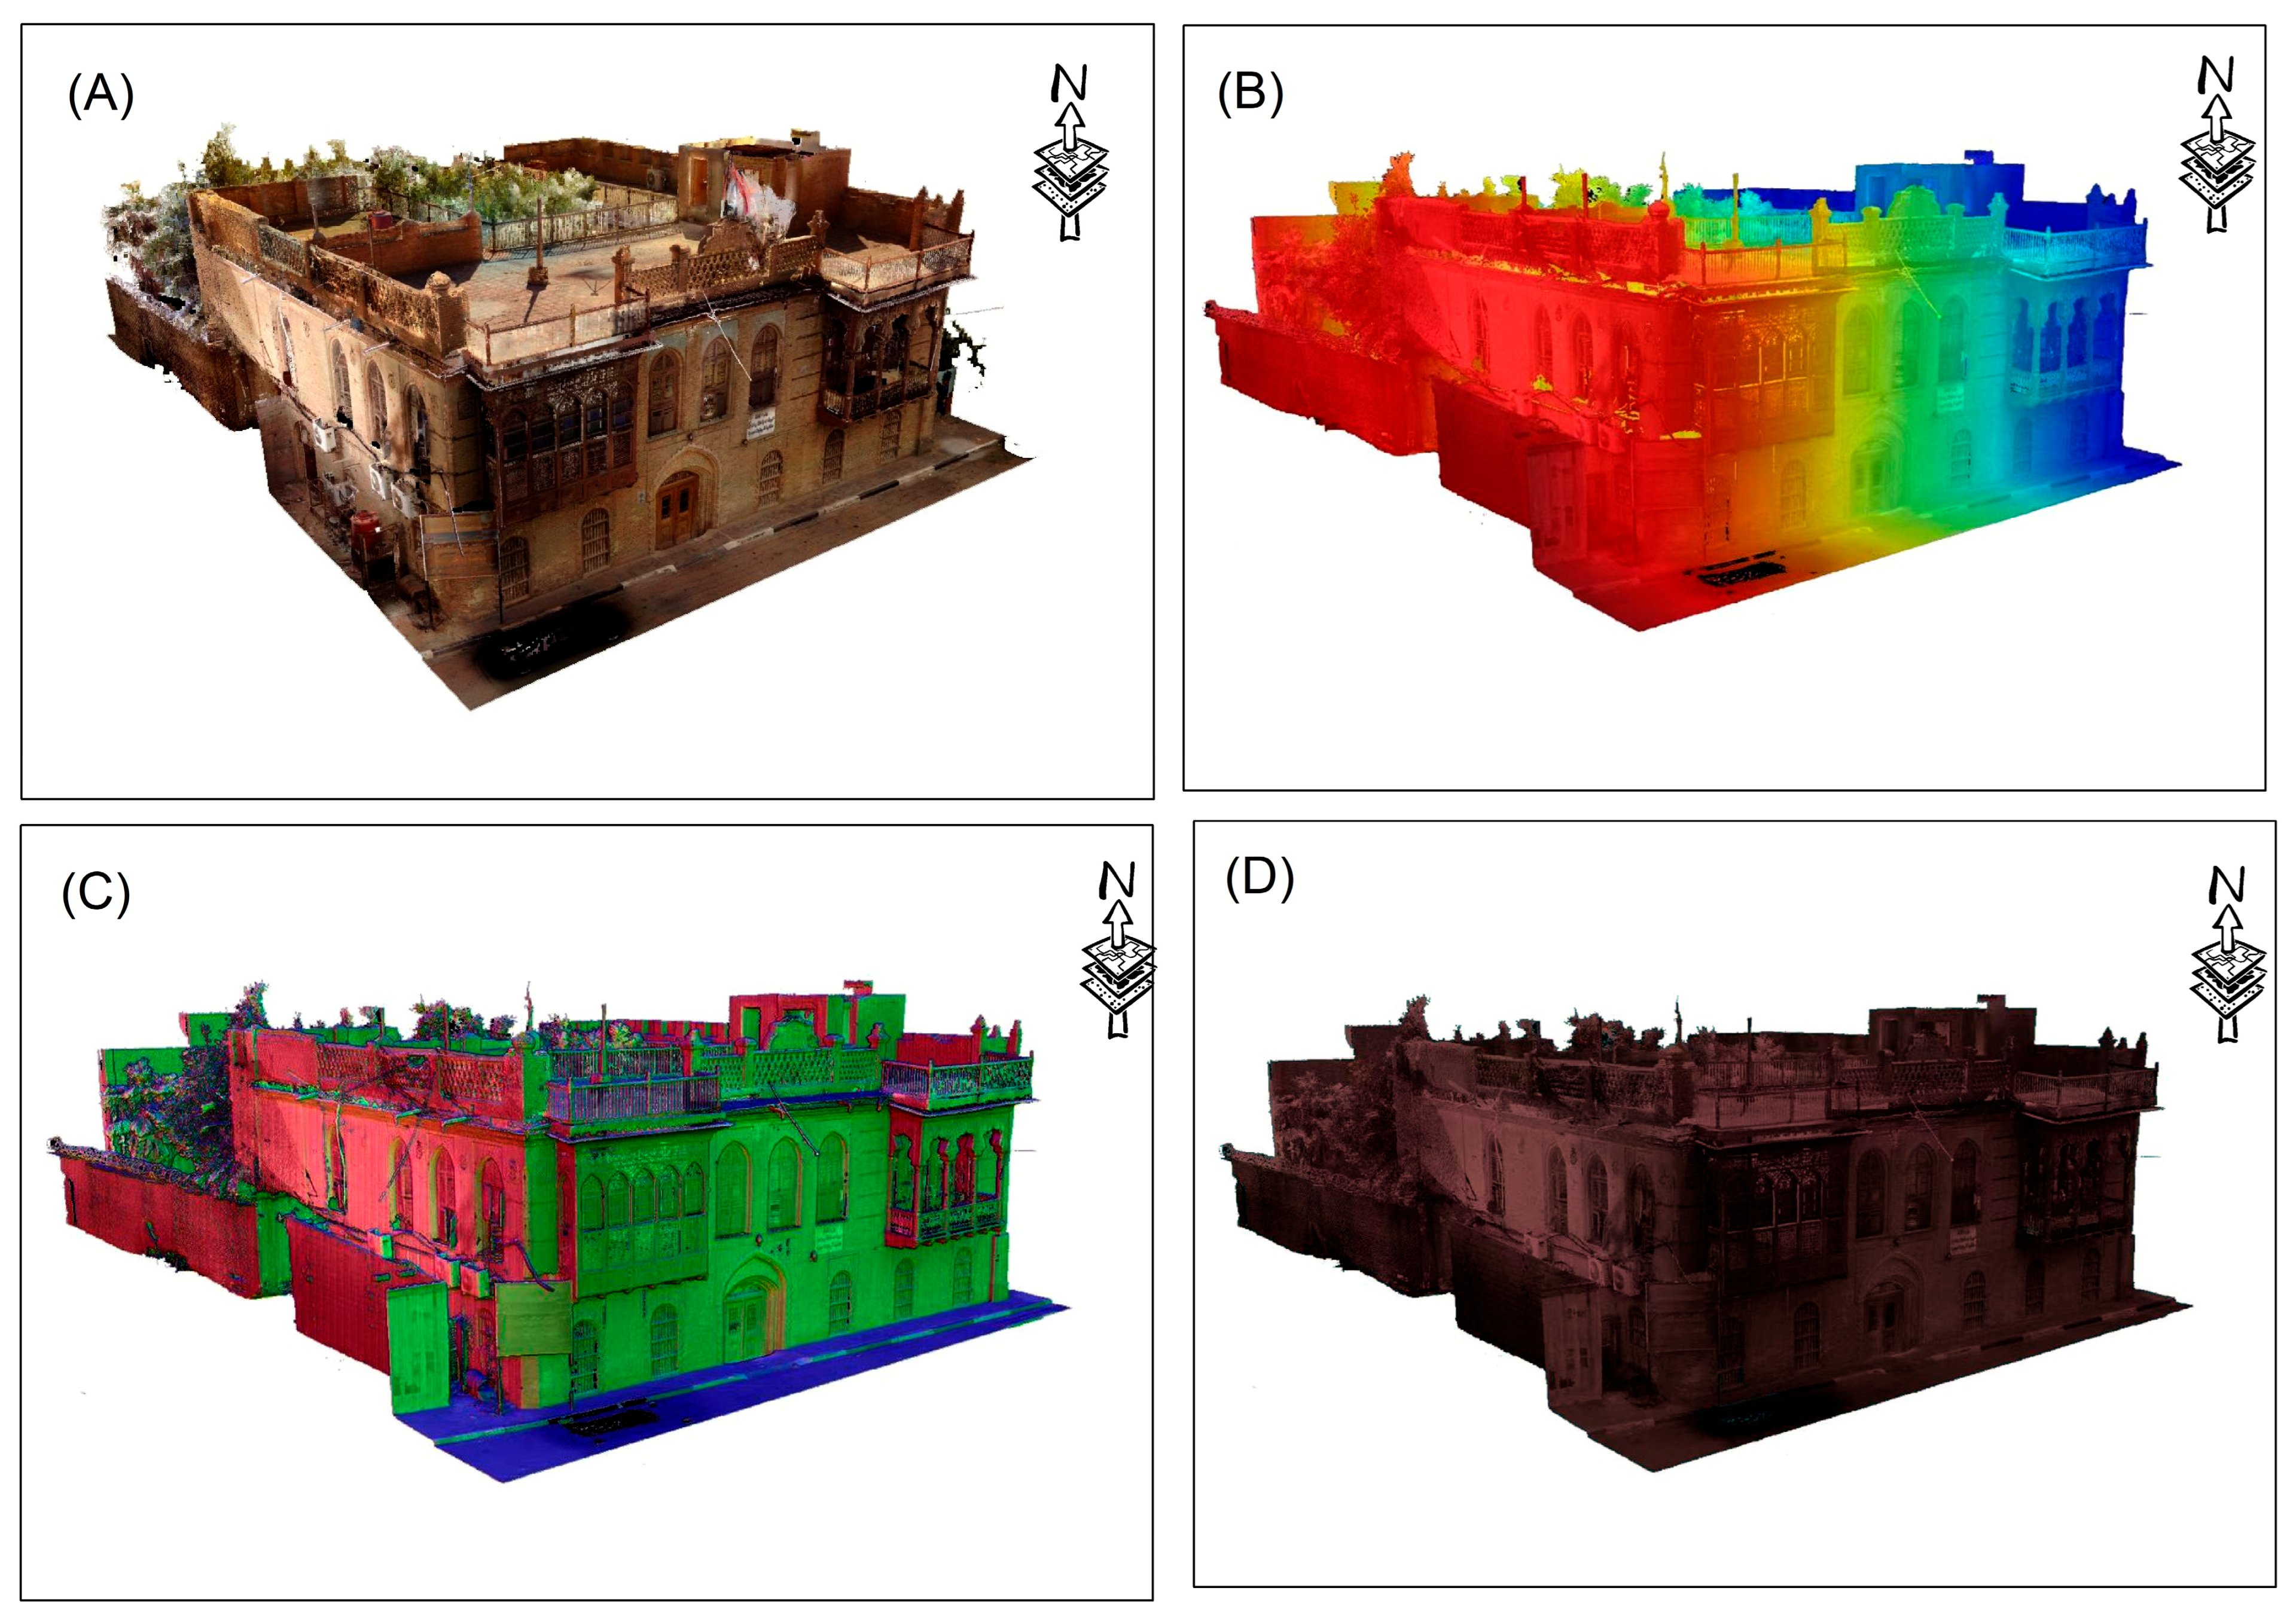
Figure 8. Three-dimensional reconstruction of a Shanasheel house in Basra using Terrestrial Laser Scanning (TLS): (A) textured 3D model, (B) elevation-colored point cloud, (C) surface normal classification, and (D) Intensity map visualization.

4.5. GIS for Data Management and Mapping of Shanasheel Houses

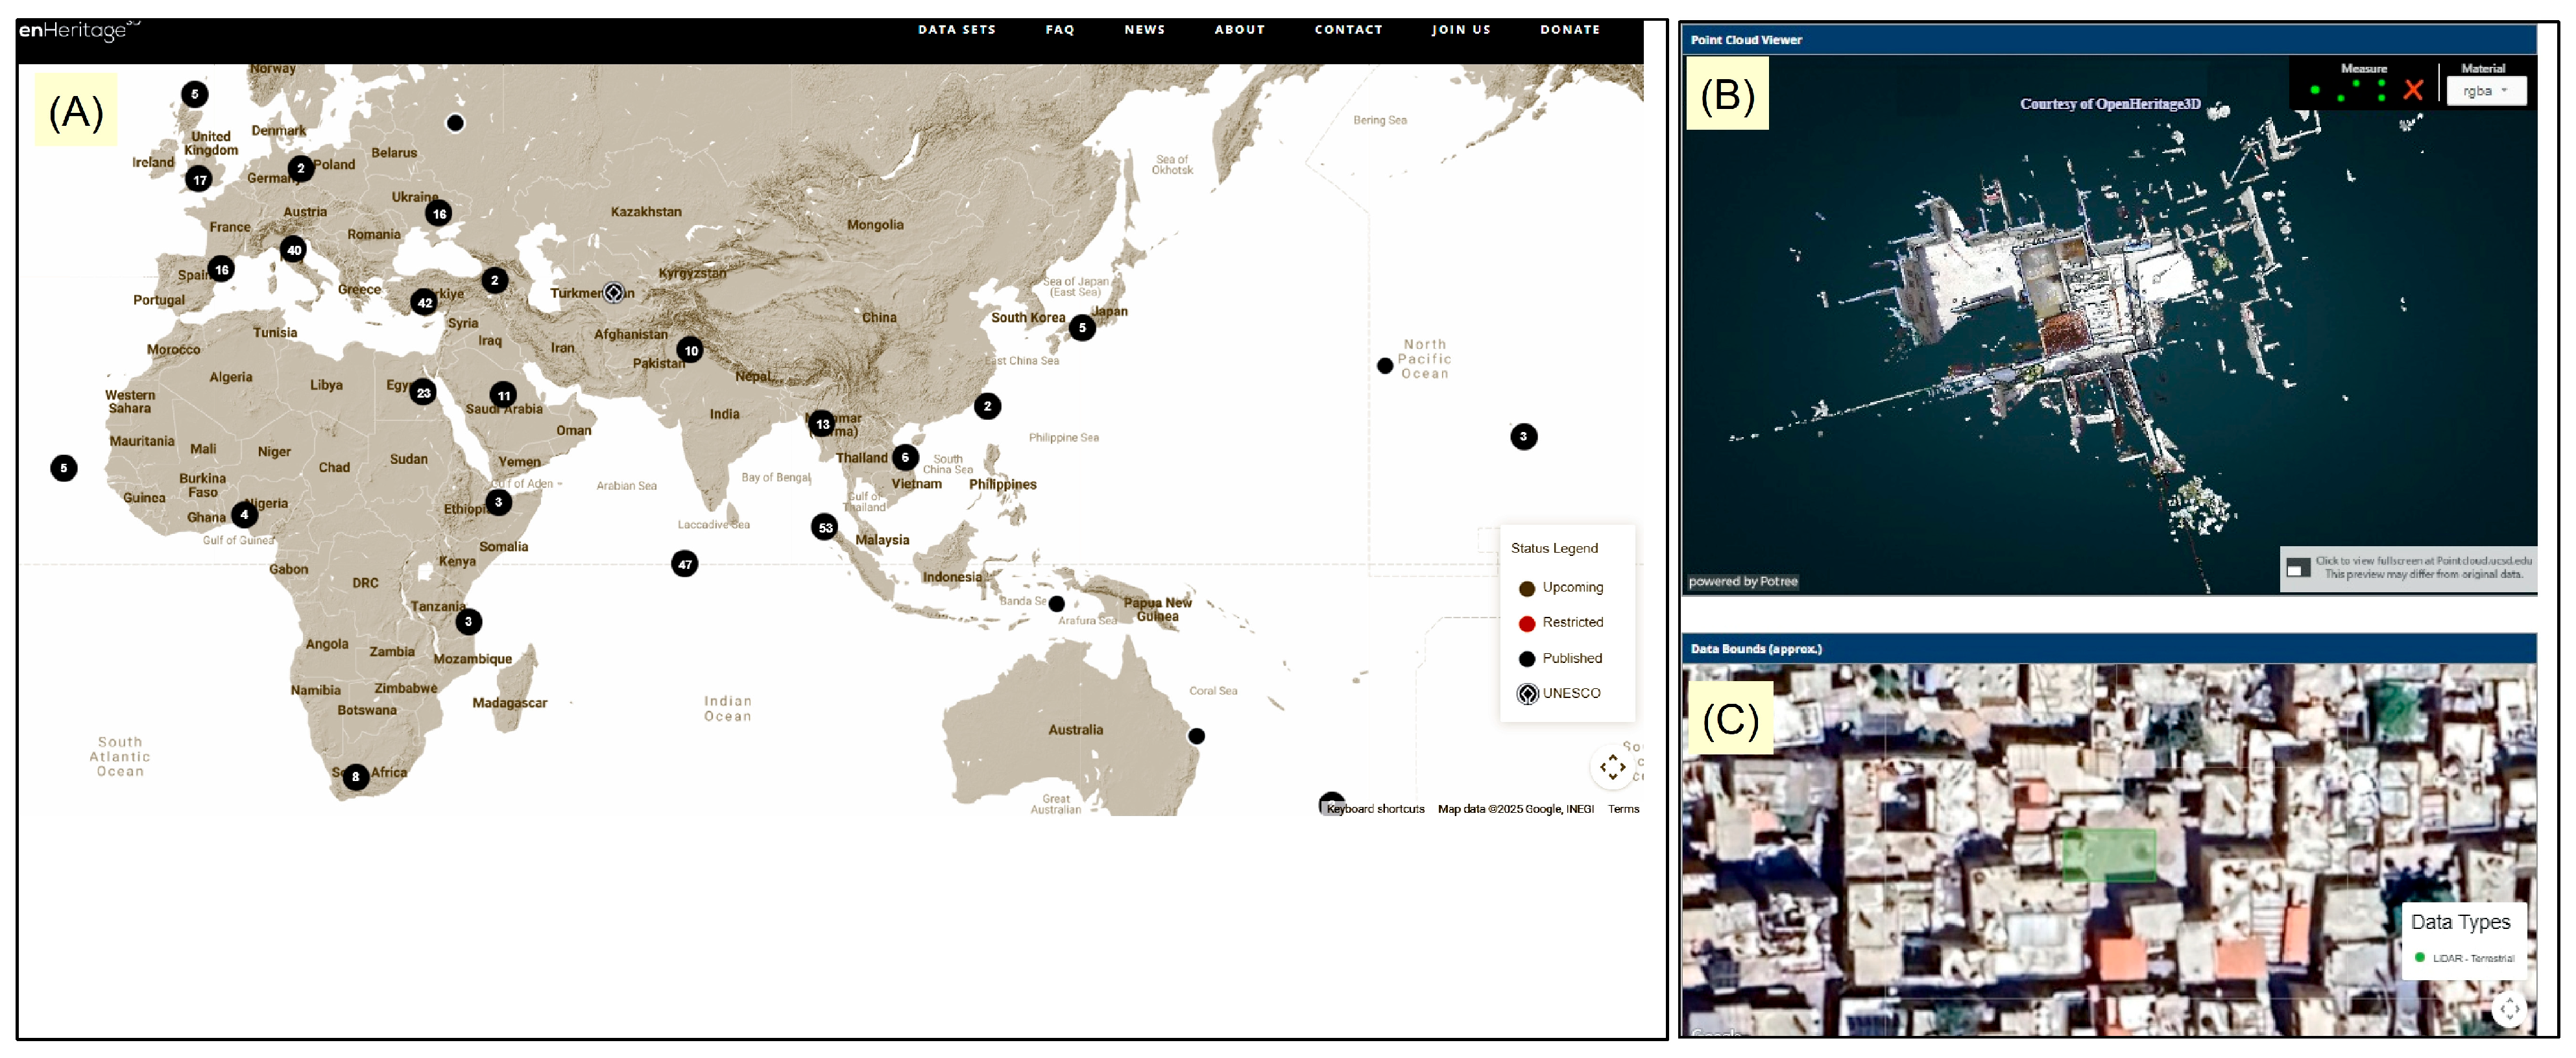
In this way, Geographic Information Systems (GIS) are useful for accumulation, storage, and analysis [,,,], and mapping spatial data, which is vitally important to the digitization and preservation of cultural heritage [,,]. In the context of Shanasheel houses study, GIS facilitates the systematic collection, organization, and analysis of data related to these architecturally and culturally significant structures, ensuring a comprehensive and precise documentation of their key features []. Therefore, this study utilizes GIS technology as a research methodology to facilitate the spatial documentation of the endangered BAIH Shanasheel house in Al-Basra, where their georeference coordinates were recorded and their data were stored as sets in ArcGIS Online for organized management, visualization, and mapping. Through building a detailed ArcGIS Online mapping platform, real-mapping access to spatial data, interactive visualization and integration of multiple heritage-related datasets has been achieved. This method enables spatial analysis of distribution patterns of Shanasheel houses and facilitates a broader understanding of other driving forces, which may include urban encroachment, structural deterioration, and environmental impact. Rock formations, natural slopes, boundaries and many other characteristics can all be overlayed onto heritage sites using GIS, giving researchers greater insight into the problems that may ensue with these historic buildings. A detailed and organized documentation system has been prepared that provides a GIS–based heritage database for systematized retrieval, analysis, and conservation management. This database consists of important characteristics, including structure identification (unique identification number, name, description, external links), location and spatial information (address, geographic coordinates, spatial geometry), structural details (building footprint, architectural attributes, structural system), architectural details (roof type and shape, interior and exterior coverings), material and design aspects (wood types, decorative features, inscriptions, decoration), openings and access points (individual door and window types), risk factors (period of construction, documented threats, functional use). This structured dataset improves documentation accuracy, data integration, and analytical capabilities, leading to informed conservation decisions by professionals in heritage. An overall ArcGIS online platform was created to conduct spatial analysis associated with Shanasheel houses distribution and to combine related data on environmental stressors, urban development, and structural degradation. This platform is used to identify urban encroachment and material deterioration, and effects caused by climate (Figure 9 and Figure 10). The overlay of contextual data of landscape morphology, land use arrangements and closeness to infrastructures further develops the spatial interpretation of the complex threats to these vulnerable heritage resources. Based on the previous research integration of GIS and BIM for sustainable heritage retrofitting [,,,,], GIS is, within this study, one of the important parts of Iraq’s digital conservation strategy []. Belonging to the Endangered Wooden Architecture Programme (EWAP), the developed GIS platform is deposited in OpenHeritage3D, with all the spatial and 3D point cloud data as shown in Figure 8. That ensures long-term availability and interoperability, and membership in the global best practice regarding the remote sensing-based conservation of digital heritage.
Figure 9. (A) Global map illustrating the distribution of documented heritage sites within the Endangered Wooden Architecture Programme (EWAP) database. (B) GIS interface showing the spatial location of Shanasheel houses in Al-Basrah, Iraq, with corresponding metadata attributes including coordinates, structure type, function, and risk level.
Figure 10. Point Cloud and GIS-Based Mapping of a Heritage Site. (A) Global map showing the geographic distribution of documented heritage sites. (B) 3D point cloud visualisation of the scanned heritage structure generated from TLS data. (C) GIS-based geospatial overlay of LiDAR-derived data and high-resolution satellite imagery showing the spatial context of the documented heritage site.

5. Discussion

The integrated TLS–GIS approach proved highly effective in generating 2D and 3D metrically accurate models of the Shanasheel houses in Al-Basrah. The 2D restitutions provided precise plans and elevations to support restoration planning, while the 3D reconstruction offered a textured, colorized visualization suitable for condition mapping, simulation, and stakeholder engagement. When combined with GIS spatial analytics, these datasets enabled the examination of environmental threats, urban encroachment, and structural deterioration, providing a solid foundation for risk assessment and decision-making frameworks in heritage management.
However, several limitations were encountered during fieldwork and data processing. Many Shanasheel structures were too deteriorated or structurally unsafe for direct scanning, requiring careful planning of scanning positions to maximize coverage. Large building volumes and narrow alleyways imposed spatial constraints that extended scanning duration and increased computational demands. Fine wooden details—such as deep reliefs and latticework—were prone to under-sampling and meshing artefacts, which were mitigated through close-range scanning, cross-polarization to reduce glare, and high-detail meshing for façade subsets. During registration, TLS geometry was assigned priority weighting in the iterative closest point (ICP) alignment to minimize residual errors between overlapping scans. Image masks were applied to exclude background elements visible through lattice openings, minimizing the generation of ghost geometries. For low-texture or reflective surfaces, scanning under diffuse lighting conditions (overcast skies or early mornings) improved point quality and reflectivity. Multi-band texture blending was employed during texturing to correct radiometric inconsistencies, while TLS data reinforced geometric fidelity across all surfaces. The hybrid registration workflow—combining target-based alignment to the survey control network, cloud-to-cloud ICP with robust kernels, and manual refinement on control façades—resulted in RMSE values below 5 mm, confirming accurate integration of all datasets. Local misalignments exceeding tolerance thresholds were addressed through selective reprocessing or constraint re-weighting. Despite these technical achievements, limitations remain. TLS systems face operational challenges in tight urban environments and complex interiors, where occlusions restrict line-of-sight coverage. The use of UAV photogrammetry could complement TLS by capturing roof structures and upper façades; however, airspace restrictions and security regulations in Iraq often prevent drone deployment. Looking ahead, machine learning and AI-based point cloud [,,] processing tools offer promising avenues for automating feature extraction, object classification, and deterioration detection. Their integration with TLS–GIS workflows could enhance scalability, reduce manual intervention, and enable more efficient and cost-effective documentation. Such innovations would not only improve precision and productivity but also broaden access to advanced remote sensing technologies for heritage documentation and conservation across Iraq and beyond.

6. Conclusions

This study established a high-precision 3D model and comprehensive digital documentation of the Shanasheel house in Al-Basrah through the integration of Terrestrial Laser Scanning (TLS) and Geographic Information Systems (GIS). Using a FARO LS9-H 150 scanner, multidirectional, high-density spatial data were acquired to capture the intricate geometries and structural conditions of this endangered heritage asset. TLS demonstrated exceptional performance, particularly in the perpendicular direction to façades, enabling detailed reconstruction of the delicate wooden latticework and ornamental carvings that characterize Shanasheel architecture. The TLS data were processed in RealityCapture 1.5 to produce metrically accurate orthophotos, elevations, and textured 3D meshes, which were subsequently integrated within GIS for spatial analysis and visualization. Accuracy assessment confirmed the superior positional precision of TLS, achieving an overall RMSE of approximately 1.2 mm, consistent with conservation-grade documentation standards. The registered point clouds produced a coherent and metrically reliable 3D model of both the building and its surrounding topography, providing a robust foundation for heritage risk assessment and spatially informed management through GIS-based analytics. Beyond its site-specific results, the proposed workflow demonstrates a replicable and transferable methodology for digital heritage documentation and monitoring. By coupling high-resolution 3D data with spatial intelligence, the approach bridges micro-scale recording (individual structures) with macro-scale monitoring of urban expansion, environmental stress, and climate-related impacts. Although further refinement of data acquisition procedures, fusion workflows, and scalability is recommended, the integrated TLS–GIS framework developed in this study underscores the potential of terrestrial laser scanning as a core technology for digital documentation, analysis, and conservation management of cultural heritage sites. The future incorporation of AI-assisted analytics will enhance automation in change detection and condition monitoring. Collectively, these advances align with international developments in remote sensing and digital heritage, providing a scalable, precise, and future-oriented framework for the preservation of cultural assets under increasing environmental and urban pressures worldwide.

Author Contributions

Conceptualization, G.S. and N.B.; methodology, N.B.; software, N.B.; validation, G.S., N.B. and A.T.; formal analysis, G.S. and N.B.; investigation, N.B., G.S., S.L.F., D.A. and A.T.; resources, G.S. and N.B.; data curation, N.B., G.S.; writing—original draft preparation, N.B., G.S., S.L.F., D.A. and A.T.; supervision, G.S.; project administration, G.S. and N.B.; funding acquisition, G.S. and N.B. All authors have read and agreed to the published version of the manuscript.

Funding

This work was supported by the Endangered Wooden Architecture Programme (EWAP), funded by Arcadia, and hosted at Oxford Brookes University as part of the project Documenting and Recording the Endangered Heritage of Shanasheel Wooden Houses in Iraq www.brookes.ac.uk/ewap accessed on 26 August 2025.

Data Availability Statement

The data presented in this study are available upon request from the corresponding author.

Conflicts of Interest

Author Aussama Tarabeih was employed by the company Virtual World Lines. The remaining authors declare that the research was conducted in the absence of any commercial or financial relationships that could be construed as a potential conflict of interest.

Abbreviations

The following abbreviations are used in this manuscript:
AIArtificial Intelligence
BAIHAl-Basrah Antiquities Inspectorate Headquarters House (Shanasheel house case study)
BIMBuilding Information Modelling
CADComputer-Aided Design
EWAPEndangered Wooden Architecture Programme
GISGeographic Information Systems
LiDARLight Detection and Ranging
TLSTerrestrial Laser Scanning
UAVUnmanned Aerial Vehicle

References

  1. Selim, G.; Farhan, S.L. Reactivating voices of the youth in safeguarding cultural heritage in Iraq: The challenges and tools. J. Soc. Archaeol. 2024, 24, 58–78. [Google Scholar] [CrossRef]
  2. Selim, G.; Jamhawi, M.; Ma’bdeh, S.; Holland, A. Digitizing Heritage as an Integrated, Sustainable Tool for Interpretation of the Past. Tradit. Dwell. Settl. Rev. 2021, 32, 7–21. [Google Scholar]
  3. Maté-González, M.Á.; Di Pietra, V.; Piras, M. Evaluation of different LiDAR technologies for the documentation of forgotten cultural heritage under forest environments. Sensors 2022, 22, 6314. [Google Scholar] [CrossRef] [PubMed]
  4. Llabani, A.; Abazaj, F. 3D documentation of cultural heritage using terrestrial laser scanning. J. Appl. Eng. Sci. 2024, 22, 267–271. [Google Scholar] [CrossRef]
  5. Li, Y.; Zhao, L.; Chen, Y.; Zhang, N.; Fan, H.; Zhang, Z. 3D LiDAR and multi-technology collaboration for preservation of built heritage in China: A review. Int. J. Appl. Earth Obs. Geoinf. 2023, 116, 103156. [Google Scholar] [CrossRef]
  6. Megarry, W.P.; Davenport, B.A.; Comer, D.C. Emerging applications of LiDAR/airborne laser scanning in the management of world heritage sites. Conserv. Manag. Archaeol. Sites 2016, 18, 393–410. [Google Scholar] [CrossRef]
  7. Jo, Y.H.; Hong, S. Three-dimensional digital documentation of cultural heritage site based on the convergence of terrestrial laser scanning and unmanned aerial vehicle photogrammetry. ISPRS Int. J. Geo-Inf. 2019, 8, 53. [Google Scholar] [CrossRef]
  8. Galantucci, L.; Piperi, E.; Lavecchia, F.; Zhavo, A. Semi-automatic low cost 3D laser scanning systems for reverse engineering. Procedia Cirp 2015, 28, 94–99. [Google Scholar] [CrossRef]
  9. Calisi, D.; Botta, S.; Cannata, A. Integrated surveying, from laser scanning to UAV systems, for detailed Documentation of architectural and archeological heritage. Drones 2023, 7, 568. [Google Scholar] [CrossRef]
  10. Abd-Elmaaboud, A.; El-Tokhey, M.; Ragheb, A.; Mogahed, Y. Comparative assessment of terrestrial laser scanner against traditional surveying methods. Int. J. Eng. Appl. Sci. 2019, 6, 79–84. [Google Scholar]
  11. Wang, J.; Yi, T.; Liang, X.; Ueda, T. Application of 3D laser scanning technology using laser radar system to error analysis in the curtain wall construction. Remote Sens. 2022, 15, 64. [Google Scholar] [CrossRef]
  12. Lemmens, M. Terrestrial laser scanning. In Geo-Information: Technologies, Applications and the Environment; Springer: Dordrecht, The Netherlands, 2011; pp. 101–121. [Google Scholar]
  13. Olsen, M.J.; Kuester, F.; Chang, B.J.; Hutchinson, T.C. Terrestrial laser scanning-based structural damage assessment. J. Comput. Civ. Eng. 2010, 24, 264–272. [Google Scholar] [CrossRef]
  14. Mohamed, M.A.; Shaker, I.F.; Ragab, A.F.; Mogahed, Y.M. Accuracy assessment of terrestrial laser scanner in heritage documentation. Int. J. Eng. Adv. Technol. 2019, 8, 117–123. [Google Scholar]
  15. Liu, J.; Willkens, D.; Gentry, R. Developing a Practice-Based Guide to Terrestrial Laser Scanning (TLS) for Heritage Documentation. Heritage 2025, 8, 313. [Google Scholar] [CrossRef]
  16. Yuanyi, Z.; Zhang, Y.; Zhenjiang, S.; Nishino, T.; Xiaojuan, C. 3D Laser Scanning Technology-based Historic Building Mapping for Historic Preservation: A Case Study of Shang Shu Di in Fujian Province, China. Int. Rev. Spat. Plan. Sustain. Dev. 2015, 3, 53–67. [Google Scholar]
  17. Donato, E.; Giuffrida, D. Combined methodologies for the survey and documentation of historical buildings: The Castle of Scalea (CS, Italy). Heritage 2019, 2, 2384–2397. [Google Scholar] [CrossRef]
  18. Rocha, G.; Mateus, L. A survey of scan-to-BIM practices in the AEC industry—A quantitative analysis. ISPRS Int. J. Geo-Inf. 2021, 10, 564. [Google Scholar] [CrossRef]
  19. Martin-Lerones, P.; Olmedo, D.; Lopez-Vidal, A.; Gomez-Garcia-Bermejo, J.; Zalama, E. BIM supported surveying and imaging combination for heritage conservation. Remote Sens. 2021, 13, 1584. [Google Scholar] [CrossRef]
  20. Moyano, J.; Gil-Arizón, I.; Nieto-Julián, J.E.; Marín-García, D. Analysis and management of structural deformations through parametric models and HBIM workflow in architectural heritage. J. Build. Eng. 2022, 45, 103274. [Google Scholar] [CrossRef]
  21. Trizio, I.; Savini, F.; Giannangeli, A. Integration of three-dimensional digital models and 3D GIS: The documentation of the medieval burials of amiternum (L’Aquila, Italy). Int. Arch. Photogramm. Remote Sens. Spat. Inf. Sci. 2018, 42, 1121–1128. [Google Scholar] [CrossRef]
  22. Pepe, M.; Costantino, D.; Alfio, V.S.; Restuccia, A.G.; Papalino, N.M. Scan to BIM for the digital management and representation in 3D GIS environment of cultural heritage site. J. Cult. Herit. 2021, 50, 115–125. [Google Scholar] [CrossRef]
  23. Brașoveanu, C.; Mihu-Pintilie, A.; Brunchi, R.-A. Inside Late Bronze Age Settlements in NE Romania: GIS-Based Surface Characterization of Ashmound Structures Using Airborne Laser Scanning and Aerial Photography Techniques. Remote Sens. 2023, 15, 4124. [Google Scholar] [CrossRef]
  24. Arroyo Ohori, K.; Biljecki, F.; Diakité, A.; Krijnen, T.; Ledoux, H.; Stoter, J. Towards an integration of GIS and BIM data: What are the geometric and topological issues? ISPRS Ann. Photogramm. Remote Sens. Spat. Inf. Sci. 2017, 4, 1–8. [Google Scholar] [CrossRef]
  25. Liu, B.; Wu, C.; Xu, W.; Shen, Y.; Tang, F. Emerging trends in GIS application on cultural heritage conservation: A review. Herit. Sci. 2024, 12, 139. [Google Scholar] [CrossRef]
  26. Almeida, A.; Gonçalves, L.; Falcão, A.; Ildefonso, S. 3D-GIS heritage city model: Case study of the historical city of Leiria. In Proceedings of the 19th AGILE International Conference on Geographic Information Science, Helsinki, Finland, 14–17 June 2016. [Google Scholar]
  27. He, Y.; Dai, J.; Cui, S.; Peng, D. Facade measurement of building along the roadway based on TLS and GIS of project supervision. IOP Conf. Ser. Earth Environ. Sci. 2018, 146, 012027. [Google Scholar]
  28. Ali, S. Periodical Evolution of Typology in Arab Cities Housings and Influence of Modernism: Baghdad Case Study. Gazi Univ. J. Sci. Part B Art Humanit. Des. Plan. 2020, 8, 681–694. [Google Scholar]
  29. Jasim, I.A.; Farhan, S.L.; Al-Maliki, L.A.; AL-Mamoori, S.K. Climatic treatments for housing in the traditional holy cities: A comparison between Najaf and Yazd cities. IOP Conf. Ser. Earth Environ. Sci. 2021, 754, 012017. [Google Scholar] [CrossRef]
  30. Al-Asadi, L.S.; Mohsin, A.H.; Al-Juboori, H.A.; Fakhratov, M.A.; Sinenko, S.A. The need for sustainable management to document the remaining Baghdadi heritage houses. E3S Web Conf. 2024, 535, 03005. [Google Scholar] [CrossRef]
  31. Youssef, S. The History of Iraqi Architecture in Various Ages; Dar al-Taqqafa wa al-Alam Publications: Baghdad, Iraq, 1982; pp. 272–275. [Google Scholar]
  32. Alfuraty, A.B.; Alkazaaly, N.A. Using Heritage Architectural Elements in the Contemporary Buildings: The ‘Shanashil’of Iraq. J. Int. Soc. Study Vernac. Settl. 2024, 11, 178–195. [Google Scholar]
  33. Bandarin, F.; Eloundou Assomo, L.; Anthony Appiah, K.; Al-Sabouni, M.; Adams, S.; Bokova, I.; Weiss, T.G.; Cuno, J. 26 Fighting Terrorist Attacks against World Heritage and Global Cultural Heritage Governance. In Cultural Heritage and Mass Atrocities; Getty Publications: Los Angeles, CA, USA, 2022; pp. 569–587. [Google Scholar]
  34. Dakhil, A.J.; Samir, H.H.; Alawadi, W.; Hassan, A.A. GIS and BIM as data sources for sustainable Heritage building retrofit in Basrah City-Iraq. In Proceedings of the 2023 16th International Conference on Developments in eSystems Engineering (DeSE), Istanbul, Turkiye, 18–20 December 2023. [Google Scholar]
  35. Dakhil, A.; Hussain, E.; Aziz, F. Evaluation of the Drought Situation Using Remote Sensing Technology, an Applied Study on a Part of North Wasit Governorate in Iraq. Nat. Environ. Pollut. Technol. 2024, 23, 2241–2249. [Google Scholar] [CrossRef]
  36. Ali, S.H.; Sherzad, M.F.; Alomairi, A.H. Managing strategies to revitalize urban cultural heritage after wars: The center of the old city of Mosul as a case study. Buildings 2022, 12, 1298. [Google Scholar] [CrossRef]
  37. Boardman, C.; Bryan, P. 3D Laser Scanning for Heritage: Advice and Guidance on the Use of Laser Scanning in Archaeology and Architecture; Historic England: Swindon, UK, 2018. [Google Scholar]
  38. Selim, G. Participatory Digital Heritage as an Integrated Sustainable Tool for Informative Interpretation of the Past: Umm Qais, Jordan. In Managing Natural and Cultural Heritage for a Durable Tourism; Springer: Cham, Switzerland, 2024; pp. 287–303. [Google Scholar]
  39. Muir, J.; Goodwin, N.; Armston, J.; Phinn, S.; Scarth, P. An accuracy assessment of derived digital elevation models from terrestrial laser scanning in a sub-tropical forested environment. Remote Sens. 2017, 9, 843. [Google Scholar] [CrossRef]
  40. Šašak, J.; Gallay, M.; Kaňuk, J.; Hofierka, J.; Minár, J. Combined use of terrestrial laser scanning and UAV photogrammetry in mapping alpine terrain. Remote Sens. 2019, 11, 2154. [Google Scholar] [CrossRef]
  41. Sinko, M.; Kamencay, P.; Hudec, R.; Benco, M. 3D registration of the point cloud data using ICP algorithm in medical image analysis. In Proceedings of the 2018 ELEKTRO, Mikulov, Czech Republic, 21–23 May 2018. [Google Scholar]
  42. Li, P.; Wang, R.; Wang, Y.; Tao, W. Evaluation of the ICP algorithm in 3D point cloud registration. IEEE Access 2020, 8, 68030–68048. [Google Scholar] [CrossRef]
  43. Bachagha, N.; Wang, X.; Luo, L.; Li, L.; Khatteli, H.; Lasaponara, R. Remote sensing and GIS techniques for reconstructing the military fort system on the Roman boundary (Tunisian section) and identifying archaeological sites. Remote Sens. Environ. 2020, 236, 111418. [Google Scholar] [CrossRef]
  44. Opitz, R.; Nowlin, J. Photogrammetric modeling+ GIS: Better methods for working with mesh data. ArcUser Spring 2012, 2012, 46–49. [Google Scholar]
  45. Dell’Unto, N.; Leander, A.-M.; Dellepiane, M.; Callieri, M.; Ferdani, D.; Lindgren, S. Digital reconstruction and visualization in archaeology: Case-study drawn from the work of the Swedish Pompeii Project. In Proceedings of the 2013 Digital Heritage International Congress (DigitalHeritage), Marseille, France, 28 October–1 November 2013. [Google Scholar]
  46. Lock, G.; Harris, T. Visualizing spatial data: The importance of Geographic Information Systems. In Archaeology and the Information Age; Routledge: London, UK, 2003; pp. 67–76. [Google Scholar]
  47. Salimi, H.; Bahramjerdi, S.F.N.; Tootoonchi, R. The Role of Geographic Information Systems (GIS) in Participatory Conservation of Heritage Areas. Eur. J. Geogr. 2025, 16, s1–s11. [Google Scholar] [CrossRef]
  48. Dore, C.; Murphy, M. Integration of Historic Building Information Modeling (HBIM) and 3D GIS for recording and managing cultural heritage sites. In Proceedings of the 2012 18th International Conference on Virtual Systems and Multimedia, Milan, Italy, 2–5 September 2012. [Google Scholar]
  49. Saygi, G.; Remondino, F. Management of Architectural Heritage Information in BIM and GIS: State-of-the-art and Future Perspectives. Int. J. Herit. Digit. Era 2013, 2, 695–713. [Google Scholar] [CrossRef]
  50. Ma, Z.; Ren, Y. Integrated application of BIM and GIS: An overview. Procedia Eng. 2017, 196, 1072–1079. [Google Scholar] [CrossRef]
  51. Tsilimantou, E.; Delegou, E.T.; Nikitakos, I.A.; Ioannidis, C.; Moropoulou, A. GIS and BIM as integrated digital environments for modeling and monitoring of historic buildings. Appl. Sci. 2020, 10, 1078. [Google Scholar] [CrossRef]
  52. Dionizio, R.F.; Marques, C.K.B.; Dezen-Kempter, E. BIM-GIS application for documenting and promoting archaeological heritage. Appl. Geomat. 2025, 17, 693–710. [Google Scholar] [CrossRef]
  53. Su, P. Integrating HBIM and GIS for Flood Risk Assessment and Heritage Conservation. Ph.D. Thesis, Politecnico di Torino, Torino, Italy, 2025. [Google Scholar]
  54. Kallas, J.; Napolitano, R. Image-To-Insight: A novel workflow for converting post-disaster imagery of historic masonry structures into actionable data. Int. J. Disaster Risk Reduct. 2025, 120, 105358. [Google Scholar] [CrossRef]
  55. Garcia-Garcia, A.; Orts-Escolano, S.; Oprea, S.; Villena-Martinez, V.; Garcia-Rodriguez, J. A review on deep learning techniques applied to semantic segmentation. arXiv 2017, arXiv:1704.06857. [Google Scholar] [CrossRef]
  56. Ruggieri, S.; Cardellicchio, A.; Leggieri, V.; Uva, G. Machine-learning based vulnerability analysis of existing buildings. Autom. Constr. 2021, 132, 103936. [Google Scholar] [CrossRef]
Disclaimer/Publisher’s Note: The statements, opinions and data contained in all publications are solely those of the individual author(s) and contributor(s) and not of MDPI and/or the editor(s). MDPI and/or the editor(s) disclaim responsibility for any injury to people or property resulting from any ideas, methods, instructions or products referred to in the content.

Article Metrics

Citations

Article Access Statistics

Multiple requests from the same IP address are counted as one view.