Highlights
What are the main findings?
- The integration of radar and rain gauge data significantly improves the quality of spatial rainfall representation compared to using rain gauges alone, even in rela-tively small and densely instrumented areas.
- Radar data calibrated with rain gauges provides a more accurate estimate of landslide-triggering rainfall.
What is the implication of the main finding?
- Improved rainfall estimates based on the combined use of radar and rain gauges, enhance landslide risk assessment and the reconstruction of cumulative rainfall that triggers landslide events.
- The integrated approach of radar and rain gauge data generally supports a better understanding of hydrological and geomorphological processes and a more effec-tive management of flood and landslide risk, providing more realistic inputs for hydrological modeling and early warning systems.
Abstract
The availability of reliable and spatially distributed rainfall data is a key element flood and landslide risk assessment, both for forecasting and post-event analysis. In this context, this study evaluates the contribution of radar-based rainfall estimates to enhancing the spatial accuracy of precipitation fields with respect to those derived from rain gauge networks alone. The analysis was conducted over a ~100 km2 area in the Liguria Region, north-western Italy, characterized by a dense rain gauge network, with an average density of one gauge per 10 km2, and covers seven years of hourly rainfall observations. Radar-derived rainfall fields, available at a 1 × 1 km2 spatial resolution, were locally corrected across the study area by interpolating gauge-based local correction factors through an Inverse Distance Weighting (IDW) scheme. The corrected radar fields were then assessed through Leave-P-Out Cross-Validation and rainfall-intensity-based classification, also simulating scenarios with progressively reduced gauge density. The results demonstrate that radar-corrected estimates systematically provide a more accurate spatial representation of rainfall, especially for high-intensity events and in capturing the actual magnitude of local rainfall peaks, even in areas covered by a dense rain gauge network. Regarding the implications for rainfall-induced landslide hazard assessment, the analysis of 56 landslides from the ITALICA (Italian Rainfall-Induced Landslides Catalogue) database showed that including radar information can lead to significant differences in the estimation of rainfall thresholds for landslide initiation compared with gauge-only data.
1. Introduction
Accurate knowledge of the spatial distribution of surface rainfall is essential for a proper understanding of the hydrological cycle, with significant implications for hydrological modelling and forecasting, as well as for a correct assessment of rainfall-induced risks and the interpretation of related ground effects. Rain gauges have traditionally been the primary source of rainfall data, providing high-accuracy point measurements that allow for detailed temporal characterization of rainfall events at specific locations. Spatial interpolation is therefore necessary to obtain a distributed rainfall field from these point data [1], but this remains a delicate and challenging issue, especially given the potentially non-uniform or sparse distribution of rain gauges, particularly in remote areas or regions with complex orography [2,3].
A further limitation arises from the highly heterogeneous spatial nature of precipitation. Rainfall events can exhibit fine, localized, and irregular structures that make accurate representation challenging, even with relatively dense rain gauge networks [4,5]. In such cases, point-based sampling may fail to capture critical aspects of the actual rainfall distribution, leading to an under-estimation of rainfall forcing and, consequently, to an inaccurate assessment of geo-hydrological and hydraulic risks, while also compromising the ability to interpret ground effects during post-event analyses. These limitations are particularly pronounced in the case of small catchments [6,7] and during convective meteorological events, which are potential candidates for generating short-duration extreme rainfall [8] with consequent triggering of landslide phenomena with fatalities and serious damage to infrastructure [9,10,11]. Landslides are complex processes influenced by both predisposing and triggering factors. The former includes various factors, such as slope gradient, lithology, soil type, and land cover, which determine the hydrological and mechanical response of the terrain. Among external triggers, examples include seismic activity, volcanic events, rapid snowmelt, and human interventions (e.g., excavation or land-use changes), with rainfall being the most closely related, as it is capable of reducing soil shear strength through increased pore pressure and saturation, ultimately causing slope failure. The rainfall conditions capable of initiating landslides depend not only on total rainfall amounts but also on rainfall intensity, duration, and antecedent soil moisture [10]. Therefore, accurately capturing the spatial and temporal variability of rainfall is essential for a reliable assessment of rainfall-induced landslide hazard.
In this context, convective atmospheric events are particularly relevant, as they are characterized by intense rainfall structures with limited spatial extent, often only a few square kilometres, and short duration. Due to their highly localized nature, these phenomena may not be detected by any rain gauge in the network [12] and, consequently, cannot be reliably reconstructed using point-based interpolation techniques. This issue is expected to worsen under climate change, as the increased atmospheric energy is predicted to increase both the frequency and intensity of convective events [13]. An approach to addressing this issue is to incorporate auxiliary information alongside traditional rain gauge data, with the goal of enhancing the spatial characterization of rainfall fields. Weather radar systems are particularly well suited for this task [14], as they provide high-resolution precipitation estimates [15] in both space (typically at 1 km2) and time (5–10 min). Radar systems operate by emitting pulses of electromagnetic waves and measuring the energy reflected by hydrometeors in the atmosphere [16]. The intensity of the returned signal, expressed as reflectivity (Z), depends on the size distribution of the cloud particles and it is empirically converted into rain rate (R, in mm/h) using power-law Z-R relationships whose parameters can vary from one locality to another and based on the season and the type of storm [17,18]. The main strength of weather radar systems, lies in their ability to provide an almost continuous view of rainfall patterns across large areas and to offer detailed insights into the structure of rainfall events, including highly localized ones such as convective storms. This proves especially useful in hydrologically complex environments, such as mountainous basins or regions with limited rain gauge coverage, where point-based measurements often fall short in capturing the spatial variability of rainfall.
Despite the advantages offered by weather radar in terms of spatial coverage and temporal resolution, radar-based precipitation estimates, due to their inherently indirect nature, are subject to several sources of uncertainty [19,20] such as signal attenuation, overshooting, and anomalous increase in reflectivity (bright band effect). However, the main source of uncertainty is the Z–R relationship used to convert reflectivity into rainfall intensity, as it is highly sensitive to the microphysical properties of precipitation and often requires local calibration [19]. These uncertainties often hinder their immediate application in hydrological studies and in the assessment of rainfall-induced risks.
The integration of radar data with ground-based rain gauge measurements makes it possible to mitigate the uncertainties in radar estimates. The combined use of radar and gauge data, by leveraging the radar’s ability to capture spatial variability together with the gauges’ capacity to provide reliable point measurements, is widely regarded as an effective strategy to overcome the individual limitations of each measurement type and to improve the accuracy of spatial precipitation field estimates. Various approaches that combine radar and rain gauge data have been developed to reduce bias in spatial rainfall estimates. In the literature, these methods have been categorized in different ways depending on the criteria and strategies used. For instance, a proposed distinction is based on the mathematical framework adopted, with whether geostatistical methods are involved or not [20,21,22]. Other classifications focus on how the bias is characterized, distinguishing between techniques based on mean bias correction and those aimed at minimizing error variance [23]. Alternatively, application-oriented classifications emphasize the role that radar and rain gauge data play in the merging process and typically distinguish between adjustment methods and integration methods [24,25]. A broad class of radar bias adjustment methods treats rain gauges as ground truth and focuses on calculating correction factors by comparing rain gauge measurements with radar estimates at co-located cells. In its simplest form, the correction is applied as a uniform multiplicative factor across the entire radar domain, computed as the ratio between the total rainfall measured by the gauges and the corresponding radar-derived values [26,27]. This approach aims to minimize the mean bias, assumed to be uniformly distributed over the spatial domain. This correction can be applied either as a static adjustment, as in its original formulation, or updated dynamically over time [28]. Other methods attempt to account for distance-dependent errors in radar measurements, as in the range-dependent adjustment in [29], where a calibration approach is proposed based on the assumption that in log-scale the rain gauge to radar ratio varies as a function of the distance from the radar, following a second-degree polynomial relationship. This results in a correction matrix to be applied over the radar domain, exhibiting radial symmetry around the radar location. A more complex spatial structure of the correction factor is found in the method proposed by Brandes [30], where local correction factors G/R are spatially interpolated using a negative exponential weighting scheme. This procedure produces a calibration field with a spatially variable structure that depends on both distance and direction from the radar.
The choice of how to spatialize local correction factors has led to different approaches. In [31], spatial distribution is carried out using geostatistical interpolation via Ordinary Kriging, and the authors analysed the performance of this method in the context of basin-scale hydraulic modelling. Among the alternative interpolation methods, a spline-based approach is adopted in [32], while a different technique based on multiquadric surface fitting is proposed in [33], resulting in a smooth calibration map applied to the radar data. Recently, Nielsen et al. (2024) [34] used the Inverse Distance Weighting (IDW) technique to correct radar precipitation estimates. In their study, precipitation estimates from microwave links [35] were used alongside traditional rain gauges and treated as additional reference sensors, providing more data for comparison to correct radar bias. For each radar grid cell, nearby sensors within a variable search radius are identified, and a correction factor is computed for each sensor as the ratio between observed and radar-estimated rainfall. The final correction factor for each radar pixel is then obtained as a weighted average of these values, with weights decreasing with distance according to the IDW method. IDW has also been used in the literature to calibrate satellite-derived precipitation estimates by comparing them with rain gauge measurements [36]. For example, in [37], the so-called Geographical Ratios Analysis (GRA) is proposed. This method involves calculating local ratios between rain gauge observations and satellite-based rainfall estimates and then interpolating these ratios across the domain using the IDW scheme to produce a calibration map. Finally, the GRA-calibrated precipitation field is obtained by multiplying the original satellite-based rainfall estimates by the interpolated ratio map.
This same approach for correcting radar-derived precipitation data through comparison with rain gauge measurements was applied in the present study, which focuses on a small area of approximately 100 km2, characterized by a dense network of rain gauges, with an average density of one gauge per 10 km2. The objective is to evaluate whether, even in such a well-instrumented context, the use of radar data, available with a resolution of 1 × 1 km2, can significantly improve the spatial representation of precipitation, compared to the spatialization of rain gauge data alone using IDW interpolation. In particular, given that the study area is prone to landslides and a dedicated georeferenced database of historical events is available, the analysis focused on evaluating and characterizing how the estimated triggering rainfall differs when using calibrated radar data at the landslide location, as opposed to relying solely on the rainfall measured by the nearest rain gauge.
2. Study Area and Data
2.1. Study Area
The proposed methodology was tested on a relatively small area in the Savona province, (Italy). The area is located in the central part of the Liguria Region, in north-western Italy. This area is particularly prone to instability phenomena and a rich database of rainfall-induced landslides is available. Several rain gauges are located in the chosen area, and such availability of relatively dense monitoring network makes it particularly suitable for evaluate the potential improvement provided by radar for a more accurate reconstruction of spatial rainfall patterns even in well-instrumented contexts. The region is characterized by small- to medium-sized catchments, with drainage areas ranging from 10 to 1000 km2. Rainfall events are generally short in duration, typically lasting between 0.5 and 10 h [38,39], and the hydrological regime is predominantly torrential, often associated with flash flood events [40].
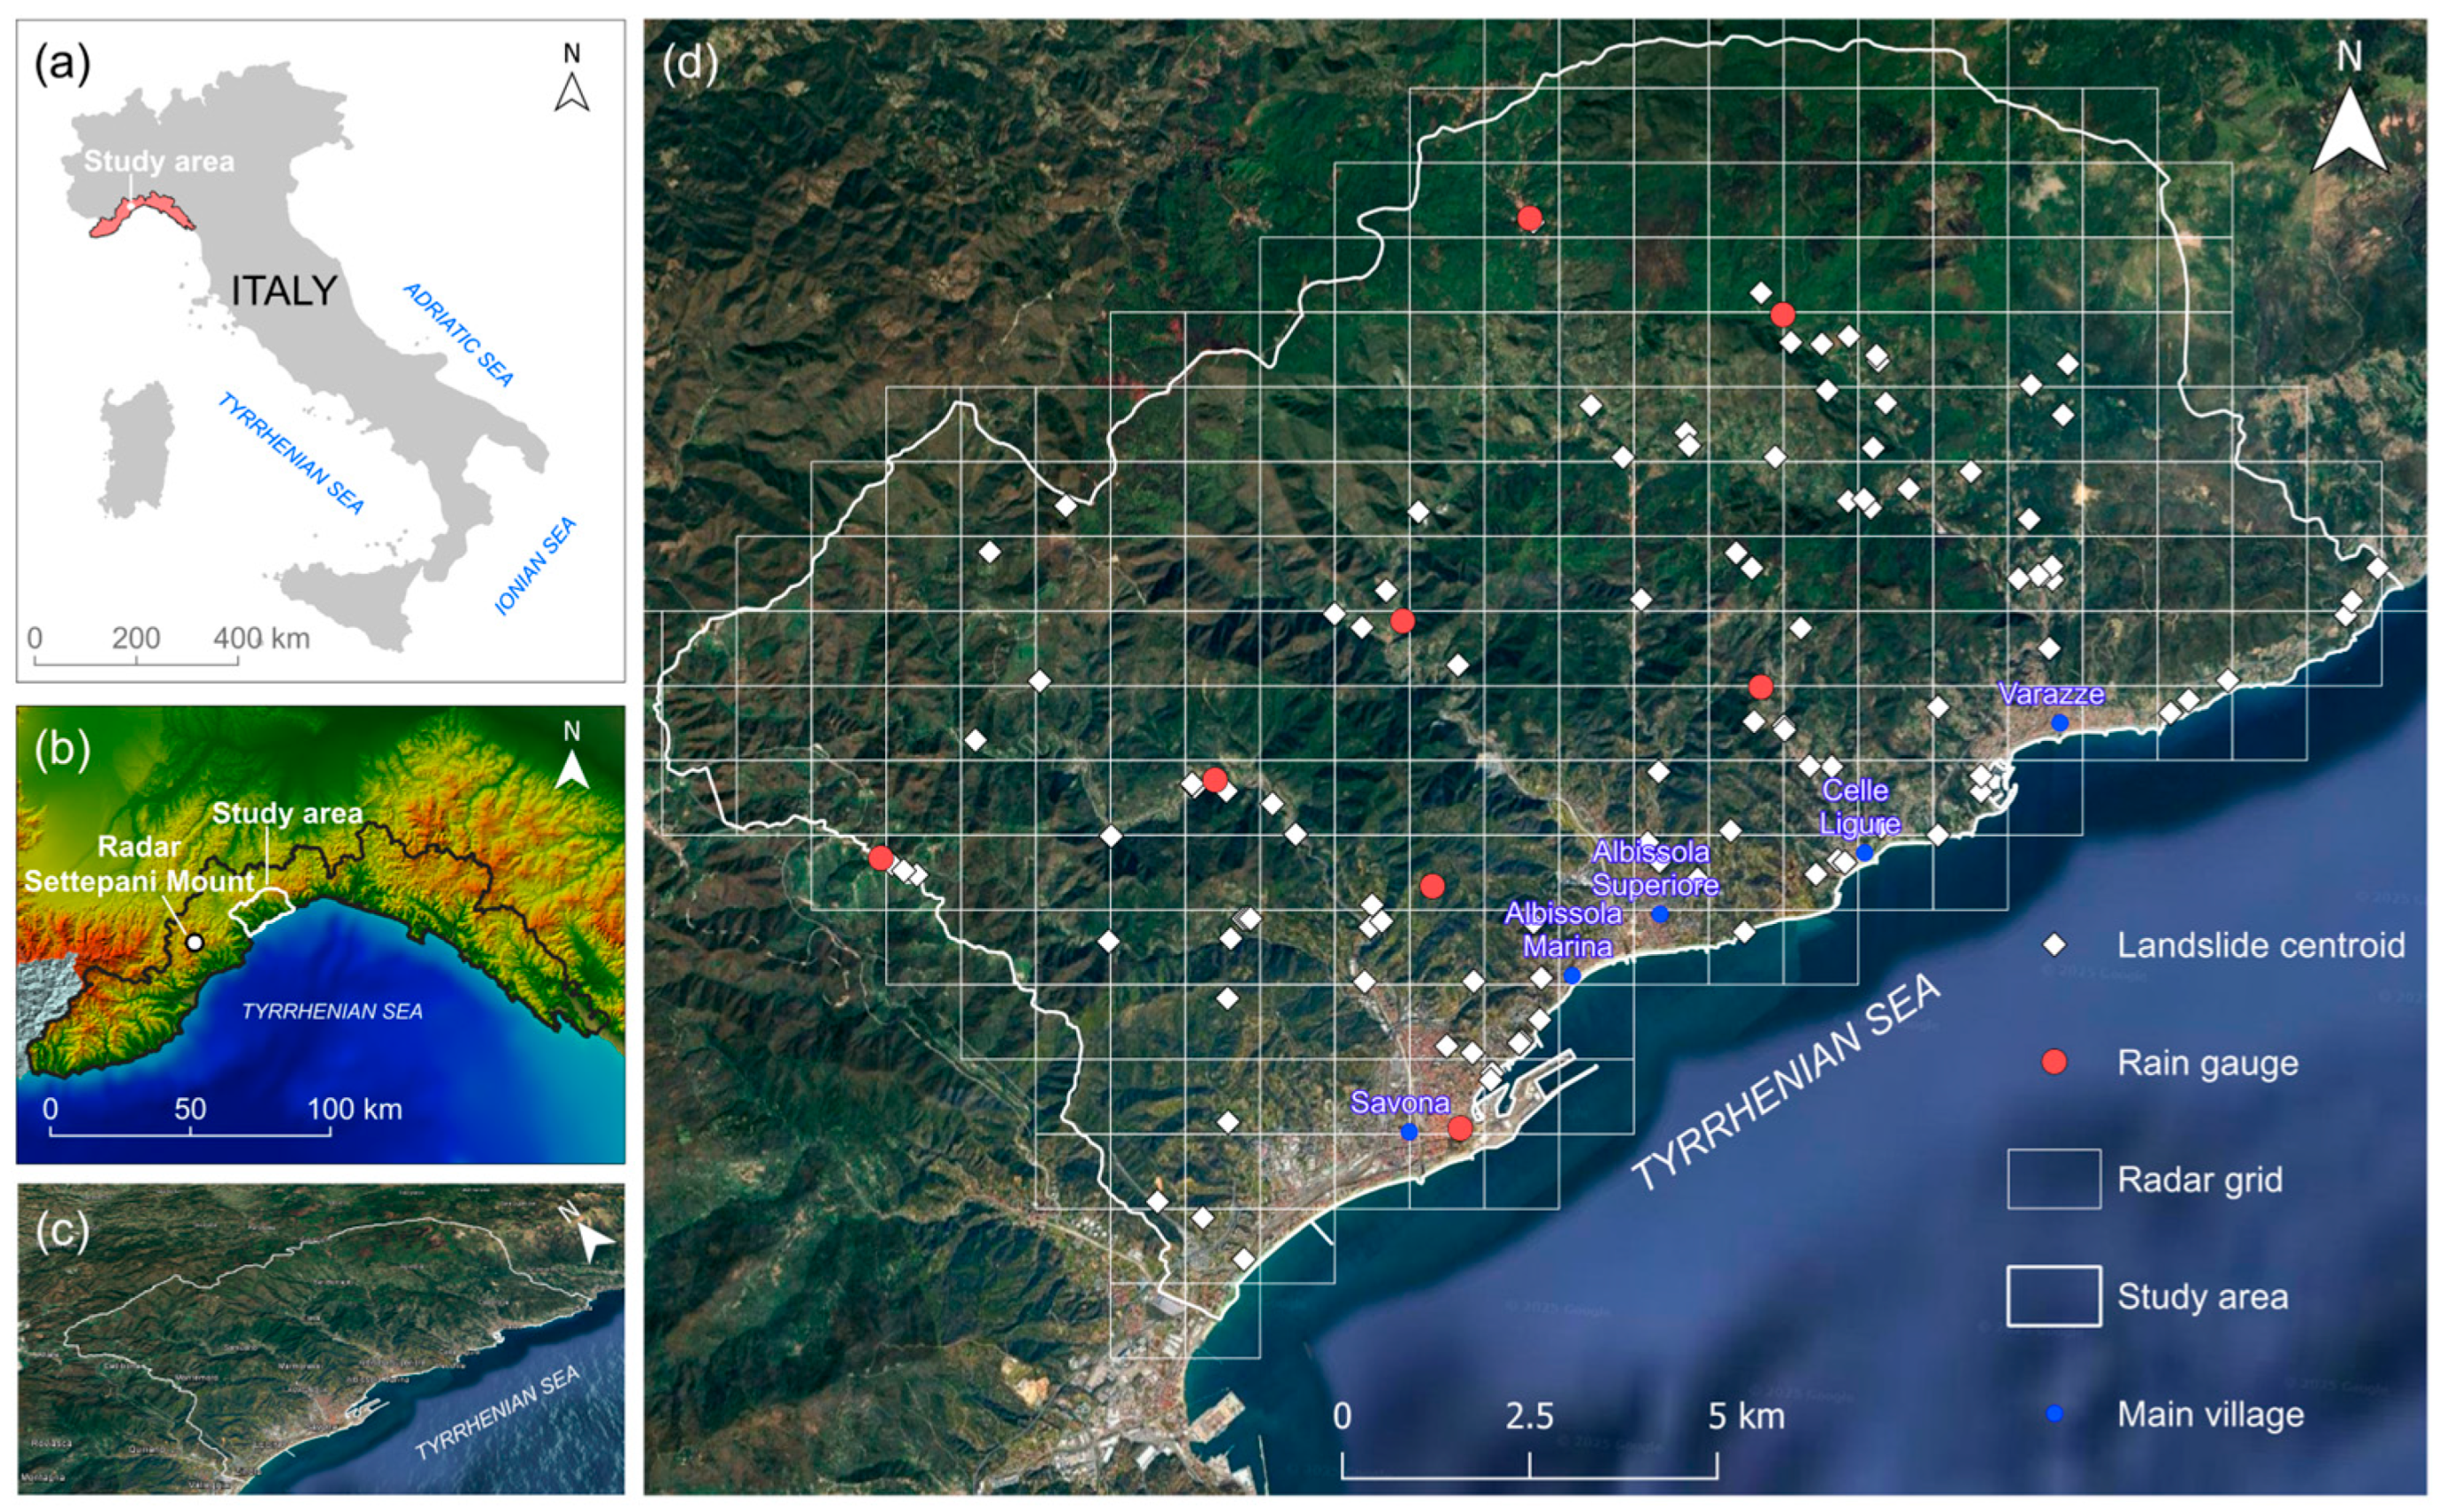
The area includes six municipalities (Savona, Albissola Superiore, Albissola Marina, Celle Ligure, Stella and Varrazze) covering approximately 200 km2, with average altitude of 861 m a.s.l. highest altitude is reached in the north-western sector at Mount Beigua with 1287 m a.s.l. m a.s.l. It is equipped with 8 rain gauges, evenly distributed across the territory (see Figure 1d), with an average station density of approximately 0.04 km2.
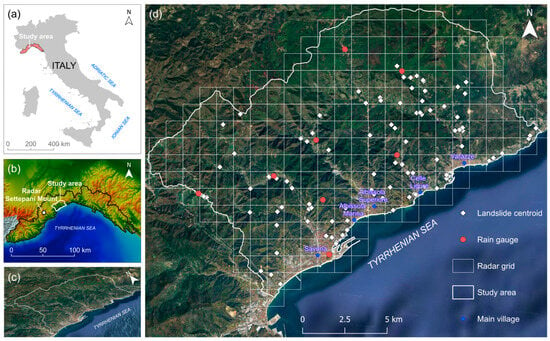
Figure 1.
Study area; (a,b) ubication; (c) Google earth view; (d) Map of landslide and rain gauges location.
The geomorphological and geological settings are characterized by steep slopes and narrow valleys incised into hard rock formations. The area has a very complex geological structure and is considered a transition zone between the Ligurian Alps and the Northern Apennines. As described by [41], the Savona crystalline massif belongs to the Ligurian Briançonnais domains, which includes a set of pre-Alpine sedimentary sequences and slices of basement rocks. In particular, the area features a complex of strongly deformed mafic amphibolite and paragneiss, in tectonic contact with orthogneiss bodies [42,43]. Due to geological, geomorphological, and hydrological characteristics this area an ideal case of study for the investigation of geo-hydrological events such as landslides, floods, and flash floods. Indeed, according to [44], the Province of Savona is among the Italian regions with the highest number of recent reported landslides.
2.2. Radar and Rain Gauge Data
2.2.1. Weather Radar Data
In Italy, within the framework of the national early-warning system for multi-risk management, the National Department of Civil Protection (DPC) coordinates a network of 26 weather radar systems [45]. Some of these radars are directly operated by the DPC, while others are managed by regional authorities, the National Centre for Aerospace Meteorology and Climatology (CNMCA) of the Italian Air Force, or the Italian air traffic control company (ENAV) [46]. The network, which is distributed across the national territory, includes both single-frequency and polarimetric radars, as well as systems equipped with Doppler capabilities.
In particular, in the Liguria region, a C-band polarimetric radar, jointly managed by the Regional Environmental Protection Agencies of Liguria (ARPAL) and Piemonte, operates on Settepani Mount (Province of Savona) at an elevation of 1387 m above sea level (lat: 44° 14′ 57″ N, lon: 8° 11′ 55″ E [47]). The data processing of this radar is based on an advanced multiparameter algorithm that, using a flowchart decision tree, identifies the best rainfall intensity estimation algorithm based on the actual values of polarimetric radar measurements, allowing it to produce highly reliable rainfall estimates [48].
The DPC is responsible for processing raw data from all radar systems, applying several corrections [49], and integrating them into a national radar mosaic that serves as the basis for generating various types of composite gridded products at national scale. These products are disseminated through the Radar-DPC platform [50] and made available in GeoTIFF format, georeferenced in WGS 84 geographic coordinate system (EPSG:4326), on a regular grid with spatial resolution of 1 × 1 km2. In particular, every 5 min and in near real time, the system provides an estimate of Surface Rainfall Intensity (SRI) derived from radar measurements.
In the present study, the SRI product was used for the period from 1 January 2015, to 31 December 2021. The dataset was clipped and projected to the study area in the UTM Zone 32N coordinate system (EPSG:32632) using the GDAL library. As shown in Figure 1d, a total of 244 radar cells were considered.
To estimate rainfall heights from the SRI for each 5 min interval, the average of two consecutive SRI values, corresponding to the time steps and min, was calculated. This mean rain rate, expressed in mm/h, was then converted into an estimate of the corresponding cumulative precipitation over 5 min by dividing it by 12. Finally, the resulting 5 min rainfall amounts were aggregated to obtain the hourly rainfall for the entire period under consideration.
2.2.2. Rain Gauge Data
Rainfall measurements from in situ stations were supplied by the Liguria Region Hydro Meteorological Observatory (OMIRL), which is managed by ARPAL and is part of the Italian Raingauge Network of the DPC. The OMIRL network consists of about 200 rain gauges distributed throughout Liguria, providing good overall coverage, with a density on the order of 1 rain gauge per 40 km2 [51]. Hourly precipitation data can be downloaded through appropriate Liguria Region portal [52].
Within the study area, eight rain gauges are present (Figure 1d), corresponding to an average spatial density of approximately 1 gauge per 25 km2, with an average distance between the nearest gauges of about 3.7 km. The locations of these rain gauges are listed in Table 1. For these stations, the complete dataset of available hourly rainfall for the 2015–2021 period was downloaded.

Table 1.
Geographic information on rain gauges.
Considering the entire hourly dataset from the eight rain gauges over the seven-year study period, missing values account for less than 0.3%, indicating high data completeness. Non-zero rainfall values represent approximately 7% of the total observations, with a mean of 1.83 mm/h, a standard deviation of 3.58 mm/h, and a 50th percentile (median) of 0.6 mm/h. The absolute maximum recorded value is 79.2 mm/h. The data relating to the rain gauges present in the study area and used for the present analysis are reported in Table 1.
2.3. Landslides Database
In order to assess the radar’s ability to represent the spatial distribution of rainfall and cumulative rainfall, responsible of triggering localised events such as landslides, from ITALICA database (ITAlian rainfall-induced Landslides Catalogue) [53] rain-induced landslide events were extracted for the study area. ITALICA is the largest catalogue of rainfall-induced landslides available in Italy. Currently, this database lists 6312 landslides [54] that occurred between January 1996 and December 2021. The information was collected using strict objective and homogeneous criteria with high spatial and temporal accuracy. This makes the catalogue suitable for reliably defining rainfall conditions capable of triggering landslide events [54].
From the ITALICA dataset, 128 landslide events that occurred in the study area were extracted, and from these, those that occurred between January 2015 and December 2021, were selected. With a further skimming the events, for which no radar and/or rainfall data were available, were excluded. The characteristics of the 56 remaining landslides, considered for the analysis, are listed in Table 2.

Table 2.
Cumulative rainfall measured of nearest rain gauges and estimated by the corrected radar in correspondence of exact grid cell containing the landslide.
3. Method
This section illustrates the procedures adopted to validate and calibrate radar-based rainfall estimates using rain gauge data, and to assess the respective capabilities of rain gauge-based and radar-based rainfall fields in reconstructing the spatial structure of precipitation, particularly in relation to rainfall maxima and their ability to explain observed ground effects. The availability of multiple rain gauges within the study area enables a point-by-point validation of the radar rainfall product and allows for the computation of an average estimation error across the domain.
Following approaches similar to those proposed in [34,37], local correction factors were computed by comparing radar estimates at grid cells containing rain gauges with the corresponding gauge measurements. These correction factors were then spatially interpolated over the entire study area using the Inverse Distance Weighting (IDW) method, resulting in a rain gauge-calibrated radar precipitation field. The accuracy of the corrected radar data was assessed through a Leave-PP-Out cross-validation approach.
In addition, several scenarios with varying rain gauge densities were simulated by progressively excluding gauges from the analysis. This allowed for an evaluation of how reducing the number of rain gauges affects both their ability to capture localized precipitation patterns, particularly rainfall maxima, and the effectiveness of radar calibration, which can be expected to decrease when based on fewer reference measurements.
Beyond the assessment of spatial distribution differences, the calibrated radar data enabled a quantitative comparison between the precipitation input estimated using rain gauges alone and that derived from the corrected radar product. These two rainfall fields were then analyzed in relation to observed ground impacts within the study area, with particular attention to cases of rainfall-induced instability. The detailed procedures and equations used in these analyses are presented in the following subsections.
3.1. Radar Validation and Calibration
The study area is monitored by a C-band weather radar, for which advanced procedures have been developed to obtain accurate precipitation estimates [48,55]. The eight rain gauges installed within this area, each located in a different radar grid cell (see Figure 1), allow for direct comparison between radar-based hourly rainfall estimates and ground-based measurements. For each radar cell containing a rain gauge, and for each hourly time interval , the radar-estimated rainfall can be compared with the corresponding rain gauge measurement . The absolute error of the radar estimate is defined as:
The average of these absolute errors over the rain gauges provides an estimate of the typical radar error at time , representative of a generic cell within the study domain:
Finally, the distribution of values, obtained from Equation (2), over time provides insight into the accuracy of radar-based hourly rainfall estimates across the study area and for a generic hourly interval.
The presence of rain gauges in the study area also enables the correction of radar estimates, thereby enhancing the accuracy of the spatial rainfall field derived by the radar. The GRA calibration method was adopted in the present study to correct radar-based precipitation estimates by comparing them with corresponding measurements from rain gauges. This corrective method is based on the calculation of local correction factors, defined as: the ratio between rainfall measure at rain gauge and rainfall value estimated by the radar in the cell containing the rain gauge itself.
Specifically, considering the study area (Figure 1d), for the eight radar cells that contain a rain gauge, the correction coefficient associated with the corresponding rain gauge is defined as:
where and represent the hourly precipitation values as measured by the rain gauge and radar, respectively. The correction coefficients obtained in this way are then spatially distributed across the entire domain of interest using IDW (Inverse Distance Weighting) interpolation, according to the formula:
where the weight is defined as:
and represents the Euclidean distance between the center of radar cell , which contains a rain gauge, and the center of the generic cell where the interpolated value is computed. Although relatively simple, IDW has clear advantages in terms of implementation and applicability, even when few gauges are available, unlike Kriging, which requires sufficient data for variogram construction. For example, [56] found that Ordinary Kriging outperformed IDW under dense gauge networks but showed high sensitivity and uncertainty under sparse conditions. For these reasons, the use of IDW in our study is consistent with our data availability and research objectives and still led to significant improvements over gauge-only estimates.
We also note that the choice of IDW was particularly consistent with the validation framework adopted in this study. The Leave-P-Out Cross-Validation procedure involves progressively removing rain gauges to simulate reduced network densities. In such conditions, methods requiring variogram construction or strong spatial sampling assumptions, such as Kriging, become less stable or even inapplicable. By contrast, IDW remains computationally robust and applicable even with a very limited number of points, allowing for consistent evaluation of radar–gauge merging performance under different network configurations.
We used a value of , which is the most commonly adopted setting in environmental and hydrological applications. Moreover, given the relatively limited size of the study area, this value provides a good compromise between preserving local influence and avoiding overly discontinuous transitions, which can occur for larger α values, while still ensuring that nearby observations exert a stronger influence on the estimated values (an effect that tends to weaken for ).
Finally, the recalibrated radar precipitation, in the interest domain is computed as:
Note that IDW is an exact interpolator, so correction (6) accurately retrieves the rainfall value of cells with rain gauge placed. In order to evaluate the quality of corrective procedure, a Leave-P-Out Cross-Validation (LpOCV) approach was adopted [57]. In this method, observations are excluded from the dataset to form a validation set, while the model is trained on the remaining data points. The prediction error for a specific choice of rain gauges is, then, computed using the Root Mean Square Error (RMSE) with respect to the validation values, as follows:
Since there are possible combinations of elements from a dataset of observations, this results in individual error estimates. These can be averaged to obtain a single performance metric, representing the mean error of calibration method in a given time interval [57,58]:
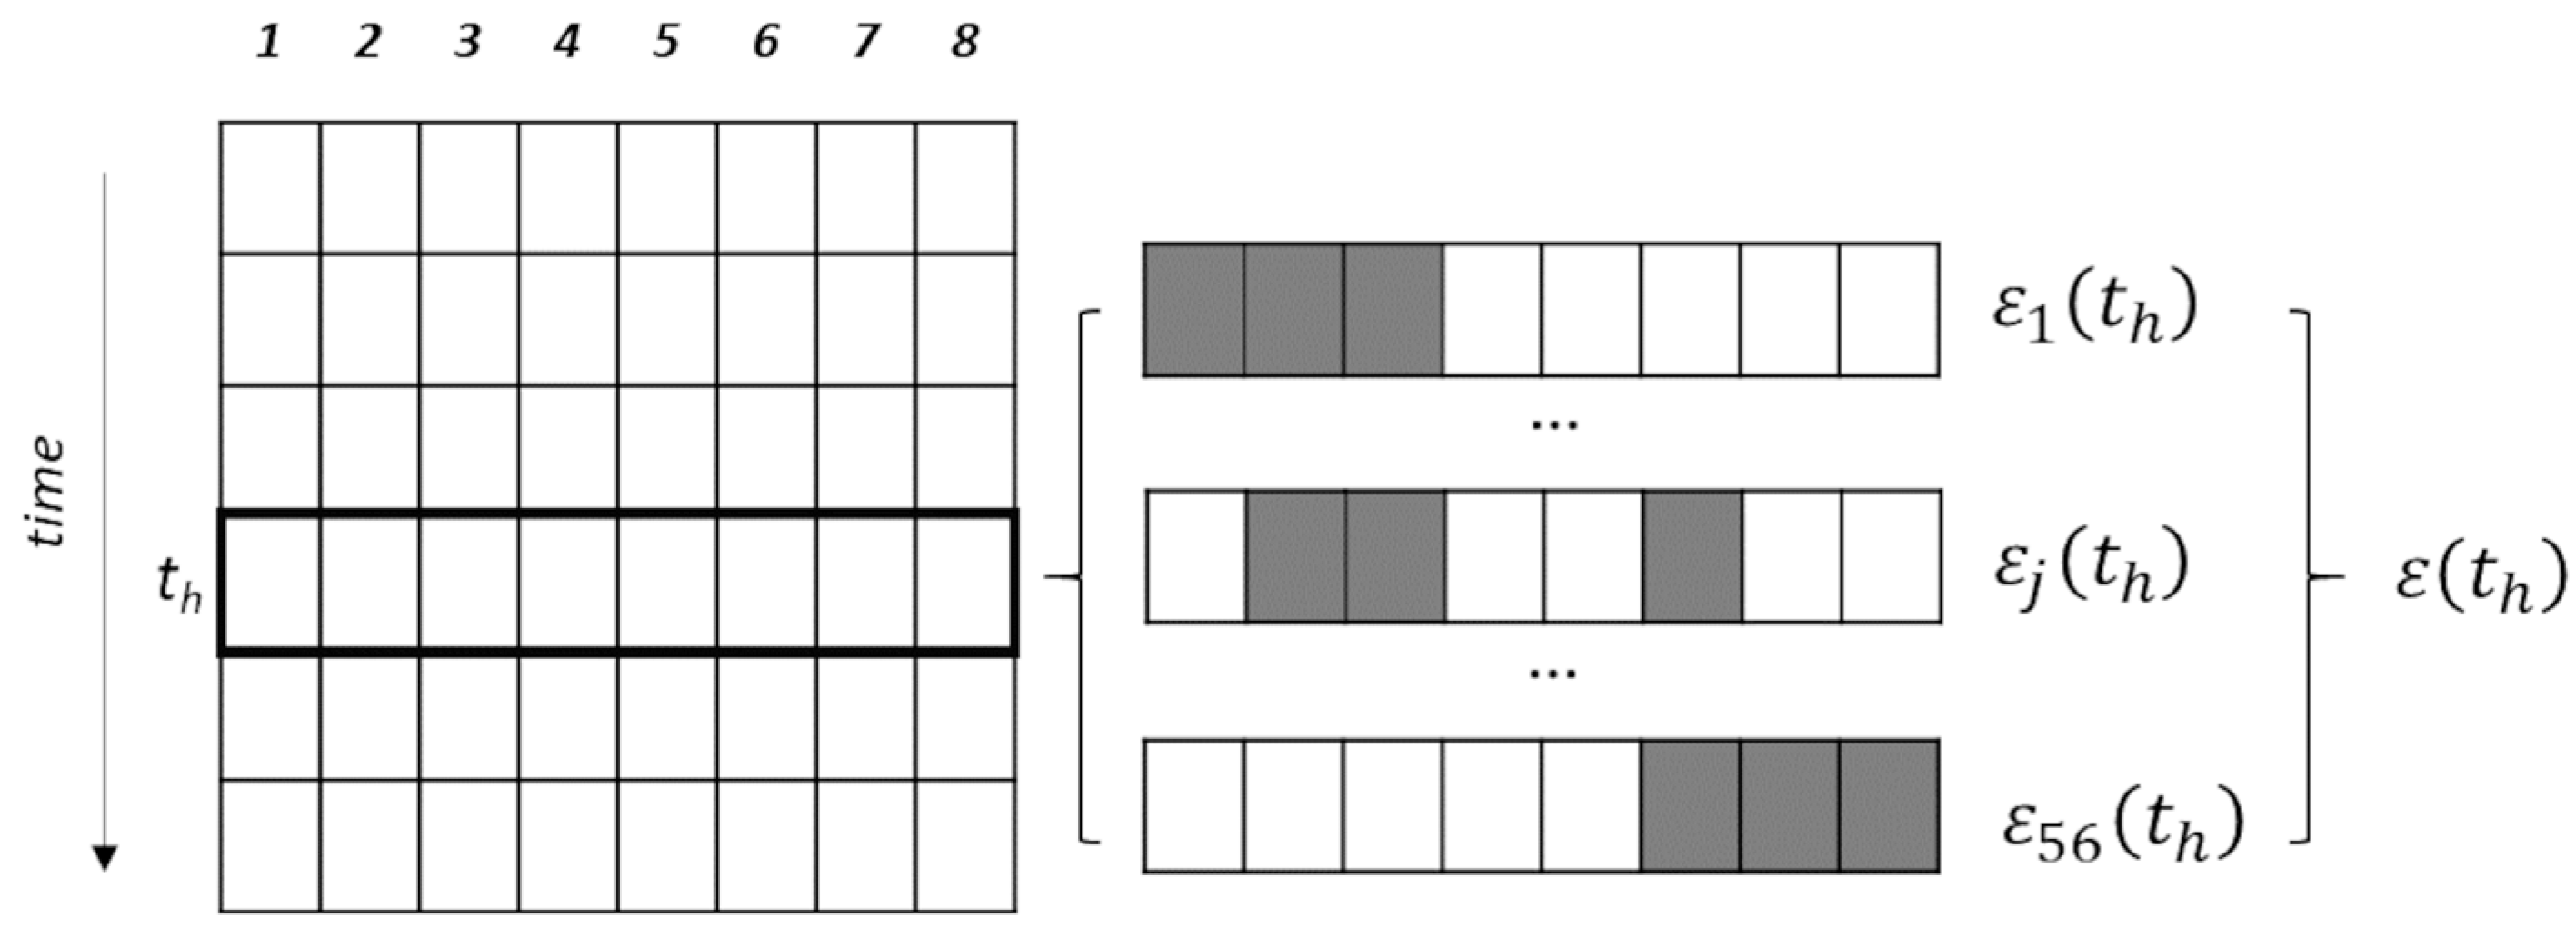
The distribution of errors (8) over time allows for a better understanding of the behaviour of radar precipitation estimates, corrected using rain gauge data, over the full duration of the study period. Figure 2 provides a schematic representation of described procedure.
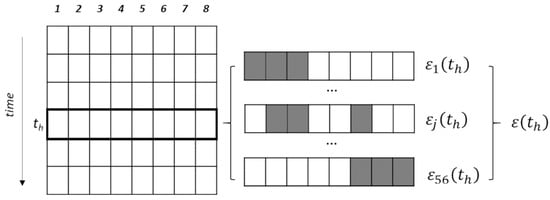
Figure 2.
Schematic representation of Leave-P-Out Cross-Validation with N = 8 data points and p = 3. In this case, for each time interval a total of 56 possible combinations can be used to select the validation set, and estimation error can be calculated for each combination. The average of these errors provides an overall assessment of estimation performance , for each time interval.
In order to simulate scenarios with varying numbers of available rain gauges in the study area, all possible values of p from 1 to N − 1 were considered. To ensure a homogeneous comparison among the possible P-set combinations resulting from each analysed time interval, only hourly data in which all available rain gauges recorded a rainfall value of at least 0.6 mm/h were used for this analysis. This selection reduces the original dataset to a sequence of 636 hourly intervals.
To analyse how the performance of precipitation estimates varies with rainfall intensity, rain gauge measurements were grouped into predefined intensity classes. Based on the classification proposed in [59], hourly rain gauge data were grouped into the following intervals: 1–6 mm/h, 6–10 mm/h, 10–18 mm/h and >18 mm/h. The first class described in [59], corresponding to light rainfall below 1 mm/h, was excluded from the analysis, as the focus of this study is on evaluating the accuracy of precipitation estimates for events that may have significant surface impacts. The highest intensity class used here combines the last two classes defined in [59], which refer to more intense rainfall, in order to have a sufficient number of cases for statistical analysis. The accuracy of the corrected radar estimator was then assessed separately for each class, considering only the data falling within the corresponding intensity range. Consequently, the estimation error defined in Equation (7) was computed using only those observations belonging to the class under analysis. The Leave-P-Out Cross-Validation procedure was modified according to this approach. At each iteration, among the rain gauges excluded from the estimator calculation, only the observations belonging to the selected intensity class were used to evaluate the estimation error. Leaving the number of excluded measurements within the interval , Equation (7) becomes:
For certain choices of , it is possible that none of the excluded values fall within the specified class: in such cases, no error is computed. The average estimation error is then obtained by averaging the values of Equation (9) actually computed during the various iterations:
where represents the number of combinations for which at least one excluded rain gauge value falls within the class of interest, allowing the error in Equation (9) to be calculated. The distribution of the values obtained from Equation (10) provides an estimate of the hourly rainfall error over the study area.
An analogous procedure for evaluating the estimation error as a function of the rainfall intensity to be retrieved can also be applied to the uncorrected radar data, with Equations (1) and (2) suitably adapted to consider only the rainfall values within the intensity class under analysis.
To assess the contribution of radar data to spatial characterization of precipitation, as compared to rain gauge data alone, a rainfall field was also generated by spatially interpolating only the rain gauge measurements, using IDW interpolator with exponent 2. The Leave-P-Out Cross-Validation procedures, described in Section 3.1, was then applied also to the estimates derived exclusively from rain gauges, and compared with the results obtained using the corrected radar values.
3.2. Assessing Maximum Rainfall Intensity
To assess the spatial representativeness of the rain gauge network, in the study area, with respect to the estimates from weather radar, the analysis focused on the hourly precipitation maxima identified from both systems. The radar data were corrected using the rain gauge measurements, as described in the previous section. This correction, as demonstrated, ensures that, in the radar grid cells containing a rain gauge, the estimated value coincides with the gauge measurement. As a result, the hourly maximum over the study area, as provided by the corrected radar, is always greater than or equal to the maximum recorded by the rain gauge network. To investigate the effect of network density, scenarios with a “reduced” number of rain gauges were simulated. In each of these scenarios, gauges were removed (with ), and the radar correction was performed using only the remaining gauges. For each hourly time step, the relative difference was calculated between the maximum recorded by the “reduced” rain gauge network and the maximum identified by the radar corrected with remaining gauges:
There are possible combinations for excluding rain gauges, each of which randomly affects the ability of the “reduced” network to detect the most significant rainfall structures, the mean relative error was computed for each time step as:
Equation (12) provides, for the study area, an evaluation of the average underestimation error in hourly rainfall maxima when using a network of rain gauges, compared to the radar field corrected and using the same reduced network. Finally, a similar analysis was carried out by comparing the maximum value from the uncorrected radar with the maximum recorded by the complete network of rain gauges, in order to assess the impact of radar calibration on the estimation of maxima rainfall.
3.3. Assessing Rainfall Inputs Related to Landslides
One of the key motivations of this study is to assess how the choice of rainfall data source used to estimate precipitation inputs associated with landslides can influence the interpretation of rainfall and landslide relationships. Traditionally, the rainfall triggering a landslide is quantified using the rain gauge closest to the landslide location, and each event is associated with a time window ∆t that represents the duration of the rainfall triggering the failure. However, this approach can introduce significant uncertainties, especially due to the large spatial variability of precipitation, but also, due to the location of rain gauges, which may be far from the trigger point or close but in a different geomorphological context. As discussed above, the study area considered here, is characterized by a dense network of rain gauges and by the availability of spatially continuous rainfall estimates derived from weather radar corrected with ground-based observations and therefore provides an ideal setting to investigate these issues. Specifically, for each landslide event within the study area and recorded in the ITALICA database, it is possible to compare the temporal pattern and the cumulative rainfall over the associated interval using both the rain gauge assigned to the landslide (which may be located some distance away), and the radar estimate on the exact grid cell where the landslide occurred. This comparison makes it possible to quantify the differences between point-based and distributed rainfall measurements, and to assess how these differences may affect the analysis of rainfall data preceding landslide events, even within a relatively small area with a high number of rain gauges.
To estimate the uncertainty associated with the radar-based rainfall estimate at the landslide location, a cross-validation procedure was applied. Each of the N rain gauges located in study area was excluded in turn from the radar calibration process, and its cumulative rainfall, over the interval, was then estimated using the remaining gauges for the radar correction. By comparing this radar-based estimate with the actual measurement of the excluded rain gauge, an absolute percentage error can be calculated. Since the process is repeated times (once for each excluded gauge), it is then possible to derive an average percentage error associated with the radar-based estimate of cumulative rainfall over the considered interval. This value was used as an estimate of the uncertainty affecting the radar-derived cumulative rainfall at the landslide cell, based on a radar calibration using all available rain gauges. Having an estimate of the uncertainty associated with the radar-derived cumulative rainfall, at the landslide cell, makes it possible to assess whether the difference with the rainfall input calculated from the nearest rain gauge is significative, and thus to evaluate the added value of radar data in reconstructing precipitation associated with landslide events. It is worth noting that this choice represents a conservative error estimate, as it is derived from calibrations with less gauges than those employed in the final correction used to evaluate the rainfall input associated with the landslide.
4. Results and Analysis
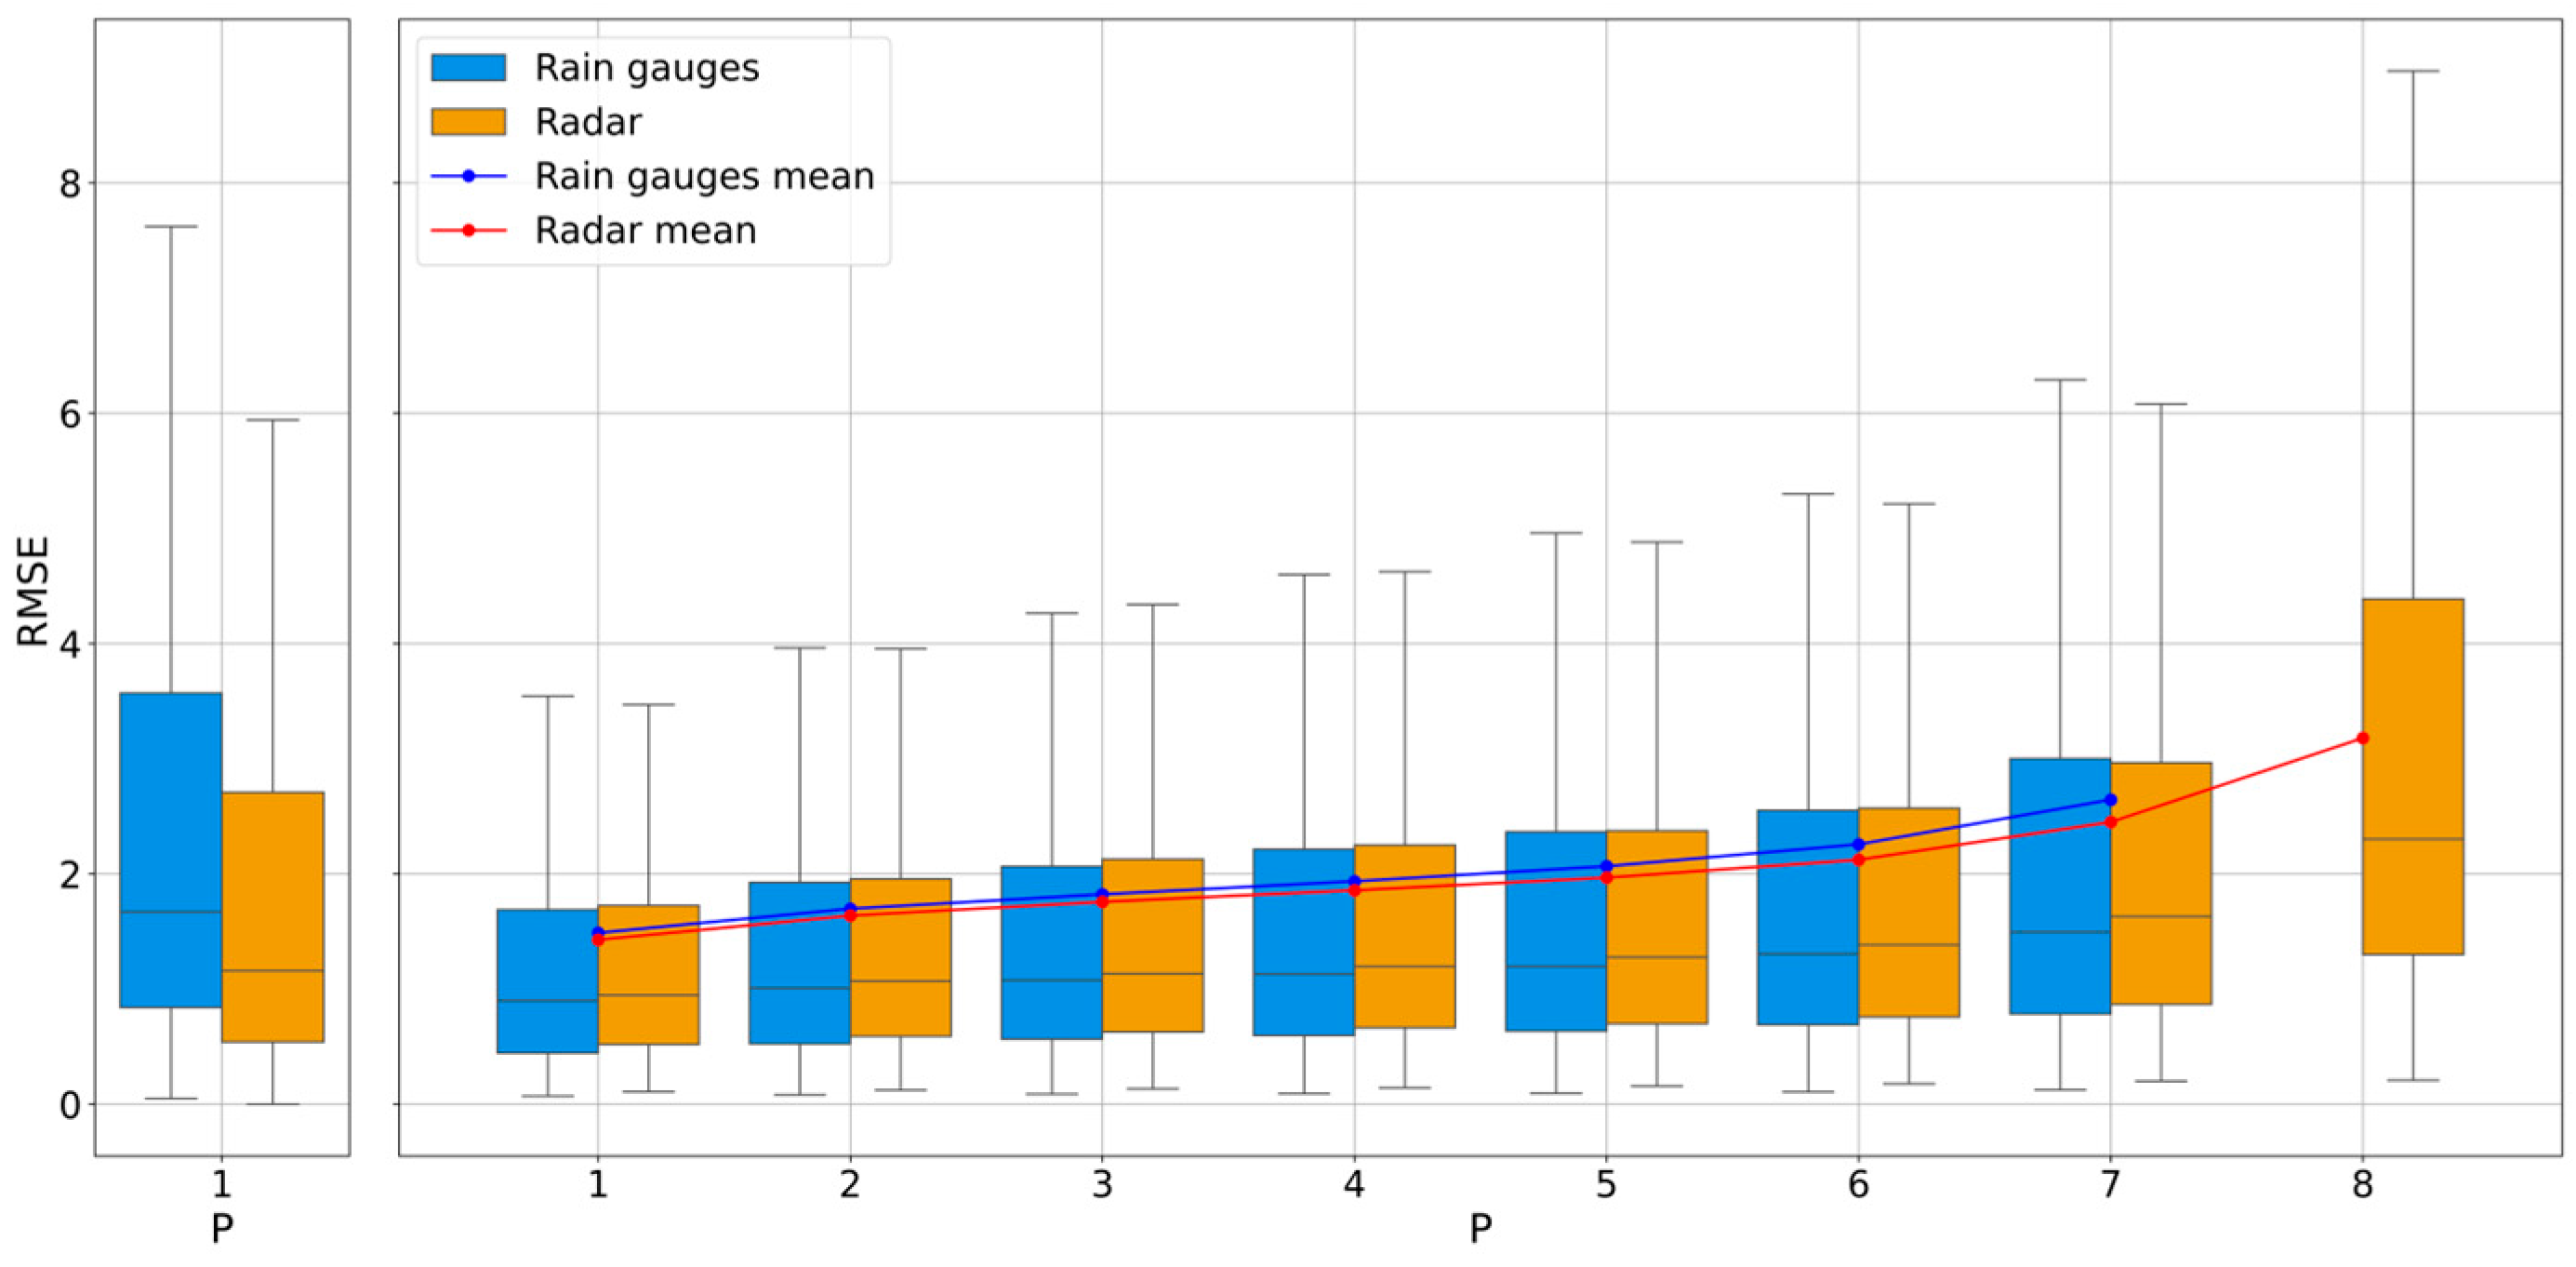
Figure 3 shows the results of analysis, in particular is depicted the distribution of hourly estimation errors (Equation (8)) over time for different configurations. Specifically, boxplots show how both the radar-based method (corrected with the remaining gauges) and the rain gauge-based interpolator (using the same set) perform in estimating precipitation at the excluded rain gauges. The performance of the uncorrected radar is also shown for reference, with the mean estimation error computed over all gauges and associated with the scenario (i.e., no correction applied). The results of Figure 3 show that, even without correction, the radar data already provide accurate estimates of hourly precipitation, with a mean error, in the study area, of about 3 mm/h over. Nevertheless, applying rain gauge-based corrections improves radar performance progressively as more gauges are included in the calibration. In all scenarios, the corrected radar outperforms the interpolated rain gauge estimates alone, consistently yielding smaller average errors.
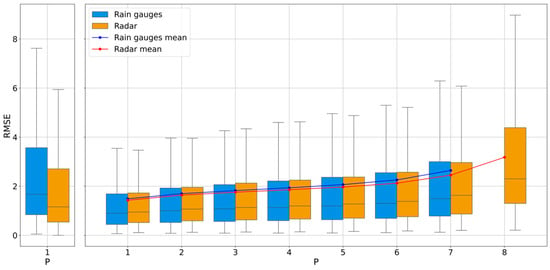
Figure 3.
Comparison between the distributions of the mean hourly estimation error in retrieving rain gauges, using the estimator based on the remaining gauges (blue box plots) or the estimator obtained with radar data corrected with the same gauges (orange box plots), for values of ranging from 1 to 7. The final box plot at represents the error distribution obtained using the uncorrected radar product. The box on the left shows the distribution of the error in the estimate of the maximum value recorded by the rain gauge when the latter is excluded in the data correction and in the spatialization of the rain gauge data. Each box plot is derived from a dataset of 636 hourly values.
To further highlight that, even in a relatively dense network of rain points of measure, there may be conditions where the rain gauges fail to capture the main rainfall structures, a specific test was conducted. In each hourly interval, the rain gauge recording the maximum rainfall was removed, and its value was then estimated using both the corrected radar data and the IDW interpolated estimates from the remaining gauges. The result, shown in the left panel of Figure 3, highlights a drastic change compared to the situation where the excluded rain gauge is chosen randomly. This intentionally unfavourable choice for the rain gauge network highlights how, even in a relatively small area with a high gauge density, there can be situations in which local precipitation maxima are severely underestimated when relying exclusively on rain gauge data.
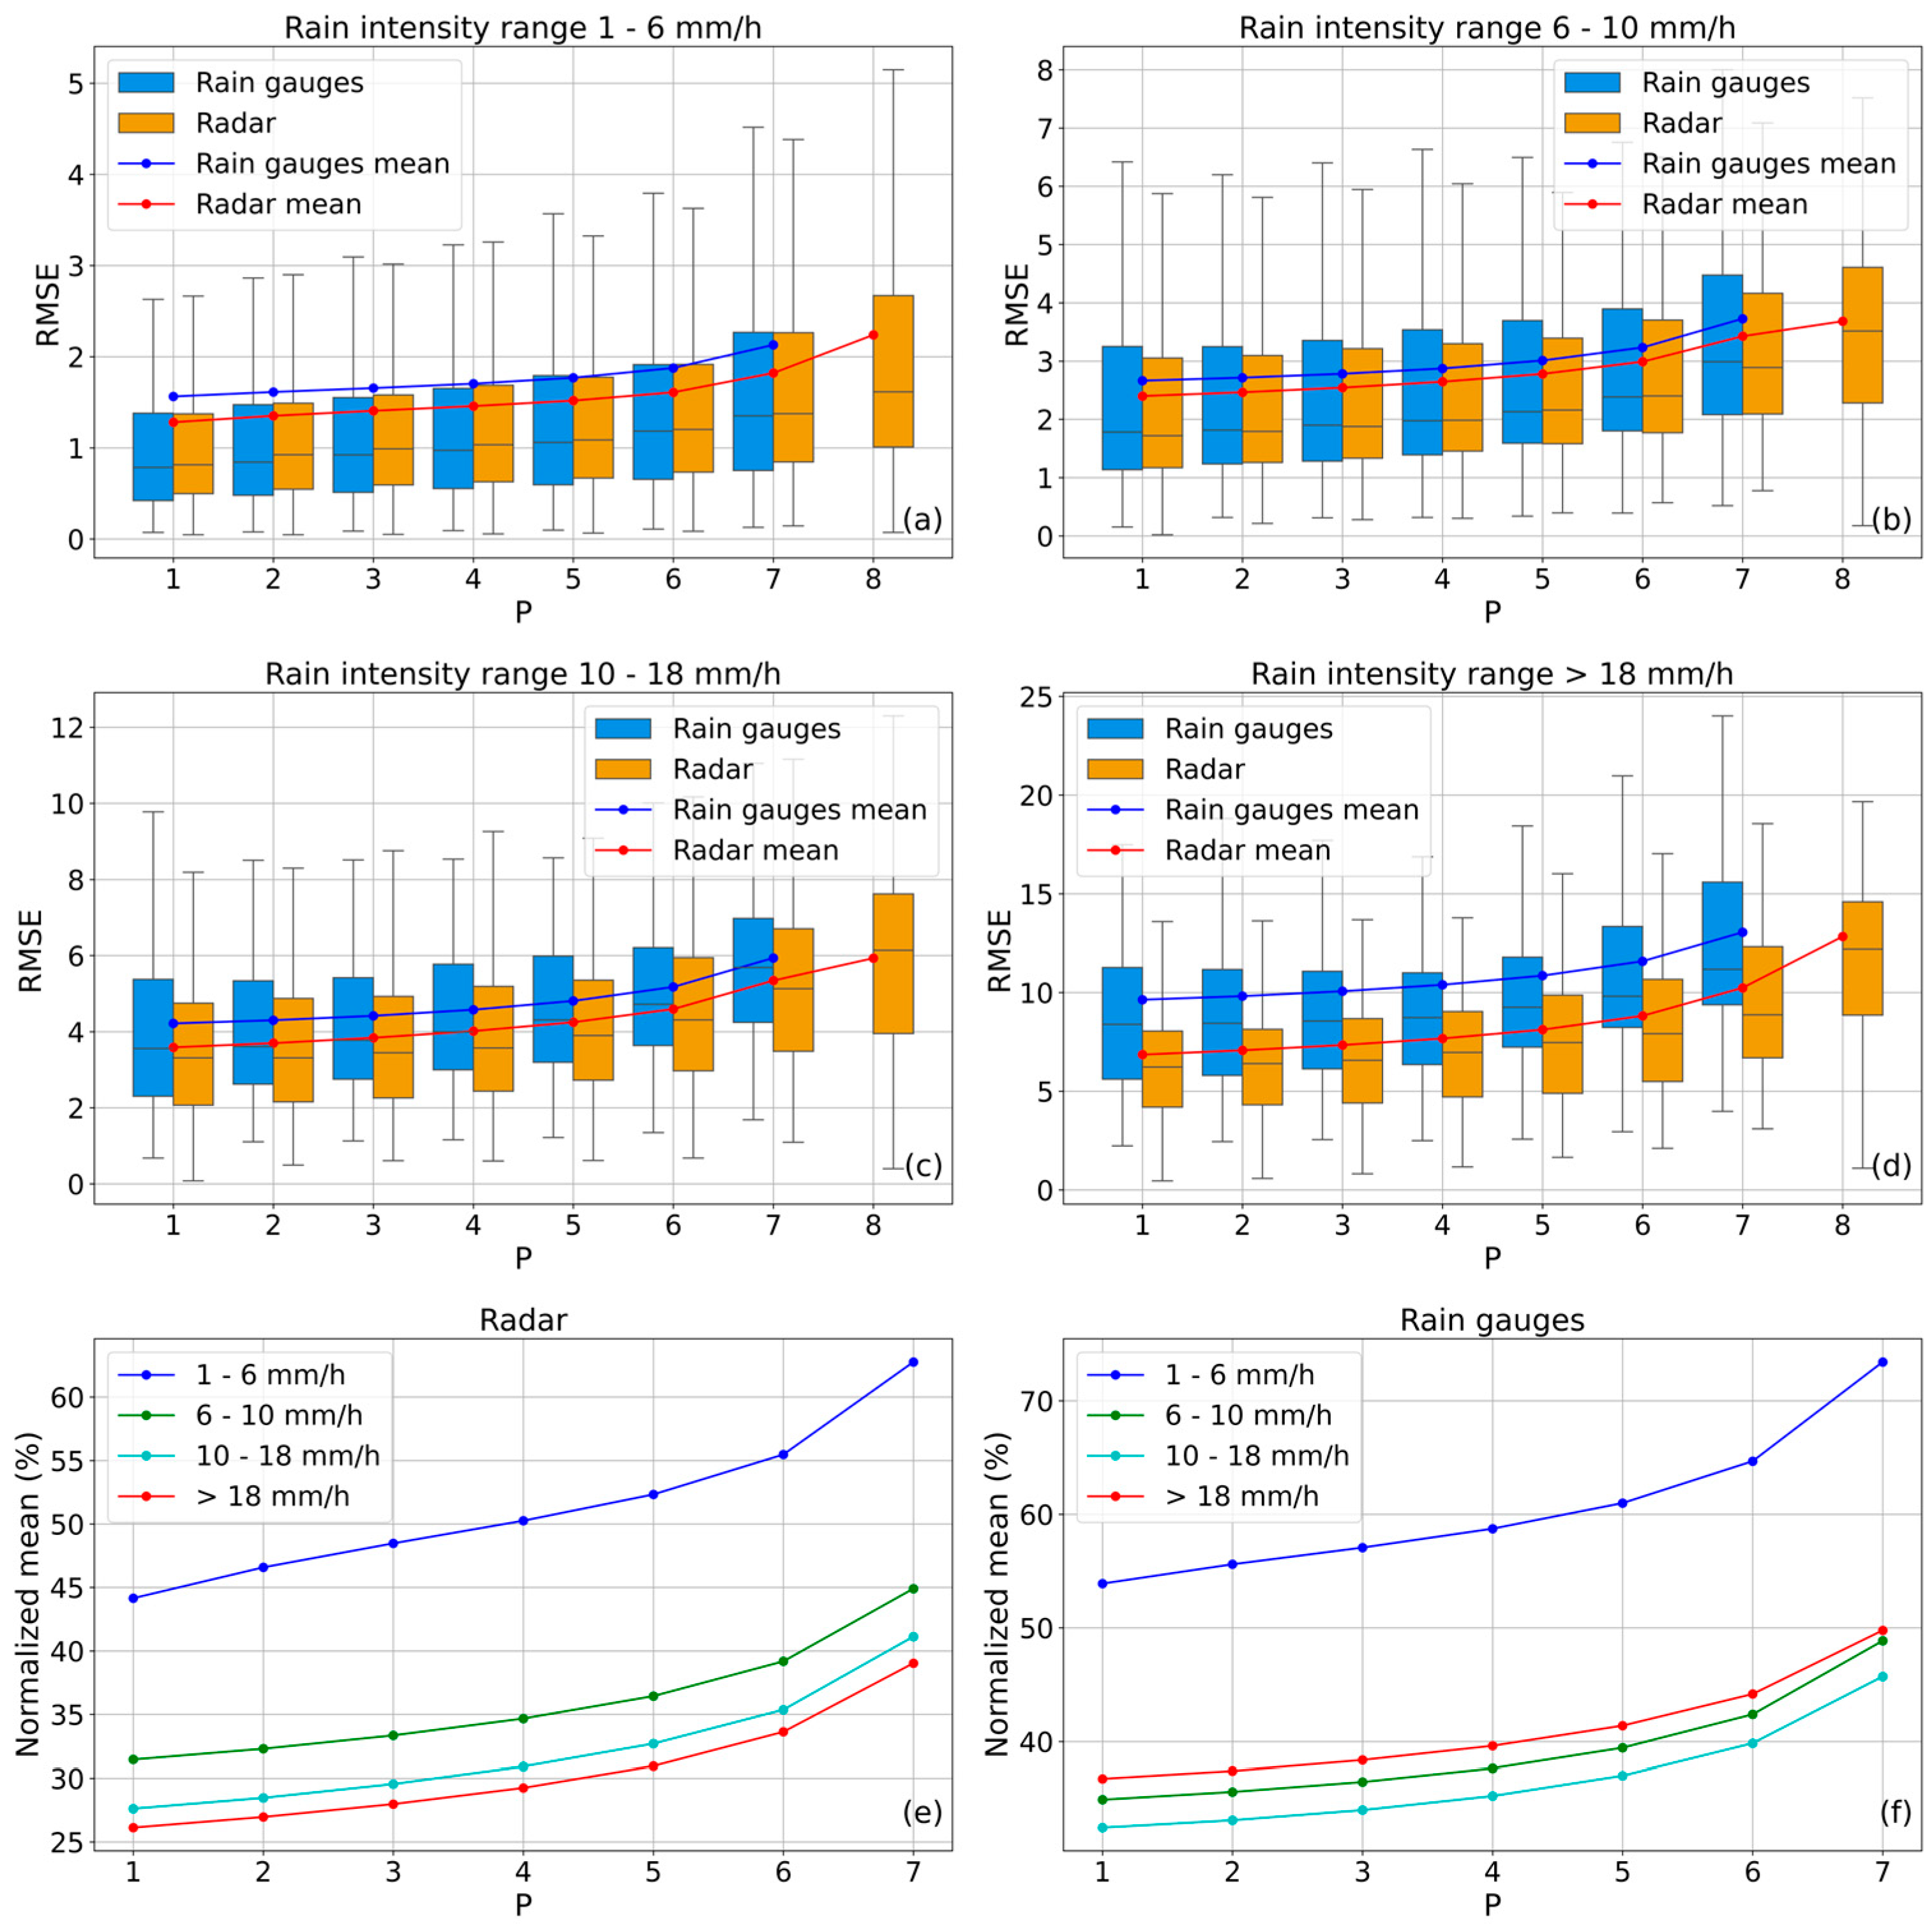
To evaluate the usefulness of radar data for more intense precipitation events, the same analysis described above was repeated by dividing the rain gauge measurements into the four intensity classes indicated in Section 3.1, each corresponding to a different rainfall regime as described in [59]. The four considered include, respectively, 597, 272, 151, and 55 hourly rainfall events. The results, presented in Figure 4, show that radar estimates, both in their uncorrected form and, in particular, when corrected using rain gauge data, consistently produce lower mean errors than estimates based solely on rain gauge interpolation. This advantage becomes increasingly evident as the precipitation intensity increases. For example, for the lowest class the RSME varies from 1.28 to 2.24, while in the highest class it varies from 6.85 to 12.84 (Figure 4a,d). Considering, on the other hand, the normalized averages of the errors with respect to the averages of the rainfall intensities falling in the various classes, in the lowest class, for example, we have an error ranging from 44% to 63%, while for the highest class the error varies from 26% to 39% (Figure 4e). In the case of using rain gauges only, the class containing the highest rainfall values has a higher RMSE on average than the second and third rainfall classes, e.g., by eliminating a rain gauge we have a percentage difference between the fourth and second class ranging from 37% to 35% (Figure 4f).
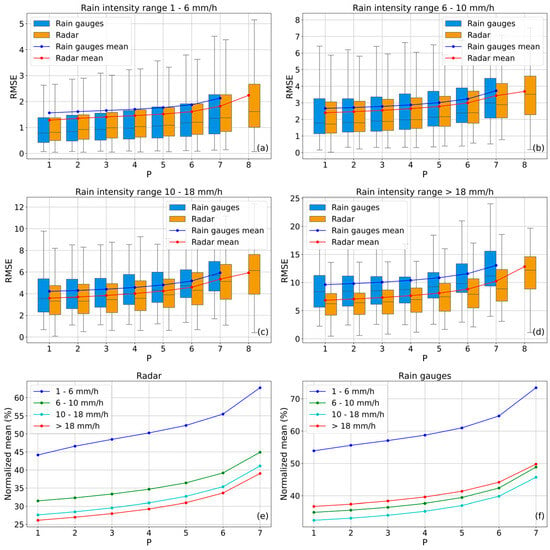
Figure 4.
Comparison between the distributions of the mean hourly estimation error in retrieving the values of P rain gauges falling within the range indicated in each panel, using the estimator based on the remaining gauges (blue box plots) or the estimator obtained with radar data corrected with the same gauges (orange box plots), for values of ranging from 1 to 7. The final box plot at , in each panel, represents the error distribution in retrieving values within the considered range using the uncorrected radar product. The box plots are derived from 597, 272, 151, and 55 hourly values for panels (a), (b), (c), and (d), respectively. The curves superimposed on the box plots represent the mean of the corresponding distributions: in blue for the rain gauge data and in red for the radar data. In the bottom row, panels (e) and (f) these curves are normalized with respect to the mean values of the rain gauge measurements within each class, which the estimates aim to reproduce ((left) panel for the rain gauge-based estimates, (right) panel for the radar-based estimates).
To characterize the statistical differences between the two error distributions, one derived from radar estimates and the other from rain gauge data alone, the Mann–Whitney U test was applied. This nonparametric test is suitable when the normality of the data cannot be assumed and when outliers may be present, potentially affecting the validity of parametric tests. It provides a robust method for comparing two independent samples without relying on distributional assumptions. Results were considered statistically significant at a p-value threshold of 0.05. The test was applied across the different rainfall intensity classes considered in the analysis. In the overall dataset (Figure 3), as well as under low to moderate rainfall intensities (Figure 4a,b), the test did not reveal statistically significant differences, with p-values ranging from 0.2 to 0.8. However, as rainfall intensity increased, the differences between the two estimators became statistically significant. p-values ranged from 0.04 to 0.06 (Figure 4c), approaching the conventional significance threshold, while for very high rainfall (Figure 4d), p-values ranged from 0.005 to 0.02, indicating strong statistical significance.
This result is consistent with the analysis conducted to characterize, in a deliberately worst-case scenario for the rain gauge network, its potential inability to capture localized precipitation peaks when the rain gauge recording the highest value is removed. As mentioned above, this approach allows for assessing the robustness of gauge-only methods in capturing locally high rainfall values. Although these maxima do not necessarily correspond to extreme events in absolute terms, they generally represent the most significant rainfall peaks within the domain and are therefore critical for hazard assessment. The difference between the two error distributions (radar-based versus gauge-only estimates) is highly statistically significant (p-value < 0.001; left panel of Figure 3), confirming that radar data more reliably reproduce these local maxima, and reinforcing the conclusion that their advantages become particularly relevant under more intense rainfall conditions.
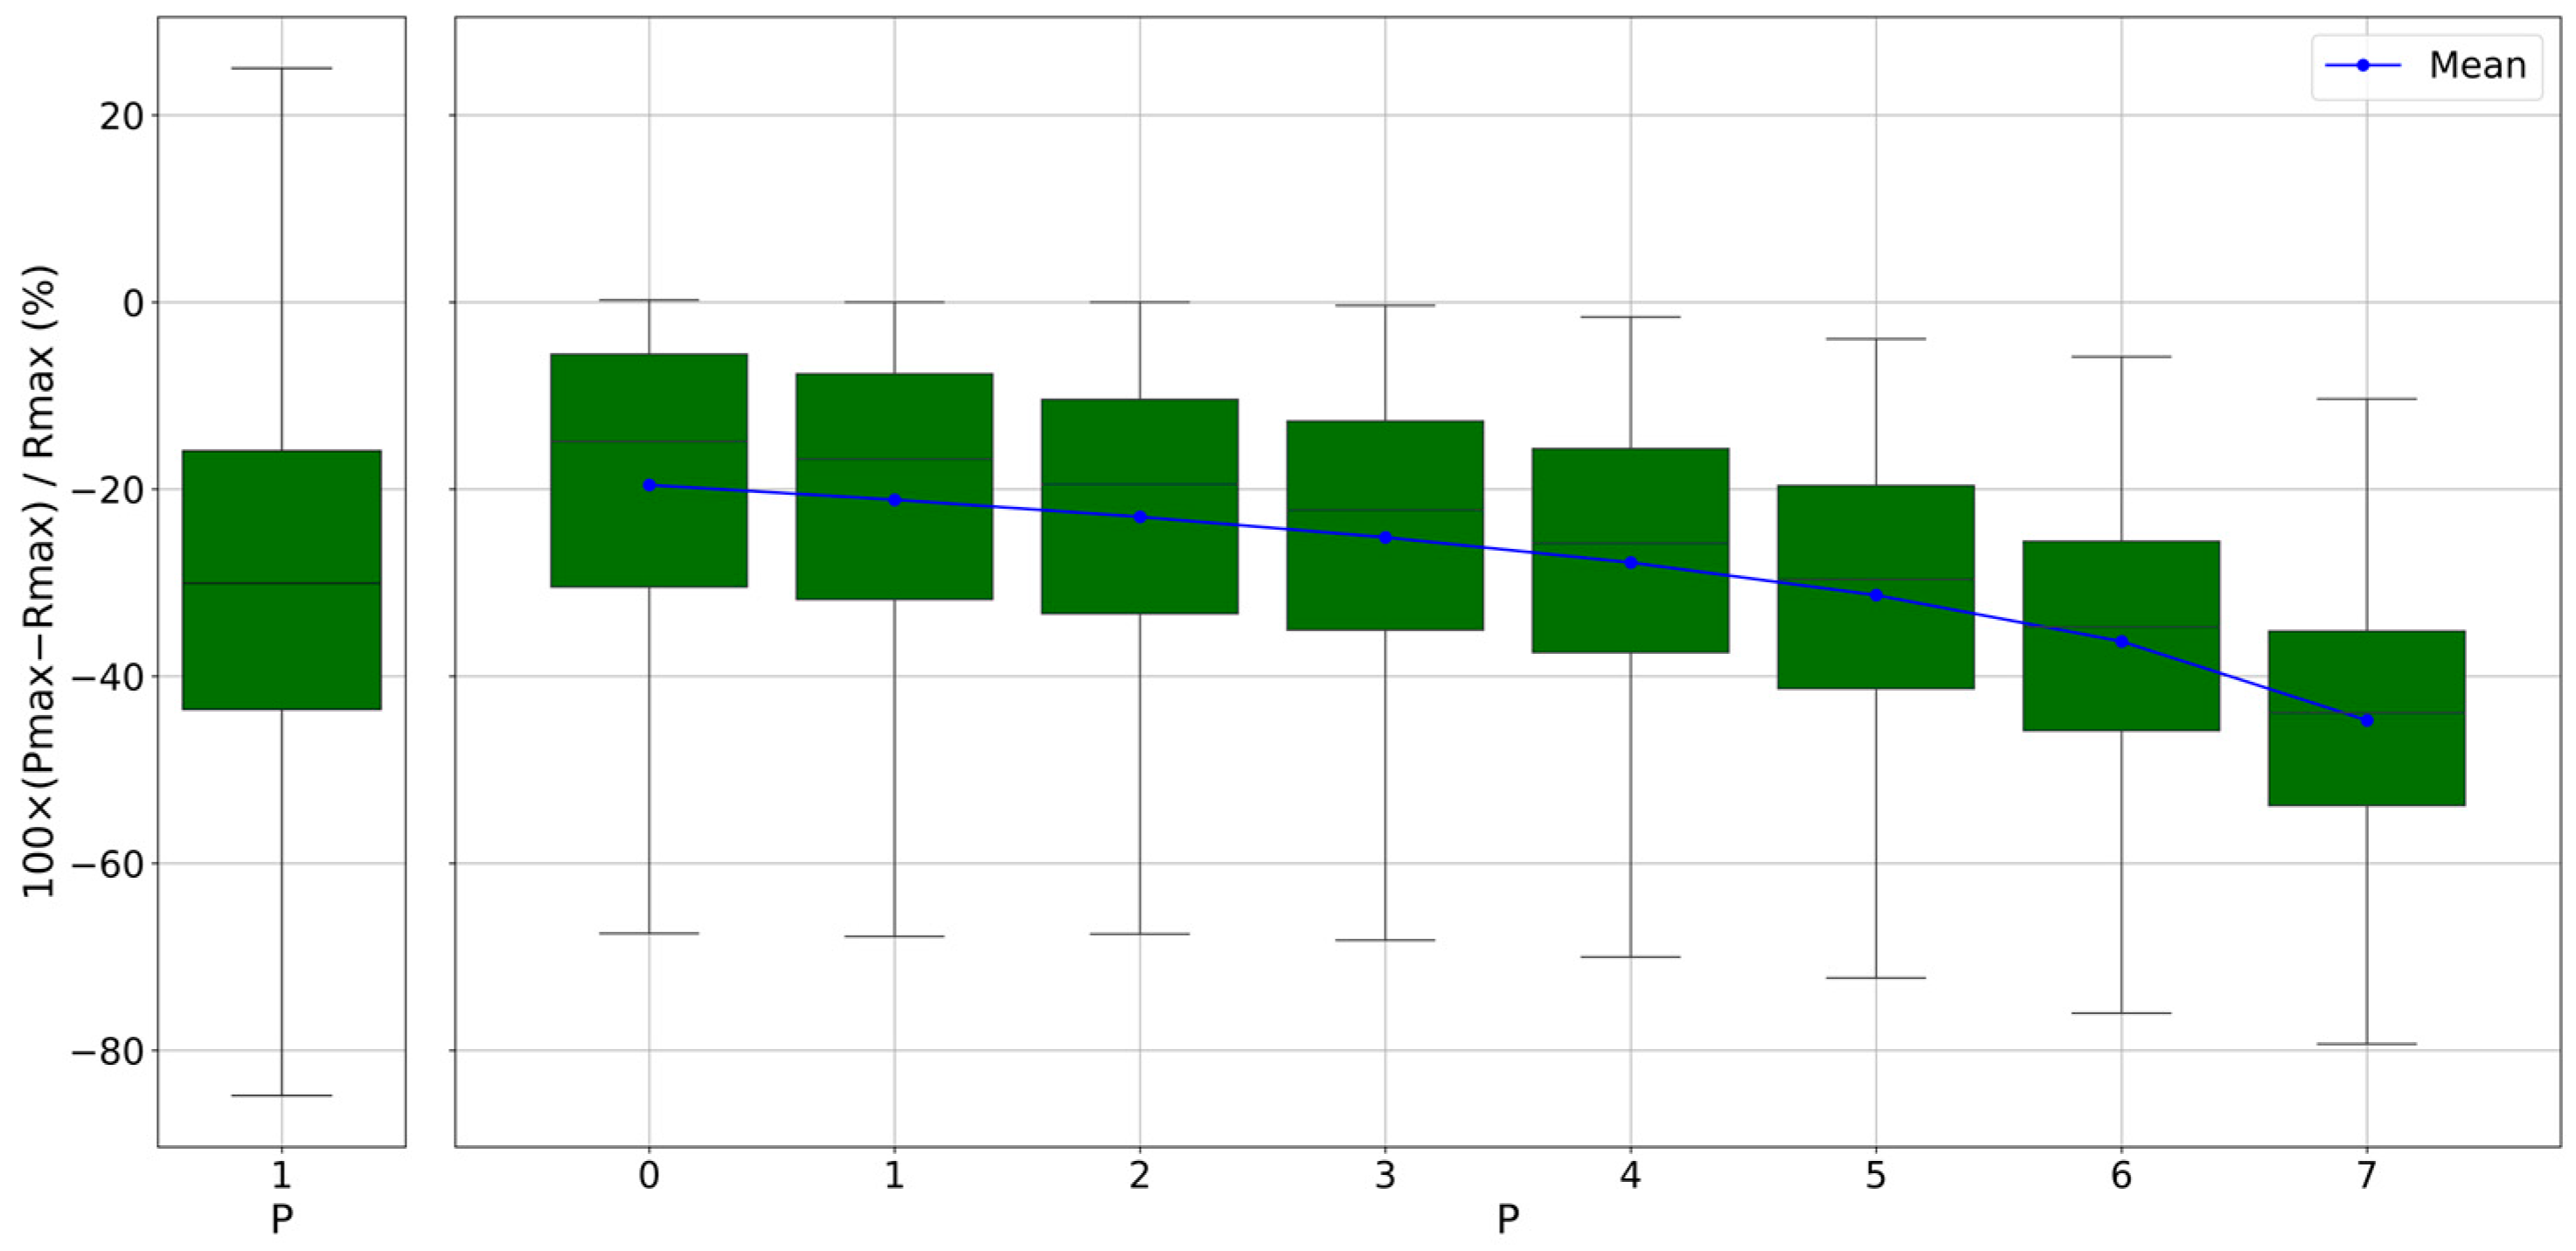
A further analysis was conducted in order to quantify the difference in estimating the maximum hourly rainfall input on study area using radar data, either uncorrected or corrected with rain gauge information, compared with estimates obtained only from rain gauge data. As described in Section 3, the analysis considered, for each time interval, the hourly maxima precipitation estimated across the entire study area from both the radar and the rain gauge network. As already noted, when rainfall fields are interpolated from gauge measurements, using IDW interpolator, the resulting estimates cannot exceed the maximum value recorded by the gauges themselves. In contrast, radar provides a spatially distributed product, which allow local maxima to be identified even in grid cells where no rain gauges are present. To explore how this ability is affected by network density, the same procedure described earlier was applied, progressively reducing the number of available rain gauges and assessing how this reduction influences the detection of precipitation maxima. The number of gauges also affects the radar correction process and, consequently, the maximum rainfall values derived from the radar itself. The temporal distribution of the mean relative percentage difference between the hourly maximum estimated from rain gauge data and the corresponding radar estimate, defined in Equation (12), is shown in Figure 5 as a function of the number of excluded gauges. The figure illustrates that the underestimation associated with rain gauge data increases as more gauges are removed, with mean values rising from about 20% when a single gauge is excluded to over 40% when only one rain gauge remains in the considered network.
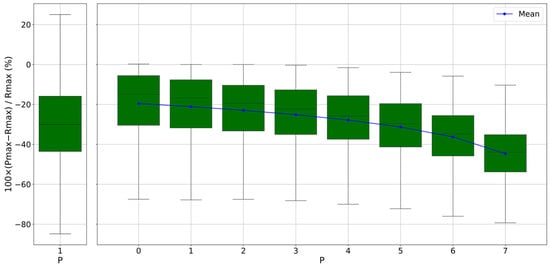
Figure 5.
Distribution of the mean relative percentage difference between the hourly maximum recorded by a network of N−P rain gauges in the study area and the maximum identified for the entire area based on the radar field corrected using the same rain gauge network (see Equation (12)), as p varies. The box on the left refers to the case p = 1 in which, for each hour, the rain gauge that records the highest value is eliminated. Each box plot is derived from a dataset of 636 hourly values.
To examine a particularly unfavourable condition for the rain gauge network, a further scenario was considered in which, for each time interval, the excluded rain gauge was specifically the one that had recorded the highest hourly rainfall amount. The distribution of the corresponding differences, in this case, is reported in the left panel of Figure 5. The underestimation observed in this scenario is significantly more severe than when a gauge is excluded at random, exceeding 40% even if only one instrument was removed.
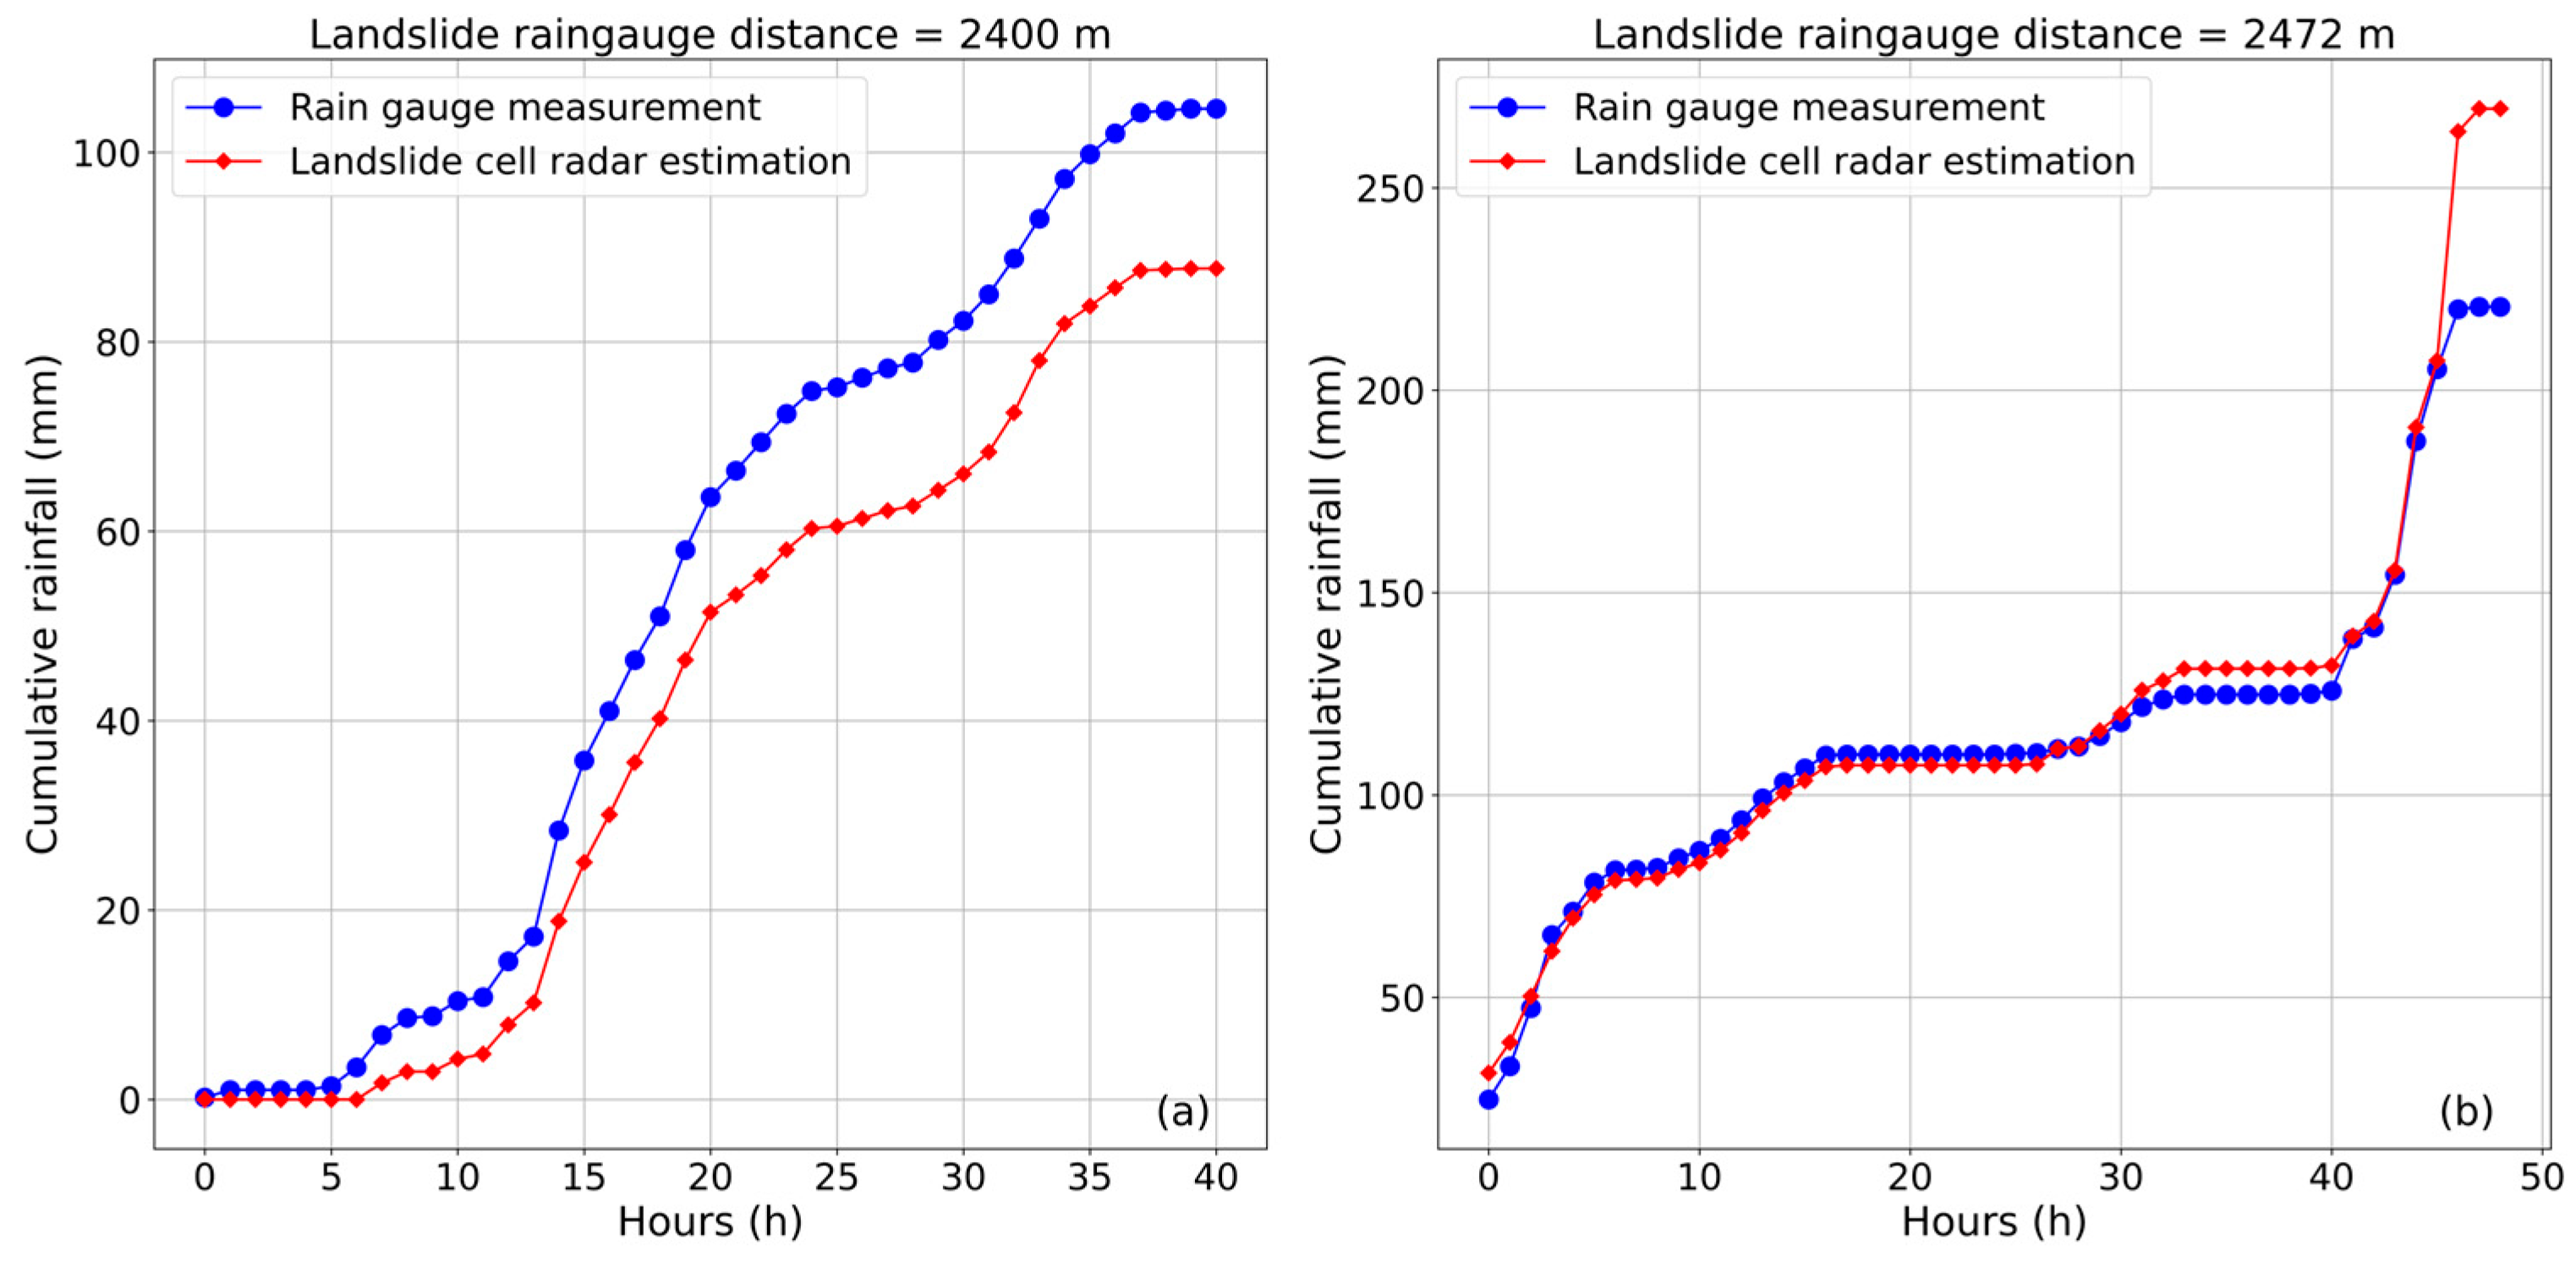
Finally, Table 2 reports, for the landslide activation cases, included in the ITALICA database the total rainfall measured during the triggering interval and the corresponding cumulative rainfall estimated by the corrected radar in correspondence of exact grid cell containing the landslide. Since the associated rain gauge is not necessarily located near the landslide site, the table also includes the distance between the rain gauge and the landslide. Additionally, is reported the maximum percentage error associated with the radar-derived cumulative, calculated following the methodology described in Section 3.3. This information allows for an assessment of whether the difference between the gauge measurement and the radar estimate is statistically significant. Eight cases among those analysed show a difference that exceeds the estimated uncertainty (highlighted in bold in the table). These include a maximum underestimation of approximately 18% (ID 49 event, with a rain gauge–landslide distance of just under 2.5 km) and a maximum overestimation of just over 19% (ID 37 event, with a distance of 2.4 km be-tween the rain gauge and the landslide). For these two events, the hyetograph recorded at the associated rain gauge and the corresponding radar-derived rainfall for the landslide cell are shown in Figure 6.
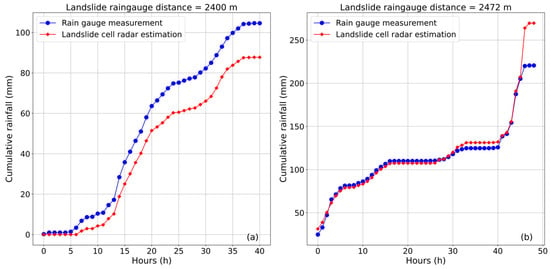
Figure 6.
Hyetograph of ID 37 event—panel (a), and ID 49 event—panel (b), recorded at the corresponding rain gauge and radar-derived rainfall for the landslide cell.
5. Discussion
This study explored the effectiveness of integrating radar data and rain gauge measurements for a more accurate characterization of precipitation, with particular reference to flood and landslide risk assessment and, specifically, to the estimation of rainfall potentially triggering landslides. The identified study area, located in Liguria (north-western Italy), spans approximately 200 km2 and is equipped with a dense network of 8 rain gauges, in addition to being covered by a C-band weather radar located about 25 km away. The analysis was based on eight years of hourly data, from 2015 to 2022, comparing radar estimates with rain gauge measurements.
The availability of 8 rain gauges, evenly distributed across the study area, allowed for the evaluation of the average spatial performance of the radar-estimated precipitation field by comparing hourly estimates in cells containing a rain gauge with the corresponding measured values. Local correction factors were also calculated, subsequently extended to the entire area using IDW interpolation, to obtain a corrected radar precipitation field. The study area, characterized by a relatively high rain gauge density, was selected for two main reasons: first, to analyse a situation favourable to rain gauges, whose limitations in capturing the spatial variability of precipitation are well known; and second, to enable the simulation of scenarios with reduced gauge availability. Accordingly, we tested configurations to evaluate how network density affects radar calibration and the ability to reconstruct rainfall patterns in ungauged cells.
The results showed clearly that the use of radar data, even in restricted territorial contexts equipped with a relatively dense rain gauge network, allows for a more accurate spatial representation of precipitation events. This contribution is particularly relevant in fields such as urban hydrology and small catchments, where spatial variability, especially in the case of localized convective events, can be extremely marked. The analysis, which included a Leave-P-Out Cross-Validation and a classification of rainfall events by precipitation intensity, showed that radar-corrected estimates consistently outperform, in terms of spatial accuracy, those obtained through interpolation of rain gauge data alone. This advantage increases with increasing precipitation intensity as shown by the results of the Mann–Whitney U tests. Differences between the two estimators start to become meaningful for rainfall intensities exceeding approximately 10 mm/h and are clearly evident for intensities above 18 mm/h. This indicates that radar-based and gauge-only estimates diverge more substantially and reliably under heavier rainfall conditions.
Notably, even the uncorrected radar data provided, for the most intense rainfall events, superior performance compared to the interpolation of rain gauges alone. Analyses of relative errors further confirmed the increasing reliability of radar products with increasing rainfall intensity. Specifically, when precipitation values are grouped by intensity classes, and the mean estimation error is normalized by the average observed precipitation within each class, radar-derived estimates show a clear improvement in accuracy as rainfall intensity rises (see panel f of Figure 4). In contrast, this trend is not evident for estimates based exclusively on rain gauge data (see panel f of Figure 4).
It was also shown that, although rain gauges provide high-precision point measurements, they can significantly underestimate precipitation maxima over a given area, particularly when the network is sparse. Radar data, especially when corrected with gauge information, proved more reliable in capturing local peaks, with gauge-only estimates showing increasing underestimation as gauges were removed, and a dramatic effect observed when the gauge recording the highest value was excluded (see Figure 5).
The integration with radar data, therefore, not only reduces the average error in estimates but also significantly improves the ability to detect and quantify intensity peaks, providing a more realistic representation of the rainfall forcing, particularly during concentrated rainfall events. It is important to emphasize that such situations are, for example, typical of convective events, which are increasingly frequent due to climate change, and require spatial coverage that only radar can effectively guarantee. In this framework, the analysis of the maximum rainfall over the study area was not intended to identify a direct correlation with landslide occurrence, but rather to quantify the potential maximum error in rainfall estimation when relying exclusively on rain gauge data. This value can be interpreted as an indicator of the largest possible misestimation of rainfall forcing across the domain. In practical terms, if such a rainfall maximum were to occur over a highly susceptible sector, the resulting error would lead to a substantial misrepresentation of the actual precipitation associated with landslide initiation. This consideration further highlights the importance of radar data for accurately reconstructing the spatial variability of rainfall, which is crucial in rainfall-induced hazard assessment.
The findings suggest that relying solely on rain gauge networks for characterizing precipitation responsible for triggering landslides can introduce significant biases, failing to capture the true localization and intensity of rainfall forcing. Indeed, occur as a result of a combination of predisposing conditions and external triggering factors, among which rainfall being the most frequent and effective factor due to its direct impact on hydrological processes that can lead to slope failure. In particular, total rainfall amount, intensity, and duration have been recognized as critical for landslide initiation [10]. The radar-based approach proposed in this study allows these parameters to be characterized with greater spatial accuracy, improving the representation of rainfall forcing responsible for slope instability. To assess real-case discrepancies in rainfall estimates associated with landslide events, the cumulative rainfall measured by the nearest rain gauge reported in the ITALICA database (which exclusively includes rainfall-induced landslides) was compared with the cumulative rainfall estimated by the corrected radar in the exact grid cell containing the landslide. In cases where the difference between the two values exceeds the uncertainty associated with the radar estimate, this indicates a possible misrepresentation of the triggering rainfall when relying solely on gauge data, despite the relatively short distances involved. Both underestimations and overestimations by rain gauges were observed, with no clear correlation between the gauge-landslide distance and the magnitude of the discrepancy (see Table 2), suggesting that small-scale rainfall variability likely plays a more critical role than proximity alone. Indeed, the spatial representativeness of rain gauge measurements largely depends on the structure of the rainfall field. In the case of more homogeneous precipitation patterns, such as those typically associated with stratiform rainfall, only limited differences are expected between the rainfall recorded by the nearest gauge and the actual rainfall at the landslide initiation point, even over relatively large distances. Conversely, for highly variable rainfall structures, such as those produced by convective events, spatial variability can be so pronounced that even gauges located relatively close to the initiation point may record rainfall amounts substantially different from those that actually occurred at the triggering location.
6. Conclusions
This study demonstrated the effectiveness of integrating radar observations with rain gauge measurements to improve the spatial characterization of precipitation and its use in flood and landslide risk assessment. Even in a relatively small study area equipped with a dense gauge network, radar data proved essential for capturing the spatial variability of rainfall, especially during intense and localized events.
With specific reference to rainfall-induced landslides, by analysing real events we showed that radar data can substantially modify the estimated rainfall associated with actual landslide occurrences, compared to gauge-only estimates. This finding demonstrates that radar-based information enables a more accurate reconstruction of rainfall forcing at the landslide initiation point, which represents a crucial step toward defining reliable rainfall thresholds for early warning and hazard assessment purposes. These results can be considered a first step toward quantifying the contribution that radar-derived rainfall estimates can provide to the development of intensity–duration thresholds for landslide initiation. Future research will extend the proposed methodology to broader spatial domains and different climatic contexts, also exploring the relationship between radar and gauge discrepancies and rainfall types such as stratiform and convective events.
Further improvements could arise from testing alternative radar and gauge merging and interpolation schemes, particularly under conditions of limited data availability or strong spatial heterogeneity. Moreover, integrating radar-derived rainfall estimates with landslide susceptibility maps may represent a promising approach to developing dynamic hazard mapping tools. This integration could also enhance post-event analyses, particularly in areas where landslide inventories are derived from indirect sources such as media reports, which are often spatially biased toward anthropized areas.
Overall, radar-based rainfall estimation emerges as a key asset for accurately describing the spatial distribution of precipitation, even in regions already equipped with dense rain gauge networks. Its integration into hydrological and geomorphological monitoring frameworks can provide essential support for early warning systems, disaster risk reduction, and the design of climate-resilient infrastructure in the face of increasingly frequent extreme events.
Author Contributions
Conceptualization, F.C., M.D.B., G.I., L.P., O.T. and V.T.; data curation, F.C., M.D.B. and L.P.; formal analysis, F.C., M.D.B. and L.P.; investigation F.C., M.D.B., V.L., M.M. and L.P.; methodology, F.C. and M.D.B.; validation F.C. and M.D.B.; visualization F.C., M.D.B. and V.L.; writing—original draft, F.C., M.D.B. and L.P.; writing—review and editing, F.C., M.D.B., G.I., V.L., M.M., L.P., O.T. and V.T. All authors have read and agreed to the published version of the manuscript.
Funding
This work was funded by the Next Generation EU—Italian NRRP, Mission 4, Component 2, Investment 1.5, call for the creation and strengthening of ‘Innovation Ecosystems’, building ‘Territorial R&D Leaders’ (Directorial Decree n. 2021/3277)—project Tech4You—Technologies for climate change adaptation and quality of life improvement, n. ECS0000009. This work reflects only the authors’ views and opinions; neither the Ministry for University and Research nor the European Commission can be considered responsible for them.
Data Availability Statement
This work is based on the analysis of data from the following publicly available databases: Landslide data used in this work were extracted from the ITALICA database, available at the following web link: https://zenodo.org/records/14204473. Rainfall data were extracted from the Liguria Region portal: https://ambientepub.regione.liguria.it/SiraQualMeteo/script/PubAccessoDatiMeteo.asp. Radar data were downloaded from the Radar-DPC platform: https://mappe.protezionecivile.gov.it/it/mappe-e-dashboard-rischi/piattaforma-radar/.
Conflicts of Interest
The authors declare no conflicts of interest.
References
- Ly, S.; Charles, C.; Degré, A. Different Methods for Spatial Interpolation of Rainfall Data for Operational Hydrology and Hydrological Modeling at Watershed Scale: A Review. [Méthodes de spatialisation de données pluviométriques dédiées à l’hydrologie opérationnelle et à la modélisation hydrologique à l’échelle du bassin versant: Une revue bibliographique]. Biotechnol. Agron. Soc. Environ. 2013, 17, 392–406. [Google Scholar]
- Villarini, G.; Mandapaka, P.V.; Krajewski, W.F.; Moore, R.J. Rainfall and Sampling Uncertainties: A Rain Gauge Perspective. J. Geophys. Res. Atmos. 2008, 113, 2007JD009214. [Google Scholar] [CrossRef]
- Otieno, H.; Yang, J.; Liu, W.; Han, D. Influence of Rain Gauge Density on Interpolation Method Selection. J. Hydrol. Eng. 2014, 19, 04014024. [Google Scholar] [CrossRef]
- Garcia, M.; Peters-Lidard, C.D.; Goodrich, D.C. Spatial Interpolation of Precipitation in a Dense Gauge Network for Monsoon Storm Events in the Southwestern United States. Water Resour. Res. 2008, 44, 2006WR005788. [Google Scholar] [CrossRef]
- O, S.; Foelsche, U. Assessment of Spatial Uncertainty of Heavy Rainfall at Catchment Scale Using a Dense Gauge Network. Hydrol. Earth Syst. Sci. 2019, 23, 2863–2875. [Google Scholar] [CrossRef]
- Avolio, E.; Cavalcanti, O.; Furnari, L.; Senatore, A.; Mendicino, G. Brief Communication: Preliminary Hydro-Meteorological Analysis of the Flash Flood of 20 August 2018 in Raganello Gorge, Southern Italy. Nat. Hazards Earth Syst. Sci. 2019, 19, 1619–1627. [Google Scholar] [CrossRef]
- Gabriele, S.; Chiaravalloti, F.; Procopio, A. Radar–Rain-Gauge Rainfall Estimation for Hydrological Applications in Small Catchments. Adv. Geosci. 2017, 44, 61–66. [Google Scholar] [CrossRef][Green Version]
- Park, I.-H.; Min, S.-K. Role of Convective Precipitation in the Relationship between Subdaily Extreme Precipitation and Temperature. J. Clim. 2017, 30, 9527–9537. [Google Scholar] [CrossRef]
- Guzzetti, F.; Peruccacci, S.; Rossi, M.; Stark, C.P. The Rainfall Intensity–Duration Control of Shallow Landslides and Debris Flows: An Update. Landslides 2008, 5, 3–17. [Google Scholar] [CrossRef]
- Guzzetti, F.; Gariano, S.L.; Peruccacci, S.; Brunetti, M.T.; Melillo, M. Chapter 15—Rainfall and Landslide Initiation. In Rainfall: Modelling, Measurement and Applications; Morbidelli, R., Ed.; Elsevier: Amsterdam, The Netherlands, 2022; pp. 427–450. ISBN 978-0-12-822544-8. [Google Scholar]
- D’Ippolito, A.; Lupiano, V.; Rago, V.; Terranova, O.G.; Iovine, G. Triggering of Rain-Induced Landslides, with Applications in Southern Italy. Water 2023, 15, 277. [Google Scholar] [CrossRef]
- Schroeer, K.; Kirchengast, G.; Sungmin, O. Strong Dependence of Extreme Convective Precipitation Intensities on Gauge Network Density. Geophys. Res. Lett. 2018, 45, 8253–8263. [Google Scholar] [CrossRef]
- Hosseinzadehtalaei, P.; Tabari, H.; Willems, P. Climate Change Impact on Short-Duration Extreme Precipitation and Intensity–Duration–Frequency Curves over Europe. J. Hydrol. 2020, 590, 125249. [Google Scholar] [CrossRef]
- Sokol, Z.; Szturc, J.; Orellana-Alvear, J.; Popová, J.; Jurczyk, A.; Célleri, R. The Role of Weather Radar in Rainfall Estimation and Its Application in Meteorological and Hydrological Modelling—A Review. Remote Sens. 2021, 13, 351. [Google Scholar] [CrossRef]
- Ryzhkov, A.; Zhang, P.; Bukovčić, P.; Zhang, J.; Cocks, S. Polarimetric Radar Quantitative Precipitation Estimation. Remote Sens. 2022, 14, 1695. [Google Scholar] [CrossRef]
- Borga, M.; Marra, F.; Gabella, M. Chapter 5—Rainfall Estimation by Weather Radar. In Rainfall: Modelling, Measurement and Applications; Morbidelli, R., Ed.; Elsevier: Amsterdam, The Netherlands, 2022; pp. 109–134. ISBN 978-0-12-822544-8. [Google Scholar]
- Uijlenhoet, R. Raindrop Size Distributions and Radar Reflectivity–Rain Rate Relationships for Radar Hydrology. Hydrol. Earth Syst. Sci. 2001, 5, 615–628. [Google Scholar] [CrossRef]
- Orellana-Alvear, J.; Célleri, R.; Rollenbeck, R.; Bendix, J. Analysis of Rain Types and Their Z–R Relationships at Different Locations in the High Andes of Southern Ecuador. J. Appl. Meteorol. Climatol. 2017, 56, 3065–3080. [Google Scholar] [CrossRef]
- Biondi, A.; Facheris, L.; Argenti, F.; Cuccoli, F. Comparison of Different Quantitative Precipitation Estimation Methods Based on a Severe Rainfall Event in Tuscany, Italy, November 2023. Remote Sens. 2024, 16, 3985. [Google Scholar] [CrossRef]
- Goudenhoofdt, E.; Delobbe, L. Evaluation of Radar-Gauge Merging Methods for Quantitative Precipitation Estimates. Hydrol. Earth Syst. Sci. 2009, 13, 195–203. [Google Scholar] [CrossRef]
- Rago, V.; Lupiano, V.; Chiaravalloti, F.; Chiodo, G.; Gabriele, S.; Pellegrino, A.D.; Terranova, O.G.; Iovine, G. Geomorphic effects caused by heavy rainfall in the Corigliano-Rossano area (NE Calabria, Italy) on 12 August 2015. J. Maps 2021, 17, 279–288. [Google Scholar] [CrossRef]
- Rago, V.; Chiaravalloti, F.; Chiodo, G.; Gabriele, S.; Lupiano, V.; Nicastro, R.; Pellegrino, A.D.; Procopio, A.; Siviglia, S.; Terranova, O.G.; et al. Geomorphic effects caused by heavy rainfall in southern Calabria (Italy) on 30 October–1 November 2015. J. Maps 2017, 13, 836–843. [Google Scholar] [CrossRef]
- Wang, L.-P.; Ochoa-Rodríguez, S.; Simões, N.E.; Onof, C.; Maksimović, Č. Radar–Raingauge Data Combination Techniques: A Revision and Analysis of Their Suitability for Urban Hydrology. Water Sci. Technol. 2013, 68, 737–747. [Google Scholar] [CrossRef]
- Ochoa-Rodriguez, S.; Wang, L.-P.; Willems, P.; Onof, C. A Review of Radar-Rain Gauge Data Merging Methods and Their Potential for Urban Hydrological Applications. Water Resour. Res. 2019, 55, 6356–6391. [Google Scholar] [CrossRef]
- Qiu, Q.; Liu, J.; Tian, J.; Jiao, Y.; Li, C.; Wang, W.; Yu, F. Evaluation of the Radar QPE and Rain Gauge Data Merging Methods in Northern China. Remote Sens. 2020, 12, 363. [Google Scholar] [CrossRef]
- Wilson, J.W.; Brandes, E.A. Radar Measurement of Rainfall—A Summary. Bull. Am. Meteor. Soc. 1979, 60, 1048–1060. [Google Scholar] [CrossRef]
- Smith, J.A.; Krajewski, W.F. Estimation of the Mean Field Bias of Radar Rainfall Estimates. J. Appl. Meteorol. Climatol. 1991, 30, 397–412. [Google Scholar] [CrossRef]
- Seo, D.-J.; Breidenbach, J.P.; Johnson, E.R. Real-Time Estimation of Mean Field Bias in Radar Rainfall Data. J. Hydrol. 1999, 223, 131–147. [Google Scholar] [CrossRef]
- Michelson, D.B.; Koistinen, J. Gauge-Radar Network Adjustment for the Baltic Sea Experiment. Phys. Chem. Earth Part B Hydrol. Ocean. Atmos. 2000, 25, 915–920. [Google Scholar] [CrossRef]
- Brandes, E.A. Optimizing Rainfall Estimates with the Aid of Radar. J. Appl. Meteor. 1975, 14, 1339–1345. [Google Scholar] [CrossRef]
- James, W.P.; Robinson, C.G.; Bell, J.F. Radar-Assisted Real-Time Flood Forecasting. J. Water Resour. Plan. Manag. 1993, 119, 32–44. [Google Scholar] [CrossRef]
- Laurent, L.; Audois, P.; Marie-Joseph, I.; Becker, M.; Seyler, F. Calibration of TRMM 3B42 with Geographical Differential Analysis over North Amazonia. In Proceedings of the IEEE International Geoscience and Remote Sensing Symposium—IGARSS, Melbourne, Australia, 21–26 July 2013; pp. 2234–2237. [Google Scholar]
- Martens, B.; Cabus, P.; De Jongh, I.; Verhoest, N.E.C. Merging Weather Radar Observations with Ground-Based Measurements of Rainfall Using an Adaptive Multiquadric Surface Fitting Algorithm. J. Hydrol. 2013, 500, 84–96. [Google Scholar] [CrossRef]
- Nielsen, J.M.; Van De Beek, C.Z.R.; Thorndahl, S.; Olsson, J.; Andersen, C.B.; Andersson, J.C.M.; Rasmussen, M.R.; Nielsen, J.E. Merging Weather Radar Data and Opportunistic Rainfall Sensor Data to Enhance Rainfall Estimates. Atmos. Res. 2024, 300, 107228. [Google Scholar] [CrossRef]
- Zhang, P.; Liu, X.; Pu, K. Precipitation Monitoring Using Commercial Microwave Links: Current Status, Challenges and Prospectives. Remote Sens. 2023, 15, 4821. [Google Scholar] [CrossRef]
- Li, B.; Zheng, J.; Shi, X.; Chen, Y. Quantifying the Impact of Mountain Precipitation on Runoff in Hotan River, Northwestern China. Front. Earth Sci. 2020, 14, 568–577. [Google Scholar] [CrossRef]
- Duan, Z.; Bastiaanssen, W.G.M. First Results from Version 7 TRMM 3B43 Precipitation Product in Combination with a New Downscaling–Calibration Procedure. Remote Sens. Environ. 2013, 131, 1–13. [Google Scholar] [CrossRef]
- Giannoni, F.; Roth, G.; Rudari, R. A Procedure for Drainage Network Identification from Geomorphology and Its Application to the Prediction of the Hydrologic Response. Adv. Water Resour. 2005, 28, 567–581. [Google Scholar] [CrossRef]
- Silvestro, F.; Parodi, A.; Campo, L.; Ferraris, L. Analysis of the Streamflow Extremes and Long-Term Water Balance in the Liguria Region of Italy Using a Cloud-Permitting Grid Spacing Reanalysis Dataset. Hydrol. Earth Syst. Sci. 2018, 22, 5403–5426. [Google Scholar] [CrossRef]
- Rebora, N.; Molini, L.; Casella, E.; Comellas, A.; Fiori, E.; Pignone, F.; Siccardi, F.; Silvestro, F.; Tanelli, S.; Parodi, A. Extreme Rainfall in the Mediterranean: What Can We Learn from Observations? J. Hydrometeorol. 2013, 14, 906–922. [Google Scholar] [CrossRef]
- Giacomini, F.; Braga, R.; Tiepolo, M.; Tribuzio, R. New Constraints on the Origin and Age of Variscan Eclogitic Rocks (Ligurian Alps, Italy). Contrib. Miner. Pet. 2007, 153, 29–53. [Google Scholar] [CrossRef]
- Cortesogno, L.; Dallagiovanna, G.; Gaggero, L.; Vanossi, M. Elements of the Palaeozoic History of the Ligurian Alps. In Pre-Mesozoic Geology in the Alps; von Raumer, J.F., Neubauer, F., Eds.; Springer: Berlin/Heidelberg, Germany, 1993; pp. 257–277. ISBN 978-3-642-84640-3. [Google Scholar]
- Gaggero, L.; Cortesogno, L.; Bertrand, J. The Pre-Namurian Basement of the Ligurian Alps: A Review of the Lithostratigraphy, Pre-Alpine Metamorphic Evolution, and Regional Comparisons. Period. Mineral. 2004, 73, 85–96. [Google Scholar]
- Franceschini, R.; Rosi, A.; Catani, F.; Casagli, N. Exploring a Landslide Inventory Created by Automated Web Data Mining: The Case of Italy. Landslides 2022, 19, 841–853. [Google Scholar] [CrossRef]
- Montopoli, M.; Annella, C.; Baldini, L.; Adirosi, E.; Capozzi, V.; Vulpiani, G. Rain Motion Vectors Analysis from the Radar Network in Italy. IEEE J. Sel. Top. Appl. Earth Obs. Remote Sens. 2024, 17, 11655–11669. [Google Scholar] [CrossRef]
- Cimini, D.; Romano, F.; Ricciardelli, E.; Di Paola, F.; Viggiano, M.; Marzano, F.S.; Colaiuda, V.; Picciotti, E.; Vulpiani, G.; Cuomo, V. Validation of Satellite OPEMW Precipitation Product with Ground-Based Weather Radar and Rain Gauge Networks. Atmos. Meas. Tech. 2013, 6, 3181–3196. [Google Scholar] [CrossRef]
- Bechini, R.; Cremonini, R. The weather radar system of north-western Italy: An advanced tool for meteorological surveillance. In Proceedings of the Second European Conference on Radar in Meteorology and Hydrology, Delft, The Netherlands, 18–22 November 2002; Copernicus: Gottingen, Germany, 2002; pp. 400–404. [Google Scholar]
- Silvestro, F.; Rebora, N.; Ferraris, L. An algorithm for real-time rainfall rate estimation by using polarimetric radar: RIME. J. Hydrometeorol. 2009, 10, 227–240. [Google Scholar] [CrossRef]
- Vulpiani, G.; Montopoli, M.; Passeri, L.D.; Gioia, A.G.; Giordano, P.; Marzano, F.S. On the Use of Dual-Polarized C-Band Radar for Operational Rainfall Retrieval in Mountainous Areas. J. Appl. Meteorol. Climatol. 2012, 51, 405–425. [Google Scholar] [CrossRef]
- Available online: https://mappe.protezionecivile.gov.it/it/mappe-e-dashboard-rischi/piattaforma-radar/ (accessed on 27 October 2025).
- Cassola, F.; Iengo, A.; Turato, B. Extreme Convective Precipitation in Liguria (Italy): A Brief Description and Analysis of the Event Occurred on October 4, 2021. Bull. Atmos. Sci. Technol. 2023, 4, 4. [Google Scholar] [CrossRef]
- Available online: https://ambientepub.regione.liguria.it/SiraQualMeteo/script/PubAccessoDatiMeteo.asp (accessed on 27 October 2025).
- Peruccacci, S.; Gariano, S.L.; Melillo, M.; Solimano, M.; Guzzetti, F.; Brunetti, M.T. The ITAlian Rainfall-Induced LandslIdes CAtalogue, an Extensive and Accurate Spatio-Temporal Catalogue of Rainfall-Induced Landslides in Italy. Earth Syst. Sci. Data 2023, 15, 2863–2877. [Google Scholar] [CrossRef]
- Brunetti, M.T.; Gariano, S.L.; Melillo, M.; Rossi, M.; Peruccacci, S. An Enhanced Rainfall-Induced Landslide Catalogue in Italy. Sci. Data 2025, 12, 216. [Google Scholar] [CrossRef] [PubMed]
- Silvestro, F.; Rebora, N.; Ferraris, L.; Morando, M.; Alberoni, P.; Fornasiero, A. Clutter and Rainfall Discrimination by Means of Doppler-Polarimetric Measurements and Vertical Reflectivity Profile Analysis. Adv. Geosci. 2005, 2, 135–138. [Google Scholar] [CrossRef][Green Version]
- Shen, Z.; Wu, H. A Comparative Analysis of Merging Strategies for Satellite Precipitation Estimates and Ground Observations over Chinese Mainland. J. Atmos. Sol. Terr. Phys. 2023, 246, 106072. [Google Scholar] [CrossRef]
- Shao, J. Linear Model Selection by Cross-Validation. J. Am. Stat. Assoc. 1993, 88, 486–494. [Google Scholar] [CrossRef]
- Allgaier, J.; Pryss, R. Cross-Validation Visualized: A Narrative Guide to Advanced Methods. Mach. Learn. Knowl. Extr. 2024, 6, 1378–1388. [Google Scholar] [CrossRef]
- Avanzato, R.; Beritelli, F. An Innovative Acoustic Rain Gauge Based on Convolutional Neural Networks. Information 2020, 11, 183. [Google Scholar] [CrossRef]
Disclaimer/Publisher’s Note: The statements, opinions and data contained in all publications are solely those of the individual author(s) and contributor(s) and not of MDPI and/or the editor(s). MDPI and/or the editor(s) disclaim responsibility for any injury to people or property resulting from any ideas, methods, instructions or products referred to in the content. |
© 2025 by the authors. Licensee MDPI, Basel, Switzerland. This article is an open access article distributed under the terms and conditions of the Creative Commons Attribution (CC BY) license (https://creativecommons.org/licenses/by/4.0/).

