Highlights
What are the main findings?
- EMIT spectral mixing spaces of built environments in China are consistent with previous studies using spectroscopic and multispectral imagery.
- The Substrate, Vegetation, Dark (SVD) topology of the mixing space reveals several anthropogenic substrates not resolvable with broadband sensors.
What are the implications of the main findings?
- Even at decameter scales, imaging spectroscopy has the potential to distinguish pervious and impervious substrates in built environments.
- Imaging spectroscopy therefore has potential for mapping built environments worldwide.
Abstract
Spectral mixing space characterization is especially important for studies of built environments because of the range of materials around which humans establish residence. With the launch of NASA’s EMIT imaging spectrometer in 2022, spectroscopic characterization of a variety of built environments using atmospherically corrected imagery collected by a common instrument became feasible. The recent availability of four cloud-free EMIT granules imaging Beijing, Chongqing, Guangzhou and Shanghai in early 2025 allows us to address a critical limitation of a 2023 study of built environments using EMIT. The 3D topology of an EMIT mixing space combining all four cities and their surrounding environments shows the familiar ternary structure with Substrate, Vegetation, Dark endmember apexes but extends it to a 3D tetrahedral structure with the addition of a non-photosynthetic vegetation (NPV) endmember. In contrast to multispectral characterizations, EMIT spectra distinguish a variety of anthropogenic substrates not resolvable with broadband sensors. However, semivariogram analysis of coincident 10 m Sentinel-2 and 1.2 m WorldView-3 imagery confirms extensive spectral mixing at the ~50 m scale of the EMIT IFOV. As a result, some of the spectral diversity resolvable with meter resolution spectroscopy is certainly attenuated by decameter resolution sensors.
1. Introduction
Spectral feature space characterization is fundamental to our understanding of the information content of imaging spectroscopy (hyperspectral imaging) data. The statistical and topological properties of spectral feature spaces reflect intrinsic properties (e.g., mixing relationships, absorption features) of the sets of pixel spectra that comprise each image cube. Characterization also fundamentally informs modeling by providing insight into the physical processes which do and do not contribute meaningful amounts of variance to the observed reflectance signal. Specifically, in the case of spectral mixture modeling [1,2,3], feature space characterization informs model design by quantifying spectral dimensionality and identifying spectral endmembers [4,5]. In the case of discrete classification, feature space characterization can inform model design by quantifying spectral separability of distinct classes [6].
Characterization is especially important for studies of the built environment because of the range of materials around which humans establish residence. Some of these materials are spectroscopically distinct, while others are not. Further, the complexity of spatial mixing and the well-documented fractal nature of the 3D structure which characterizes human settlements around the world [7,8] results in substantial complexity within the observed radiance field observed by any spaceborne sensor. For the special case of spectroscopic imaging, in some cases even materials which are spectrally distinct in field and laboratory reflectance spectroscopy studies may not be easily mappable in areas as complex as urban environments. Feature space characterization can help provide insight into this question.
Characterization of built environments using multispectral sensors revealed a mixing space dimensionality and topology similar to that of natural environments—specifically, a 2D triangular structure with Substrate, Vegetation, Dark (e.g., shadow, water, absorptive) endmembers [9,10,11]. The linearity of spectral mixing within this space gives rise to the standardized SVD spectral mixture model more generally [12]. In multispectral imagery, anthropogenic substrates like concrete are generally indistinguishable from natural substrates like some rock and soil [9,13], in part because concrete itself is a mixture of sand and gravel in a carbonate matrix, so it shares the same convex spectral continuum as many rock types. However, with the launch of NASA’s EMIT imaging spectrometer in 2022, spectroscopic characterization of a variety of built environments using atmospherically corrected imagery collected by the same spectrometer became feasible. This allowed for a comparative analysis of 23 cities that revealed a variety of anthropogenic substrates not distinguishable by broadband instruments [14].
Despite the diversity of built environments included in the analysis of [14], no Chinese cities could be included in the study because no sufficiently cloud-free EMIT images were yet available when the study was conducted in 2023. However, the recent availability of four cloud-free granules imaging Beijing, Chongqing, Guangzhou and Shanghai in early 2025 (Figure 1) allows us to address this critical limitation of the 2023 study. This is important, not only because of the ages of these four cities relative to most in the 2023 study but also because of the rapid expansion and development of each of them after 2000. The urban cores of these four cities range from 1045 BC (Beijing) to AD 1291 (Shanghai), while all four are currently experiencing rapid urban growth at their peripheries. As such, they offer a much greater range of ages and building styles than most of the cities in our previous study. Together, these four cities offer a variety of urban and peri-urban land cover types, as well as a range of settings contrasting river deltas (Shanghai and Guangzhou) with inland agricultural basins (Beijing and Chongqing) (Figure 2 and Figure 3).
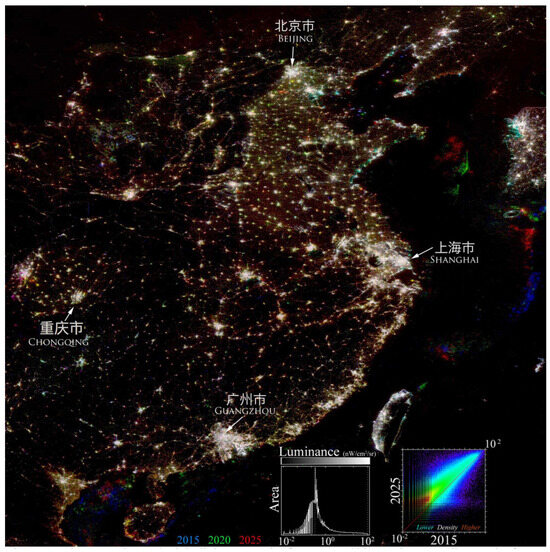
Figure 1.
Tri-temporal VIIRS night light composite for eastern China and surroundings. Color implies change. The four study areas span urban/rural gradients of conurbations in diverse climates and landscapes. Beijing and Chongqing are located at the mountainous peripheries of agricultural basins. Shanghai and Guangzhou are located on major river deltas. While urban growth and electrification contribute to decadal brightening, background luminance (<~10−0.5 nW/cm2/sr) is more sensitive to variability in cloud cover and atmospheric scattering. Most prominent changes are associated with offshore fishing fleets.
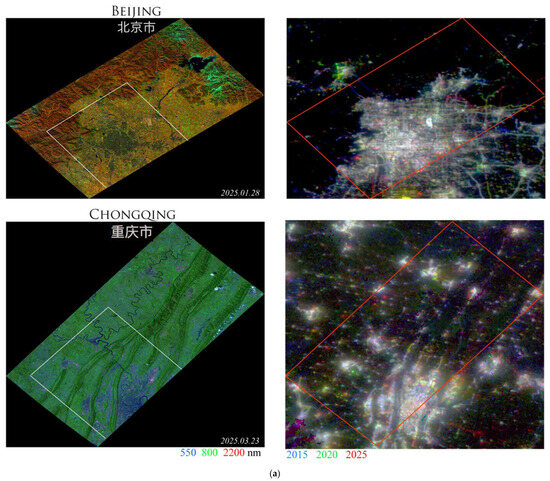
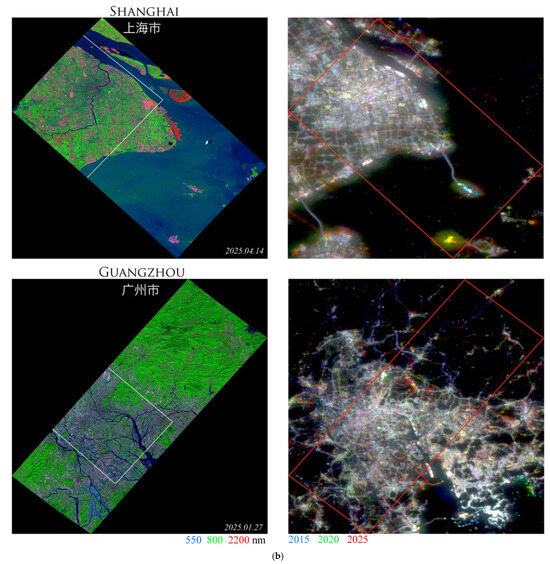
Figure 2.
(a) EMIT reflectance and VIIRS luminance for Beijing and Chongqing. Latitudinal scale of each is ~155 km. Color implies change in tri-temporal luminance composites. Warmer colors indicate brightening. White vectors show subsets used for quadcore mosaic. Vegetation cover contrast (brown vs. green) reflects different climates and acquisition dates. (b) EMIT reflectance and VIIRS luminance for Shanghai and Guangzhou. Latitudinal scale is ~160 km for Shanghai and 220 km for Guangzhou. Color implies change in tri-temporal luminance composites. Warmer colors indicate brightening. White vectors show subsets in quadcore mosaic. Note overglow extent on water around Shanghai.
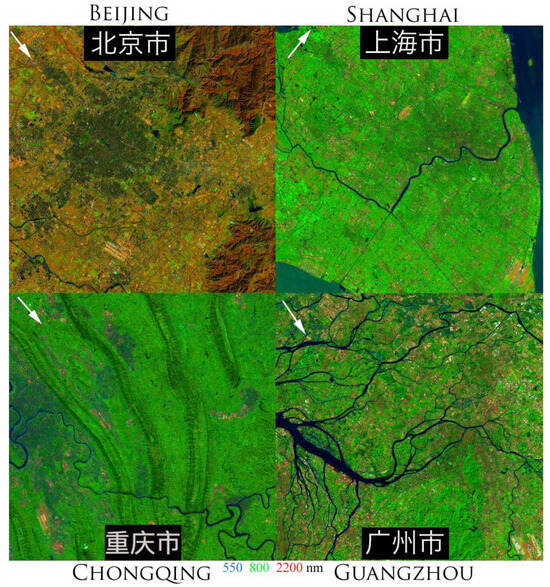
Figure 3.
Quadcore EMIT mosaic false color composite. Each city and surrounding landscape is oriented in unprojected orbital swath coordinates to avoid spatial resampling of individual pixel spectra. North shown by white arrows. Each quadrant ~ 50 × 50 km. Common [0, 0.5] linear stretch. Note diffuse density gradients from urban cores with pervasive building shadow to peri-urban and rural landscapes with multiple scales of vegetation and substrates. The fractal nature of the built area is less obvious at this scale.
The objectives of this analysis are based on a comparison of built environments on urban to peri-urban gradients in four large Chinese cities as well as with the mosaic of 30 EMIT subscenes from 24 cities worldwide characterized by [14]. Specifically, this study aims to (1) characterize the spectral dimensionality and topology of individual and aggregate spectral mixing spaces, (2) compare linear PC and nonlinear UMAP-based mixing space topology and spectral endmembers, (3) compare urban cores (based on night light luminance) to peri-urban land cover gradients within and among the four study areas and (4) establish the range of scales of spectral mixing in these heterogeneous built environments. The results of the comparative and aggregate characterizations will then be discussed in the context of the larger collection of 30 EMIT subscenes from 24 cities worldwide analyzed by [14].
2. Materials and Methods
2.1. Data
2.1.1. EMIT
This analysis used spectroscopic imagery from NASA’s Earth Surface Mineral Dust Source Investigation (EMIT) mission [15]. The EMIT instrument is a Dyson imaging spectrometer with an 11° cross-track field of view. EMIT has an optically fast (F/1.8) and wide-swath (1240 samples) optical system achieving roughly 7.4 nm spectral sampling across the 380–2500 nm spectral range [16]. EMIT achieves a high signal-to-noise ratio (SNR) > 2x its design requirement of ∼200 in most channels [17]. The ground sampling distance of EMIT pixel spectra is ∼40 × 60 m. EMIT was launched via SpaceX Dragon on 14 July 2022 and autonomously docked to the forward-facing port of the International Space Station (ISS). All EMIT data used in this study are available from https://search.earthdata.nasa.gov/ as the standard Level-2A ISOFIT-corrected surface reflectance product (EMITL2ARFL v001). Cloud and data quality masks were acquired and spot-checked, but not used in the analysis. Default bad bands lists (bands 128–142 and 188–213) provided with the data were applied.
2.1.2. Sentinel-2
Sentinel-2 MSI multispectral imagery was used to characterize the scale of spectral mixing occurring below the 50 m resolution of the EMIT sensor. Coregistered MSI spectral bands 2–12 were resampled to a common resolution of 10 m—excluding bands 9 and 10. Atmospherically corrected L2A Sentinel-2 data were downloaded free of charge from the Copernicus Data Space Browser (https://browser.dataspace.copernicus.eu). Sentinel-2 acquisition dates coincide with corresponding EMIT acquisition dates to within 2 days.
2.1.3. WorldView-3
WorldView-3 multispectral and panchromatic imagery was also used to further characterize the scale of spectral mixing below the 10 m scale of the Sentinel-2 VNIR IFOV. Uncalibrated DN imagery was obtained through the NASA Commercial Smallsat Data Analysis (CSDA) program. Because cloud-free WorldView-3 acquisitions are relatively scarce compared to Sentinel-2, the images were chosen for analysis on the basis of atmospheric clarity and near-nadir view geometry—necessarily without regard to acquisition date. Because this imagery is used only to quantify spatial scales of individual components of the urban mosaic, no cross calibration or atmospheric correction was attempted for the WorldView-3 data used.
2.2. Methods
2.2.1. Spectral Dimensionality and Mixing Space Topology
We use both linear and nonlinear dimensionality reduction to characterize the statistical dimensionality and topology of the spectral mixing space of the EMIT mosaic described above. The dimensions are spatial (pixel geographic location) and spectral (reflectance by wavelength). The singular value decomposition [18] is used to quantify the variance partition of the orthonormal dimensions (principal components; PCs) of the spectral+spatial matrix of reflectances [4] as given by the normalized singular values. This variance partition yields a separation of the low-order dimensions (i.e., PCs) representing the spatial distribution of the spectral eigenvectors that span the space of the spectral continuum and the higher-order dimensions representing noise and natural variability of the population of mixed reflectance spectra. The distinction between lower- and higher-order dimensions is given by the variance partition of the singular values. The topology of the low-dimensional space provides an indication of the linearity of spectral mixing within the space as well as facilitating identification of the spectral endmembers that span the space [5]. The endmembers are identified as the apexes of the low-dimensional PC distribution, while the linearity (or nonlinearity) of mixing can be inferred from the inward concavity (or convexity) of the orthogonal 2D projections of the low-order PCs. Because the PCs reflect the variance partition of the full population of spectra, this linear dimensionality reduction may emphasize spectral continuum amplitude at the expense of lower variance absorption features resolved by the spectrometer. For this reason, we supplement the linear variance-based characterization of the spectral feature space with a nonlinear proximity-based characterization.
Nonlinear characterization is based on Uniform Manifold Approximation and Projection (UMAP) [19] of the spectral mixing space. UMAP performs nonlinear dimensionality reduction by assuming the data (pixel spectra) are uniformly distributed on a locally connected Riemannian manifold with an (approximately) locally constant Riemannian metric. UMAP models this manifold using a fuzzy topological structure, then seeks a low-dimensional (usually 2D or 3D) embedding with an optimally similar fuzzy topological structure. The resulting embedding is generally nonlinear and noninvertible.
The UMAP results depend on the choice of several tunable hyperparameters. Among the most important are those described below:
- -
- n_components: The number of dimensions of the low-dimensional embedding space.
- -
- n_neighbors: The size of the local neighborhood used when learning the manifold structure of the data.
- -
- min_dist: The limit on how closely points may be spaced in the output space.
- -
- metric: The distance metric in the input space.
Based on previous analyses of EMIT mixing spaces [8,18], we used hyperparameter sweeps using the following values:
- -
- n_components = 2 or 3.
- -
- n_neighbors = 3, 5, 10 or 50.
For all runs, we further used min_dist = 0.1 and metric = Euclidean—also based on the relative insensitivity of the UMAP embedding topology found in earlier studies of much larger collections of EMIT imagery [8,18].
All UMAP computations were performed using the open source umap-learn Python package 0.5.2 on a commercially available laptop computer with 32 GB RAM, 2 GHz Quad-Core Intel Core i5 CPU and a 1536 MB Intel Iris Plus Graphics GPU. Runtime for a typical Sentinel-2 tile (10,000,000 11-band spectra) subset was approximately 2 h. For more information about UMAP, see [20].
2.2.2. Spatial Scale and Variability
Semivariograms are used to quantify spatial variability in reflectance of Sentinel-2 and WorldView-3 imagery below the ~50 m scale of the EMIT IFOV. Queen’s move connectivity was used to calculate the squared difference over all pairs of pixels in the image in all eight directions. For a given wavelength, the nugget, sill and range are determined by plotting the semivariance, γ(h), over distance between pixel pairs, h. For the commonly used spherical model of saturating semivariance, γ(h), with increased distance, h, the equation for a theoretical semivariogram is as follows:
The non-zero intercept or nugget of the variogram, c0, determines the degree of unresolved variability; for sensor comparison it can represent the degree to which the particular pixel size captures the underlying phenomenon. The range, a, of a semivariogram determines how quickly the underlying variability reaches a global maximum, essentially the distance to which the structure of a variable is spatially dependent [21]. Finally, the sill, c1, determines the total variance resolved in the image or region of interest and the range beyond which the spatial structure of the data is not affected by the distance between sample units.
3. Results
The PC-derived variance partition of the EMIT mosaic reveals a 3D spectral feature space, with orthogonal dimensions accounting for 75%, 20% and 4% of total variance and all remaining higher-order dimensions accounting for only 1%. Orthogonal projections of the three low-order PCs show the topology of this feature space (Figure 4). PCs 1 and 2 show the familiar triangular structure bounded by Substrate, Vegetation and absorptive/transmissive Dark spectral endmembers. The third dimension extents the 2D triangle to a 3D tetrahedon with the addition of an endmember for non-photosynthetic vegetation (NPV). Because each of the EMIT granules encompass the full gradient between the urban core and the diversity of land cover types in the surrounding landscapes, the topology of the mosaic feature space is similar to that observed in the much larger and spectrally diverse land cover collection used by [22].
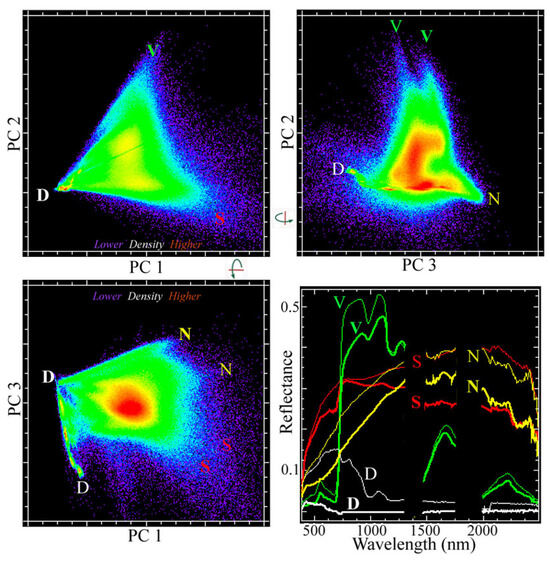
Figure 4.
Three-dimensional PC spectral mixing space for the EMIT quadcore mosaic. Low-order PCs render the familiar triangular SVD mixing space bounded by Substrate, Vegetation and absorptive/transmissive Dark features (S, V, D labels). Non-photosynthetic vegetation (N) and sediment-laden river water (D) extend a 2D triangular space to a 3D tetrahedron. Multiple similar but distinct spectral endmembers surround each apex of the mixing space.
In contrast to the single spectral continuum of the PC feature space, the UMAP-derived feature spaces reveal multiple distinct mixing continua for water, vegetation and substrate encompassing all four of the study areas. Figure 5 shows the evolution of the EMIT spectral feature space as the near neighbor parameter is increased from 3 to 50 neighbor networks. Both vegetation and substrate continua contain multiple high-amplitude spectral endmembers mixing with multiple dark endmembers. Water bodies with varying amounts of suspended sediment form multiple distinct clusters with more complex topologies, while more transmissive water bodies may reside near shadow endmembers in the substrate and vegetation continua. Mapping the 3D UMAP feature space coordinates into geographic space as an RGB composite reveals consistent colors for urban cores in all four cities, indicating similar spectral mixing continua for each. In comparison to the PC feature space, the UMAP space reveals more apexes, each corresponding to a distinct spectral endmember. Figure 6 shows four substrate and three vegetation endmembers, with multiple water and shadow endmembers residing at opposing ends of the continua.
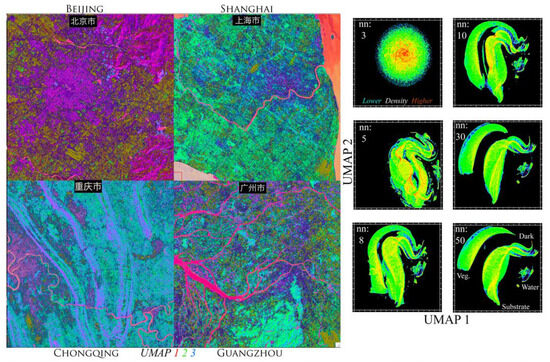
Figure 5.
Six 2D UMAP embeddings spanning a range of near_neighbor hyperparameter settings show the progression of mixing space topology from local (nn: 3) to global (nn: 50) scales. Mapping the 3D nn: 10 embedding onto an RGB color space backprojected into geographic space clearly distinguishes rivers, soils, agriculture and forests from varying density built environments. Note the spectral similarity of the Beijing urban core to the shadowed mountain slopes.
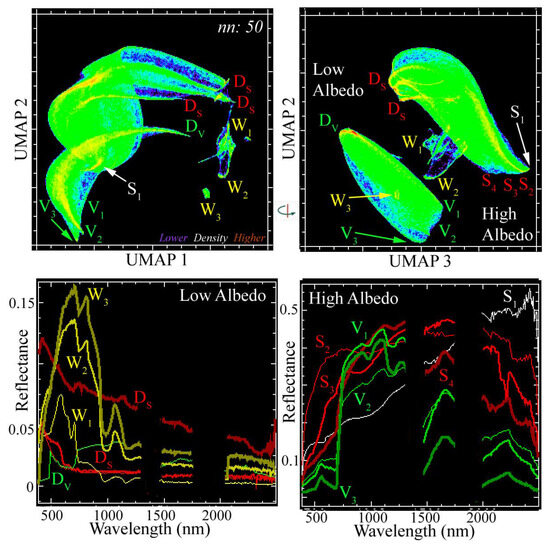
Figure 6.
Three-dimensional UMAP spectral mixing space for the EMIT quadcore mosaic. Orthogonal projections of the 3D embedding clearly distinguish mixing continua for vegetation and substrates spanning a range of albedo. Water bodies form separate clusters with more complex topologies. While all vegetation forms a single continuum with three distinct endmember reflectances and a common shadow endmember (DV), the substrate continuum has at least 3 distinct mixing continua spanning a wider range of reflectances.
UMAP subsets for each individual city can be compared by superposition on the silhouette of the full composite mixing space. Figure 7 shows distinct topologies for each city at low near neighbor scales with each city converging to distinct substrate and vegetation continua at near neighbor scales of 50. In this and successive figures, we present UMAP embeddings from nn: 50 because it represents convergence to a common topology relative to the nn: 10 embeddings. It is apparent that Shanghai and Guangzhou share very similar topologies for both the substrate and vegetation continua, while Beijing and Chongqing have very different topologies. Despite the differences in topologies, all four cities have distinct spectral endmembers corresponding to airport runway concrete but very similar spectral endmembers for a pervasive cyan roofing material found throughout each city (Figure 8a,b). While the distinct substrate endmembers among cities are not surprising given the diversity of synthetic materials expected to be present in each city, we expect that much spectral diversity is concealed by the pervasive spectral mixing we expect to occur within EMIT’s 50 m IFOV.
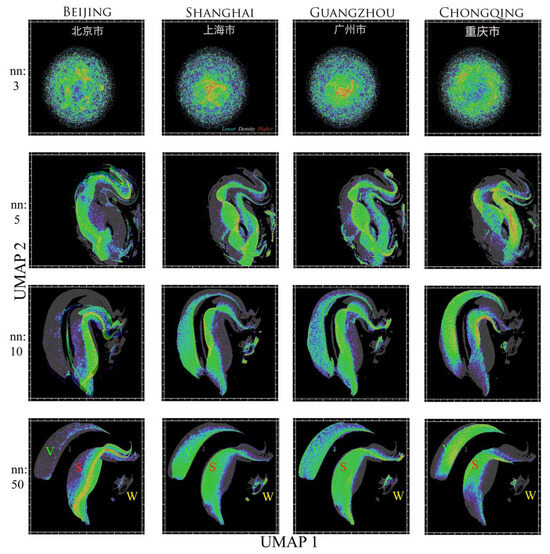
Figure 7.
UMAP hyperparameter sweep for the EMIT quadcore mosaic segmented geographically for comparison of the four cities and their respective surrounding landscapes. Each density shaded subset of the embedding is superimposed on the silhouette (gray) of the 2D embedding of the full mosaic. These renderings of the spectral mixing space clearly show distinct, but overlapping, mixing continua for each city and its surrounding landscapes. The coalescence of distinct mixing continua between near_neighbor scales of 3 and 5 provides an indication, albeit qualitative, of the pervasive spectral mixing of water bodies, forests, agricultural landscapes and the built environments interspersed among them. Note the similarity of Shanghai and Guangzhou built/substrate continua (S) compared to very different topologies of the Beijing and Chongqing continua. In contrast, note the differences among the vegetation (V) continua and water (W) clusters for all four. Color density shading identical to previous figure.
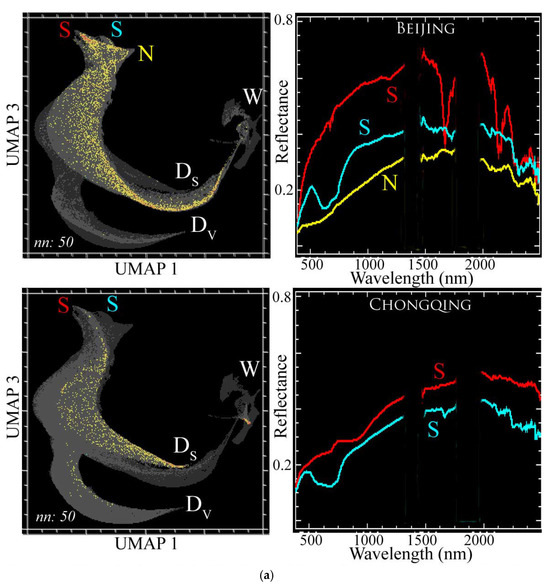
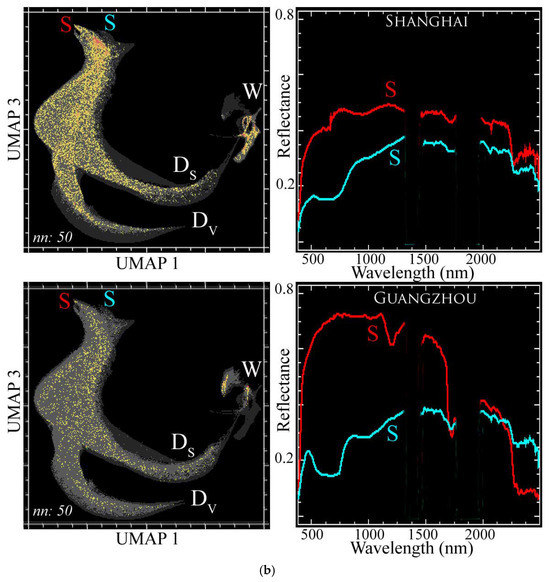
Figure 8.
(a) Two-dimensional projections of 3D UMAP embeddings with high albedo Substrate endmembers for Beijing and Chongqing. Both projections (lighter) superimposed on the silhouette of the full quadcore mosaic (darker) for reference. The highest night light luminance pixels are superimposed in yellow. The brightest areas span the full range of the Substrate continuum in both cities but are most densely concentrated at the Substrate apex in Beijing. Airport runway cement endmember spectra (red) vary more than cyan roofing material (cyan) endmembers. The NPV endmember (N) is abundant only in the Beijing quadrant. (b) Two-dimensional projections of 3D UMAP embeddings with high albedo Substrate endmembers for Guangzhou and Shanghai. Both projections (lighter) superimposed on the silhouette of the full quadcore mosaic (darker) for reference. The highest night light luminance pixels are superimposed in yellow. Shanghai’s overglow brightness extends over the full range of all three mixing continua but is densest near the substrates apex. Airport runway cement endmember spectra (red) vary more than cyan roofing material (cyan) endmembers. Labels on UMAP embeddings correspond to locations of labeled spectra.
Comparison of urban cores using 10 m resolution Sentinel-2 imagery illustrates nature and extent of spectral mixing in these built environments. Figure 9 shows the spectral mixing space for each urban core as a continuum of Substrate, Vegetation, Dark fractions when unmixed with standardized SVD endmembers for Sentinel-2 (Small and Sousa 2022). Even at scales of 10 to 20 m, the spectral mixing is pervasive throughout each urban core. Semivariograms of each SVD fraction map for each urban core show shadow-dominant Dark fractions, with sills between 100 and 300 m indicating spectral mixing well beyond the 50 m scale of the EMIT IFOV (Figure 9a,b), and Substrate and Vegetation fraction semivariograms showing much larger spatial scales. This is to be expected, due to the fact that shadow is common to all forms of land cover, whereas spatial scaling of substrate and vegetation-dominant land cover generally varies over spatial scales larger than individual features in urban mosaics.
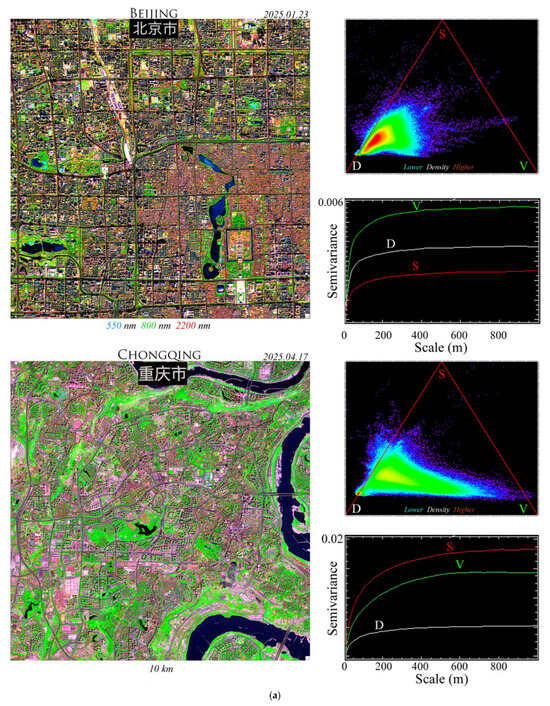
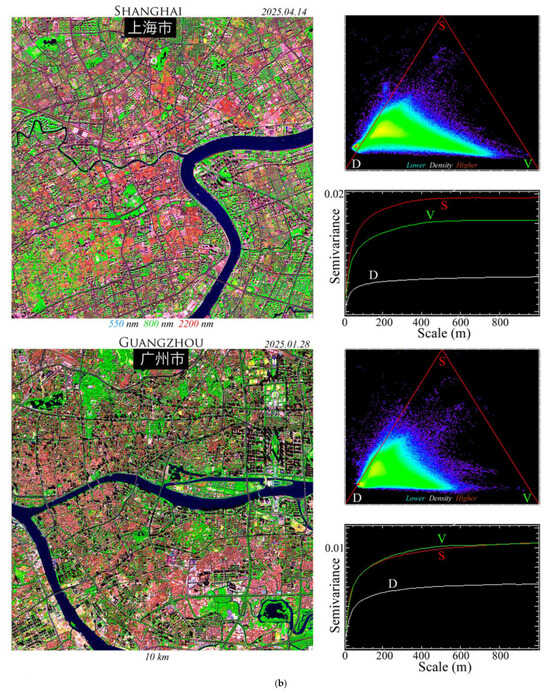
Figure 9.
(a) Full-resolution (10 m) Sentinel-2 composites, SVD fraction ternary distributions and semivariograms illustrate the characteristic scales and spectral mixing of urban core land covers for Beijing and Chongqing. Small high-density Dark fraction distribution peaks correspond to water bodies. Shadow-dominant Dark fractions (D) attain spatial semivariance sills between 100 and 300 m, quantifying pervasive spectral mixing at the 40 to 60 m resolution of the EMIT IFOV. S and V fraction sills occur at significantly larger scales. Negative fractions lie outside ternary. (b) Full-resolution (10 m) Sentinel-2 composites, SVD fraction ternary distributions and semivariograms illustrate the characteristic scales and spectral mixing of urban core land covers for Shanghai and Guangzhou. Small high-density Dark fraction distribution peaks correspond to water bodies. Shadow-dominant Dark fractions attain spatial semivariance sills between 100 and 300 m, quantifying pervasive spectral mixing at the 40 to 60 m resolution of the EMIT IFOV. S and V fraction sills occur at significantly larger scales. Negative fractions lie outside ternary. The fractal nature of the built area is more apparent at this scale than in the EMIT composites.
Semivariograms of WorldView-3 multispectral and panchromatic imagery show sills between 15 and 30 for each urban core (Figure 10a,b). This 15–30 m scaling is consistent with the early qualitative observations of [23], and quantitative scaling estimates using Ikonos panchromatic imagery for a greater diversity of built environments worldwide [11].
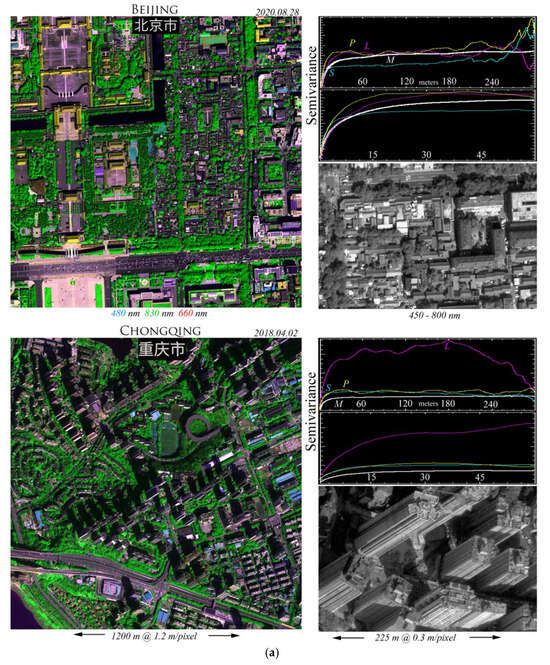
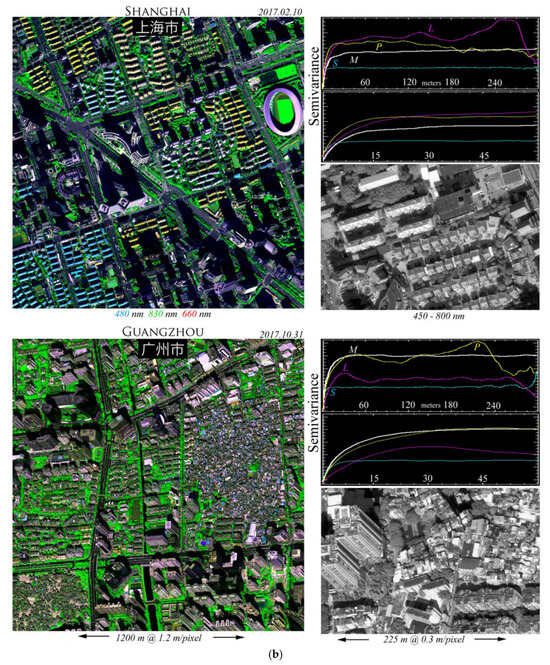
Figure 10.
(a) WorldView-3 illustrations of meter and sub-meter variations in characteristic spatial scales of urban land cover components, as quantified by semivariograms. Dual range plots show widely varying sill scales for small (S), large (L), and periodic (P) pan with mixed (M) ms example subsets. For sub-meter panchromatic imagery, semivariance sills are often impacted by individual facets as well as full building scales. ©2018 and 2020, Maxar, USG Plus. (b) WorldView-3 illustrations of meter and sub-meter variations in characteristic spatial scales of urban land cover components as quantified by semivariograms. Dual range plots show widely varying sill scales for small (S), large (L) and periodic (P) pan with mixed (M) ms example subsets. For sub-meter panchromatic imagery, semivariance sills may reflect scales of individual facets as well as full building scales. ©2017, Maxar, USG Plus.
The UMAP spectral feature space of the WorldView-3 multispectral imagery shows a similar SVD topology to that found for the EMIT mosaic. Figure 11 shows the convergence of the EMIT feature space for near neighbor scales of 10 to 50 neighbors. However, in contrast to the multi-city substrate and vegetation continua of the EMIT space, each WorldView-3 image forms a distinct SVD continuum with distinct limbs for the S and V mixing continua. We attribute this to the fact that no attempt was made to apply cross calibration or atmospheric correction to the WorldView-3 images, in contrast to both the EMIT and Sentinel-2 mosaics—for which each acquisition was calibrated and atmospherically corrected using identical procedures for each. Figure 12 superimposes 3D PC and 2D UMAP feature spaces for each sensor mosaic, highlighting the pervasive SVD structure of each.

Figure 11.
WorldView-3 VNIR quadcore mosaic with 2D UMAP embeddings for increasing nn scales. All four cities form separate spectral mixing continua extending from Dark to Substrate and Vegetation endmembers. Water bodies form separate clusters related to their suspended sediment content. At the largest nn scale (50), Shanghai (S) and Guangzhou (G) are adjacent and share a common substrate EM (S), while Beijing (B) and Chongqing (C) are adjacent but overlap. The segregation of the four mixing space continua at nn: 50 is interpreted as a result of the lack of cross calibration and atmospheric correction of the WorldView-3 acquisitions. Arrows show locations from Figure 2. © 2017, 2018 and 2020, Maxar, USG Plus.
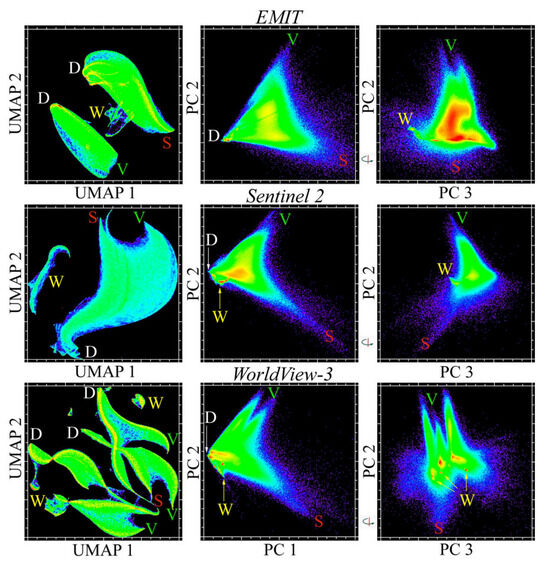
Figure 12.
Complementary quadcore built environment spectral mixing spaces for hyperspectral and multispectral sensors spanning 1 to 2+ orders of magnitude spectral and spatial resolution. The ternary SVD mixing continuum is pervasive, despite multiple distinct water body reflectances forming additional clusters and spurs from the D EM. The segregated WorldView-3 mixing space results from different calibrations and atmospheric effects which are corrected in the EMIT and Sentinel-2 products. S, V, D, W labels correspond to usage in previous figures.
4. Discussion
The spectroscopic characterizations of a variety of built environments in the four study areas share a common spectral mixing space that is consistent with the SVD mixing spaces found in both anthropogenic and natural landscapes worldwide. This is not surprising, given the variety of land covers within and surrounding the study areas. In contrast to earlier studies characterizing broadband multispectral mixing spaces, this spectroscopic characterization reveals several substrate endmembers not found by earlier studies—specifically, multiple types and conditions of concrete and a range of roofing materials, as well as constellations of distinct spectra near the substrate apex of the PC spaces. However, the relative simplicity of even the UMAP mixing space, and limited numbers of endmembers found in this study contrast strongly with the variety of synthetic endmembers found in spectroscopic characterizations based on meter resolution AVIRIS collected over Kolkata, London and Los Angeles [14].
The contiguity of the UMAP mixing spaces shown in Figure 6 and Figure 7, like that of the composite EMIT mixing space characterized by [14], suggests pervasive spectral mixing within EMIT’s 50 m IFOV. This is verified by the 10 to 20 m scale lengths of shadow fractions in near-coincident Sentinel-2 acquisitions of the four study areas. While the larger scale lengths of substrate and vegetation reflect hectometer variations in vegetation abundance and building density, the shadow fractions capture the effect of street canyons and block sizes that control spectral mixing among individual land cover elements within built environments. The scaling results in this study are consistent with the much more extensive scaling analysis performed by [11] using 0.7 m resolution Quickbird panchromatic imagery from 14 cities worldwide. It is also consistent with the 10 to 20 m scaling lengths shown by the semivariogram sills for the 1.2 m WorldView-3 imagery shown in Figure 10a,b.
The EMIT acquisitions of each of the four study areas image gradients from the historic city centers to peri-urban environments. As such, they contain not only the dense aggregations of small buildings in the oldest parts of each city but also the larger-scale mosaics of modern high-rise construction and urban vegetation that are characteristic of recent urban expansion in China. Despite the diversity of peri-urban land covers, the high luminance urban cores of all four study areas form a single SVD-bounded mixing space in the UMAP embedding of the Sentinel-2 mosaic, as shown in Figure 12. This stands in contrast to the distinct vegetation and substrate continua found for the EMIT mosaic, also shown in Figure 12. We assume that the difference is the result of the peri-urban land covers included in the EMIT mosaic but not in the Sentinel-2 mosaic. The finer-scale urban vegetation and NPV in the urban cores are present along the peripheries of the substrate continuum of the EMIT mosaic, whereas the vegetation continuum corresponds mainly to peri-urban agriculture and forest. This suggests a fundamental difference in the effectively binary mixing of the vegetation continua and the ternary mixing of the substrate-dominant continua of the urban cores. More accurate mapping of urban vegetation may also have implications for monitoring and managing specific urban planning and environmental health challenges like the urban heat island effect and loss of green space. Also noteworthy in the UMAP mixing spaces of the individual study areas is the similarity of the Shanghai and Guangzhou spaces in contrast to the differences in the Chongqing and Beijing spaces. To some extent, the latter is a result of the winter acquisition of the Beijing granule, but this does not explain why the Chongqing space is so different from the Shanghai and Guangzhou spaces—despite the fact that all share the distinction between vegetation and substrate-dominant continua.
While the results of this study extend the findings of our previous study of 30 urban EMIT granules as described above, they are also subject to some limitations. The examples of substrate endmember spectra provide illustrations of the greater diversity of spectroscopic data, but an exhaustive quantification of the true spectral diversity would require higher spatial resolution spectroscopic imagery from a larger sample of built environments, as would a more rigorous analysis of the scale-dependent attenuation of small areas of unusual spectra, like those identified in 1.5 m AVIRIS of Los Angeles by [8]. Further, the distinct, non-overlapping mixing continua in the WorldView-3 data are likely an artifact of the lack of differences in preprocessing, rather than being solely indicative of fundamental spectral differences between the cities.
5. Conclusions
Taken together, the results of this study are encouraging for the use of EMIT data for mapping of the global built environment. Spectroscopic characterization reveals remarkable consistencies (e.g., cyan roofing materials) and notable variability (e.g., in weathering status of airport runways) among urban cores. In addition, the unexpected similarity of the Shanghai and Guangzhou mixing space topologies suggests surprising commonality in the material composition of some built environments—despite their individual heterogeneity. More complex manifold topology and greater EM differentiation is observed in spectroscopic imagery than in comparable multispectral imagery. These results are especially encouraging given the significant subpixel spatial mixing and EM variability that are evident from semivariance analysis. The implications of these results for urban mapping and monitoring suggest that even in the presence of meter to decameter scale subpixel spectral mixing, decameter resolution hyperspectral sensors like NASA’s SBG and DLR’s EnMAP have the potential to distinguish distinct pervious and impervious substrates within urban mosaics worldwide.
Author Contributions
C.S.: Conceptualization, Formal analysis, Funding acquisition, Investigation, Methodology, Writing—original draft, Writing—review and editing. D.S.: Formal analysis, Funding acquisition, Investigation, Methodology, Writing—original draft, Writing—review and editing. All authors have read and agreed to the published version of the manuscript.
Funding
This research was funded by the NASA EMIT Science and Applications Team Program (Grant # 80NSSC24K0861), Sousa and Small (co-PIs).
Data Availability Statement
The original contributions presented in this study are included in the article. Further inquiries can be directed to the corresponding author.
Acknowledgments
The authors are grateful to the EMIT science and instrument teams for their efforts to provide the high-quality spectroscopic imagery used in this study. This work utilized data made available through the NASA Commercial Satellite Data Acquisition (CSDA) Program.
Conflicts of Interest
The authors declare no conflicts of interest.
References
- Adams, J.B.; Gillespie, A.R. Remote Sensing of Landscapes with Spectral Images: A Physical Modeling Approach; Cambridge University Press: Cambridge, UK, 2006. [Google Scholar]
- Adams, J.B.; Sabol, D.E.; Kapos, V.; Almeida Filho, R.; Roberts, D.A.; Smith, M.O.; Gillespie, A.R. Classification of Multispectral Images Based on Fractions of Endmembers: Application to Land-Cover Change in the Brazilian Amazon. Remote Sens. Environ. 1995, 52, 137–154. [Google Scholar] [CrossRef]
- Smith, M.O.; Ustin, S.L.; Adams, J.B.; Gillespie, A.R. Vegetation in Deserts: I. A Regional Measure of Abundance from Multispectral Images. Remote Sens. Environ. 1990, 31, 1–26. [Google Scholar] [CrossRef]
- Boardman, J.W. Inversion of Imaging Spectrometry Data Using Singular Value Decomposition. In Proceedings of the 12th Canadian Symposium on Remote Sensing Geoscience and Remote Sensing Symposium, Vancouver, BC, Canada, 10–14 July 1989; IEEE: New York, NY, USA, 1989; Volume 4, pp. 2069–2072. [Google Scholar]
- Boardman, J.W. Geometric Mixture Analysis of Imaging Spectrometry Data. In Proceedings of the IGARSS ‘94-1994 IEEE International Geoscience and Remote Sensing Symposium, Pasadena, CA, USA, 8–12 August 1994; IEEE: New York, NY, USA, 1994; Volume 4, pp. 2369–2371. [Google Scholar]
- Sousa, D.; Small, C. Joint Characterization of Multiscale Information in High Dimensional Data. Adv. Artif. Intell. Mach. Learn. 2021, 1, 196–212. [Google Scholar] [CrossRef]
- Batty, M.; Longley, P.A. Fractal Cities: A Geometry of Form and Function; Academic Press: Cambridge, MA, USA, 1994; ISBN 0-12-455570-5. [Google Scholar]
- Batty, M.; Longley, P.A. Urban Shapes as Fractals. Area 1987, 19, 215–221. [Google Scholar]
- Small, C. Spectral Properties of Pervious and Impervious Surfaces. In Proceedings of the Integrating Remote Sensing at the Global, Regional and Local Scale. Pecora 15/Land Satellite Information IV Conference, Denver, CO, USA, 10–15 November 2002. [Google Scholar]
- Small, C. A Global Analysis of Urban Reflectance. Int. J. Remote Sens. 2005, 26, 661–681. [Google Scholar] [CrossRef]
- Small, C. High Spatial Resolution Spectral Mixture Analysis of Urban Reflectance. Remote Sens. Environ. 2003, 88, 170–186. [Google Scholar] [CrossRef]
- Small, C.; Milesi, C. Multi-Scale Standardized Spectral Mixture Models. Remote Sens. Environ. 2013, 136, 442–454. [Google Scholar] [CrossRef]
- Small, C. The Color of Cities: An Overview of Urban Spectral Diversity. In Global Mapping of Human Settlement: Experiences, Data Sets & Prospects; CRC Press: Boca Raton, FL, USA, 2009; ISBN 978-1-4200-8339-2. [Google Scholar]
- Small, C.; Sousa, D. Multiscale Topology of the Spectroscopic Mixing Space: Impervious Substrates. arXiv 2023, arXiv:2307.04716. [Google Scholar] [CrossRef]
- Green, R.O.; Thompson, D.R.; EMIT Team. NASA’s Earth Surface Mineral Dust Source Investigation: An Earth Venture Imaging Spectrometer Science Mission. In Proceedings of the 2021 IEEE International Geoscience and Remote Sensing Symposium IGARSS, Brussels, Belgium, 11–16 July 2021; pp. 119–122. [Google Scholar]
- Bradley, C.L.; Thingvold, E.; Moore, L.B.; Haag, J.M.; Raouf, N.A.; Mouroulis, P.; Green, R.O. Optical Design of the Earth Surface Mineral Dust Source Investigation (EMIT) Imaging Spectrometer. Proc. SPIE 2020, 11504, 1150402. [Google Scholar]
- Thompson, D.R.; Green, R.O.; Bradley, C.; Brodrick, P.G.; Mahowald, N.; Dor, E.B.; Bennett, M.; Bernas, M.; Carmon, N.; Chadwick, K.D. On-Orbit Calibration and Performance of the EMIT Imaging Spectrometer. Remote Sens. Environ. 2024, 303, 113986. [Google Scholar] [CrossRef]
- Eckart, C.; Young, G. The Approximation of One Matrix by Another of Lower Rank. Psychometrika 1936, 1, 211–218. [Google Scholar] [CrossRef]
- McInnes, L.; Healy, J.; Melville, J. UMAP: Uniform Manifold Approximation and Projection for Dimension Reduction. arXiv 2020, arXiv:1802.03426. [Google Scholar] [CrossRef]
- McInnes, L. UMAP: Uniform Manifold Approximation and Projection for Dimension Reduction—Umap 0.5 Documentation. Available online: https://umap-learn.readthedocs.io/en/latest/ (accessed on 13 October 2022).
- Dale, M.R.; Fortin, M.-J. Spatial Analysis: A Guide for Ecologists; Cambridge University Press: Cambridge, UK, 2014; ISBN 0-521-14350-0. [Google Scholar]
- Small, C.; Sousa, D. The Standardized Spectroscopic Mixture Model. Remote Sens. 2024, 16, 3768. [Google Scholar] [CrossRef]
- Welch, R. Spatial Resolution Requirements for Urban Studies. Int. J. Remote Sens. 1982, 3, 139–146. [Google Scholar] [CrossRef]


Disclaimer/Publisher’s Note: The statements, opinions and data contained in all publications are solely those of the individual author(s) and contributor(s) and not of MDPI and/or the editor(s). MDPI and/or the editor(s) disclaim responsibility for any injury to people or property resulting from any ideas, methods, instructions or products referred to in the content. |
© 2025 by the authors. Licensee MDPI, Basel, Switzerland. This article is an open access article distributed under the terms and conditions of the Creative Commons Attribution (CC BY) license (https://creativecommons.org/licenses/by/4.0/).