Article

Seagrass Mapping in Cyprus Using Earth Observation Advances

by
Despoina Makri
1,2,*,
Spyridon Christofilakos
3,
Dimitris Poursanidis
4,
Dimosthenis Traganos
3,
Christodoulos Mettas
1,2,
Neophytos Stylianou
1 and
Diofantos Hadjimitsis
1,2
1
ERATOSTHENES Centre of Excellence, Franklin Roosevelt 82, Limassol 3012, Cyprus
2
Department of Civil Engineering and Geomatics, Remote Sensing and Geo-Environment Lab, Cyprus University of Technology, Arch. Kyprianos 30, Limassol 3036, Cyprus
3
Imaging Spectroscopy Department, German Aerospace Center (DLR), Remote Sensing Technology Institute (IMF), 2 Rutherfordstraße, 12489 Berlin, Germany
4
Institute of Applied and Computational Mathematics, Foundation for Research and Technology Hellas, N. Plastira 100, Vassilika Vouton, 70013 Heraklion, Greece
*
Author to whom correspondence should be addressed.
Remote Sens. 2025, 17(21), 3610; https://doi.org/10.3390/rs17213610 (registering DOI)
Submission received: 1 August 2025 / Revised: 14 October 2025 / Accepted: 20 October 2025 / Published: 31 October 2025
(This article belongs to the Section Environmental Remote Sensing)

Highlights

What are the main findings?
  • Scalable workflow was developed for local-scale seagrass mapping in Cyprus using Sentinel-2 imagery, cloud computing and machine learning.
  • The workflow maps key Natura 2000 habitats—soft bottoms, hard bottoms, and Posidonia beds—along the Cypriot coastline.
  • The method estimated 10-17 km2 of seagrass with approximately 19,000 Mg C stored in Posidonia oceanica meadows.
What is the implication of the main finding?
  • The approach addresses a knowledge gap in the Eastern Mediterranean, providing a replicable, consistent methodology for local- and country-scale mapping.
  • The integration of open-access satellite data and cloud computing supports sustainable blue-carbon management and conservation planning.

Abstract

Seagrass meadows are vital for biodiversity and provide a plethora of ecosystem services, but significant losses due to human activity and climate change have been observed in recent decades. This study aims to evaluate whether the integration of Sentinel-2 composites, cloud computing (Google Earth Engine, GEE), and machine learning (ML) classifiers can produce accurate, scalable maps of seagrass habitats, enabling reliable estimates of associated carbon stocks. In this case study, we developed a methodological workflow for local-scale seagrass mapping in Cyprus, covering a total area of 310 km2. ML techniques, specifically the Random Forest (RF) classifier and Classification And Regression Tree (CART), were employed in the main processing stage. The RF classifier achieved an overall accuracy of 73.5%, with a seagrass-specific F1-score of 69.4%. Class-specific F1-scores ranged from 63.2% for hard bottoms to 98.2% for deep water, accounting for variability in habitat separability. The workflow is designed to be scalable across Cyprus and potentially the broader EMMENA region (Eastern Mediterranean, Middle East, and North Africa). Based on the mapped extent of Posidonia oceanica meadows, preliminary estimates suggest a carbon stock of approximately 19,000 Mg C in Cyprus.

1. Introduction

Seagrass meadows are among the most productive ecosystems on Earth, providing essential ecosystem services [1,2] such as coastal erosion protection [3], carbon sequestration [4], oxygen generation and production [5], and habitat for juvenile marine organisms [6]. In the Eastern Mediterranean, meadows are dominated by Posidonia oceanica, with small contributions from Cymodocea nodosa [7] and the invasive species of Halophila stipulacea [8,9]. Despite their ecological importance, these habitats face significant threats from climate change, including rising sea surface temperatures, and anthropogenic pressures such as wastewater disposal and coastal development [10,11]. P. oceanica meadows are protected under international conventions [12,13], yet declines up to 50% have been recorded in the Mediterranean, highlighting the urgent need for conservation and monitoring [14,15,16].
Remote sensing has emerged as a valuable tool for seagrass mapping, enabling large-scale monitoring of coastal habitats [17,18]. Over the past decade, Landsat, ASTER, UAV (Unmanned Aerial Vehicles) and Sentinel-2 data have been used to map seagrass across various spatial scales, from local to regional, [17,18,19,20,21]. In Cyprus, prior efforts have been fragmented and limited in spatial coverage, leaving gaps in high-resolution, island-wide seagrass mapping and blue carbon assessment [22,23]. More specifically, Sentinel-2 data processed with the Sentinel Application Platform (SNAP) [24] enabled seagrass classification in Paphos and Polis Chrysochous into three habitat types: seagrass, soft bottom, and deep water areas [21]. Further, a study in Vasiliko Bay assessed the conservation status of P. oceanica meadows using a combination of in situ measurements, side-scan sonar (C-MAX system), scuba diving, and ArcGIS (v.10.2.2) tools [22].
Beyond habitat mapping, research has also focused on the role of P. oceanica in carbon sequestration [25]. At the pan-Mediterranean level, Pergent-Martini et al. [23] examined the efficiency of angiosperm P. oceanica in sequestering and storing carbon dioxide, estimating an annual sequestration rate across 204.25 km2 along 100 km of coastline. A key observation of that study was the sparsity of data for Cyprus. In this survey, 30% of Cyprus’ total coastline was mapped, and the carbon sequestration estimates were derived from this portion, as reported by Telesca et al. [16]. Recent advances in cloud computing, especially Google Earth Engine (GEE), coupled with machine learning techniques, offer new opportunities for efficient, scalable, and large-scale mapping [26]. GEE is a cloud-based geospatial analysis platform and the key contributor to big data analysis [27]. GEE can develop and execute algorithms for a wide range of applications [28]. These procedures have reduced the execution time, even for global-scale analyses. Additionally, the algorithms can be custom-made for the users’ specific needs [29]. By integrating long-term, cloud-filtered Sentinel-2 composites with field validation, GEE facilitates large-scale habitat mapping and the estimation of ecosystem carbon stocks, which were challenging due to data volume and processing limitations.
Despite these technological advances, a systematic mapping of seagrass habitats across Cyprus is still lacking, and the associated blue carbon stocks remain poorly quantified. Therefore, the main hypothesis of this study is that the integration of Sentinel-2 composites, cloud computing (GEE), and machine learning classifiers can produce accurate, scalable, and transferable maps of seagrass habitats in Cyprus, providing reliable estimates of associated carbon stocks. The aim of this study is to develop and validate a standardized workflow for local-scale seagrass mapping, covering key Natura 2000 habitats: 1110 (Natura 2000 code)—soft bottoms; 1170 (Natura 2000 code)—hard bottoms; and 1120* (Natura 2000 code) Posidonia beds along the Cypriot coastline. The workflow is designed to be scalable for future applications across the Eastern Mediterranean, supporting conservation, management, and policy decisions.

2. Materials and Methods

The analysis utilizes Copernicus Sentinel-2 satellite data Level-2A (L2A). By integrating machine learning techniques, the Sentinel-2 data is leveraged to enhance the accuracy and efficiency of seagrass mapping [30]. The high-resolution bands of Sentinel-2 serve as valuable inputs for training ML models, enabling robust feature extraction and classification [31]. This combination of high-quality satellite imagery and machine learning [32] provides a powerful framework for analyzing and mapping coastal habitats in the Cyprus region.

2.1. Study Site

Cyprus is the third largest island in area and population, located in the easternmost Levantine basin, and lies north of Egypt, east of Greece, south of Turkey, and west of Lebanon and Syria. It is in a critical geopolitical area for the EMMENA (Eastern Mediterranean, Middle East, and North Africa) region [33]. The surrounding waters belong to one of the most oligotrophic marine regions globally, with extremely low nutrient concentrations (Chlorophyl-a, Chl-a concentrations) [34] and very limited primary production [35,36]. The sea surface temperature varies seasonally between 16 °C in the winter to 28 °C in the summer, and salinity averages 39.1 psu [37], indicating high seawater salinity [38]. Light availability is generally high due to low cloud cover, particularly in summer. The average sunshine ranges from 60% during winter and 90% during summer. Freshwater inputs are limited, and prolonged droughts, combined with 108 dams, restrict riverine nutrient fluxes [38,39]. Offshore filaments of relatively cooler waters are observed in the area of Cape Akrotiri during the summer months. This phenomenon arises from upwelling and advective transport influenced by the Rhodes Gyre, driven by strong and persistent northwesterly winds that transport water away from the coast during this season [38,40]. The climate is characterized by wet winters (short season) and dry summers (extended summers—long season) [33]. Finally, the coast consists of narrow and flat strips of land [41]. Compared to other regions of the Mediterranean, the eastern basin is poorly studied [34] in terms of seagrass distribution with novel technologies. In this case study, we will test the analytical workflow in the wider coastal area of Episkopi and Akrotiri Bay in Limassol. Water depth in the study area ranges from shallow nearshore zones (<5 m) to moderately deep areas (30 m), with deeper zones posing challenges for remote sensing detection of seagrass.
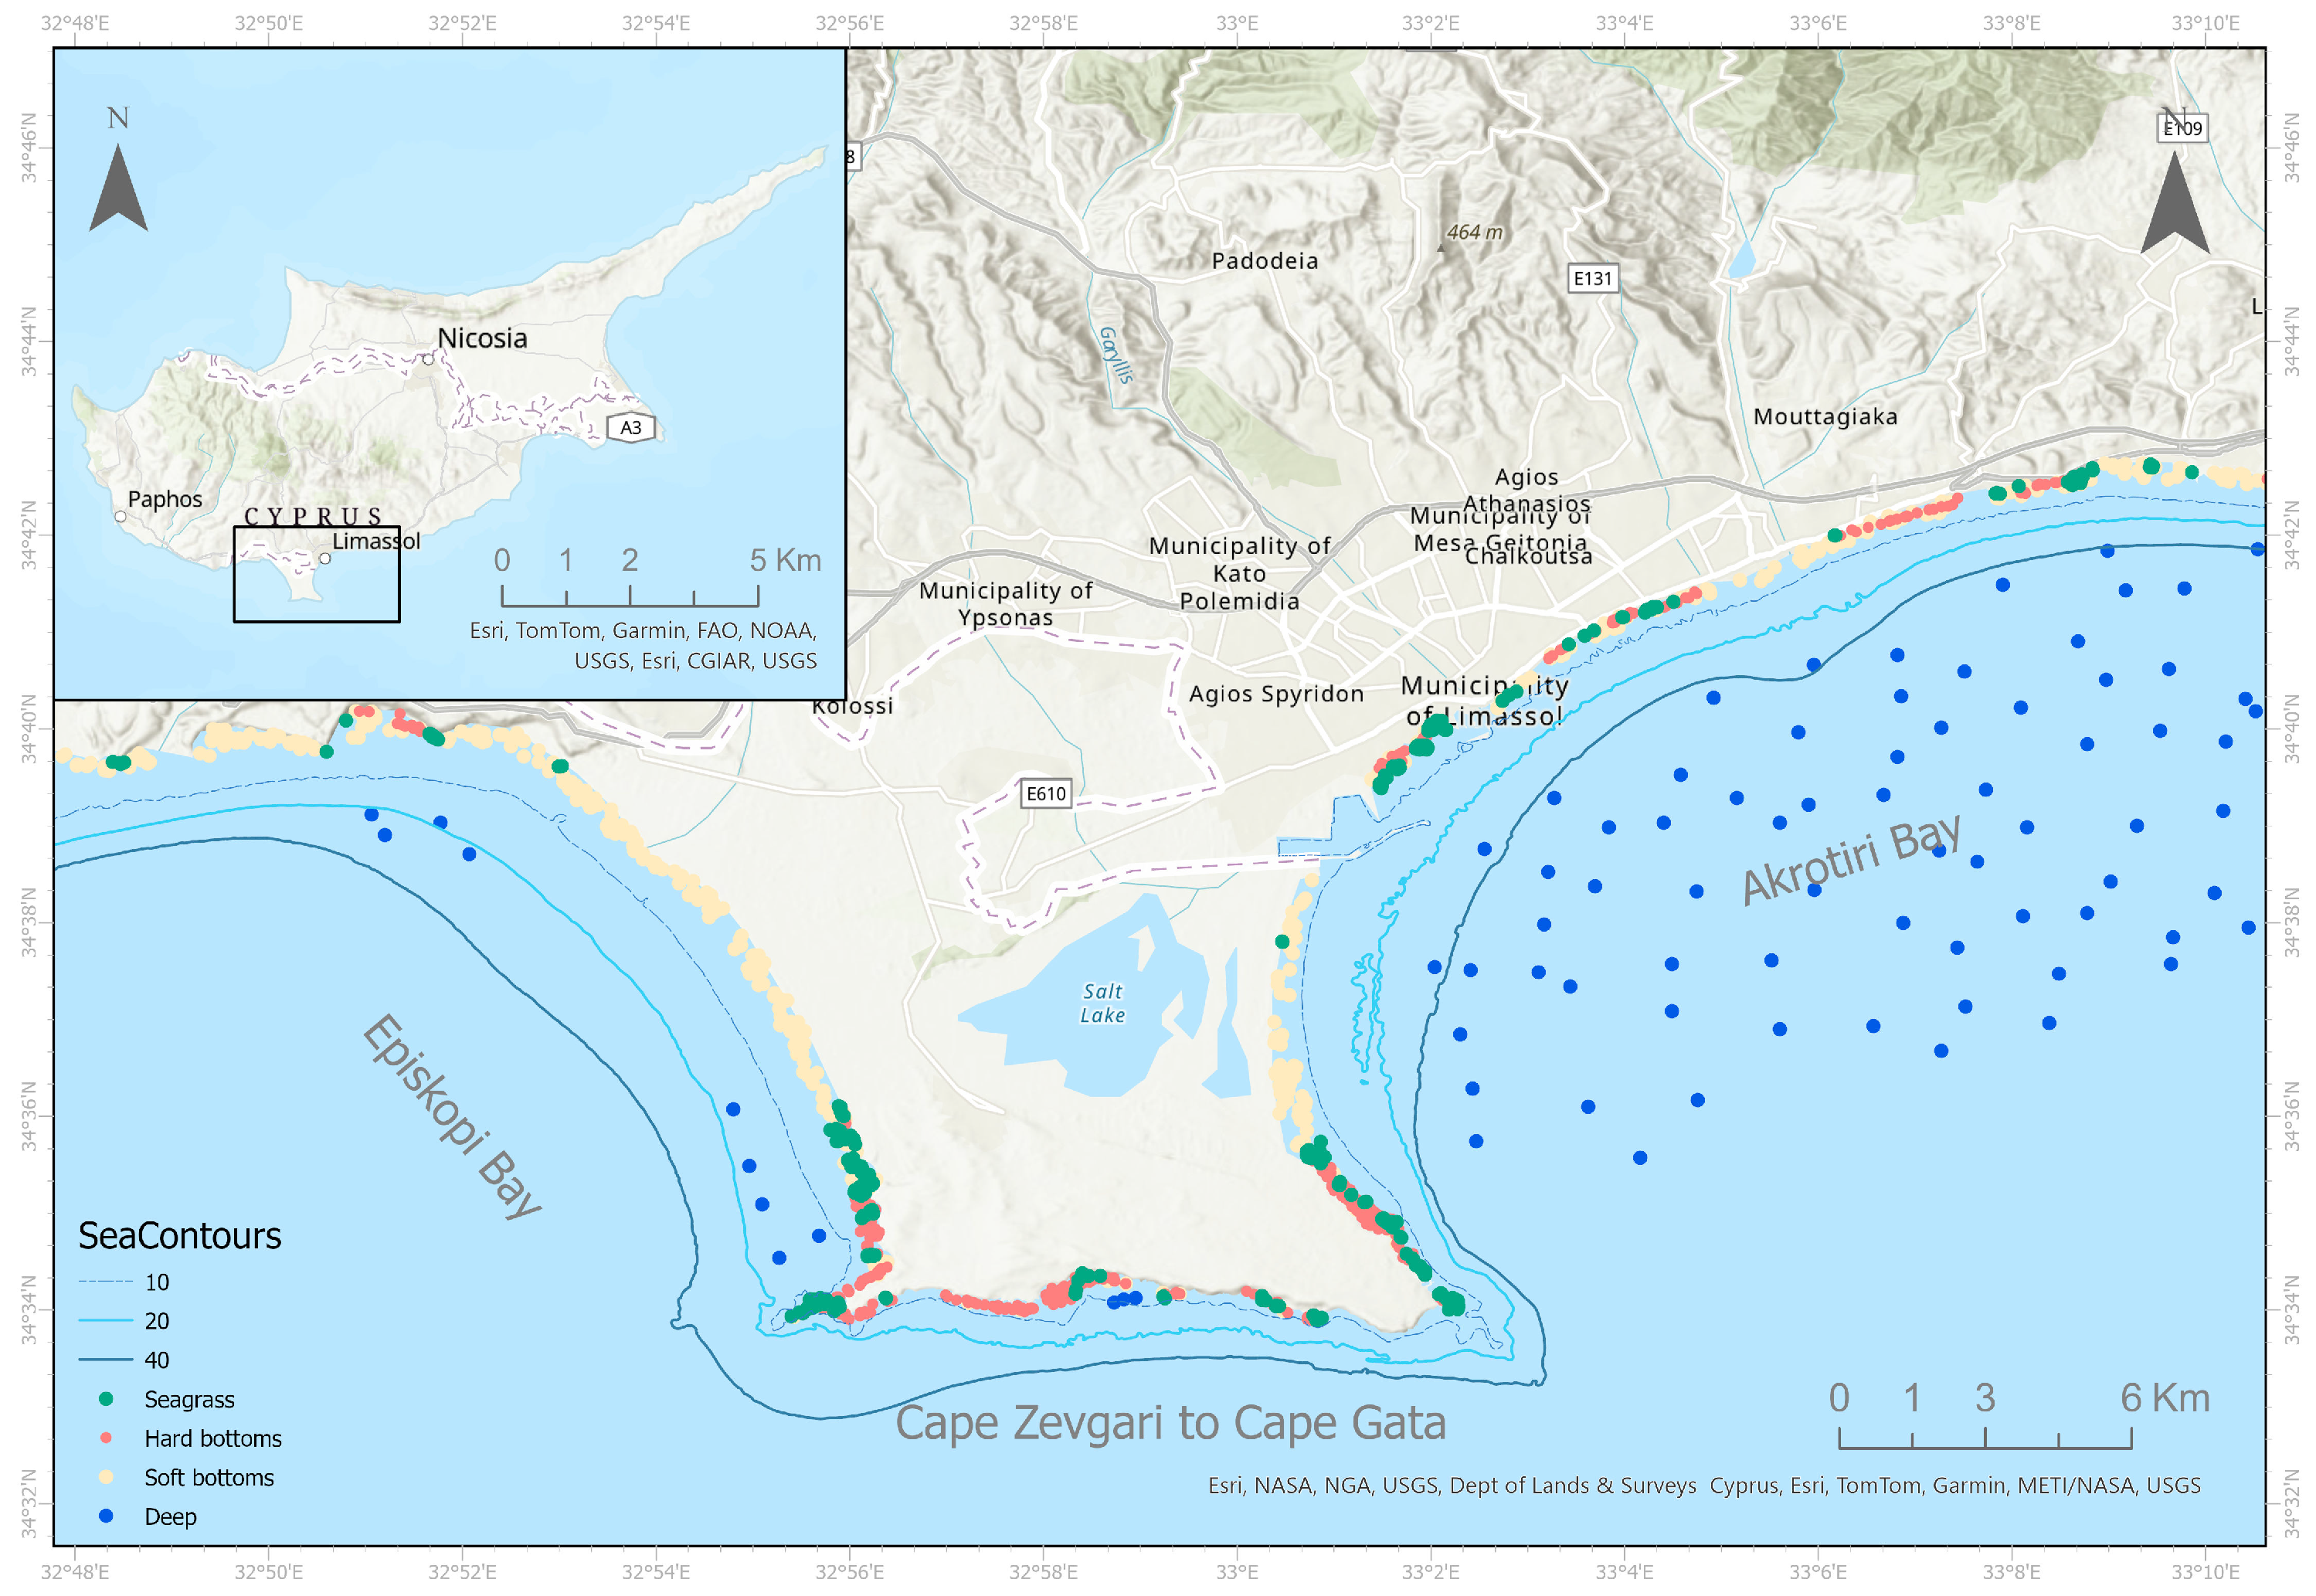
These oceanographic and climatic conditions strongly influence seagrass distribution and density along the Cypriot coast. In Cyprus, extensive seagrass meadows cover 6.52% of the total coastal area [42]. Plenty of patchy seagrass meadow areas are scattered along the coastline influenced by oceanographic conditions and human activities [34]. The densest meadows can be found in the north-west of Cyprus, particularly in the areas of Paphos and Polis Chrysochous [21]. This case study is extended between Episkopi Bay and Akrotiri Bay (Figure 1).

2.2. Data

2.2.1. Satellite Data

In this case study, Copernicus Sentinel-2, L2A, satellite data was used, also called S2_SR_HARMONIZED (S2_HAR), with a five-day temporal resolution. The Level-2A SR_HARMONIZED satellite images refer to atmospherically corrected bottom-of-atmosphere reflectance values, scaled by 1000 to maintain compatibility with older scenes. The atmospheric correction is performed by Sen2Cor versions 2.5–2.9, depending on date.
All further computations were carried out on normalized water, leaving reflectance values ( ρ w N ( λ ) ) (after division by pi), not on raw or DN values. The time range of the data used for this study is 2017–2021, and the total number of images was 201. This five-year window (2017–2021) was selected to maximize the number of cloud-free, low-turbidity observations and to minimize noise from sunglint and atmospheric effects. This approach ensures robust seagrass detection and represents a generalized baseline rather than interannual dynamics.
For the analysis, we use eleven bands: B1 (coastal), B2 (blue), B3 (green), B4 (red), B5 (red edge 1), B6 (red edge 2), B7 (red edge 3), B8 (NIR), B11 (short wave infrared 1-SWIR1), SCL (Scene Classification Layer), and the QA60 bitmask band, which helps discriminate clouds and cirrus, leading to cloud masking. Sentinel-2 bands are provided at different resolutions (10 m, 20 m, and 60 m). For this study, we used mainly the bands at 10 m spatial resolution, corresponding to the four key bands—B02 (blue, 490 nm), B03 (green, 560 nm), B04 (red, 665 nm), and B08 (NIR, 842 nm). The additional bands (B01-60 m, B05-20 m, B06-20 m, B07-20 m, and B11-20 m) were automatically resampled by GEE using nearest-neighbor resampling.

2.2.2. Reference Data for Training and Validation

A key part of the image classification workflow is the existence and use of high-quality data, ideally matching the timeframe of the satellite observations. Figure 2 displays the training dataset used in the analysis for the four desired classes: hard bottom (habitat 1170), soft bottom (habitat 1110), seagrass (habitat 1120*), and deep water.
This process requires experience and sufficient logistics for field missions. Here, the training dataset (Figure 2) was produced solely with photointerpretation [19,42,43,44] of Sentinel-2 and PlanetScope image composites. The photointerpretation keys used were tone, shape, size, pattern, texture, shadow, and association. The photointerpretation process was carried out during the period 2020–2021 using the most recent high-resolution basemaps available during that time. This is why the 2017–2021 time span was selected for creating the satellite image mosaic, ensuring alignment between the reference data and the satellite observations. The resulting areas, in the form of polygons, have been cross-checked for misinterpretations with recent and older high-resolution data, like Bing maps, GEE basemap, and Google Earth Pro, and aerial imagery [45]. Sampled points were accepted only if they showed consistent agreement across all imagery sources. Finally, these were extracted from GEE’s cloud environment in a vector format (polygon shapefiles). These polygons refer to the presence of three different coastal habitat classes: hard bottom (habitat 1170), soft bottom (habitat 1110), and seagrass (habitat 1120*). Within the final polygons, training points of the three different classes were selected with stratified sampling [46] for the area of interest. To continue, the validation dataset (shapefile points) is provided by the Department of Fisheries and Marine Research (DFMR) [47,48], which operates under the Ministry of Agriculture, Rural Development, and Environment of Cyprus. This dataset was generated using side-scan sonar and ground-truthing as part of the “Mapping and evaluation of Posidonia oceanica meadows and other important marine habitats project conducted under the European Habitats Directive (92/43/EEC)”. The selected points were extended beyond the isobath of 5 m, reaching 20 m depth.

2.2.3. Carbon Data

We retrieved carbon stock Corg data expressed in Megagrams per square kilometers (Mg/km2) (1 Mg = 1 ton). The Intergovernmental Panel on Climate Change (IPCC) defines three tiers of carbon stock assessment methodologies, each reflecting a different level of detail or accuracy. The first one, Tier 1, is broad and refers to a global estimation and generalized assumptions. This assessment has a high degree of uncertainty. On a country scale or site-specific data, Tier 2 refers to measurements that have been used for average carbon stock estimates within a region. Finally, Tier 3 has the highest accuracy in comparison to the previous two and provides site-specific data with repeated measurements over time to monitor changes. For Tier 1, we utilized the IPCC default values for emission factors [49,50], which rely on generalized assumptions and are associated with a broad error margin. We examined the different ranges and the mean value. For Tier 2, we conducted a comprehensive literature review to identify blue carbon accounting data for seagrass meadows, analyzing various reported ranges and mean values. According to Wesselmann et al. [51], the estimated carbon stock in Cyprus is 1200 Mg/km2 incorporating contributions of three different seagrass species in this estimation, Posidonia oceanica, Cymodocea nodosa and Halophila stipulacea.

2.3. Methodological Framework

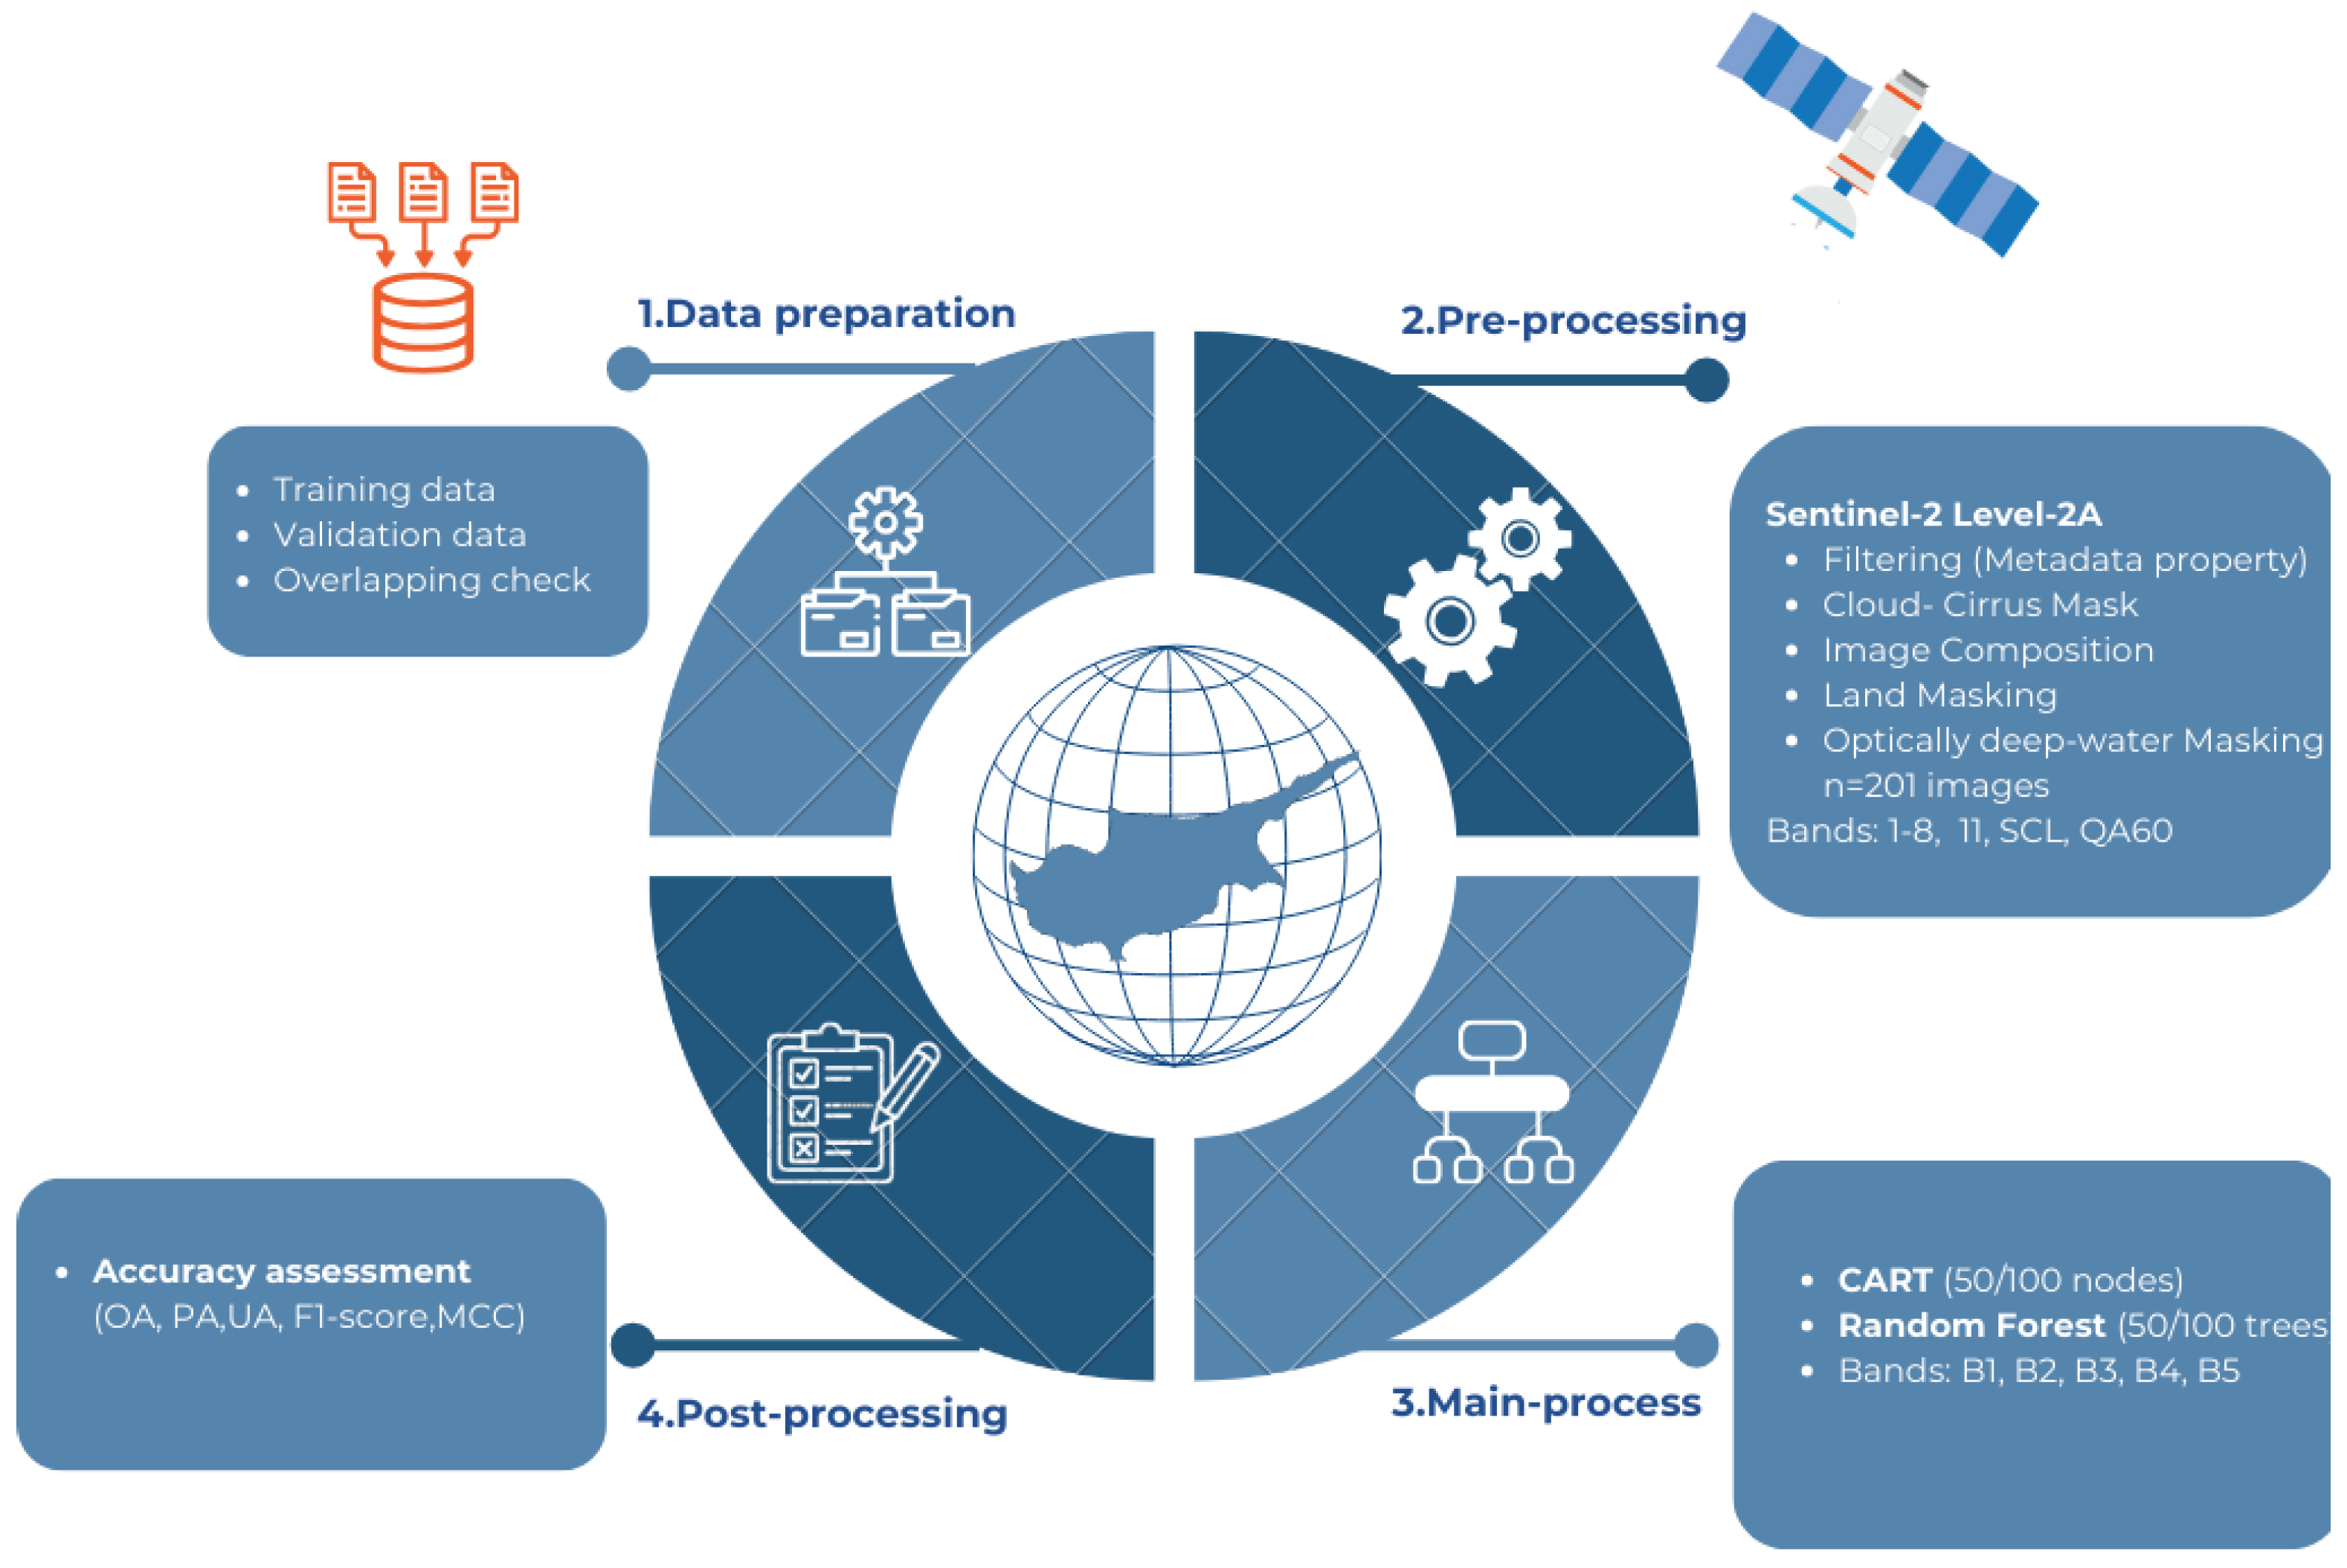
The proposed methodological framework integrates machine learning techniques to extract information from pixels and transform it into local-scale seagrass maps in the Cyprus area of interest with GEE (Figure 3). It enables users to process, analyze, and visualize large satellite data, saving processing time and storage space. The proposed methodology on the GEE platform provides quick and easy analysis tools for pre-processing, processing, and analyzing remote sensing data. The methodology is divided into four main stages: (a) data preparation; (b) the pre-processing; (c) the main process, where we prepare the data to train our models, and afterwards, the machine learning models are trained and applied for classification; and (d) the post-processing, where results are validated and the blue carbon estimation is carried out.

2.3.1. Data Preparation

In this section, the training and validation datasets were prepared for the main analysis (Table 1), which includes the machine-learning habitat mapping. Within the photointerpreted polygons, stratified random sampling [46] was performed to select 500 training points per habitat class (seagrass, soft bottoms, and hard bottoms; 1500 training points in total). For the analytical workflow, training and validation points were selected with a minimum distance between them to avoid overlap. The minimum distance between any point in the training and validation datasets is at least 10 m. The validation points were selected randomly, 50 points per class (150 validation points in total), and it was ensured that there was no overlap between the validation and training datasets. Moreover, the optically deep water class—representing the areas away from the coastal zone with a minimum optical ecological interest—was identified through photointerpretation for both training (122) and validation (44) and was included in the analysis only to avoid misclassifications. Finally, the reference dataset, which includes both training and validation data, consists of a total of 1816 points (1622 training; 194 validation) obtained within the polygons generated by GEE. This ensures that the accuracy assessment remains unbiased and is not overestimated.

2.3.2. Pre-Processing

The primary objective is to produce a high-quality image composite that remains unaffected by clouds, cirrus formations, and other atmospheric or environmental interferences, through the implementation of a structured five-step methodology. To achieve this, S2_HAR image collection is filtered to reduce its size and work with the most suitable tiles. In the first step, the S2_HAR collection is filtered for images with cloud coverage less than 25%. In the second step, the QA60 band is used to mask out the cirrus and clouds, further refining the dataset. In this way, the clouds, cirrus, and shadows are excluded from the analysis and masked out. In the third step, following the approach of Traganos et al. [30], a statistical reduction in the 25th percentile per pixel is applied. For example, for each pixel, the 25th percentile reflectance value across the multi-temporal stack was retained. This method has been shown to effectively minimize disturbances and noise caused by sunglint, haze, clouds, turbidity, and waves. Based on this approach, a final image composite was generated for the period 2017–2021, synthesizing data from 201 Sentinel-2 images over Cyprus. The fourth pre-processing step is the land masking, land water bodies, and optically deep water. The different masks were produced with the combination of the Otsu-thresholding method and Canny edge filtering. Otsu thresholding is a non-parametric, automatic technique that selects an optimal threshold by maximizing the variance between classes (e.g., land and water) [52]. Canny edge filtering offers two advantages. It detects and delineates sharp transitions between land, shallow water, and deep water—all those components that were masked—and enhances the effectiveness of Otsu thresholding by refining the spatial boundaries in the reflectance data before thresholding is applied [53]. To achieve this, the Modified Normalized Difference Water Index (MNDWI) (Equation (1)) [54] was applied to distinguish between land and coastal water.
MNDWI = Green SWIR 1 Green + SWIR 1
The fifth and final step of the pre-processing took place, where Otsu thresholding was applied to mask out the optically deep water [52]. Effective masking results can be achieved by utilizing the appropriate image subsets as the foundation for all threshold methods, which facilitates a strong binarization for optimum differentiation [52]. The input parameters were selected based on Traganos et al.’s approach [42] and parameterized for the case study. The parametrization aims to refine the masking of optically deep water and indirectly to enhance the classification accuracy. It involves selecting different sets of values for the Canny edge sensitivity and the number of buckets for Otsu thresholding. These values provide a balanced approach, minimizing the loss of important information while achieving effective thresholding. The composite, finally, divided by pi and the output produced an optically shallow S2 composite, which is translated into normalized water leaving reflectance ( ρ w N ( λ ) ) [42,55]. All the above pre-processing steps were used to address influences from the change of medium (water column/air column) [42].
In remote sensing, the terms optically shallow waters and optically deep waters describe how light interacts with the water column and the seafloor, rather than physical depth. In optically shallow waters, the seafloor is visible or detectable from above, allowing reliable retrieval of bottom characteristics [56]. On the other hand, optically deep waters are water bodies where the seabed signal is too weak to reach the water surface and cannot be detected by satellite sensors, so the substratum does not contribute to the water leaving reflectance, and depth estimates are unreliable [57]. To exclude this information from the analysis, first, Otsu thresholding is applied to mask out optically deep water. After this procedure, if this information remains, it is classified as deep water.

2.3.3. Main Process—Classification

The ML algorithm was trained to extract high-quality classification results. The CART [58] and RF [59] ML methods were chosen as they are commonly applied in similar studies in the literature [60]. The CART algorithm builds a tree structure based on the values of the variables in the dataset and discovers relationships and patterns within it. During the tree structure development, CART selects the variables and their respective threshold values that best improve homogeneity within subsets [58]. In addition, CART can perform both classification and regression tasks. The tree structure can explain the linkages and interactions between the variables in the dataset, allowing researchers to view and analyze complicated structures in a straightforward manner [58]. The RF algorithm consists of multiple tree predictors, with each tree relying on values from a random vector sampled independently and uniformly across all trees in the forest. As the number of trees in the forest increases, the generalization error converges to a limit [61]. This error depends on both the individual trees’ strength and their correlation within the forest [62]. Additionally, for both RF and CART classifications, we used two separate datasets: one for training and another for validation—the former set to train the algorithms and the latter to evaluate the result. Although the training and validation data were from different depths, we trained our algorithm in optically shallow waters and validated it in mixed depths. Despite this difference, the results remained satisfactory, and the accuracy assessment was not significantly affected. Finally, for both classifiers, we used bands B1 to B5 as input features, allowing the models to be trained on the spectral variability captured within these bands.

2.3.4. Post-Processing

The final stage of the methodology is the accuracy estimation of the produced classifications. The resulting output should be checked for correctness using field measurements. The accuracy assessment of the Cyprus area of interest is based on the known metrics such as overall accuracy (OA), producer’s accuracy (PA), user’s accuracy (UA) [63], and the F1-score [55]. The OA represents the correctly classified validation samples, regardless of their class. The PA refers to the number of validation samples that are correctly classified, relative to the total number of validation samples in this class. UA is the ratio of correctly classified validation samples in a specific class to the total number of samples predicted to belong to that class. Additionally, the F1-score and Matthews Correlation Coefficient (MCC) were applied to assess classification performance for each class and model. F1-score is the harmonized mean of PA and UA (Equation (2)), and MCC evaluates the quality of a binary classification, ranging from −1 to 1, where 1 indicates perfect agreement and values above 0.4 are considered moderate [64] (Equation (3)).
For performance interpretation, values above 80% were considered high, those between 60 and 80% were considered moderate, and values below 60% were considered low [65]. This scale was applied to the overall accuracy, the producer and user accuracy, and the F1-scores.
F 1 s c o r e = 2 × UA × PA UA + PA
MCC = T P × T N F P × F N ( T P + F P ) ( T P + F N ) ( T N + F P ) ( T N + F N )
Although GEE stores data in a geographic coordinate system (WGS84), we converted all layers to a projected coordinate system (UTM zone 36N) before estimating areas in ArcGIS Pro 3.1 software.

3. Results

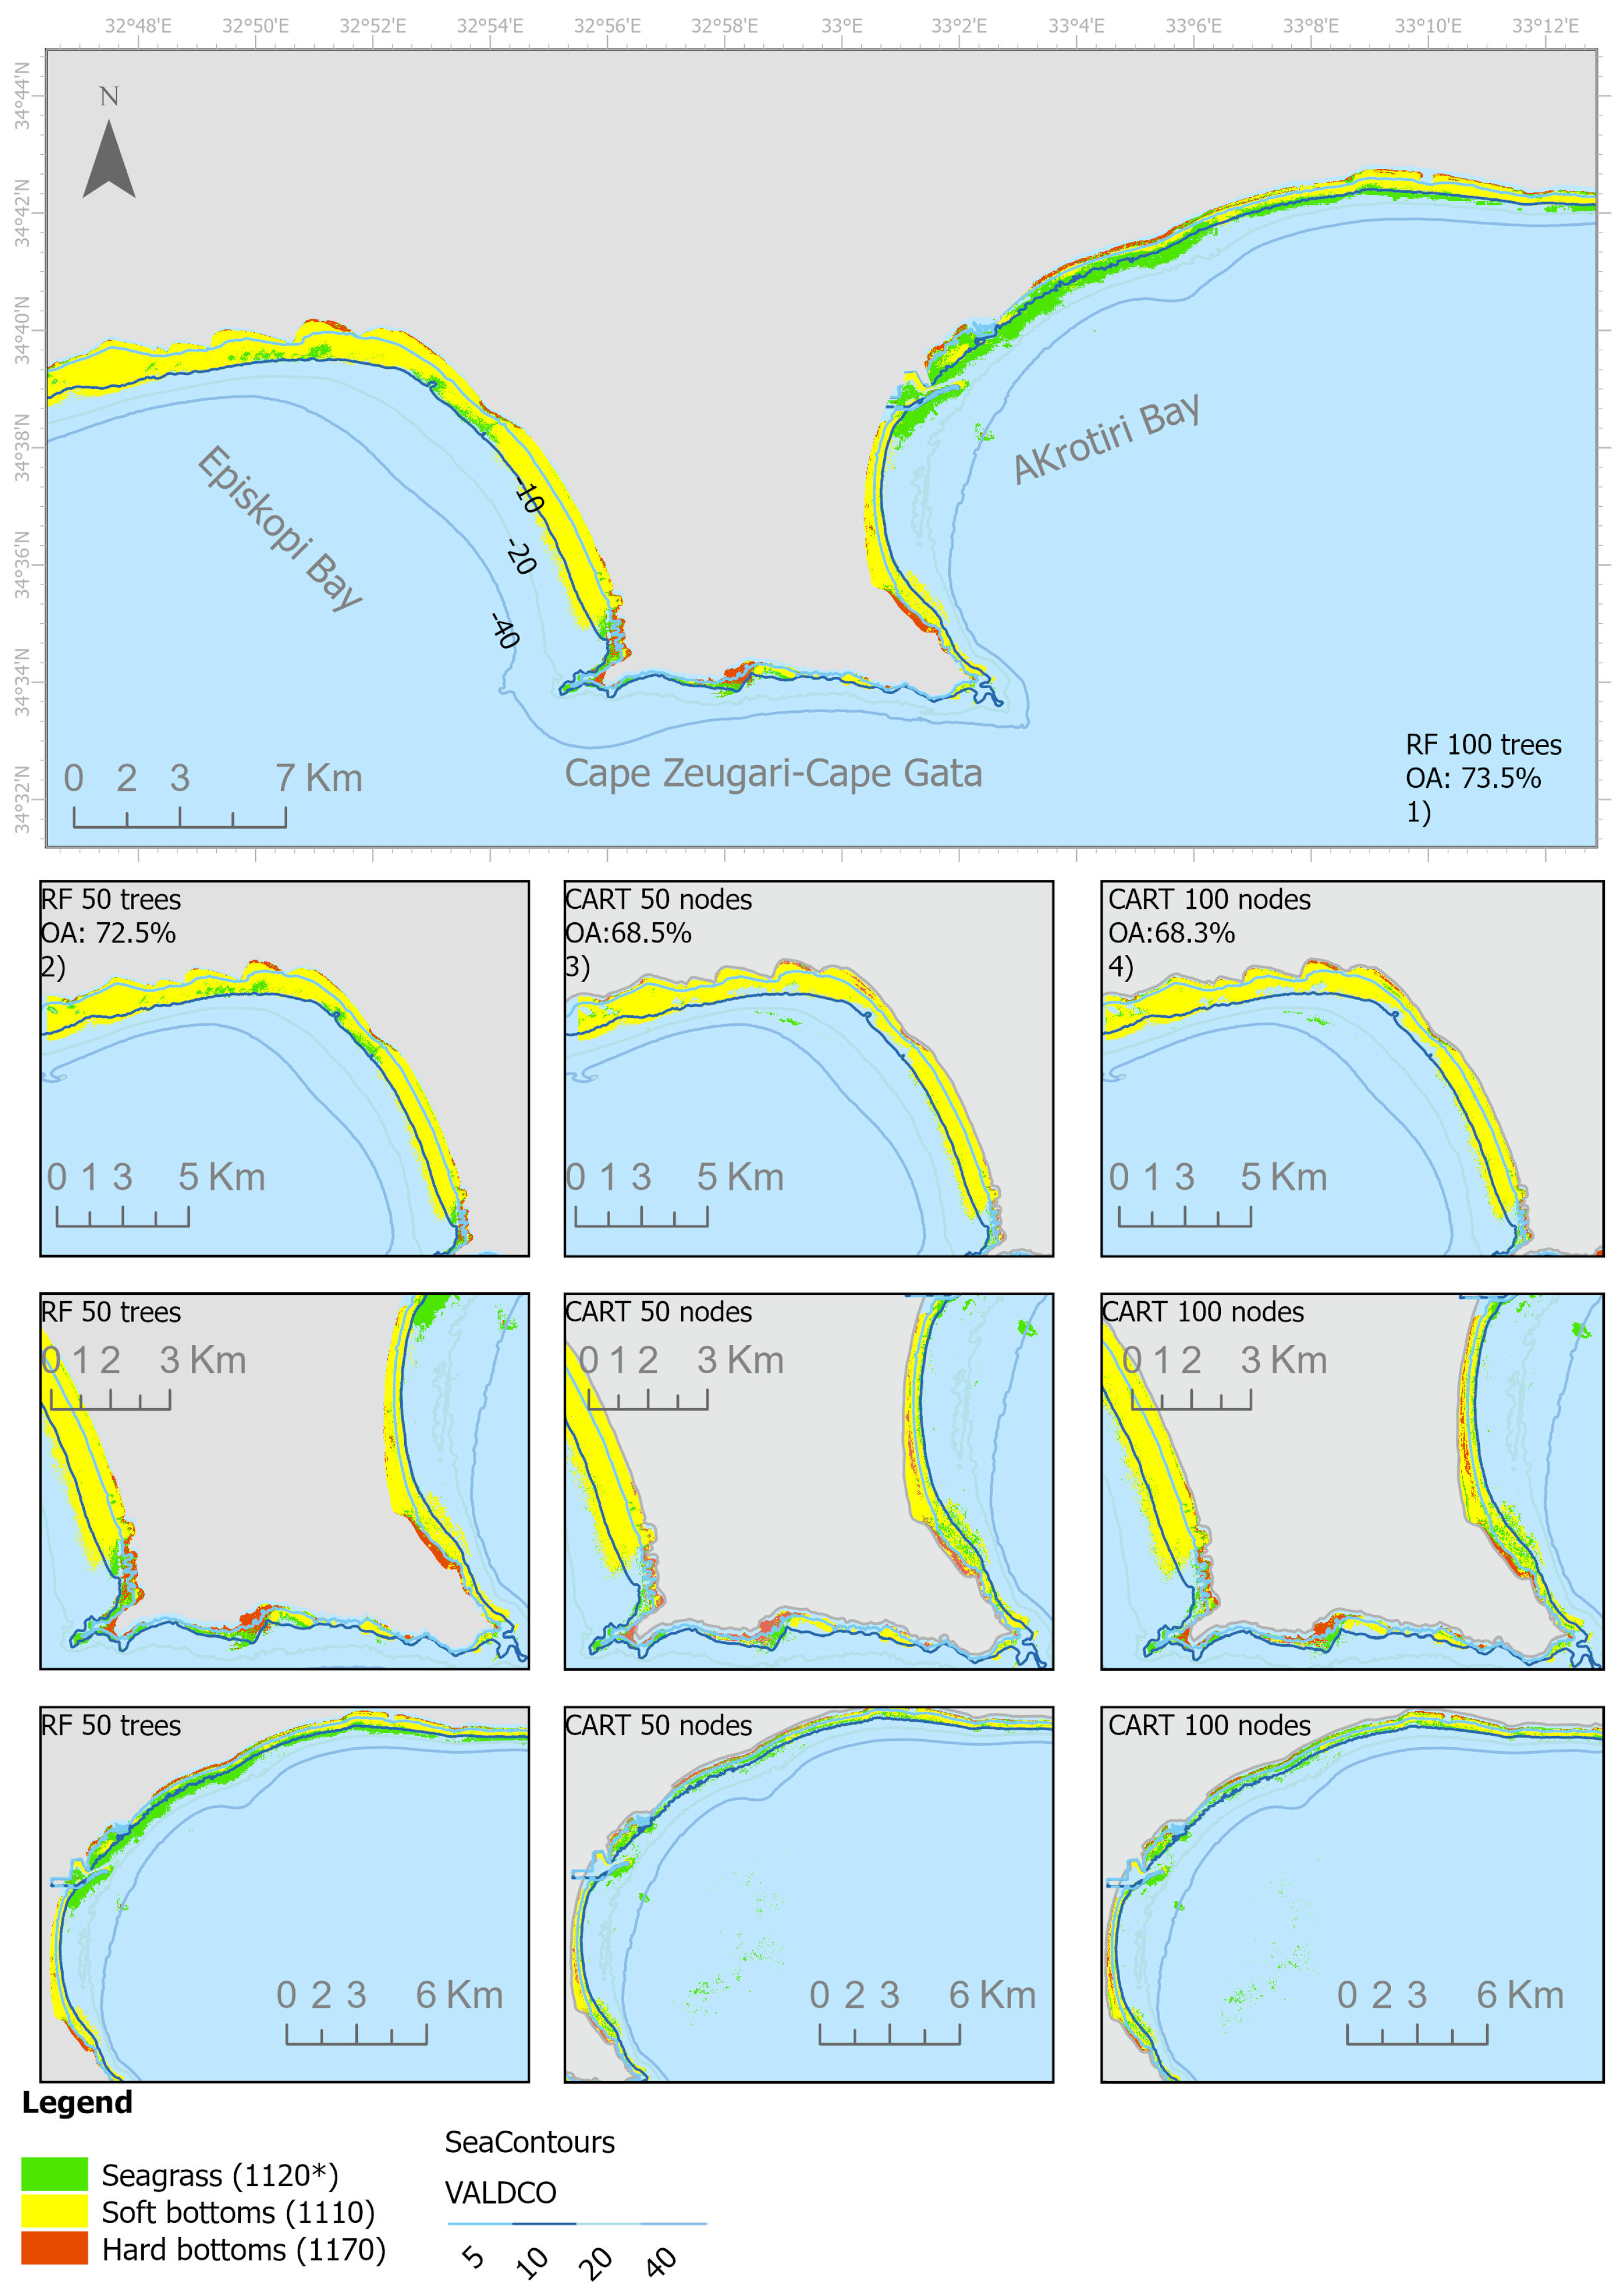
Using Sentinel-2 satellite data, we estimated the extent of shallow seagrass in southern Cyprus between depths of 0 and 15 m, and in some cases up to 20 m, with CART and RF classifiers. The bathymetric maps provided by the DFMR determined the minimum and maximum depths at which seagrass was observed. The largest visually continuous seagrass patch is observed in the eastern part of the case study, Akrotiri Bay, in the coastal area of Limassol. Figure 4 shows the results of the regional-scale distribution and extent of seagrass. Among all classes, seagrass showed large variability across classifiers and parameter settings.
As shown in Table 2, the mapped area of seagrass ranged from 10.03 km2 (CART, 50 nodes) to 17.23 km2 (RF, 50 trees)—a difference of over 7 km2. The soft bottom class showed stable classification performance across all model configurations. The total area ranged from 42.89 km2 (CART, 100 nodes) to 45.08 km2 (RF, 100 trees). When the number of nodes and trees was set to 50, the area had a small difference, which was mapped using both classifiers (CART, 50 nodes, 44.12 km2, RF; 50 trees, 44.30 km2). One of the most important findings here is the total area mapped for the hard bottom class with two different classifiers and four different parameters—number of nodes and trees. We have successfully mapped the same extent for the class hard bottoms, using the RF classifier, only with a small difference of 0.18 km2. Finally, the deep water class covered the same area for the classifier CART (50 and 100 nodes), while the RF classifier showed a small difference in the area classified.
The usage of the machine learning techniques CART and RF in this study allowed the effective habitat classification and mapping of seagrass, thus showcasing the usefulness of these algorithms for large-scale ecological monitoring and analysis. The class of optically deep water is removed from the map in Figure 4, for visualization purposes, in order to enhance clarity of the habitat distribution among the other three classes (seagrass, soft bottoms, and hard bottoms) as they are more ecologically important. However, this class was still included in the classification process and overall methodology.
The area of interest appears to be quite heterogeneous despite the close distance between the three coastal regions. Based on the classification results, the area can be divided into three distinct extents: (a) Episkopi Bay in the western part of the map, (b) the coastline from Cape Zevgari to Cape Gata in the central part, and (c) Akrotiri Bay in the eastern part of the map. In Episkopi Bay, the Otsu thresholding parametrization has worked effectively. The optical deep water has been removed effectively from the scene. However, in the second area of Cape Zevgari, Cape Gata, although the parametrization produced results, it also masked not only the optically deep water, but also the optically shallow areas that contain useful information. As a result, important details about the coverage of seagrass were lost. In the third part, Akrotiri Bay (eastern part of the map), the Otsu-thresholding parametrization was ineffective, resulting in small misclassifications of seagrass in the region. For both classifiers, we have observed misclassifications and overestimation/underestimation, depending on specific classes, especially seagrass and hard bottoms.
The study evaluated the performance of two machine learning algorithms, CART and RF, in mapping four substrate types in a marine environment: seagrass, optically soft bottoms, optically hard bottoms, and optically deep water. Both models estimated the total area for each substrate type, with slight variations. Utilizing a threshold of 70% for training with the CART classifier, we mapped a total of 10.03 km2 and 11.71 km2 for seagrass meadows in Cyprus (50 and 100 nodes, respectively). Additionally, CART estimated 44.12 km2 and 42.89 km2 for soft bottoms, 7.22 and 6.78 km2 for hard bottoms, and 247.61 km2 for deep water. At the same time, RF produced estimates with a small difference, including 17.23 km2 and 15.55 km2 (50 and 100 trees, respectively) for seagrass, 44.3 and 45.08 km2 for soft bottoms, 10.31 and 10.29 km2 for hard bottoms, and 238.09 and 239.01 km2 for deep water. According to the isobaths provided by the Department of Lands and Surveys of Cyprus [48], the mapped depth ranges between 15 m and 20 m. It is important to note that the algorithm was trained in shallow areas until a 5 m depth, yet it was applied across mixed depths, with the accuracy assessment also conducted in mixed depths, due to different sources of training and validation datasets. As a result, the performance of the accuracy assessment was affected in the optically soft bottom areas, which is the second most predominant class in the area of interest, after the optically deep water.
The accuracy assessment highlights notable differences in model performance (Table 3). The accuracy assessment of the CART model (50 nodes) shows an overall accuracy of 68.5%, with the highest classification performance in the deep water class (UA:94.0%, PA:92.0%), while seagrass (UA:63.5%, PA:60.4%) exhibits higher misclassification rates. Soft bottoms (UA: 67.6%, PA: 75.7%) perform moderately well but still show some confusion with seagrass and hard bottoms. Interestingly, even if the producer’s accuracy with 100 nodes is 72,9%, for the seagrass class, the user’s accuracy is 57.9%, thus indicating an overestimation of the seagrass class when using the specific parameter (100 nodes). On the other hand, the three other classes—soft bottoms (UA:72%, PA: 63.6%), hard bottoms (UA:64%, PA: 54.5%), and deep water (UA:94.2%, PA: 92%)—were underestimated. Based on the results, among the performed classifications, the CART with 100 nodes achieves the highest accuracy. Conversely, the RF model demonstrated higher overall accuracy at 72.5% for 50 trees and 73.5% for 100 trees and more balanced performance across all classes. For the case of 50 trees, we have an overestimation of the seagrass class (PA: 68.8%, UA: 67.2%). For the other classes, we can see that there is an underestimation in classes—soft bottoms (PA: 72.8%, UA: 73.3%), hard bottoms (PA: 61.7%, UA: 62.5%), and deep water (PA: 97.7%, UA: 98.8%). For the RF classifier with the 100 trees parameter, for the class seagrass, we have equal PA and UA, which means that it is estimated to be the same by both the model and the user. We continue with underestimations of the classes’ soft bottoms (PA: 74%, UA: 74.5%) and deep water (PA: 97.7%, UA: 98.8%) and an overestimation in the class hard bottoms (PA: 63.6%, UA: 62.8%).
Another metric used to evaluate the classification result of each model and class is the MCC ((Table 4). MCC values range from −1 (complete disagreement) to 1 (perfect prediction) for binary classification. For the CART classifier with 50 nodes, MCC values were moderate for seagrass (0.46), soft bottoms (0.59), and hard bottoms (0.45), and the deep water achieved a high MCC of 0.92. When increasing the number of nodes to 100, there is an improvement for seagrass (0.48) and hard bottoms (0.46). The deep water class remains high (0.92). The RF classifier outperformed CART across all classes. With 50 trees, MCC values were 0.54 for seagrass, 0.63 for soft bottoms, 0.48 for hard bottoms and 0.98 for deep water. Increasing to 100 trees improved MCC for seagrass (0.57), soft bottoms (0.64), hard bottoms (0.5), and deep water (0.98).
Taking into consideration the F1-score and MCC, RF outperforms CART, especially for seagrass and soft bottoms. Increasing the number of trees or nodes generally improves performance, but hard bottoms remain difficult to classify accurately. Deep water consistently achieves the highest F1-score and MCC across all models, reflecting distinct spectral properties. Despite the fact that the classification results are characterized as moderate, they are yet comparable with other studies with higher spatial resolution [66], demonstrating the robustness of our approach despite using coarser imagery.

Carbon Accounting

Using an RF and CART classifiers, we assessed the carbon stock of seagrass meadows in Cyprus, incorporating regional data and Tier 1 [67] and Tier 2 [51] model-based methodologies Table 5. Tier 2 involves country-specific measurements conducted in Limassol and the port of Limassol. These metrics reduce the uncertainty compared to the global estimations provided by Tier 1. The mapped extent of seagrass meadows ranges from 10.06 to 17.23 km2, with region-specific carbon storage values derived from Wesselmann et al. [51] indicating a total carbon stock of approximately 19,000 Mg C.

4. Discussion

The main hypothesis of this study was that cloud computing and ML can be effectively combined to map benthic habitats and estimate carbon stock along the coast of Limassol, Cyprus. Our results support this hypothesis: the integration of Sentinel-2 composites, GEE, and ML algorithms (RF and CART) produced a replicable and scalable workflow for mapping shallow marine habitats.

4.1. Key Findings

The most important added value for Cyprus is that this study addresses a small but significant knowledge gap concerning the Eastern Mediterranean [49], and it presents an innovative approach in this mapping effort that we have designed, aggregated, and used a single, consistent data source while paving the road towards larger scale seagrass mapping across the whole Cyprus and the wider EMMENA region. Moreover, we integrated global Tier 1 data and regional Tier 2 methodologies to estimate carbon stocks. The extent of meadows was estimated to range from 10.03 to 17.23 km2, while region-specific carbon storage values derived from [51] and [67] indicated a total carbon stock of approximately 19,000 Mg C.

4.2. Comparison of RF and CART Classifiers

The results provide a comparative analysis of the performance of the CART and RF classifiers in mapping marine habitats such as seagrass, soft bottoms, hard bottoms, and optically deep water. Overall, the RF classifier demonstrates higher accuracy and balance across the different classes compared to CART. However, both classifiers show tendencies toward either overestimation or underestimation in specific habitat types. CART showed moderate classification accuracy in detecting seagrass, and its performance improved when the number of nodes was increased; however, the classifier still failed to distinguish hard bottom areas, which proved to be the most difficult class for both models. The model’s performance for seagrass detection improved with increased parameters (i.e., number of nodes), but other habitat types did not benefit from this improvement. RF outperformed CART in all classes according to the results. Better classification results were achieved when classifying seagrass and soft bottoms, with the highest F1-scores achieved when using the 100 trees. Despite these improvements, hard bottom areas posed limitations, proving that spectral similarity between substrates remains a challenge. Both classifiers exhibit some biases: misclassifications are more common in the seagrass and hard bottom classes. In contrast, the soft bottoms and optically deep water classes are more reliably classified, likely due to their more distinct spectral signatures. The better performance of RF can be attributed to its ability to handle complex environments and model non-linear relationships, which are the main characteristics of aquatic habitats [58,68]. The main advantage of this study is the satisfactory classification performance, achieving relatively high accuracies, even in a highly fragmented and heterogeneous area.

4.3. Comparison with Other Case Studies

The methodology presented here offers a replicable and scalable tool for future monitoring of shallow marine habitats and their ecosystem services. To conceptualize our findings in Table 6, we compare the performance of our RF classification (F1-score 69.4%) with recent studies in the Mediterranean and other regions (2022–2025). For example, Roca et al. (2025) [32] achieved an overall accuracy of 92.5% and user’s accuracy of 94.8% using multi-temporal Sentinel-2 composites and RF for three classes, seagrass, optically deep, and sand/rock in the Balearic islands. Davies et al. (2024) [69] reported pixel-level accuracy of 0.82 for seagrass using Sentinel-2 and neural networks across intertidal sites in Western Europe, while Davies et al. (2023) [70] achieved accuracies between 0.835 and 0.951 using various sensors and ML methods in the Western Atlantic. Traganos et al. (2022) [42] reported 0.58 for P. oceanica classification across 22 Mediterranean islands. These comparisons indicate that our results are within the range of previously reported accuracies (65–80% for Mediterranean Sentinel-2 studies), highlighting the robustness of our workflow while also noting the influence of regional differences, dataset size, and methodological choices on classification performance. Our findings are particularly noteworthy as they represent the first regional-scale estimation, significantly advancing previous studies by delivering more detailed and comprehensive mapping.

4.4. Challenges in Coastal Habitat Mapping

An important challenge in coastal habitat mapping using Sentinel-2 satellite data is the presence of stripping on the images, an issue that is related to the sensor’s geometry. Since Sentinel-2 data are optimized for land applications, these strips are not a visualization issue, yet they represent a technical bottleneck, as they alter the reflectance values of neighboring pixels and areas [71]. As a result, classification algorithms cannot be implemented in the whole area of interest.
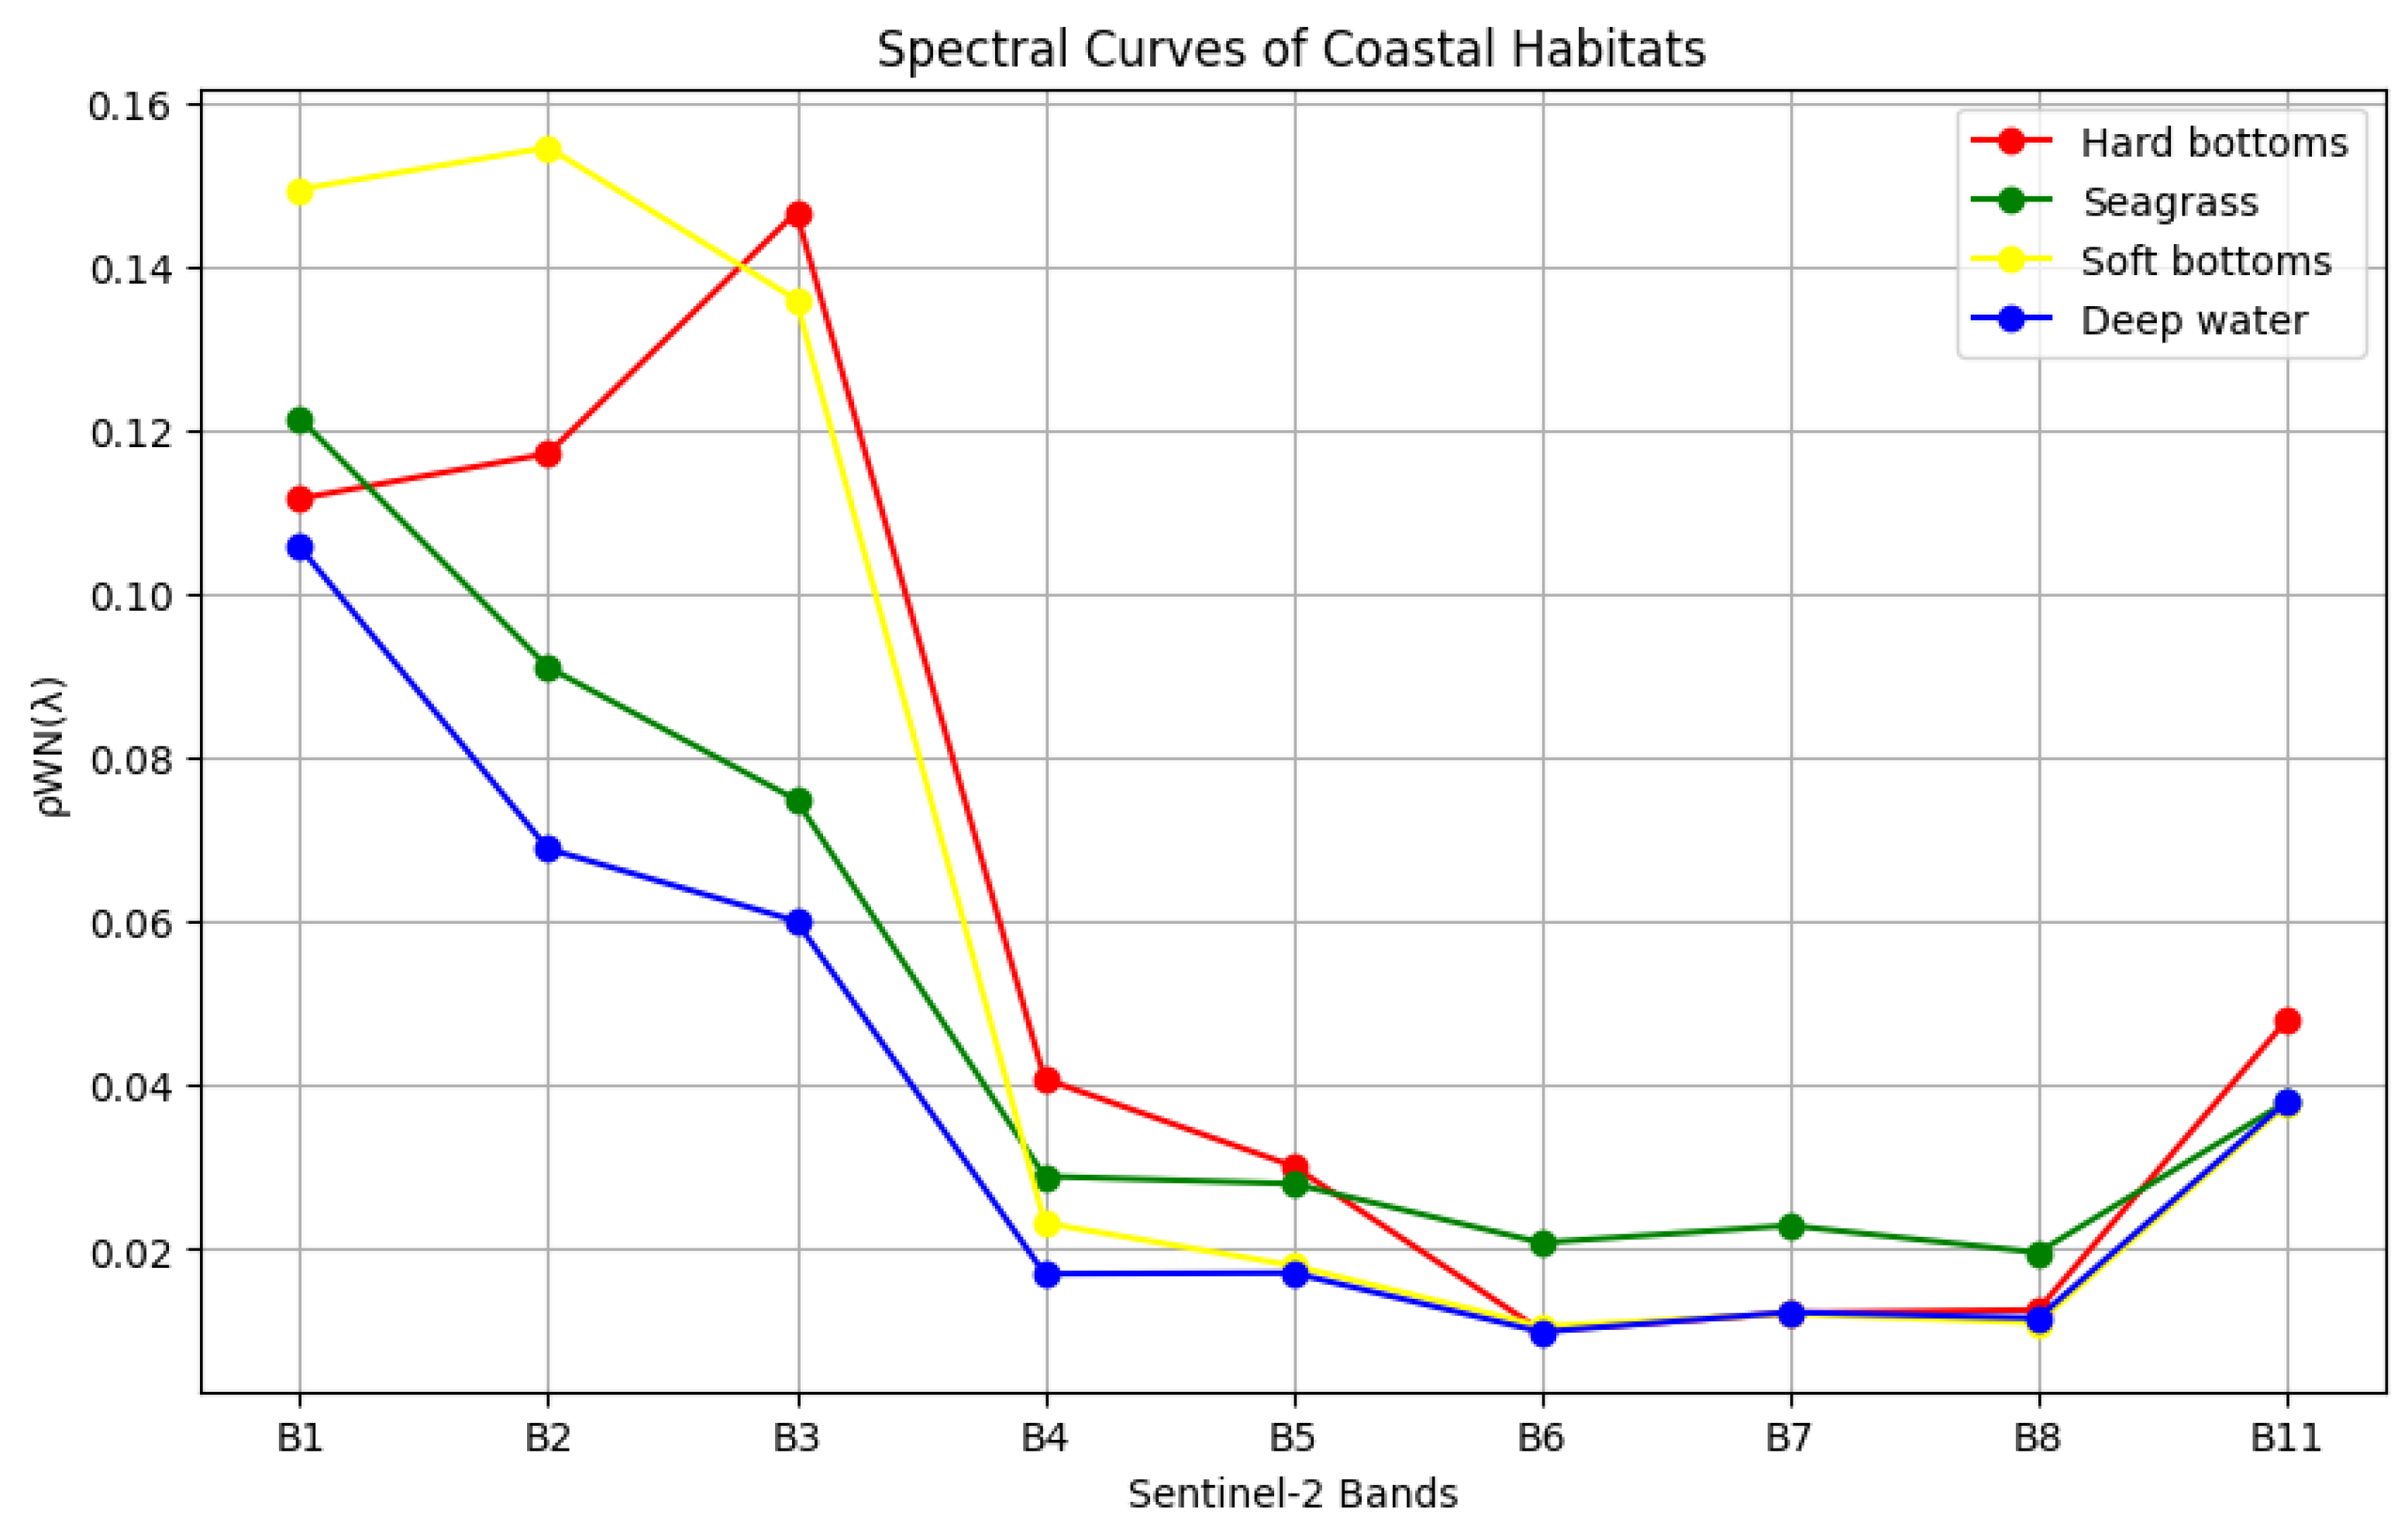
Another major challenge arises from the difficulty in distinguishing optically deep water from seagrass meadows. These two classes have similar spectral characteristics because of water column influences, making the classification challenging. As a result, optical deep water is misclassified as seagrass [31,42]. Our results showed that increasing the level of the parameterization level of the Otsu algorithm led to more accurate classification results. Adjusting threshold values influenced the extent of optically deep water areas, as well as variations in the boundaries of seagrass habitats. Misclassifications and parametrization errors may arise from multiple sources, including the use of multi-temporal image composites with different sun angles and water surface conditions, as well as technical factors, such as processing parameters, satellite sensor characteristics (i.e., spectral bands and spatial resolution) (Figure 5).
Water clarity plays a critical role in classification accuracy [72]. In Episkopi Bay, the Otsu thresholding parametrization performed effectively due to the high optical clarity of the water. In contrast, the Cape Zevgari–Cape Gata region showed acceptable parametrization results but also some loss of information in the extent of seagrass and hard bottom classes. The application of the MNDWI revealed areas affected by the index, indicating that misclassifications and masking errors may have influenced the result. Finally, in Akrotiri Bay, Otsu thresholding failed to perform effectively, resulting in misclassifications of seagrass. This may be attributed to reduced water clarity in the water column, potentially influenced by sediment resuspension from the Port of Limassol [73].
Additional uncertainty was also introduced due to the training and validation datasets, as they were from different sources. Beyond potential photointerpretation errors [42], a key limitation was the distribution of the training samples, which were concentrated primarily in shallow waters (0–5 m) for seagrass and soft and hard bottoms. This bias could affect the performance of the classifiers across depth ranges. Future research should prioritize a more balanced distribution of training and validation datasets to enhance classification accuracy.
In the remote sensing of coastal ecosystems, one also faces physical sources of errors: this type of error has to deal with the physical characteristics of an area during the satellite image capture and the final products we receive and process, such as cirrus, clouds, and the water column. The first two errors have been minimized in the pre-processing steps. However, water column clarity remains a key factor influencing the accuracy of the Otsu-thresholding and Canny edge filtering methods.
The accuracy assessment further revealed difficulties in mapping the class of hard bottoms [74]. The class was mostly underestimated for both classifiers, as reflected by PA < UA, especially for CART 50 and 100 nodes (CART 50 nodes; UA: 60.0%, PA: 58.4%, CART 100 nodes; UA: 64.0%, PA: 54.5%) and similarly for RF with 50 trees (UA: 62.5%, PA: 61.7%). Conversely, for RF with 100 trees, we observe an overestimation, where PA > UA (UA: 62.8%, PA: 63.6%). A possible explanation is the biological hypostasis of the hard bottoms, which are colonized by different types of flora and fauna, leading to the same spectral characteristics in the green band. Further research on texture features or bathymetric auxiliary data could potentially help reduce spectral confusion with the other classes.
Despite these challenges, this study provides the first spatially explicit assessment of seagrass carbon stocks for Cyprus using Sentinel-2 imagery combined with machine learning classifiers. Both RF and CART achieved reliable estimations of seagrass areal extent, which were subsequently translated into carbon stock estimates using two different approaches for emission factors: IPCC Tier 1 default values and Tier 2 values derived from regional values. The results demonstrate clear differences between Tier 1 and Tier 2 estimations. For example, RF with 50 nodes yielded a Tier 1 mean carbon stock of approximately 186,114 Mg C, while the corresponding Tier 2 estimate was substantially lower at 20,676 Mg C. Similarly, CART with 100 nodes produced a Tier 1 mean of 126,716 Mg C, compared to a Tier 2 estimate of 14,076 Mg C. These discrepancies underscore the sensitivity of carbon stock assessments to the choice of emission factors. Tier 1 values, while globally standardized, appear to overestimate carbon stocks for Cyprus relative to local empirical data. Tier 2 values derived from regional studies provide more realistic estimates, reflecting the unique ecological and geomorphological characteristics of Cypriot seagrass meadows. Methodologically, RF produced higher carbon stock values compared to CART across both Tier 1 and Tier 2 assessments. This is consistent with the broader literature, where RF often outperforms single-decision-tree methods due to its structure, which reduces variance and captures non-linear relationships more effectively. The sensitivity of carbon stock estimates to model complexity (50 vs. 100 trees/nodes) was less pronounced than the differences arising from emission factor selection, indicating that uncertainties in emission factors currently represent the dominant source of variability. In the Mediterranean context, these findings align with studies reporting the importance of using locally derived parameters for accurate blue carbon accounting. Posidonia oceanica meadows, which dominate Cypriot waters, are known for their capacity to sequester carbon over millennial timescales. However, without site-specific calibration, global Tier 1 values risk overestimating their contribution. The integration of Earth observation with robust machine learning classifiers and locally derived emission factors thus provides a more credible basis for national greenhouse gas inventories and for considering seagrass ecosystems within Cyprus climate mitigation strategies. Nevertheless, some limitations remain. The Sentinel-2 spatial resolution (10–20 m) may not capture fine-scale meadow fragmentation or patchy distributions, potentially biasing areal estimates. Moreover, while Tier 2 values represent a substantial improvement, they are based on limited field measurements and may not fully capture variability across meadow types and sedimentary environments. Future work should therefore focus on expanding field sampling, incorporating water column correction techniques for further refinement of seagrass mapping, and exploring higher-resolution sensors e.g., PlanetScope (Planet Labs PBC, San Francisco, CA, USA), WorldView (Ball Aerospace & Technologies Corp., Broomfield/Westminster, CO, USA) to improve extent estimates.
Finally, the site-specific method of Wesselmann et al. includes an associated error of 0.1 kg/m2. The authors provided carbon stock metrics for three different seagrass species: Posidonia oceanica (0.4 ± 0.1 kg/m2), Cymodocea nodosa (0.3 ± 0.1 kg/m2), and Halophila stipulacea (0.5 ± 0.1 kg/m2). Compared to the Western Mediterranean, the Corg stock in the Eastern Mediterranean is very low, due to severe nutrient deficiency. This nutrient scarcity is linked to the limited freshwater input, water scarcity, and dam construction, all of which reduce nutrient inflow to the coastal ecosystems.

4.5. A Conservation Tool

This research highlights the effectiveness of combining machine learning techniques, cloud computing, and large-scale satellite datasets with carbon metrics to produce reliable assessments in ecosystem carbon accounting. Notably, our findings represent the first estimation of Posidonia oceanica carbon stocks at a regional scale. This achievement significantly enhances the body of existing research by providing more detailed and comprehensive mapping, offering new insights into the spatial distribution and carbon storage capacity of these critical ecosystems. The methodologies employed here demonstrate great potential for application in similar studies, contributing to more robust assessments of blue carbon stocks and supporting informed conservation and management efforts. Within this framework, we can provide monitoring, protection, and conservation of those valuable species, taking into consideration the characteristics of Cyprus and cost-effective methods. It is very important to understand the dynamics of those ecosystems in the face of the ongoing climate change, to assess how these habitats are being affected, and to develop strategies to mitigate and adapt to these changes. At the same time, it should be noted that the use of a multi-year mosaic assumes relative stability in seagrass extent. While seagrass meadows in Cyprus are subject to threats from climate and anthropogenic pressures, the focus of this study was not the interannual variability but the development of a reliable baseline distribution map. Future studies can build on this baseline to perform seasonal or multi-annual monitoring supported by the scalability of the presented workflow.

4.6. Implications for Ecosystem Monitoring, Policy, and Future Research

The most important added value of the GEE is the scalability. As a part of GEE, big data analytics is a new cutting-edge technology provided by cloud computing, machine learning, and globally aggregated satellite data. In this case study, we provide an innovative cloud-based approach for the area of interest, which is transferable and scalable [30,42,55]. Within this application, we gained knowledge that can be transferred to other scientists and policy makers interested in this thematic area. The scalability can be translated into multidimensional scale—spatial and temporal—from local to regional areas, and from a seasonal to multi-annual period with different optical satellite sensors (e.g., Sentinel and Landsat series) as well as Space-based LiDAR data (e.g., ICESAT-2). This approach maximizes the benefits of using remote sensing techniques with the GEE platform, combined with field campaigns. At the same time, these two methods can work synergistically to provide an initial estimation of the spatial extent of coastal ecosystems, effectively complementing in situ campaigns and measurements. This synergy will lead to more effective and impactful scientific research and decision-making, particularly in areas such as climate change, blue carbon accounting and crediting, biodiversity monitoring, protection, conservation, and sustainable development. Overall, the presented workflow offers a scalable, transferable, and robust foundation for seagrass mapping, carbon stock accounting, and long-term ecosystem monitoring in the Eastern Mediterranean.

5. Conclusions

In this application case study, we provide a cloud-based geospatial analysis in GEE to map the extent of seagrass meadows and other types of coastal habitats in a regional case study of Cyprus. To achieve this target, we developed a custom-made algorithm that includes Otsu thresholding and machine learning classification techniques from GEE, such as RF and CART. The proposed methodological framework is scalable across space, time, and data, and is able to produce a sunglint and cloud-free 10 m Sentinel-2 composite. Our results reveal a mapped area of 15.55 km2 of seagrass patches (using the RF classifier—100 trees) within the 310 km2 study area along the southern coastline of Cyprus. This corresponds to estimated carbon stocks ranging from approximately 12,000 to 20,700 Mg C, based on both CART and RF classifications. The lower end of the range refers to 12,072 Mg C for CART with 50 nodes, while higher estimates are 20,676 Mg C with RF 50 trees, both derived from region-specific seagrass carbon data as part of a Tier 2 blue carbon assessment. Taking into consideration the variability and the complexity of the coastal environment, both classification algorithms have potential. The potential of these algorithms directly lies in their ability to map these critical ecosystems and indirectly lies in their ability to estimate carbon stocks and scale analyses across regions and timeframes, making them valuable for conservation, climate action, and sustainable development. The analysis targets the presence of three different coastal habitat classes: hard bottom (habitat 1170), soft bottom (habitat 1110), and seagrass (habitat 1120*). On the other hand, there are misclassifications and over/under under-estimations, for both classifiers, especially in the habitat of hard bottoms. We demonstrate a scalable, time-efficient and cost-effective cloud-based approach that can enable monitoring at various spatiotemporal scales. However, it is crucial to take in situ measurements to validate the accuracy of the procedures. These synergies, cloud-based techniques and in situ data can lead to more impactful and decisive scientific insights and decision-making regarding climate change, biodiversity monitoring, protection, and conservation, as well as sustainable development for the interconnected coastal ecosystem. This ecosystem encompasses vital elements such as seagrasses. In the future, with this valuable tool, we can accurately map and monitor these habitats, enabling early detection of ecosystem changes, better estimation of carbon stocks, and data-driven conservation strategies. This will strengthen efforts to mitigate and adapt to climate change, enhance coastal protection, and support sustainable development.

Author Contributions

D.M. designed the study, developed the reference data harmonization, co-designed and implemented the cloud-based Earth Observation framework, performed the Tier 1 and Tier 2 blue carbon accounting, created all figures and tables, and wrote the manuscript with input from all co-authors; S.C. annotated training data and co-designed the cloud-based Earth Observation framework with D.M.; D.P. contributed to the annotation of training data; D.T. conceived the original research idea and supervised the entire project, from conceptualization to manuscript completion. D.H., C.M. and N.S. reviewed and revised the manuscript, providing critical input and technical feedback. All authors have read and agreed to the published version of the manuscript.

Funding

This research was funded by ‘EXCELSIOR’ project (www.excelsior2020.eu, accessed on 25 July 2025) titled "ERATOSTHENES: Excellence Research Centre for Earth Surveillance and Space- Based Monitoring of the Environment" which has received funding from the European Union’s Horizon 2020 Research and Innovation Programme under Grant Agreement No.857510. It was also partially supported by the AI-OBSERVER project (https://ai-observer.eu, accessed on 25 July 2025) titled “Enhancing Earth Observation capabilities of the Eratosthenes Centre of Excellence on Disaster Risk Reduction through Artificial Intelligence”, which has received funding from the European Union’s Horizon Europe Framework Programme HORIZON-WIDERA-2021-ACCESS-03 (Twinning) under the Grant Agreement No. 101079468. DP was supported by the European Union’s Horizon Europe Research and Innovation program (project C-BLUES 101137844).

Data Availability Statement

The raw data supporting the conclusions of this article will be made available by the authors on request.

Acknowledgments

This research is part of the Ph.D. thesis of D.C., hosted at the Remote Sensing and Geo-Environment Lab of the Department of Civil Engineering and Geomatics, Cyprus University of Technology.The authors acknowledge the support of the "ERATOSTHENES: Excellence Research Centre for Earth Surveillance and Space-Based Monitoring of the Environment" - ‘EXCELSIOR’ project (www.excelsior2020.eu, accessed on 25 July 2025), which has received funding from the European Union’s Horizon 2020 Research and Innovation Programme under Grant Agreement No 857510, from the Government of the Republic of Cyprus through the Directorate General for European Programmes, Coordination and Development, and the Cyprus University of Technology. The authors, also, acknowledge the AI-OBSERVER project (https://ai-observer.eu, accessed on 25 July 2025) titled "Enhancing Earth Observation capabilities of the Eratosthenes Centre of Excellence on Disaster Risk Reduction through Artificial Intelligence", which has received funding from the European Union’s Horizon Europe Framework Programme HORIZON-WIDERA-2021-ACCESS-03 (Twinning) under the Grant Agreement No101079468." Finally, the authors, acknowledge the Department of Fisheries and Marine Research of Cyprus for providing the validation dataset, as well as the Department of Land and Surveys for providing the bathymetric data.

Conflicts of Interest

The authors declare no conflicts of interest.

References

  1. Coffer, M.M.; Graybill, D.D.; Whitman, P.J.; Schaeffer, B.A.; Salls, W.B.; Zimmerman, R.C.; Hill, V.; Lebrasse, M.C.; Li, J.; Keith, D.J.; et al. Providing a framework for seagrass mapping in United States coastal ecosystems using high spatial resolution satellite imagery. J. Environ. Manag. 2023, 337, 117669. [Google Scholar] [CrossRef]
  2. Waycott, M.; Duarte, C.M.; Carruthers, T.J.B.; Orth, R.J.; Dennison, W.C.; Olyarnik, S.; Calladine, A.; Fourqurean, J.W.; Heck, K.L.; Hughes, A.R.; et al. Accelerating loss of seagrasses across the globe threatens coastal ecosystems. Proc. Natl. Acad. Sci. USA 2009, 106, 12377–12381. [Google Scholar] [CrossRef]
  3. Potouroglou, M.; Bull, J.C.; Krauss, K.W.; Kennedy, H.A.; Fusi, M.; Daffonchio, D.; Mangora, M.M.; Githaiga, M.N.; Diele, K.; Huxham, M. Measuring the role of seagrasses in regulating sediment surface elevation. Sci. Rep. 2017, 7, 11917. [Google Scholar] [CrossRef] [PubMed]
  4. Agueda Aramburu, P.; Flecha, S.; Lujan-Williams, C.A.M.; Hendriks, I.E. Water column oxygenation by Posidonia oceanica seagrass meadows in coastal areas: A modelling approach. Sci. Total. Environ. 2024, 942, 173805. [Google Scholar] [CrossRef] [PubMed]
  5. Borum, J.; Sand-jensen, K.; Binzer, T.; Pedersen, O.; Hillerød, D.; Greve, T.M. Oxygen movement in seagrasses. In Seagrasses: Biology, Ecology and Conservation; Springer Nature: Dordrecht, The Netherlands, 2006; pp. 255–270. [Google Scholar]
  6. Heck, K.; Nadeau, D.; Thomas, R. The Nursery Role of Seagrass Beds. Gulf Mex. Sci. 1997, 15, 8. [Google Scholar] [CrossRef]
  7. Bianchi, T.S.; Argyrou, M.; Chippett, H.F. Contribution of vascular-plant carbon to surface sediments across the coastal margin of Cyprus (Eastern Mediterranean). Org. Geochem. 1999, 30, 287–297. [Google Scholar] [CrossRef]
  8. Belluscio, A.; Panayiotidis, P.; Gristina, M.; Knittweis, L.; Pace, M.L.; Telesca, L.; Criscoli, A.; Apostolaki, E.T.; Gerakaris, V.; Fraschetti, S.; et al. Seagrass beds distribution along the Mediterranean coasts. In Mediterranean Sensitive Habitats (MEDISEH) Final Report; Technical Report April; Hellenic Centre for Marine Research: Heraklion, Greece, 2013. [Google Scholar]
  9. Manh Nguyen, H.; Savva, I.; Kleitou, P.; Kletou, D.; Lima, F.P.; Sapir, Y.; Winters, G. Seasonal dynamics of native and invasive Halophila stipulacea populations—A case study from the northern Gulf of Aqaba and the eastern Mediterranean Sea. Aquat. Bot. 2020, 162, 103205. [Google Scholar] [CrossRef]
  10. Litsi-Mizan, V.; Efthymiadis, P.T.; Gerakaris, V.; Serrano, O.; Tsapakis, M.; Apostolaki, E.T. Decline of seagrass (Posidonia oceanica) production over two decades in the face of warming of the Eastern Mediterranean Sea. New Phytol. 2023, 239, 2126–2137. [Google Scholar] [CrossRef]
  11. McDonald, A.M.; McDonald, R.B.; Cebrian, J.; Sánchez Lizaso, J.L. Reconstructed life history metrics of the iconic seagrass Posidonia oceanica (L.) detect localized anthropogenic disturbance signatures. Mar. Environ. Res. 2023, 186, 105901. [Google Scholar] [CrossRef]
  12. Convention for the Protection of the Mediterranean Sea Against Pollution (Barcelona Convention). 1976. Available online: https://eur-lex.europa.eu/EN/legal-content/summary/barcelona-convention-for-the-protection-of-the-mediterranean.html (accessed on 1 March 2024).
  13. Convention on the Conservation of European Wildlife and Natural Habitats (Bern Convention). 1979. Available online: https://www.coe.int/en/web/conventions/full-list/-/conventions/treaty/104 (accessed on 1 March 2024).
  14. McKenzie, L.; Mellors, J. Seagrass-Watch: Guidelines for Monitoring Seagrass Habitats in the Burdekin Dry Tropics Region. In Proceedings of the Arcadian Junior Surf Life Saving Club, (DPI&F, Cairns), Townsville, QLD, Australia, 18 March 2007; 24p. [Google Scholar]
  15. Roelfsema, C.M.; Lyons, M.; Kovacs, E.M.; Maxwell, P.; Saunders, M.I.; Samper-Villarreal, J.; Phinn, S.R. Multi-temporal mapping of seagrass cover, species and biomass: A semi-automated object based image analysis approach. Remote. Sens. Environ. 2014, 150, 172–187. [Google Scholar] [CrossRef]
  16. Telesca, L.; Belluscio, A.; Criscoli, A.; Ardizzone, G.; Apostolaki, E.T.; Fraschetti, S.; Gristina, M.; Knittweis, L.; Martin, C.S.; Pergent, G.; et al. Seagrass meadows (Posidonia oceanica) distribution and trajectories of change. Sci. Rep. 2015, 5, 12505. [Google Scholar] [CrossRef] [PubMed]
  17. Traganos, D.; Aggarwal, B.; Poursanidis, D.; Topouzelis, K.; Chrysoulakis, N.; Reinartz, P. Towards Global-Scale Seagrass Mapping and Monitoring Using Sentinel-2 on Google Earth Engine: The Case Study of the Aegean and Ionian Seas. Remote. Sens. 2018, 10, 1227. [Google Scholar] [CrossRef]
  18. Topouzelis, K.; Makri, D.; Stoupas, N.; Papakonstantinou, A.; Katsanevakis, S. Seagrass mapping in Greek territorial waters using Landsat-8 satellite images. Int. J. Appl. Earth Obs. Geoinf. 2018, 67, 98–113. [Google Scholar] [CrossRef]
  19. Torres-Pulliza, D.; Wilson, J.R.; Darmawan, A.; Campbell, S.J.; Andréfouët, S. Ecoregional scale seagrass mapping: A tool to support resilient MPA network design in the Coral Triangle. Ocean. Coast. Manag. 2013, 80, 55–64. [Google Scholar] [CrossRef]
  20. Themistocleous, K.; Mettas, C.; Evagorou, E.; Hadjimitsis, D.G. The use of satellite remote sensing and UAV for the mapping of coastal areas for the use of marine spatial planning. In Proceedings of the Earth Resources and Environmental Remote Sensing/GIS Applications X, Strasbourg, France, 9–12 September 2019; Schulz, K., Michel, U., Nikolakopoulos, K.G., Eds.; SPIE: Bellingham, WA, USA, 2019; p. 36. [Google Scholar] [CrossRef]
  21. Makri, D.; Melillos, G.; Kalogirou, E.; Hadjimitsis, D. Seagrass mapping in Cyprus area of interest with pixel-based classification. In Proceedings of the Ocean Sensing and Monitoring XV, Orlando, FL, USA, 30 April–4 May 2023; Hou, W., Mullen, L.J., Eds.; SPIE: Bellingham, WA, USA, 2023; p. 19. [Google Scholar] [CrossRef]
  22. Kletou, D.; Kleitou, P.; Savva, I.; Attrill, M.J.; Charalambous, S.; Loucaides, A.; Hall-Spencer, J.M. Seagrass of Vasiliko Bay, Eastern Mediterranean: Lost Cause or Priority Conservation Habitat? J. Mar. Sci. Eng. 2020, 8, 717. [Google Scholar] [CrossRef]
  23. Pergent-Martini, C.; Pergent, G.; Monnier, B.; Boudouresque, C.F.; Mori, C.; Valette-Sansevin, A. Contribution of Posidonia oceanica meadows in the context of climate change mitigation in the Mediterranean Sea. Mar. Environ. Res. 2021, 165, 105236. [Google Scholar] [CrossRef]
  24. Leskovec, J.; Sosič, R. SNAP: A General-Purpose Network Analysis and Graph-Mining Library. ACM Trans. Intell. Syst. Technol. TIST 2016, 8, 1. [Google Scholar] [CrossRef]
  25. Macreadie, P.I.; Anton, A.; Raven, J.A.; Beaumont, N.; Connolly, R.M.; Friess, D.A.; Kelleway, J.J.; Kennedy, H.; Kuwae, T.; Lavery, P.S.; et al. The future of Blue Carbon science. Nat. Commun. 2019, 10, 3998. [Google Scholar] [CrossRef]
  26. Wang, X.; Tian, J.; Li, X.; Wang, L.; Gong, H.; Chen, B.; Li, X.; Guo, J. Benefits of Google Earth Engine in remote sensing. Natl. Remote. Sens. Bull. 2022, 26, 299–309. [Google Scholar] [CrossRef]
  27. Gorelick, N.; Hancher, M.; Dixon, M.; Ilyushchenko, S.; Thau, D.; Moore, R. Google Earth Engine: Planetary-scale geospatial analysis for everyone. Remote. Sens. Environ. 2017, 202, 18–27. [Google Scholar] [CrossRef]
  28. Velastegui-Montoya, A.; Montalván-Burbano, N.; Carrión-Mero, P.; Rivera-Torres, H.; Sadeck, L.; Adami, M. Google Earth Engine: A Global Analysis and Future Trends. Remote. Sens. 2023, 15, 3675. [Google Scholar] [CrossRef]
  29. Kumar, L.; Mutanga, O. Google Earth Engine Applications Since Inception: Usage, Trends, and Potential. Remote. Sens. 2018, 10, 1509. [Google Scholar] [CrossRef]
  30. Traganos, D.; Reinartz, P. Machine learning-based retrieval of benthic reflectance and Posidonia oceanica seagrass extent using a semi-analytical inversion of Sentinel-2 satellite data. Int. J. Remote. Sens. 2018, 39, 9428–9452. [Google Scholar] [CrossRef]
  31. Blume, A.; Pertiwi, A.P.; Lee, C.B.; Traganos, D. Bahamian seagrass extent and blue carbon accounting using Earth Observation. Front. Mar. Sci. 2023, 10, 1058460. [Google Scholar] [CrossRef]
  32. Roca, M.; Lee, C.B.; Pertiwi, A.P.; Blume, A.; Caballero, I.; Navarro, G.; Traganos, D. Subtidal seagrass and blue carbon mapping at the regional scale: A cloud-native multi-temporal Earth Observation approach. GiSci. Remote. Sens. 2025, 62, 2438838. [Google Scholar] [CrossRef]
  33. Eliades, M.; Michaelides, S.; Evagorou, E.; Fotiou, K.; Fragkos, K.; Leventis, G.; Theocharidis, C.; Panagiotou, C.F.; Mavrovouniotis, M.; Neophytides, S.; et al. Earth Observation in the EMMENA Region: Scoping Review of Current Applications and Knowledge Gaps. Remote. Sens. 2023, 15, 4202. [Google Scholar] [CrossRef]
  34. Bianchi, T.S.; Demetropoulos, A.; Hadjichristophorou, M.; Argyrou, M.; Baskaran, M.; Lambert, C. Plant Pigments as Biomarkers of Organic Matter Sources in Sediments and Coastal Waters of Cyprus (Eastern Mediterranean). Estuarine, Coast. Shelf Sci. 1996, 42, 103–115. [Google Scholar] [CrossRef]
  35. Tselepides, A.; Zervakis, V.; Polychronaki, T.; Danovaro, R.; Chronis, G. Distribution of nutrients and particulate organic matter in relation to the prevailing hydrographic features of the Cretan Sea (NE Mediterranean). Prog. Oceanogr. 2000, 46, 113–142. [Google Scholar] [CrossRef]
  36. Petrou, A.; Kallianiotis, A.; Hannides, A.K.; Charalambidou, I.; Hadjichristoforou, M.; Hayes, D.R.; Lambridis, C.; Lambridi, V.; Loizidou, X.I.; Orfanidis, S.; et al. Initial Assessment of the Marine Environment of Cyprus: Part I—Characteristics; Technical Report; Ministry of Agriculture, Natural Resources, and the Environment, Department of Fisheries and Marine Research: Nicosia, Cyprus, 2012.
  37. Department of Fisheries and Marine Research, Cyprus. The Marine Environment of Cyprus. 2025. Available online: https://www.moa.gov.cy/moa/dfmr/dfmr.nsf/0/6561CB64C528ECFA42257F370041F296?OpenDocument&print- (accessed on 27 August 2025).
  38. Fyttis, G.; Zervoudaki, S.; Sakavara, A.; Sfenthourakis, S. Annual cycle of mesozooplankton at the coastal waters of Cyprus (Eastern Levantine basin). J. Plankton Res. 2023, 45, 291–311. [Google Scholar] [CrossRef]
  39. Xevgenos, D.; Marcou, M.; Louca, V.; Avramidi, E.; Ioannou, G.; Argyrou, M.; Stavrou, P.; Mortou, M.; Küpper, F. Aspects of environmental impacts of seawater desalination: Cyprus as a case study. Desalin. Water Treat. 2021, 211, 15–30. [Google Scholar] [CrossRef]
  40. Zodiatis, G.; Lardner, R.; Hayes, D.R.; Georgiou, G.; Sofianos, S.; Skliris, N.; Lascaratos, A. Operational ocean forecasting in the Eastern Mediterranean: Implementation and evaluation. Ocean. Sci. 2008, 4, 31–47. [Google Scholar] [CrossRef]
  41. Retalis, A.; Katsanos, D.; Tymvios, F.; Michaelides, S. Comparison of GPM IMERG and TRMM 3B43 Products over Cyprus. Remote. Sens. 2020, 12, 3212. [Google Scholar] [CrossRef]
  42. Traganos, D.; Lee, C.B.; Blume, A.; Poursanidis, D.; Čižmek, H.; Deter, J.; Mačić, V.; Montefalcone, M.; Pergent, G.; Pergent-Martini, C.; et al. Spatially Explicit Seagrass Extent Mapping Across the Entire Mediterranean. Front. Mar. Sci. 2022, 9, 871799. [Google Scholar] [CrossRef]
  43. Baumstark, R.; Dixon, B.; Carlson, P.; Palandro, D.; Kolasa, K. Alternative spatially enhanced integrative techniques for mapping seagrass in Florida’s marine ecosystem. Int. J. Remote. Sens. 2013, 34, 1248–1264. [Google Scholar] [CrossRef]
  44. Poursanidis, D.; Katsanevakis, S. Mapping Subtidal Marine Forests in the Mediterranean Sea Using Copernicus Contributing Mission. Remote. Sens. 2025, 17, 2398. [Google Scholar] [CrossRef]
  45. Department of Lands and Surveys, Cyprus. Aerial Imagery; Unpublished dataset provided upon request; Department of Lands and Surveys: Nicosia, Cyprus, 2021.
  46. Google Earth Engine. ee.Image.stratifiedSample. Available online: https://developers.google.com/earth-engine/apidocs/ee-image-stratifiedsample (accessed on 1 March 2024).
  47. Department of Fisheries and Marine Research, Cyprus. Marine Dataset and Validation Data; Unpublished dataset provided upon request; Department of Fisheries and Marine Research: Nicosia, Cyprus, 2025.
  48. Department of Land and Surveys, Cyprus. Application Submission Status Portal; Department of Lands and Surveys: Nicosia, Cyprus, 2025.
  49. Ward, E.A.; Aldis, C.; Wade, T.; Miliou, A.; Tsimpidis, T.; Cameron, T.C. Is All Seagrass Habitat Equal? Seasonal, Spatial, and Interspecific Variation in Productivity Dynamics Within Mediterranean Seagrass Habitat. Front. Mar. Sci. 2022, 9, 891467. [Google Scholar] [CrossRef]
  50. Howard, J. Blue Carbon Manual—The Blue Carbon Initiative; Conservation International, Intergovernmental Oceanographic Commission of UNESCO, International Union for Conservation of Nature: Arlington, VA, USA, 2019; p. 860. [Google Scholar]
  51. Wesselmann, M.; Geraldi, N.R.; Duarte, C.M.; Garcia-Orellana, J.; Díaz-Rúa, R.; Arias-Ortiz, A.; Hendriks, I.E.; Apostolaki, E.T.; Marbà, N. Seagrass (Halophila stipulacea) invasion enhances carbon sequestration in the Mediterranean Sea. Global Change Biol. 2021, 27, 2592–2607. [Google Scholar] [CrossRef]
  52. Otsu, N. A Threshold Selection Method from Gray-Level Histograms. IEEE Trans. Syst. Man, Cybern. 1979, 9, 62–66. [Google Scholar] [CrossRef]
  53. Donchyts, G.; Schellekens, J.; Winsemius, H.; Eisemann, E.; Van de Giesen, N. A 30 m resolution surface water mask including estimation of positional and thematic differences using landsat 8, srtm and openstreetmap: A case study in the Murray-Darling Basin, Australia. Remote. Sens. 2016, 8, 386. [Google Scholar] [CrossRef]
  54. Xu, H. Modification of normalised difference water index (NDWI) to enhance open water features in remotely sensed imagery. Int. J. Remote. Sens. 2006, 27, 3025–3033. [Google Scholar] [CrossRef]
  55. Lee, C.B.; Martin, L.; Traganos, D.; Antat, S.; Baez, S.K.; Cupidon, A.; Faure, A.; Harlay, J.; Morgan, M.; Mortimer, J.A.; et al. Mapping the National Seagrass Extent in Seychelles Using PlanetScope NICFI Data. Remote. Sens. 2023, 15, 4500. [Google Scholar] [CrossRef]
  56. Richardson, G.; Foreman, N.; Knudby, A.; Wu, Y.; Lin, Y. Global deep learning model for delineation of optically shallow and optically deep water in Sentinel-2 imagery. Remote. Sens. Environ. 2024, 311, 114302. [Google Scholar] [CrossRef]
  57. Wang, Y.; He, X.; Bai, Y.; Li, T.; Wang, D.; Zhu, Q.; Gong, F. Satellite-Derived Bottom Depth for Optically Shallow Waters Based on Hydrolight Simulations. Remote. Sens. 2022, 14, 4590. [Google Scholar] [CrossRef]
  58. Meister, M.; Qu, J.J. Quantifying Seagrass Density Using Sentinel-2 Data and Machine Learning. Remote. Sens. 2024, 16, 1165. [Google Scholar] [CrossRef]
  59. Hamuna, B.; Pujiyati, S.; Gaol, J.L.; Hestirianoto, T. Spatial distribution of benthic habitats in Kapota Atoll (Wakatobi National Park, Indonesia) using remote sensing imagery. Biodiversitas J. Biol. Divers. 2023, 24, 3700–3707. [Google Scholar] [CrossRef]
  60. Poursanidis, D.; Traganos, D.; Teixeira, L.; Shapiro, A.; Muaves, L. Cloud-native seascape mapping of Mozambique’s Quirimbas National Park with Sentinel-2. Remote. Sens. Ecol. Conserv. 2021, 7, 275–291. [Google Scholar] [CrossRef]
  61. Bennett, M.K.; Younes, N.; Joyce, K. Automating Drone Image Processing to Map Coral Reef Substrates Using Google Earth Engine. Drones 2020, 4, 50. [Google Scholar] [CrossRef]
  62. Jin, Z.; Shang, J.; Zhu, Q.; Ling, C.; Xie, W.; Qiang, B. RFRSF: Employee Turnover Prediction Based on Random Forests and Survival Analysis. In Proceedings of the Web Information Systems Engineering—WISE 2020 (WISE 2020), Amsterdam, The Netherlands, 20–24 October 2020; pp. 503–515. [Google Scholar] [CrossRef]
  63. Congalton, R.G. Accuracy assessment and validation of remotely sensed and other spatial information. Int. J. Wildland Fire 2001, 10, 321. [Google Scholar] [CrossRef]
  64. Luque, A.; Carrasco, A.; Martín, A.; de las Heras, A. The impact of class imbalance in classification performance metrics based on the binary confusion matrix. Pattern Recognit. 2019, 91, 216–231. [Google Scholar] [CrossRef]
  65. Congalton, R.G.; Green, K. Assessing the Accuracy of Remotely Sensed Data: Principles and Practices; CRC Press: Boca Raton, FL, USA, 2019. [Google Scholar] [CrossRef]
  66. Evagorou, E.; Hasiotis, T.; Petsimeris, I.T.; Monioudi, I.N.; Andreadis, O.P.; Chatzipavlis, A.; Christofi, D.; Kountouri, J.; Stylianou, N.; Mettas, C.; et al. A Holistic High-Resolution Remote Sensing Approach for Mapping Coastal Geomorphology and Marine Habitats. Remote. Sens. 2025, 17, 1437. [Google Scholar] [CrossRef]
  67. Howard, J.; Hoyt, S.; Isensee, K.; Telszewski, M.; Pidgeon, E. (Eds.) Coastal Blue Carbon: Methods for Assessing Carbon Stocks and Emissions Factors in Mangroves, Tidal Salt Marshes, and Seagrasses; Conservation International, Intergovernmental Oceanographic Commission of UNESCO, International Union for Conservation of Nature: Arlington, VA, USA, 2014. [Google Scholar]
  68. Fang, X.; Li, X.; Zhang, Y.; Zhao, Y.; Qian, J.; Hao, C.; Zhou, J.; Wu, Y. Random forest-based understanding and predicting of the impacts of anthropogenic nutrient inputs on the water quality of a tropical lagoon. Environ. Res. Lett. 2021, 16, 055003. [Google Scholar] [CrossRef]
  69. Davies, B.F.R.; Oiry, S.; Rosa, P.; Zoffoli, M.L.; Sousa, A.I.; Thomas, O.R.; Smale, D.A.; Austen, M.C.; Biermann, L.; Attrill, M.J.; et al. Intertidal seagrass extent from Sentinel-2 time-series show distinct trajectories in Western Europe. Remote. Sens. Environ. 2024, 312, 114340. [Google Scholar] [CrossRef]
  70. Davies, B.F.R.; Gernez, P.; Geraud, A.; Oiry, S.; Rosa, P.; Zoffoli, M.L.; Barillé, L. Multi- and hyperspectral classification of soft-bottom intertidal vegetation using a spectral library for coastal biodiversity remote sensing. Remote. Sens. Environ. 2023, 290, 113554. [Google Scholar] [CrossRef]
  71. Gascon, F.; Bouzinac, C.; Thépaut, O.; Jung, M.; Francesconi, B.; Louis, J.; Lonjou, V.; Lafrance, B.; Massera, S.; Gaudel-Vacaresse, A.; et al. Copernicus Sentinel-2A Calibration and Products Validation Status. Remote. Sens. 2017, 9, 584. [Google Scholar] [CrossRef]
  72. Wilson, K.L.; Skinner, M.A.; Lotze, H.K. Eelgrass (Zostera marina) and Benthic Habitat Mapping in Atlantic Canada Using High-Resolution SPOT 6/7 Satellite Imagery. Estuarine, Coast. Shelf Sci. 2019, 226, 106292. [Google Scholar] [CrossRef]
  73. Papoutsa, C.; Retalis, A.; Scoullos, M.; Loizidou, M.; Argyrou, M.; Hadjimitsis, D.G. Image based analysis for assessing coastal water quality temporal and spatial variations in Limassol Harbor area in Cyprus. In Proceedings of the SPIE 8795, First International Conference on Remote Sensing and Geoinformation of the Environment (RSCy2013), Paphos, Cyprus, 8–10 April 2013; SPIE: Bellingham, WA, USA, 2013; Volume 8795, p. 879528. [Google Scholar] [CrossRef]
  74. Pottier, A.; Catry, T.; Trégarot, E.; Maréchal, J.P.; Fayad, V.; David, G.; Sidi Cheikh, M.; Failler, P. Mapping Coastal Marine Ecosystems of the National Park of Banc d’Arguin (PNBA) in Mauritania Using Sentinel-2 Imagery. Int. J. Appl. Earth Obs. Geoinf. 2021, 102, 102419. [Google Scholar] [CrossRef]
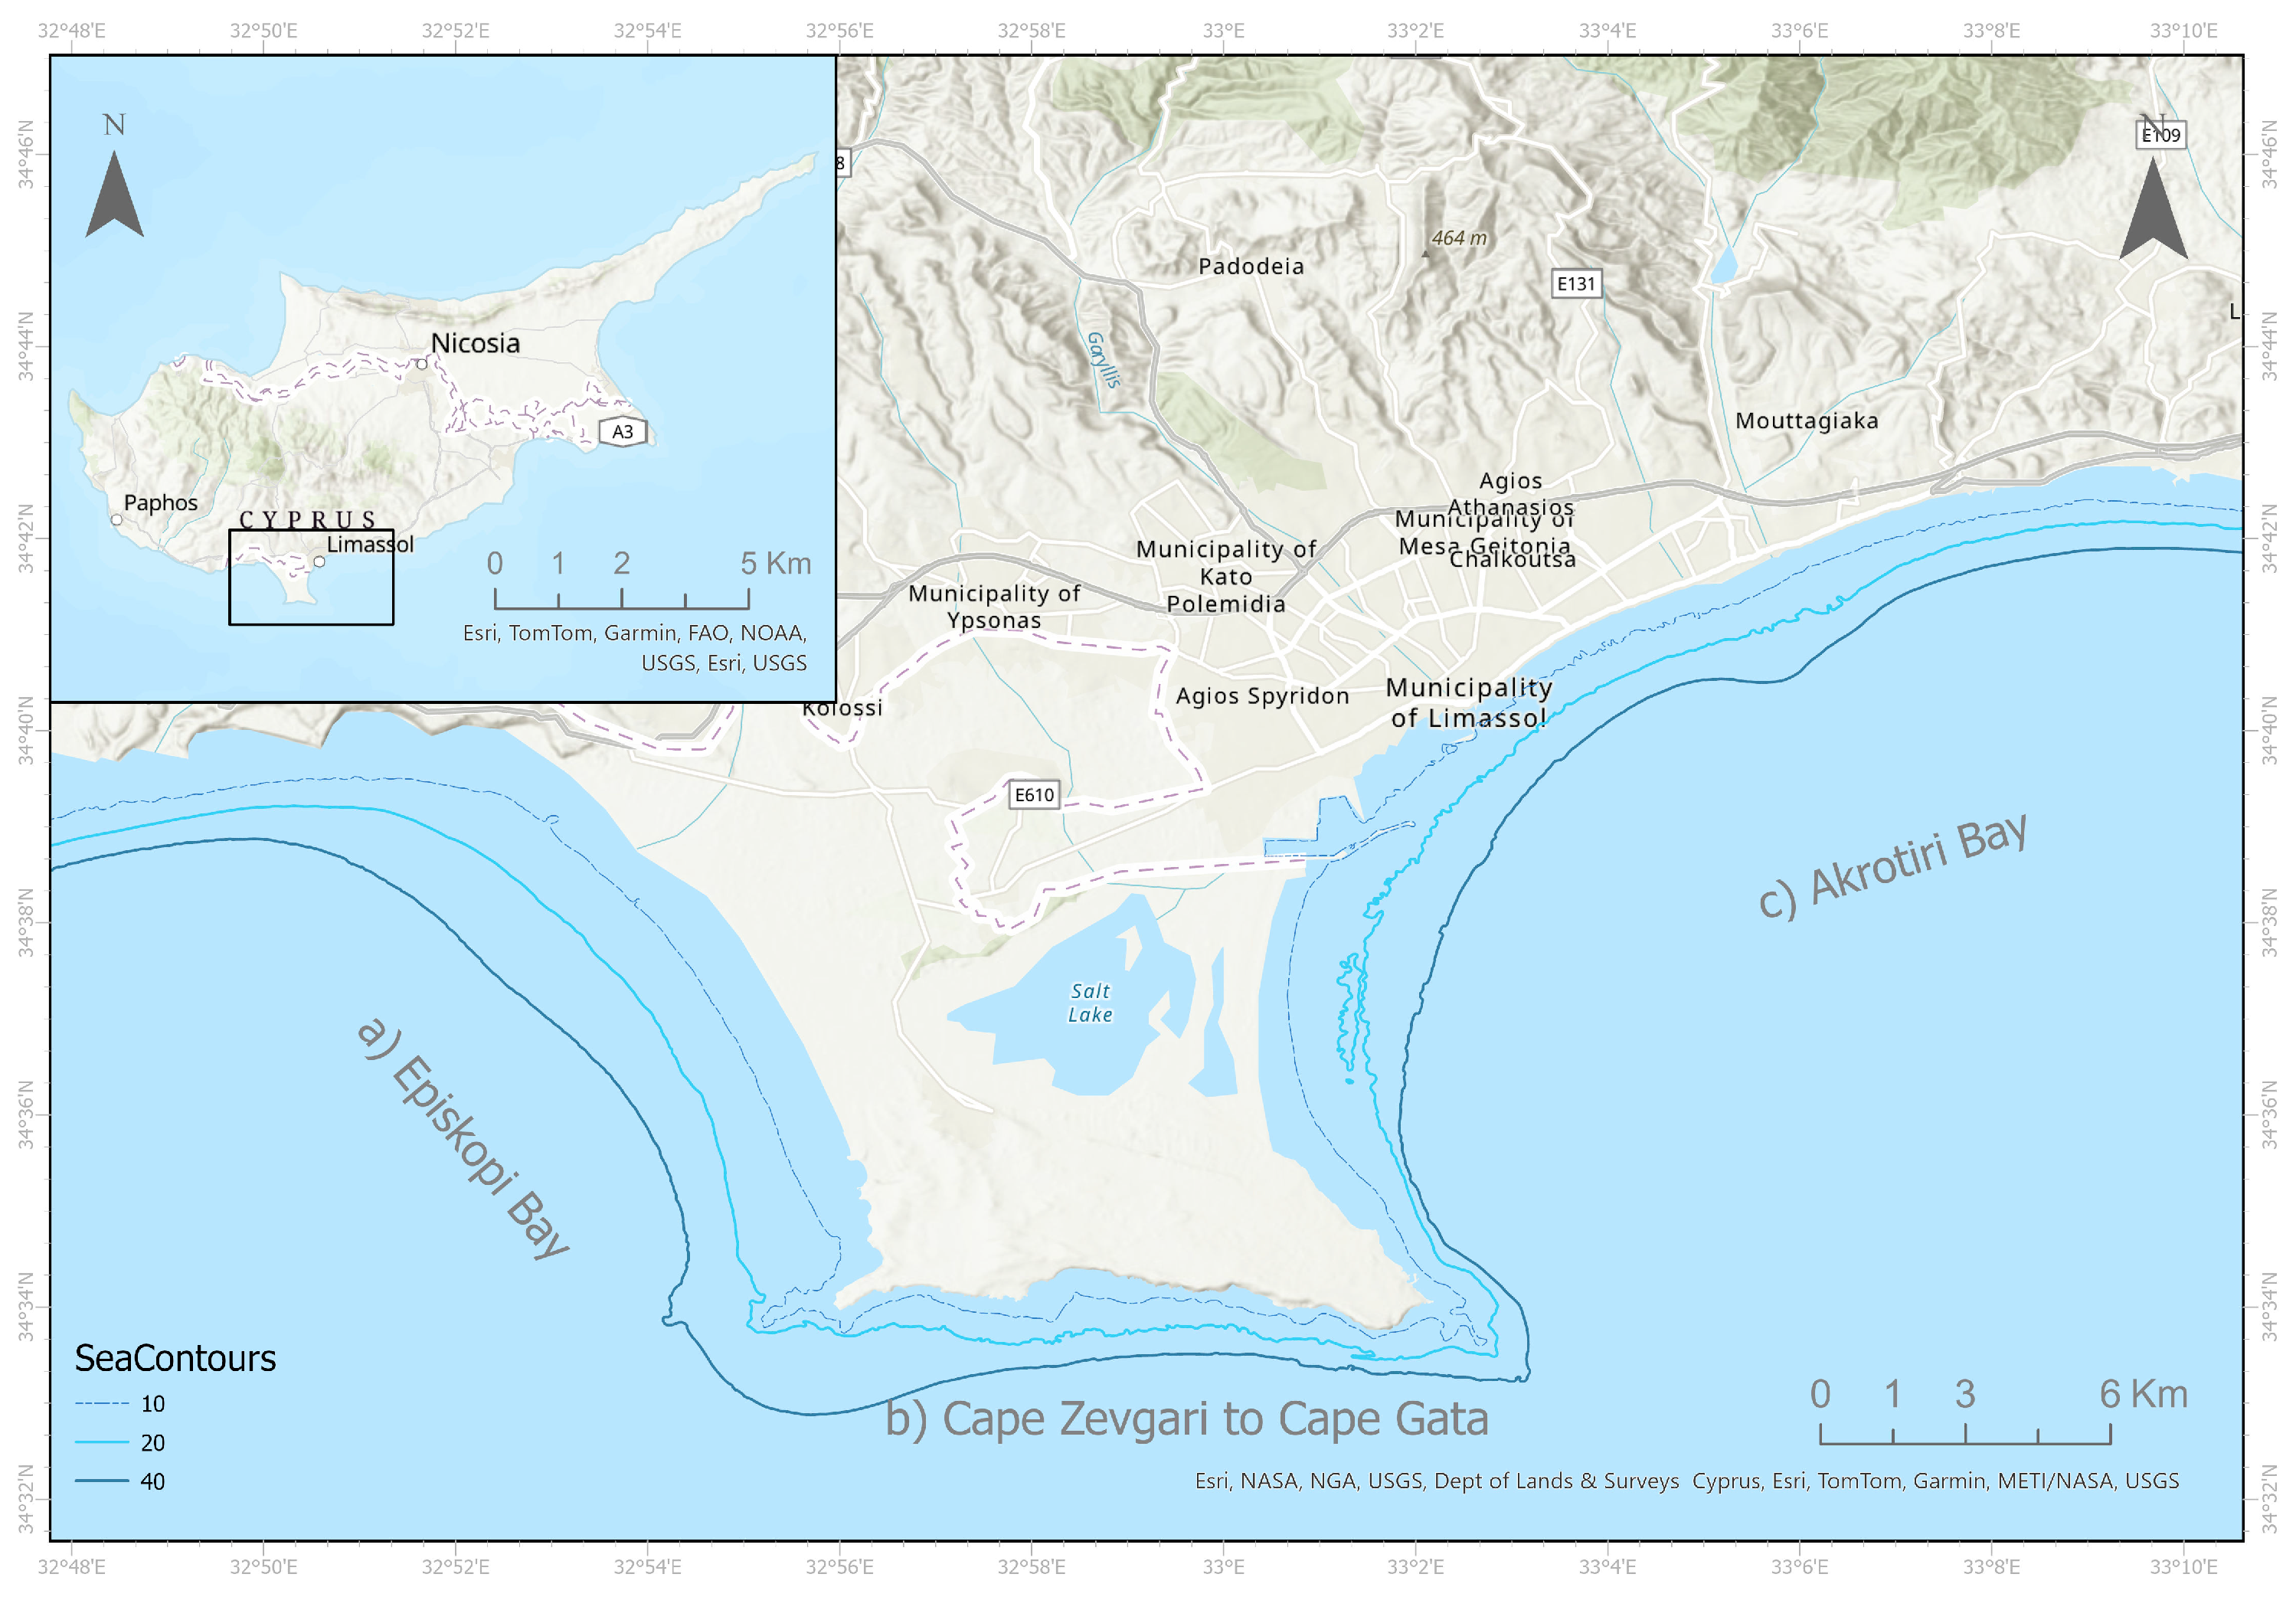
Figure 1. Map of the study area, divided into three distinct coastal extents: (a) Episkopi Bay (western section), (b) the coastline from Cape Zevgari to Cape Gata (central section), and (c) Akrotiri Bay (eastern section).
Remotesensing 17 03610 g001
Figure 2. Overview of the training dataset used in this case study, displaying the distribution of the four main desired classes.
Remotesensing 17 03610 g002
Figure 3. Methodological framework for the cloud-based seagrass mapping in the Google Earth Engine platform.
Remotesensing 17 03610 g003
Figure 4. Hard bottom (habitat 1170), soft bottom (habitat 1110), and seagrass (habitat 1120*− the asterisk indicates natural habitats in danger of disappearance under the Council Directive 92/43/EEC) distribution maps using the RF 100 trees (1), RF 50 trees (2), and CART 50 nodes (3), 100 nodes (4) classifiers. The different colors distinguish habitat types, and the maps allow comparison of spatial differences in habitat distribution captured by the different classifiers across the study area.
Remotesensing 17 03610 g004
Figure 5. Spectral curves of the main target classes—seagrass, soft bottoms, hard bottoms, and deep water. The curves represent the water-leaving reflectance values across all Sentinel-2 bands used in the analysis, highlighting the spectral similarities that make class separation challenging.
Remotesensing 17 03610 g005
Table 1. Distribution of training and validation data points across depth intervals. Training samples are concentrated in shallow waters (0–5 m), while validation samples are more evenly distributed across depth ranges.
Depth IntervalTraining DataValidation Data
0–5 m1500287
5–10 m0196
>10 m12282
Table 2. Comparison of total area mapped by different models.
Class NameCART (km2)RF (km2)
50 Nodes100 Nodes50 Trees100 Trees
Seagrass-optically vegetated areas10.0311.7117.2315.55
Optically Soft Bottoms44.1242.8944.3045.08
Optically Hard bottom7.226.7810.3110.29
Optically deep water247.61247.61238.09239.01
Table 3. Comparison of CART and RF Classifiers (50 vs. 100 nodes/trees).
Actual ClassSeagrassSoft BottomsHard BottomsDeep Water
50100501005010050100
CARTSeagrass (Class 1)1011242920362044
Soft Bottoms (Class 2)1633121103242511
Hard Bottoms (Class 3)35502920908400
Deep Water (Class 4)7700008181
RFSeagrass (Class 1)1171182422293000
Soft Bottoms (Class 2)1513118120282811
Hard Bottoms (Class 3)40371919959800
Deep Water (Class 4)2200008686
Producer’s Accuracy (%)CART60.472.975.763.658.454.592.092.0
RF68.869.472.874.061.763.697.797.7
User’s Accuracy (%)CART63.557.967.672.060.064.094.094.2
RF67.269.473.374.562.562.898.898.8
F1-score (%)CART61.964.571.467.559.258.993.093.1
RF68.069.473.074.262.163.298.298.2
Overall Accuracy (%)CART68.5/68.3
RF72.5/73.5
Table 4. Matthews Correlation Coefficient (MCC) per class for CART and RF classifiers.
ModelSeagrassSandReefsDeep
CART (50 nodes)0.460.590.450.92
CART (100 nodes)0.480.560.460.92
RF (50 trees)0.540.630.480.98
RF (100 trees)0.570.640.500.98
Table 5. Tier 1 and Tier 2 carbon stock estimates for the classified extent of the seagrass ecosystem. Carbon stocks are presented in megagrams (Mg). Tier 1 values are derived from country-scale estimates based on Howard et al. [67], while Tier 2 values are informed by site-specific assessments following Wesselmann et al. [51].
Carbon Stock (Mg/km2)
Tier 1 Tier 2
MinMaxMean
CART50 nodes9155.87834,090.06108,663.1212,072
CART100 nodes10,677.03972,665.70126,716.4014,076
RF50 trees15,681.851428,599.12186,114.2420,676
RF100 trees14,150.501,289,095.00167,940.0018,660
Table 6. Summary of recent seagrass classification studies in the Mediterranean and other regions, including study area, methods, and accuracy metrics.
ResearchStudy AreaMethodsAccuracy Metrics
[32]Balearic Islands (Western Mediterranean)Multi-temporal composite (2016–2022) + Google Earth Engine + Random Forest + optimized bathymetry (SDB)92.5% (OA), 91.7% (PA), 94.8% (UA)
[69]6 intertidal sites, Western EuropeNeural network0.82 (pixel-level accuracy for seagrass)
[70]Western AtlanticRandom Forest, XGBoost and Multinomial ClassifiersSentinel-2 10 m (4 bands) 0.835; Sentinel-2 20 m (8 bands) 0.95; PRISMA (56 bands) 0.951 ± 0.0061
[42]22 Mediterranean countries (bioregional scale)Cloud-native geoprocessing + ML (RF) with 62,928 labeled pixels + 2480 independent field pointsSentinel-2 20 m (8 bands) 0.95; PRISMA (56 bands, 30 m) 0.951 ± 0.0061; 72%,  55% PA (for P. oceanica);  62% UA;  0.58 (derived from PA/UA)
Disclaimer/Publisher’s Note: The statements, opinions and data contained in all publications are solely those of the individual author(s) and contributor(s) and not of MDPI and/or the editor(s). MDPI and/or the editor(s) disclaim responsibility for any injury to people or property resulting from any ideas, methods, instructions or products referred to in the content.