Article

Evaluating the German Ground Motion Service for Operational Dam Monitoring: A Comparison of InSAR Data with In Situ Measurements

1
Department for Earth Observation, Institute of Geography, Friedrich Schiller University Jena, Leutragraben 1, 07743 Jena, Germany
2
Department for Water Economy, Ruhrverband, Kronprinzenstraße 37, 45128 Essen, Germany
3
Federal Institute for Geosciences and Natural Resources, Stilleweg 2, 30655 Hannover, Germany
4
Institute of Data Science, German Aerospace Center, Maelzerstraße 3–5, 07745 Jena, Germany
*
Author to whom correspondence should be addressed.
Remote Sens. 2025, 17(21), 3649; https://doi.org/10.3390/rs17213649
Submission received: 9 September 2025 / Revised: 17 October 2025 / Accepted: 4 November 2025 / Published: 5 November 2025
(This article belongs to the Special Issue Dam Stability Monitoring with Satellite Geodesy II)

Highlights

What are the main findings?
  • A versioned comparison of BBD PSI (2015–2020 vs. 2015–2021) shows fewer PS points in the 2021 dataset but equal or higher agreement with in-situ measurements for long-term trends, with clear geometry effects (ascending > descending; decomposed products more sensitive).
  • For long-term deformation, PSI shows stronger agreement with plumb-line measurements than with trigonometric/levelling campaign data (best cases reaching r ≈ 0.8), while accuracy varies with viewing geometry and dam type.
What are the implications of the main findings?
  • BBD PSI is suitable for operational support (not a full replacement): it can complement DIN-aligned programs for long-term trend assessment, while limitations remain for vertical component accuracy and update frequency.
  • Operational practice should include regular reassessment of PS coverage and site-specific selection of orbit geometry (ascending vs. descending) informed by the dam’s geographic orientation (e.g., wall azimuth, slope aspect) and local topography.

Abstract

This study evaluates the applicability of Sentinel-1 Persistent Scatterer Interferometry (PSI) data from the Ground Motion Service Germany (BBD) for monitoring dams by comparing it with terrestrial measurements at dams of the Ruhrverband in North Rhine-Westphalia (NRW), Germany. The analysis focuses on the accuracy and reliability of BBD data in detecting movements, considering two observation periods and two satellite observation geometries (Ascending and Descending orbit). BBD data showed high correlations with in situ measurements, particularly for long-term deformation trends. However, weak correlations are observed, especially in the Ascending direction. These inconsistencies highlight the influence of structural characteristics of the dams, observation conditions like incidence angles and changes of the study period on data reliability. Key findings show that BBD data provides valuable insights for observing long-term deformation trends (r up to 0.7) but has limitations in capturing short-term deformations due to its annual update rate. A clear difference was observed when extending the observation period by one year, from 2015–2020 to 2015–2021: although the number of PS (Persistent Scatterers) decreased by up to 60%, the PS showed an improved agreement with in situ measurements, indicating higher data quality (r up to 0.8). However, the precision of BBD data depends on inherent factors from the PSI method such as the satellites’ observation geometry, observation period, and site-specific conditions, underscoring the importance of tailored feasibility assessments. The BBD offers a complementary tool to support the maintenance and safety of dam infrastructures. The study follows an observational multi-site design with predefined, DIN-aligned evaluation criteria and statistical tests and is intended as an assessment of operational support rather than a full operational qualification, outlining conditions under which BBD PSI can complement standards-aligned monitoring.

1. Introduction

Dams are critical infrastructures for water supply, hydropower, and flood control. Their structural integrity must be assured through monitoring programs that are adequate to purpose and traceable to standards (e.g., DIN 19700-10 [1] for dam safety in Germany). Traditional geodetic techniques (e.g., plumb systems or trigonometry) provide high-precision observations but are limited in spatial coverage and temporal sampling, which motivates complementary, wide-area deformation measurements to support maintenance and safety [2,3].
Satellite-based Persistent Scatterer Interferometry (PSI) offers millimeter-per-year sensitivity with broad spatial coverage and regular revisits [4,5]. With the European Space Agency (ESA) Sentinel-1 mission and systematic, wide-area processing by Ground Motion Services (GMS), analysis-ready PSI time series have become publicly available. In Germany, the BodenBewegungsdienst (BBD) has provided PSI products since 2019 for the period 2015–2021 with 6–12-day acquisition intervals [6,7]. These data provide critical insights into the structural behavior and deformation characteristics of various infrastructures over time, including, but not limited to, dams. Despite this progress, most published studies to date, such as [8], have focused on single-dam analyses, leaving the integration of PSI data into routine, operational monitoring largely unexplored. Similar continental-scale products are offered by the European Ground Motion Service (EGMS) with annual updates since 2022 [9]. While numerous studies have demonstrated the capability of synthetic aperture radar (SAR) and multi-temporal differential interferometric SAR (DInSAR) for monitoring dam deformations [2,10,11,12,13,14], most relied on custom processing. Evidence for the operational use of analysis-ready PSI in routine dam monitoring, aligned with DIN-compliant requirements on observables, frequency, accuracy, interpretability, and documentation, remains limited [15,16]. Comparable applications beyond Germany include the Mosul Dam (Iraq) [10], the Pertusillo Dam (Italy) [11], the Three Gorges Dam (China) [12], and embankment dams in southern Spain [11], underscoring the global relevance of PSI for dam monitoring.
This study addresses that gap by evaluating the operational feasibility and consistency of BBD PSI for six dams in Germany. Two BBD data versions are analyzed (2015–2020 and 2015–2021) to (i) quantify changes in PS point density and coverage, (ii) assess impacts on deformation behavior and statistical reliability, and (iii) determine the agreement with in situ measurements (plumb and trigonometry) across dam types, geometries (ascending/descending), and decomposed motion products (East–West, vertical). Feasibility criteria and practical conditions under which BBD PSI can complement DIN-oriented monitoring are also discussed.
This study presents a versioned comparison of BBD PSI (2015–2020 vs. 2015–2021) across six dams to quantify effects on PS availability and time-series stability, alongside a quantitative evaluation against in situ references (plumb and trigonometry) across orbits and decomposed motion components. Based on these results, operational guidance is formulated that aligns PSI feasibility with DIN 19700-10 considerations [1], such as observable comparability, update frequency, and uncertainty. It is acknowledged that annual updates limit the detection of short-term changes and that PS availability cannot be guaranteed; depending on local conditions, individual processing or auxiliary measures (e.g., reflectors) may be required. Within these bounds, the analysis outlines when and how BBD PSI can strengthen routine, standards-aligned dam monitoring, bringing the field a step closer to operational dam monitoring. In this sense, “operational” is understood as operational support: PSI-based information that is compatible with DIN-aligned practice and can augment, but not replace, established in situ techniques. In line with these objectives, the analysis is guided by three overarching questions concerning coverage sufficiency at the dam scale, DIN-aligned agreement with in situ measurements, and stability across service versions (2015–2020 vs. 2015–2021).

2. Materials and Methods

This chapter outlines the methodology of the present study. It is divided into three sections: First, the study area is described to define the spatial and thematic context of the analysis. Second, the datasets used for this study are introduced, including two BBD datasets, which differ in their observation period. These datasets are complemented by in situ measurements provided by the Ruhrverband. Finally, the statistical workflow is presented, with a focus on the comparative analysis between satellite-based and terrestrial observations, as well as between the two BBD datasets.

2.1. Study Area

The study focuses on six dams managed by the Ruhrverband, a water management organization based in North Rhine-Westphalia (NRW), Germany. The jurisdiction of the Ruhrverband and the locations of its major rivers and reservoirs are shown in Figure 1. Among its infrastructure, the largest reservoirs include four gravity dams (Möhne, Fürwigge, Lister, Ennepe) and four embankment dams (Sorpe, Henne, Verse, Bigge). These dams supply water to the Ruhr River, which ultimately discharges into the Rhine near Duisburg.
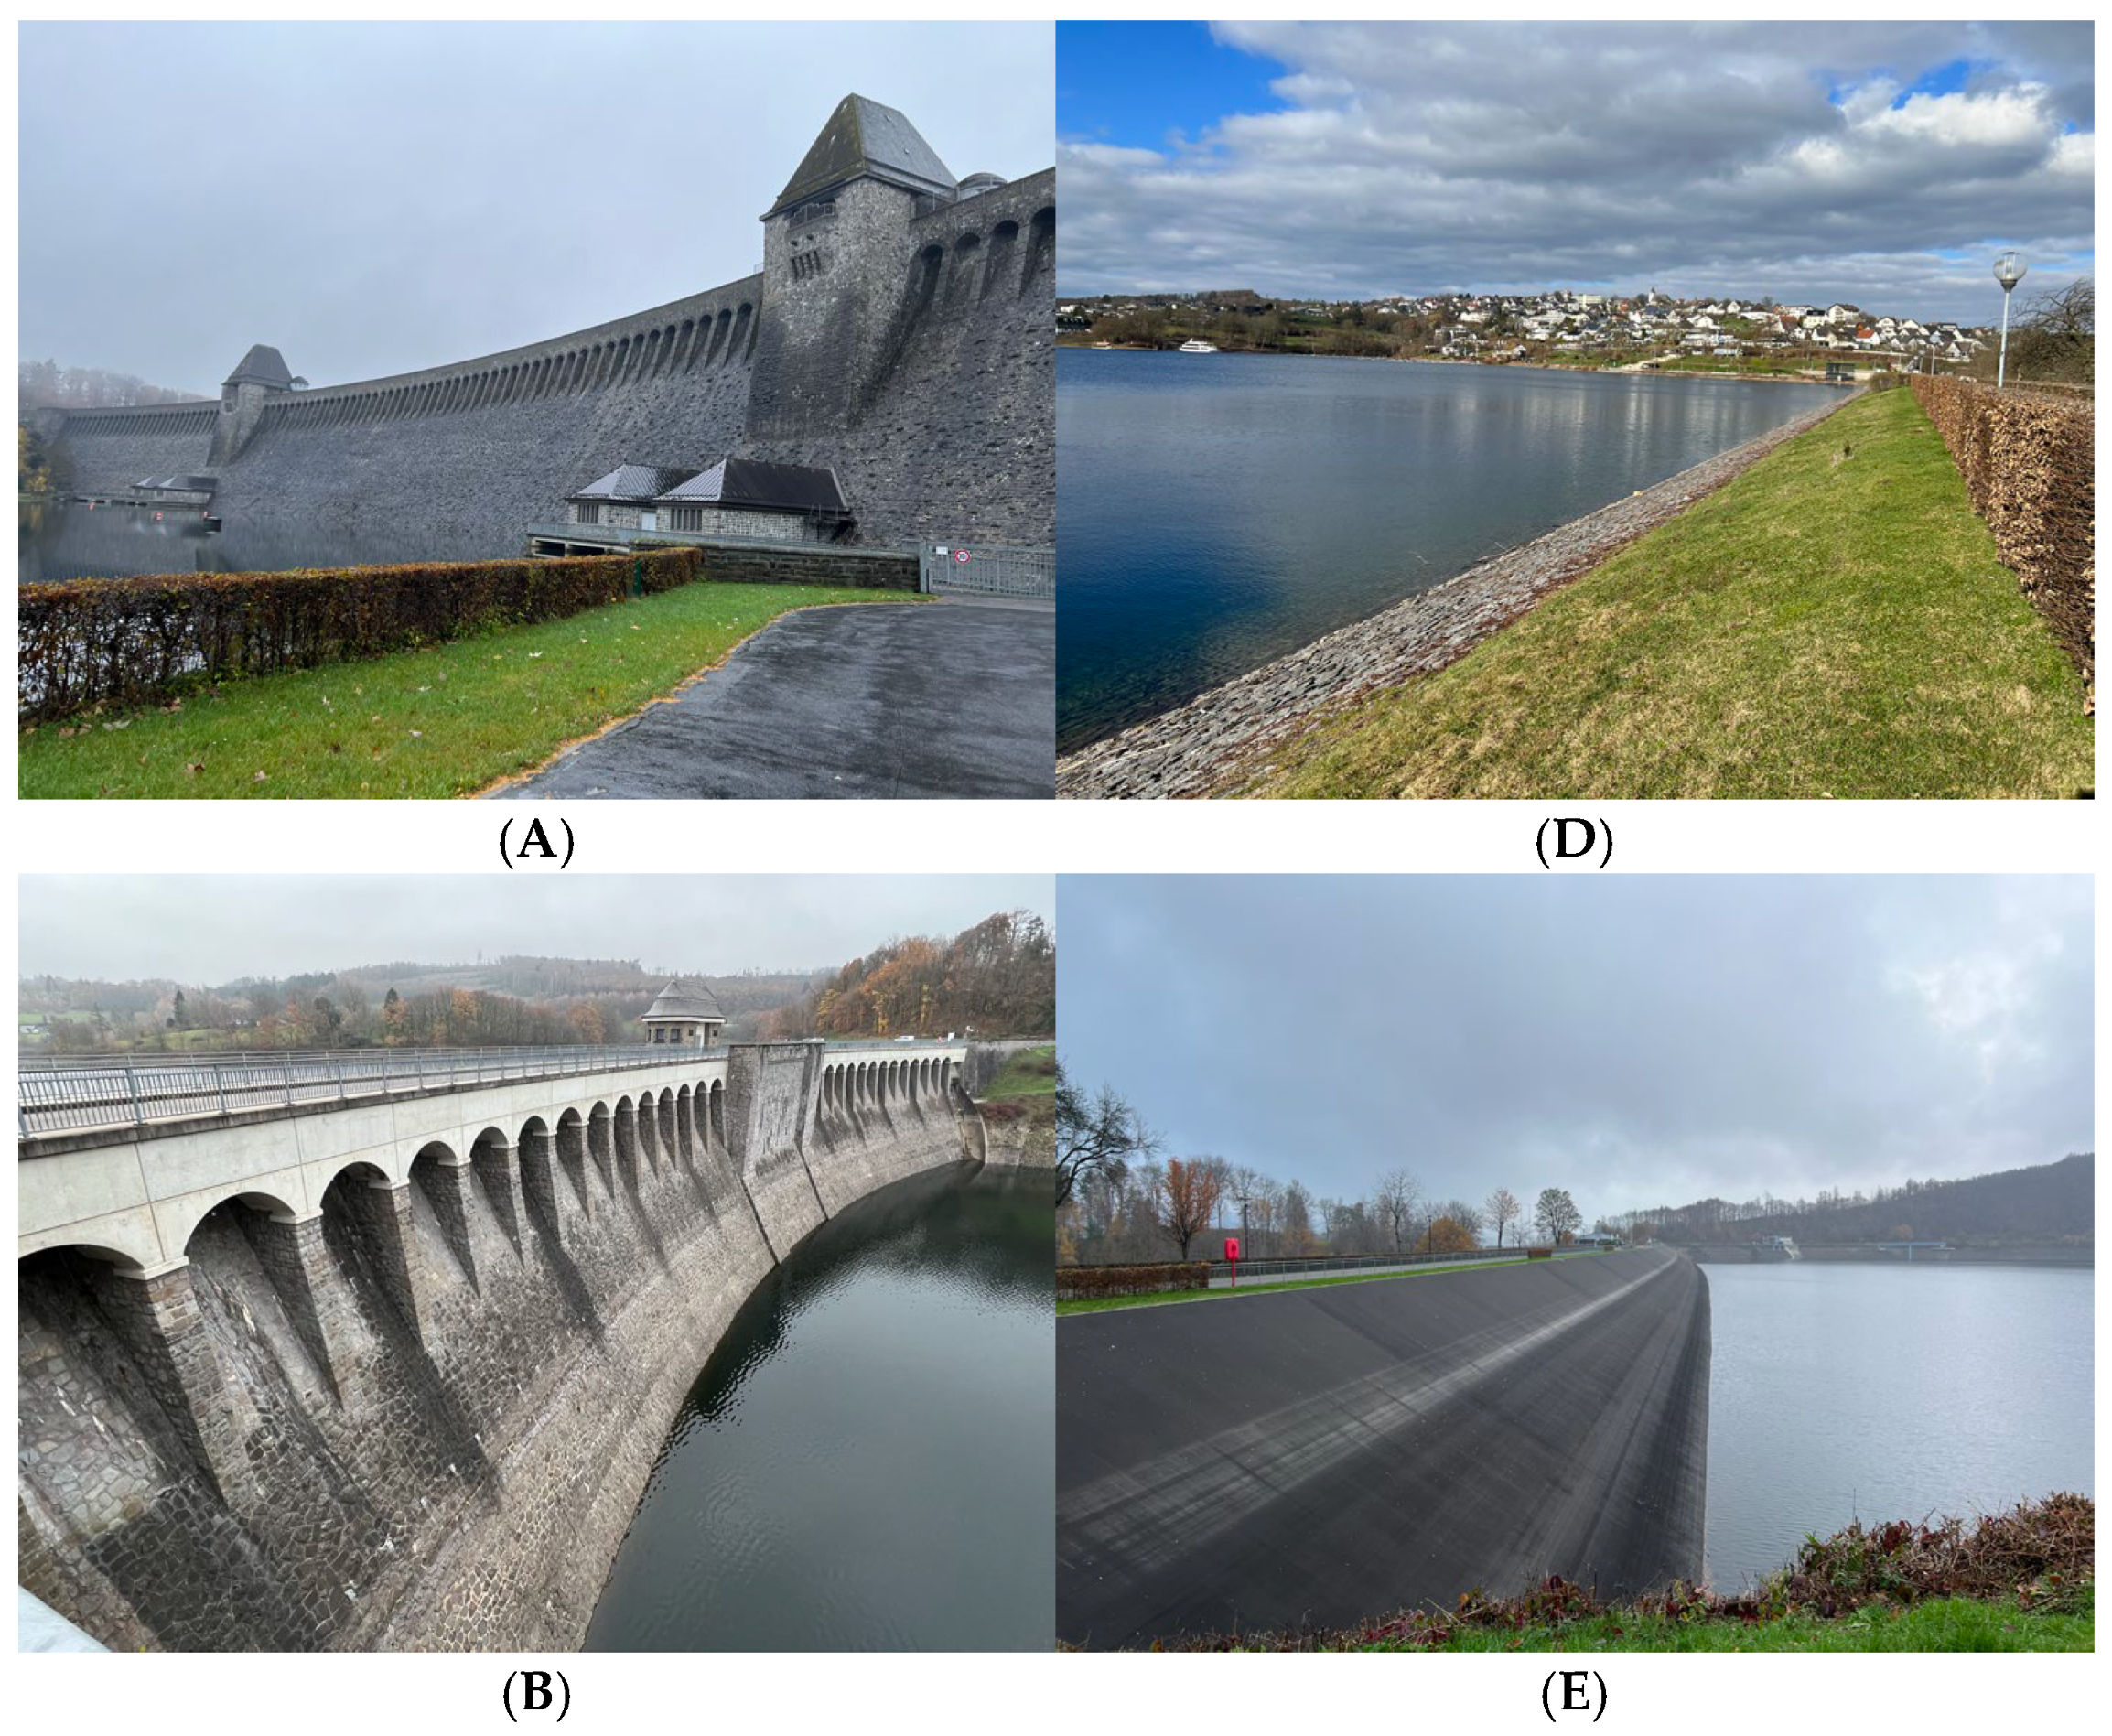
This study analyzes six of these dams, depicted in Figure 2. They include three gravity dams (Möhne, Lister, and Fürwigge) and three embankment dams (Sorpe, Bigge, and Verse). The Möhne Dam, located in the Arnsberg Forest Nature Park, is 40 m high with a crest length of 650 m, and plays a key role in regional water supply and flood control [17,18,19]. The Fürwigge Dam is a smaller gravity structure, measuring 24.6 m in height and 166 m in crest length [20,21]. The Lister Dam stands 42 m tall and spans 264 m along the crest. Both Fürwigge and Lister serve as forebay dams to the downstream Verse and Bigge reservoirs, respectively [22,23].
The embankment dams differ structurally but are equally vital to regional water management. The Bigge Dam, the largest structure in this study, is 52 m high and 640 m long, forming one of the most significant reservoirs in the region [22,23]. In contrast, the Verse Dam is comparatively smaller, with a height of 62 m and a crest length of 320 m [24,25]. The Sorpe Dam stands 60 m high with a 700 m crest length [26,27].
Together, these dams cover a range of structural types, sizes, and hydrological settings and serve as examples for assessing the applicability of ground motion data in dam monitoring. All six sites are equipped with monitoring infrastructure, including trigonometric survey networks and, where applicable, plumb line systems, which are installed only at the gravity dams Möhne and Fürwigge to ensure operational safety and long-term reliability.

2.2. Data

The analysis is based on two PSI datasets provided by the BBD [6,7], covering different observation periods. The first dataset ends in December 2020 and serves as a baseline for assessing temporal changes in point density, deformation behavior, and data consistency. The second dataset extends the observation period to December 2021.
Both datasets are based on the PSI technique using ESA’s Sentinel-1 data and are provided via the BBD WebGIS platform. They include time series from both Ascending and Descending orbits, as well as decomposed products for Vertical and East–West displacements. Vertical and East–West components were taken from the 50 m BBD decomposition product. Values are aggregated per grid cell from PS time series, and map symbols indicate grid cell centroids (not individual PS locations). The revisit interval ranges between 6 and 12 days, with annual updates [6,7].
The two datasets were analyzed separately to evaluate potential differences in the number and spatial distribution of PS points, as well as in the temporal consistency of deformation signals. For both time periods, all available PS Line-of-Sight (LOS) time series and decomposed products were extracted and used for comparative analysis. A summary of the stack characteristics for both datasets is provided in Table 1.
The in situ measurements used in this study were provided by the Ruhrverband [17,18,19,20,21,22,23,24,25,26,27] and comprise two types of geodetic monitoring techniques: plumb systems and trigonometric measurements. An overview of their distribution and measurement frequency is presented in Table 2.
Plumb systems are installed exclusively on two gravity dams (Möhne and Fürwigge), where they provide daily radial deformation data. At the Möhne Dam, one plumb point is operational, while the Fürwigge Dam hosts two. Trigonometric surveys are performed semi-annually at the gravity dams and annually at the embankment dams, yielding additional deformation data from 5 to 27 measurement points per structure. Figure 3 illustrates the distribution of geodetic measurement points along the Möhne Dam at three different elevation levels (numbers from 41 to 67), serving as a representative example. The distribution of measurement points at the other dams is similar. The plumb line is located at the center of the dam [17]. At the Fürwigge Dam, where two plumb line systems are installed, they are positioned closer to the lateral sections of the dam crest [21]. Together, these in situ datasets provide spatially distributed and temporally consistent ground-truth information that is used to evaluate the accuracy and interpretability of the satellite-based PSI data from both BBD datasets. The methodology for this comparative analysis is described in the following section.

2.3. Statistical Analysis

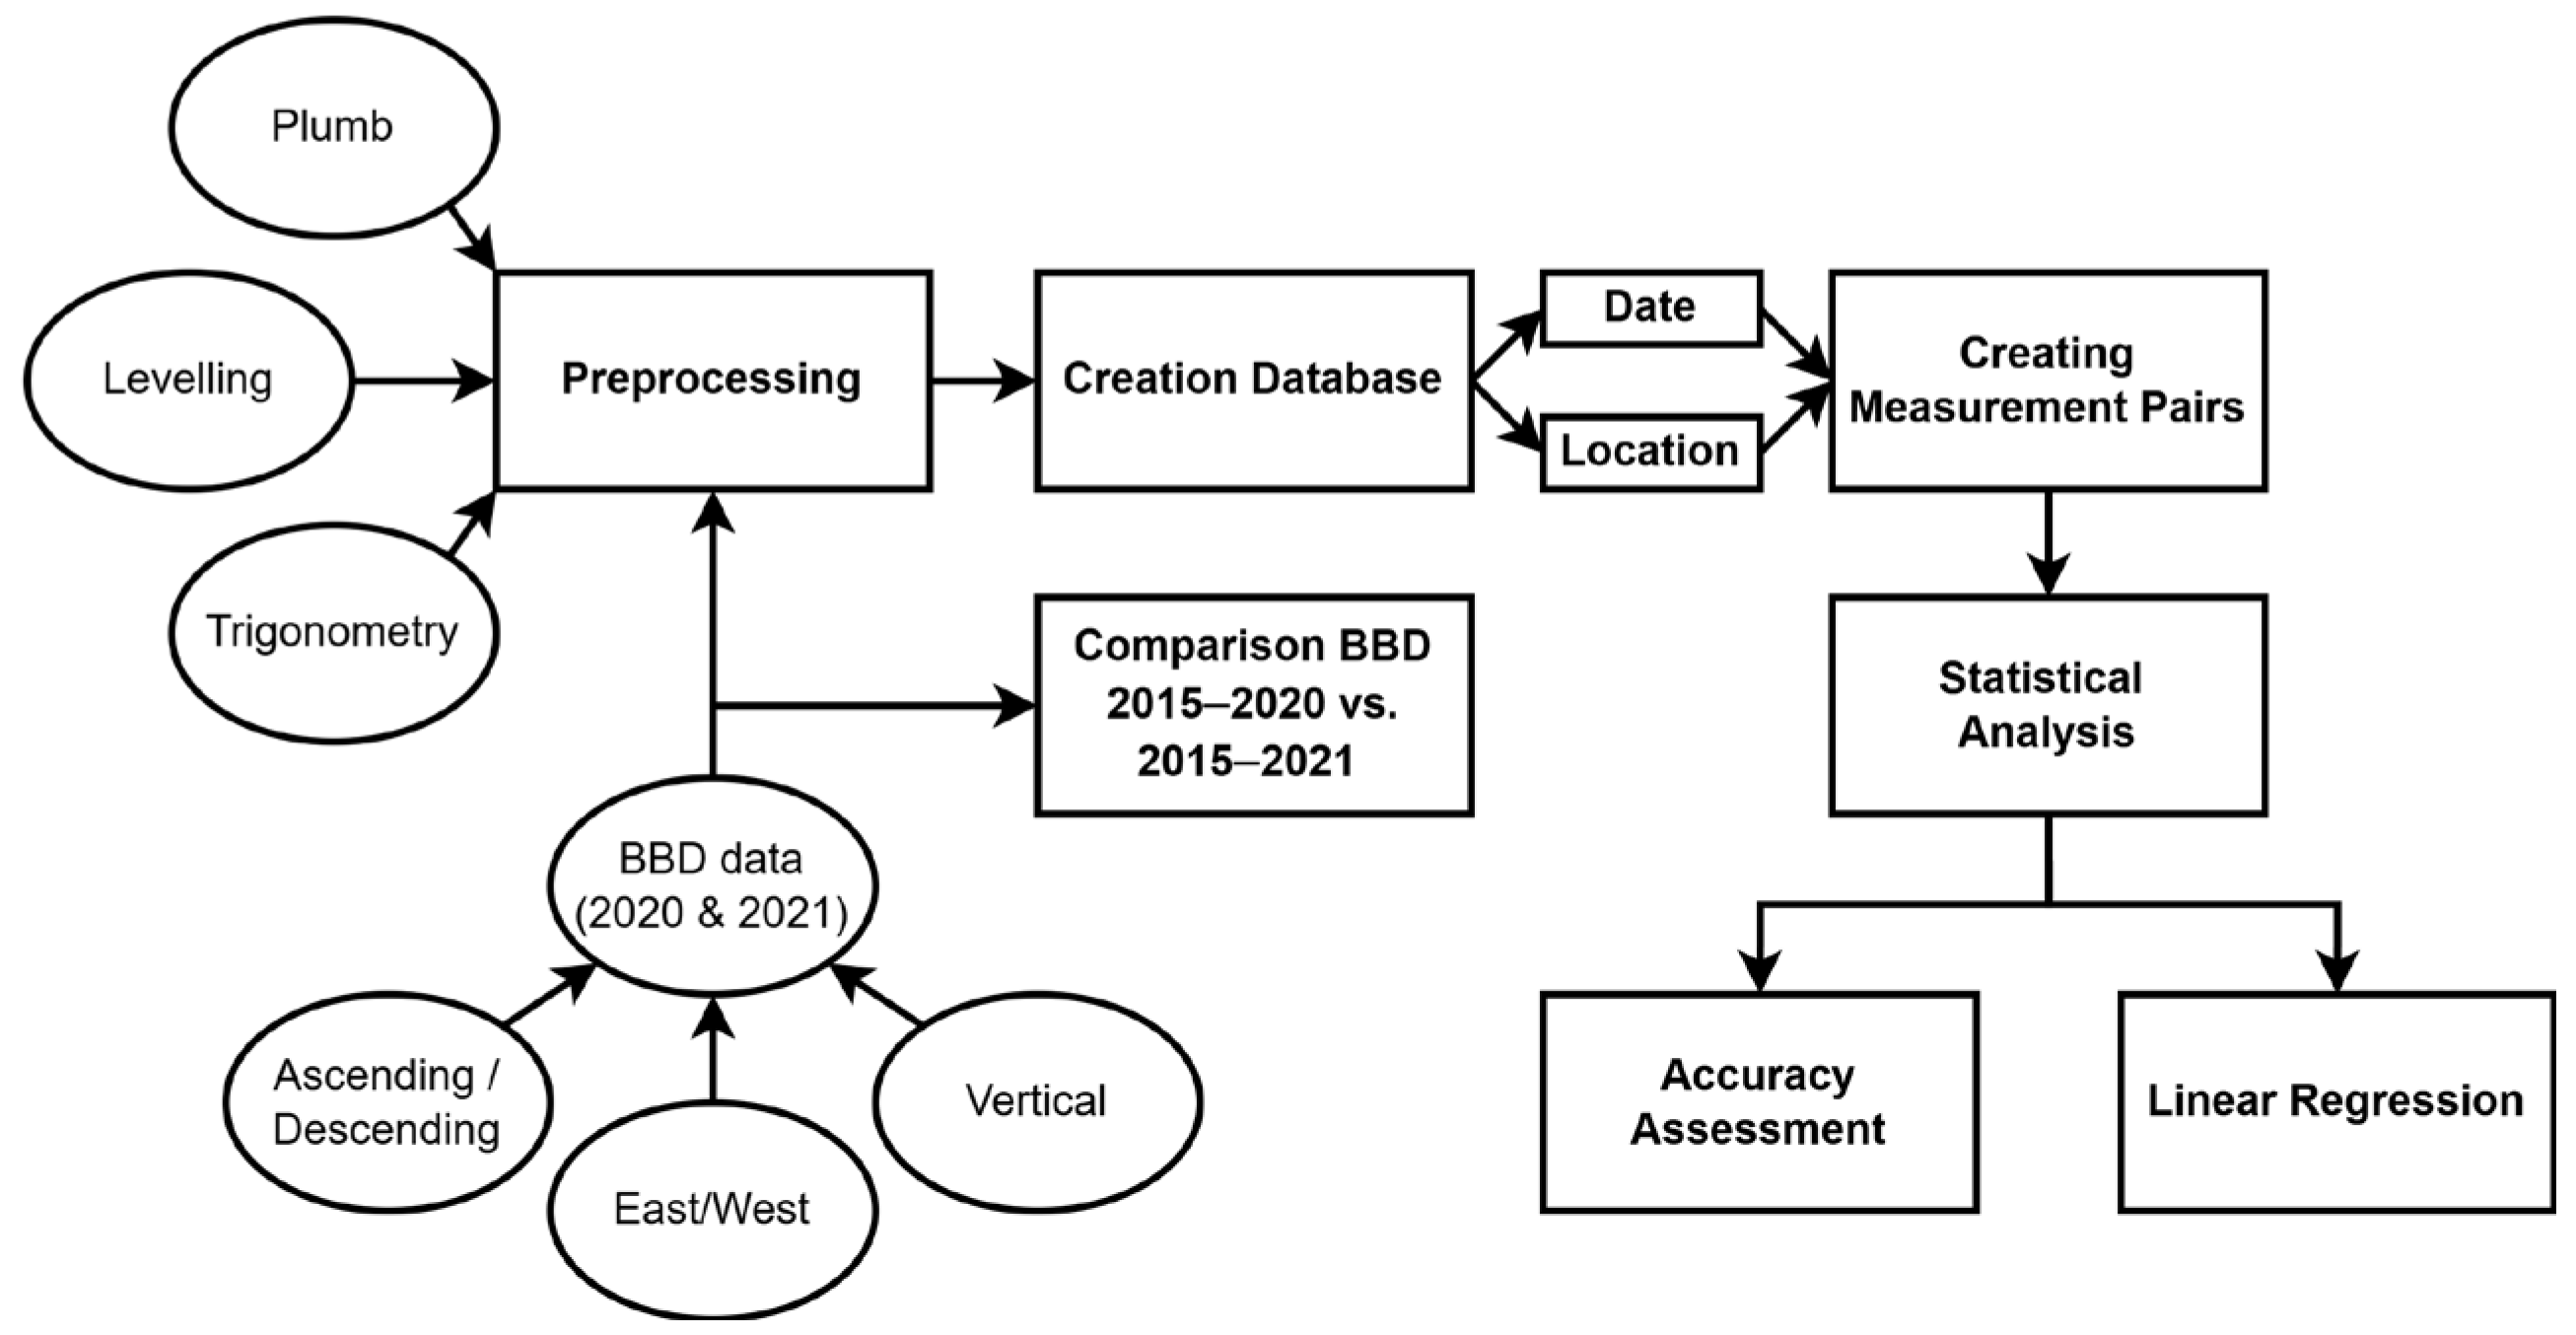
Figure 4 illustrates the workflow of this study. The analysis begins with preprocessing of the in situ data (plumb, leveling, and trigonometric measurements) to enable direct comparison with the satellite-based PSI data. Both PSI datasets (2015–2020 and 2015–2021) were considered independently and integrated into a centralized database structured by date and location. The PSI data from each stack and product (Ascending, Descending, Vertical, East–West) were matched with the nearest 2D in situ measurement points using a nearest-neighbor approach. These matchings form the basis for creating comparison pairs for statistical evaluation. Agreement was quantified using Pearson’s correlation coefficient (r), Root Mean Square Error (RMSE), Mean Absolute Error (MAE), and Median Absolute Error (MedAE); where applicable, confidence intervals are reported, significance is assessed with two-sided tests (α = 0.05), and uncertainty is quantified and carried through consistently across products and sites. Results for each PSI dataset were evaluated separately, both for aggregated PS averages and for the best-performing individual PS points per site.
In addition to comparisons with ground-based observations, the two PSI datasets were directly compared with each other to assess the influence of the extended observation period (2021 update) on point density, deformation trends, and statistical stability. Special attention was paid to the consistency of time series patterns, the evolution of movement trends over time, and the robustness of detected deformation signals in both datasets. Key factors such as orbit direction (Ascending vs. Descending), motion decomposition (East–West vs. Vertical), incidence angle, and dam-specific characteristics were also considered in the evaluation. These dimensions are integrated into the subsequent results and discussion sections to derive best-practice recommendations for operational PSI-based dam monitoring.
Operational support criteria were framed with reference to German dam-monitoring practice and relevant DIN standards (DIN 19700) [1]. The evaluation focuses on (i) observables that are interpretable in the established framework, (ii) temporal suitability given update frequency, (iii) spatial coverage expressed as PS availability at the dam scale, and (iv) agreement with in situ observations as an indicator of application suitability. These criteria are used to interpret the results rather than to establish full operational use.

3. Results

The results section presents the findings of the comparative analysis between the two BBD PSI datasets and the in situ measurements collected at the four dams. The analysis begins with an evaluation of the spatial distribution and density of PS points (Section 3.1), followed by a detailed comparison of the BBD data with plumb measurements (Section 3.2) and with trigonometric and levelling data (Section 3.3).

3.1. Comparison of PS Point Distribution (2020 vs. 2021)

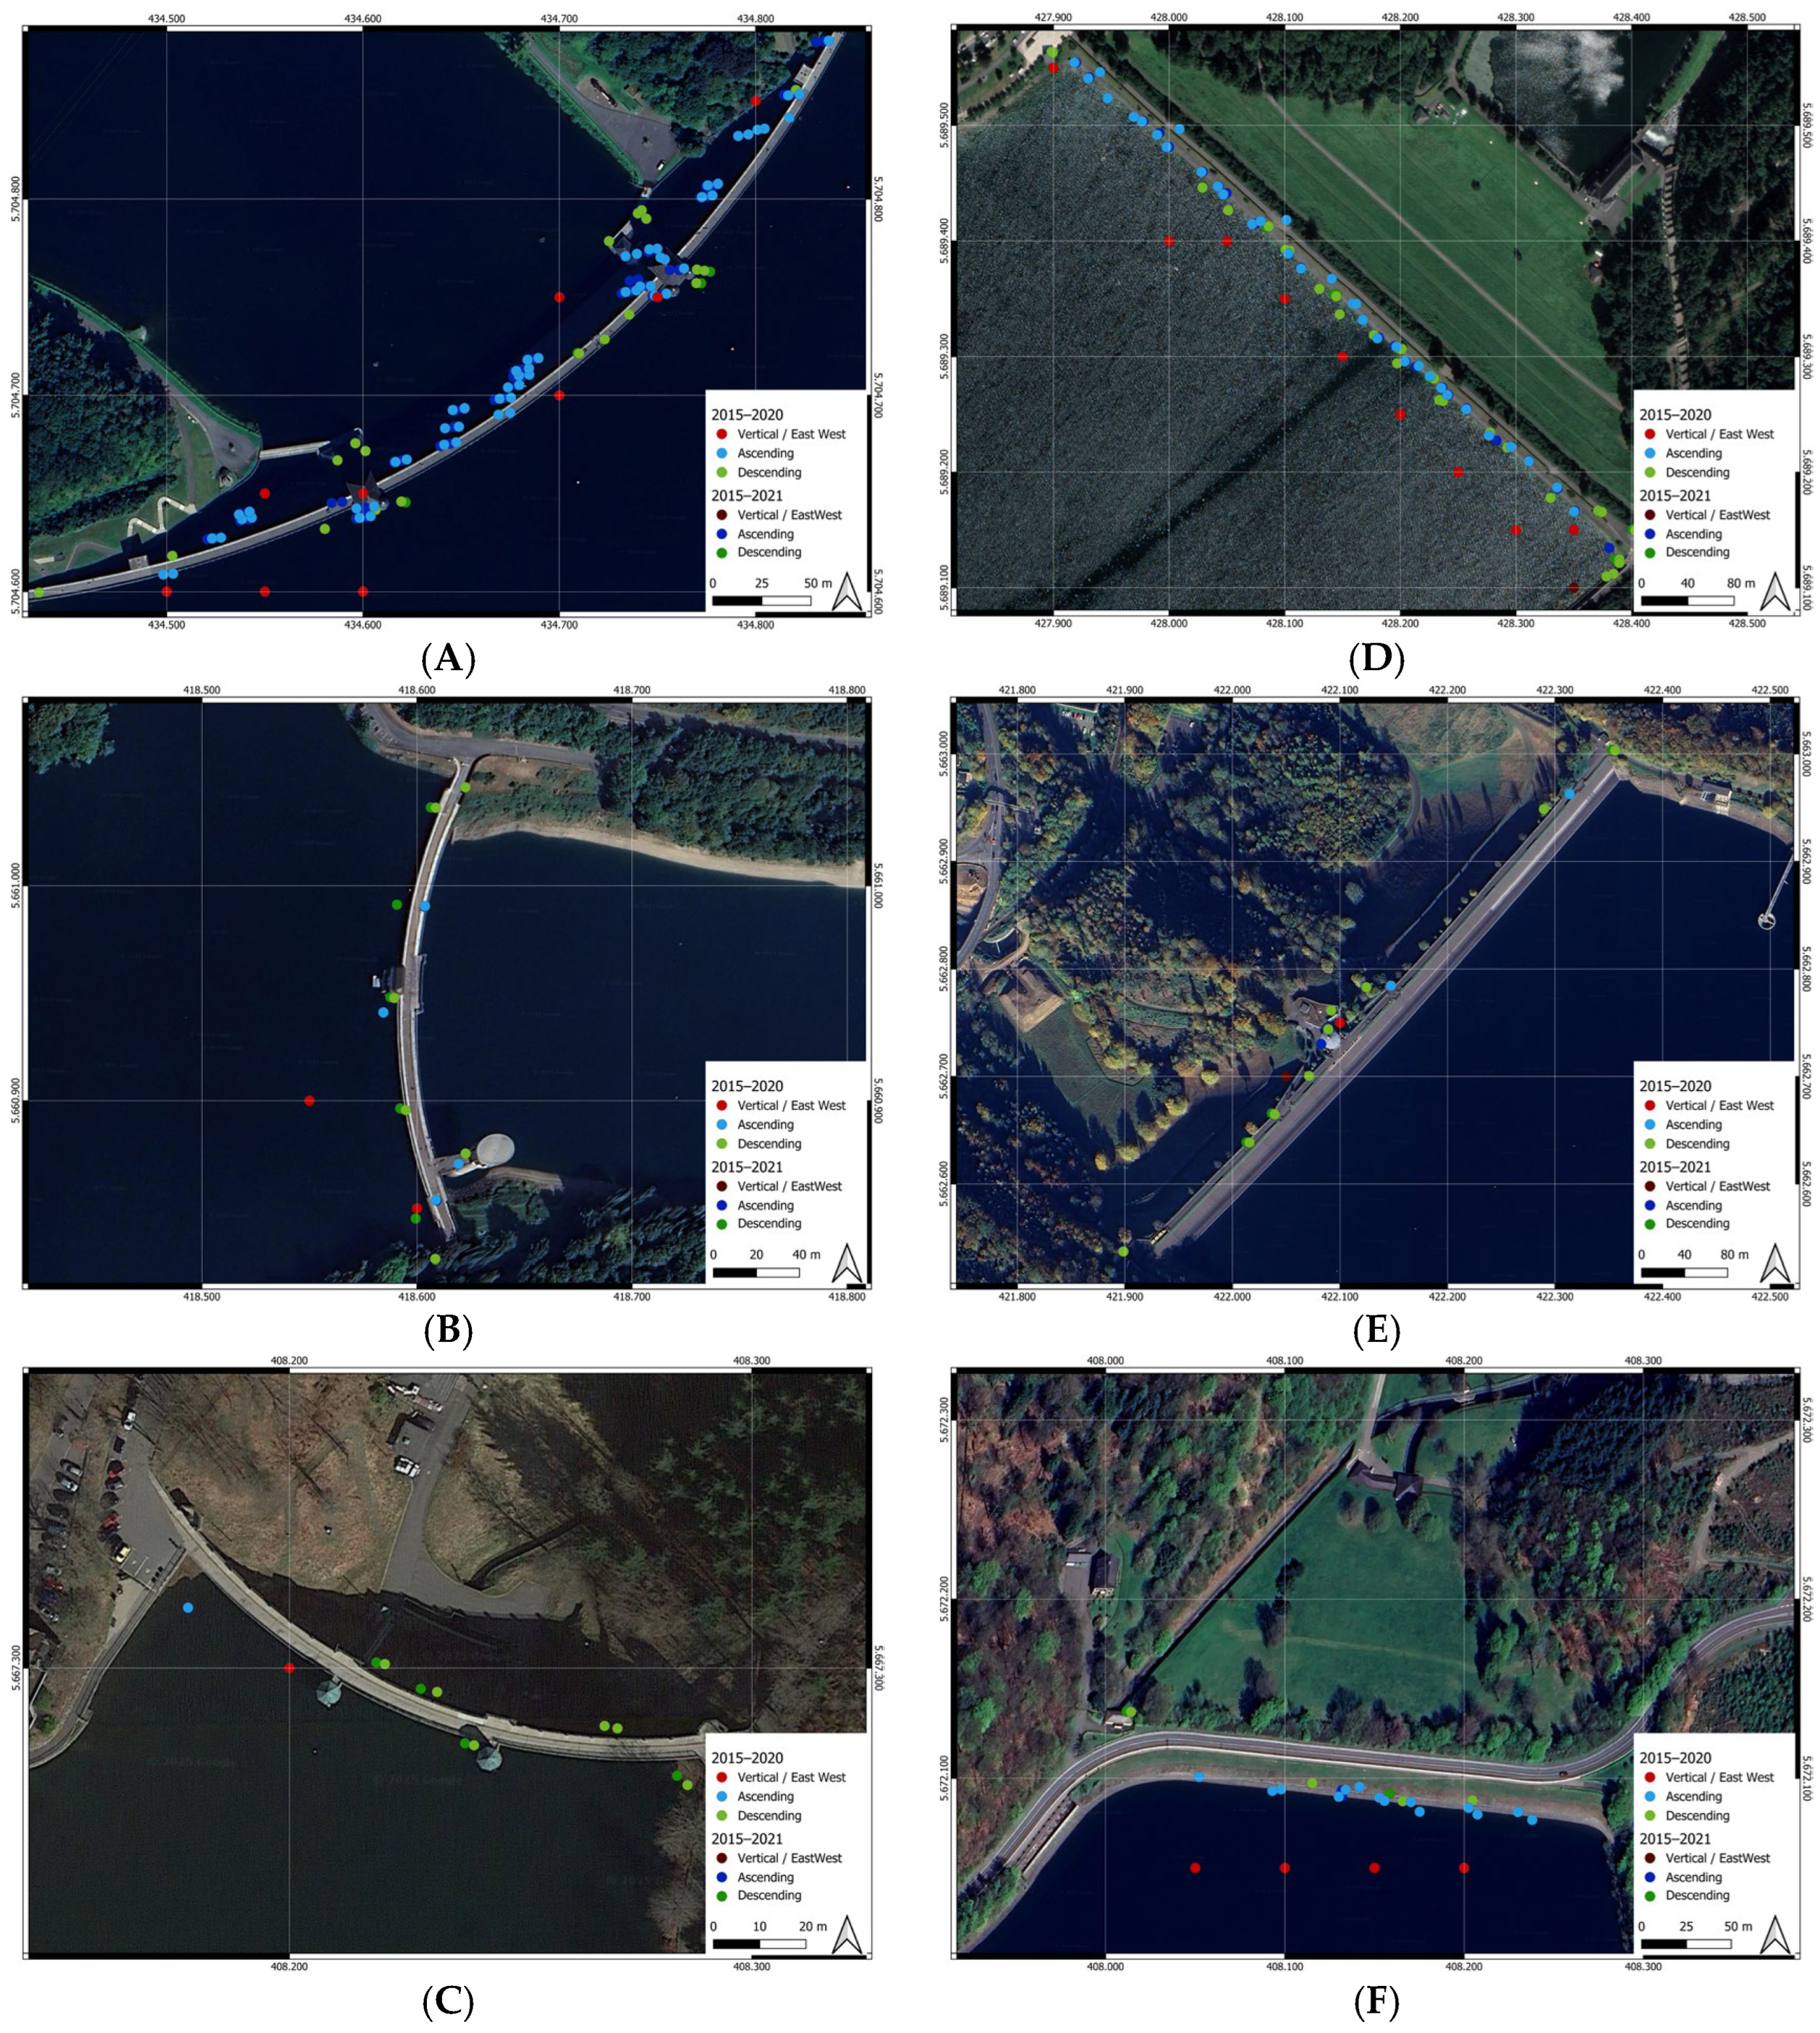
Figure 5 visualizes the spatial distribution of PS points derived from the PSI datasets for both observation periods (2015–2020 and 2015–2021) across all six dams. The exact number of PS points per data stack is listed in Table 3. The comparison reveals notable differences in PS density between the two time ranges, varying in extent and direction depending on dam location and stack geometry. For visualization, the 2015–2020 dataset is prioritized for plotting on the map. As a consequence, PS points from the extended dataset (2015–2021) may be partially or fully obscured in areas where both datasets overlap in space.
Overall, the number of points at all dam sites decreases when extending the dataset to 2021. At the Möhne Dam, PS coverage is generally high and spatially uniform. As shown in Table 3, the number of PS in the Ascending stacks 015_05 and 015_06 decreases only slightly, with 29 and 30 points in 2020 compared to 27 and 27 in 2021. However, the number of PS points in the Descending stacks 139_07 and 139_08 drops considerably: from 7 and 11 points in 2020 to 3 and 3 in 2021. As a consequence, similar decline is observed in the decomposed motion products: East–West and Vertical points decrease from 11 to 1. This reduction suggests that the inclusion of the 2021 update may have led to lower coherence or stricter filtering in the PS selection process for these components.
The Sorpe Dam shows a comparable pattern. The number of Ascending PS points in stack 088_03 decreases from 34 to 25, while Descending stack 139_08 drops from 23 to 9 points. The decomposed products also lose several PS points, with Vertical and East–West counts each decreasing from 9 to 5. Despite this reduction, Sorpe still maintains a comparatively robust PS coverage, particularly in the ascending direction.
In contrast, the Fürwigge Dam exhibits very sparse PS distributions in both observation periods. In the 2015–2020 dataset, six PS points are detected in Descending stack 139_08, and one point each in Vertical and Ascending stacks. In the 2015–2021 version, these numbers decline to four Descending points and zero in Vertical and Ascending directions, effectively rendering large parts of the dam unobservable via BBD PSI.
The Bigge Dam also shows low PS availability, with slight reductions across the two datasets: descending stack 139_08 drops from eight to three points, while the Ascending and decomposed products remain unchanged at very low levels (one point each).
The Verse Dam follows a similar trend. While the 2020 dataset still offers modest PS coverage (seven Ascending, seven Descending, four Vertical), the extended 2021 dataset contains only one to two points per stack, suggesting marginal utility for PSI analysis without additional measures such as artificial reflectors.
Finally, the Lister Dam shows minimal changes in point distribution across both periods. PS counts in Ascending stack 088_03 slightly decline (from four to three), and Descending points drop from six to five. However, overall PS availability remains low.
Across all dams, PS density is generally higher in the ascending geometry, while descending geometry tends to be more sensitive to temporal coherence losses. The decline in total PS counts from the 2020 dataset to the 2021 dataset is likely a result of local scene changes affecting radar backscatter stability. These findings highlight the importance of periodic reassessment of PSI data coverage, especially for operational dam monitoring applications relying on consistent spatial data availability. Comparisons across the two BBD service versions isolate versioning effects on PS availability and trend stability, enabling a controlled assessment beyond single-period case evidence.

3.2. Results for Plumb Data

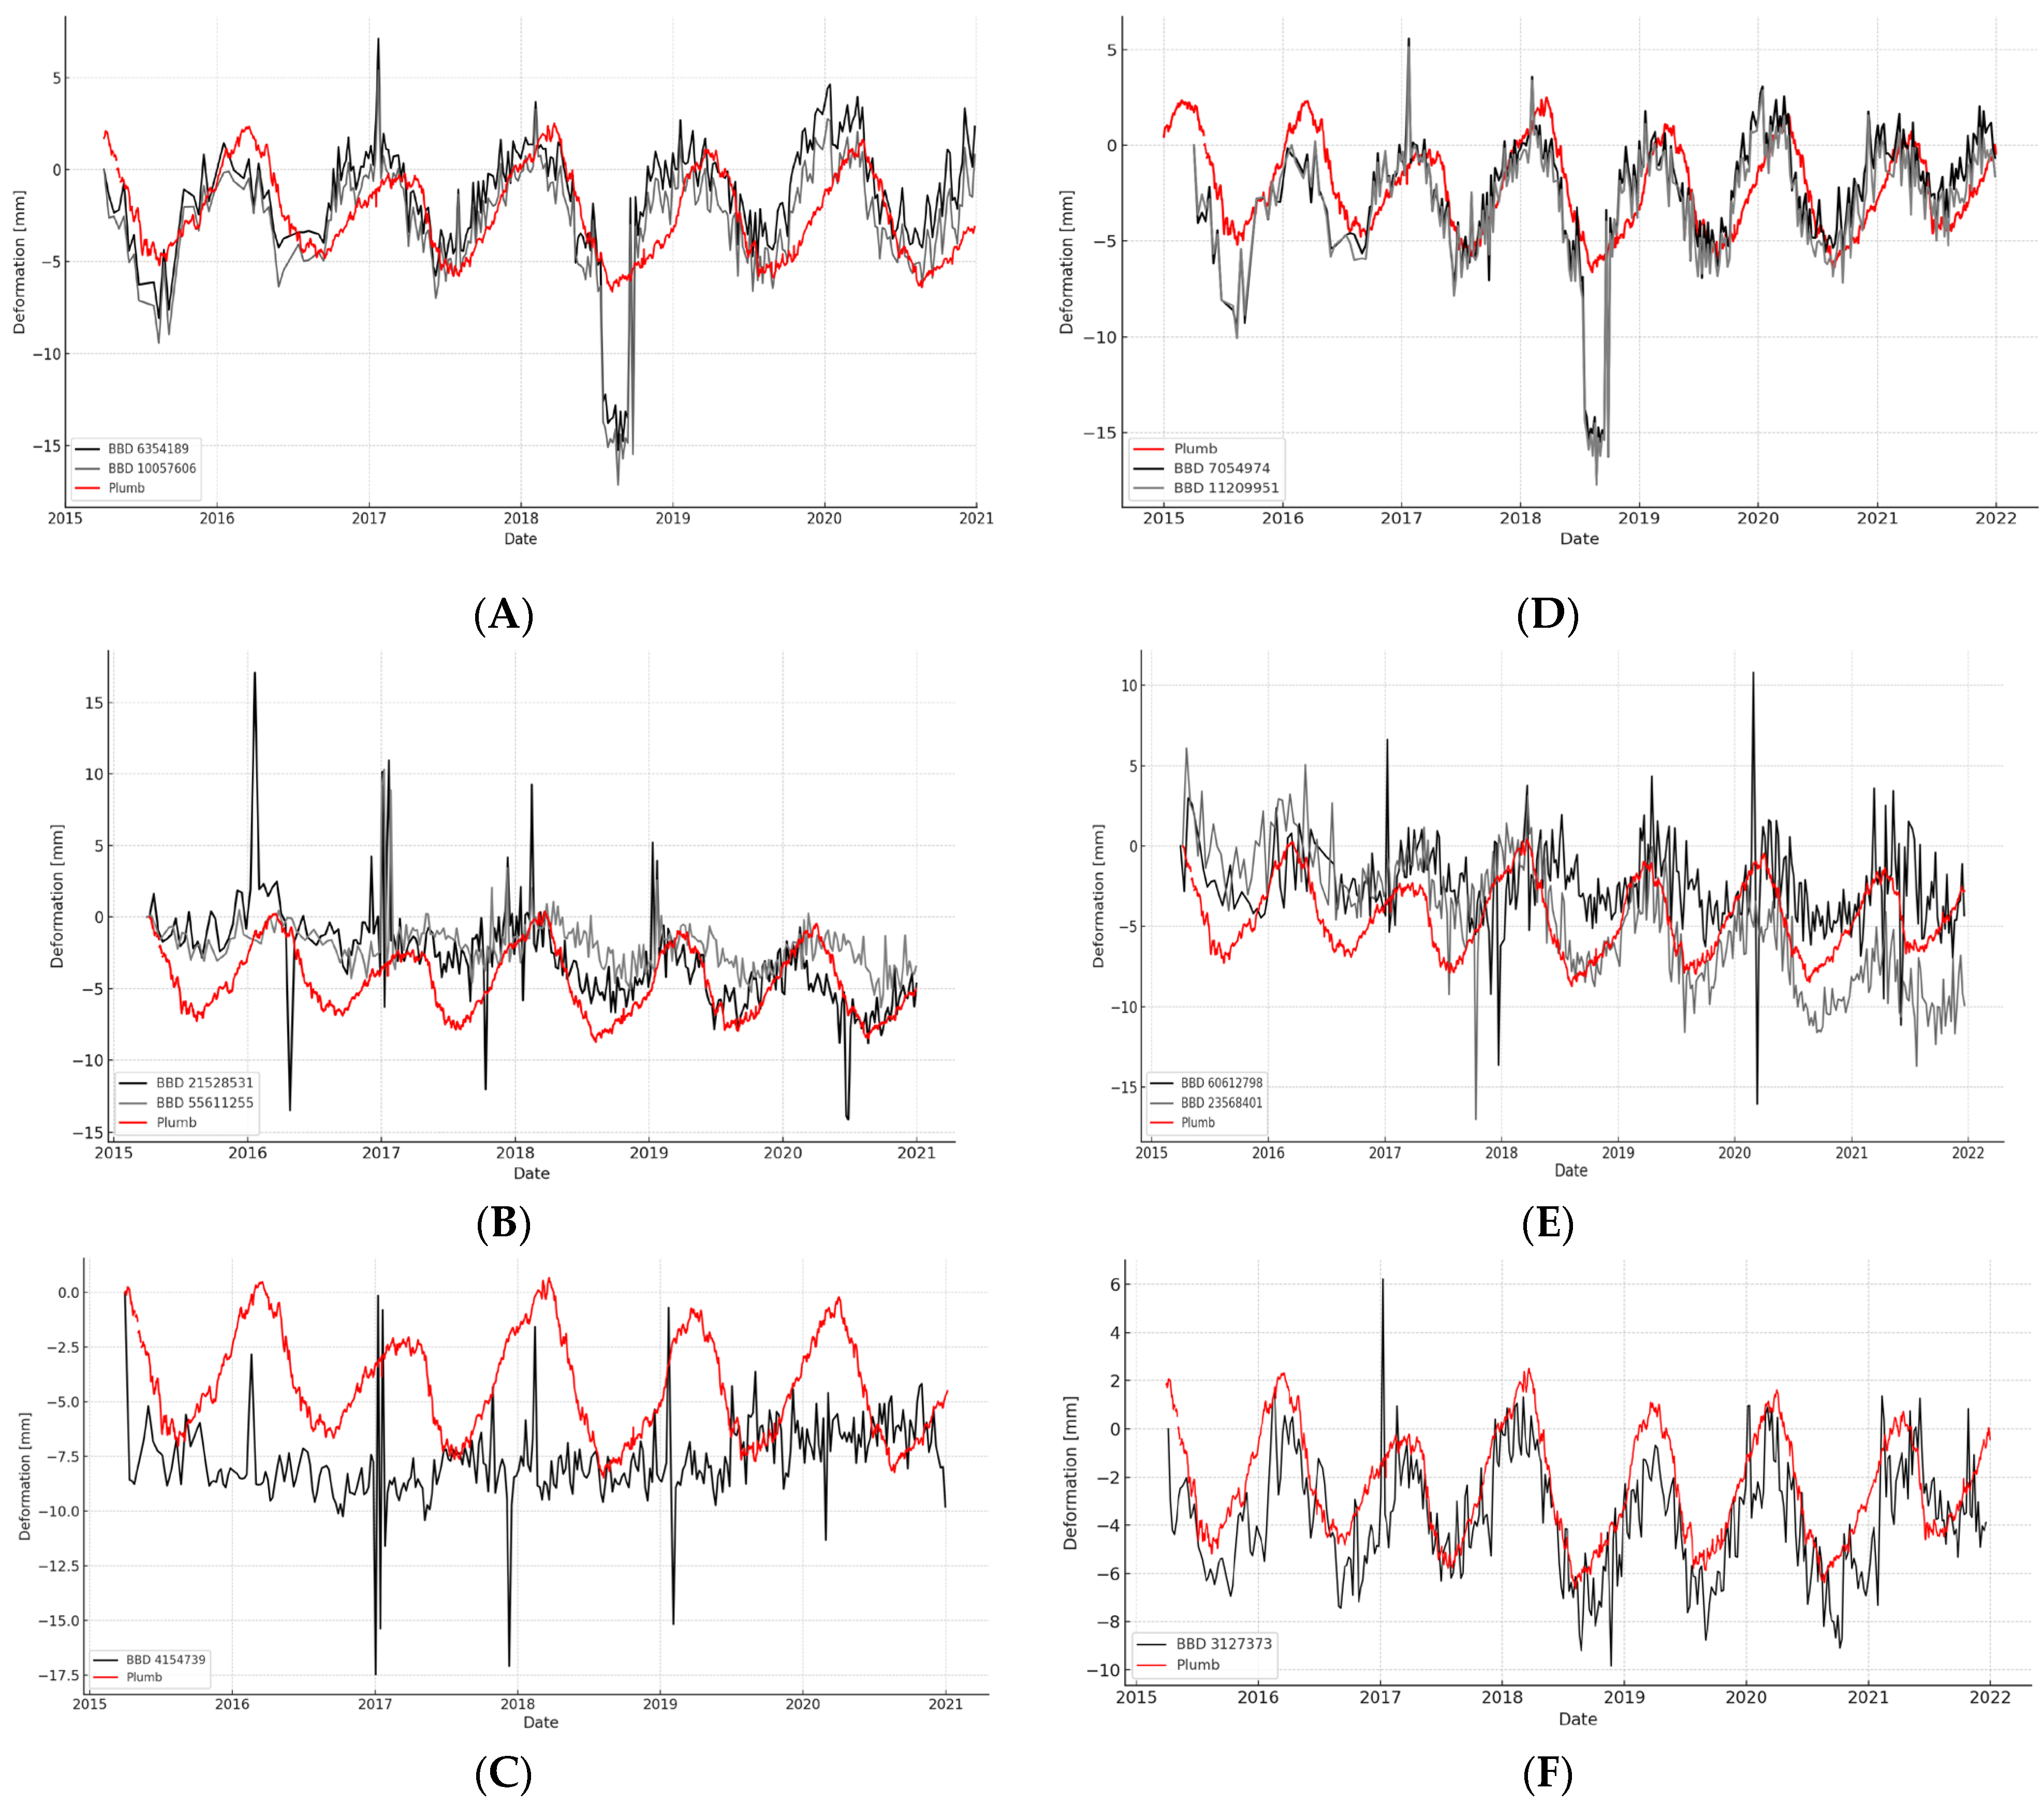
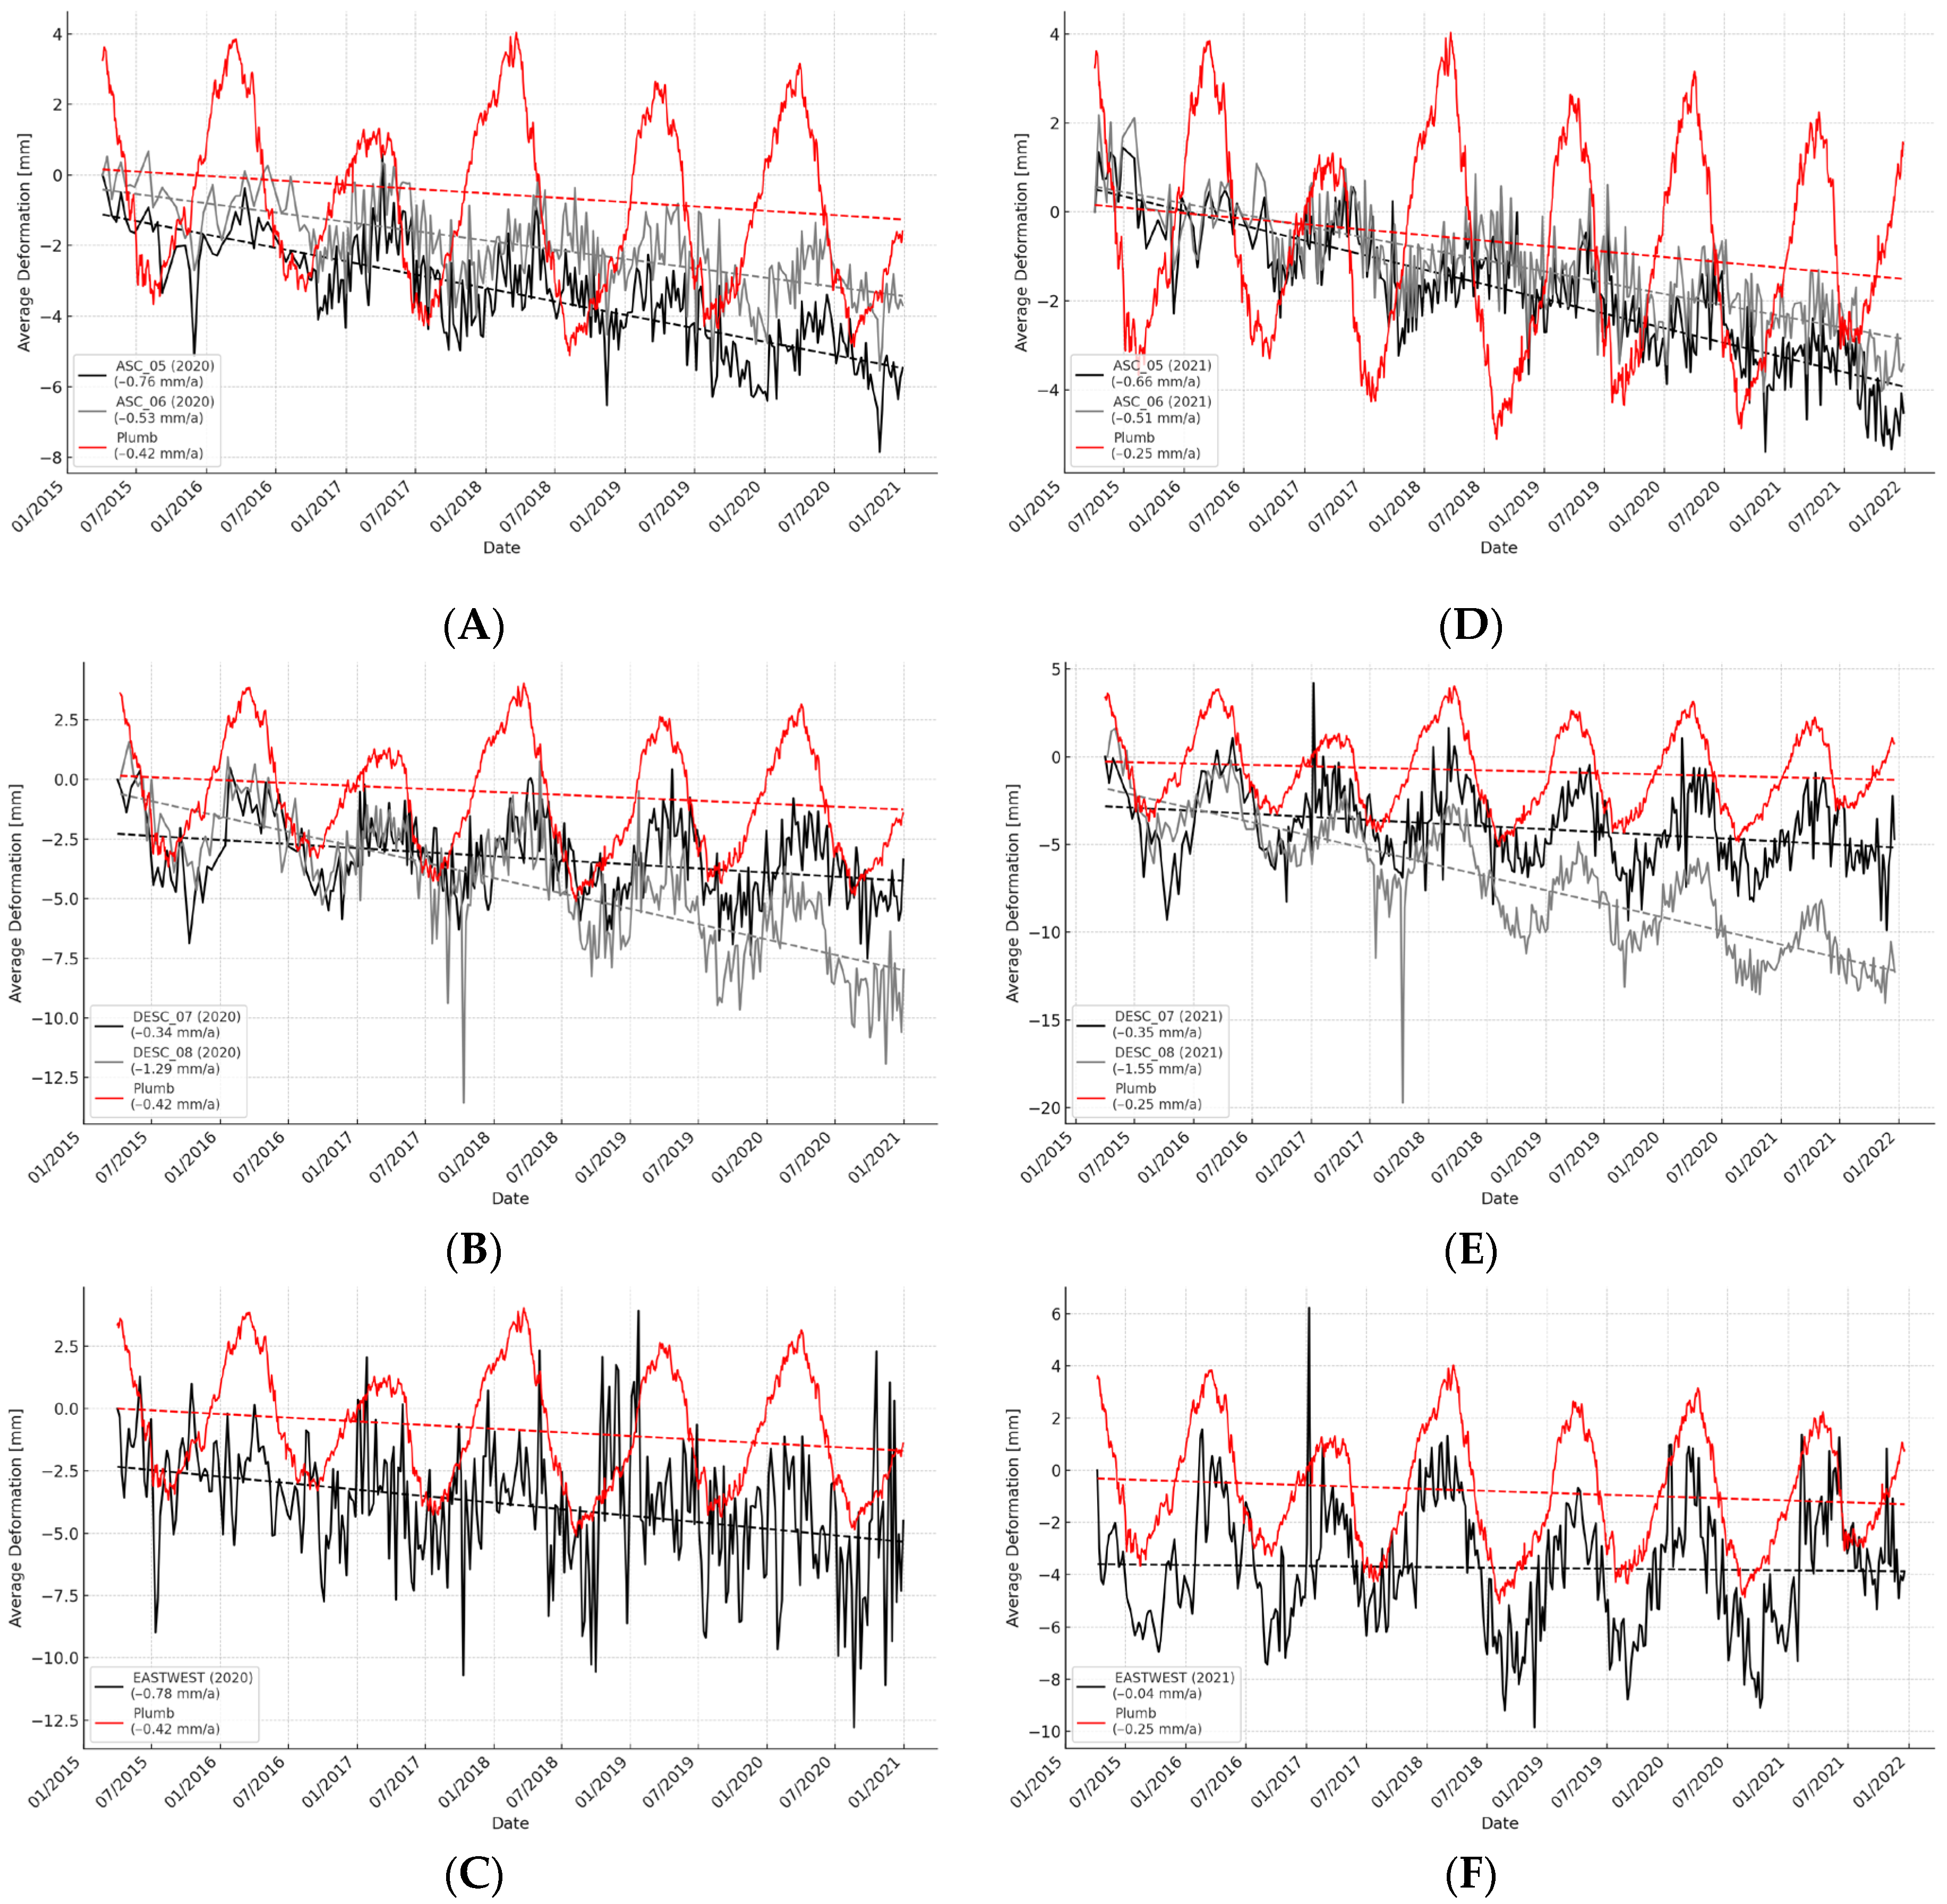
For the comparison of BBD data with the plumb measurements, only the Möhne Dam and the Fürwigge Dam can be used, as plumb systems are operated only at these gravity dams and not at the other reservoir dams. Figure 6 presents the visual results of the data series in the Ascending- and Descending-LOS directions as well as the decomposed East–West data for the Möhne Dam, covering both analyzed time periods. For each stack, the best performing measurement pair is shown, consisting of the plumb data and the PS located closest to the plumb position.
The Ascending and Descending data stacks (Figure 6A,B,D,F) are able to reproduce the annual progression of the plumb data well for several points. Individual outliers occur, and a general large offset is visible in the Ascending data around mid-2018. Overall, the BBD time series from 2015 to the end of 2021 shows better agreement with the plumb data, as confirmed by the statistical analysis in Table 4. This is particularly evident in the motion-decomposed East–West data. While hardly any correlation is observed for 2020, a clearer relationship emerges in 2021, confirmed by a Pearson correlation coefficient of 0.75.
The improvement between the two observation periods is also reflected in the other statistical metrics. For example, the RMSE for the East–West stack at the Möhne Dam decreases from 6.79 mm (2020) to 3.45 mm (2021), and the MAE decreases from 6.12 mm to 2.34 mm (Table 4). The same trend is observed in the best-performing PS points (Table 5), with the East–West stack showing a correlation increase from 0.27 in 2020 to 0.75 in 2021. For the Descending stack 139_07, the correlation improves from 0.46 to 0.65 over the same period. These developments are reflected in visual comparisons shown in Figure 6, where the alignment between BBD and plumb data becomes clearer in the 2021 time series.
Figure 7 presents the mean values of all available PS per time step, providing an aggregated comparison with the plumb data. Compared to the individual points in Figure 4, the averaged data curves appear smoother and show less variation. A general correspondence between the BBD and plumb data is visible across all subplots and becomes more pronounced in the 2021 datasets (Figure 7D–F). This is also supported by the trend lines and average annual displacement rates given in each subplot. Among the motion components, the East–West direction again shows the clearest visual match in 2021.
As noted in the before, only one PS remains available for comparison. Nevertheless, across all data stacks and observation periods, the Descending geometry (e.g., Figure 6B,E) appears to follow the temporal evolution of the plumb data more closely than the Ascending data. Despite some divergence in magnitude and timing at certain points, the general movement trends in Ascending, Descending, and East–West stacks show consistent temporal patterns.
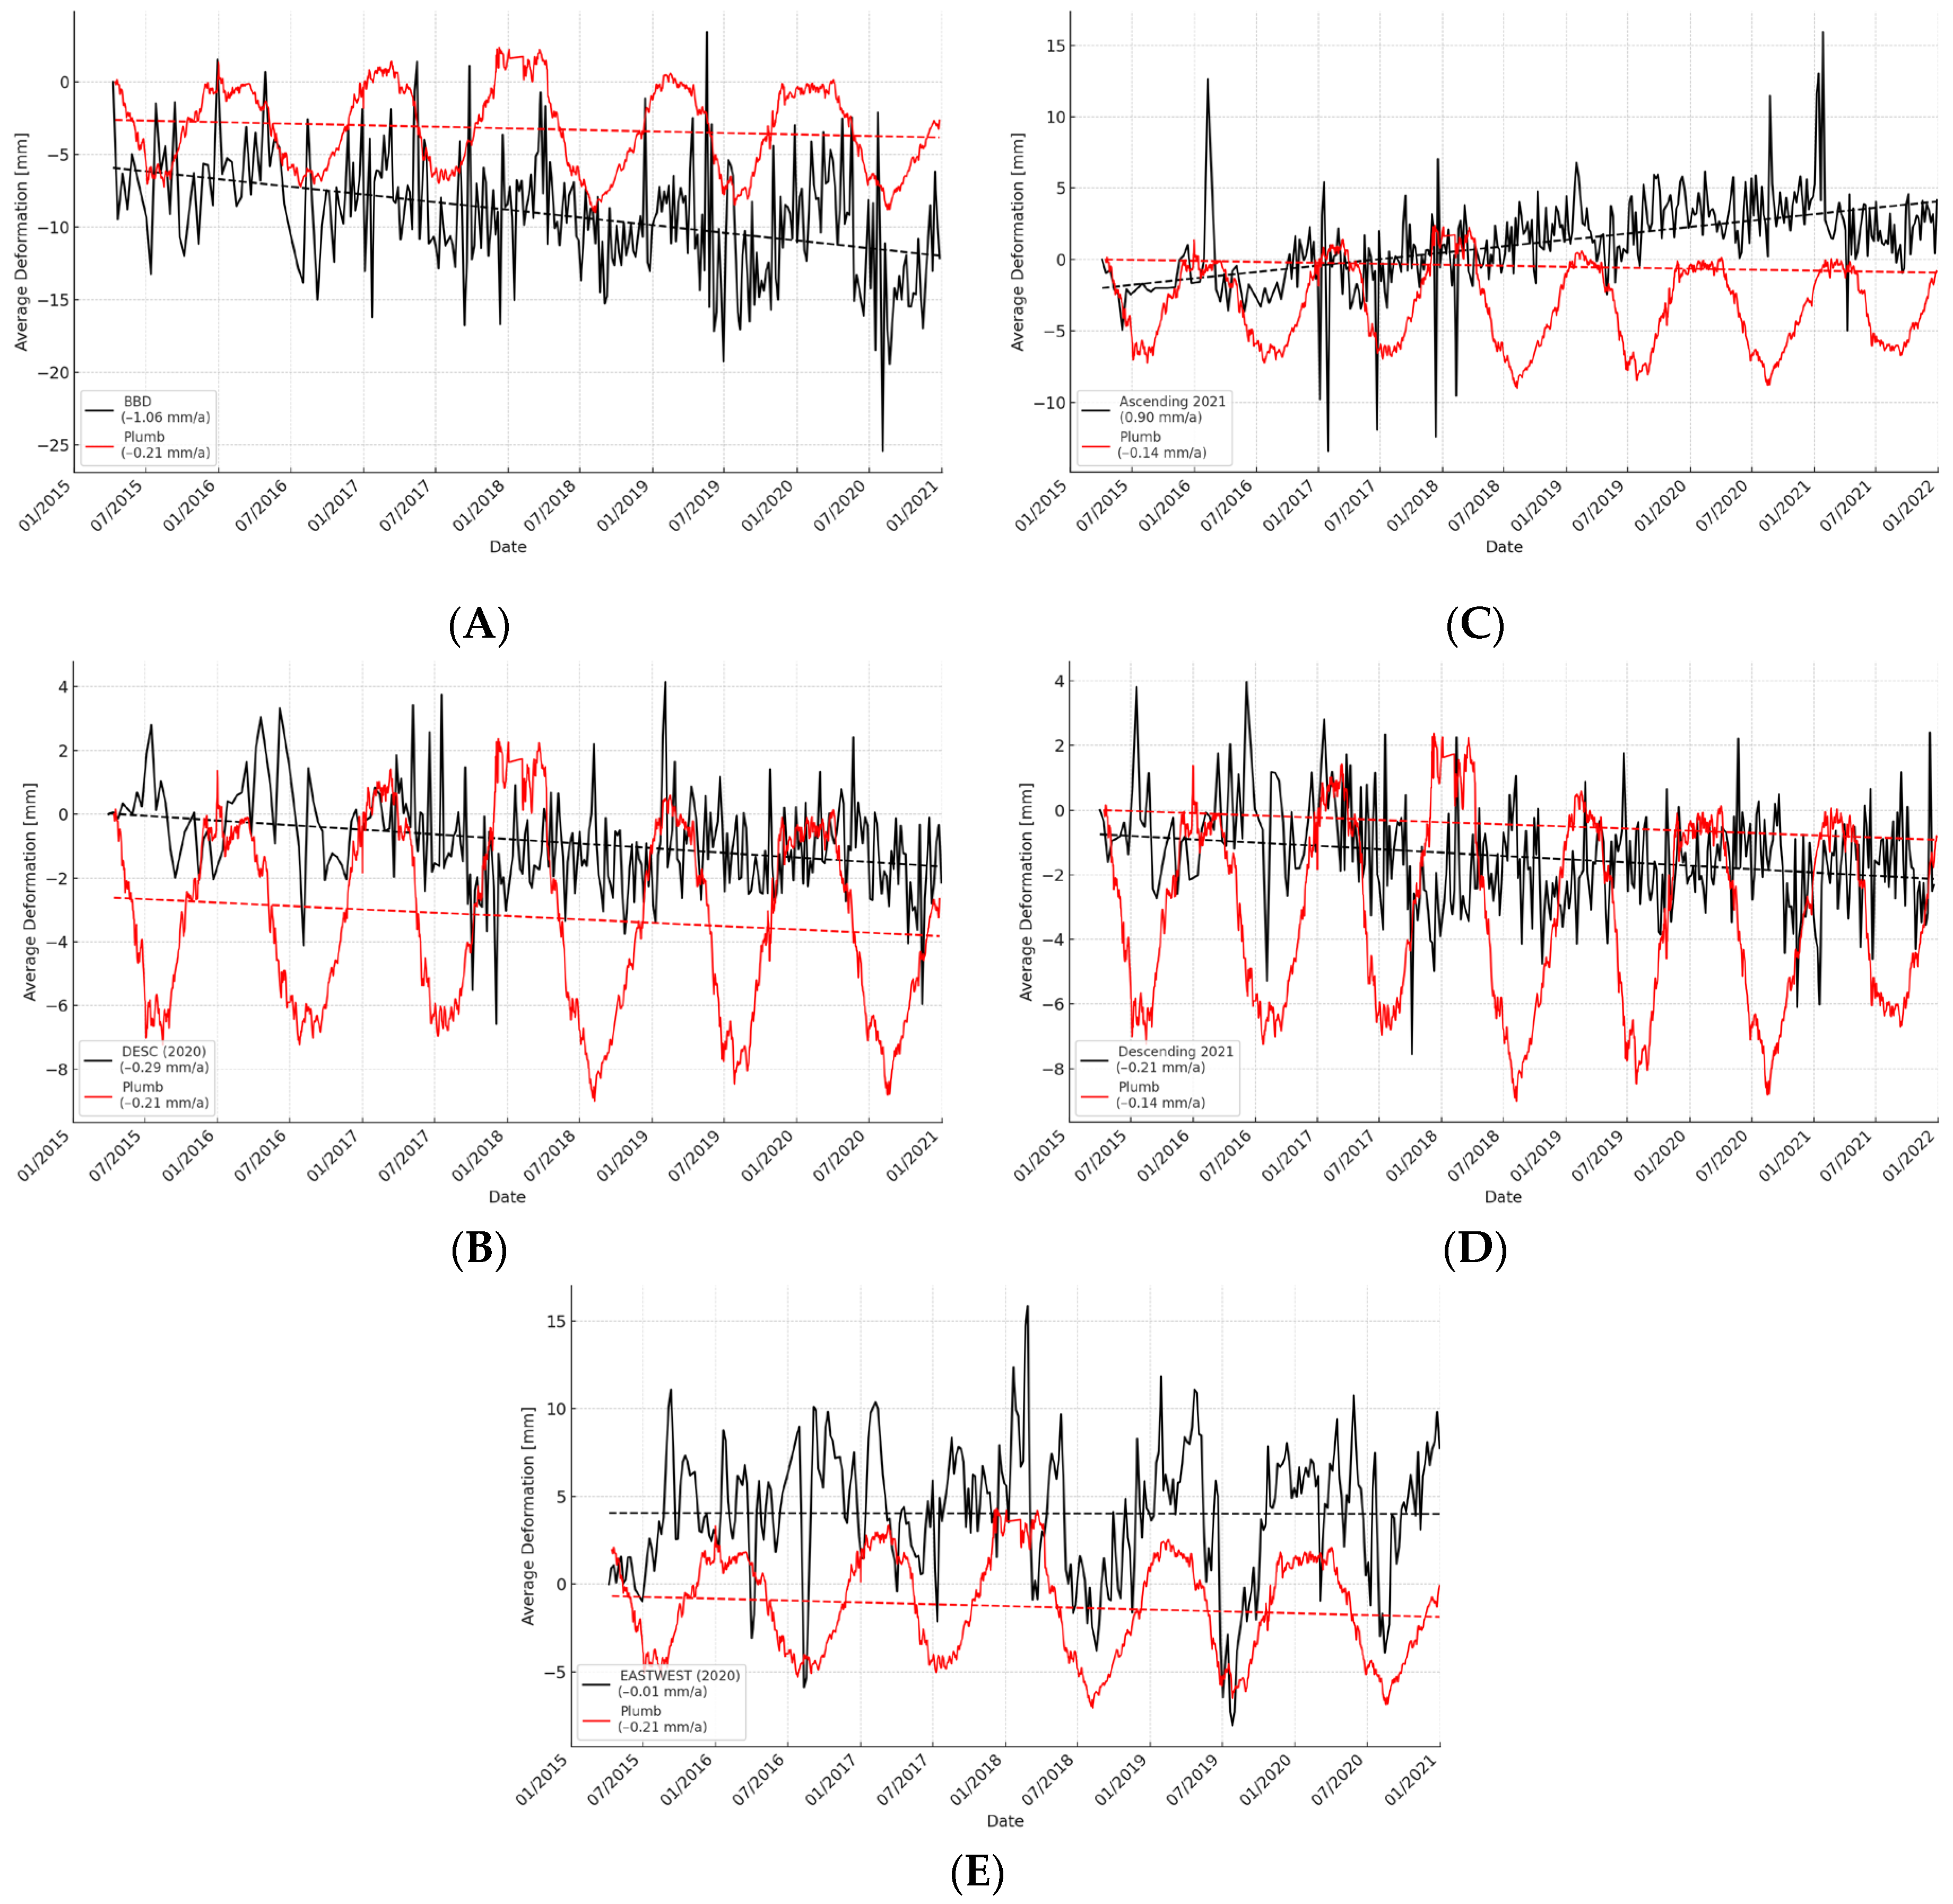
For the Fürwigge Dam, the results of the comparison between PSI data and plumb measurements are presented in Figure 8 and Figure 9. Figure 8 displays the best-performing PS from each available data stack for the years 2020 and 2021. In contrast to the Möhne Dam, the agreement between PSI and plumb data is generally weaker. This is also reflected in the statistical indicators shown in Table 4 and Table 5.
The correlation coefficients for most data stacks remain low across both observation periods. For example, the East–West stack reaches only 0.23 in 2020. The Ascending stack 015_06 even shows slightly negative correlation values (–0.121 in 2020 and –0.041 in 2021), with RMSE and MAE values remaining relatively high (e.g., MAE of 7.34 mm in 2020, Table 5). Only slight improvements are observed for the Descending stack 139_08, where the correlation increases from 0.11 in 2020 to 0.27 in 2021, accompanied by a reduction in RMSE from 4.67 mm to 3.46 mm.
Figure 9 shows the mean of all available PS per time step, allowing a smoothed comparison with the plumb data. As with the individual points, the averaged values show only limited visual agreement with the reference data.
Some general trends appear to run in a similar direction, particularly in the Descending data (Figure 9B,E), but a clear temporal alignment is not apparent in most subplots. The Ascending data, in particular, deviates significantly from the progression of the plumb measurements in both years.
Only a single PS remains available for Fürwigge as well, and as at the Möhne Dam, the Descending geometry shows a slightly better match to the visual progression of the plumb data. Nevertheless, the overall agreement between BBD and plumb data at Fürwigge is noticeably weaker than at Möhne, both in terms of correlation and in the structure of the displacement time series.
Plumb data are only available for the Möhne and Fürwigge dams, as plumb line systems are installed exclusively at these two gravity dams. For the other reservoirs, no comparable vertical reference measurements exist. Therefore, the following section focuses on the evaluation of the trigonometric measurements, which are available for all dams and offer an alternative means of ground movement verification.

3.3. Results for Trigonometric and Levelling Data

A comprehensive statistical analysis was conducted for all dam structures. The visual results are presented in Figure 8 using the Möhne Reservoir as an example, covering all satellite pass directions and the decomposed displacement time series. From all observation pairs formed based on their spatial proximity, the best-performing pairs for each satellite direction are shown. In all cases, the PS clearly reflect the trends observed in the trigonometric measurements.
Compared to plumb line measurements, which are recorded daily, trigonometric measurements are conducted only semi-annually, resulting in significantly fewer overlapping data points for the analysis. Statistically, these consistencies are confirmed by high Pearson correlation coefficients ranging from 0.7 to 0.75 for the 2020 time series (see Table 6).
For the 2021 time series, these correlations increase significantly, consistently exceeding 0.8 for the best-performing observation pairs. It should be noted, however, that the total number of available observation pairs decreases substantially, particularly in the Descending direction, due to the reduced number of PS from 2020 to 2021.
The East–West component shows the most significant improvement in correlation, rising from 0.72 in 2020 to 0.89 in 2021 (see Table 6). This relationship is also supported by low RMSE values and strong visual consistency (see Figure 10F).
Table 6 also presents the statistical results for all other examined structures. Notably, the results for the Fürwigge Reservoir are considerably poorer than those for the other two dams. The correlations (Pearson’s r) do not significantly improve from 2020 to 2021 and remain below 0.5 even for the best-performing observation pairs.
In contrast, the PS at the Lister Reservoir perform excellently for both time series, with correlations consistently above 0.8 and comparably low RMSE values. However, the qualitative differences between 2020 and 2021 are minimal in this case. For the Descending direction, the Lister Reservoir yields the highest correlations, with values of 0.91 in 2020 and 0.88 in 2021 for a closely located pair in the center of the dam.
For all three dams, the comparisons between decomposed Vertical PSI data and individual observation points generally show poor agreement, with high RMSE values and low correlations compared to the other LOS directions or the decomposed East–West component.
In the case of embankment dams, the highest-matching observation pairs show much more mixed results. For the Bigge Reservoir, moderate correlations were achieved, slightly improving across all directions when extending the time series from 2020 to 2021 (from approximately 0.5 to 0.6). Sorpe shows the best performance in this group, with correlations ranging from 0.6 to 0.85, and up to 0.88 for the 2021 time series. For the Verse Reservoir, all correlation values remain low, with the highest reaching only 0.25.
A special case is presented by the comparisons between decomposed Vertical PSI data and trigonometric campaign measurements. For every observation pair across all structures, correlation values remain below 0.5, with widely varying RMSE values. However, such correlations could only be computed for dams. The three gravity dams (Möhne, Lister, and Fürwigge) show correlation values around 0.2 for the “best” pairs, while most observation pairs show correlations near zero.
The comparison and interpretation of these results, both with the plumb line and trigonometric measurements, are discussed in the following chapter.

4. Discussion

The previously discussed results highlight the diversity in both quantity and quality of the PS when compared to the in situ measurement data. However, no universally valid conclusions can be drawn without considering the prevailing conditions at each dam structure. Key influencing factors include the type of structure, its size, and its geographical orientation.
Additional factors arise from the number of available BBD points in conjunction with the two BBD observation periods. Based on these criteria, the results are discussed in detail in the following chapter.

4.1. BBD PSI Point Quantity

The comparison of Persistent Scatterer (PS) datasets from the German Ground Motion Service (BBD) reveals a critical issue for long-term infrastructure monitoring: extending the observation window from 2015–2020 to 2015–2021 resulted in a reduction in the number of PS points over the analyzed dams. Notably, while large dams such as Möhne and Sorpe lost a moderate portion of PS, smaller earth-fill dams like Verse and Fürwigge, which are already scarcely represented in PSI, became unobservable. This pattern aligns with theoretical expectations of PSI and reflects typical large-scale processing practices [5,28,29].
PSI require backscattering objects characterized by a high coherence across the entire temporal stack of interferograms. With an extended time span, scatterers previously stable over five years may no longer meet the coherence threshold applicable over six years. This temporal decorrelation often results from minor physical or environmental changes accumulating over time, especially on textured or vegetated surfaces, leading to loss of PS points [5,28]. For example, at the Verse Dam, nearly all PS points disappeared in the extended dataset, highlighting the sensitivity of PSI to subtle surface alterations.
Longer time series also impose more stringent displacement model fitting. Deviations in additional years that disrupt previously linear trends lead to exclusion of scatterers, functioning as a built-in quality filter that sacrifices quantity for reliability [29,30]. This effect is particularly pertinent in analyses of non-linear displacement behavior, as demonstrated in methodologies for classifying InSAR time series into linear and non-linear trends [31,32] or in landslide precursor monitoring using A-DInSAR [33].
Operational PSI services such as BBD and EGMS prioritize consistency and minimize false positives through conservative, automated algorithms. Reprocessing to include an extra year applies the same coherence criteria across the full-time range, often filtering out previously marginal scatterers. EGMS validation, covering 12 European sites, confirms that PS density tends to decline in longer temporal stacks, particularly in rural or vegetated environments [34].
A case study in Gävle, Sweden, from the InSAR-Sweden service (covering 2015–2021) corroborates this trend: PSI results using an extended time span (March 2015–October 2021) produced fewer PS points than the earlier time series ending May 2020, despite consistent processing parameters [35,36]. This is consistent with broader EGMS observations and suggests that increased temporal coverage does not necessarily translate to higher or stable point density.
Comprehensive reviews emphasize key limitations of PSI, including temporal decorrelation, geometric decorrelation, and phase misalignment [30,37]. These factors are exacerbated when observation periods lengthen, increasing the risk of losing stable scatterers from the dataset. The reliance on high-coherence scatterers makes PSI inherently less effective over long-term multi-year analyses in non-urban or non-built-up areas [30], which explains the pronounced decrease in points, particularly at embankment dam that are often covered with vegetation.
The dynamic nature of PS density across successive data releases poses operational challenges for infrastructure monitoring. Sudden or gradual loss of PS coverage can disrupt deformation time series, especially for critical facilities like dams. Incomplete coverage risks missing key displacements or misinterpreting trends. To enhance monitoring resilience, integrating artificial reflectors into dam structures can provide long-term, phase-stable targets that remain detectable across time. National services like InSAR-Sweden already implement this approach, co-locating corner reflectors with GNSS (Global Navigation Satellite Service) stations to support validation and stability [36].
Finally, another critical aspect must be considered, one that has traditionally been a key strength of the PSI technique: the ability to provide consistent, large-scale spatial coverage over extended time periods. With the recent updates of the BBD, however, a significant reduction in spatial coverage has been observed. This has particularly affected several dams, such as Bigge, Verse, and Fürwigge, where the number of PS has decreased to the extent that only portions of the dam structure remain covered.
Previous studies have demonstrated, using the CR Index that the density of potentially detectable PS points can vary not only between dam types, but also within a single dam structure [38,39,40].
The decreasing number of points in both Ascending and Descending geometries also directly affects the number of PS points available for motion decomposition. Since Vertical and East–West motion components are derived using a linear system based on both satellite viewing directions, the loss of PS points in just one geometry is sufficient to render a point unusable for decomposition [6,7,15,41,42]. This was, for example, the case at the Verse and Fürwigge dams.
These findings highlight the importance of periodic reassessment of PSI data coverage, especially for operational dam monitoring applications relying on consistent spatial data availability. However, even after reassessment, PS coverage cannot be guaranteed, as it is partly governed by chance. Although parameters such as acquisition time span or the choice of detection algorithm can improve PS availability, local conditions may still result in a complete absence of usable scatterers, requiring alternative solutions or individual processing strategies.
The implications of this reduction for the reliability and statistical quality of comparisons with geodetic measurement data are discussed in detail in the following chapter.

4.2. Analysis of Plumb and Trigonometric Comparisons

This study confirms that PSI data from the BBD can effectively capture seasonal deformation patterns observed in in situ measurements, especially from plumb lines. The PSI time series often reflect the seasonal cycles well, underlining their value for long-term monitoring. However, the daily resolution of the plumb line data means that every PSI value is included in the analysis, amplifying the effect of outliers. These outliers, in turn, influence statistical indicators such as RMSE and correlation. The observed agreement between PSI and plumb measurements is in line with observations reported for large dams elsewhere, where long-term deformation is captured reliably while short-term variability remains more challenging [10,11,12].
In contrast, the trigonometric measurements are taken only twice per year. As a result, many of the PSI outliers fall outside the sampled intervals and are naturally excluded from the comparison. This leads to improved statistical agreement, which is also reflected in the visual correspondence of the time series across most dam sites. The magnitude and spatial consistency of differences between PSI and trigonometry align with applications of major reservoirs outside Germany, with discrepancies of comparable order attributed to viewing geometry, reference choices, and local coherence conditions [10,11,12,13,14].
The process of pairing PSI and in situ data is essential for meaningful analysis, as dam structures often show heterogeneous deformation behaviors depending on location and height. For example, the Bigge dam exhibits distinct movement patterns between its two segments, and at the Möhne dam, vertical displacement increases toward the crest. Such spatial variability underscores the importance of localized analysis over aggregated comparisons.
Regarding structural orientation, Möhne and Lister dams yielded particularly good results, likely due to their favorable alignment with the satellite line of sight. Conversely, Fürwigge and Verse showed weaker agreement, presumably due to suboptimal orientation. Sorpe and Bigge presented moderate to good results, which will be discussed further in the following chapter.
Nevertheless, not all measurement pairs yielded strong correlations. In some cases, the mismatch between PSI and in situ data was significant, limiting the comparability. This highlights the need for careful point selection and preliminary inspection before integrating PSI data into automated workflows.
RMSE values also showed considerable variation across dam sites. One contributing factor is the presence of occasional signal offsets in the BBD time series, likely caused by changes in processing parameters or temporal decorrelation. These step-like shifts can distort error metrics, even when trend alignment appears reasonable.
A particularly noteworthy result was the improvement in the decomposed motion components (Vertical and East–West) in the 2021 dataset compared to 2020. The extended observation period led to stricter filtering, removing many noisy or unstable PS points from the Ascending and Descending geometries. This, in turn, improved the reliability of the decomposed values derived from the linear inversion. Similar effects have been reported in recent studies, where extending time series improved precision even at the cost of PS density [43,44].
However, the decomposition process inherently incorporates multiple surrounding PS points, often located on different parts or elevations of a structure. As such, direct spatial comparisons with discrete in situ measurements, especially on narrow structures like dam walls, must be interpreted cautiously. Furthermore, the decomposed components were not considered relevant for the dam walls in this study, as no significant vertical settlement is expected in these rigid structures [17,23]. They are primarily applicable to earth-fill dams, where vertical displacement due to consolidation is a typical behavior. Another aspect, which considers the motion-decomposed components in relation to the orientation of the dam structures, is addressed in the following chapter.
The trade-off between PS density and signal quality has also been addressed in broader PSI research. Studies show that lowering the temporal coherence threshold may increase the number of PS points but also introduces more noise and reduces comparability between updates [45]. To address this, approaches such as adaptive filtering or segment-wise classification have been proposed to balance spatial coverage and measurement quality [44,46]. Some authors recommend distinguishing between stable and semi-stable scatterers to maintain density without compromising interpretability [44].
Overall, this study’s results align well with these broader observations. The loss of PS points, although initially counterintuitive, can yield a net benefit in terms of accuracy and stability. Still, the implications for continuity, coverage, and the spatial representativeness of decomposed data require careful consideration when applying PSI datasets like BBD to localized infrastructure monitoring.

4.3. Limitations of BBD Data

A fundamental limitation of the PSI technique is its low sensitivity to ground motion in the North–South direction [47]. This is due to the acquisition geometry of most SAR satellites, which operate in near-polar orbits and observe the Earth’s surface at an oblique angle. As a result, PSI primarily detects displacement components projected onto the radar’s line of sight, mainly Vertical and East–West movements [48,49]. This geometric limitation should be considered when applying PSI to monitor dam structures where significant movement is expected along the North–South axis.
This is particularly relevant for dams oriented in an East–West direction. In the case of gravity dams, where deformation is mainly driven by horizontal water pressure and vertical movements are generally negligible [2,19,50], the North–South insensitivity of InSAR becomes especially problematic. For embankment dams, on the other hand, vertical settlement typically occurs, resulting in a measurable vertical component and thus a less severe impact of this geometric limitation [22,23,24,25,26,27]. Higher PS availability in the ascending geometry and the sensitivity to incidence angle are consistent with patterns described for other major dams, underscoring viewing geometry and layover/foreshortening as key determinants of PS yield [10,11,12].
This insensitivity is also reflected in the results. For the gravity dams, the highest agreement with the in situ measurements (both plumb line and interferometric data) is observed at the Lister dam. This dam is oriented in a North–South direction, meaning that horizontal displacements primarily occur in the East–West direction. This indicates a high sensitivity of the PSI data and explains the strong correlation with the ground-based measurements. In contrast, the Fürwigge dam, which is aligned in a northwest direction, is subject to significantly lower sensitivity, resulting in the lowest agreement with the reference data. For the Möhne, Sorpe, and Bigge dams, moderate agreement is observed due to their oblique orientation. The acquisition geometry at the Verse dam also shows low sensitivity.
To assess the general observability of dams using the PSI technique, Table 7 provides an overview of all gravity and embankment dams in the German federal state of North Rhine-Westphalia, including their geographic orientations. A distinction is made between the two dam types, but a combined classification is also provided.
The orientation of most dam structures allows for meaningful PSI analysis using PSI data from the BBD. Approximately 20% of all dams have an East–West orientation, which corresponds to low sensitivity. Another 20% show very favorable conditions with a North–South alignment, and around 60% are oriented obliquely, which generally allows for adequate observation. Differences between the two dam types in NRW are relatively small in this regard (see Table 7).
The geometric classification of dam structures conducted in this study aligns well with current methodological approaches in the literature. It has been shown that the observability of structures using PSI is largely determined by their orientation relative to the satellite’s line of sight [40]. In a feasibility study on operational dam monitoring with BBD PSI data, a so-called ∆RAD value was introduced to quantify the angle between the radial alignment of the structure and the satellite’s LOS direction. For angular deviations of ≤20°, approximately 50–70% of the radial motion could still be reliably captured in the LOS, depending on the local incidence angle. This quantitative assessment supports the high sensitivity observed in this study for North–South-oriented gravity dams with predominant East–West displacements (e.g., Lister Dam), as well as the significantly reduced observability of East–West-oriented embankments (e.g., Fürwigge Dam). The orientation-based classification presented in Table 7 further supports this geometry-driven evaluation and illustrates that reliable PSI analysis is highly dependent on the relative positioning of the structure to the satellite geometry.
Strategies to reduce the impact of InSAR’s North–South insensitivity can include support by auxiliary information such as digital elevation models, slope orientation, or geological context to infer probable movement directions [51]. A more robust solution involves integrating InSAR with GNSS measurements, enabling the reconstruction of full 3D displacement vectors and allowing detection of motion components that are otherwise invisible to radar LOS measurements [52]. However, this would result in a significant limitation for the automated use of BBD PSI data in dam monitoring.

4.4. Trade-Off Between Data Quantity and Data Quality

Extending the observation period from 2015–2020 to 2015–2021 reveals a clear trade-off in the PSI data. While the number of PS points decreases significantly due to stricter coherence requirements over the longer time span, the remaining points exhibit higher stability and reliability. This results in improved correlations with in situ measurements, such as trigonometric and plumb line data. In other words, although fewer points are available, their quality and agreement with ground truth data improve—indicating a shift from quantity toward enhanced measurement accuracy. Similar trends have been documented in PSI studies, where longer time series improve measurement precision but lead to temporal decorrelation and reduced point density [53,54]. These service-level patterns are in line with external evaluations of analysis-ready products, which likewise report shifts in PS yield across processing versions [15,16].
For some dam structures, the reduced point density further limits their observability, especially in cases where orientation and location already lead to poor PSI sensitivity. In several instances, more than 50% of the PS points are lost, with entire sections of the structure no longer covered. As a result, meaningful comparisons with ground-based measurements become impossible in those areas.
As fewer points are included in the calculation of Vertical and East–West components, the overall accuracy of these decomposed motions tends to improve. This is largely because many of the weaker points (those showing poor agreement with in situ data) are excluded during extended time series processing. This effect is consistent with findings from integrated PSI approaches, which show that stable scatterers over longer periods tend to provide more reliable deformation estimates [55,56]. On the other hand, the loss of Ascending or Descending points may lead to situations in which no decomposed Vertical or East–West motion can be derived at all.
A comparison with the planned 2022 time series would have been particularly relevant, since the temporal coherence threshold was intended to be lowered in that update, which likely would have increased PS density. However, such additions would require careful filtering to retain only reliable points. Including more low-coherence points might improve spatial coverage but degrade East–West projection accuracy.
Looking ahead, if future updates continue to relax the coherence threshold, PS point counts will likely increase but at the cost of overall quality and comparability across updates. In such cases, adaptive or sequential estimation methods, such as those based on temporal coherence adaptation or probabilistic change-point frameworks, may help maintain both quantity and quality by selectively integrating newly coherent points while discarding unreliable ones [57]. Manual filtering may still be required to ensure consistency in time-series comparisons. Likewise, X-band data could contribute to an increased point density [58], but there is currently no sufficient data source available to complement a large-scale product like the BBD. Overall, the findings define conditions for operational support, while full operational qualification remains dependent on site-specific requirements (e.g., vertical component accuracy, update frequency, documentation) as specified in DIN-aligned practice. Overall, the study constitutes a hypothesis-driven evaluation rather than a descriptive service review, and it supports operational-support use cases under DIN-aligned constraints.

5. Conclusions

For a comprehensive monitoring concept of dam structures, BBD PSI data can make a valuable contribution. The analyses showed high comparability between the BBD data from all satellite orbits and the measurement data provided by the Ruhrverband monitoring programs. Particularly significant are the differences between the individual BBD updates. The trade-off between point quantity and quality presents both advantages and disadvantages. Adjusting the threshold for temporal coherence could create new points for comparison in future BBD updates. How the quality of these points will change in future updates remains a subject for future statistical and visual analyses. However, it is likely that the loss of PS points and resulting blind spots along individual sections of a structure can be mitigated.
The analyses also clearly showed that not every PS point can be compared with arbitrary time series from the in situ measurements. By forming measurement pairs based on spatial proximity, corresponding points from both datasets could be successfully compared. Using BBD PSI data for such a small-scale study area as a dam site poses a number of challenges that must be considered during analysis. These include the type and geometry of the structure, as well as its size and orientation in geographical space.
Ultimately, this study highlights both the potential and the current limitations of using large-scale PSI datasets such as those from the BBD for the structural monitoring of critical infrastructure. While the spatial and temporal resolution of the data enables valuable insights, their application to small, complex structures like dams requires careful preprocessing, pairing strategies, and interpretation. As an observational multi-site study with predefined criteria and statistical evaluation, the findings extend beyond the Ruhrverband context and inform suitability assessments at comparable dams. Accordingly, the results should be interpreted as evidence for operational support, clarifying when PSI can complement DIN-aligned programs, rather than as a replacement or full operational certification. Future improvements in processing strategies, such as more flexible coherence thresholds, adaptive filtering, or integration with complementary data sources, could significantly enhance the usability of these datasets in operational dam safety monitoring.

Author Contributions

Conceptualization, J.J. and C.D.; methodology, J.J.; software, J.J.; validation, J.J., J.Z., C.W., A.C.K., T.L. and C.D.; formal analysis, J.J., J.Z., C.W. and C.D.; investigation, J.J.; resources, J.J., C.W., A.C.K., T.L. and K.L.; data curation, J.J., C.W., A.C.K. and T.L.; writing—original draft preparation, J.J.; writing—review and editing, J.J., J.Z., C.W., A.C.K. and C.D.; visualization, J.J.; supervision, K.L., C.S. and C.D.; project administration, C.S. and C.D.; funding acquisition, C.S., C.D. and K.L. All authors have read and agreed to the published version of the manuscript.

Funding

This research was funded by DLR with funds provided by the Federal Ministry for Economic Affairs and Climate Action (BMWK) due to an enactment of the German Bundestag, grant number 50EE2202A. We also acknowledge support by the German Research Foundation Projekt-Nr. 512648189 and the Open Access Publication Fund of the Thüringer Universitäts- und Landesbibliothek Jena.

Data Availability Statement

The data presented in this study are available on request from the corresponding author. The data are not publicly available due to legal and privacy issues.

Acknowledgments

We acknowledge financial support through DLR with funds provided by the Federal Ministry for Economic Affairs and Climate Action (BMWK) due to an enactment of the German Bundestag under Grand No. 50EE2202A.

Conflicts of Interest

The authors declare no conflicts of interest.

Abbreviations

The following abbreviations are used in this manuscript:
BBDBodenbewegungsDienst Deutschland—German Ground Motion Service
DInSARDifferential Interferometric SAR
DSDistributed Scatterer Pixel
ECRElectronic Corner Reflector
EGMSEuropean Ground Motion Service
ESAEuropean Space Agency
GMSGround Motion Service
GNSSGlobal Navigation Satellite System
LOSLine-of-Sight
MAEMean Absolute Error
MedAEMedian Absolute Error
NRWNorth Rhine-Westphalia
PSPersistent Scatterer Pixel
PSIPersistent Scatterer Interferometry
RMSERoot Mean Square Error
SARSynthetic Aperture Radar

References

  1. DIN 19700-10; Dam Structures—Part 10: General Provisions. DIN: Berlin, Germany, 2004.
  2. Jänichen, J.; Schmullius, C.; Baade, J.; Last, K.; Bettzieche, V.; Dubois, C. Monitoring of radial deformations of a gravity dam using Sentinel-1 persistent scatterer interferometry. Remote Sens. 2022, 14, 1112. [Google Scholar] [CrossRef]
  3. Bettzieche, V. Satellitenüberwachung der Verformungen von Staumauern und Staudämmen. Wasserwirtschaft 2020, 9, 48–51. [Google Scholar] [CrossRef]
  4. Ferretti, A.; Prati, C.; Rocca, F. Analysis of permanent scatterers in SAR interferometry. In Proceedings of the IGARSS 2000, IEEE 2000 International Geoscience and Remote Sensing Symposium, Taking the Pulse of the Planet: The Role of Remote Sensing in Managing the Environment, Proceedings (Cat. No. 00CH37120), Honolulu, HI, USA, 24–28 July 2000; Volume 2, pp. 761–763. [Google Scholar] [CrossRef]
  5. Ferretti, A.; Prati, C.; Rocca, F. Permanent scatterers in SAR interferometry. IEEE Trans. Geosci. Remote Sens. 2001, 39, 8–20. [Google Scholar] [CrossRef]
  6. Kalia, A.C.; Frei, M.; Lege, T. BodenBewegungsdienst Deutschland (BBD): Konzept, Umsetzung und Service-Plattform. ZfV-Z. Für Geodäsie Geoinf. Landmanagement 2021, 146, 273–279. [Google Scholar]
  7. Bundesanstalt für Geowissenschaften und Rohstoffe (BGR). BodenBewegungsdienst Deutschland (BBD). Available online: https://bodenbewegungsdienst.bgr.de/mapapps/resources/apps/bbd/index.html?lang=de (accessed on 5 January 2025).
  8. Dubois, C.; Ziemer, J.; Jänichen, J.; Stumpf, N.; Liedel, C.; Sabrowski, M.; Schmullius, C. Dam Monitoring with Ground Motion Services–A Case Study of a Gravity Dam with the German Ground Motion Service. In Proceedings of the IGARSS 2024, IEEE 2024 International Geoscience and Remote Sensing Symposium, Athens, Greece, 7–12 July 2024; pp. 4670–4673. [Google Scholar] [CrossRef]
  9. EGMS. European Ground Motion Service (EGMS). Available online: https://egms.land.copernicus.eu/ (accessed on 5 January 2025).
  10. Milillo, P.; Porcu, M.C.; Londgren, P.; Soccodato, F.; Alzer, J.; Fielding, E.; Bürgmann, R.; Milillo, G.; Perissin, D.; Biondi, F. The ongoing destabilization of the Mosul Dam as observed by synthetic aperture radar interferometry. In Proceedings of the IEEE International Geoscience and Remote Sensing Symposium (IGARSS), Fort Worth, TX, USA, 23–28 July 2017; pp. 6279–6282. [Google Scholar] [CrossRef]
  11. Ruiz-Armenteros, A.M.; Marchamalo-Sacristán, M.; Bakoň, M.; Lamas-Fernández, F.; Delgado, J.M.; Sánchez-Ballesteros, V.; Papco, J.; González-Rodrigo, B.; Lazecky, M.; Perissin, D.; et al. Monitoring of an Embankment Dam in Southern Spain Based on Sentinel-1 Time-Series InSAR. Procedia Comput. Sci. 2021, 181, 353–359. [Google Scholar] [CrossRef]
  12. Abo, H.; Osawa, T.; Ge, P.; Takahashi, A.; Yamagishi, K. Deformation Monitoring of Large-Scale Rockfill Dam Applying Persistent Scatterer Interferometry (PSI) Using Sentinel-1 SAR Data. In Proceedings of the 2021 7th Asia-Pacific Conference on Synthetic Aperture Radar (APSAR), Bali, Indonesia, 1–3 November 2021; pp. 1–6. [Google Scholar] [CrossRef]
  13. Wang, Z.; Perissin, D. Cosmo SkyMed AO projects-3D reconstruction and stability monitoring of the Three Gorges Dam. In Proceedings of the 2012 IEEE International Geoscience and Remote Sensing Symposium, Munich, Germany, 22–27 July 2012; pp. 3831–3834. [Google Scholar] [CrossRef]
  14. Lazecký, M.; Perissin, D.; Zhiying, W.; Ling, L.; Yuxiao, Q. Observing dam’s movements with spaceborne SAR interferometry. In Engineering Geology for Society and Territory; Lollino, G., Manconi, A., Guzzetti, F., Culshaw, M., Bobrowsky, P., Luino, F., Eds.; Springer: Cham, Switzerland, 2015; Volume 5, pp. 131–136. [Google Scholar] [CrossRef]
  15. Even, M.; Westerhaus, M.; Kutterer, H. German and European Ground Motion Service: A Comparison. PFG-J. Photogramm. Remote Sens. Geoinf. Sci. 2024, 92, 253–270. [Google Scholar] [CrossRef]
  16. Marchamalo-Sacristán, M.; Fernández-Landa, A.; Sancho, C.; Hernández-Cabezudo, A.; Krishnakumar, V.; García-Lanchares, C.; Lamas-Fernández, F. EyeRADAR-Dam: Integration of MT-InSAR with monitoring technologies in a pilot monitoring system for embankment dams. Procedia Comput. Sci. 2024, 239, 2286–2292. [Google Scholar] [CrossRef]
  17. Ruhrverband. (Möhnetalsperre, Möhnesee, Germany); Sicherheitsbericht 2013, Teil A. Unpublished security report. 2013. [Google Scholar]
  18. Ruhrverband. (Möhnetalsperre, Möhnesee, Germany); Sicherheitsbericht 2020, Teil B. Unpublished security report. 2020. [Google Scholar]
  19. Ruhrverband. (Möhnetalsperre, Möhnesee, Germany); Vertiefte Überprüfung 2018, Analyse der Messdaten. Unpublished security report. 2018. [Google Scholar]
  20. Ruhrverband. (Fürwiggetalsperre, Lüdenscheid, Germany); Sicherheitsbericht 2010, Teil A. Unpublished security report. 2010. [Google Scholar]
  21. Ruhrverband. (Fürwiggetalsperre, Lüdenscheid, Germany); Sicherheitsbericht 2021, Teil B. Unpublished security report. 2021. [Google Scholar]
  22. Ruhrverband. (Biggetalsperre, Attendorn, Germany); Sicherheitsbericht 2019, Teil A. Unpublished security report. 2019. [Google Scholar]
  23. Ruhrverband. (Biggetalsperre, Attendorn, Germany); Sicherheitsbericht 2020, Teil B. Unpublished security report. 2020. [Google Scholar]
  24. Ruhrverband. (Versetalsperre, Lüdenscheid, Germany); Sicherheitsbericht 2020, Teil A. Unpublished security report. 2020. [Google Scholar]
  25. Ruhrverband. (Versetalsperre, Lüdenscheid, Germany); Sicherheitsbericht 2020, Teil B. Unpublished security report. 2020. [Google Scholar]
  26. Ruhrverband. (Sorpetalsperre, Sundern, Germany); Sicherheitsbericht 1993, Teil A. Unpublished security report. 1993. [Google Scholar]
  27. Ruhrverband. (Sorpetalsperre, Sundern, Germany); Sicherheitsbericht 2020, Teil B. Unpublished security report. 2020. [Google Scholar]
  28. Zebker, H.A.; Villasenor, J. Decorrelation in interferometric radar echoes. IEEE Trans. Geosci. Remote Sens. 1992, 30, 950–959. [Google Scholar] [CrossRef]
  29. Crosetto, M.; Monserrat, O.; Barra, A.; Frunzio, G.; Novellino, A. Validation of Ground Motion Datasets in Operational PSI Services: Methods and Findings from EGMS. Remote Sens. 2023, 15, 1982. [Google Scholar] [CrossRef]
  30. Crosetto, M.; Monserrat, O.; Cuevas-González, M.; Devanthéry, N.; Crippa, B. Persistent Scatterer Interferometry: A review. ISPRS J. Photogramm. Remote Sens. 2016, 115, 78–89. [Google Scholar] [CrossRef]
  31. Pedretti, L.; Bordoni, M.; Vivaldi, V.; Figini, S.; Parnigoni, M.; Grossi, A.; Lanteri, L.; Tararbra, M.; Negro, N.; Meisina, C. InterpolatiON of InSAR Time Series for the dEtection of ground deforMatiOn eVEnts (ONtheMOVE): Application to Slow-Moving Landslides. Landslides 2023, 20, 1797–1815. [Google Scholar] [CrossRef]
  32. Afzal, Z.; Balz, T.; Asghar, A. Non-Linear PSInSAR Analysis of Deformation Patterns in Islamabad/Rawalpindi Region: Unveiling Tectonics and Earthquake-Driven Changes. Remote Sens. 2024, 16, 1194. [Google Scholar] [CrossRef]
  33. Moretto, S.; Bozzano, F.; Mazzanti, P. The Role of Satellite InSAR for Landslide Forecasting: Limitations and Openings. Remote Sens. 2021, 13, 3735. [Google Scholar] [CrossRef]
  34. Vradi, M.; Mikosch, D.; Vanneschi, C. Validating the European Ground Motion Service: An Assessment of Measurement Point Density. ISPRS Arch. 2023, XLVIII-4/W7, 247–254. [Google Scholar] [CrossRef]
  35. Gido, N.A.A.; Nilfouroushan, F.; Kiamehr, R.; Olsson, P.-A. Localized Subsidence Zones in Gävle City Detected by Sentinel-1 PSI and Leveling Data. Remote Sens. 2020, 12, 2629. [Google Scholar] [CrossRef]
  36. Nilfouroushan, F.; Gido, N.; Olsson, P.-A.; Gedara, C.P. Contributions from Lantmäteriet to the InSAR-Sweden Project: Validation of InSAR-Sweden with PSI Studies in Uppsala and Gävle. Lantmäterirapport 2023, 1, 1–40. Available online: https://www.lantmateriet.se/globalassets/geodata/gps-och-geodetisk-matning/rapporter/lantmaterirapport_2023-1.pdf (accessed on 30 July 2025).
  37. Hooper, A. A multi-temporal InSAR method incorporating both persistent scatterer and small baseline approaches. Geophys. Res. Lett. 2008, 35, L16302. [Google Scholar] [CrossRef]
  38. Jänichen, J.; Ziemer, J.; Wolsza, M.; Klöpper, D.; Weltmann, S.; Wicker, C.; Last, K.; Schmullius, C.; Dubois, C. Towards Operational Dam Monitoring with PS-InSAR and Electronic Corner Reflectors. Remote Sens. 2025, 17, 1318. [Google Scholar] [CrossRef]
  39. Jänichen, J.; Ziemer, J.; Wicker, C.; Klöpper, D.; Last, K.; Wolsza, M.; Schmullius, C.; Dubois, C. Enahncing Dam Monitoring: Utilizing the CR-Index for Electronic Corner Reflector (ECR) Site Selection and PSI Analysis. In Proceedings of the IGARSS 2024—2024 IEEE International Geoscience and Remote Sensing Symposium, Athens, Greece, 7–12 July 2024. [Google Scholar]
  40. Ziemer, J.; Jänichen, J.; Wicker, C.; Klöpper, D.; Last, K.; Kalia, A.; Lege, T.; Schmullius, C.; Dubois, C. Assessing the Feasibility of Persistent Scatterer Data for Operational Dam Monitoring in Germany: A Case Study. Remote Sens. 2025, 17, 1202. [Google Scholar] [CrossRef]
  41. GAF AG. BBD–Bodenbewegungsdienst Deutschland, Produktpräsentation auf der ESA Fringe Konferenz 2023; ESA FRINGE 2023: Frascati, Italy, 2023; Available online: https://fringe2023.esa.int/iframe-agenda/files/presentation-293.pdf (accessed on 30 July 2025).
  42. Cuervas-Mons, J.; Domínguez-Cuesta, M.J.; Jiménez-Sánchez, M. Potential and Limitations of the New European Ground Motion Service in Landslides at a Local Scale. Appl. Sci. 2024, 14, 7796. [Google Scholar] [CrossRef]
  43. Cigna, F.; Ramírez, R.E.; Tapete, D. Accuracy of Sentinel-1 PSI and SBAS InSAR Displacement Velocities against GNSS and Geodetic Leveling Monitoring Data. Remote Sens. 2021, 13, 4800. [Google Scholar] [CrossRef]
  44. Zhang, J.; Duan, W.; Fu, X.; Yun, Y.; Lv, X. The Stepwise Multi-Temporal Interferometric Synthetic Aperture Radar with Partially Coherent Scatterers for Long-Time Series Deformation Monitoring. Remote Sens. 2025, 17, 1374. [Google Scholar] [CrossRef]
  45. Scoular, J.; Ghail, R.; Mason, P.; Lawrence, J. Are measured InSAR displacements a function of the chosen processing method? Q. J. Eng. Geol. Hydrogeol. 2022, 56, e122022-049. [Google Scholar] [CrossRef]
  46. Sánchez-Fernández, J.; Fernández-Landa, A.; Hernández Cabezudo, Á.; Molina Sánchez, R. Interferometric Synthetic Aperture Radar Phase Linking with Level 2 Coregistered Single Look Complexes: Enhancing Infrastructure Monitoring Accuracy at Algeciras Port. Remote Sens. 2024, 16, 3966. [Google Scholar] [CrossRef]
  47. Cakir, Z.; Aslan, A.; Gungor, O.; Gunay, A. Landslide Mapping and Monitoring Using Persistent Scatterer Interferometry in Vegetated Areas. Remote Sens. 2020, 12, 1305. [Google Scholar] [CrossRef]
  48. Crosetto, M.; Monserrat, O.; Cuevas-González, M.; Crippa, B. Persistent Scatterer Interferometry: Potential, Limits and Initial C- and X-band Comparison. Photogramm. Eng. Remote Sens. 2010, 76, 1061–1069. [Google Scholar] [CrossRef]
  49. Barone, A.; Fedi, M.; Pepe, A.; Mastro, P.; Tizzani, P.; Castaldo, R. Inferring 3-D displacement time series through InSAR measurements and potential field theory in volcanic areas. Sci. Rep. 2025, 15, 4719. [Google Scholar] [CrossRef]
  50. Bettzieche, V. Mathematisch-Statistische Analyse von Messwerten der Talsperrenüberwachung. Wasserwirtschaft 2004, 94, 30–34. [Google Scholar] [CrossRef]
  51. Shang, J.; Wang, M.; Wang, X.; Yang, M.; Wu, Y.; Du, W. Three-Dimensional Surface Deformation Field Monitoring and Influencing Factors Analysis in Mountainous Areas Based on SBAS-InSAR Technology (Tianjin, China). Sci. Rep. 2025, 15, 25702. [Google Scholar] [CrossRef]
  52. Lin, Y.; Chang, Z.; Wang, X.; Chen, Z. Combining InSAR and GPS to Determine Transient Movement and Thickness of a Seasonally Active Low-Gradient Translational Landslide. Geophys. Res. Lett. 2018, 45, 1453–1462. [Google Scholar] [CrossRef]
  53. Sadeghi, Z.; Wright, T.J.; Hooper, A.J.; Jordan, C.; Novellino, A.; Bateson, L.; Biggs, J. Benchmarking and Inter-Comparison of Sentinel-1 InSAR Velocities and Time Series. Remote Sens. Environ. 2021, 256, 112306. [Google Scholar] [CrossRef]
  54. Fabris, M.; Battaglia, M.; Chen, X.; Menin, A.; Monego, M.; Floris, M. An Integrated InSAR and GNSS Approach to Monitor Land Subsidence in the Po River Delta (Italy). Remote Sens. 2022, 14, 5578. [Google Scholar] [CrossRef]
  55. Dörr, M.; Schenk, A.; Hinz, S. Fully Integrated Temporary Persistent Scatterer Interferometry. IEEE Trans. Geosci. Remote Sens. 2022, 60, 4412815. [Google Scholar] [CrossRef]
  56. Hu, J.; Wang, T.; Ding, X.; Zhu, J.; Zhang, L. Incorporating Temporarily Coherent Targets into Persistent Scatterer Interferometry for Improved Monitoring of Urban Subsidence. ISPRS J. Photogramm. Remote Sens. 2012, 68, 102–112. [Google Scholar] [CrossRef]
  57. Yang, C.H.; Soergel, U. Adaptive 4D PSI-based Change Detection for High-Quality Scatterer Time Series. ISPRS Ann. Photogramm. Remote Sens. Spatial Inf. Sci. 2018, IV-3, 453–460. [Google Scholar] [CrossRef]
  58. Ziemer, J.; Jänichen, J.; Stein, G.; Liedel, N.; Wicker, C.; Last, K.; Denzler, J.; Schmullius, C.; Shadaydeh, M.; Dubois, C. Identifying Deformation Drivers in Dam Segments Using Combined X- and C-Band PS Time Series. Remote Sens. 2025, 17, 2629. [Google Scholar] [CrossRef]
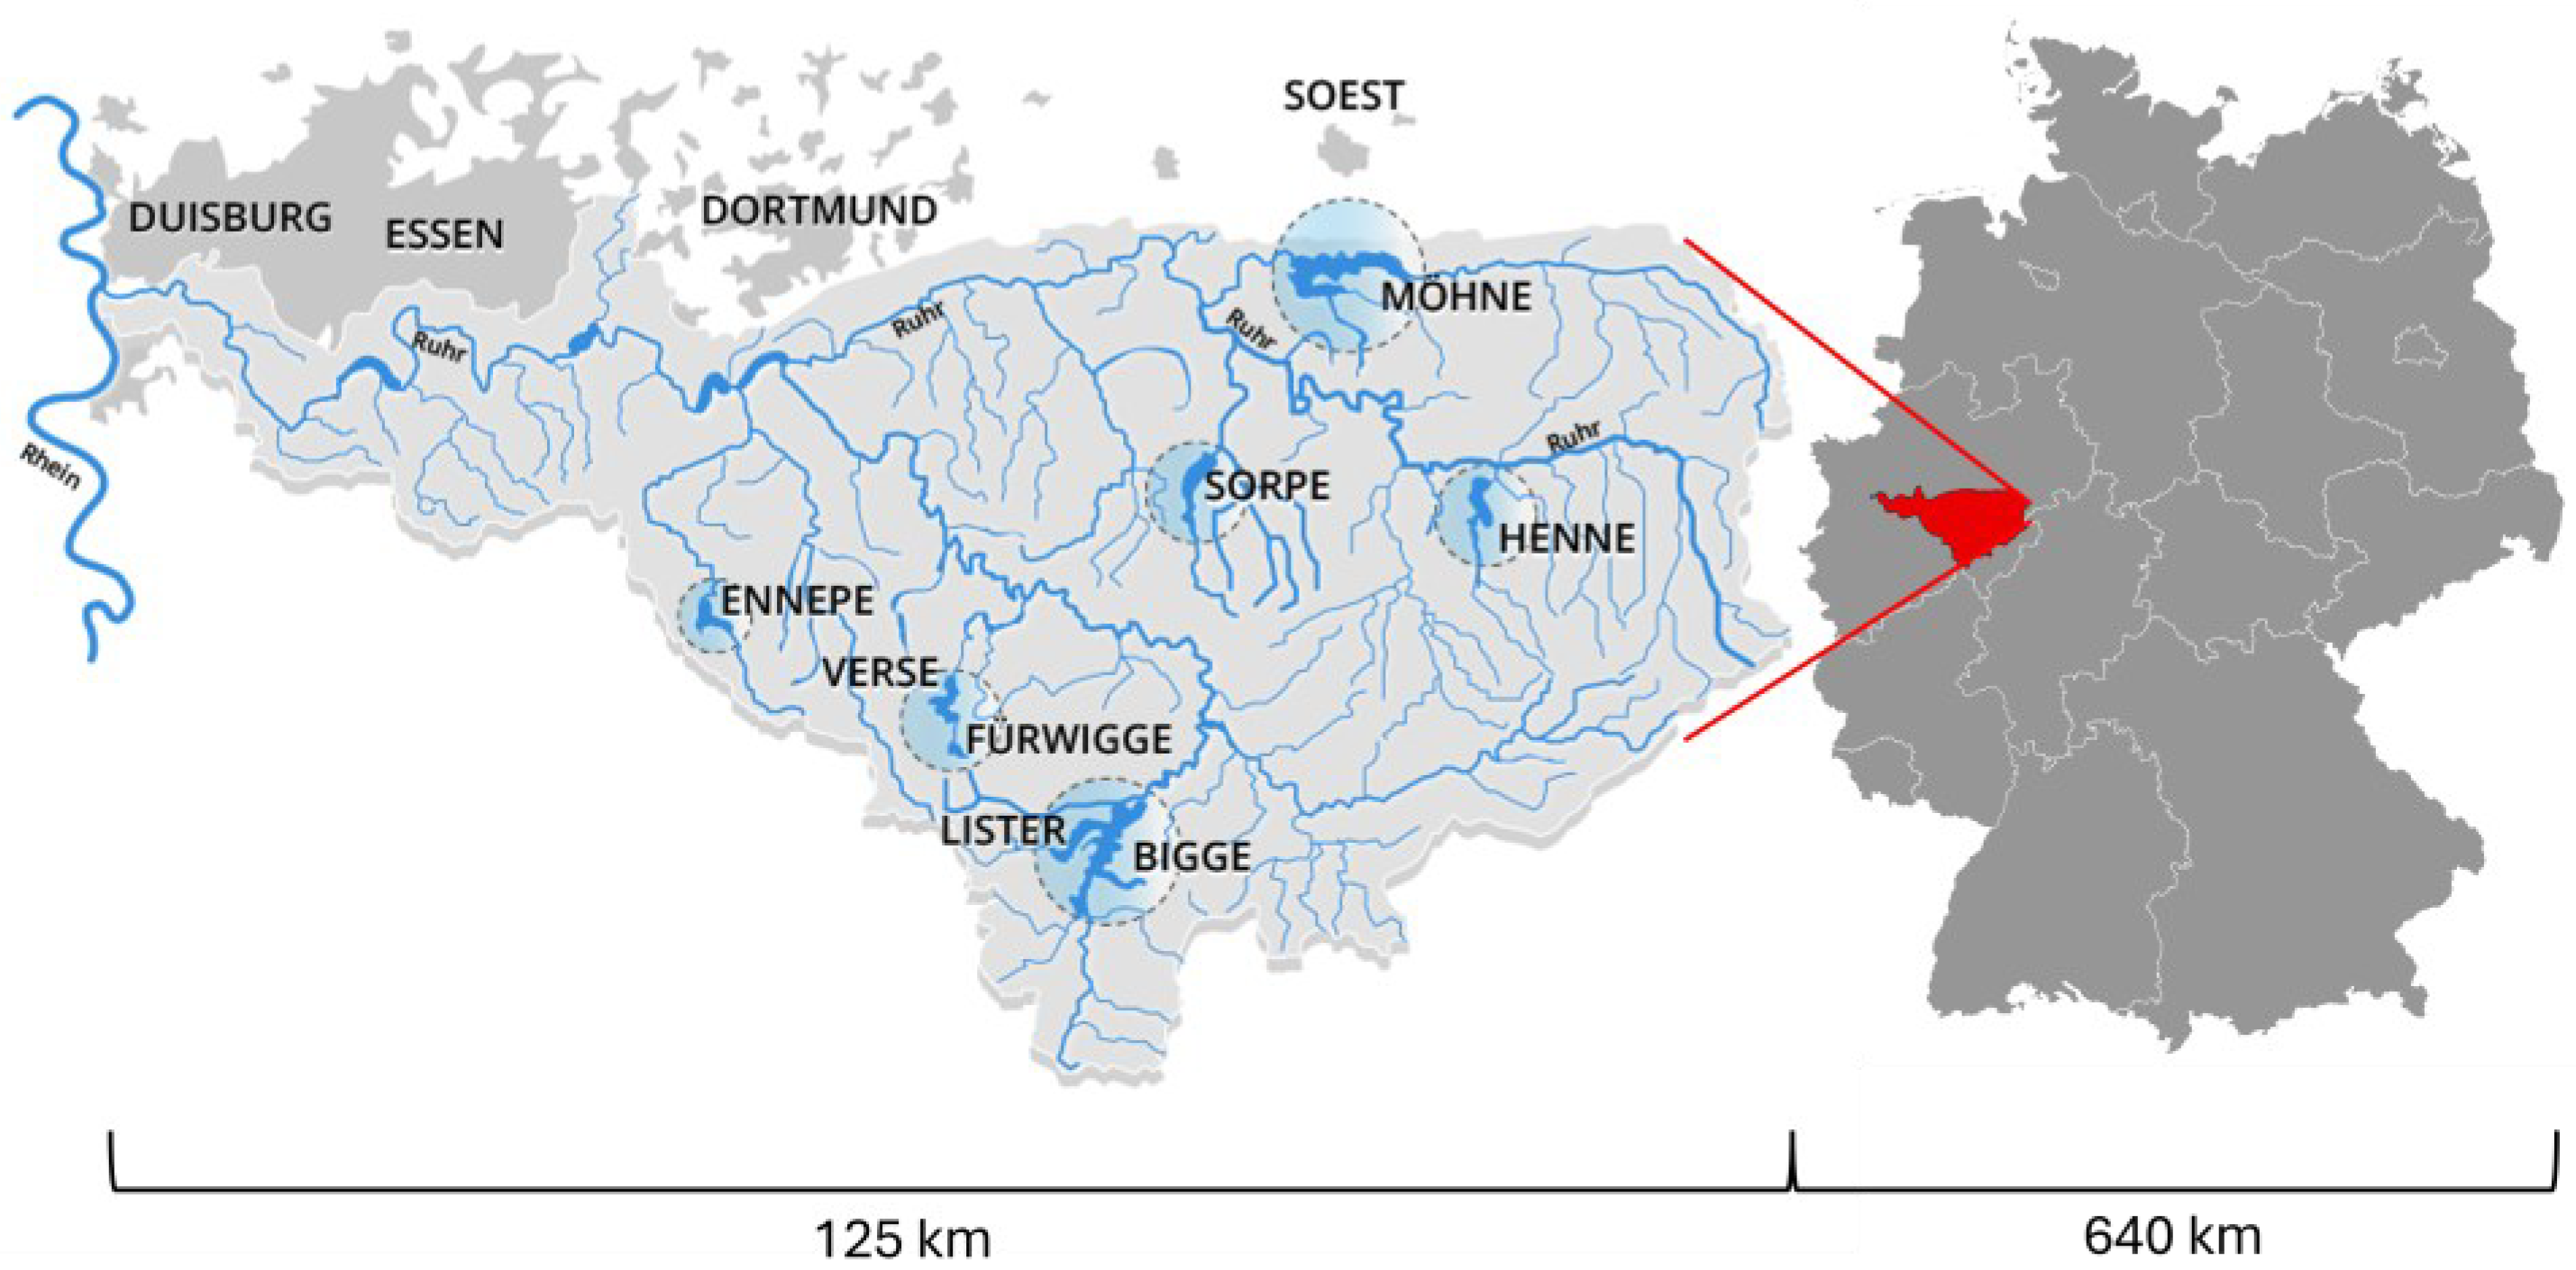
Figure 1. Jurisdiction of the Ruhrverband, including major rivers and reservoirs, and its location within Germany [17,18,19,20,21,22,23,24,25,26,27].
Remotesensing 17 03649 g001
Figure 2. Photos of the six dams included in this study: gravity dams (A) Möhne, (B) Lister, (C) Fürwigge; embankment dams (D) Sorpe, (E) Bigge, (F) Verse.
Remotesensing 17 03649 g002aRemotesensing 17 03649 g002b
Figure 3. Observation points for horizontal and vertical displacements at the Möhne Dam, including the location of the plumb line. Vertically exaggerated by a factor of two [17].
Remotesensing 17 03649 g003
Figure 4. Workflow of this study. The analysis includes preprocessing of in situ data and PSI data from the BBD (2015–2020 and 2015–2021), followed by statistical analysis.
Remotesensing 17 03649 g004
Figure 5. PS distribution [7] for each analyzed dam (Ascending, Descending, East–West, Vertical) and for both observation periods (2015–2020 and 2015–2021 respectively). Markers denote centroids of the 50 m BBD decomposition grid (not individual PS). Centroids may plot over water if contributing PS within the cell originate from adjacent structures; (A) Möhne Dam; (B) Lister Dam; (C) Fürwigge Dam; (D) Sorpe Dam; (E) Bigge Dam; (F) Verse Dam.
Remotesensing 17 03649 g005
Figure 6. Comparison of best performing PS from each available data stack (2015–2020 and 2015–2021) [7] and plumb measurements for the Möhne Dam [17,18,19,20,21,22,23,24,25,26,27,28,29]. (A) Ascending 015_05/06 2020; (B) BBD Descending 139_07/066_08 2020; (C) East–West 2020; (D) Ascending 015_05/06 2021; (E) Descending 139_07/066_08 2021; (F) East–West 2021.
Remotesensing 17 03649 g006
Figure 7. Comparison of averaged PSI data [7] and plumb measurements for the Möhne Dam [17,18,19,20,21,22,23,24,25,26,27,28,29]. (A) Ascending 015_05/06 2020; (B) Descending 139_07/066_08 2020; (C) East–West 2020; (D) Ascending 015_05/06 2021; (E) Descending 139_07/066_08 2021; (F) East–West 2021.
Remotesensing 17 03649 g007
Figure 8. Comparison of best performing PS from each available data stack (2015–2020 and 2015–2021) [7] and plumb measurements for the Fürwigge Dam [20,21]. (A) Ascending 015_06 2020; (B) Descending 139_08 2020; (C) East–West 2020; (D) Ascending 015_06 2021; (E) Descending 139_08 2021.
Remotesensing 17 03649 g008
Figure 9. Comparison of averaged PSI data (2020 and 2021) [7] and plumb measurements for the Fürwigge Dam [20,21]. (A) Ascending 015_06 2020; (B) Descending 139_08 2020; (C) East–West 2020; (D) Ascending 015_06 2021; (E) Descending 139_08 2021.
Remotesensing 17 03649 g009
Figure 10. Comparison of averaged PSI data (2020 and 2021) [7] and trigonometric measurements for the Möhne Dam [17,18,19]. (A) Ascending 015_06 2020; (B) Descending 066_08 2020; (C) East–West 2020; (D) Ascending 015_05 2021; (E) Descending 066_08 2021; (F) East–West 2021.
Remotesensing 17 03649 g010
Table 1. Overview of Sentinel-1 PSI data stacks from the BBD [7]. Apart from the number of scenes, all parameters are identical for both datasets (2015–2020 and 2015–2021).
OrbitStack-IDNumber Scenes (2015–2020)Number Scenes (2015–2021)Incidence Angle Range (°)Look Angle (°)
Ascending015_0528234139.484
015_0628234139.484
088_0329235145.584
Descending066_0829835545.7276
139_0729234937.8276
139_0828233937.8276
Table 2. Measurement types, intervals, and point counts for in situ monitoring at the six dams from the Ruhrverband [17,18,19,20,21,22,23,24,25,26,27].
DamDam TypePlumb:
Interval—No. Points
Trigonometry:
Interval—No. Points
MöhneGravity Damdaily—1semi-annual—27
Listersemi-annual—16
Fürwiggedaily—2semi-annual—15
SorpeEmbankment Damannual—10
Biggeannual—13
Verseannual—5
Table 3. Number of PS points from the BBD for each data stack and observation period (2015–2020 vs. 2015–2021) [7]. “–“ indicates that the respective data stack is not available for the given dam, while “0” means that the stack covers the dam area but no PS points were detected.
DamPeriodVertical/
East–West
Ascending
015_05
Ascending
015_06
Ascending
088_03
Descending
066_08
Descending
139_07
Descending
139_08
Möhne2015–2020112930711
2015–20211272733
Lister2015–2020246
2015–2021135
Fürwigge2015–20201016
2015–20210004
Sorpe2015–20209342310
2015–202152595
Bigge2015–2020118
2015–2021113
Verse2015–20204774
2015–20210112
Table 4. Results of comparisons between Plumb measurements [17,18,19,20,21] and PSI mean values [7] for Möhne Dam and Fürwigge Dam. Results are shown for both time periods and for all available data stacks. Comparative statistics: Correlation (Pearson) and p Value, Root Mean Square Error (RMSE), Mean Absolute Error (MAE).
DamStackPearson
(r)
pRMSE
[mm]
MAE
[mm]
MöhneAsc. 015_05 20200.220.0245.444.28
Asc. 015_05 20210.340.0223.973.29
Asc. 015_06 20200.240.0624.774.42
Asc. 015_06 20210.380.0643.442.86
Desc. 066_08 20200.430.01313.3311.22
Desc. 066_08 20210.520.01211.069.96
Desc. 139_07 20200.520.0118.998.73
Desc. 139_07 20210.660.017.686.70
East–West 20200.440.0126.796.12
East–West 20210.750.013.452.34
Vertical 20200.140.0127.217.33
Vertical 20210.180.015.985.20
FürwiggeAsc. 015_06 2020–0.1020.327.767.13
Asc. 015_06 2021–0.0410.456.235.18
Desc. 139_08 20200.030.0837.876.43
Desc. 139_08 20210.120.0325.624.88
Table 5. Results of comparisons between Plumb measurements [17,18,19,20,21] and the best performing PS of each stack [7] for Möhne Dam and Fürwigge Dam. Results are shown for both time periods and for all available data stacks. Comparative statistics: Correlation (Pearson) and p Value, Root Mean Square Error (RMSE), Mean Absolute Error (MAE).
DamStackPearson
(r)
pRMSE
[mm]
MAE
[mm]
MöhneAsc. 015_05 20200.480.024.223.29
Asc. 015_05 20210.610.023.202.32
Asc. 015_06 20200.490.033.983.22
Asc. 015_06 20210.630.023.422.57
Desc. 066_08 20200.390.024.229.01
Desc. 066_08 20210.540.013.077.74
Desc. 139_07 20200.460.014.329.04
Desc. 139_07 20210.650.012.978.61
East–West 20200.270.029.017
East–West 20210.750.017.456.34
Vertical 20200.120.026.445.76
Vertical 20210.180.025.985.20
FürwiggeAsc. 015_06 2020–0.1210.458.227.34
Asc. 015_06 2021–0.0410.456.235.18
Desc. 139_08 20200.110.0094.674.10
Desc. 139_08 20210.270.013.462.83
East–West 20200.230.034.554.076
Vertical 20200.040.037.325.02
Table 6. Results of comparisons between Trigonometric measurements [17,18,19,20,21,22,23,24,25,26,27] and best performing PS [7].
DamValueRMSE 2020 (mm)RMSE 2021 (mm)Pearson (r) 2020Pearson (r) 2021
MöhneAsc. 015_051.461.690.740.79
Asc. 015_061.481.670.750.78
Desc. 066_081.572.690.760.87
Desc. 139_071.561.70.720.87
East–West2.430.940.720.89
Vertical2.932.220.140.20
FürwiggeAsc. 015_064.334.160.40.41
Asc. 088_034.434.020.430.41
Desc. 139_083.923.760.320.33
East–West6.267.220.320.38
Vertical7.127.760.170.1
ListerAsc. 015_062.032.560.840.87
Desc. 139_082.552.450.910.88
East–West2.762.290.810.84
Vertical3.823.510.210.20
BiggeAsc. 015_060.990.820.540.63
Desc. 139_081.21.020.510.54
East–West1.421.340.470.62
Vertical1.451.440.560.62
SorpeAsc. 015_064.895.760.850.88
Desc. 139_078.228.120.790.72
Desc. 139_087.416.980.730.76
East–West2.282.080.600.61
Vertical1.991.860.450.54
VerseAsc. 015_062.332.290.320.36
Asc. 088_032.963.220.210.29
Desc. 139_082.342.290.140.23
East–West2.672.510.210.26
Vertical1.982.010.150.2
Table 7. Classification of the orientations of dam structures in North Rhine-Westphalia, Germany.
Dam TypeNorth–SouthEast–WestObliqueTotal
Gravity Dam461626
15.38%23.08%61.54%100%
Embankment Dam861933
24.24%18.18%57.58%100%
Both Types12123559
20.34%20.34%59.32%100%
Disclaimer/Publisher’s Note: The statements, opinions and data contained in all publications are solely those of the individual author(s) and contributor(s) and not of MDPI and/or the editor(s). MDPI and/or the editor(s) disclaim responsibility for any injury to people or property resulting from any ideas, methods, instructions or products referred to in the content.