Highlights
What are the main findings?
- Present a methodology based on multispectral satellite images to identify green roofs at the city scale.
- Apply deep learning techniques to identify the geometric shapes of buildings to overcome the lack of geospatial information.
What are the implications of the main findings?
- The methodology can be applied to green roofs, either at the top-level (single buildings) or ground level (shared spaces by groups of buildings).
- Enables urban planners and environmental entities to monitor and quantify green infrastructure at a city level.
Abstract
The identification of strategies to mitigate climate change and address urban challenges is nowadays a priority for urban planners. The installation of green roofs (GR), as a natural-based solution, is widely promoted. Despite this recognition, most installations result from individual initiatives, and their mapping and monitoring remains absent. Over time, the installation of green roofs has followed the building construction sector, moving from individual to groups of buildings organ, grouped in condominiums, on which common shared areas at ground level are covered with GR. The identification of those GRs is important, as they represent the majority of the GR installations in urban areas; however, this task is still very challenging due to the lack of information about the condominium boundaries. This work proposes a methodology for mapping GR at a top and ground level, and monitoring them, through the use of Support Vector Machine classification process, deep learning models, and GIS-based spatial analysis. Applied to the Lisbon Municipality, the methodology enabled the identification and validation of 196 GR. The results demonstrate the effectiveness and scalability of the proposed approach, which surpasses existing methods and is adaptable to diverse urban contexts without reliance on location-specific characteristics.
1. Introduction
Cities today face unprecedented urban challenges concerning climate change adaption and the identification of mitigation actions needs to be addressed to assure human health [1,2]. Green roofs (GR) have emerged as a promising nature-based solution due to their multifunctional ecosystem services, as highlighted by [3,4] and revised by [5]; however, most Mediterranean countries in Europe have not yet adopted neither policies nor incentives for the installation of GR [3]. The existence of updated maps with the location of the green roofs is crucial to understand its representativeness in the urban environment and their role in the green connectivity and in the urban regeneration. Mapping and monitoring GR are particularly urgent activities as, in general, at a municipality scale, no spatial data infrastructures dedicated to it exist [6]. The availability of an up-to-date inventory, and an expedite monitoring tool, capable of assessing the greenness condition, is therefore essential for an effective city green infrastructure management.
Mapping building GR is not conceptually complex; however, the inexistence of spatial data to support their identification, particularly with regards to GR located at street level (usually over underground parking structures to which no geometric information exists) makes the problem very challenging.
Some researchers have conducted work in this field. Ref. [7] developed a methodology to analyze and monitor green roofs utilizing the capabilities of Sentinel-1, Sentinel-2, and Landsat-8 remote sensing data. Sentinel-1 enabled the retrieval of information focused on land surface characteristics and soil moisture, while Sentinel-2 was employed to estimate vegetation conditions through the use of the Normalized Difference Vegetation Index (NDVI). Refs. [8,9] proposed a methodology to assess the potential of green coverage at the rooftop level and pinpoint optimal locations for installing new green roofs. These authors proposed the use of a digital surface model, based on a LiDAR data acquisition, and parameters such as the land surface temperature, imperviousness, Normalized Difference Vegetation Index, and cadaster information, to provide two key outcomes: an estimation of the maximum green roof potential and a strategic framework for prioritization installations. Ref. [10] focused on Lisbon and analyzed green spaces using 2D and 3D visualizations: the 2D solution mainly identified existing green spaces at ground level by combining a digital surface model and spectral indices sensitive to chlorophyll, while the 3D solution used a digital surface model and the footprint of Lisbon’s buildings to identify rooftops for green roof implementation.
Ref. [11] explored a large-scale approach to mapping green roofs and photovoltaic panels across 17 cities, using a variety of imagery sources obtained from cities’ open data repository and applying a deep learning methodology. A modified U-Net model was trained and fed to obtain building footprints as a prediction input, providing quantifiable measures for rooftop sustainability across cities and detailed maps of both solar panels and green roofs. Ref. [12] also discussed the utilization of deep learning techniques, emphasizing the potential of these methods in urban planning and highlighting the need for further improvements and exploration in a more refined model. Ref. [13] developed an open-source automated method for the survey of green roofs, based on aerial imagery segmentation and a U-Net-based machine learning algorithm, achieving high accuracy and revealing a notable increase in green roof areas between 2019 and 2021.
Although previous studies have yielded important conclusions regarding the mapping of green roofs, they do not provide a methodology tailored to identify simultaneously ground-level and rooftop GR. In older buildings, GRs are typically located at the rooftop level, enabling their identification using satellite band combination to produce vegetation indices, but in new urban layouts on which buildings are grouped in condominiums, GR are often located at ground level over an underground space, with no spatial information available. This last situation is more complicated to identify since it may blend in with small gardens or other landscape areas. Another crucial aspect, typically not yet addressed by the GR promoters, is the documentation of vegetation health over time in these green spaces, which is a critical factor for assessing the long-term performance and sustainability of green roof systems.
The work presented in this paper contributes to overcoming the existing gaps in mapping GR at top and ground level by identifying building shape patterns using deep learning techniques whenever the existence of buildings’ or condominiums’ footprints are not available. The presence of vegetation is estimated by vegetation indices, and errors associated with the presence of trees in public spaces are minimized using spatial operations in a Geographic Information System environment. Additionally, the paper examines the refinement of the NDVI threshold value used in GIS mapping solutions by analyzing a vegetation index over a 1-year period for a building with green roofs at ground and at rooftop level. The methodology is applied to Lisbon City, in Portugal.
2. Background
The identification of patterns in satellite images using Artificial Neural Networks (ANN) has become an important research trend. These supervised machine learning models use layers of nodes or neurons, including input layer, hidden layers, and output layer. The layers undergo iterative initial weights and bias adjustments to optimize the objective function [14]. Convolutional Neural Networks (CNN) optimize image classification tasks [15], using internal representations to extract valuable features and predict output images. CNN layers are not fully interconnected, offering computational efficiency but posing training challenges. CNNs typically include convolution layers, pooling layers, and fully connected layers. Convolution layers extract features by applying filters to generate multiple feature maps while reducing computational complexity and addressing overfitting. Finally, fully connected layers handle classification tasks using input from flattened pooling layer outputs [16]. The R-CNN (Regions with Convolutional Neural Networks) architecture combines multiple algorithms. It starts by using a selection search algorithm to pick region proposals and then processing it through a convolutional net to obtain a feature map. These maps support a vector machine model for object classification and a regression model for obtaining tight bounding boxes [17]. Faster R-CNN [18] further improves the process using a Region Proposal Network (RPN) with the CNN model. The RPN shares convolutional features from the detection network, minimizing additional cost when generating region proposals. A fully convolutional network can predict both object boundaries and scores, i.e., the probability of having an object in a specific region of interest at each location. Trained end-to-end, the RPN generates high-quality region proposals, which are then utilized by Fast R-CNN for object detection. Faster R-CNN replaces the selection search algorithm Region Proposal Network (RPN), maintaining a similar architecture to R-CNN but achieving faster detection speeds, approaching real-time performance [15,18]. Faster R-CNN has been successfully applied in remote sensing for object detection, as the identification of land structures like greenhouses [19], buildings [20,21,22] and chimneys [23].
The success of these applications also relies on the characteristics of the remote sensing images, namely the spatial and spectral resolution. Moreover, multispectral images capture data across different wavelengths, including those beyond the visible spectrum, which allows us to assess the object characteristics by analyzing specific image bands. Taking advantage of the spectral properties of the vegetation, indices like the Normalized Difference Vegetation Index (NDVI) can be used to monitor plant greenness, as a health proxy. This index is obtained by a combination of the red (R) and the near-infrared (NIR) satellite multispectral band [24]:
NDVI = (NIR − R)/(NIR + R)
NDVI value, ranging from −1 to 1, provides an overall measure of the observed greenness. The NDVI is a widely used remote sensing metric, sensitive to chlorophyll content, acting as a proxy to evaluate vegetation health by analyzing the difference between near-infrared (which vegetation strongly reflects) and red light (which vegetation absorbs) [25]. NDVI higher values typically indicate healthy and denser vegetation, while lower values may signal stressed or sparse vegetation. By analyzing an NDVI time series, it is possible to monitor the vegetation status over time and conclude about the greenness/health of the green roof, including the seasonal variations, the impact of environmental changes and the effectiveness of maintenance practices, especially concerning water availability.
3. Material and Methods
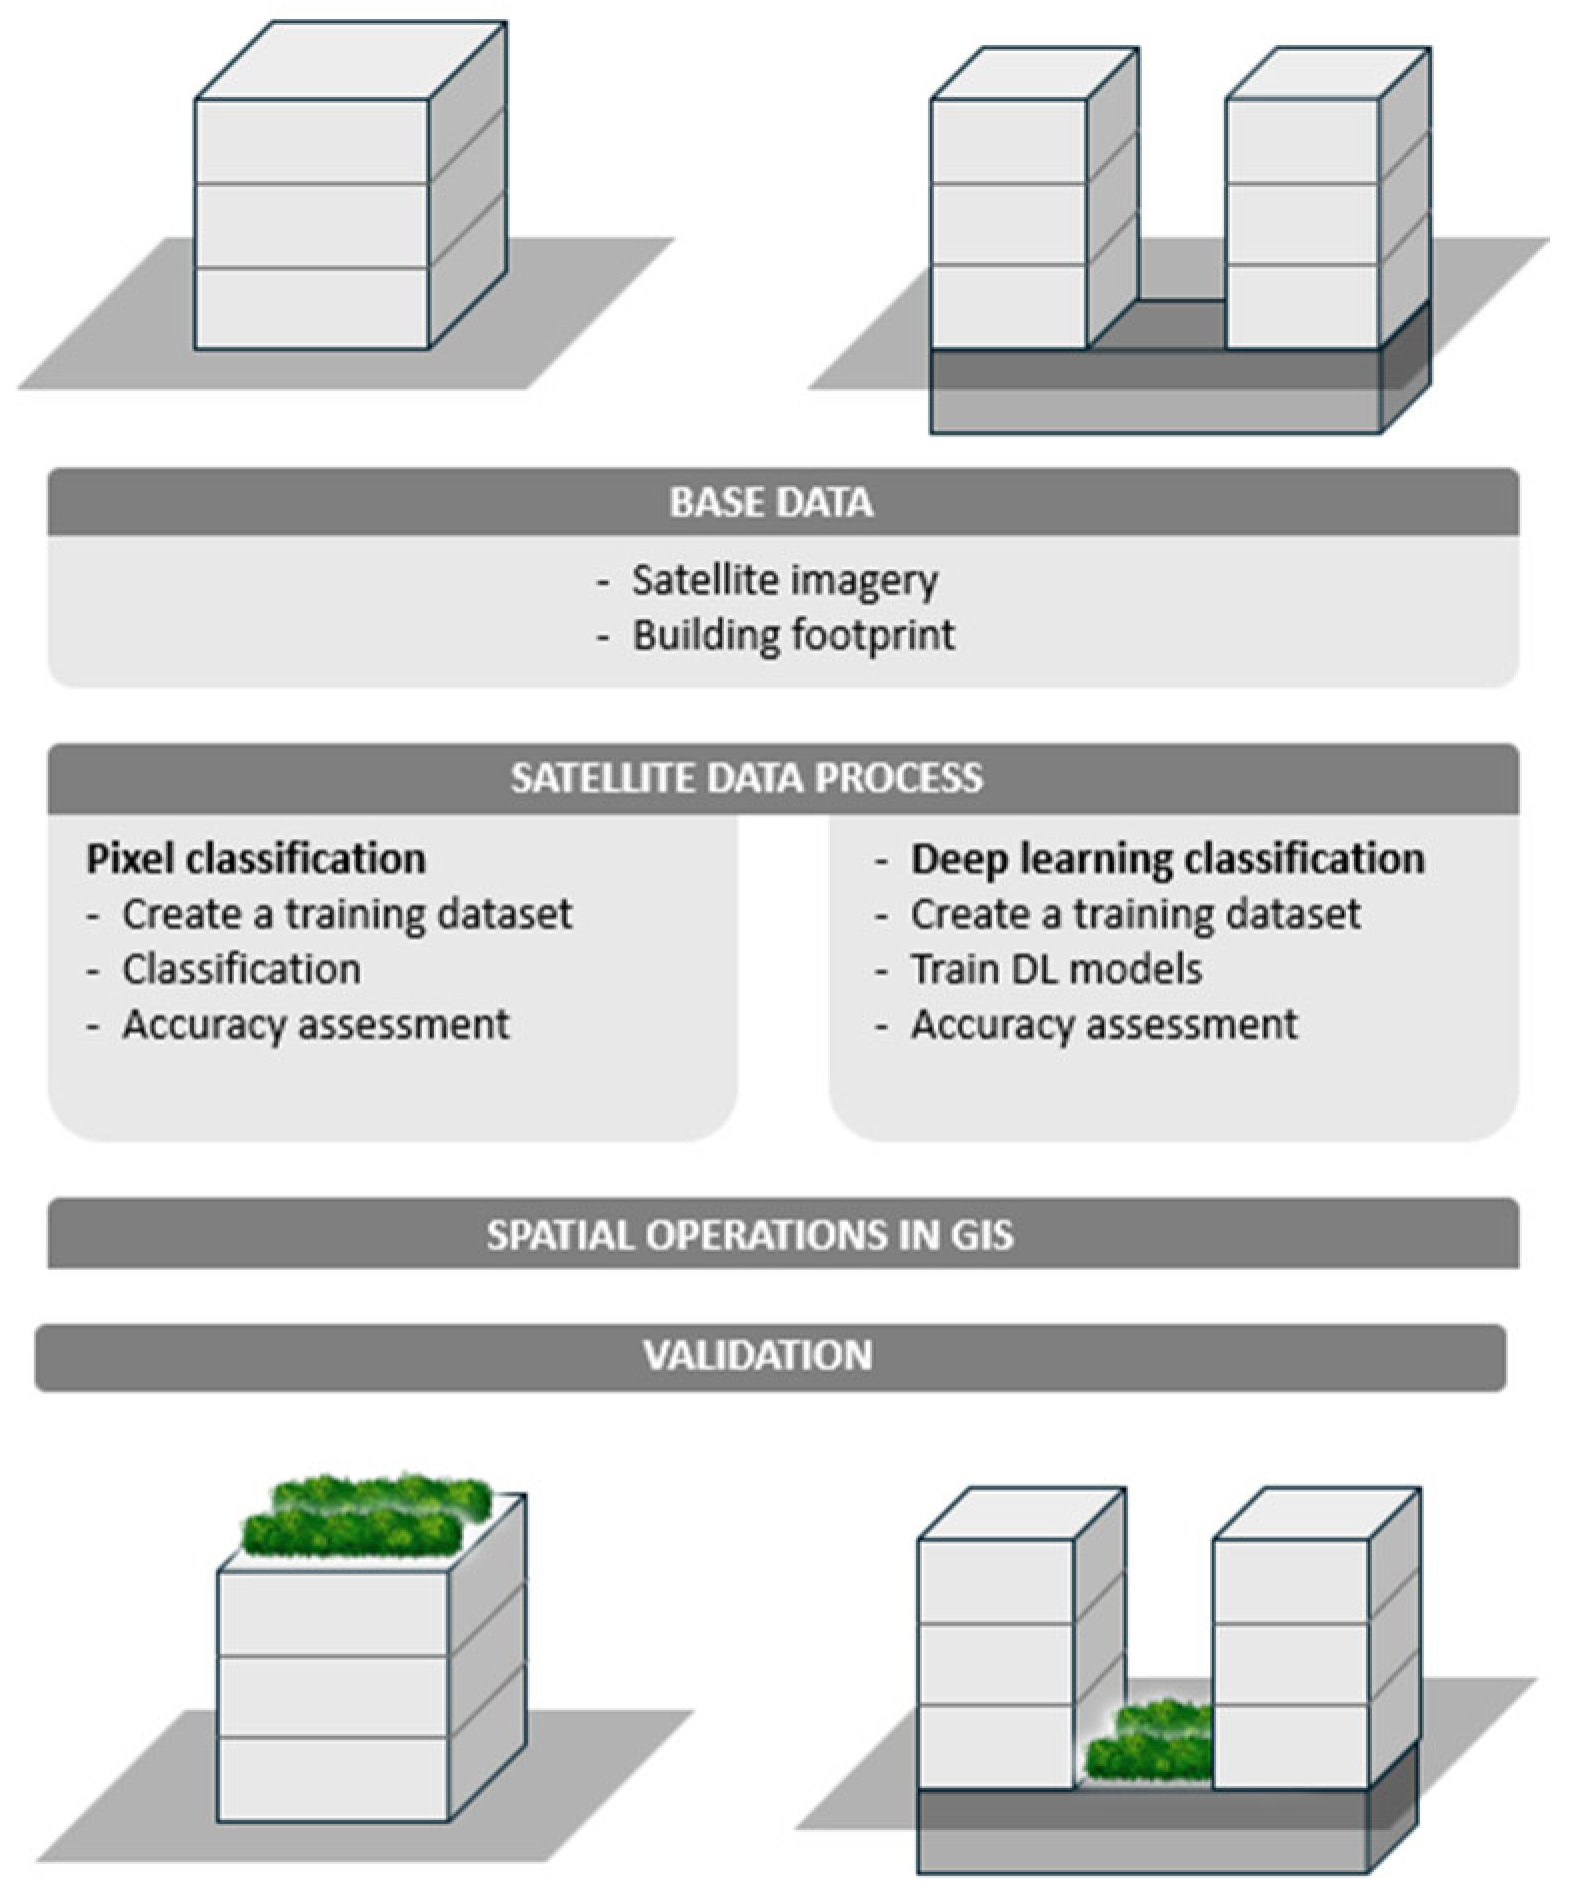
The imagery-based proposed methodology comprises two approaches for mapping GR, depending on their locations (rooftop or ground-level): GR at a rooftop level generally corresponds to a single building; GR at a ground level generally corresponds to green spaces that cover underground infrastructures, as garages shared by several buildings. These two situations are illustrated in Figure 1.
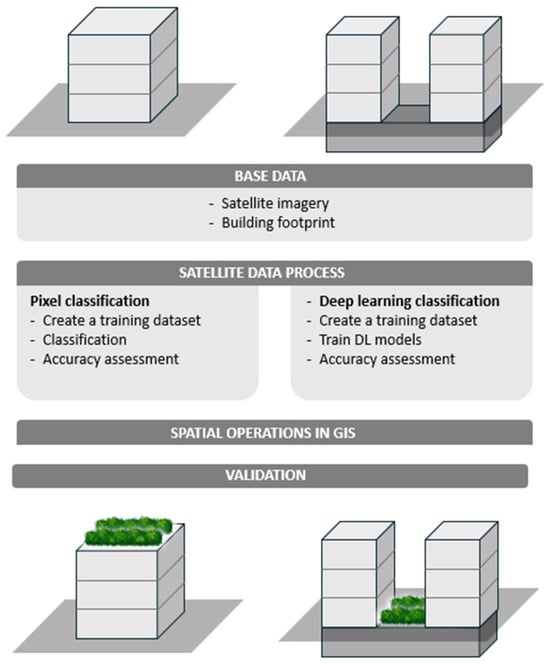
Figure 1.
The four stages—proposed methodology to identify green rooftops of single buildings and street level green roofs shared by a group of buildings.
The methodology is structured in four distinct stages. The first stage involves the data collection, which includes acquiring satellite imagery and collecting the building footprint features. The second stage focuses on satellite data processing, encompassing tasks such as the image classification and the vegetation index estimation, to gather information on vegetation presence and identify unsuitable roofs covered with red tiles. In the third stage, all processed data is analyzed within a GIS environment, overlaying the presence of vegetation with the geometry of building footprints. Finally, a validation process is conducted to eliminate potential errors and ensure the accuracy of the results.
3.1. Base Data
The application of the methodology depends on the availability of up-to-date data on building footprints and satellite multispectral images. Several open-access satellite imagery repositories, such as the Copernicus Hub, ensure the availability of multispectral satellite data. Special attention is paid to satellite characteristics such as the spatial and spectral resolution, as the results may depend on it. Although the availability of building footprint data still varies by geographic region, there is an increasing trend towards making this information accessible through open data portals, like OpenStreetMap, or from national planning institutions, as municipalities and national agencies responsible for land management and urban planning.
3.2. Satellite Data Processing
Different image processing techniques may be applied depending on whether the goal is to identify green roofs on individual buildings or associated with a group of buildings. In the case of identifying green roofs within a building footprint, it is essential to exclude buildings whose roofs have characteristics such as ceramic tiles covering or steep slopes, making them unsuitable for GR. To achieve this, the first step is to apply a pixel classification process to identify buildings with tile-covered roofs and exclude them from the dataset. This process involves defining an appropriate training dataset according to the pre-defined object classes and evaluating the results using an omission–confusion matrix and other statistical metrics, such as the Kappa coefficient (that compares observed accuracy to expected accuracy based on random choice), overall accuracy, user’s accuracy (U_Accuracy), producer’s accuracy (P_Accuracy), and the overall Kappa statistic index of agreement. These accuracy metrics range from 0 to 1, where 1 represents the maximum accuracy.
After excluding buildings unsuitable for GR implementation, the remaining structures should be intersected with a spectral index layer designed to identify vegetated surfaces. The NDVI is particularly appropriate for this purpose, owing to its methodological simplicity and demonstrated effectiveness in vegetation analysis. Nonetheless, it is essential to calibrate the NDVI threshold to the specific spectral response of the plant species employed in green roofs, as this response may vary according to the prevailing geographic and environmental conditions.
For the scenario corresponding to the mapping of ground-level GR, shared by a group of buildings, a different approach needs to be addressed as the green infrastructure does not belong to individual buildings but is a space shared by several buildings organized in condominiums. In this case, the GR might be confused with gardens, from a spectral point of view. Thus, whenever spatial information of those private gardens is not available, an extra step is necessary. The present paper successfully tested object-oriented machine learning, namely a Faster Region-Based Convolutional Neural Network (Faster R-CNN) defining a training dataset, identifying GR on shapes of group of buildings, training the algorithm, and applying it to the whole image. The final step is the assessment of the accuracy of the classification process and the NDVI threshold application to achieve good results.
3.3. Spatial Data Operations in GIS
Since large trees may shadow the roof of single buildings, one may obtain an oversized selection of single buildings with GRs. These buildings were excluded whenever a low ration between the original building area and the area with high NDVI pixels values is obtained. The selection of GRs shared by a group of buildings was obtained by intersecting the NDVI vegetation values and its geometry. In general, the shape of buildings, distributed around the green space, compose a condominium feature, and the green roof is typically on top of a garage, since municipal impositions do not allow new constructions without garage spaces. All spatial operations applied to exclude false identified GR were implemented in GIS.
3.4. Validation
The validation process can be carried out in several ways, depending on the availability and granularity of the data: at the microscale, a statistical sampling and validation approach can be applied, combining visual inspection through image platforms (e.g., GE) with in situ verification. At a macroscale, validation can be performed by cross information of building geometry (e.g., flat or sloped roof), construction materials (e.g., ceramic or glass tiles), and construction dates—data that are typically collected during national censuses or other surveys conducted by governmental institutions.
4. Case Study Implementation
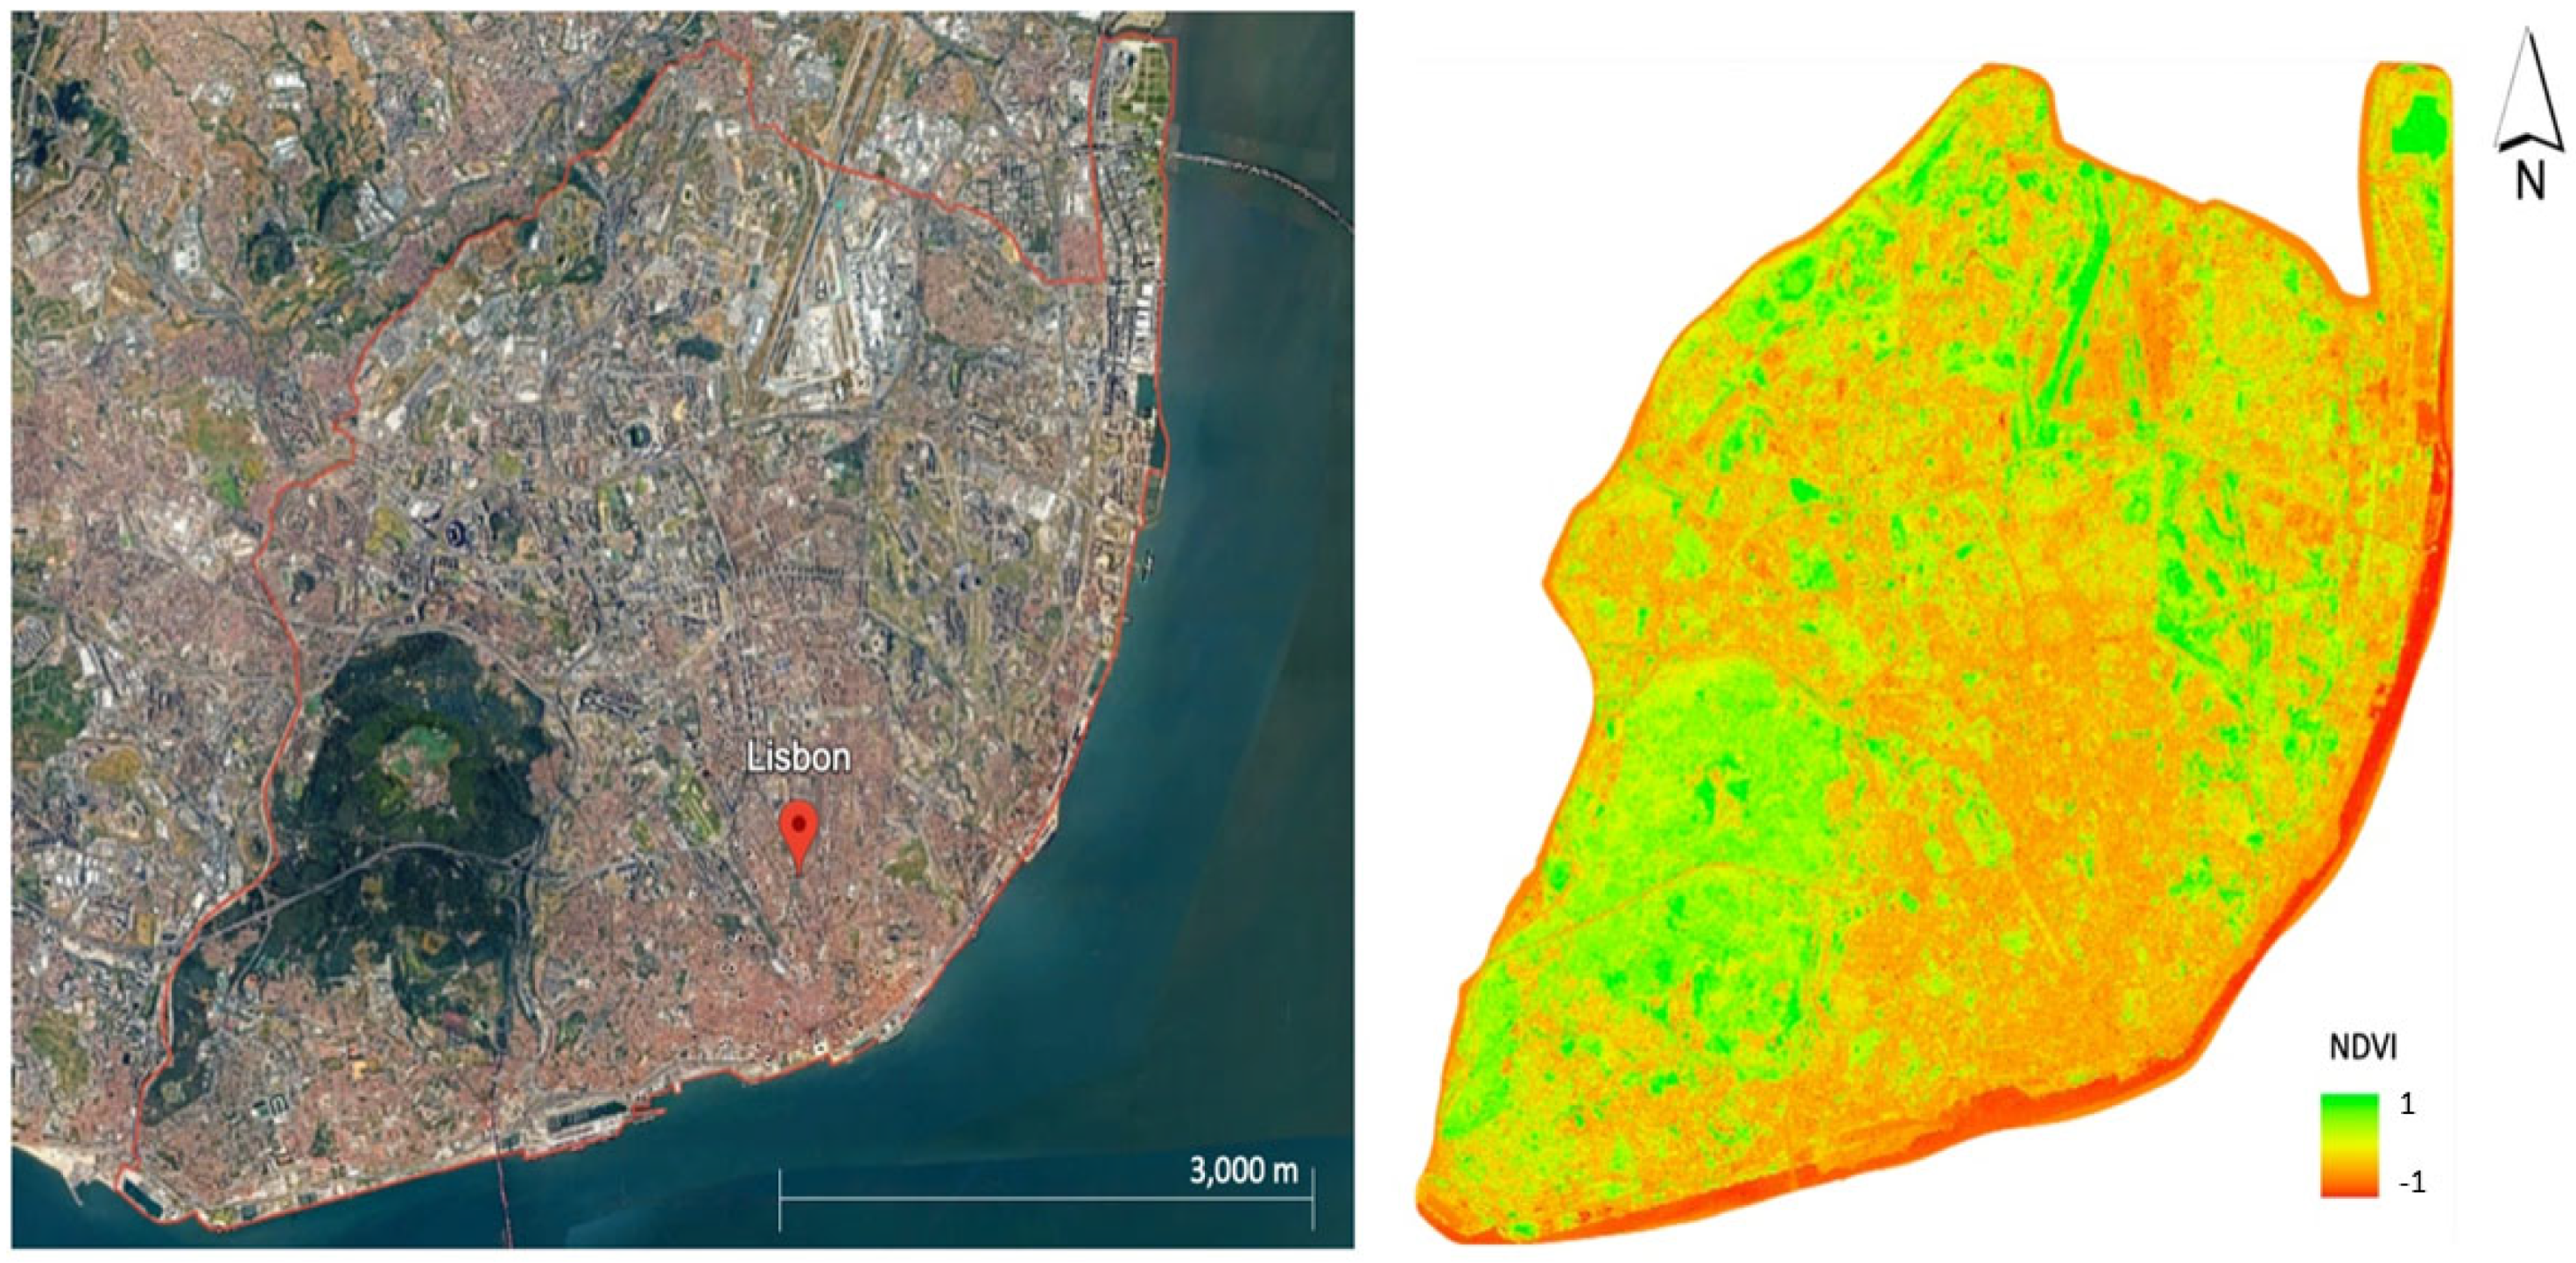
The case study is the city of Lisbon, the capital of Portugal. According to the latest available data from the 2021 official census, Lisbon covers an area of 100.05 km2 (Figure 2), has a population density of 5438 inhabitants per km2, and 33% of the territory is green spaces as referred in [26], mainly due to the existence of Monsanto. The urban environment is characterized by a mix of built areas and green spaces. The historic center is very urbanized and most of these buildings, from the Pombaline Portuguese style, have sloped rooftops covered with red clay tiles. In Portugal, ceramic tile roofs are one of the most common roof formats, allowing rainwater to drain effectively and preventing infiltrations that harm the integrity of the construction. Outside the city center, there is a mix of modern and old buildings associated with different construction periods. The building stock of Lisbon is mainly composed of residential multi-family buildings (98%) [26].

Figure 2.
The case study location: (a) View of Gulbenkian garden; (b) Boundary (in white) of the Gulbenkian garden; (c) Lisbon municipality boundary (in red); (d) Lisbon city identification.
Lisbon has an altitude range of 228 m, is situated along the Atlantic coast (Figure 2) and features a Mediterranean climate with warm and arid summers, coupled with temperate and damp winters [27]. In 2022, the city experiences maximum temperatures exceeding 35 °C, contributing to the existence of urban heat islands [28].
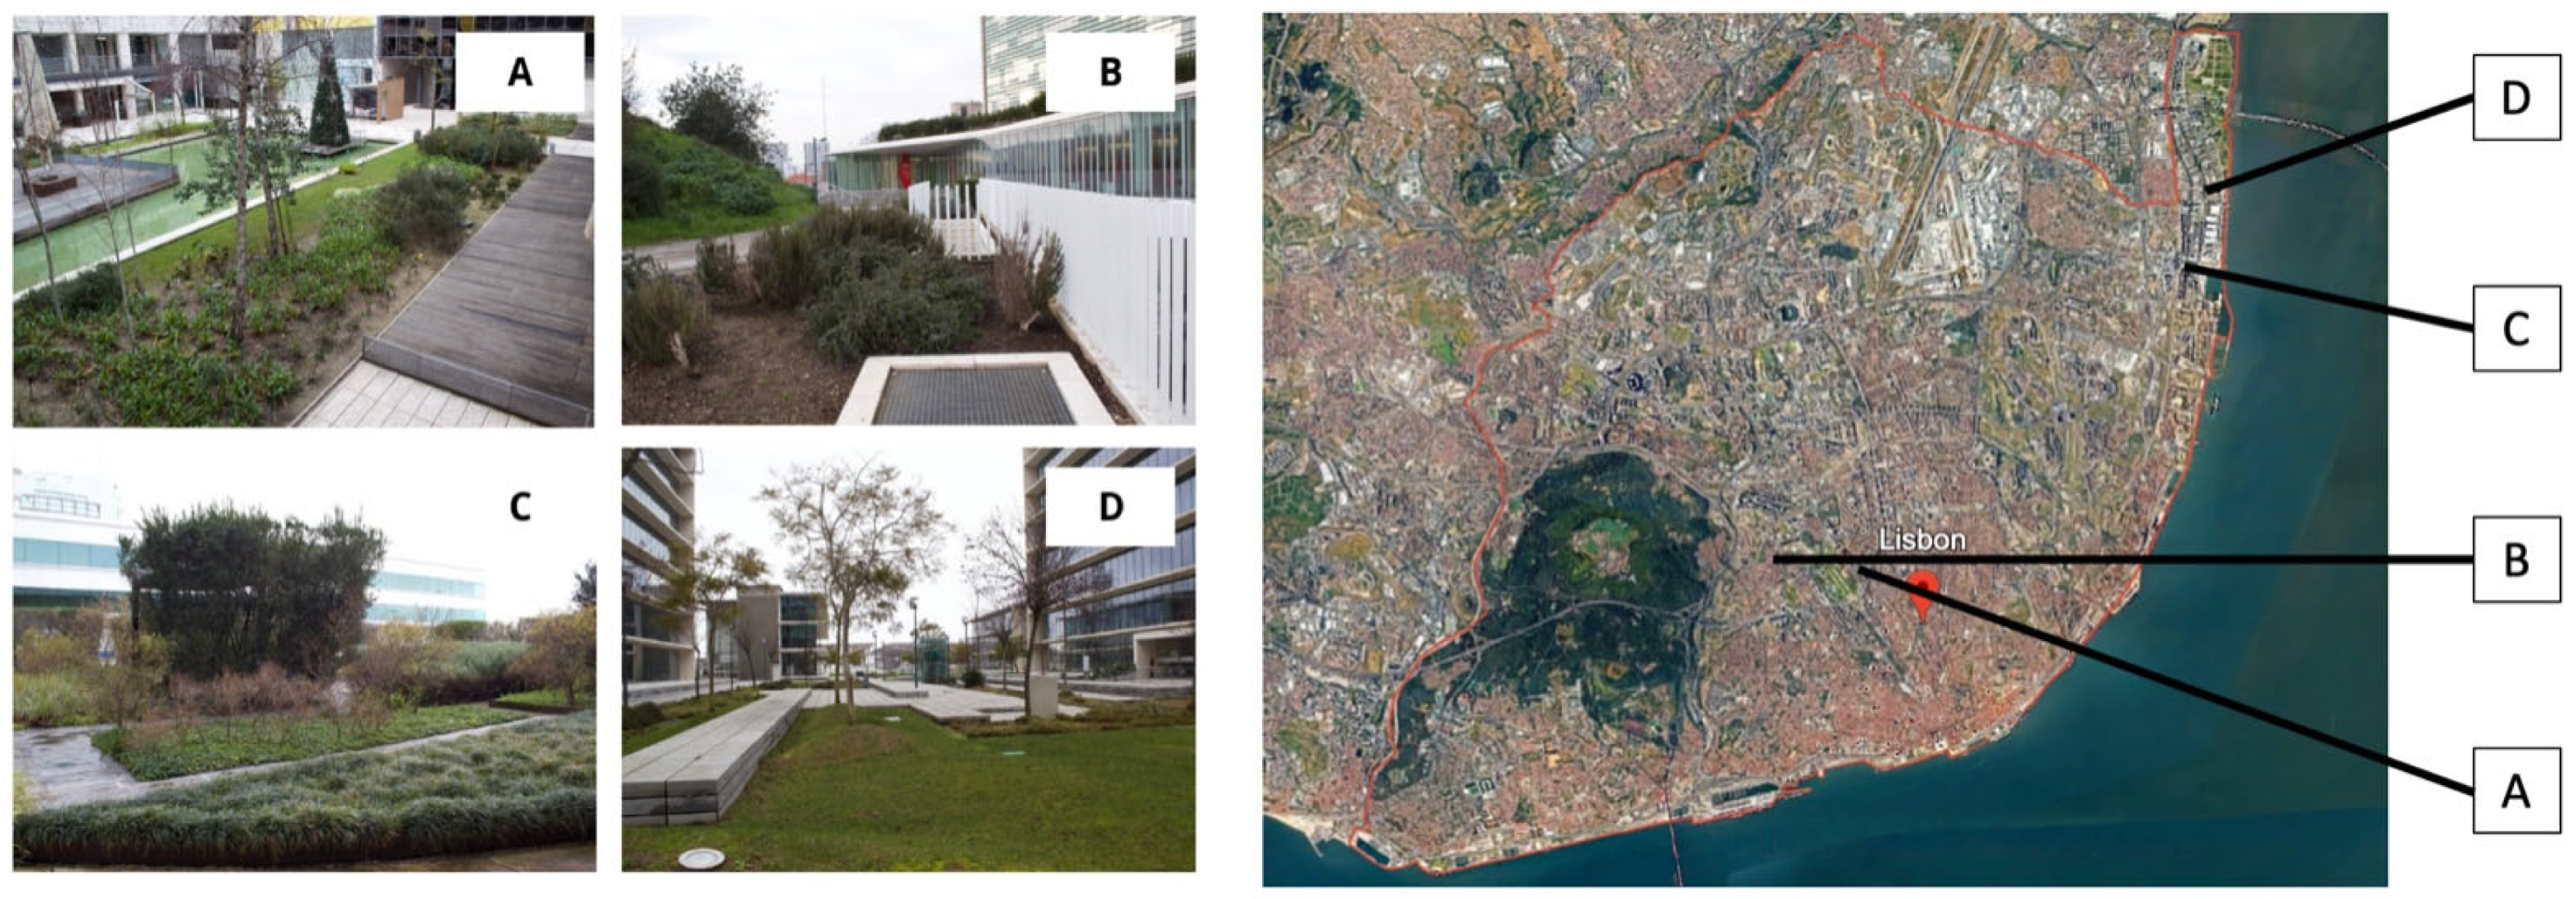
The type of GRs existing in the city of Lisbon is very diverse (Figure 3) and encompasses a diverse set of buildings, including residential, corporate, and governmental structures, as well as diverse types of vegetation (Figure 3).
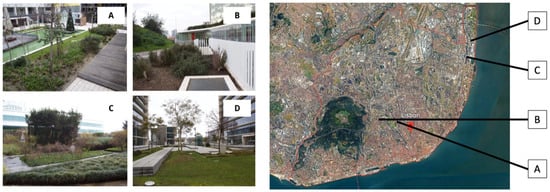
Figure 3.
Examples of different regime typologies ((A) Intensive; (B,C) Semi intensive, (D) Extensive) of green roofs in Lisbon (on the left) and their location in the Lisbon city (on the right).
4.1. Base Data Collection
The data collected in this study included:
- (i)
- An 8-band multispectral image WorldView-2, acquired on 18 February 2022, with a spatial resolution of 1.6m, for mapping BGR and CGR.
- (ii)
- A set of 12 Sentinel-2 images corresponding to a civil year, one per month, to monitor the GR greenness. All images were freely downloaded under the Copernicus program.
- (iii)
- A building footprint layer, delivered by Lisbon municipality.
4.2. Mapping Green Roofs in Single Buildings
The identification of green roofs in single buildings starts with a WorldView-2 image classification, performed by applying a supervised classification (Support Vector Machine algorithm) in ArcGIS Pro (version 3.5.3). To assess the accuracy of the classification, 100 control points were randomly generated (well distributed in each class) and validated the assigned class to each one, allowing the generation of a confusion matrix (Table 1) and the correspondent accuracy assessment. The classification model’s accuracy is 0.95, while the kappa, which translates as a general measure of the model’s quality, is 0.91.

Table 1.
The confusion matrix obtained in the validation stage for all the classes considered in the supervised classification process.
The classification result was transformed into a polygon layer and by applying several spatial analysis functions it has been possible to overlay the polygon with the building footprints (a layer provided by the Municipality of Lisbon with 54,800 buildings). By overlaying the tiled class onto the building footprint area, it has been possible to determine the proportion of buildings occupied by red tiles. Through statistical data (mean, standard deviation, and median of the ratio of red tiles to total building area), all buildings with a ratio higher than 64.71% were eliminated (corresponding to the median value of proportion). With this first step, the number of buildings was reduced to 27,401 polygons.
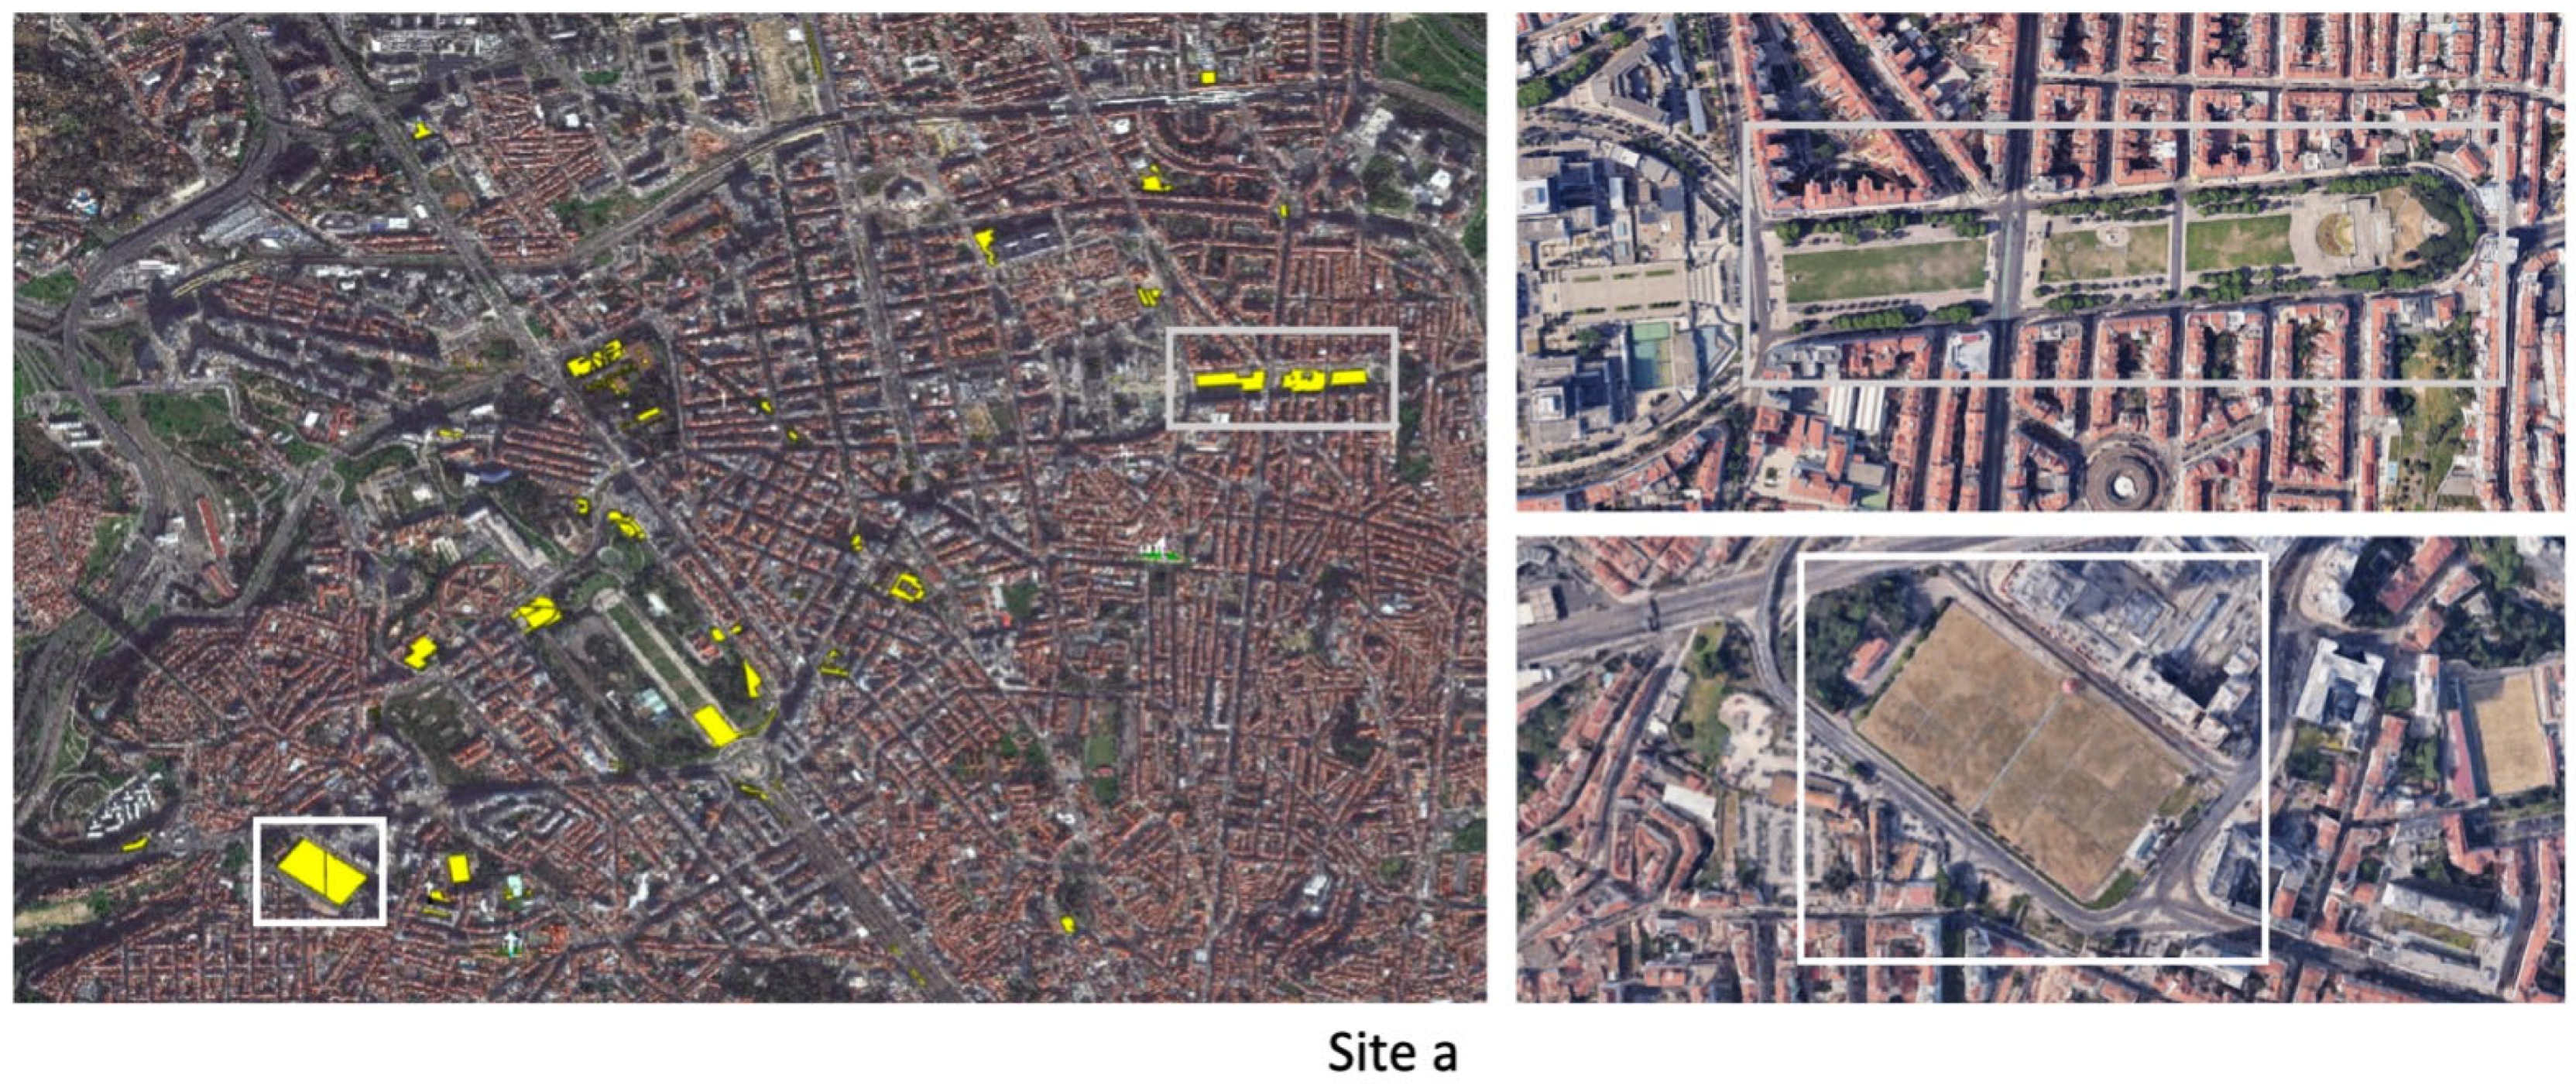
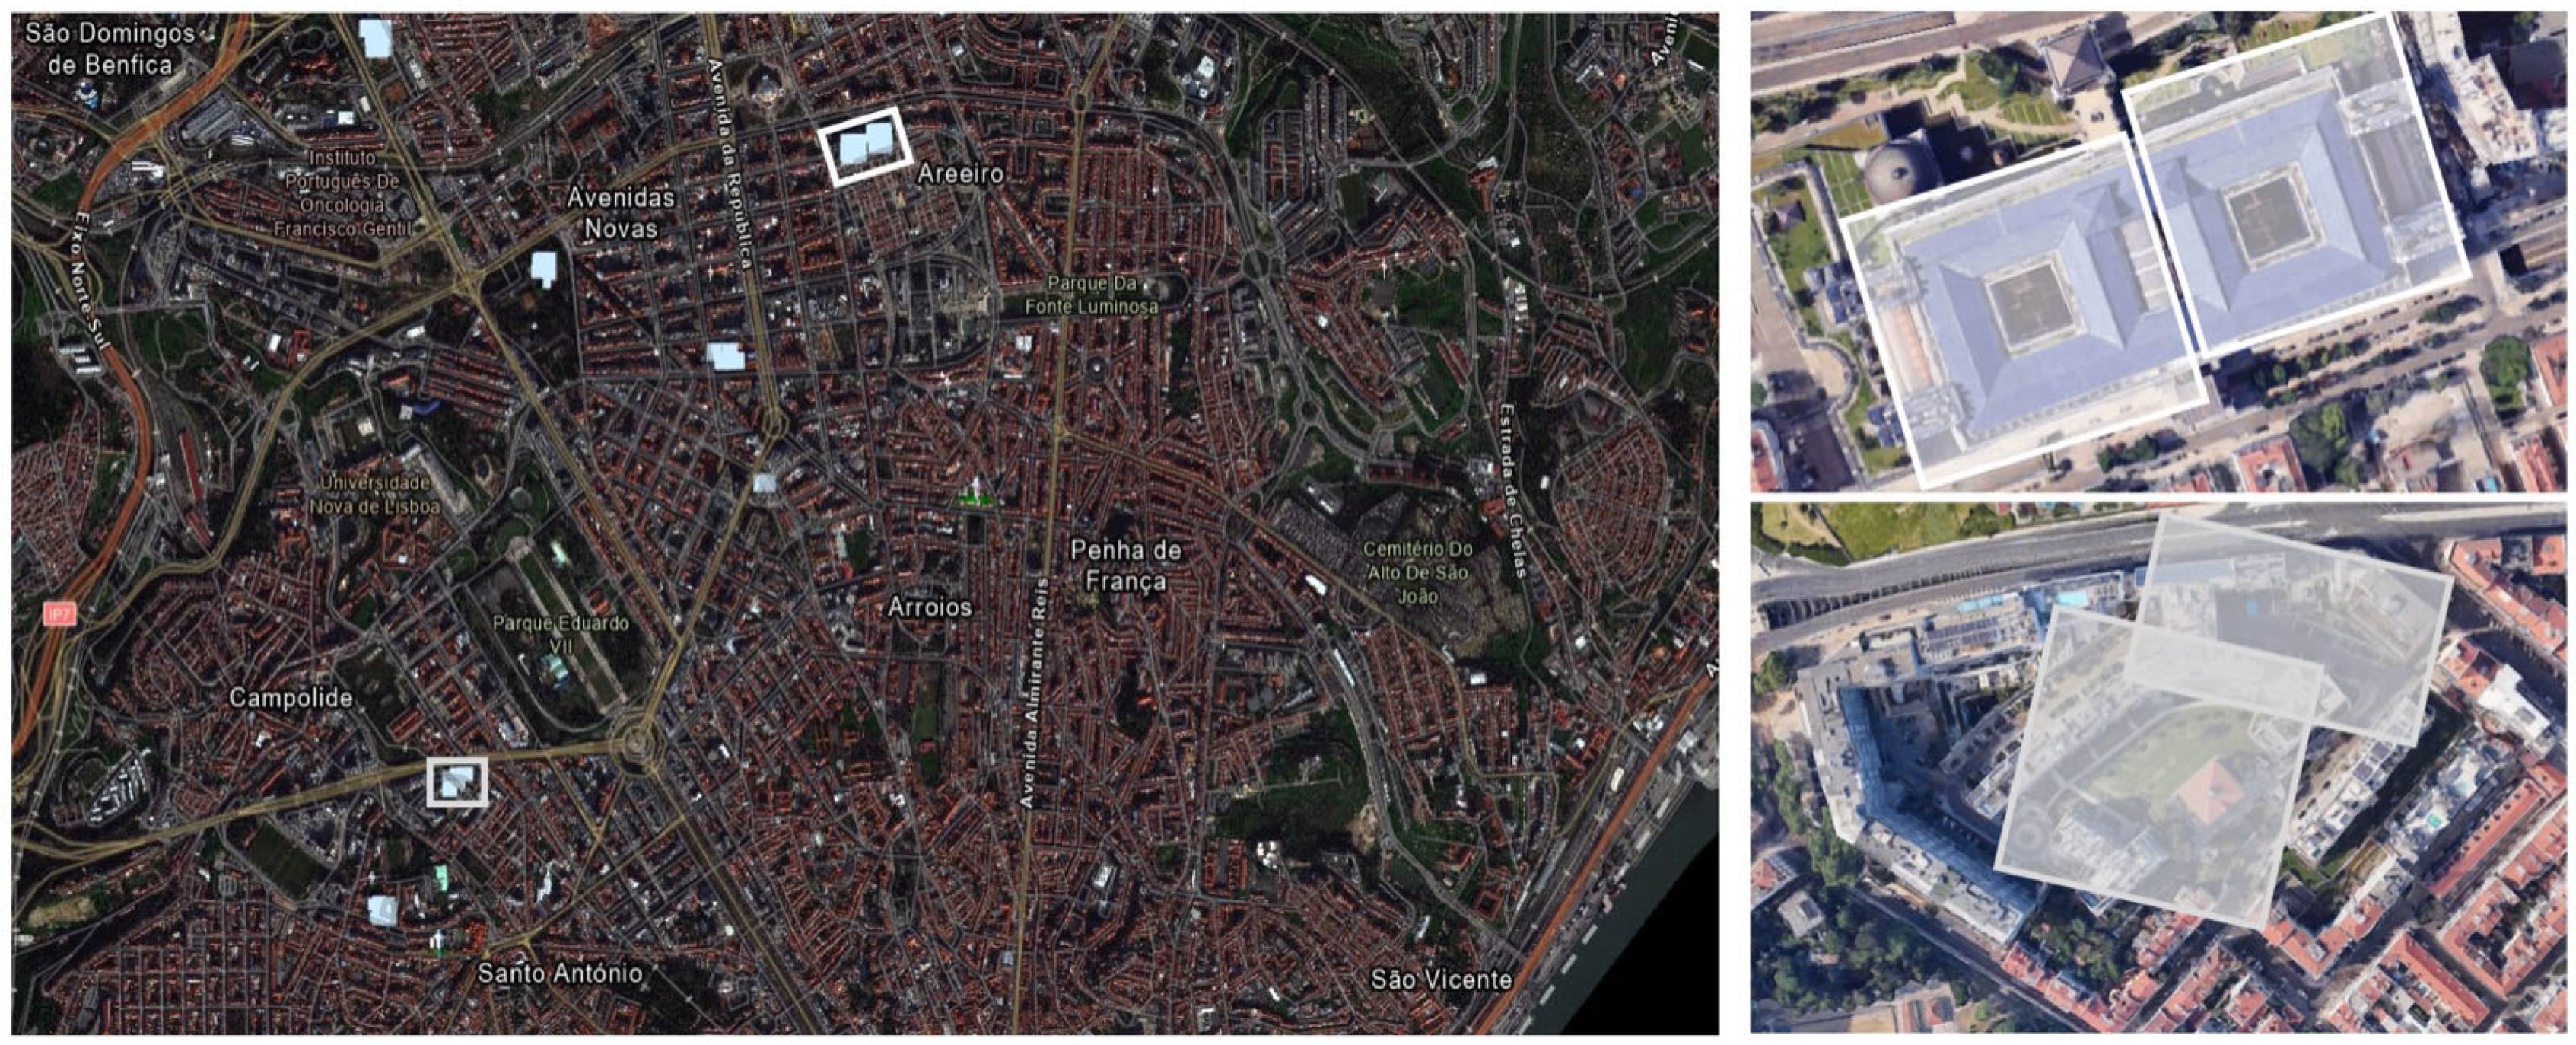
To identify the green areas, the NDVI was estimated using the WorldView-2 image and a threshold was defined based on the NDVI value estimated for the green roofs mapped in 2022 by the Lisbon municipality. The work has carried out a field survey to map small polygons with vegetation on roofs in public spaces (underground parks, public buildings and infrastructure) and identified 219 polygons (Figure 4), corresponding to 0.3% of the Lisbon city area, to which the NDVI has been computed and the average value was used as a threshold to identify the presence of green areas.
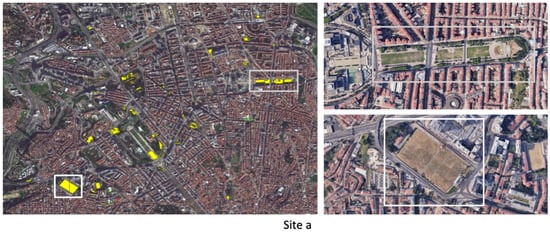
Figure 4.
GR identified by technicians from Lisbon municipality in 2022. Areas highlighted in white in the figure on the left, are detailed on right side.
The threshold lies within 0.3, by being the mean NDVI of the GRs mapped by the CML team (Figure 5 and Figure 6).
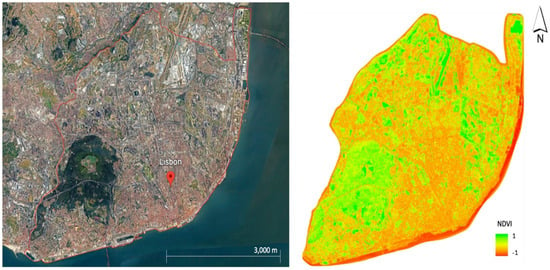
Figure 5.
NDVI values estimated over WV-2 for Lisbon city. NDVI values higher than 0. 1 range from sparse vegetation to dense green vegetation.

Figure 6.
NDVI mean distribution of green roofs identified by the municipality of Lisbon in 2022.
The NDVI of the city of Lisbon was clipped by the boundaries of the 27,401 polygons and transformed into points, where only points with an NDVI equal to or greater than 0.3 are retained. All areas that are not of interest, like public roads, gardens or squares, were eliminated, and only information related to “green” points was retained. Taking advantage of the spatial join operation, the points were joined with the buildings so that each building was assigned several points. Buildings with a null number of points were removed from the dataset, once again reducing the universe to 8656 polygons.
Since the resolution of WorldView-2 images is 1.8 m when composing the NDVI, there may be a shadowing effect from the tree canopy onto the tops of buildings, causing points of NDVI to appear at the building boundaries even though they do not represent a green roof. To avoid considering these cases, a buffer was computed, reducing the building size by 3.6 m on each side of the building and excluding buildings with a null number of points. By crossing the buffer layer with the layer of the 8656 polygons, only the buildings common to both layers were retained, resulting in a total of 3423 polygons.
To ensure the green roofs identification, a division was made between large buildings (area greater than or equal to 2000 m2) and small buildings (area less than 2000 m2). For large buildings, it is relevant to analyze the possible existence of green roofs based on the absolute value of the green roof area, while for smaller buildings, the main focus is on the percentage of the building area corresponding to green roofs. In the set of buildings with an area smaller than 2000 m2, only buildings with a green roof ratio equal to or greater than the median plus the standard deviation of the green roof ratio, or buildings with a green roof area greater than 200 m2, were selected. A total of 176 polygons were identified after excluding duplicated records and segmented buildings from the database.
4.3. Mapping Green Roofs in the Group of Buildings
A distinct classification process was implemented to address the challenge of identifying GRs installed in shared spaces among a set of buildings as they exhibit distinctive shapes. Once these groups of buildings are located, an NDVI can be applied alongside with geospatial management tools.
To find the buildings with distinctive shapes, a two-step object detection algorithm utilizing deep learning techniques in ArcGIS Pro (version 3.5.3). Specifically, the Faster R-CNN served as the chosen neural network for this task and the model was trained to focus on detecting two principal shapes, A and B, along with their variations (A1, A2, B1, and B2), as can be seen in Figure 7.

Figure 7.
A and B shapes for object detection: A1 and A2 are geometric variations of shape A; B1 and B2 are geometric variations of shape B.
The selection of the data augmentation method was guided by considerations of computational efficiency. Several experiments were performed using different rotation angles 60°, 30°, 10°, and 6°); however, the best results were ultimately obtained with smaller rotation angles. Scaling was not included, as the analysis was conducted at the city scale, where building layouts exhibit a high degree of uniformity. A total of 150 samples were selected for the training dataset. For each sample a rotation angle of 6° was applied, for augmentation of the training data. This technique generated 116,824 features, whereas 82,324 belong to class one (class A and variations) and 34,500 to class two (class B and variations).
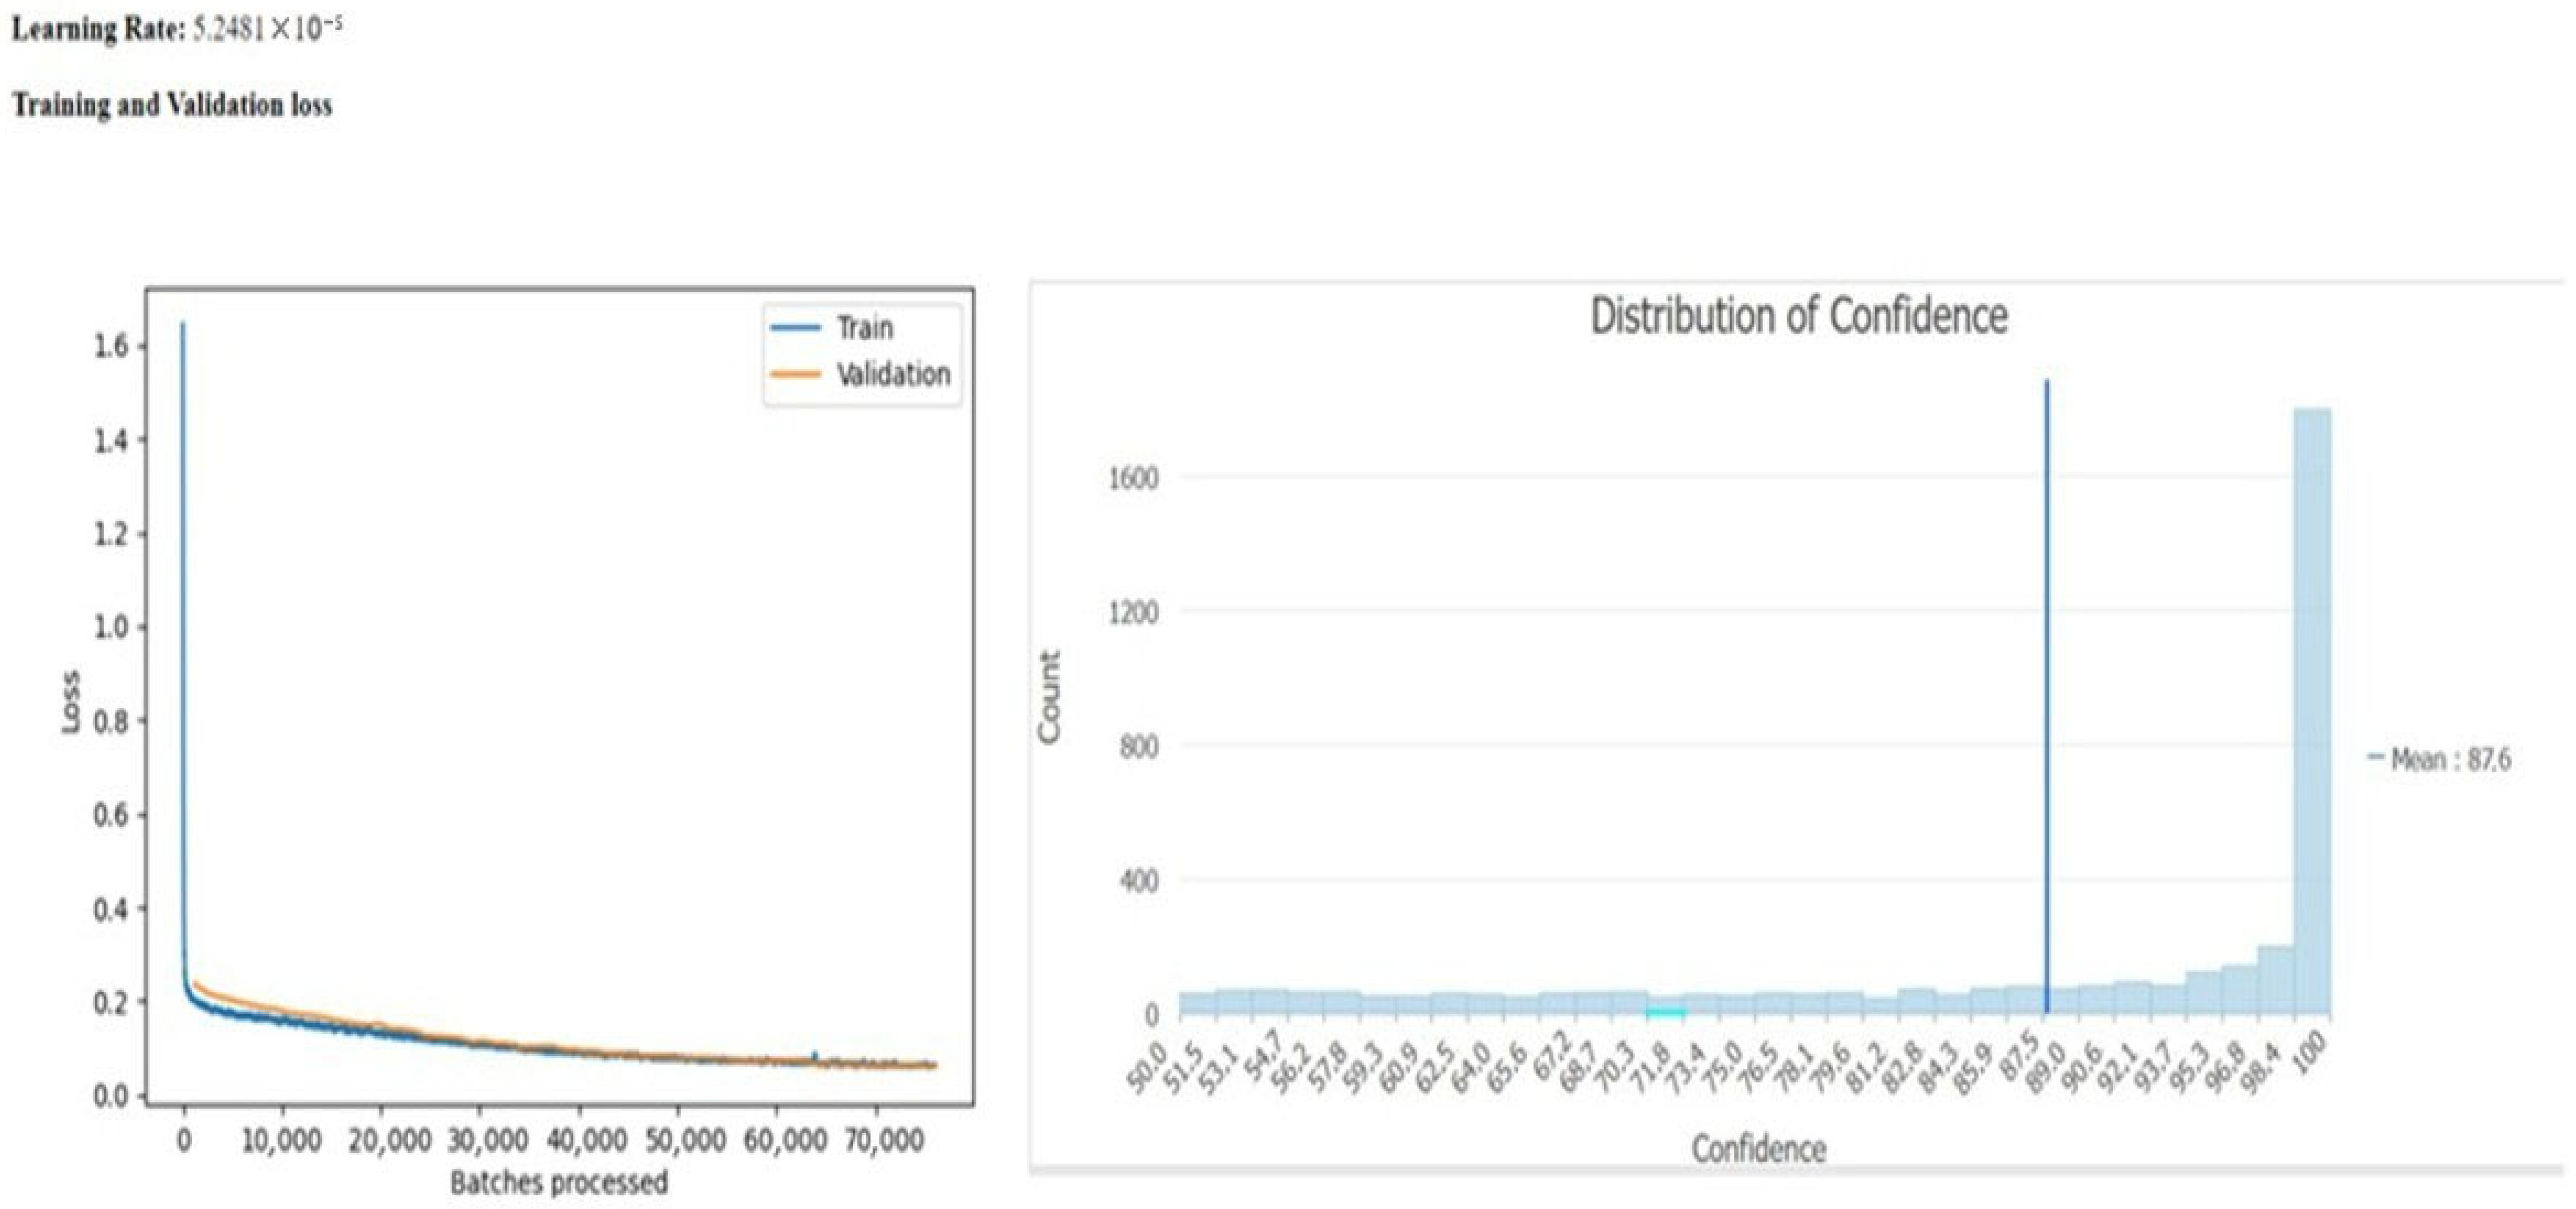
The Residual Neural Network (ResNet) addresses problems with convergence when the training initially converges and then saturates, degrading rapidly, as described in [29], by means of introducing a deep residual learning framework. In this framework, residual functions are learned with reference to the layer inputs, instead of being learned as unreferenced functions. In terms of model specificity, a backbone of a resnet50 and a learning rate of 5.2481 × 10⁻⁵ were used. Moreover, as shown in Figure 8, the training process is converging. Regarding the average precision score, class A has a precision of 0.92 and class B 0.93.
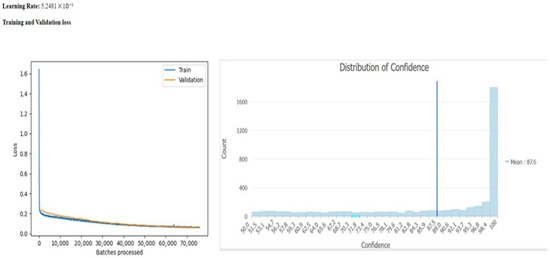
Figure 8.
Faster R-CNN learning rate and training-validation loss.
The outcome of the model Faster R-CNN is a layer composed of regular polygons that contains the trained patterns, in a total of 4015 bounding boxes that were analyzed, and a threshold of 0.87 was established. This value represents the average confidence in the model, so all polygons with this parameter lower than 0.87 were eliminated (Figure 8).
In this case, NDVI points were also attached to the model result, and all polygons with NDVI values below 0.3 were disregarded. A universe of 195 polygons (Figure 9) was identified and later validated.
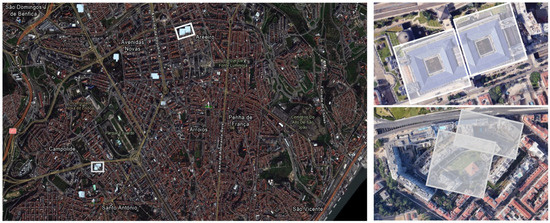
Figure 9.
Faster R-CNN model results. On the right side are shown the enlarged areas identified in the figure on the left.
4.4. Case Study Validation
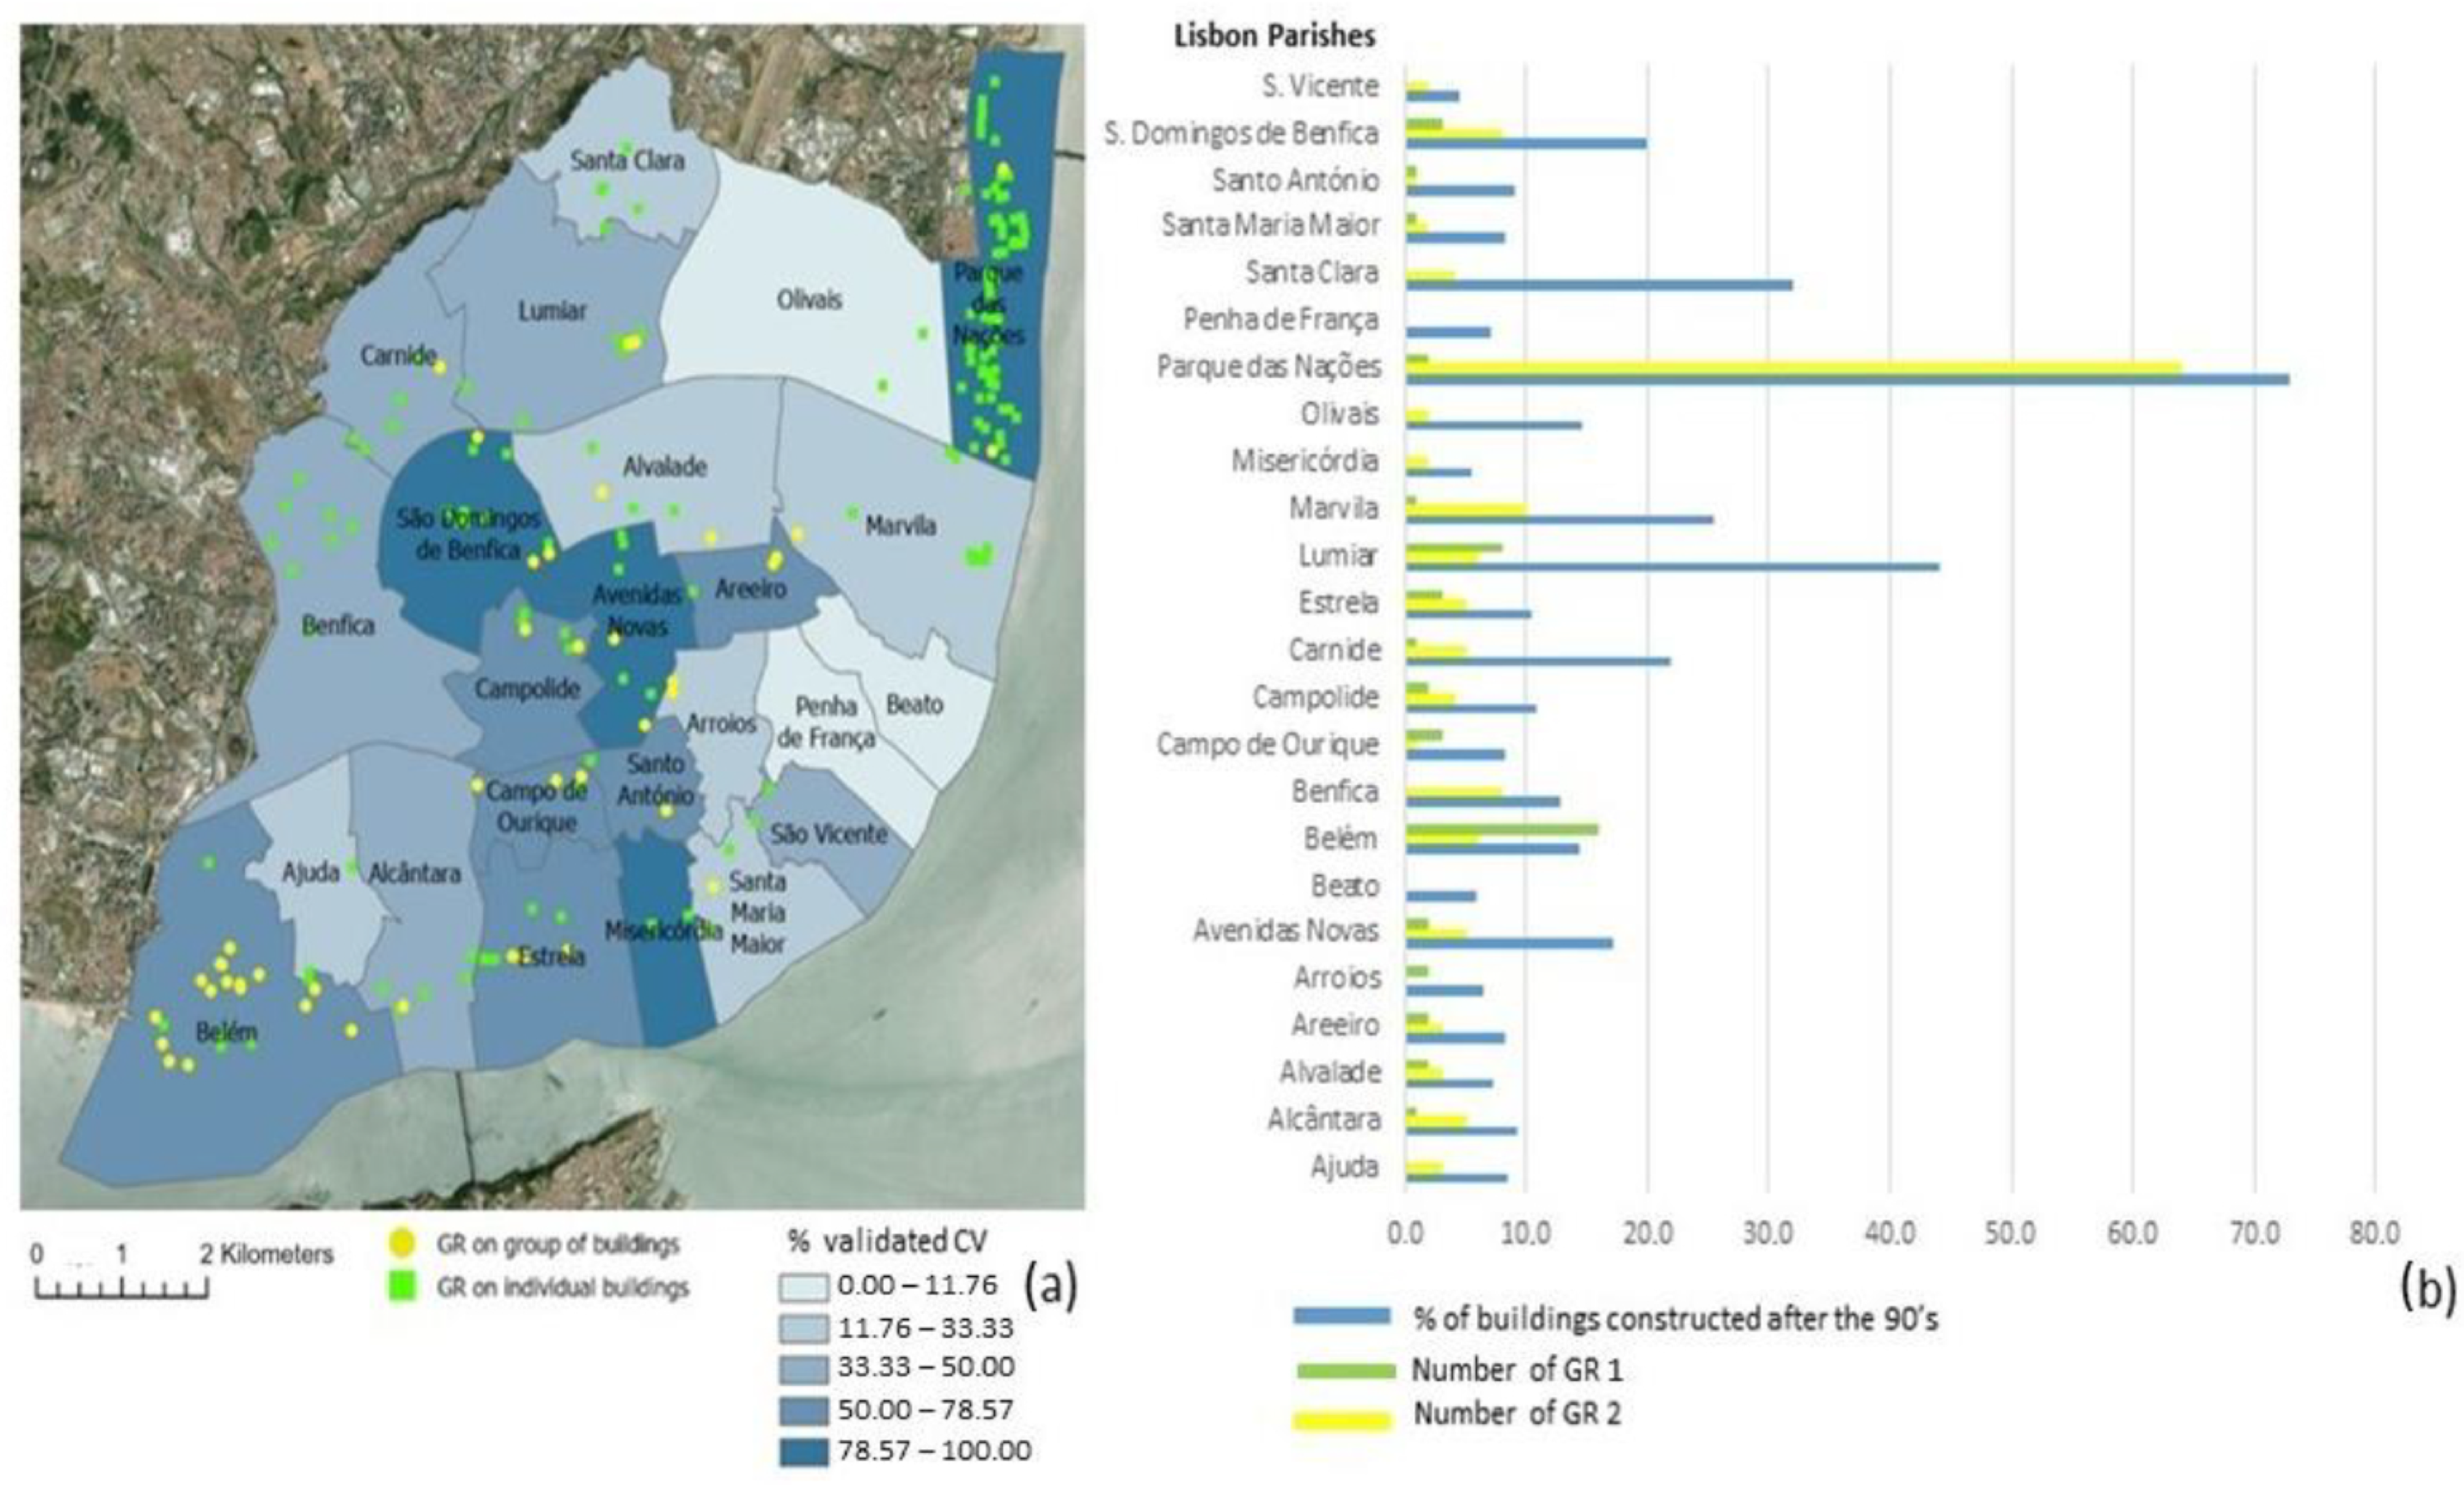
Considering both approaches, 371 polygons (176 singular green roofs and 195 shared green roofs) were identified as potential green roofs and validated via the Google Earth Platform or by in situ verification, with classification success rates of 28.4% and 74.8% for the corresponding approaches. A total of 196 polygons were obtained, of which 25.5% correspond to green roofs on individual buildings (GR1) and 74.4% correspond to green roofs shared by groups of buildings and which are generally underground garage spaces (GR2). The spatial distribution of both GR typologies follows the evolution of building architecture in the city very closely, where the most recently constructed areas of the city have a predominance of groups of buildings that share a private green space, generally on top of an underground garage. Thus, the distribution of GR over the city follows the expansion of the building construction: the parish of Parque das Nações, which underwent its great expansion in the 90s, stands out from the rest of the city with 64 GR2; Beato and Penha de França parishes, whose construction boom was in the 60s, have no green roofs as expected, as the building structures are not suitable for this type of installation (Figure 10).
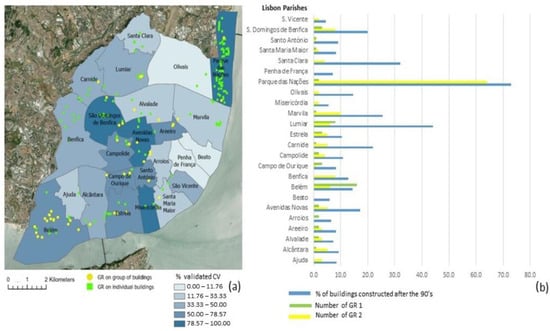
Figure 10.
(a) Distribution of green roofs (GR1 and GR2) and the percentage of validated CV by per parish; (b) number of GR1 and GR2 mapped per parish and the percentage of new building construction by parish.
According to data from the 2021 Census (https://www.ine.pt/, accessed on 1 July 2025) on building construction periods, there is a correlation coefficient of 0.85 between the percentage of buildings constructed after the 1990s (a period of significant expansion in Lisbon) and the number of mapped green roofs by parish. These results underscore the role of newer building typologies—such as condominiums—in facilitating the installation of green roofs.
An exhaustive validation was conducted in the Avenidas Novas parish through on-site visits to the identified green roofs (GRs). A total of seven GRs—two classified as GR1 and five as GR2—were validated, and no additional green roofs were identified.
5. Results and Discussion
From the original layer of 54,800 building footprint polygons, 50% of polygons have been classified as unsuitable over the WorldView-2 image and, naturally, excluded as potential green roofs. The NDVI has been computed and converted to points and only points with an NDVI equal to or greater than the threshold (0.3) were retained. By excluding the building footprints without points, duplicated records on the database, and fragmented geometries, the total number of potential building green roofs was reduced to 176 polygons.
In parallel, green roofs installed in a shared space of a group of buildings were identified by applying the Faster R-CNN algorithm to the WorldView-2 image. The expected geometries were then crossed with NDVI and only selected those with index values higher than 0.3. A total of 196 buildings with green roofs (146 at ground level and 50 at top level) have been identified and validated by in situ verification and at a macroscale level.
Having successfully identified green roofs in Lisbon, the focus shifted to a more detailed exploration to better understand if the selection of a unique NDVI value is still a good criterion to help the identification of green roofs, both at the top and the ground level. The Gulbenkian Park emerged as a compelling case study due to various factors, including its location and the presence of GRs both at the rooftop and ground levels having the same type of vegetation. To conduct an in-depth analysis of the park’s GR greenness throughout a civil year, a series of 12 Sentinel-2 images were acquired through the Copernicus hub. These images, acquired monthly from January to December of 2023, form a comprehensive temporal dataset.
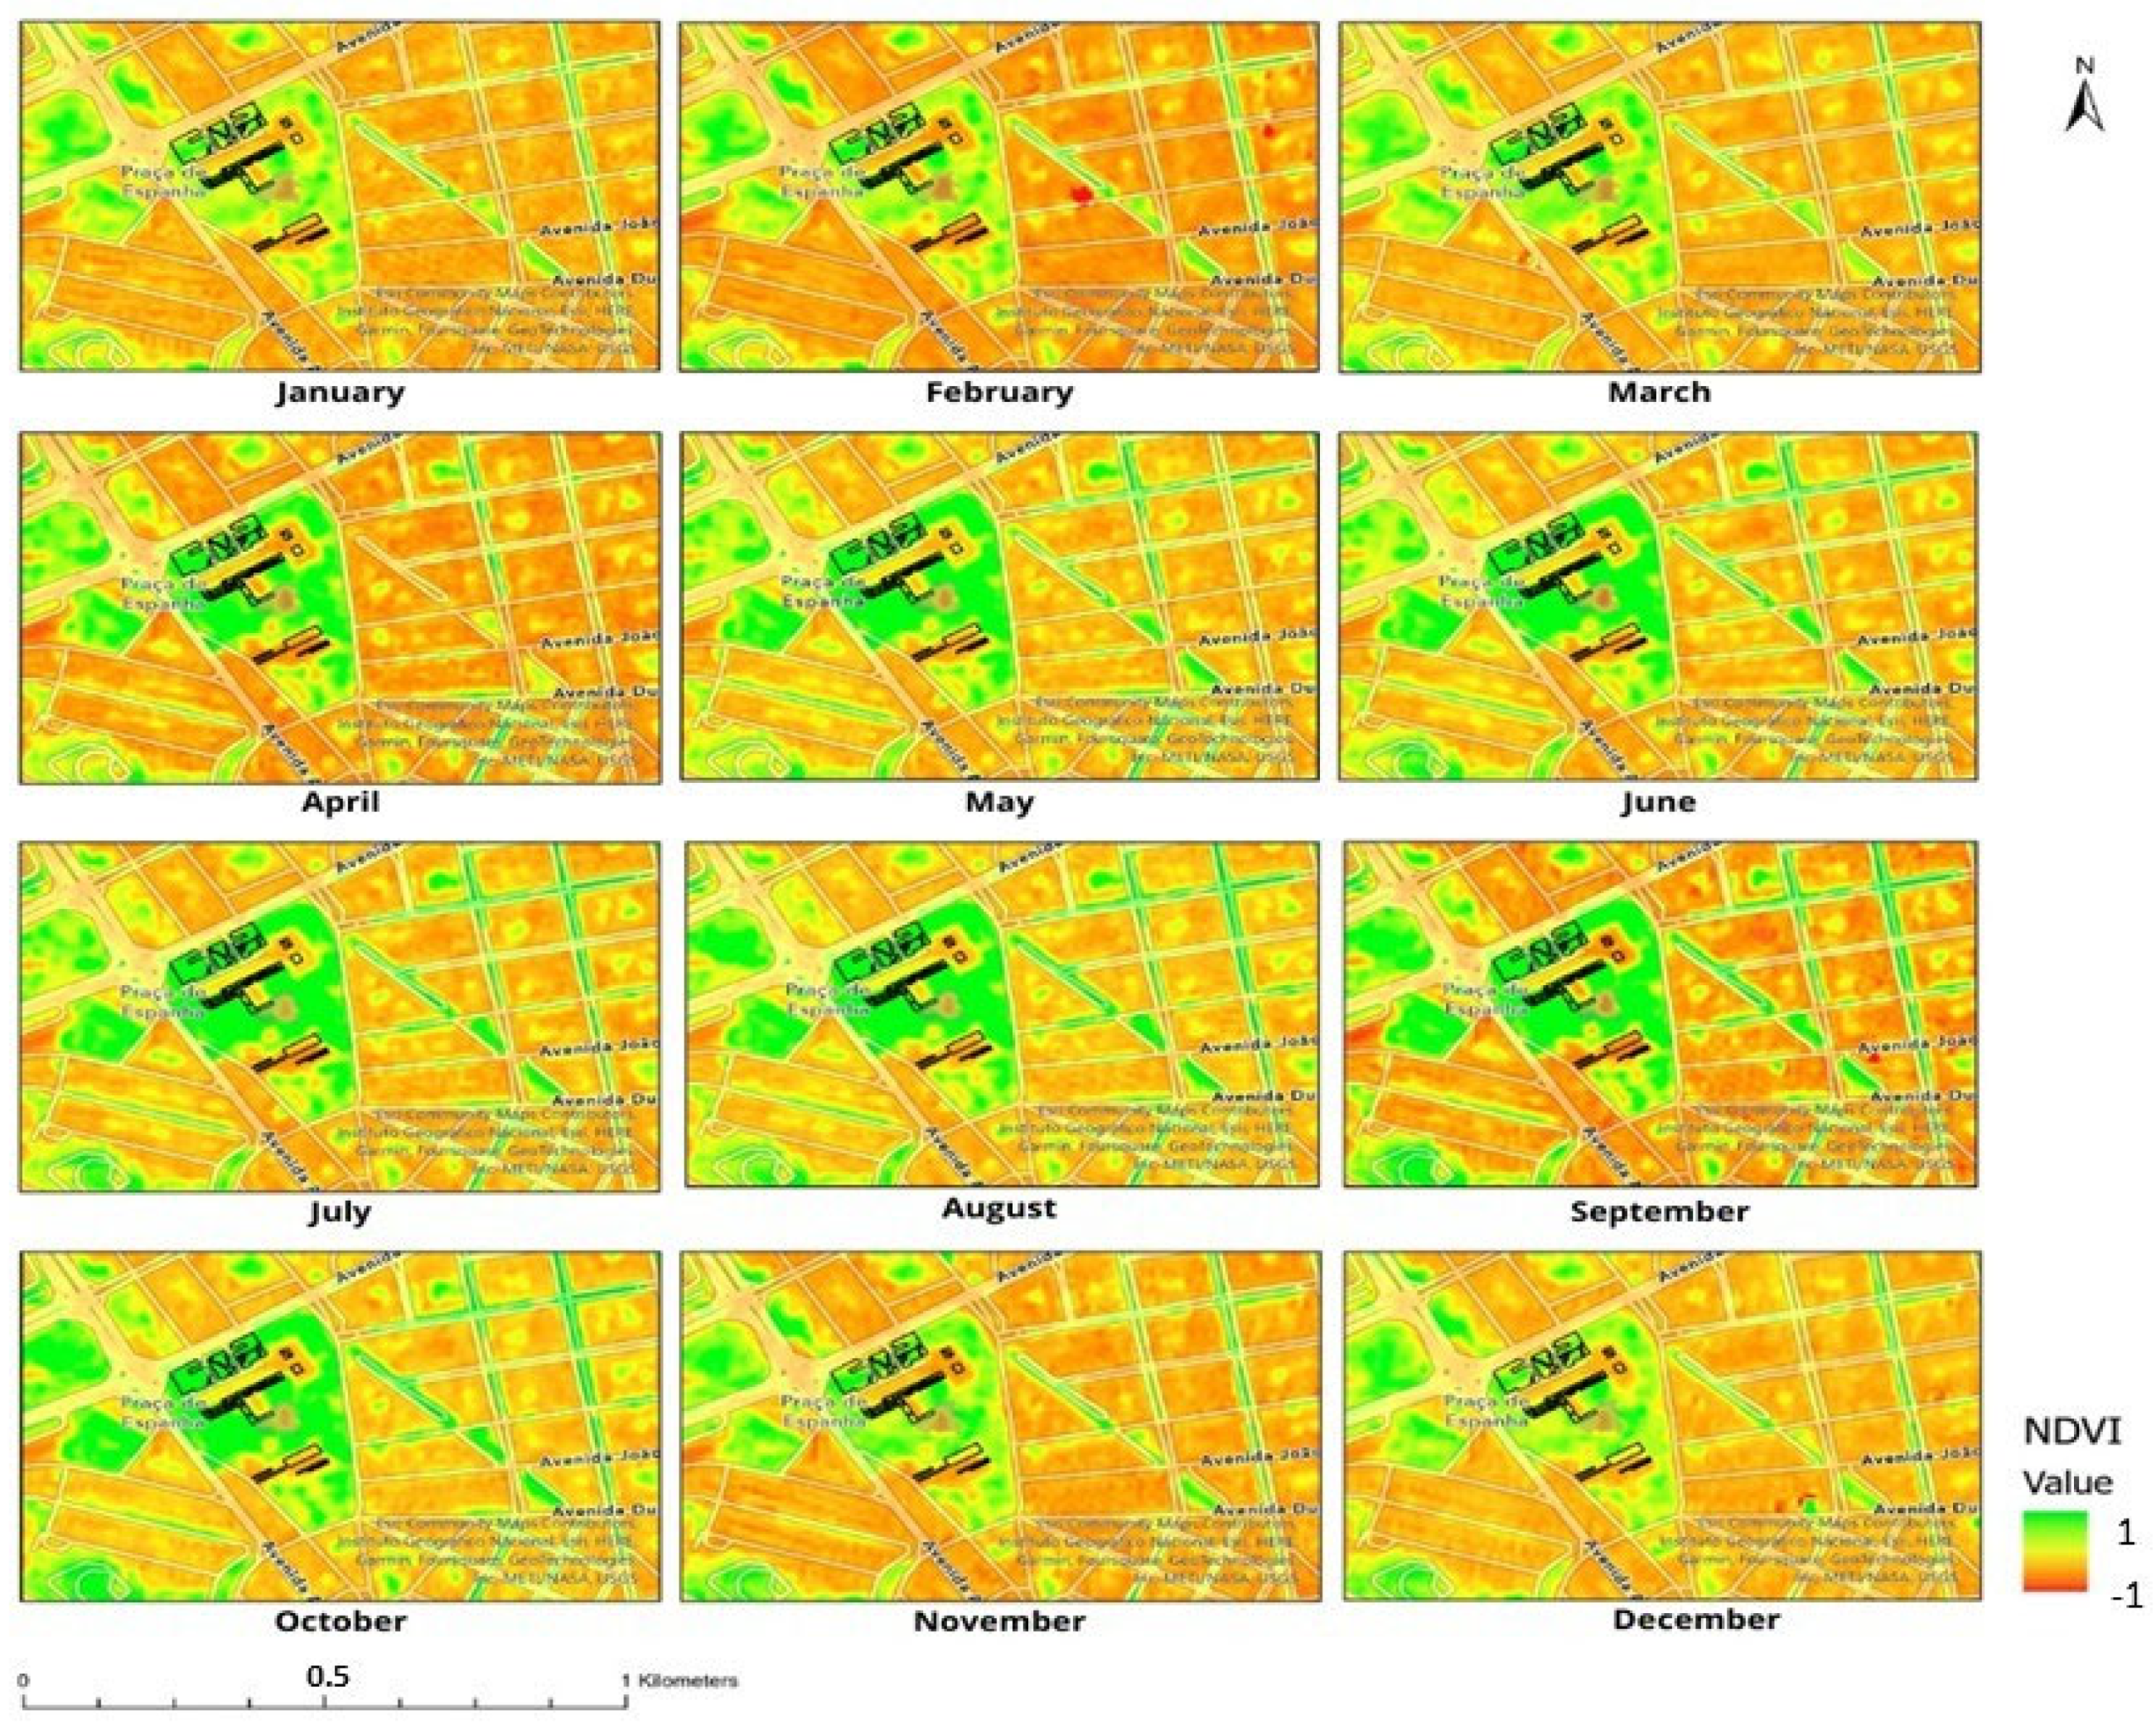
Following the acquisition of images, the next crucial step was the computation of the NDVI for each image (Figure 11). This process generated a temporal series capturing the greenness dynamics across the entire area.
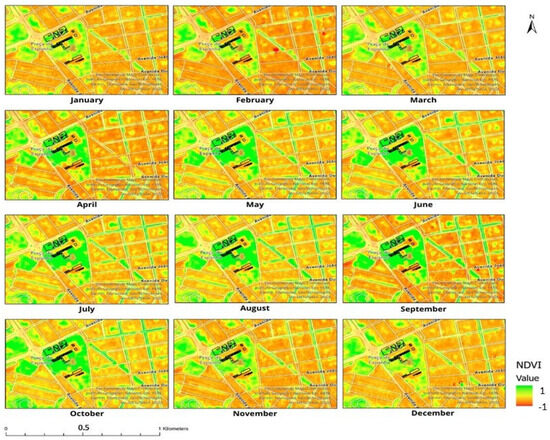
Figure 11.
NDVI temporal series for Gulbenkian Park, during 1 year (the Gulbenkians’ green roofs boundaries are represented in black).
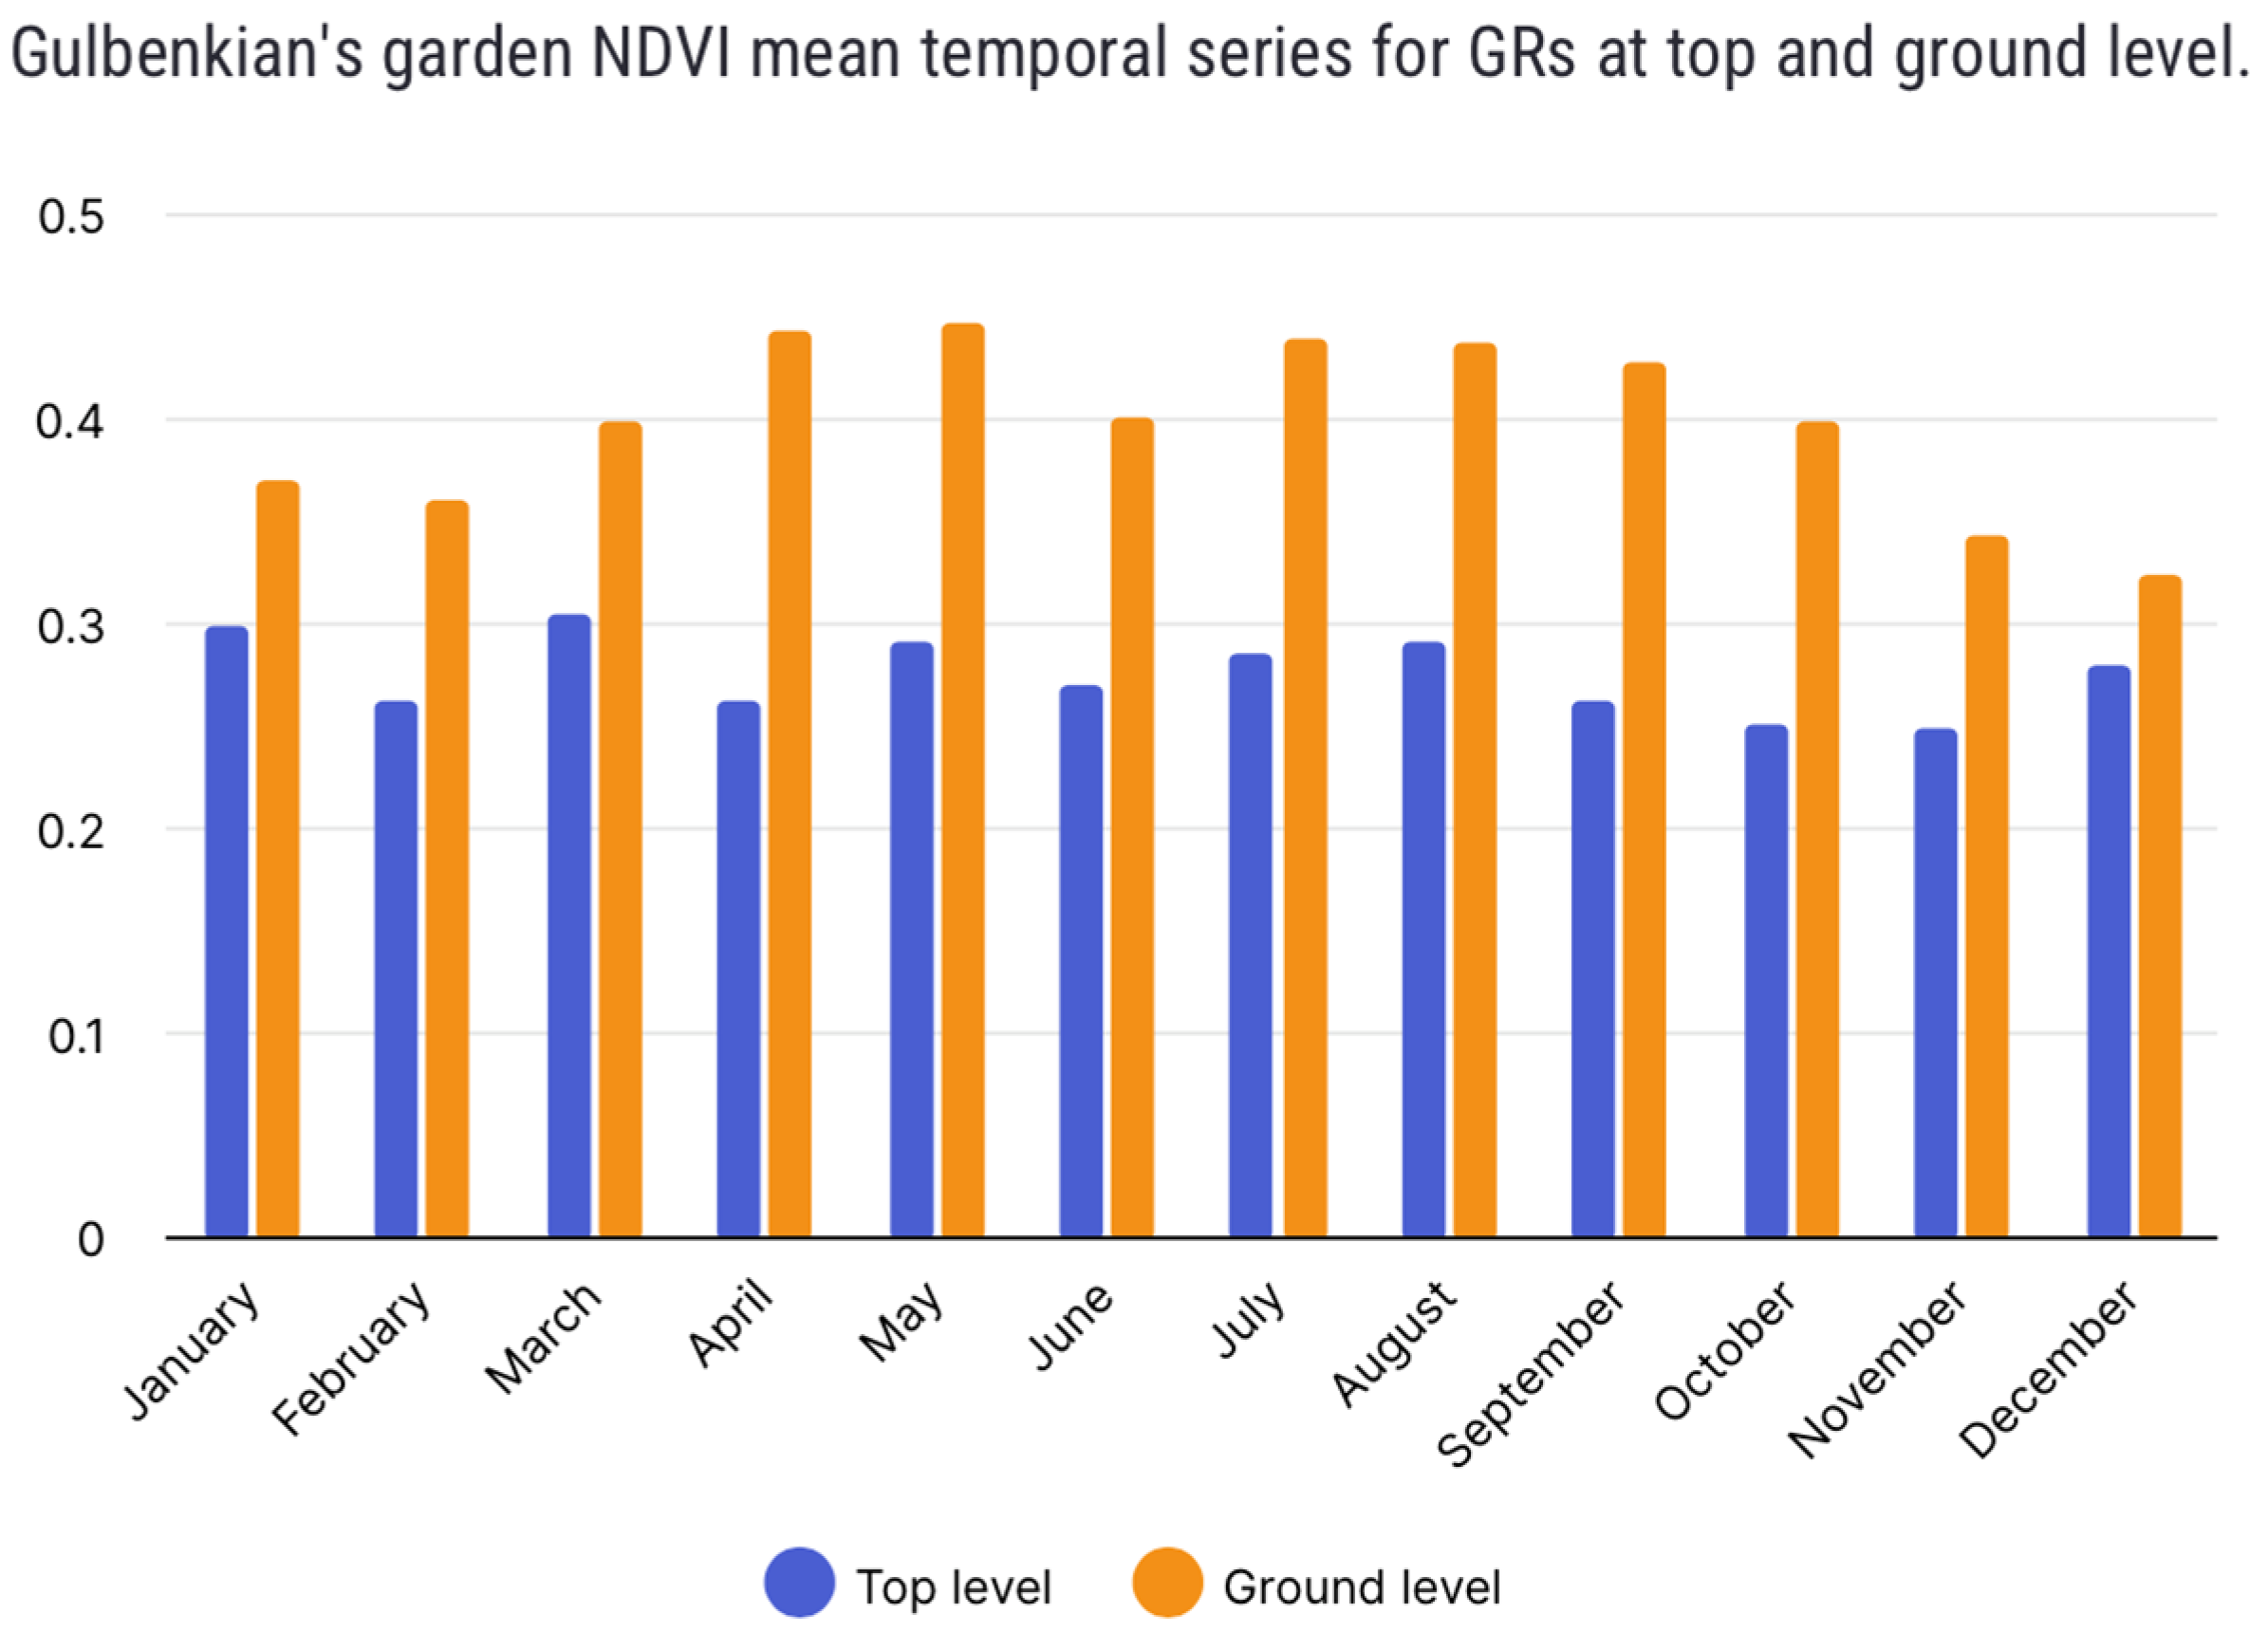
As the vegetation selection is very dependent on the NDVI threshold, computations were conducted for distinct types of green roofs with the same type of vegetation: those at top level and those at ground level. This detailed analysis revealed specific nuances in the greenness patterns for each type (Figure 12), highlighting the importance of its selection when the objective is to map green roofs at different levels.
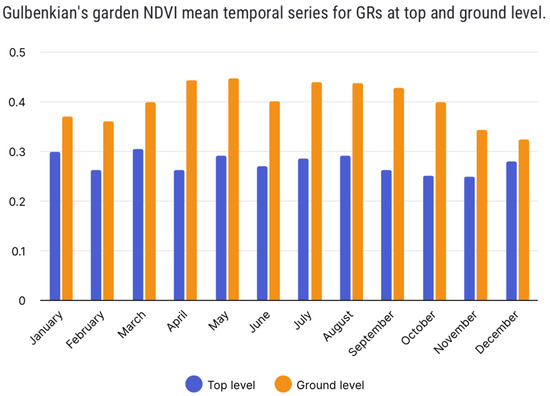
Figure 12.
Statistical information of the NDVI temporal series for GRs at the top and ground level.
For GRs at the top level, the highest mean NDVI was observed in March, reaching a value of 0.31. Conversely, for GRs at ground level, May exhibited the highest NDVI mean at a value of 0.49. On the contrasting end of the spectrum, the months of November and December recorded the lowest NDVI means for GRs at the top (0.25) and ground level (0.32), respectively (Figure 12).
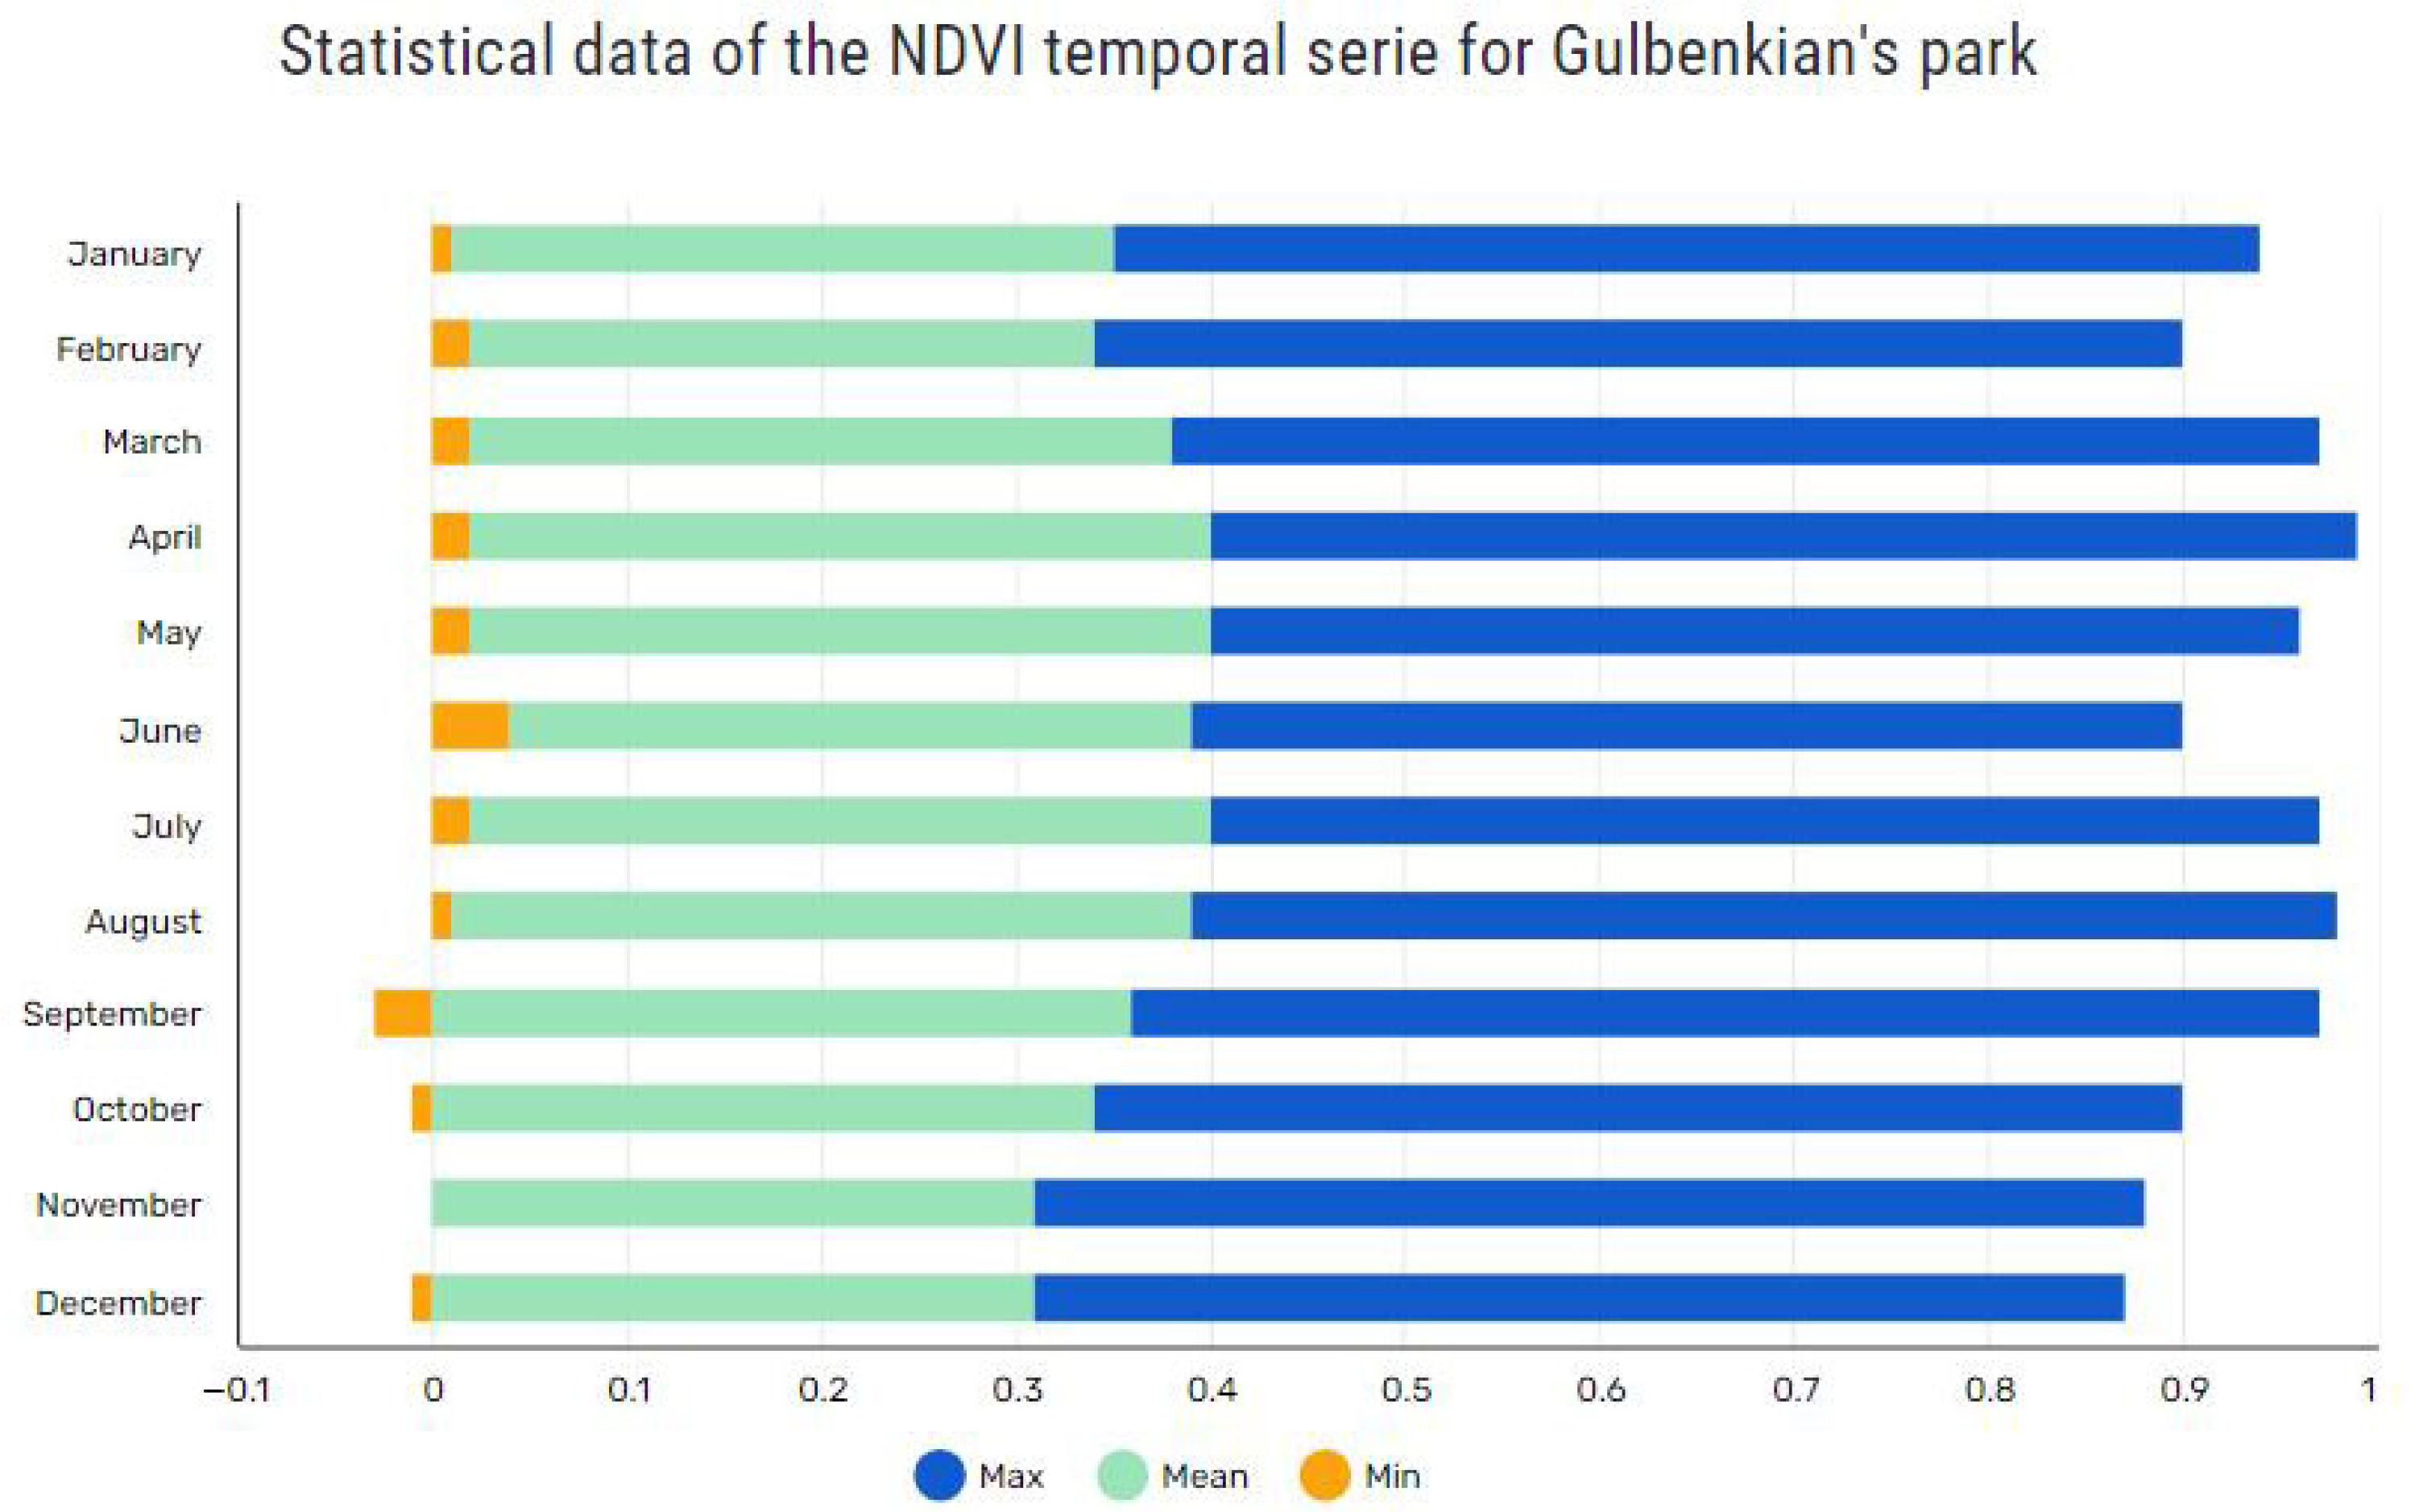
Considering the footprint of Gulbenkian’s GRs (delivered by the Gulbenkian office, represented in black in Figure 11), the NDVI image was cropped and a temporal series of NDVI images, from January to December, have been built. In the subsequent phase of the analysis, statistical metrics were computed for each month, providing a comprehensive understanding of the temporal variations in greenness. The calculated statistics encompassed the mean, maximum, and minimum values of the NDVI for all the polygons that represent the GR boundaries (Figure 13).
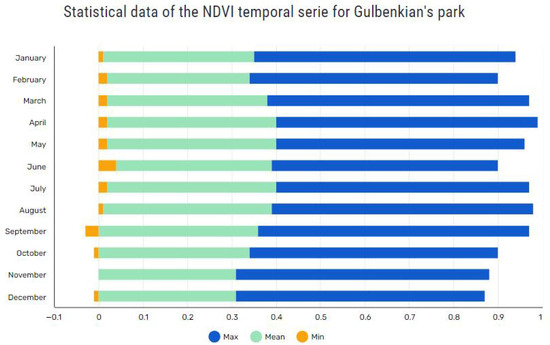
Figure 13.
Statistical data (max, min, and mean) of the NDVI temporal series (January to December) for all the GRs (top and ground level) mapped in the Gulbenkian’s gardens.
May exhibited the highest mean NDVI value at 0.38, while November recorded the lowest mean at 0.31 (Figure 12). These findings align with the broader seasonal context, as May corresponds to the conclusion of spring, a period characterized by lush vegetation, whereas November marks the end of autumn, a season typically associated with decreased greenness.
6. Conclusions
The proposed methodology combines the use of the NDVI vegetation index, estimated over a high-resolution multispectral image, with geometric information about the building’s footprint, in a GIS environment. Several challenges had to be overcome: (i) the inaccurate georeferencing of the high-resolution satellite image and its non-nadiral geometric acquisition; (ii) the outdated data provided by Lisbon municipality, with building footprints for a group of buildings that no longer exist as they have been demolished, groups of buildings grouped into a single feature, and all buildings lacking information about underground geometries; and (iii) the presence of trees in the streets (and their shadows), which lead to the incorrect identification of top-level GR.
To overcome the inexistence of geometric information on underground structures, the Faster R-CNN algorithm proved to be efficient in the identification of the shapes of buildings on which ground-level green roofs are installed, allowing to foresee better results with larger annotated datasets, as larger training datasets typically lead to higher model accuracy.
The observed trend, where NDVI values for GRs at ground level consistently surpass those at the top level, may be attributed to various factors, notably maintenance considerations. Ground-level GRs, being easily accessible, likely undergo more frequent and efficient maintenance compared to their counterparts at the top level. The ease of access simplifies tasks such as planting, pruning, and overall care, contributing to the sustained vibrancy of vegetation. Additionally, the aspect of public accessibility plays a pivotal role. Ground-level GRs, being publicly accessible, often carry higher maintenance demands to ensure an esthetically pleasing and welcoming environment. The heightened visibility and use of these green spaces by the public might drive more rigorous maintenance practices to meet both functional and esthetic expectations.
This methodology can be applied to other cities as it does not rely on the unique properties of Lisbon. However, the selection of an appropriate NDVI threshold, according to the species installed in the GR, and the geometric patterns of groups of buildings organized in condominiums are key considerations when adapting the methodology to different geographic contexts. The results of this study are particularly important to support the decision, whether by those responsible for the management and maintenance of buildings, or at the level of city planning and municipal authorities.
Author Contributions
A.P.F.: Writing—review and editing and supervision, J.P.: Writing—original draft, V.M.: Validation and supervision, C.M.S.: Supervision and funding acquisition. All authors have read and agreed to the published version of the manuscript.
Funding
The authors would like to express their gratitude to the Portuguese Foundation for Science and Technology (FCT) for funding the Gravity Project (10.54499/2022.02093.PTDC) [https://doi.org/10.54499/2022.02093.PTDC], which enabled the completion of this work. They also appreciate FCT’s continued support through the funding of UIDB/04625/2020 for the CERIS research unit (10.54499/UIDB/04625/2020).
Data Availability Statement
The Sentinel-2 and WorldView-2 are publicly available through the Copernicus Programme (https://browser.dataspace.copernicus.eu/, accessed on 1 March 2023). The buildings database has been delivered by the Lisbon municipality. Additional data used in the analysis is available from the corresponding author upon request.
Acknowledgments
The authors are deeply thankful to the reviewers for their insightful comments and suggestions, which significantly contributed to the improvement of the manuscript.
Conflicts of Interest
The authors declare no conflict of interest.
References
- Zhang, Z.; Zhao, M.; Zhang, Y.; Feng, Y. How does urbanization affect public health? New evidence from 175 countries worldwide. Front. Public Health 2023, 10, 1096964. [Google Scholar] [CrossRef] [PubMed]
- Joshi, M.Y.; Teller, J. Urban Integration of Green Roofs: Current Challenges and Perspectives. Sustainability 2021, 13, 12378. [Google Scholar] [CrossRef]
- Liberalesso, T.; Cruz, C.O.; Silva, C.M.; Manso, M. Green infrastructure and public policies: An international review of green roofs and green walls incentives. Land Use Policy 2020, 96, 104693. [Google Scholar] [CrossRef]
- Yuliani, S.; Hardiman, G.; Setyowati, E. Green-Roof: The Role of Community in the Substitution of Green-Space toward Sustainable Development. Sustainability 2020, 12, 1429. [Google Scholar] [CrossRef]
- Manso, M.; Teotónio, I.; Silva, C.M.; Cruz, C.O. Green roof and green wall benefits and costs: A review of the quantitative evidence. Renew. Sustain. Energy Rev. 2021, 135, 110111. [Google Scholar] [CrossRef]
- Marcos, L. Detection of Green Roofs through Satellite Imagery Using Faster R-CNN. Master’s Thesis, Toronto Metropolitan University, Toronto, ON, Canada, 2024. [Google Scholar] [CrossRef]
- Addabbo, P.; Focareta, M.; Marcuccio, S.; Votto, C.; Ullo, S.L. Contribution of Sentinel-2 data for applications in vegetation monitoring. Acta IMEKO 2016, 5, 44–54. [Google Scholar] [CrossRef]
- Dong, J.; Guo, F.; Lin, M.; Zhang, H.; Zhu, P. Optimization of green infrastructure networks based on potential green roof integration in a high-density urban area—A case study of Beijing, China. Sci. Total Environ. 2022, 834, 155307. [Google Scholar] [CrossRef]
- Gandini, A.; Navarro, D.; Feliu, E. Identification and Mapping of Areas and Buildings with High Roof Greening Potential. In Proceedings of the 2023 Joint Urban Remote Sensing Event (JURSE), Heraklion, Greece, 17–19 May 2023; pp. 1–4. [Google Scholar] [CrossRef]
- Santos, T.; Tenedório, J.A.; Gonçalves, J.A. Quantifying the City’s Green Area Potential Gain Using Remote Sensing Data. Sustainability 2016, 8, 1247. [Google Scholar] [CrossRef]
- Wu, A.N.; Biljecki, F. Roofpedia: Automatic mapping of green and solar roofs for an open roofscape registry and evaluation of urban sustainability. Landsc. Urban Plan. 2021, 214, 104167. [Google Scholar] [CrossRef]
- Pirotti, F.; Zanchetta, C.; Previtali, M.; Della Torre, S. Detection of Building Roofs and Facades from Aerial Laser Scanning Data Using Deep Learning. ISPRS—Int. Arch. Photogramm. Remote Sens. Spat. Inf. Sci. 2019, XLII–2/W11, 975–980. [Google Scholar] [CrossRef]
- Simpson, C.H.; Brousse, O.; Mohajeri, N.; Davies, M.; Heaviside, C. An open-source automatic survey of green roofs in London using segmentation of aerial imagery. Earth Syst. Sci. Data 2023, 15, 1521–1541. [Google Scholar] [CrossRef]
- Abdolrasol, M.G.M.; Hussain, S.M.S.; Ustun, T.S.; Sarker, M.R.; Hannan, M.A.; Mohamed, R.; Ali, J.A.; Mekhilef, S.; Milad, A. Artificial Neural Networks Based Optimization Techniques: A Review. Electronics 2021, 10, 2689. [Google Scholar] [CrossRef]
- Dhillon, A.; Verma, G.K. Convolutional neural network: A review of models, methodologies and applications to object detection. Prog. Artif. Intell. 2020, 9, 85–112. [Google Scholar] [CrossRef]
- O’Shea, K.; Nash, R. An Introduction to Convolutional Neural Networks. arXiv 2015, arXiv:1511.08458. [Google Scholar] [CrossRef]
- Girshick, R. Fast R-CNN. In Proceedings of the 2015 IEEE International Conference on Computer Vision (ICCV), Santiago, Chile, 7–13 December 2015; pp. 1440–1448. [Google Scholar] [CrossRef]
- Ren, S.; He, K.; Girshick, R.; Sun, J. Faster R-CNN: Towards Real-Time Object Detection with Region Proposal Networks. arXiv 2015, arXiv:1506.01497. [Google Scholar] [CrossRef]
- Li, M.; Zhang, Z.; Lei, L.; Wang, X.; Guo, X. Agricultural greenhouses detection in high-resolution satellite images based on convolutional neural networks: Comparison of faster R-CNN, YOLO v3 and SSD. Sensors 2020, 20, 4938. [Google Scholar] [CrossRef] [PubMed]
- Bai, T.; Pang, Y.; Wang, J.; Han, K.; Luo, J.; Wang, H.; Lin, J.; Wu, J.; Zhang, H. An optimized faster R-CNN method based on DRNet and RoI align for building detection in remote sensing images. Remote Sens. 2020, 12, 762. [Google Scholar] [CrossRef]
- Ding, J.; Zhang, J.; Zhan, Z.; Tang, X.; Wang, X. A precision efficient method for collapsed building detection in post-earthquake UAV images based on the improved NMS algorithm and faster R-CNN. Remote Sens. 2022, 14, 663. [Google Scholar] [CrossRef]
- Li, X.; Fu, L.; Fan, Y.; Dong, C. Building Recognition Based on Improved Faster R-CNN in High Point Monitoring Image. In Proceedings of the 2021 33rd Chinese Control and Decision Conference (CCDC), Kunming, China, 22–24 May 2021; pp. 1803–1807. [Google Scholar]
- Han, C.; Li, G.; Ding, Y.; Yan, F.; Bai, L. Chimney detection based on faster R-CNN and spatial analysis methods in high resolution remote sensing images. Sensors 2020, 20, 4353. [Google Scholar] [CrossRef]
- Dobrinić, D.; Gašparović, M.; Medak, D. Sentinel-1 and 2 Time-Series for Vegetation Mapping Using Random Forest Classification: A Case Study of Northern Croatia. Remote Sens. 2021, 13, 2321. [Google Scholar] [CrossRef]
- Eisfelder, C.; Asam, S.; Hirner, A.; Reiners, P.; Holzwarth, S.; Bachmann, M.; Gessner, U.; Dietz, A.; Huth, J.; Bachofer, F.; et al. Seasonal Vegetation Trends for Europe over 30 Years from a Novel Normalised Difference Vegetation Index (NDVI) Time-Series—The TIMELINE NDVI Product. Remote Sens. 2023, 15, 3616. [Google Scholar] [CrossRef]
- Liberalesso, T.; Silva, C.M.; Cruz, C.O. Assessing financial subsidies for green roofs: A comprehensive review of influential factors. Cities 2023, 137, 104295. [Google Scholar] [CrossRef]
- Rodrigues, M.; Santana, P.; Rocha, A. Modelling of Temperature-Attributable Mortality among the Elderly in Lisbon Metropolitan Area, Portugal: A Contribution to Local Strategy for Effective Prevention Plans. J. Urban Health 2021, 98, 516–531. [Google Scholar] [CrossRef]
- Silva, R.; Carvalho, A.C.; Pereira, S.C.; Carvalho, D.; Rocha, A. Lisbon urban heat island in future urban and climate scenarios. Urban Clim. 2022, 44, 101218. [Google Scholar] [CrossRef]
- He, K.; Zhang, X.; Ren, S.; Sun, J. Deep Residual Learning for Image Recognition. In Proceedings of the IEEE conference on computer vision and pattern recognition, Las Vegas, NV, USA, 27–30 June 2016; pp. 770–778. [Google Scholar]
Disclaimer/Publisher’s Note: The statements, opinions and data contained in all publications are solely those of the individual author(s) and contributor(s) and not of MDPI and/or the editor(s). MDPI and/or the editor(s) disclaim responsibility for any injury to people or property resulting from any ideas, methods, instructions or products referred to in the content. |
© 2025 by the authors. Licensee MDPI, Basel, Switzerland. This article is an open access article distributed under the terms and conditions of the Creative Commons Attribution (CC BY) license (https://creativecommons.org/licenses/by/4.0/).

