Article

The Global Spatial Pattern of Aerosol Optical, Microphysical and Chemical Properties Derived from AERONET Observations

1
State Key Laboratory of Remote Sensing and Digital Earth, Aerospace Information Research Institute, Chinese Academy of Sciences, Beijing 100101, China
2
University of Chinese Academy of Sciences, Beijing 100049, China
3
College of Resources and Environment, Chengdu University of Information Technology, Chengdu 610225, China
4
Public Meteorological Service Center, China Meteorological Administration, Beijing 100081, China
*
Author to whom correspondence should be addressed.
Remote Sens. 2025, 17(21), 3624; https://doi.org/10.3390/rs17213624
Submission received: 29 September 2025 / Revised: 30 October 2025 / Accepted: 30 October 2025 / Published: 1 November 2025

Highlights

What are the main findings?
  • Coastal aerosol gradients reveal continental outflow’s role in shaping global aerosol patterns.
  • The imbalance in observations will introduce systematic errors to the assessment of global aerosol characteristics.
What are the implications of the main findings?
  • Anthropogenic aerosols may affect remote uninhabited regions through intercontinental transport.
  • Increasing the number of observations in underdeveloped regions is beneficial for understanding the true global distribution of aerosol characteristics.

Abstract

This study, based on global AERONET observation data from 2023, employs a synergistic inversion algorithm that integrates aerosol optical, microphysical, and chemical properties to retrieve the global distribution of aerosol parameters. We find that the global annual mean aerosol optical depth (AOD), fine-mode AOD (AODf), coarse-mode AOD (AODc), absorbing aerosol optical depth (AAOD), single scattering albedo (SSA) are 0.20, 0.15, 0.04, 0.024, and 0.87, respectively. From the perspective of spatial distribution, in densely populated urban areas, AOD is mainly determined by AODf, while in the areas dominated by natural sources, AODc contributes more. Combined with the optical and microphysical properties, fine-mode aerosols dominate optical contributions, whereas coarse-mode aerosols dominate volume contributions. In terms of chemical components, fine-mode aerosols at most global sites are primarily carbonaceous. The mass concentrations of black carbon (BC) exceed 10 mg m−2 in parts of South Asia, Southeast Asia, and the Arabian Peninsula, while the mass fraction of brown carbon (BrC) accounts for more than 16% in regions such as the Sahara, Western Africa, and the North Atlantic Ocean reference areas. The dust (DU) dominates in coarse mode, with the annual mean DU fraction reaching 86.07% in the Sahara. In coastal and humid regions, the sea salt (SS) and water content (AWc) contribute significantly to the aerosol mass, with fractions reaching 13.13% and 34.39%. The comparison of aerosol properties in the hemispheres reveals that the aerosol loading in the Northern Hemisphere caused by human activities is higher than in the Southern Hemisphere, and the absorption properties are also stronger. We also find that the uneven distribution of global observation sites leads to a significant underestimation of aerosol absorption and coarse-mode features in global mean values, highlighting the adverse impact of observational imbalance on the assessment of global aerosol properties. By combining analyses of aerosol optical, microphysical, and chemical properties, our study offers a quantitative foundation for understanding the spatiotemporal distribution of global aerosols and their emission contributions, providing valuable insights for climate change assessment and air quality research.

1. Introduction

As short-lived climate forcers (SLCFs), atmospheric aerosols significantly influence Earth’s radiative forcing, regional climate changes, and public health due to their complex and variable chemical components and optical properties. These effects depend strongly on the aerosol-specific chemical composition, internal/external mixing state, and degree of hygroscopicity. For instance, black carbon (BC) and brown carbon (BrC) present strong absorption, enhancing atmospheric heating and potentially suppressing cloud formation. In contrast, sea salt (SS), inorganic salts, and highly oxidized organic compounds primarily scatter radiation, typically leading to a net cooling effect. Hygroscopic growth further modifies the aerosol single scattering albedo (SSA) and phase function, enhancing their sensitivity to environmental conditions such as relative humidity and air mass concentration [1,2]. The changes in aerosol components cause spatially heterogeneous radiative forcing, leading to uneven climate responses across regions. Since the Fifth Assessment Report of the IPCC (IPCC AR5), our understanding of these relationships has improved, reinforcing the conclusion that SLCFs, especially aerosols, have global and regional impacts on climate changes, unlike the relatively uniform spatial influence of long-lived greenhouse gases [3,4,5,6,7,8]. However, the complex nature of aerosol components and their role in heterogeneous radiative forcing and regional climate changes are compounded by insufficient global observations. IPCC AR6 emphasizes that limited global measurements of carbonaceous aerosols, the diversity of their impact factors, and the large difference from model estimates of their total amounts and loadings are leading to a relatively low confidence in the quantitative distribution of carbonaceous aerosol components currently. Natural aerosol species such as dust, sea salt, and pollen are widely distributed due to their natural emissions, yet their overall properties remain difficult to constrain. Although secondary inorganic aerosols are observed more extensively than other aerosol species, current observations remain inadequate for robust global climate assessments.
Recently, multi-angle polarimetric remote sensing has provided stricter global constraints, showing that the spatial distribution of aerosol absorption and direct radiative forcing is closely linked to aerosol components [9]. This highlights the need for synergistic “optical–microphysical–chemical” retrievals. However, the limited number of polarimetric satellites in orbit, and the massive computational demand of such retrievals, remain a key bottleneck for their broader application. Ground-based sun–sky radiometer networks provide essential observational support for global aerosol component studies. Long-term, multi-wavelength direct (sun) and diffuse (sky) radiation observations from Aerosol Robotic Network (AERONET) support the inversion of aerosol optical and microphysical parameters such as complex refractive index (CRI), particle volume size distribution (PVSD), and SSA. This capability is gradually moving towards “estimation from optics to components” [9,10,11,12,13,14]. For instance, the carbonaceous and inorganic secondary components in the winter of Beijing were retrieved through AERONET observations, revealing their joint driving effect under severe haze conditions [15]. Cross-site comparisons (Beijing vs. Kanpur) further showed that differences in emissions and humidity environments systematically modulate optical–microphysical parameters and the inferred components [16]. At the algorithm level, the choice of mixing rules strongly affects component retrievals [17]. The diagnostic biases are revealed by comparison of aerosol components between MERRA-2 products and ground-based sampling results over China [18]. The recent enhancement of the calculation skills of CRI in the multicomponent liquid system has further refined the aerosol components based on remote sensing [11,14]. Furthermore, the aerosol optical, microphysical, and chemical properties have been linked and can be retrieved by sun and sky radiance observations using the GRASP algorithm [19]. Li et al. [20] embedded the chemical component algorithm of Schusterr et al. [2] into GRASP, and applied it to POLDER/PARASOL satellite observations. This study provided fine- and coarse-mode optical properties and illustrated the connections between component, optics, and emissions through case studies of pollution events [21]. Similarly, Ou et al. [22] carry out the inversion of the optical–microphysical–chemical parameters and preliminary validation over North China. Further progress has been made by transplanting the calculation skills of CRI in the multicomponent liquid system to satellite platforms, yielding global distributions of full aerosol chemical components [14]. Integration of ground-based retrievals and chemical transport model simulations through artificial intelligence, and mapping them onto satellite observations, has also been shown to greatly enhance the capability of satellite data to resolve aerosol components [23]. Recently, systematic retrievals of global carbonaceous aerosol components have emerged [24], providing a valuable reference for addressing the observational gaps highlighted in IPCC AR6. Together, these advances point toward the establishment of a synergistic retrieval framework that spans fine and coarse modes, integrates multiple variables (AOD, AAOD, SSA, CRI, PVSD), and bridges across platforms (ground-based, satellite, and models).
Nevertheless, the current inversion process “from optical properties to chemical components” still faces several challenges. For example, regional variability in mixed components is difficult to constrain [12,17]; uncertainties in hygroscopic growth and relative humidity propagate into errors in SSA and AAOD [11,25]; and aerosol component properties across different climate zones and seasons have not yet been comprehensively characterized. To address these challenges, this study employs the global AERONET observation network as the data source to conduct a synergistic optical–microphysical–chemical inversion on a global scale (Section 2). The spatial distributions of aerosol optical, microphysical, and chemical properties are systematically analysed across regions, fine/coarse modes and emission characteristics, and the optical properties are validated against the officially released AERONET products (Section 3). Finally, a conclusion of the entire study is presented (Section 4).

2. Data and Methods

2.1. Data

2.1.1. AERONET Data

The AERONET, jointly established in the 1990s by the NASA Goddard Space Flight Center and the French PHOTONS program, is a global ground-based remote sensing network for aerosol observations. Its primary objective is to provide long-term, continuous, and standardized data on aerosol optical and microphysical properties for use in climate research, satellite validation, and model evaluation [26]. The network is widely deployed globally, currently comprising more than 600 observation sites, with approximately 250–300 being long-term sites. The primary instrument used in AERONET is the CE-318 sun–sky radiometer, which performs observations within the 340–1640 nm spectral range. Its measurement modes include direct solar radiation and sky diffuse radiation. The former is mainly used to derive AOD, while the latter provides constraints for the inversion of aerosol microphysical properties. The typical uncertainty of AOD is about ±0.01, making it one of the most accurate and reliable aerosol products currently available from ground-based observations. In terms of data products, AERONET provides fundamental optical products such as AOD and the Ångström exponent, as well as microphysical parameters retrieved from combined inversion of direct solar and sky diffuse radiation measurements. These microphysical parameters are retrieved using the inversion algorithm developed by Dubovik et al. [27], which is used to derive key parameters including PVSD, CRI, SSA, phase function, asymmetry factor, and effective radius. According to previous studies [28,29], the uncertainty of the PVSD is approximately ±35%; the errors in the real and imaginary parts of the CRI are about ±0.04 and ~50%, respectively, and under high aerosol loading conditions (AOD440 > 0.4), the accuracy of SSA can reach ±0.03.
AERONET data are categorized into different levels according to the degree of processing and quality control. Level 1.0 data represent uncorrected raw measurements, Level 1.5 data are cloud-screened but still contain certain uncertainties, and Level 2.0 data, released after rigorous calibration and quality control, are the recommended dataset for scientific analysis and satellite validation. For the inversion products of microphysical properties, in addition to routine quality screening, sufficient aerosol loading is required to ensure the reliability of the retrievals. This study primarily employs direct solar and multi-angle sky diffuse radiance measurements from AERONET sites in 2023 to retrieve aerosol optical–microphysical–chemical properties.

2.1.2. Reference Regions

In the data analysis process, the Reference Regions defined in the IPCC AR6 Working Group I (WGI) report were adopted. These regions are designed to provide a consistent geographical framework for climate change research, facilitating comparisons of climate change characteristics and impacts across different areas. Compared with previous assessment reports, AR6 places particular emphasis on regional climate change information, offering more practical and detailed regional insights. AR6 reference regions integrate natural geographical units such as continents, ocean basins, and mountain ranges, consider climate system characteristics such as monsoon systems and ocean currents, incorporate socio-economic factors such as population distribution and levels of economic development, and evaluate ecosystem vulnerability to climate change. Figure 1 illustrates the overlay of reference regions and AERONET sites distribution. When this regional framework is compared with the distribution of AERONET site, a significant global observation imbalance is revealed. Although 42 of the 58 reference regions contain AERONET sites, only 8 regions present relatively dense coverage. Among these, the Mediterranean (Region 19) and Eastern North America (Region 5) contain the largest numbers of sites, each with over 40. They are followed by Western North America (Region 3), West & Central Europe (Region 17), and East Asia (Region 35) each containing more than 30 sites. Central North America (Region 4), Northern Europe (Region 16), and Southeast Asia (Region 38) each have more than 10 sites. In contrast, the remaining 26 regions each contain fewer than 10 sites, with eight regions, including Southern South America, Northeastern Africa, West & Central Asia, and Central Australia, having only a single site. Such observational imbalance inevitably results in limited regional representativeness, but it also provides useful guidance for the future establishment of new observation sites.

2.2. Method

This study employs a synergistic inversion algorithm that has been progressively developed in our previous work. Methodologically, the algorithm follows the general inversion framework, integrating the chemical composition mixing mechanism and Mie scattering codes into the radiation transfer model (RTM) to construct the forward model. The volume fractions of aerosol components are then retrieved by applying an optimization algorithm that minimizes the residuals between observations and RTM outputs. The algorithm incorporates several refinements from earlier studies: (1) Zhang et al. [12] first refined the treatment of organic components by introducing scattering organic matter and relative humidity-related constraint; (2) Zhang et al. [11] enhanced the accuracy of CRI retrieval in multicomponent liquid systems; (3) building upon the work of Zhang et al. [12], Yang et al. [24] added brown carbon (BrC) as an aerosol component, enabling a more comprehensive characterization of carbonaceous components. Collectively, these advancements form the methodological foundation for the algorithm used in the present study.

2.2.1. Incorporation of the Light-Scattering Organic Components

The earlier method proposed by Schuster et al. [2] only included light-absorbing organic carbon (BrC) when considering organic matters (OM), but failed to account for the non-absorbing OMs (white carbon), which primarily contributes to scattering. Zhang et al. [12] overcame this limitation by adding the light-scattering organic matter (water-soluble OM and water-insoluble OM in fine mode, WSOM & WIOMf) into the inversion and imposing constraints on the range of WSOM to total OM ratios based on statistical results from the literature. However, due to the scarcity of studies that simultaneously measured the CRI of BrC and WSOM/WIOMf, BrC was not treated as an independent component in the research.
For the water-soluble substances, the environment CRI (me) is expressed as a weighted average of the CRIs of individual components as same as the Schuster et al. [2]:
m e λ = j f j m j λ
where f j represents the volume fraction of the jth water-soluble component, satisfying j f j = 1 . m j denotes the CRI of the jth water-soluble component.

2.2.2. Determination of CRI in the Multicomponent Liquid System

Although the light-scattering organic components are introduced into the algorithm, the CRI ( m ( λ ) = n ( λ ) + i k ( λ ) ) calculation method in the multicomponent liquid system did not improve, which affected the accuracy of CRI. To address this, Zhang et al. [11] proposed the multicomponent liquid mixture model (MLMM), which provides a theoretical derivation for calculating the CRI in such systems and delivers the necessary formulas for the forward model. In this model, ammonium nitrate (AN), WSOM, and fine-mode aerosol water content (AWf) are treated as a multicomponent liquid system, with the hygroscopic parameter κ used to characterize the hydration effects of the components. For a mixed solution at a given relative humidity (RH), the calculation of the real part of the CRI (ne) is modified as follows:
n e λ = 1 + 2 A e λ 1 A e λ
where A e λ is the mixed molar refractive index of the water-soluble components (the specific algorithm is provided by Equations (7) and (8) in Zhang et al. [11]). This framework can be flexibly extended to any type of water-soluble component based on the κ value, significantly enhancing the adaptability of the inversion algorithm to different regions and environmental conditions.

2.2.3. Comprehensive Characterization of Carbonaceous Components

Building upon the MLMM, Yang et al. [24] introduced the BrC component into the inversion framework, allowing for the retrieval of the carbonaceous aerosols (including BC, BrC, WSOM, and WIOM). Methodologically, the study utilizes the distinctive absorption properties of BrC in the ultraviolet and blue wavelengths to differentiate it from BC and other organic components. This characteristic is typical of colored organic matter produced through combustion or decaying processes. As it remains in the atmosphere for a longer time, it undergoes oxidation by free radicals, ultimately transforming into white carbon (WSOM & WIOM). This approach of utilizing the spectral dependence of absorption follows the principle established by Arola et al. [30]. Given that the spectral properties of BrC are compound-specific and environmentally dependent, leading to varying representative values in the literature [2,14,31], the algorithm in this study adopts the spectral characteristics consistent with those defined by Schuster et al. [2].
Alongside these improvements in organic component treatment, the algorithm has also refined the representation of components such as inorganic salts and dust, culminating in a comprehensive aerosol component model (Figure 2). The model comprises 10 distinct components across fine and coarse modes. These are categorized into 3 water-soluble (AN, WSOM, SS) and 5 water-insoluble components (BC, BrC, WIOMf, DU, WIOMc), and aerosol water content in fine and coarse mode (AWf & AWc). It is noteworthy that the WIOMc is treated as a component distinct from WIOMf due to its different natural origins and properties. Thus, they are treated as two distinct components. Aerosol water content in both fine and coarse mode is included. Due to its dependence on the hygroscopicity of the other mixed components in each mode, they are treated as separate components.

3. Results and Discussions

3.1. Aerosol Optical Properties

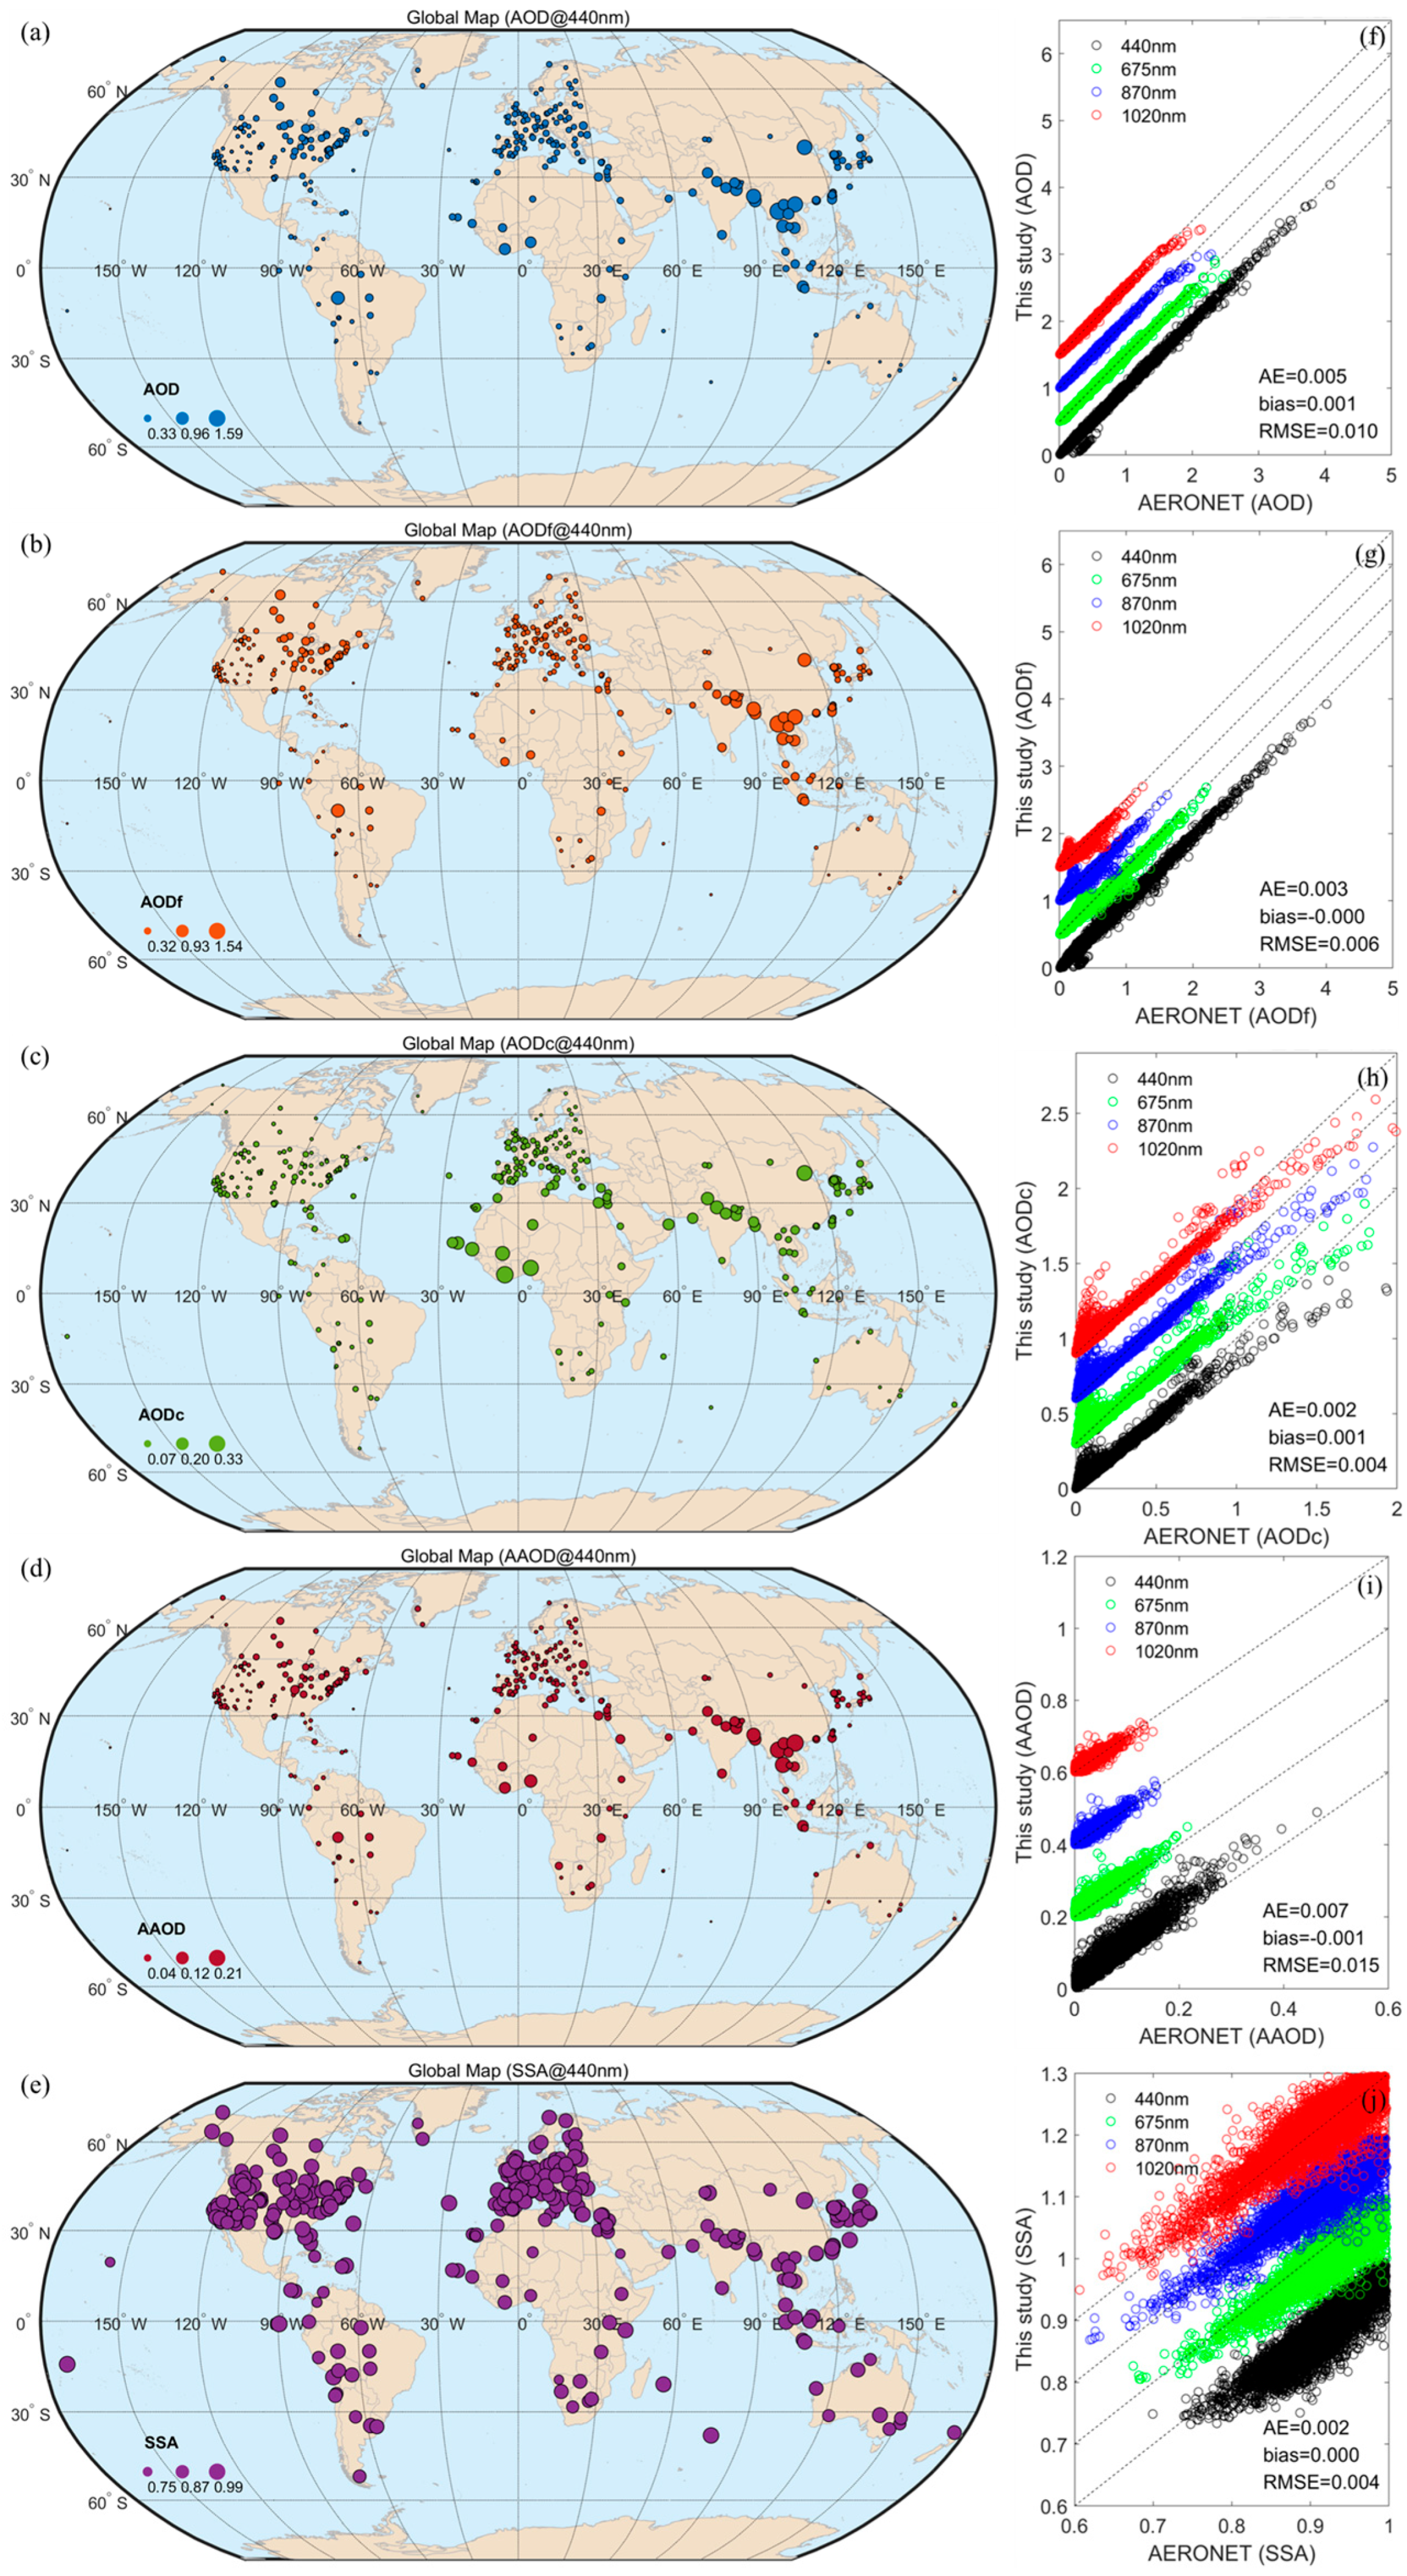
The global annual average aerosol optical properties for 2023, including AOD, AOD in the fine and coarse modes (AODf and AODc), AAOD, and SSA, along with their validation against the corresponding official AERONET products, are presented in Figure 3. Globally, the average AOD derived from AERONET sites is 0.20. High AOD values are distributed in the regions of S. Asia and S.E. Asia, with average AOD values of 0.71 and 0.55, respectively. Following these regions are W. Africa and W.C. Asia, with mean AOD values of 0.61 and 0.63, respectively (Figure 3a). Because three stations located on the southern edge of the Tibetan Plateau in India are classified under the Tibetan Plateau region, this region also presents a higher average AOD value (0.37), which is comparable to the AOD value of the E. Asia region (0.36). Additionally, the mean AOD in the S. American Monsoon region can reach 0.31. These results above are consistent with the global AOD high-value regions summarized by Lin et al. [32] based on AERONET official products. Although the AOD in the North America region did not show the high values as in E. Asia, distinct spatial variations in AOD are observed based on dense sites. The mean total AOD increases from west (0.10) to east (0.21), with intermediate values in the central region (0.17).
The distribution of AODf shows some differences compared to AOD. Globally, the average AODf is slightly lower than AOD, at 0.15. Spatially, S. Asia and S.E. Asia remain significant high-value regions, but the mean AODf in W. Africa (0.33) does not present as high values as in the previous regions (Figure 3b). In contrast, AODc in the W.E. Africa region is 0.28, much higher than its global mean of 0.04 (Figure 3c). The mean AODf in W.C. Asia is slightly higher than in W. Africa (0.44), and AODc remains at a relatively high level (0.19). This may be due to the fact that W.C. Asia has only one representative site (Lahore in Pakistan), where fine particulate pollution is primarily from biomass burning and urban industrial emissions, and is also affected by long-distance transported dust during spring, summer, and autumn [33,34]. In the North America region, AODf still shows a significant increase from west to east, similar to AOD, while AODc does not exhibit such a change. This indicates that the AOD spatial pattern in the North-American region is largely controlled by AODf; AODf values are elevated due to anthropogenic emissions from industry and transportation in densely populated regions [35]. Globally, there are only 6 stations where AODc exceeds 0.2, with 4 located in the W. Africa and Sahara regions, and the other 2 in E. Asia and S. Asia, namely Beijing_CAMS and IIT_Delhi, both of which are influenced by seasonal dust sources [36,37]. These results suggest that in areas with strong anthropogenic emissions, fine particulate matter dominates the optical depth, whereas in regions near deserts and gobi, the optical contribution of coarse particles should not be overlooked.
Although both AAOD and SSA are performance of aerosol absorption properties, AAOD is still associated with the total AOD, while SSA represents the purely aerosol light absorption contribution. Globally, the mean AAOD is only 0.024, and SSA is 0.87. Similar to AOD distribution, AAOD also presents higher values in five regions (S. Asia, S.E. Asia, W. Africa, W.C. Asia, and the Tibetan Plateau), with regional averages exceeding 0.05. The AAOD regional average for the Arabian Peninsula is next, at 0.044. There are 6 stations globally with AAOD greater than 0.1, of which 4 are located in S. Asia and S.E. Asia. The Ilorin station in the W. Africa region also recorded an annual AAOD mean of 0.117. However, the highest annual mean AAOD globally was recorded at the NGHIA_DO station in E. Asia, reaching 0.206. This station is located in Hanoi, the capital of Vietnam, where the influence of strong light-absorbing particles from seasonal biomass burning cannot be ruled out [38]. In contrast to the AAOD distribution, we retrieved 11 regions from the IPCC AR6 reference regions with SSA values less than 0.85, where only W. Africa, the Tibetan Plateau, and the Arabian Peninsula show relatively high AAOD, while AAOD in the other 8 regions is lower than 0.025, approximating or below the global mean. There are 8 stations globally with an annual mean SSA below 0.8, distributed in the Sahara (Tamanrasset_INM and Teide), W.S. Africa (Windpoort), E. Asia (Lulin), N. Pacific Ocean (Mauna Loa), and S. Indian Ocean (Maido_OPAR). We further classified the SSA mean values into three ranges, >0.90, [0.85~0.90], and <0.85, and counted the number of reference regions and stations where the SSA mean falls within these ranges. Based on the reference region statistics, we found 7 regions with SSA > 0.9, 24 regions with SSA between 0.85 and 0.90, and 11 regions with SSA < 0.85, accounting for 17%, 57%, and 26%, respectively. From the sites statistics, out of 345 valid stations in 2023, 39%, 42%, and 19% are distributed in the above SSA ranges. We found that the fraction of sites observing high-scattering aerosols is much higher than that of regions (39% vs. 17%), which can be explained by the dense observation sites in regions with scattering aerosols, reflecting the observational bias.
Figure 3f–j show the comparison between the inversion results (this study) and the AERONET official products for each wavelength (440/675/870/1020 nm) over the entire year. For clarity, we applied a suitable offset for each wavelength. As shown in the figures, the scatter plots for AOD, AODf, and AAOD closely follow the offset-adjusted 1:1 reference line, with a good linear relationship. AODc is slightly overestimated in the low-value range (<0.2), and the variability of SSA is greater than the other four parameters, but it remains within an acceptable range. Error statistics show that the average error (AE) for all five parameters is extremely low (<0.01), with biases close to zero. The root-mean-square error (RMSE) is also low, with only AAOD having an RMSE of 0.015, while the RMSE for the other four parameters is all below 0.010. This indicates that, whether at high or low values, the retrieved aerosol optical property parameters present high consistency and accuracy across the four wavelengths, and this robust multi-wavelength performance provides a solid foundation for subsequent microphysical and chemical component retrievals.
Figure 4 shows the error distribution properties for AOD, AODf, AODc, AAOD, and SSA at 440 nm across four seasons (MAM, JJA, SON, DJF). Here, DJF refers to January, February, and December of 2023. For the five optical parameters, we used thresholds of 0.4, 0.4, 0.1, 0.05, and 0.85 to separately analyze the overall, above-threshold, and below-threshold errors. We then compared these results with AERONET official products across different seasons. Overall, the errors for all parameters present an approximately symmetric distribution, with the mainly concentrated within ±0.05, indicating that the inversion results show a high consistency with AERONET products across the year. The significant differences still exist between different parameters and seasons. For AOD, the errors for all four seasons show a narrow peak distribution, with more than 80% of the samples falling within ±0.02, indicating that the algorithm is highly stable for retrieving the total aerosol load. In MAM and DJF, the errors are more frequently concentrated near 0.0, while in JJA and SON, the distribution slightly broadens due to the increase in atmospheric moisture and biomass burning emissions. Overall and in the low-AOD range, more than 90% of the errors remain within ±0.05. Under high AOD conditions (blue curve), the error distribution slightly broadens, suggesting some uncertainty in aerosol concentrations when they are higher. The error distribution for AODf follows a pattern extremely similar to AOD, but in SON and DJF, there is a tail extension in the opposite direction. Since the frequency of high errors is very low, this does not alter the distribution pattern near zero error. AODc presents stronger seasonal dependence, with higher frequency near zero error in JJA, SON, and DJF, while the error distribution in MAM is wider, with some samples shifting up to ±0.1. The error distribution for AAOD is more dispersed compared to AOD and does not follow a normal distribution, especially in high-value cases, where a long-tail distribution appears, with offset reaching ±0.15. Compared to the above parameters, SSA shows the largest uncertainty, particularly under low SSA conditions (<0.85, red curve), where the error distribution is wide, with some offsets exceeding ±0.04. In contrast, under high SSA conditions (blue curve), the low error frequency is higher. This phenomenon suggests that the errors in SSA are primarily due to highly absorbing aerosols, rather than seasonal variations. Overall, the retrieved optical parameters present high accuracy, with errors remaining stable and concentrated near zero across different seasons. However, the impact of aerosol absorption properties may be one of the main sources of inversion error.

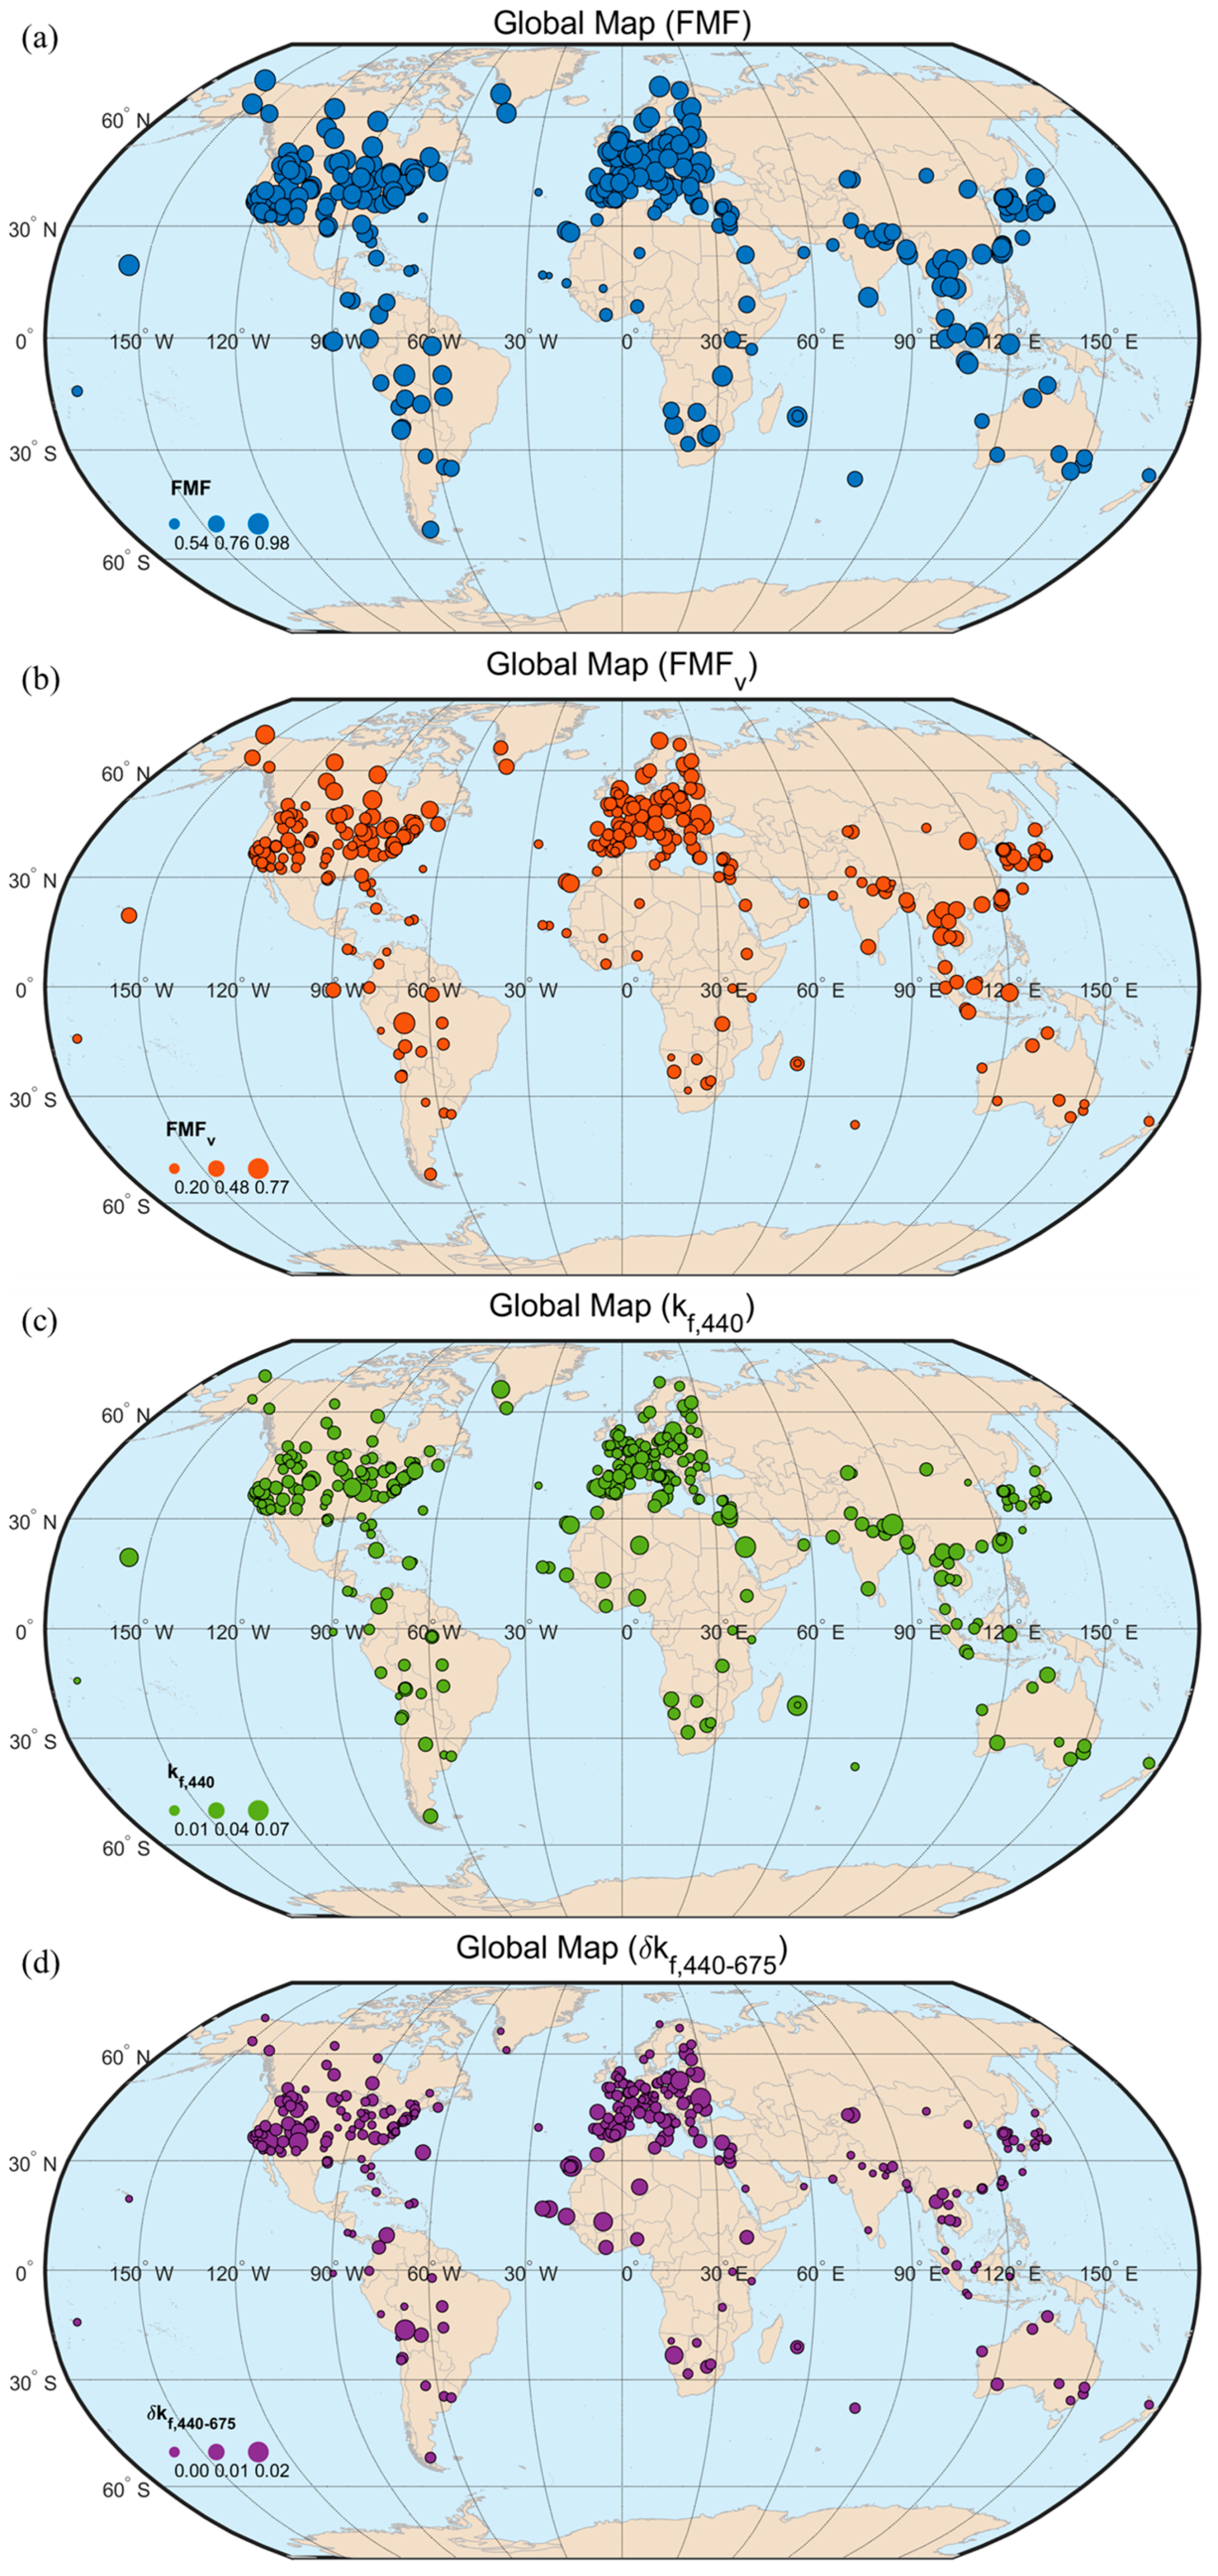
3.2. Aerosol Microphysical Properties

Through the analysis of aerosol optical properties, we can gain a general understanding of the global aerosol loading and the distribution of optical scattering-absorption properties. Leveraging the synergistic inversion of optical, microphysical, and chemical parameters based on the inversion algorithm, we further analyze global aerosol microphysical properties. Given the direct proportional relationship between aerosol volume and AOD, we further calculate the fine-mode fraction in both optical and volume terms (FMF, FMFv), the imaginary part of the CRI for fine-mode aerosols at 440 nm (kf,440), and the difference in the imaginary part of the CRI for fine-mode aerosols between 440 nm and 675 nm (δkf,440-675) to gain deeper insights into aerosol microphysical properties. Figure 5a shows that FMF is relatively high in Europe, E. Asia, S. Asia, and E. N. America, with values mostly above 0.8, indicating that aerosols in these regions are predominantly fine-mode. In contrast, in dust source regions such as the Sahara, Arabian Peninsula, and Australia, FMF is lower, usually below 0.7, indicating a more significant contribution from coarse-mode particles. Additionally, although observation in oceanic regions is sparse, they still present a low FMF dominated by naturally sourced coarse particles. The lowest FMF value of 0.46 is observed in the N. Atlantic Ocean (R50). Figure 5b shows that the spatial distribution of FMFv differs somewhat from that of FMF. Although FMFv is also relatively high in industrialized regions, its values are noticeably lower than FMF, typically ranging from 0.3 to 0.6. This indicates that, although the fine mode dominates optical depth, its volume contribution remains smaller than that of the coarse mode. This difference reflects the larger geometric size and significant volume contribution of coarse-mode particles (such as dust and sea salt), while fine-mode particles primarily control optical properties [28]. Figure 5c shows the kf,440, which is directly related to aerosol light absorption capacity. Globally, kf,440 values are generally low (most below 0.03), but relatively higher values are observed at certain sites in regions such as W. Africa, N. America, Europe, Australia, and S.E. Asia, indicating that fine-mode aerosols in these regions contain a higher fraction of light-absorbing components, such as black carbon (BC) and brown carbon (BrC) [39,40]. Furthermore, Figure 5d presents the variation in the δkf,440–675. The results show that higher values of δkf,440–675 are observed at sites in W. Africa, the Sahara, and the N. Atlantic Ocean, particularly at the Capo Verde site. Osborne et al. [41] observed that dust layers are mainly transported at altitudes of 1–2 km, with an additional layer of biomass burning aerosols above them. This results in the aerosol components in this region being dominated by dust aerosols, yet fine-mode aerosols still contain significant amounts of light-absorbing aerosols. In contrast, the high values in Europe and the Mediterranean region stem from the long-range transport of biomass burning aerosols from the W. United States [42]. The significant increase in wildfire activity in Europe in 2023 also enhanced the aerosol light absorption characteristics in the region [43]. Additionally, Australia is also a high-value region. He et al. [44] pointed out that during intensive burning periods, air quality in major Australian cities is severely threatened. Although E. Asia and S.E. Asia also experience seasonal biomass burning, the higher regional aerosol loading and the strong control policies implemented by certain countries (e.g., China) result in less prominent high values.

3.3. Aerosol Chemical Properties

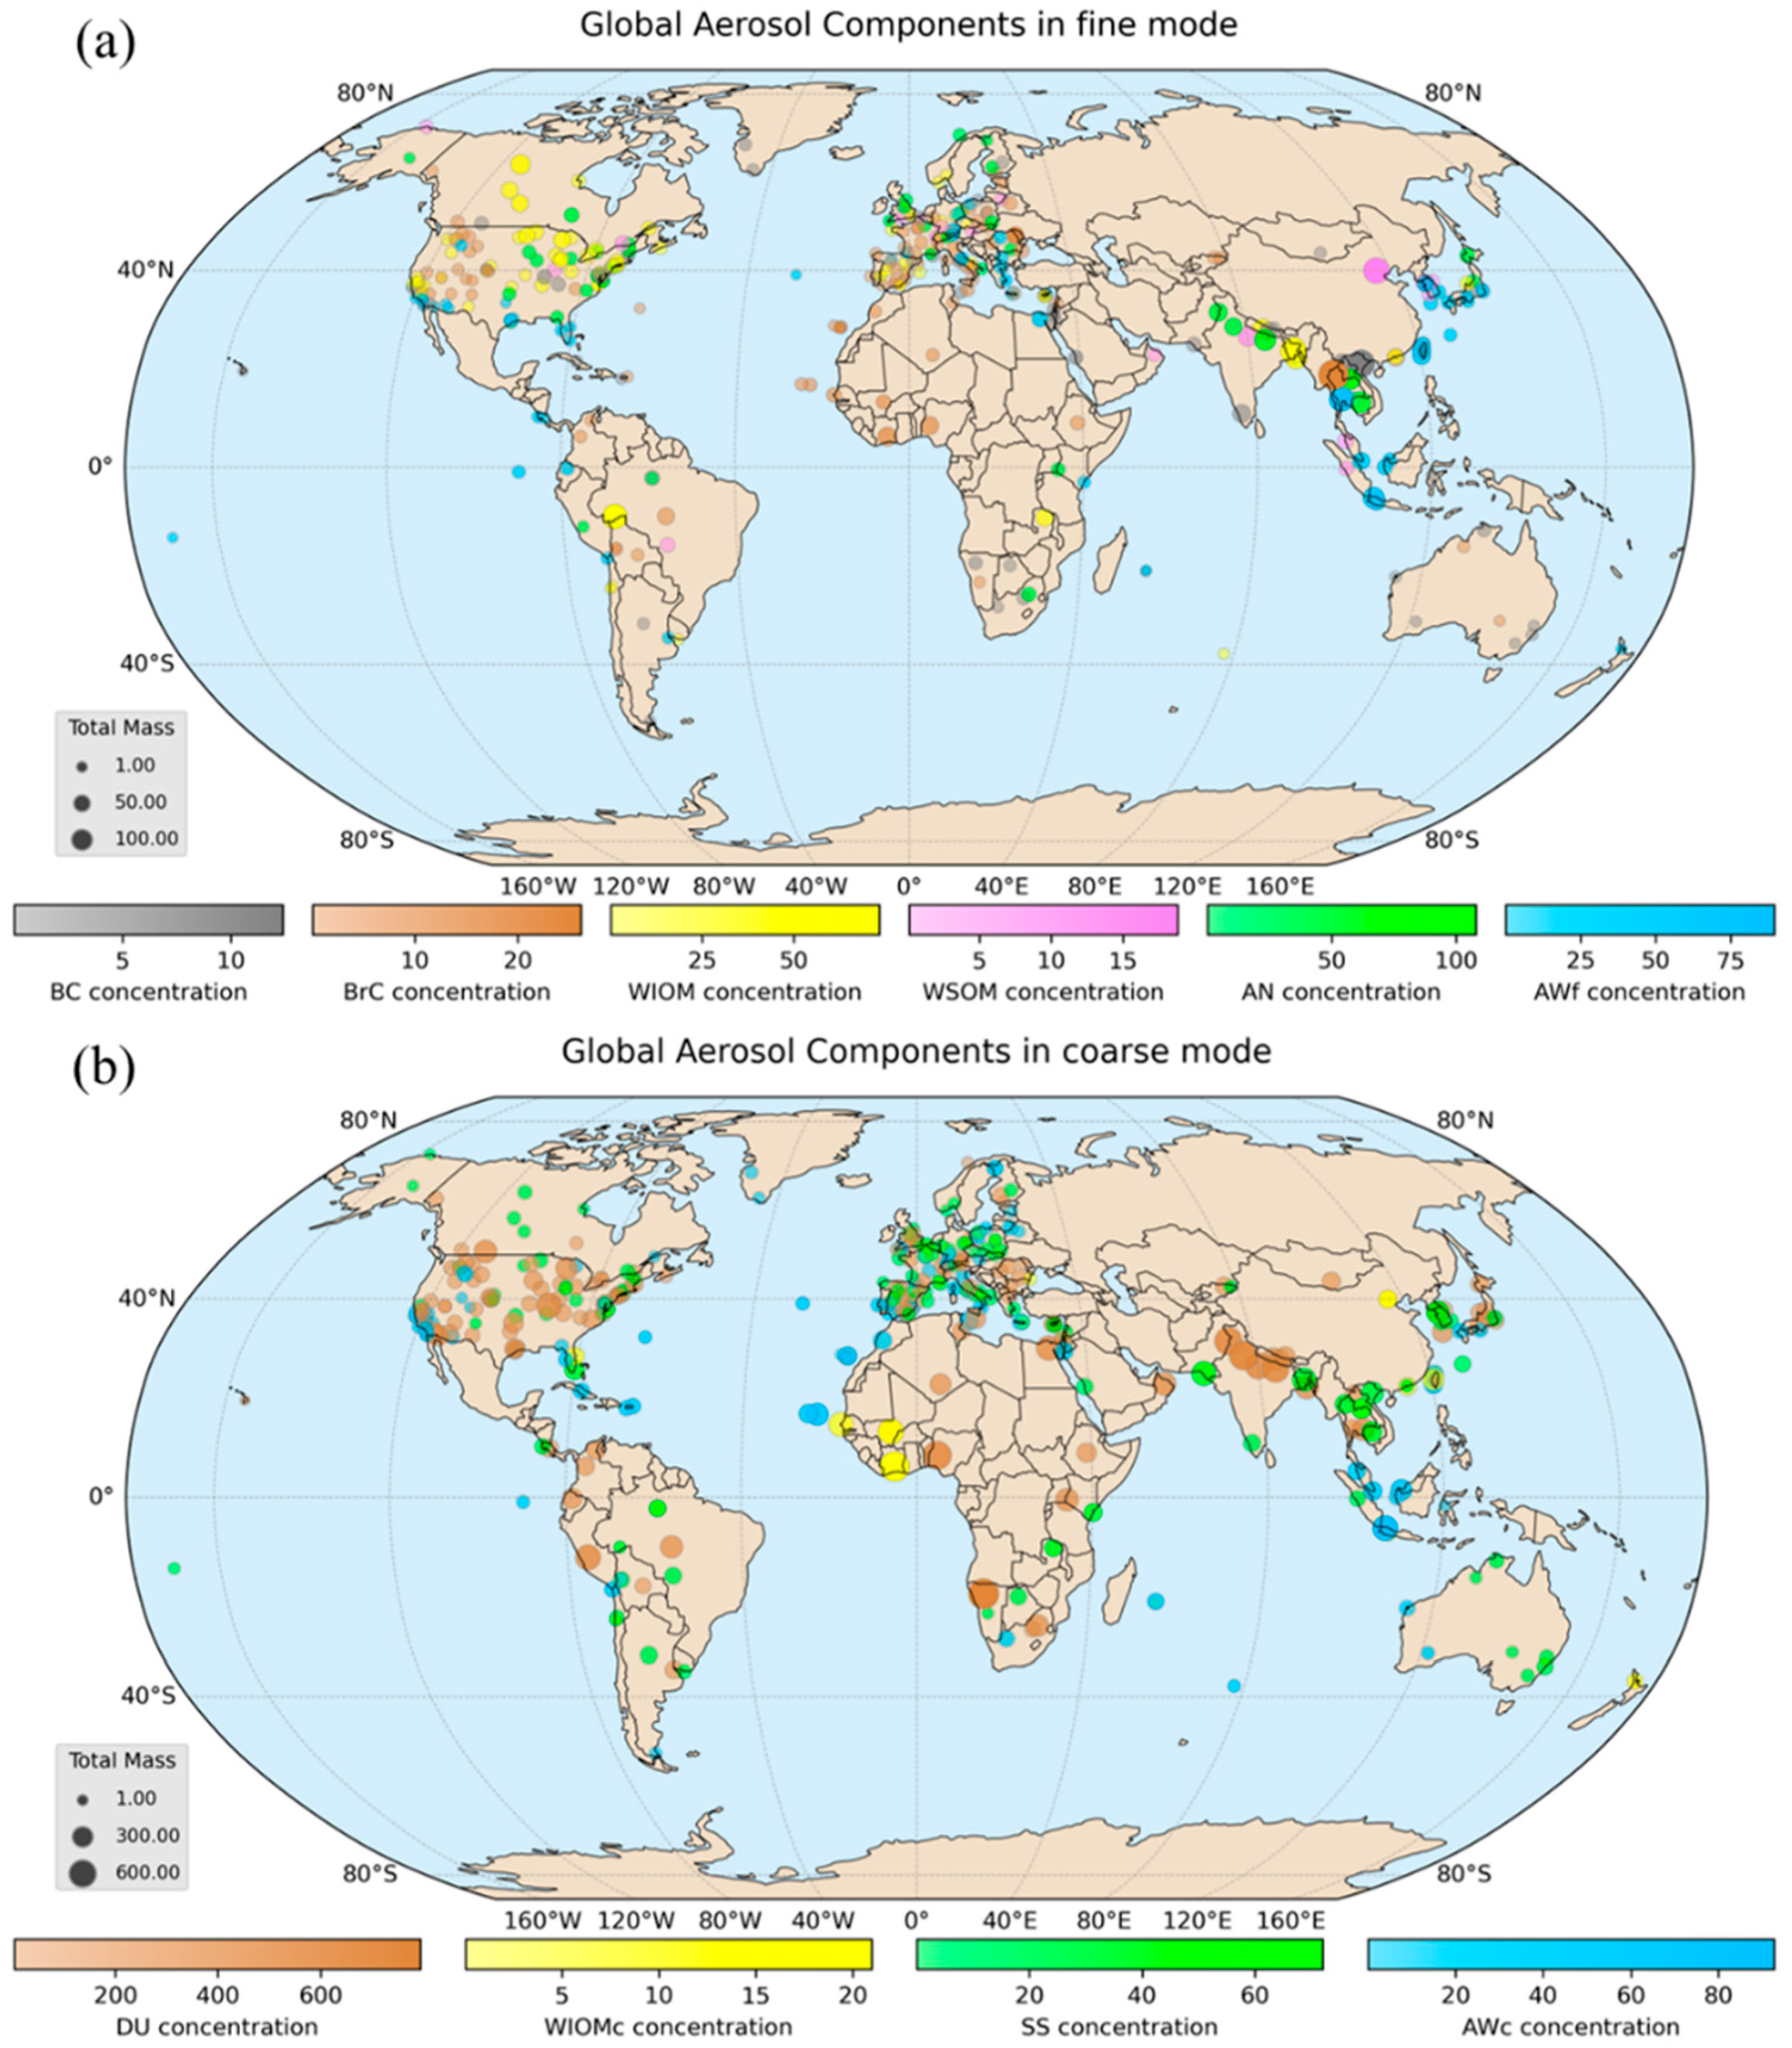
Figure 6 presents the global distribution of the annual mean chemical components of fine- and coarse-mode aerosols. To more clearly illustrate the component distribution properties across regions, we ranked the annual mean of each component at all global sites and used the high rank of aerosol component as the representative color for that site. In the figure, the size of each circle represents the total fine- or coarse-mode aerosol mass at the site, while color and transparency denote the component species and their corresponding mass concentrations. It should be noted that the color at a site does not necessarily represent the locally dominant aerosol component by mass. Instead, it indicates which component has the highest mass concentration relative to its own concentration at all other sites. We refer to this as the apparent aerosol component (AAC) of this site.
We found that global aerosol component presents significant regional variability and source-dependent properties. In the fine mode, BC and BrC are shown as AACs in many sites, with clear regional distribution patterns. BC appears as the AAC mainly in S. Asia and S.E. Asia, with peak concentrations exceeding 10 mg m−2. It is also widely distributed in the Arabian Peninsula, N. America, and Europe. Regions dominated by biomass burning, such as W. Africa, as well as the Sahara and nearby Atlantic islands influenced by W. African emissions, together with W. N. America and its downwind regions in the Mediterranean and Europe, mainly present BrC as the AAC. Among these regions, the high mass concentrations of BrC (>10 mg m−2) are mainly concentrated in the W. C. Europe, W. Africa, and S.E. Asia reference regions. Australia shows alternating patterns of BC and BrC as AACs, which is associated with its frequent large-scale wildfires. In the fine-mode aerosols shown in Figure 6, WIOMf is the AAC at some sites in N. America and Canada, as well as at a few sites in S. America, S. Africa, and S. Asia. Notably, Rio Branco in the S. American Monsoon region and Chiang Mai Met Sta in S.E. Asia show annual mean WIOMf values exceeding 70 mg m−2. Sites with WSOM as the AAC are mostly located in Asia, with the maximum value observed at Beijing-CAMS (18.8 mg m−2). The regional means are dominated by S. Asia and S.E. Asia, which may be related to the limited number of observation sites in China. Sites with AN as the AAC are primarily distributed in N. America, Europe, S. Asia, and S.E. Asia. The highest AN value is recorded at Chiang Mai Met Sta, with an annual mean of 107.9 mg m−2. Sites with AWf as the AAC are mainly located in coastal or near-water regions, particularly in E. Asia and eastern S.E. Asia. In the latter region, AWf at the Silpakorn Univ site reaches 89.5 mg m−2.
In the coarse mode, DU dominates most inland sites, with regional annual mean DU exceeding 400 mg m−2 in W. Africa, W. C. Asia, and S. Asia. W. Africa and W.C. Asia are influenced by nearby deserts and Gobi natural sources, while S. Asia is more complex because northern India is affected not only by Thar Desert dust transport during the monsoon season but also by additional local urban emissions [45,46]. In coastal regions, many sites show sea salt (SS) and AWc as AACs. Notably, some inland sites characterized by DU also display SS as their AAC, which may be related to paleo-oceanic sources in deserts [11]. In addition, W. Africa shows WIOMc as the AAC in the coarse mode, whereas fine-mode aerosols in most African sites present BrC as the AAC. This may be associated with the Congo Basin in C. Africa, reported by Gao et al. [47] as the largest source of global OM emissions, although there are no effective observations in C. Africa (R22).

3.4. Regional Properties of Aerosols

Figure 7 presents the global mass fraction distribution of aerosol components in fine and coarse modes across the IPCC AR6 reference regions. As shown in the figure, global aerosol components present a distinct spatial distribution with fine-mode carbonaceous aerosols prevailing in densely populated mid-latitudes, coarse-mode DU dominating arid subtropical regions, and coarse-mode SS being the primary component in oceanic and high-latitude coastal areas. On a global scale, BC accounts for 2–5% in most regions, but exceeds 5% in the Arabian Peninsula (R36, 6.96%), S. South America (R15, 6.11%), and W.Southern Africa (R25, 5.23%). Due to long-range transoceanic transport, even remote regions such as the N.Pacific Ocean (R47, 10.74%) and Greenland/Iceland (R0, 6.45%) show the influence of BC. BrC generally contributes less than 10% across most regions, but its fraction in fine-mode is notably high in the Sahara (R20, 20.72%), Western-Africa (R21, 16.88%), and N.Atlantic Ocean (R50, 20.06%), highlighting the influence of biomass burning in these areas. Organic matter (WIOMf + WSOM) accounts for a relatively high fraction in S.Asia (R37, 32.9%), the Tibetan Plateau (R34, 34.3%; based on sites only on the southern margin), and C.North America (R4, 31.0%), likely due to intensive agricultural burning, regional emissions, and secondary organic aerosol formation processes. The AN fraction in fine-mode fluctuates around 30–40% globally, with high values observed in N.E.North America (R2, 52.52%), S.E.South America (R14, 48.57%), N.Europe (R16, 47.52%), and E.Australia (R41, 46.60%). These elevated fractions can be attributed to industrial emissions and secondary inorganic aerosol formation under humid conditions. AWf accounts for high fractions in New Zealand (R43, 60.96%), the N.Pacific Ocean (R47, 58.26%), the Equatorial Pacific Ocean (R48, 52.17%), and the S.Pacific-Ocean (R49, 44.64%), indicating strong hygroscopic growth of marine-source aerosols in high-humidity environments.
Coarse-mode aerosol components are generally dominated by DU, with fractions exceeding 80% in most regions. The Sahara (R20, 86.07%) is a typical high-value region, reflecting the contribution of large-scale dust dispersion and long-range transport. WIOMc shows relatively high fractions in New Zealand (R43, 5.84%), the Caribbean (R8, 3.19%), and S.W.South America (R13, 3.41%), likely associated with vegetation sources or marine organic matter input. SS shows elevated fractions in the S.Pacific Ocean (R49, 13.13%), E.Australia (R41, 8.73%), New Zealand (R43, 9.34%), and the Southern-Ocean (R57, 9.81%), reflecting strong coastal sea salt influence. Similarly, AWc is pronounced in the Southern-Ocean (R57, 34.39%), New Zealand (R43, 29.66%), and the S.Pacific Ocean (R49, 22.29%), indicating significant hygroscopicity of SS components in humid environments.
Using the mass fractions of aerosol components, we classified the properties of global reference regions. We found that the Sahara (R20) and Arabian Peninsula (R36) are strongly influenced by dust sources and can be regarded as relatively pure dust-dominated types. Of course, this does not exclude the possibility of biomass-burning aerosols being transported into regions such as the Sahara during burning seasons. In the Caribbean (R8) and N.Atlantic Ocean (R50), the aerosol components in fine mode show evidence of biomass burning, while those in coarse mode present signatures of marine aerosol influence, characterized by elevated SS and AWc. This suggests that these oceanic regions do not generate such fine-mode aerosols locally; rather, their fine-mode components are entirely dominated by long-range transport from continental sources, mixing with locally generated coarse sea salt particles. The major anthropogenic pollution regions worldwide (E.North-America, Europe, E.Asia, and S.Asia) show highly consistent aerosol component ratios. Fine-mode aerosols are generally enriched in AN and AWf, while coarse-mode aerosols are dominated by DU. This indicates that in these densely populated areas, locally generated inorganic salts and black carbon dominate the fine-mode aerosol component, while long-range transported dust or local resuspended dust constitutes the main source of coarse-mode aerosols. Africa and the central, western America both show pronounced biomass-burning aerosol properties in fine mode, while their coarse aerosols remain dominated by DU. Coastal or island regions (e.g., S.E.Asia and S.C.America) also present biomass-burning properties in the fine-mode aerosols, but their coarse-mode aerosols reflect stronger marine influence, with relatively higher SS and AWc. Furthermore, from the offshore pure marine aerosol regions (e.g., N.Pacific (R47), S.Pacific Ocean (R49), and Southern-Ocean (R57)) dominated by water-soluble components, to the nearshore regions (S.Indian Ocean (R56), Equatorial Pacific Ocean (R48), New Zealand (R43)) affected by inland aerosol transport (due to the small number of stations in this area and its proximity to the shore), and finally to the coastal areas, the fractions of AWc and SS in the coarse-mode aerosol components gradually decrease, while the fractions of other types of components gradually increase, revealing the spatial extent and gradient of the continental aerosol outflow influence on the marine atmosphere. Moreover, Greenland/Iceland (R0) presents a significant fine-mode BC fraction, with an FMF mean as high as 0.91. We have reason to infer that this region is influenced by long-range transported BC [48]. Similarly, in the N.Atlantic Ocean (R50) region, two sites located close to N. Africa are affected by the combined influence of seasonally transported dust and biomass burning, and thus do not present the typical marine aerosol properties.

3.5. Comparison of Aerosol Properties in Hemispheres

The above results show that there are significant differences in the aerosol properties between the northern and southern hemispheres. Comparing the differences in aerosol properties between the two hemispheres, we find that the mean AOD in the Northern Hemisphere (0.22) is substantially higher than in the Southern Hemisphere (0.17), indicating a higher aerosol loading. The increase is mainly driven by the fine-mode component (ΔAODf = 0.03), suggesting a predominance of fine anthropogenic aerosols in the north, while coarse-mode particles are relatively more important in the south. The SSA is slightly higher in the north (by 0.01), implying stronger scattering effects possibly due to enhanced secondary inorganic aerosols. The elevated FMF and FMFv further support the dominance of pollution-derived fine particles in the Northern Hemisphere. The absorption parameters (kf,440 and δkf,440–675) exhibit minimal hemispheric differences (<5%), indicating similar spectral dependence of absorbing aerosols. However, the slightly higher AAOD in the north suggests greater contributions from absorbing species such as black and brown carbon.
In terms of composition, the Northern Hemisphere shows significantly higher concentrations of BC (ΔBC = 0.71 mg m−2) and BrC (ΔBrC = 1.58 mg m−2), highlighting stronger influences from combustion-related emissions. Both WIOMf and WSOM (ΔWIOMf = 0.27 mg m−2, ΔWSOM = 0.56 mg m−2) are elevated, indicating enhanced biomass burning emission and secondary organic aerosol formation. AN (ΔAN = +1.56 mg m−2) and AWf (ΔAWf = +1.56 mg m−2) are also more abundant, consistent with anthropogenic pollution dominance. Conversely, natural components, including DU (ΔDU = −7.41 mg m−2), WIOMc (ΔWIOMc = −1.30 mg m−2), and SS (ΔSS = −4.52 mg m−2), are more prominent in the Southern Hemisphere, reflecting stronger marine and desert sources under less industrial influence.
In summary, aerosols in the Northern Hemisphere are characterized by higher loading, a predominance of fine-mode particles, and enhanced absorption, primarily driven by anthropogenic emissions. In contrast, Southern Hemisphere aerosols are dominated by natural scattering particles such as SS and DU. These hemispheric contrasts underscore the distinct anthropogenic–natural partitioning of global aerosol sources. However, the significant disparity in the number of observation sites (301 vs. 44) has to some extent restricted the hemispheric comparison analysis.

3.6. The Observational Imbalance Induced the Global Mean Differences

Figure 8 illustrates the relative differences (RD) in the global means of aerosol optical, microphysical, and component properties obtained using two averaging approaches. The first approach directly averages all global sites (AGS), while the second calculates regional means within IPCC AR6 reference regions and then averages across regions (ARR), which is designed to mitigate biases in the global mean caused by uneven observational density. We found that the impact on optical parameters representing overall aerosol properties is smaller than that on parameters in fine and coarse mode. Specifically, the global RD in AOD, SSA, and AAOD are within 6%, while the RD of AODf and AODc exceed 10%. In particular, the RD of AODc reaches –15.61%, indicating that the AGS approach significantly underestimates AODc compared with the ARR approach. This bias likely results from the less available observations in remote oceanic and desert regions combined with the dense coverage in developed regions, leading to an overrepresentation of continental aerosols in the global mean. Comparing FMF and FMFv, the two global averaging approaches show only minor differences in the optical FMF (RD = 4.72%), but the RD approaches 10% for FMFv which reflects aerosol volume fractions. The fine-mode light absorptivity indicator kf,440 is underestimated by 11.35% under the AGS approach, most likely due to the scarcity of observations in biomass-burning regions, where strongly absorbing organic aerosols prevail. This suggests that global retrievals relying solely on current observational networks may underestimate the global light absorption efficiency of fine aerosols. For the aerosol components, coarse-mode components are all significantly underestimated, especially SS, WIOMc, and AWc, which are underestimated by more than 27%. This underestimation is closely related to the scarcity of observation sites that can represent pristine oceanic environments. In the fine mode, WIOMf is overestimated by about 19.10%, which can be explained by the particularly dense network of observation sites in North America where WIOMf fractions are relatively high. We suggest that the ARR provides a more reasonable approach for evaluating global aerosol properties, as it balances disparities in site observation density across regions. Although some regions have very few sites (in some regions only one), the regional means remain representative in most cases and can mitigate uncertainties caused by global observational imbalances as much as possible.
It should be noted that, although the ARR approach effectively reduces the dominance of regions with dense observations in the global mean, it cannot fully eliminate representativeness biases within individual regions. The spatial distribution of sites remains highly uneven in some large regions, such as East Asia (R35), where Japan and South Korea are well represented while Chinese sites are sparse and concentrated mainly in southern areas. This uneven coverage limits our ability to assess subregional differences or perform sensitivity analyses for areas without observations. In addition, we found that in several regions with only a few observation sites (e.g., R50), these sites are located near continental margins and may be influenced by continental air masses, thus potentially weakening the characteristic signatures of marine aerosols expected for these regions. Such spatial inhomogeneity introduces uncertainty into the regional means and, consequently, into the global estimates derived from them. Nevertheless, the ARR approach still provides a more balanced assessment of global aerosol properties compared with the direct averaging of all sites (AGS), as it mitigates the overrepresentation of well-monitored areas and minimizes large-scale observational biases. Future work will focus on improving regional representativeness through weighting schemes or integration with satellite-based observations.

4. Conclusions

We employed a synergistic inversion algorithm with the ability to jointly retrieve aerosol optical, microphysical and chemical composition parameters to conduct an inversion of the 2023 AERONET global observations, and obtained a self-consistent global distribution of aerosol optical–microphysical–chemical properties. We found that the global mean AOD was 0.20, with significantly higher values in East and South Asia. In highly industrialized urban agglomerations, AODf dominated the spatial pattern of AOD, whereas AODc contributed more strongly in desert and ocean regions. On both annual and seasonal scales, the aerosol optical parameters showed small deviations compared with AERONET official products, with no distinct seasonal bias. The main uncertainties can derive from aerosol absorption properties. Significant regional differences exist in global aerosol optical and microphysical properties. The fine-mode aerosols are mainly attributed to total optical properties in industrialized and densely populated regions, whereas coarse-mode aerosols prevail in terms of volume contribution. Biomass burning emissions in West Africa and dust transport from the Sahara jointly enhanced regional aerosol light absorption capacity, while long-range transport of biomass-burning aerosols from North America increased aerosol light absorption capacity over Europe and the Mediterranean.
Absorbing aerosol components (e.g., BC and BrC) presented spatial distributions consistent with the parameters kf,440 and δkf,440–675, reflecting the internal consistency of the inversion algorithm. In the fine mode, BC and BrC dominated in regions such as South Asia, Southeast Asia, West Africa, and Europe, reflecting the strong influence of fossil fuel combustion and biomass burning, while other components showed strong associations with local emissions and environmental conditions. Coarse-mode aerosols were mainly represented by DU and SS, underscoring the strong control of natural sources, though organic matter also contributed in certain regions. Overall, these spatial distributions reveal the combined roles of anthropogenic emissions, natural sources, and interregional transport in shaping global aerosol chemical components. Further classification of aerosol component by IPCC AR6 reference regions shows that mid-latitude densely populated areas are dominated by fine-mode AN and carbonaceous aerosols, subtropical arid regions are dominated by coarse-mode DU, and oceanic and high-latitude coastal areas are dominated by coarse-mode SS and AWc. Long-range transoceanic transport significantly changed the fine-mode components in marine and polar regions, enriching them with BC and BrC and highlighting the influence of continental emissions on remote atmospheric environments. Overall, the gradient of aerosol components from the open sea to coastal regions clearly reflects the regulatory role of continental aerosol outflow in shaping the global aerosol distribution pattern. Moreover, the uneven distribution of global aerosol observation sites causes systematic biases in estimating aerosol properties, particularly in regions with sparse observations such as oceans and dust sources, where natural aerosol properties are substantially underestimated in global averages. This observational imbalance directly affects the accuracy of global aerosol property assessments.

Author Contributions

Y.Z.: Writing—original draft, Visualization, Methodology, Formal analysis, Resources, Funding acquisition. Q.W.: Writing—review & editing, Software, Data curation. Z.Y.: Investigation, Software, Data curation. C.Y.: Investigation, Methodology, Writing—review & editing. T.H.: Investigation, Data curation. Y.X.: Writing—review & editing, Funding acquisition. Y.C.: Writing—review & editing. H.X.: Project administration. All authors have read and agreed to the published version of the manuscript.

Funding

This work was supported by the National Key Research and Development Program (Grant No. 2022YFE0209500), the National Natural Science Foundation of China (Grant No. 42175147, 42175148).

Data Availability Statement

The original contributions presented in the study are included in the article, further inquiries can be directed to the corresponding author.

Acknowledgments

The data used for this study are available at https://aeronet.gsfc.nasa.gov/ (AERONET website, accessed on 29 October 2025). We would like to thank all the sites staffs for the data used for this study and the GRASP team (https://www.grasp-open.com/, accessed on 29 October 2025) for their algorithmic support.

Conflicts of Interest

The authors declare that they have no known competing financial interests or personal relationships that could have appeared to influence the work reported in this paper.

Abbreviations

AODAerosol Optical Depth
AODfFine-mode Aerosol Optical Depth
AODcCoarse-mode Aerosol Optical Depth
AAODAbsorbing Aerosol Optical Depth
SSASingle Scattering Albedo
FMFFine-Mode Fraction (optical)
FMFvFine-Mode Volume Fraction
PVSDParticle Volume Size Distribution
CRIComplex Refractive Index
m
nReal part of CRI
kImaginary part of CRI
Kf,440Imaginary part of CRI in fine mode at 440 nm
δkf,440–675Imaginary part of the fine-mode aerosol CRI
between 440 nm and 675 nm
A(λ)Molar refractive index
RHRelative Humidity
fiVolume fraction of the ith component
BCBlack Carbon
BrCBrown Carbon
OMOrganic Matter
WSOMWater-Soluble Organic Matter
WIOMfWater-Insoluble Organic Matter in fine mode
ANAmmonium Nitrate
AWfAerosol Water content (fine mode)
DUDust
SSSea Salt
WIOMcWater-Insoluble Organic Matter in coarse mode
AWcAerosol Water Content(coarse mode)
SLCFShort-Lived Climate Forcer
MLMMMulti-Component Liquid Mixture Model
AACApparent Aerosol Component
AGSAverage of Global Sites
ARRAverage of IPCC AR6 regions
RTMRadiation Transmission Model
MERRA-2Modern-Era Retrospective analysis for Research and Applications, Version 2
GRASPGeneralized Retrieval of Aerosol and Surface Properties
POLDERPolarization and Directionality of the Earth’s Reflectances
PARASOLPolarization &Anisotropy of Reflectances for Atmospheric Sciences coupled with Observations from a Lidar
PHOTONSPHOtométrie pour le Traitement Opérationnel de Normalisation Satellitaire
AEAverage Error
RMSERoot-Mean-Square Error
RDRelative Difference

References

  1. Kasoar, M.; Shawki, D.; Voulgarakis, A. Similar spatial patterns of global climate response to aerosols from different regions. npj Clim. Atmos. Sci. 2018, 1, 12. [Google Scholar] [CrossRef]
  2. Schuster, G.L.; Dubovik, O.; Arola, A. Remote sensing of soot carbon—Part 1: Distinguishing different absorbing aerosol species. Atmos. Chem. Phys. 2016, 16, 1565–1585. [Google Scholar] [CrossRef]
  3. Aamaas, B.; Berntsen, T.K.; Fuglestvedt, J.S.; Shine, K.P.; Collins, W.J. Regional temperature change potentials for short-lived climate forcers based on radiative forcing from multiple models. Atmos. Chem. Phys. 2017, 17, 10795–10809. [Google Scholar] [CrossRef]
  4. Collins, D.B.; Ault, A.P.; Moffet, R.C.; Ruppel, M.J.; Cuadra-Rodriguez, L.A.; Guasco, T.L.; Corrigan, C.E.; Pedler, B.E.; Azam, F.; Aluwihare, L.I.; et al. Impact of marine biogeochemistry on the chemical mixing state and cloud forming ability of nascent sea spray aerosol. J. Geophys. Res. Atmos. 2013, 118, 8553–8565. [Google Scholar] [CrossRef]
  5. Dong, B.; Wilcox, L.J.; Highwood, E.J.; Sutton, R.T. Impacts of recent decadal changes in Asian aerosols on the East Asian summer monsoon: Roles of aerosol–radiation and aerosol–cloud interactions. Clim. Dyn. 2019, 53, 3235–3256. [Google Scholar] [CrossRef]
  6. Lee, Y.H.; Adams, P.J.; Shindell, D.T. Evaluation of the global aerosol microphysical ModelE2-TOMAS model against satellite and ground-based observations. Geosci. Model. Dev. 2015, 8, 631–667. [Google Scholar] [CrossRef]
  7. Liu, L.; Shawki, D.; Voulgarakis, A.; Kasoar, M.; Samset, B.H.; Myhre, G.; Forster, P.M.; Hodnebrog, O.; Sillmann, J.; Aalbergsjo, S.G.; et al. A PDRMIP multi-model study on the impacts of regional aerosol forcings on global and regional precipitation. J. Clim. 2018, 31, 4429–4447. [Google Scholar] [CrossRef]
  8. Persad, G.; Burney, J.A.; Burke, M.; Heft-Neal, S.; Bendavid, E.; Proctor, J.; Caldeira, K. Dependence of the Global Burden of Aerosol-Driven Societal Impacts on the Geographic Location of Emissions. In Proceedings of the AGU Fall Meeting Abstracts; American Geophysical Union: Washington, DC, USA, 2018; p. GH11C-0924. [Google Scholar]
  9. Chen, C.; Dubovik, O.; Schuster, G.L.; Chin, M.; Henze, D.K.; Lapyonok, T.; Li, Z.; Derimian, Y.; Zhang, Y. Multi-angular polarimetric remote sensing to pinpoint global aerosol absorption and direct radiative forcing. Nat. Commun. 2022, 13, 7459. [Google Scholar] [CrossRef]
  10. Xie, Y.S.; Li, Z.Q.; Zhang, Y.X.; Zhang, Y.; Li, D.H.; Li, K.T.; Xu, H.; Zhang, Y.; Wang, Y.Q.; Chen, X.F.; et al. Estimation of atmospheric aerosol composition from ground-based remote sensing measurements of Sun-sky radiometer. J. Geophys. Res. Atmos. 2017, 122, 498–518. [Google Scholar] [CrossRef]
  11. Zhang, Y.; Li, Z.; Chen, Y.; de Leeuw, G.; Zhang, C.; Xie, Y.; Li, K. Improved inversion of aerosol components in the atmospheric column from remote sensing data. Atmos. Chem. Phys. 2020, 20, 12795–12811. [Google Scholar] [CrossRef]
  12. Zhang, Y.; Li, Z.; Sun, Y.; Lv, Y.; Xie, Y. Estimation of atmospheric columnar organic matter (OM) mass concentration from remote sensing measurements of aerosol spectral refractive indices. Atmos. Environ. 2018, 179, 107–117. [Google Scholar] [CrossRef]
  13. Zhang, Y.; Li, Z.; Zhang, Y.; Li, D.; Qie, L.; Che, H.; Xu, H. Estimation of aerosol complex refractive indices for both fine and coarse modes simultaneously based on AERONET remote sensing products. Atmos. Meas. Tech. 2017, 10, 3203–3213. [Google Scholar] [CrossRef]
  14. Zhang, Y.; Yan, C.; Li, Z.; Gu, H.; Xie, Y. Development of a multiple solution mixing mechanism based aerosol component retrieval method for polarimetric satellite measurements. Atmos. Environ. 2025, 349, 121120. [Google Scholar] [CrossRef]
  15. Li, Z.; Gu, X.; Wang, L.; Li, D.; Xie, Y.; Li, K.; Dubovik, O.; Schuster, G.; Goloub, P.; Zhang, Y.; et al. Aerosol physical and chemical properties retrieved from ground-based remote sensing measurements during heavy haze days in Beijing winter. Atmos. Chem. Phys. 2013, 13, 10171–10183. [Google Scholar] [CrossRef]
  16. Li, Z.; Li, L.; Zhang, F.; Li, D.; Xie, Y.; Xu, H. Comparison of aerosol properties over Beijing and Kanpur: Optical, physical properties and aerosol component composition retrieved from 12 years ground-based Sun-sky radiometer remote sensing data. J. Geophys. Res. Atmos. 2015, 120, 1520–1535. [Google Scholar] [CrossRef]
  17. Xie, Y.; Li, Z.; Li, L.; Wang, L.; Li, D.; Chen, C.; Li, K.; Xu, H. Study on influence of different mixing rules on the aerosol components retrieval from ground-based remote sensing measurements. Atmos. Res. 2014, 145, 267–278. [Google Scholar] [CrossRef]
  18. Ou, Y.; Li, Z.; Chen, C.; Zhang, Y.; Li, K.; Shi, Z.; Dong, J.; Xu, H.; Peng, Z.; Xie, Y.; et al. Evaluation of MERRA-2 Aerosol Optical and Component Properties over China Using SONET and PARASOL/GRASP Data. Remote Sens. 2022, 14, 821. [Google Scholar] [CrossRef]
  19. Dubovik, O.; Herman, M.; Holdak, A.; Lapyonok, T.; Tanré, D.; Deuzé, J.L.; Ducos, F.; Sinyuk, A.; Lopatin, A. Statistically optimized inversion algorithm for enhanced retrieval of aerosol properties from spectral multi-angle polarimetric satellite observations. Atmos. Meas. Tech. 2011, 4, 975–1018. [Google Scholar] [CrossRef]
  20. Li, L.; Che, H.; Derimian, Y.; Dubovik, O.; Schuster, G.L.; Chen, C.; Li, Q.; Wang, Y.; Guo, B.; Zhang, X. Retrievals of fine mode light-absorbing carbonaceous aerosols from POLDER/PARASOL observations over East and South Asia. Remote Sens. Environ. 2020, 247, 111913. [Google Scholar] [CrossRef]
  21. Li, L.; Che, H.; Zhang, X.; Chen, C.; Chen, X.; Gui, K.; Liang, Y.; Wang, F.; Derimian, Y.; Fuertes, D.; et al. A satellite-measured view of aerosol component content and optical property in a haze-polluted case over North China Plain. Atmos. Res. 2022, 266, 105958. [Google Scholar] [CrossRef]
  22. Ou, Y.; Li, L.; Li, Z.; Zhang, Y.; Dubovik, O.; Derimian, Y.; Chen, C.; Fuertes, D.; Xie, Y.; Lopatin, A.; et al. Spatio-Temporal Variability of Aerosol Components, Their Optical and Microphysical Properties over North China during Winter Haze in 2012, as Derived from POLDER/PARASOL Satellite Observations. Remote Sens. 2021, 13, 2682. [Google Scholar] [CrossRef]
  23. Li, Z.; Li, Z.; Ji, Z.; Xie, Y.; Zhang, Y.; Yang, Z.; Shi, Z.; Qie, L.; Zhang, L.; Zhang, Z.; et al. Improvement of Space-Observation of Aerosol Chemical Composition by Synergizing a Chemical Transport Model and Ground-Based Network Data. Remote Sens. 2024, 16, 4390. [Google Scholar] [CrossRef]
  24. Yang, Z.; Zhang, Y.; Xie, Y.; Xu, H.; Yan, C.; Hu, T.; Li, Z. Inversion of the global carbonaceous aerosol components (CACs) based on ground-based remote sensing of AERONET. Environ. Int. 2025, 198, 109432. [Google Scholar] [CrossRef]
  25. Schuster, G.L.; Lin, B.; Dubovik, O. Remote sensing of aerosol water uptake. Geophys. Res. Lett. 2009, 36. [Google Scholar] [CrossRef]
  26. Holben, B.N.; Eck, T.F.; Slutsker, I.; Tanré, D.; Buis, J.P.; Setzer, A.; Vermote, E.; Reagan, J.A.; Kaufman, Y.J.; Nakajima, T.; et al. AERONET—A Federated Instrument Network and Data Archive for Aerosol Characterization. Remote Sens. Environ. 1998, 66, 1–16. [Google Scholar] [CrossRef]
  27. Dubovik, O.; King, M.D. A flexible inversion algorithm for retrieval of aerosol optical properties from Sun and sky radiance measurements. J. Geophys. Res. Atmos. 2000, 105, 20673–20696. [Google Scholar] [CrossRef]
  28. Dubovik, O.; Holben, B.; Eck, T.F.; Smirnov, A.; Kaufman, Y.J.; King, M.D.; Tanré, D.; Slutsker, I. Variability of Absorption and Optical Properties of Key Aerosol Types Observed in Worldwide Locations. J. Atmos. Sci. 2002, 59, 590–608. Available online: https://journals.ametsoc.org/view/journals/atsc/59/3/1520-0469_2002_059_0590_voaaop_2.0.co_2.xml (accessed on 29 October 2025). [CrossRef]
  29. Dubovik, O.; Smirnov, A.; Holben, B.N.; King, M.D.; Kaufman, Y.J.; Eck, T.F.; Slutsker, I. Accuracy assessments of aerosol optical properties retrieved from Aerosol Robotic Network (AERONET) Sun and sky radiance measurements. J. Geophys. Res. Atmos. 2000, 105, 9791–9806. [Google Scholar] [CrossRef]
  30. Arola, A.; Schuster, G.; Myhre, G.; Kazadzis, S.; Dey, S.; Tripathi, S.N. Inferring absorbing organic carbon content from AERONET data. Atmos. Chem. Phys. 2011, 11, 215–225. [Google Scholar] [CrossRef]
  31. Wang, L.; Li, Z.; Tian, Q.; Ma, Y.; Zhang, F.; Zhang, Y.; Li, D.; Li, K.; Li, L. Estimate of aerosol absorbing components of black carbon, brown carbon, and dust from ground-based remote sensing data of sun-sky radiometers. J. Geophys. Res. Atmos. 2013, 118, 6534–6543. [Google Scholar] [CrossRef]
  32. Lin, J.; Zheng, Y.; Shen, X.; Xing, L.; Che, H. Global Aerosol Classification Based on Aerosol Robotic Network (AERONET) and Satellite Observation. Remote Sens. 2021, 13, 1114. [Google Scholar] [CrossRef]
  33. Zafar, Q.; Zafar, S.; Holben, B. Seasonal assessment and classification of aerosols transported to Lahore using AERONET and MODIS deep blue retrievals. Int. J. Climatol. 2018, 38, 1022–1040. [Google Scholar] [CrossRef]
  34. Zeb, B.; Alam, K.; Khan, R.; Ditta, A.; Iqbal, R.; Elsadek, M.F.; Raza, A.; Elshikh, M.S. Characteristics and optical properties of atmospheric aerosols based on long-term AERONET investigations in an urban environment of Pakistan. Sci. Rep. 2024, 14, 8548. [Google Scholar] [CrossRef]
  35. Li, X.; Zhang, C.; Zhang, B.; Liu, K. A comparative time series analysis and modeling of aerosols in the contiguous United States and China. Sci. Total Env. 2019, 690, 799–811. [Google Scholar] [CrossRef]
  36. Sharma, V.; Ghosh, S.; Bilal, M.; Dey, S.; Singh, S. Performance of MODIS C6.1 Dark Target and Deep Blue aerosol products in Delhi National Capital Region, India: Application for aerosol studies. Atmos. Pollut. Res. 2021, 12, 65–74. [Google Scholar] [CrossRef]
  37. She, L.; Xue, Y.; Guang, J.; Mei, L.; Che, Y.; Li, Y.; Fan, C. Aerosol optical and physical properties over beijing. In Proceedings of the 2017 IEEE International Geoscience and Remote Sensing Symposium (IGARSS), Fort Worth, Texas, USA, 23–28 July 2017; pp. 5962–5965. [Google Scholar]
  38. Bui, T.H.; Nguyen, D.L.; Nguyen, H.H. Study of aerosol optical properties at two urban areas in the north of Vietnam with the implication for biomass burning impacts. Env. Sci. Pollut. Res. Int. 2022, 29, 41923–41940. [Google Scholar] [CrossRef]
  39. Bond, T.C.; Rood, M.J.; Riemer, N. Isolating Weakly and Strongly-Absorbing Classes of Carbonaceous Aerosol: Optical Properties, Abundance and Lifecycle; University of Illinois at Urbana Champaign: Urbana, IL, USA, 2013. [Google Scholar]
  40. Feng, Y.; Ramanathan, V.; Kotamarthi, V.R. Brown carbon: A significant atmospheric absorber of solar radiation? Atmos. Chem. Phys. 2013, 13, 8607–8621. [Google Scholar] [CrossRef]
  41. Osborne, S.R.; Johnson, B.T.; Haywood, J.M.; Baran, A.J.; Harrison, M.A.J.; McConnell, C.L. Physical and optical properties of mineral dust aerosol during the Dust and Biomass-burning Experiment. J. Geophys. Res. Atmos. 2008, 113. [Google Scholar] [CrossRef]
  42. Brocchi, V.; Krysztofiak, G.; Catoire, V.; Guth, J.; Marécal, V.; Zbinden, R.; El Amraoui, L.; Dulac, F.; Ricaud, P. Intercontinental transport of biomass burning pollutants over the Mediterranean Basin during the summer 2014 ChArMEx-GLAM airborne campaign. Atmos. Chem. Phys. 2018, 18, 6887–6906. [Google Scholar] [CrossRef]
  43. San-Miguel-Ayanz, J.; Durrant, T.; Boca, R.; Maianti, P.; Libertà, G.; JACOME, F.O.; Branco, A.; DE, R.; Suarez-Moreno, M.; Ferrari, D. Forest Fires in Europe, Middle East and North Africa 2022; JRC Publications Repository: Brussels, Belgium, 2023. [Google Scholar]
  44. He, C.; Miljevic, B.; Crilley, L.R.; Surawski, N.C.; Bartsch, J.; Salimi, F.; Uhde, E.; Schnelle-Kreis, J.; Orasche, J.; Ristovski, Z.; et al. Characterisation of the impact of open biomass burning on urban air quality in Brisbane, Australia. Environ. Int. 2016, 91, 230–242. [Google Scholar] [CrossRef] [PubMed]
  45. Pandey, A.; Patel, S.; Pervez, S.; Tiwari, S.; Yadama, G.; Chow, J.C.; Watson, J.G.; Biswas, P.; Chakrabarty, R.K. Aerosol emissions factors from traditional biomass cookstoves in India: Insights from field measurements. Atmos. Chem. Phys. 2017, 17, 13721–13729. [Google Scholar] [CrossRef]
  46. Sethi, S.S.; Vinoj, V. Transported dust modulates aerosol pollution domes over rapidly urbanizing Indian cities. Commun. Earth Environ. 2025, 6, 554. [Google Scholar] [CrossRef]
  47. Gao, C.Y.; Bauer, S.E.; Tsigaridis, K.; Im, U. Global Influence of Organic Aerosol Volatility on Aerosol Microphysical Processes: Composition and Number. J. Adv. Model. Earth Syst. 2024, 16, e2023MS004185. [Google Scholar] [CrossRef]
  48. Xie, Y.; Li, Z.; Li, L.; Wagener, R.; Abboud, I.; Li, K.; Li, D.; Zhang, Y.; Chen, X.; Xu, H. Aerosol optical, microphysical, chemical and radiative properties of high aerosol load cases over the Arctic based on AERONET measurements. Sci. Rep. 2018, 8, 9376. [Google Scholar] [CrossRef] [PubMed]
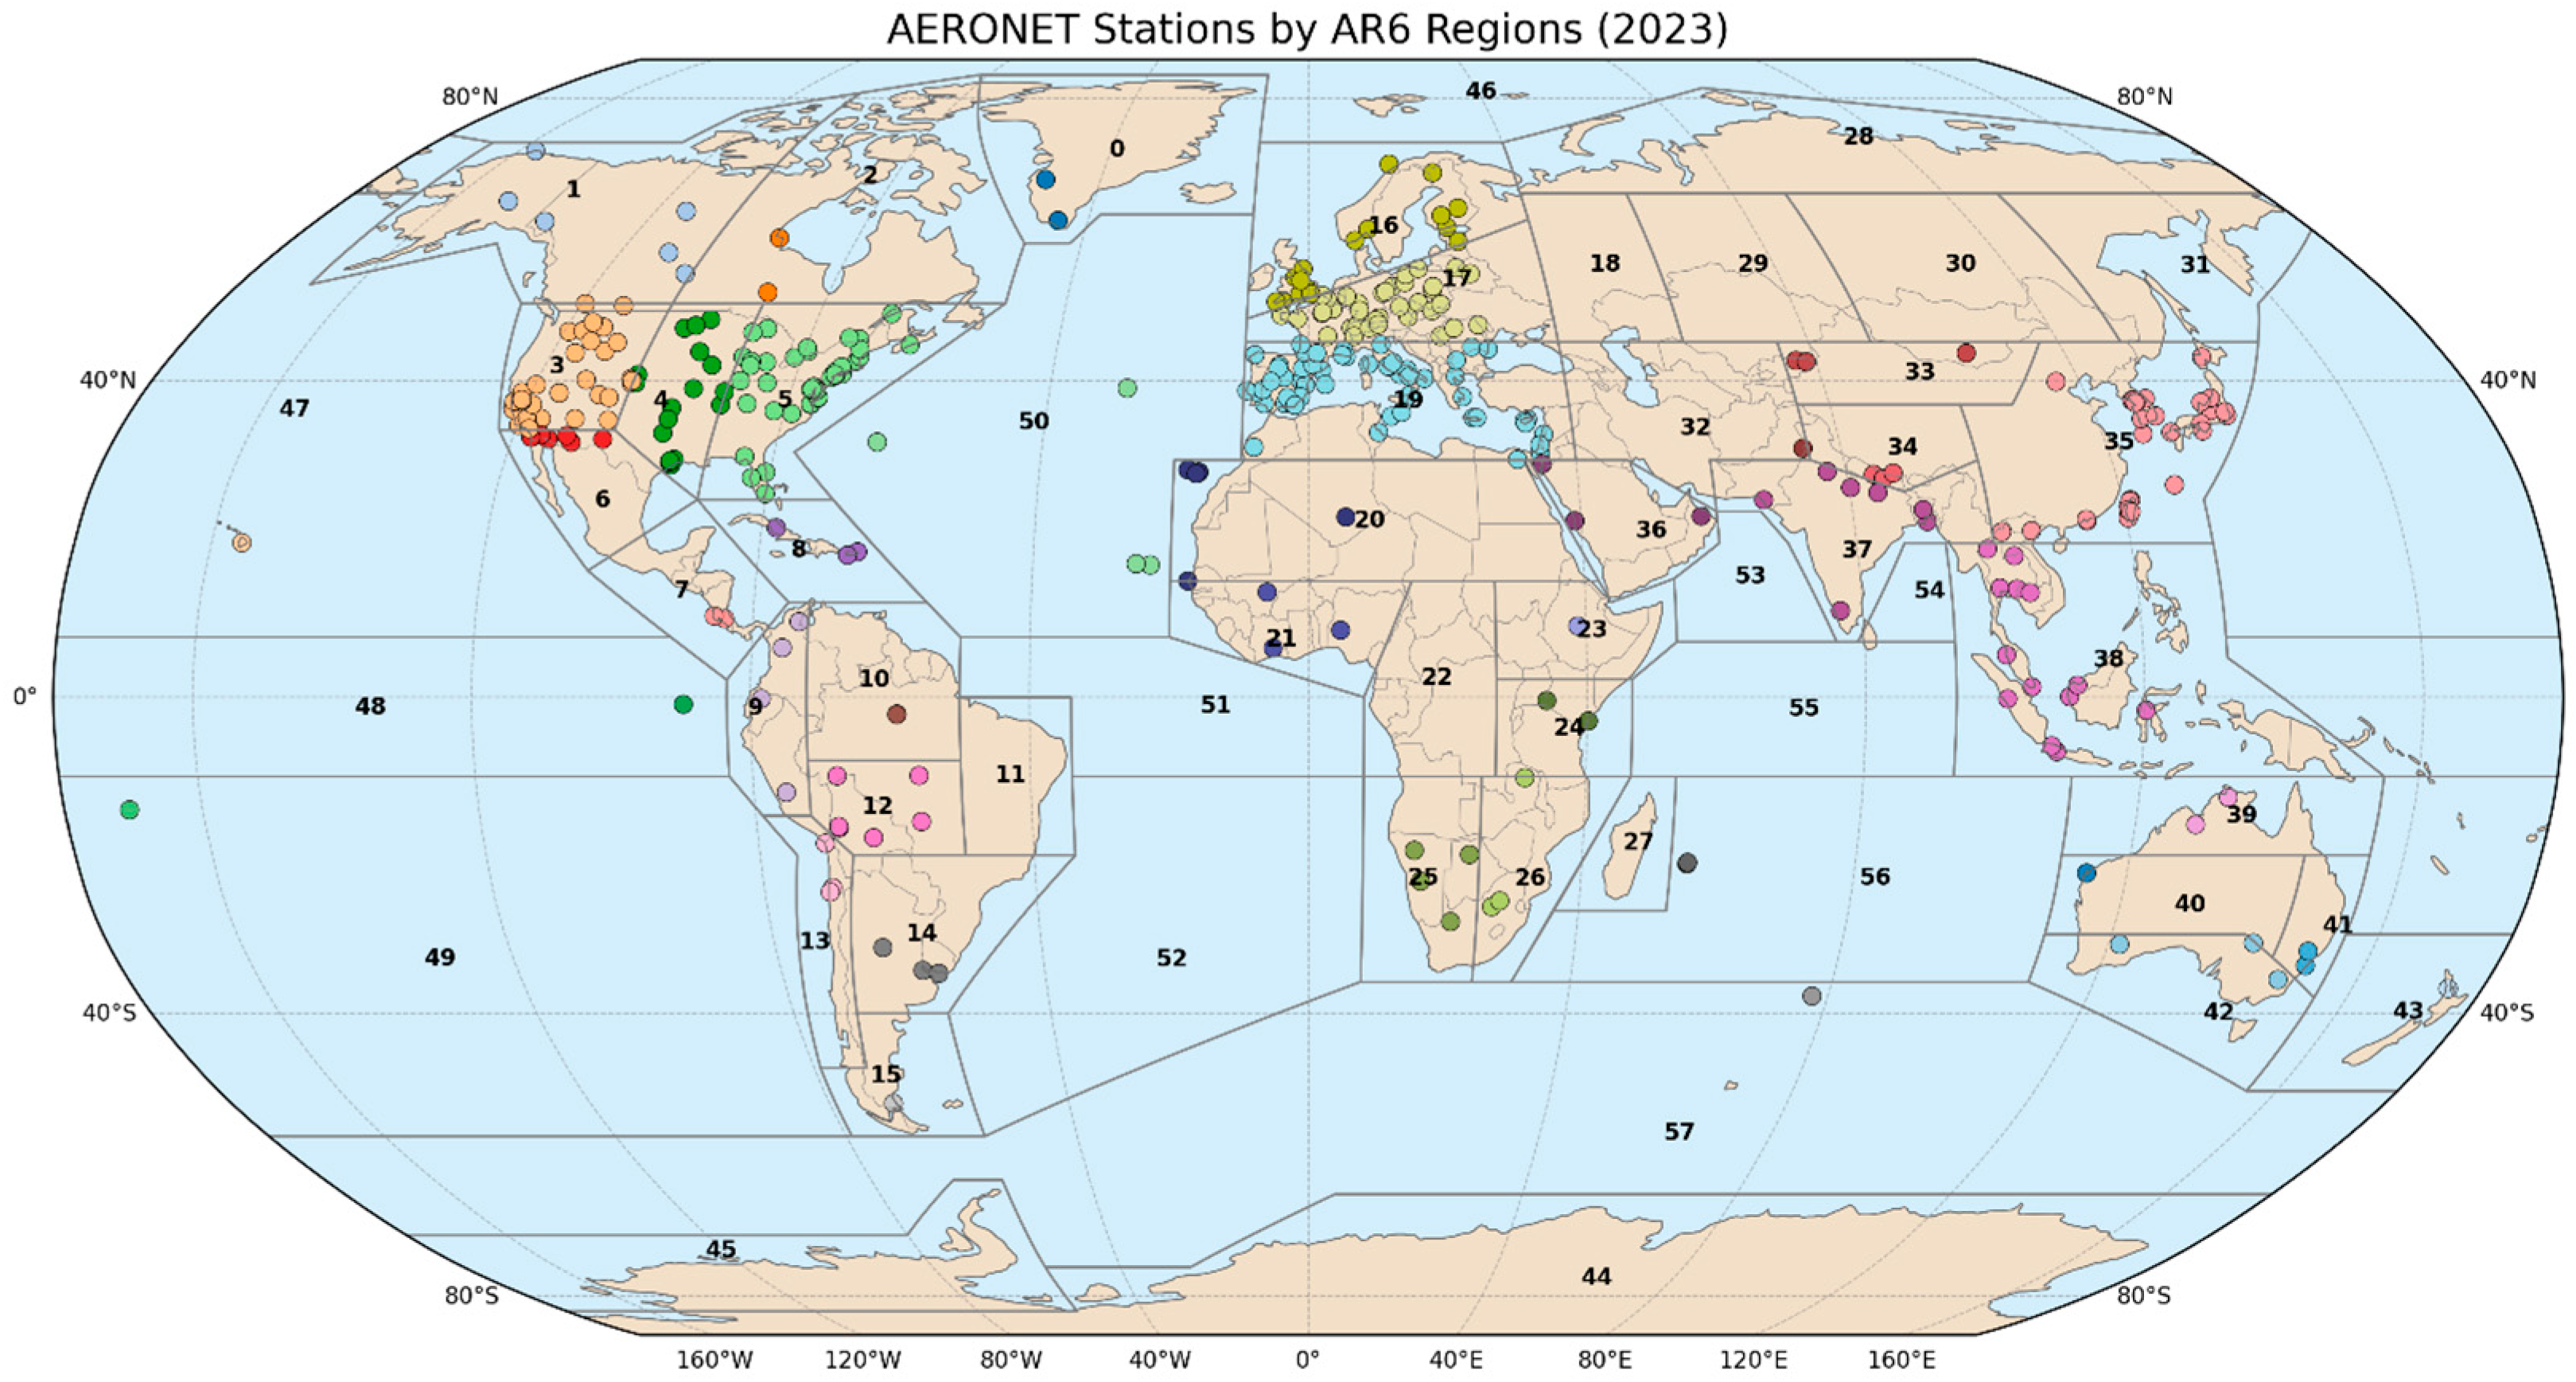
Figure 1. Distribution of AERONET sites in the IPCC AR6 reference regions. Dots represent AERONET sites, and different colors denote different regions. The number in each region is the sequence number of IPCC AR6 reference regions (0: Greenland/Iceland; 1: N.W. North-America; 2: N.E. North-America; 3: W. North-America; 4: C. North-America; 5: E. North-America; 6: N. Central-America; 7: S. Central-America; 8: Caribbean; 9: N.W. South-America; 10: N. South-America; 11: N.E. South-America; 12: South-American-Monsoon; 13: S.W. South-America; 14: S.E. South-America; 15: S. South-America; 16: N. Europe; 17: West & Central-Europe; 18: E. Europe; 19: Mediterranean; 20: Sahara; 21: Western-Africa; 22: Central-Africa; 23: N. Eastern-Africa; 24: S. Eastern-Africa; 25: W. Southern-Africa; 26: E. Southern-Africa; 27: Madagascar; 28: Russian-Arctic; 29: W. Siberia; 30: E. Siberia; 31: Russian-Far-East; 32: W.C. Asia; 33: E.C. Asia; 34: Tibetan-Plateau; 35: E. Asia; 36: Arabian-Peninsula; 37: S. Asia; 38: S.E. Asia; 39: N. Australia; 40: C. Australia; 41: E. Australia; 42: S. Australia; 43: New-Zealand; 44: E. Antarctica; 45: W. Antarctica; 46: Arctic-Ocean; 47: N. Pacific-Ocean; 48: Equatorial. Pacific-Ocean; 49: S. Pacific-Ocean; 50: N. Atlantic-Ocean; 51: Equatorial. Atlantic-Ocean; 52: S. Atlantic-Ocean; 53: Arabian-Sea; 54: Bay-of-Bengal; 55: Equatorial. Indic-Ocean; 56: S. Indic-Ocean; 57: Southern-Ocean).
Remotesensing 17 03624 g001
Figure 2. Characteristic breakdown of aerosol component.
Remotesensing 17 03624 g002
Figure 3. Global distribution of the annual mean aerosol optical properties in 2023 (ae) and their validation with the corresponding AERONET official products (fj). (a,f) Aerosol optical depth (AOD); (b,g) fine-mode AOD (AODf); (c,h) coarse-mode AOD (AODc); (d,i) absorbing aerosol optical depth (AAOD); and (e,j) single scattering albedo (SSA).
Remotesensing 17 03624 g003
Figure 4. Distribution of the statistical errors of AOD, AODf, AODc, AAOD, and SSA for four seasons (MAM, JJA, SON, and DJF). For the five optical parameters, we used 0.4, 0.4, 0.1, 0.05, and 0.85 as thresholds, respectively. We statistically analysed how the discrepancies between our results and AERONET official products varied by season, categorizing the errors as overall (black line), above-threshold (blue line), and below-threshold (red line).
Remotesensing 17 03624 g004
Figure 5. The global distribution of microphysical parameters. (a) Optical and (b) volume fine-mode fractions (FMF, FMFv), (c) the imaginary part of the fine-mode CRI at 440 nm (kf,440), and (d) the difference in the imaginary part of the fine-mode aerosol CRI between 440 nm and 675 nm (δkf,440–675).
Remotesensing 17 03624 g005
Figure 6. Global distribution of annual averages of fine- and coarse-mode aerosol components. The size of the circles in the figure represents the aerosol mass concentrations in fine (a) or coarse (b) mode at that site, while the color and transparency represent the component species and their mass concentrations. It is important to note that the color displayed for each site depends on the highest mass concentration of components relative to its own concentration at all other sites.
Remotesensing 17 03624 g006
Figure 7. (a) The fine-mode and (b) coarse-mode mass ratio of aerosol component concentrations in the IPCC AR6 WGI reference regions. The regions represented by the numbers are consistent with Figure 1.
Remotesensing 17 03624 g007
Figure 8. The relative differences (RDs) of aerosol properties averaged between AGS and ARR approaches. The meanings of the abbreviations are listed in Abbreviations.
Remotesensing 17 03624 g008
Disclaimer/Publisher’s Note: The statements, opinions and data contained in all publications are solely those of the individual author(s) and contributor(s) and not of MDPI and/or the editor(s). MDPI and/or the editor(s) disclaim responsibility for any injury to people or property resulting from any ideas, methods, instructions or products referred to in the content.