Highlights
What are the main findings?
- A novel method using multi-source remote sensing, expert knowledge, and machine learning accurately revealed 151.7 Mha of wetlands in the Amazon region in 2020.
- This study offers a detailed analysis of the protection status of the Amazon wetlands, quantifies the pressures and threats posed by land use and climate change, and provides a baseline for monitoring.
What are the implications of the main findings?
- The Amazon region wetland map can effectively guide national inventories and support science-based decision-making by governments and local communities.
- Expanding protection by creating new Ramsar Sites and conservation areas within the 72 Mha of unprotected wetlands presents a pivotal opportunity.
Abstract
The Amazon wetlands are the largest and most diverse freshwater ecosystem globally, characterized by various flooded vegetation and the Amazon River’s estuary. This critical ecosystem is vulnerable to land use changes, dam construction, mining, and climate change. While several studies have utilized remote sensing to map wetlands in this region, significant uncertainty remains, which limits the assessment of impacts and the conservation priorities for Amazon wetlands. This study aims to enhance wetland mapping by integrating existing maps, remote sensing data, expert knowledge, and cloud computing via Earth Engine. We developed a harmonized regional wetland classification system adaptable to individual countries, enabling us to train and build a random forest model to classify wetlands using a robust remote sensing dataset. In 2020, wetlands spanned 151.7 million hectares (Mha) or 22.0% of the study area, plus an additional 7.4 Mha in deforested zones. The four dominant wetland classes accounted for 98.5% of the total area: Forest Floodplain (89.0 Mha; 58.6%), Lowland Herbaceous Floodplain (29.6 Mha; 19.6%), Shrub Floodplain (16.7 Mha; 11.0%), and Open Water (14.1 Mha; 9.3%). The overall mapping accuracy was 82.2%. Of the total wetlands in 2020, 52.6% (i.e., 79.8 Mha) were protected in Indigenous Territories, Conservation Units, and Ramsar Sites. Threats to the mapped wetlands included 7.4 Mha of loss due to fires and deforestation, with an additional 800,000 ha lost from 2021 to 2024 due to agriculture, urban expansion, and gold mining. Notably, 21 Mha of wetlands were directly affected by both reduced precipitation and surface water in 2020. Our mapping efforts will help identify priorities for wetland protection and support informed decision-making by local governments and ancestral communities to implement conservation and management plans. As 47.4% of the mapped wetlands are unprotected and have some level of threats and pressure, there are also opportunities to expand protected areas and implement effective management and conservation practices.
1. Introduction
Amazon wetlands support rich fisheries and provide essential ecosystem services, including food, water, carbon storage, and biodiversity [1,2,3], habitat for migratory species [4], among other resources. The Amazon wetlands are considered the world’s most extensive and diverse freshwater ecosystem, with a biodiversity-rich flooded flora [2,5], lake and river floodplains, flooded forests, floating herbaceous ecosystems, and the freshwater estuary of the Amazon River. They are estimated to hold 16–18% of the world’s freshwater, contributing 20% of global freshwater discharge [3]. This ecosystem and its natural resources are highly vulnerable due to, for example, land use, damming, infrastructure, mining, and climate change [6,7,8]. Therefore, mapping and monitoring Amazonia wetlands’ threats are imperative for conservation and management, climate change mitigation, and adaptation policies. Additionally, accurate mapping and monitoring are essential for effective conservation, planning and ensuring watershed-scale resilience against floods and droughts [9].
Several research initiatives have mapped the Amazon wetlands using various remotely sensed data and mapping methods (e.g., [10,11,12]). These mapping efforts have covered different portions of the Amazon Basin over different years. When comparing the existing maps, some wetland classes have differences in coverage. For instance, the estimation of lowland wetland extent varies from 14% [7] to 30% when including flooded forests, rivers, lakes, and other wetlands [13]. Yet only a few Amazonian countries have comprehensive wetland inventories, maps, and classification systems, which inhibit conservation and wetland management policies [13].
Global wetland datasets exist to prioritize wetlands for conservation [14], assess their area extension and loss and status [15,16], and monitor wetland trends [17]. However, due to their coarse spatial resolution (around 1 km pixel size), the existing global datasets are limited to supporting the implementation of conservation and management policies for wetlands at the regional and country levels. Identifying and defining wetland classes are also essential, given the diversity of socio-cultural and economic perspectives, and for improving mapping efforts. In this respect, flooding is a primary indicator used by hydrologists, whereas botanists emphasize flora, and soil scientists focus on soil characteristics [18,19,20], making the classification of wetlands challenging. The lack of a robust classification scheme and imprecise mapping creates a knowledge gap that partially contributes to the inaction regarding global wetland loss [21].
There is still no general agreement on the definition of wetlands across all the Amazonian countries (e.g., [19,22]), except for Brazil and Colombia. Nevertheless, there is a consensus that land covered by water and saturated soil (or water table near the surface) are key factors that define wetlands [23], and that remote sensing has the potential to improve the mapping of wetlands. For instance, it enhances wetland monitoring and management across landscapes by generating baseline datasets applicable to national and regional wetland policies [24]. Unsurprisingly, there are vast methodologies to detect, map, and monitor wetlands. As a result, more mapping consistency must be achieved [25]. On the other hand, there are also technical challenges dealing with the wetland complexity posed by the interchange of water, soils, vegetation, and water dynamics daily and throughout the year. Detecting inundation in densely forested wetlands is also a difficult task, particularly under tree canopies. Conventional optical remote sensing methods, like Landsat, struggle with under-canopy water detection and high cloud cover persistence [26]. Wetlands also share similar spectral characteristics, complicating differentiation between types using standard imaging techniques [27]. For optical data (i.e., Landsat and Sentinel-2), spectral mixture analysis has been proposed to overcome challenges in complex environments with soil, vegetation, and water mixing [28,29].
Another critical challenge is the significant variability in inundation patterns driven by seasonal rainfall and ecological factors. In the Amazon region, the distinct wet and dry seasons cause substantial fluctuations in water levels, which complicate mapping efforts [30]. Consequently, wetland boundaries shift regularly, necessitating frequent remote sensing data to ensure accurate mapping. Moreover, the persistent lack of timely and large-scale training samples directly undermines the progress of wetland mapping research [30]. Finally, data accessibility and integration present challenges. Many mapping efforts described above rely on a disparate collection of datasets that can be inconsistent or incompatible across different spatial resolutions and temporal scales. Access to computing resources, such as Google Earth Engine, capable of processing high volumes of data, can help overcome this challenge, particularly in the Amazon region with limited cloud computing infrastructure [31].
This study aims to enhance wetland mapping by utilizing existing wetland maps and integrating diverse remote sensing datasets, expert knowledge, and cloud computing through Earth Engine. Our objectives are threefold. First, we seek to develop a method to improve the mapping of wetlands in the Amazon region by merging existing maps with optical and synthetic aperture radar (SAR) remote sensing data, surface water dynamics datasets, and a digital elevation model (DEM). Second, we will evaluate the gaps in wetland protection across the Pan-Amazonia region and identify priority areas for conservation. Finally, we intend to quantify the impacts of climate change, land use change, mining, and infrastructure on wetlands through geospatial analysis. Ultimately, our goal is to provide standardized maps of Amazon wetlands and a classification system that will inform national inventories and facilitate effective management and conservation policies.
2. Materials and Methods
2.1. Study Area
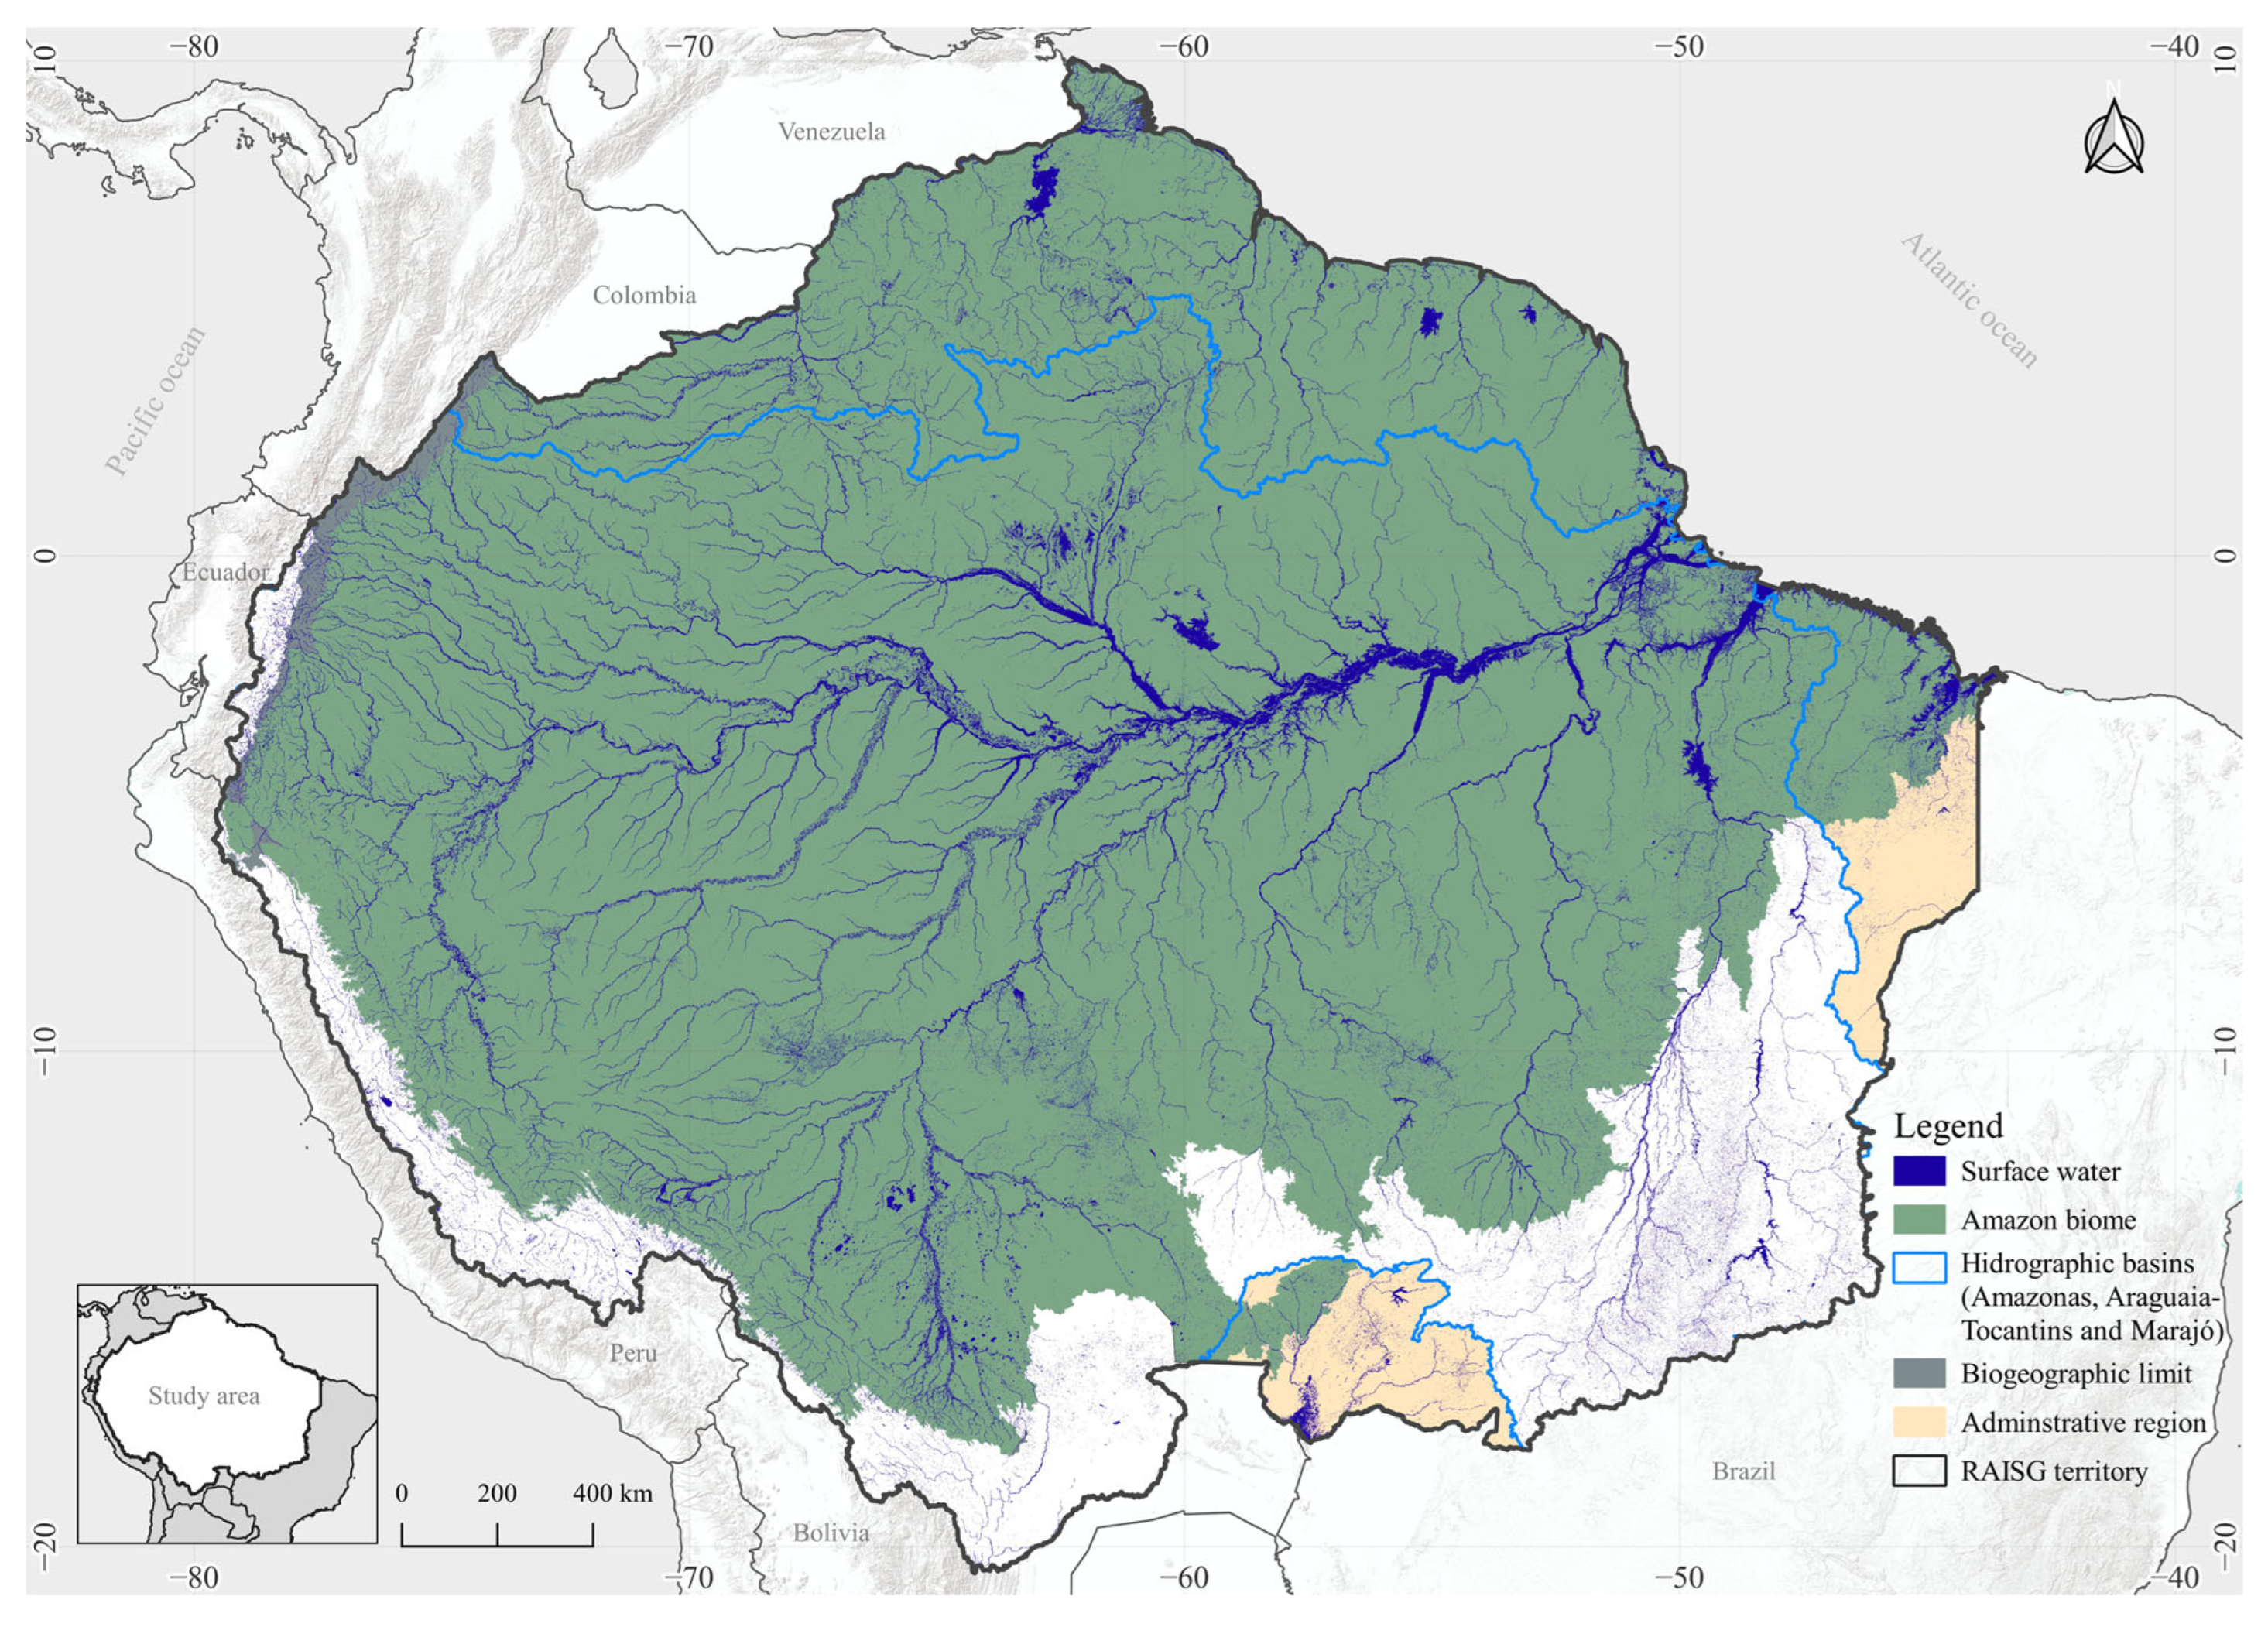
This study focuses on the Amazon and Orinoco Basins, encompassing the interconnectedness of the Amazon and Orinoco rivers and their hydrological and biogeographical characteristics [32], as well as administrative areas to delineate the boundaries of these intricate ecosystems in a policy implementation context (Figure 1). It encloses parts of nine countries: Bolivia, Brazil, Colombia, Ecuador, French Guiana, Guyana, Peru, Suriname, and Venezuela. This region boundary covers 8.5 million km2, including the tropical rainforests and the shrub and herbaceous ecosystems, many of which are exclusive (i.e., endemic) and relevant to identifying and mapping wetlands in this region [33]. It also safeguards the region’s biodiversity and ecosystem services, preserving its crucial role in maintaining the continent’s climatic stability. The integrity of the wetlands within this boundary is also vital to the Amazonian indigenous and traditional people for their food safety, ritual ceremonies, and welfare [34]. The only exception to the study area delineation is in Brazil, which includes a political boundary of the country’s legal Amazon decree [35], encompassing portions of the Pantanal biome in the southwest and the Northeast Atlantic Basin (Figure 1). Hereafter, our study area will be referred to as the Amazon region.
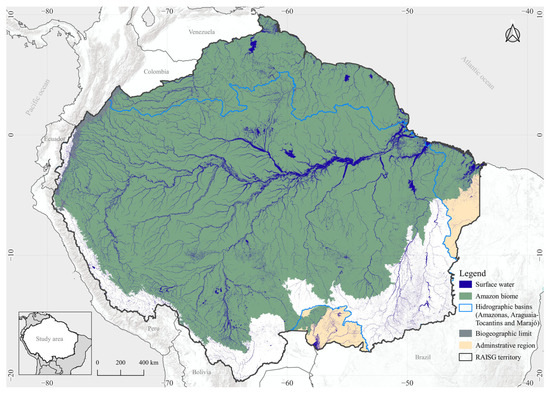
Figure 1.
The Amazon region for mapping wetlands, which encompasses the hydrological and biogeographic attributes of the Amazon and Orinoco Basins and administrative boundaries.
2.2. Wetland Maps and Classes
We initially selected 20 global and regional (i.e., covering at least 60% of the study area) wetland and land cover maps with wetland classes. Then, we applied three criteria to define the final maps () for selecting training, calibration, and test samples to run the wetland random forest (RF) classification algorithm (Table 1). First, the mapping methodology must be peer-reviewed and published in the scientific literature. Second, the digital map must be accessible and available for analysis. Last, the map’s spatial resolution must be less than or equal to 100 m to guarantee sufficient detail to build the samples for the classification stage, with specific wetland and water classes.

Table 1.
Wetland dataset used to build training, validation, and test samples. OA, UP, and PA denote overall accuracy, users’ accuracy, and producers’ accuracy, respectively, reported in references of these datasets.
We defined two broad categories of wetlands: Coastal and Inland. The coastal wetland classes were Tidal Flat (1), Salt Marsh (2), and Mangrove (3). The inland classes included Glacier (4), Open Water (5), Lowland Herbaceous Floodplain [<2600 masl (6)], Highland Herbaceous Floodplain [>2600 masl (7)], Shrub floodplain (8), and Forest Floodplain (9) (Table 2). The first step in harmonizing the wetland dataset presented in Table 1 was to assess the definition of the wetland classes applied to each map. Next, we compared the class definitions among the maps and matched them to harmonize the classification schemes (Table 2). We also performed spatial analysis to compare the wetland classes of each map. For example, two distinct wetland classes could have agreed spatially but had similar names and definitions (e.g., in the harmonization of the Shrub Floodplain class, we combined the Flooded Shrub class from the Amazon Wetland LBA map with Stable Tree Cover areas up to 5 m in height from the GLAD map). In this case, we lumped them into one class and assigned a class definition. We have also added classes that occurred only in a few maps (e.g., Salt Marsh and Glacier). Finally, we eliminated polygons that showed class spatial and definition disagreement that could not be harmonized. This harmonization of the wetland classes of the map dataset (Table 1) also allowed us to create a digital map of the wetland classes (Table 2; Figure S1 in File S1) for selecting random samples to build the training, calibration, and test datasets for generating the new wetland map, using 2020 as baseline (i.e., the year that most existing global and regional maps converge). With this process, we randomly selected over one-million-pixel samples within class regions and split them into classification (60%) and test (40%) samples. The sampling methodology described above was fully automated and based on a global sampling strategy for mapping wetlands [39] (Figure S1 in File S2).

Table 2.
Wetland classification and definition of the selected maps for harmonization.
2.3. Wetland Classification
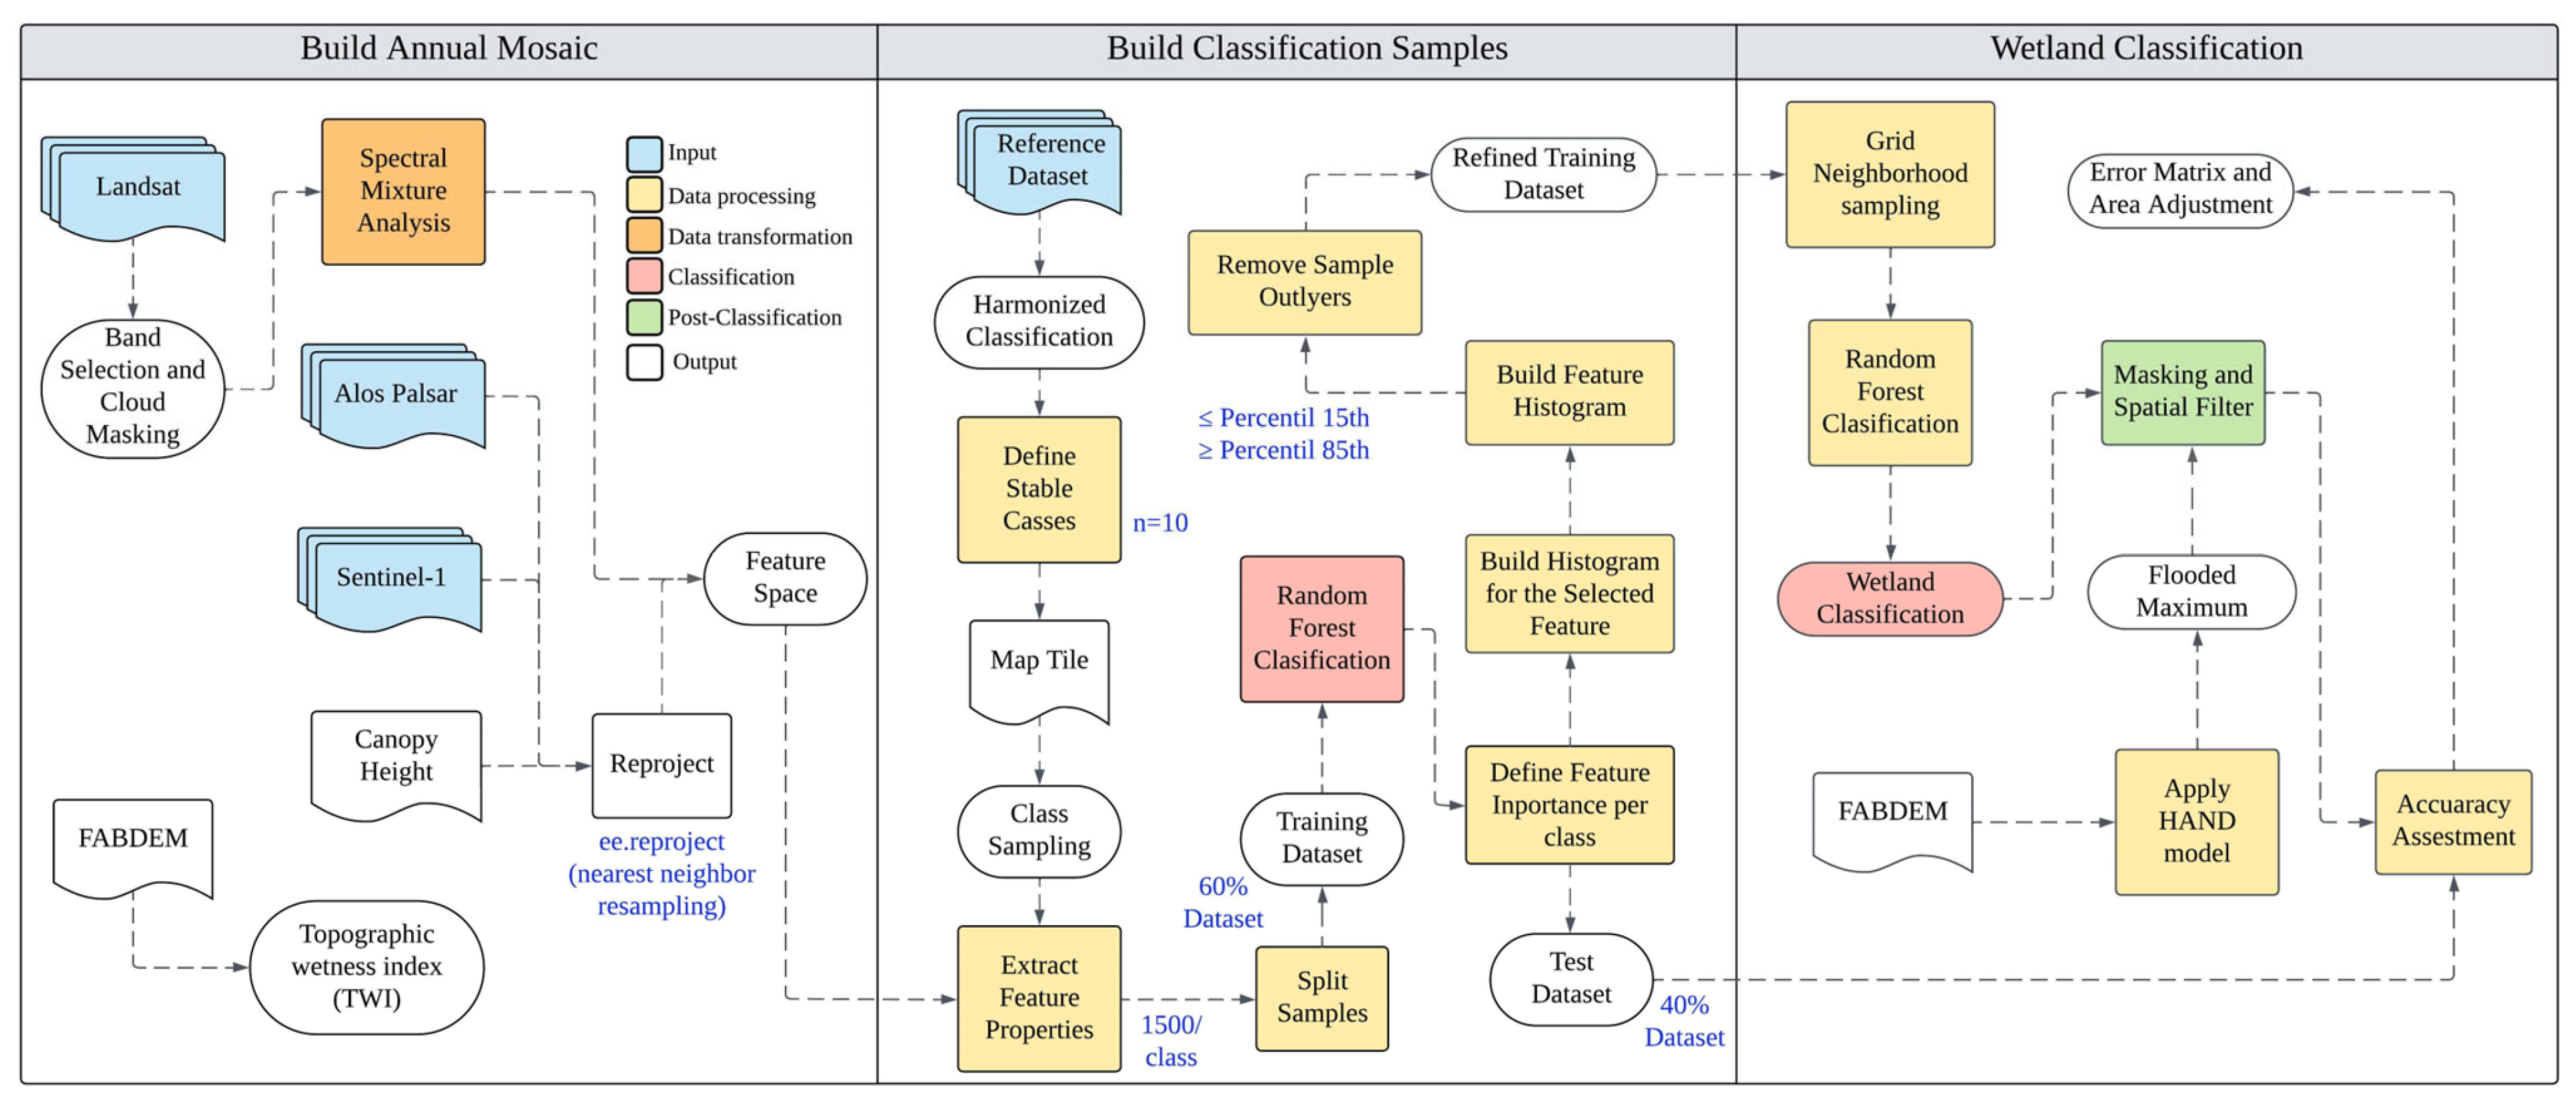
The classification method followed three main steps (Figure 2). Firstly, we used multi-sourced remote sensing data acquired in 2020, the baseline year for mapping, when most of the wetland map datasets converged (Table 1). We have acquired all Landsat scenes (n = 20,584) covering the study area with ≤50% of cloud cover. Next, we divided the study area into map sheets of ~3° longitude by ~2° latitude to generate the input dataset for the RF classification. For that, we statistically reduced the Landsat and Sentinel-1 scenes into median, 15th, and 85th percentiles to capture the wetland intra-annual water dynamics.
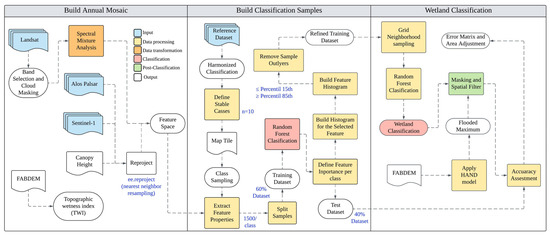
Figure 2.
Image classification workflow for mapping wetlands in study area.
We used these statistically reduced images to estimate the abundance of Green Vegetation (GV), Soil, Non-Photosynthetic Vegetation (NPV), Shade, and Cloud, applying spectral mixture analysis (SMA) with Landsat bands 1–5 and 7. SMA has been considered a valuable technique for mapping wetlands, particularly when using Landsat data, due to the compositional mixing of soil, vegetation, and water in wetland environments [28,47]. Details about the SMA algorithm can be found in [28].
We also added other data types to the map sheets (Figure 2; Table 1 and File S2). For the ALOS-PALSAR, we used only the yearly mosaic (version 2) available in Google Earth Engine for 2020 [48]. Combining SAR (i.e., Sentinel-1 and ALOS-PALSAR) with optical (i.e., Landsat) imagery has the potential to strengthen wetland mapping by acquiring ground observations through clouds. It also complements the compositional information obtained with SMA by providing structural vegetation insights [49]. Finally, we used the Forest And Buildings removed Copernicus 30m DEM [50] (FABDEM) to calculate the Topographic Wetland Index (TWI) [51], and the Global Canopy Height (GCH) dataset [52]. The FABDEM digital elevation model and TWI provide topography and hydrology conditions suitable for mapping wetlands, and the GCH adds information about wetland vegetation structure [53]. Finally, we resampled the datasets with spatial resolutions of 30 m to match the Landsat pixel size using Earth Engine’s reproject method, which applies the nearest neighborhood resampling algorithm by default. Detailed information about these input datasets is available in File S3.
Wetland classification was performed for each map sheet grid (Figure 2). Training and calibration samples of the selected and neighbor tiles, as well as the annual mosaic datasets, were used as inputs in the RF classifier. The RF ran with 100 trees and the number of variables considered at each decision node set to the square root of the total number of input variables. We set the random forest parameters based empirically to optimize the classification results and time to process the classification task in Earth Engine. The minimum number of samples required to split a node was set to one; and the fraction of the training data used to build each tree was set to 0.632. The maximum number of nodes per tree was left unrestricted.
The RF output was the first version of the wetland classification, which underwent filtering and masking procedures. The spatial filter removes salt-and-pepper misclassification noise by applying a majority-neighborhood logic to replace groups of classified pixels with the predominant wetland class [54]. Spatial filtering was applied to groups of 1 to 11 pixels (i.e., ~0.99 ha), which is the minimum mapping unit of the wetland map. Next, we applied the Height Above the Nearest Drainage (HAND) model [55] to the FABDEM data to extract the maximum inundation height (MIH) from the spatially filtered wetland map and masked out the wetland classes outside this range. Finally, we conducted accuracy assessment analysis using the test sample dataset following the good-practice statistical model [56] [details in File S4].
2.4. Wetland Protection and Impacts
We performed a series of spatial analyses to estimate the levels of protection and threats and pressures to the wetlands in the study area. For that, we overlapped the new wetland map with maps of protected areas and Ramsar Sites to estimate the extent of protected and unprotected wetlands. Then, we assessed anthropogenic and climate change threats and pressure (i.e., extreme droughts and flooding). The anthropogenic threats (i.e., the direct impacts) included fires, deforestation, mining, artificial water bodies, urban areas, and roads. For the climate-related threats, we used the surface water dynamic time-series of the MapBiomas Water initiative, which estimates the monthly surface water extent [28] to estimate the monthly surface water extent, and the Climate Hazards Center InfraRed Precipitation with Station (CHIRPS) data available in Google Earth Engine [57]. We applied the Mann–Kendall’s test to conduct a trend analysis of surface water dynamics and rainfall. The temporal analyses allowed us to identify areas undergoing loss and gain in surface water and precipitation relative to the wetland areas mapped, allowing us to point out the areas experiencing extreme drought and flooding.
3. Results
3.1. Wetland Mapping
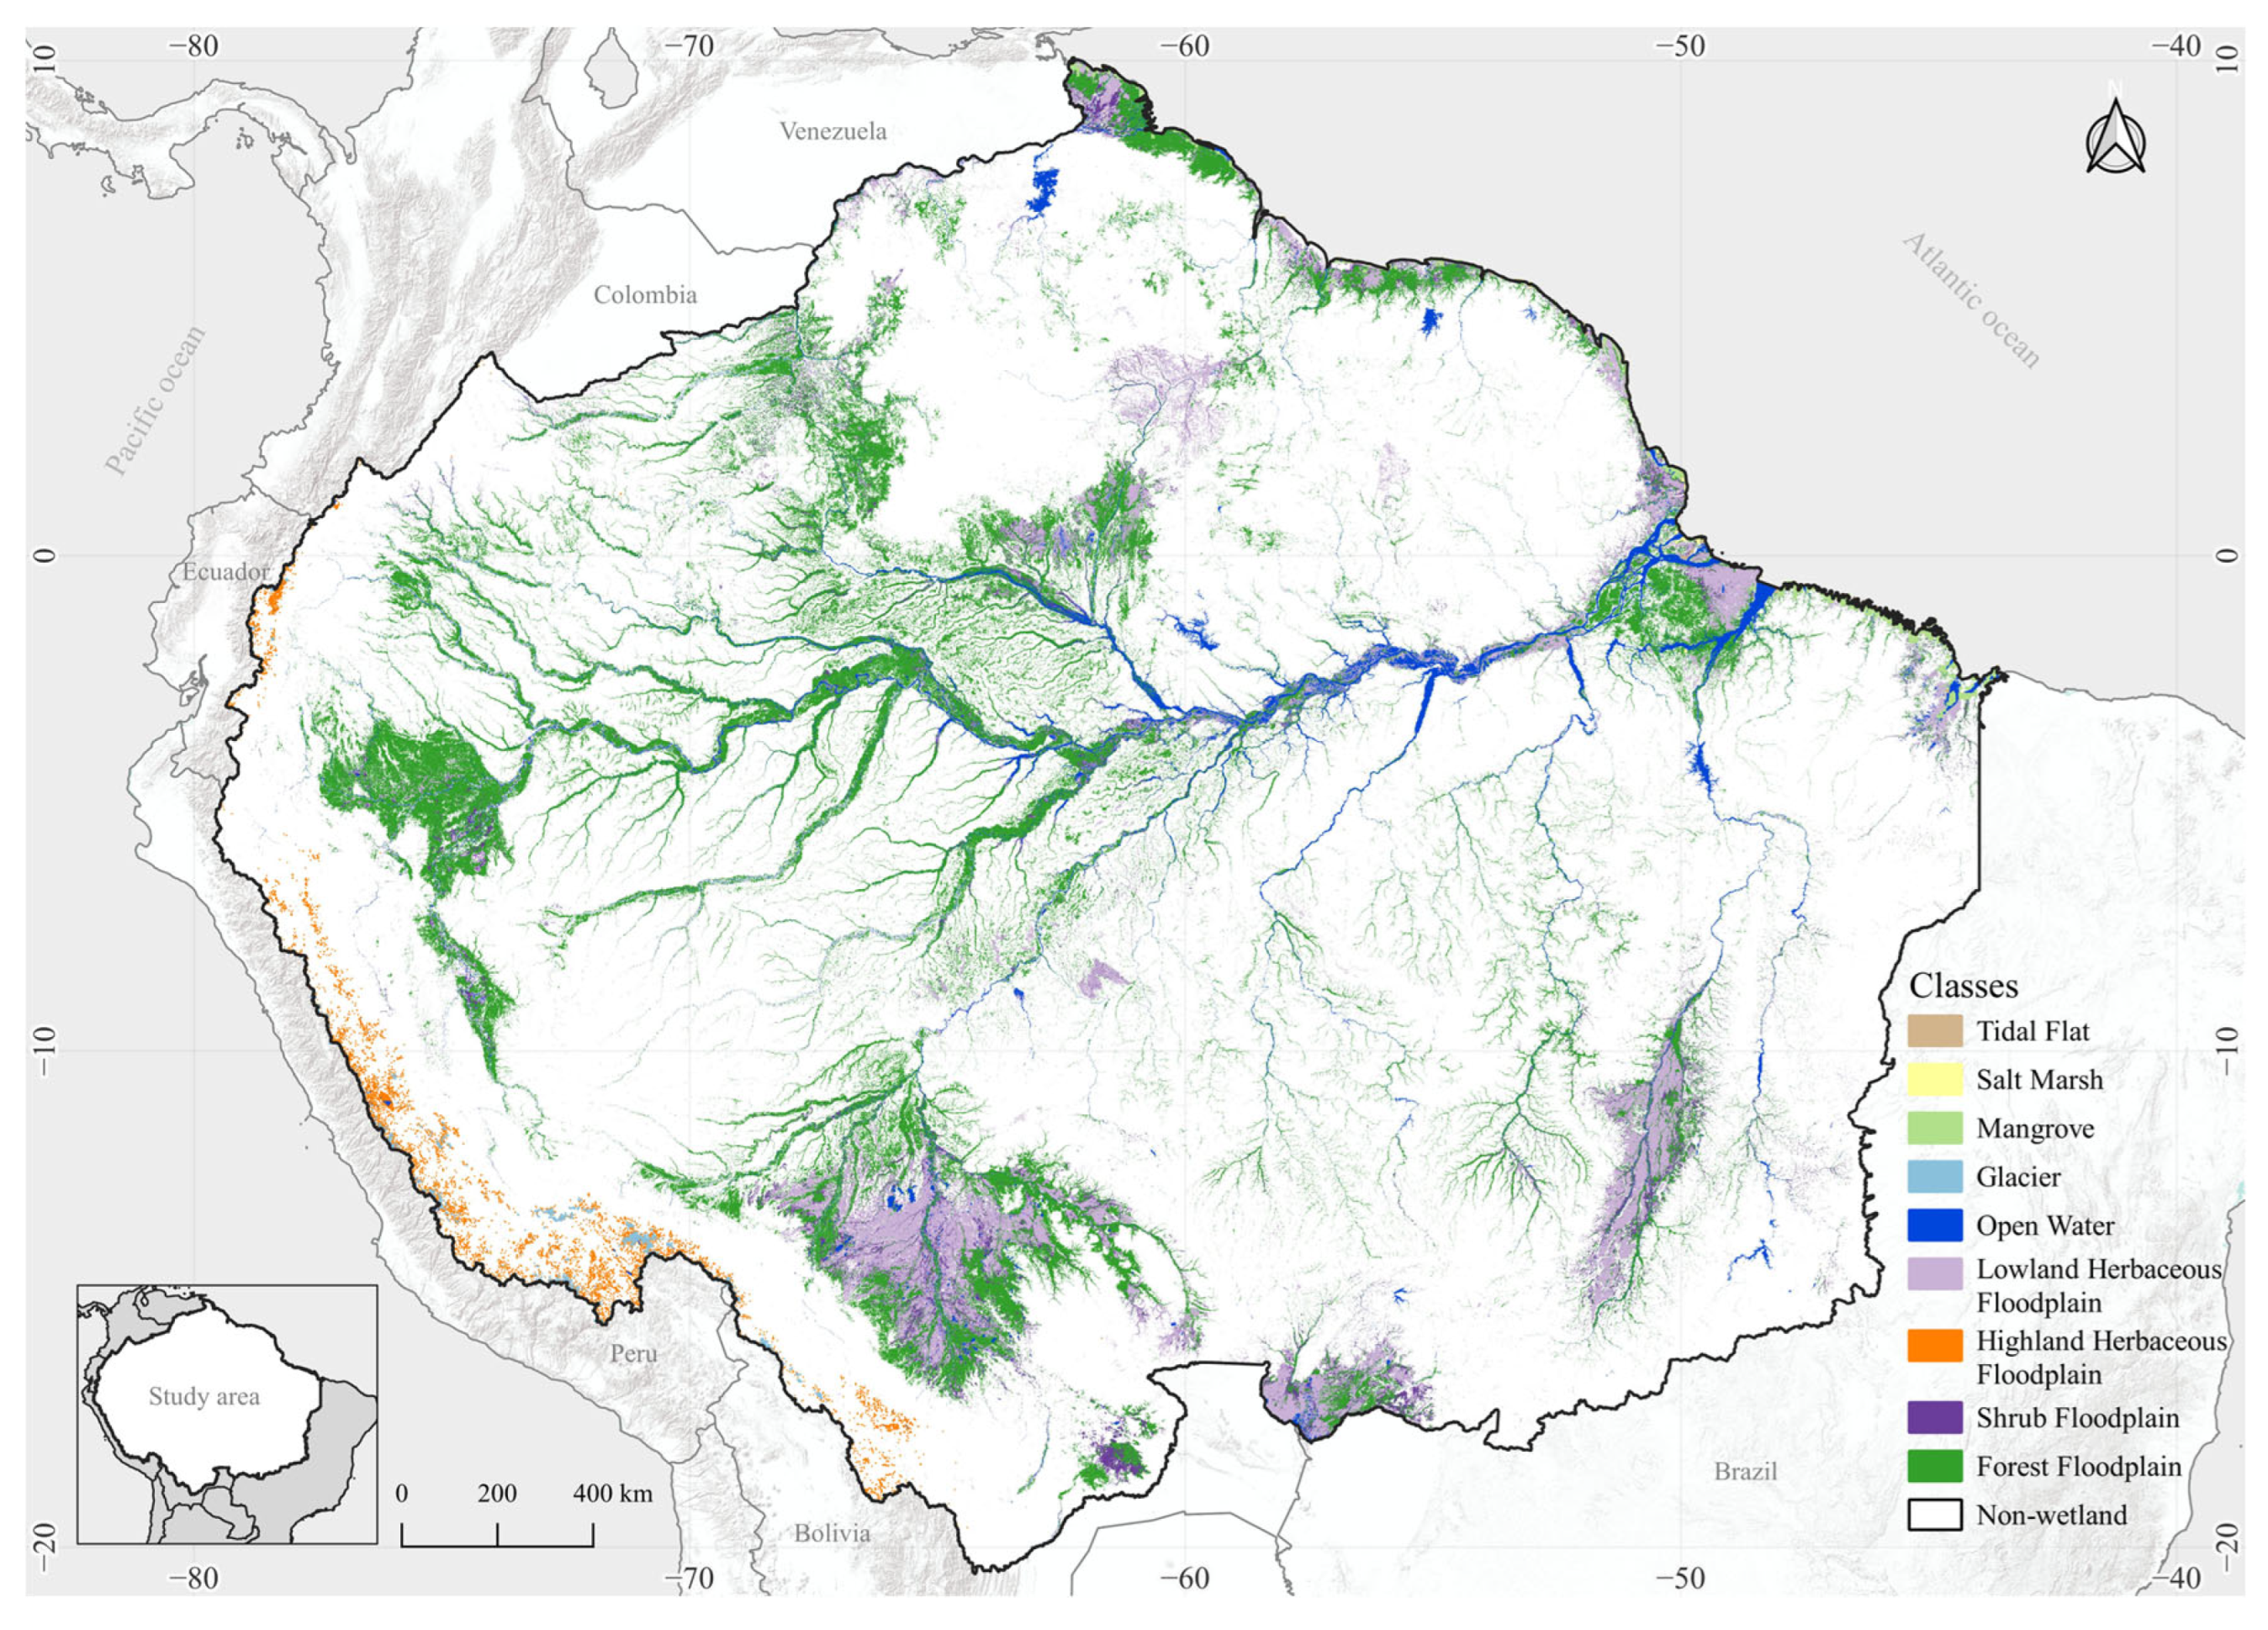
The wetland extent mapped in 2020 reached 151.7 Mha, encompassing 22.0% of the study area (Figure 3), with an additional 7.4 Mha already in deforested areas turning into land use classes (e.g., pasture, agriculture, urban mining, and infrastructure). Four wetland classes predominate, covering 98.5% of the wetlands, which included Forest Floodplain (89.0 Mha; 58.6%), the most predominant, almost two-fold the following class, Lowland Herbaceous Floodplain (29.6 Mha; 19.5%); and with less extent Shrub Floodplain (16.7 Mha; 11.0%), Open Water (14.1 Mha; 9.3%). These dominant classes represent inland wetlands. Along the coastal zone, the Mangrove class was the one with the most extent, reaching 1.4 Mha (0.9% of the total and 82% of the coastal wetlands), followed by Tidal Flat (0.2 Mha) and Salt Marsh (0.1 Mha). The Glacier class cover (0.2 Mha) and Highland Herbaceous Floodplain (0.1 Mha) are interconnected classes with their occurrence concentrating along the Andes. Non-wetland areas covered 692 Mha, of which 27.7% (i.e., 192 Mha) are potentially inundated areas (Figure 3).
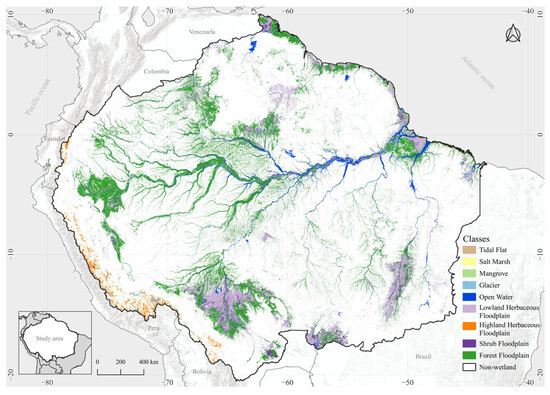
Figure 3.
Amazonian Wetland classification resulting from the random forest classifier for the harmonization of 11 global and regional datasets.
We calculated the mapping accuracy using the area-adjusted method based on the error matrix statistics of all classes [56] (File S4). The overall mapping accuracy, including both wetland and non-wetland classes, was 82.2% for the study area. When inspecting the mapping sheet tiles, the mean accuracy reached 83%, with a median of 82% and a first quartile (Q1) of 79%, implying that more than 75% of the mapping sheet tiles had an accuracy above this value (File S4).
Not surprisingly, the Non-Wetland class had the highest producers’ accuracy (84.1%), meaning an omission error of 15.9%. The users’ accuracy for the Non-Wetland class reached 81.4%, indicating that 18.6% Non-Wetland on the map may be a wetland class. This can be explained by the large extent of the potentially inundated area that lies within this class.
We also estimated the producers’ and users’ accuracies for all classes. Here, we report the users’ accuracy, as it is more relevant for map users (see the details in Table S4 in File S4). Glacier and Open Water had the highest users’ accuracy (i.e., 99.3% and 98.5%, respectively; similar to the GSW estimate for Open Water; Table 1), followed by the Highland Herbaceous (95.1%) and Lowland Herbaceous (82.9%). Forest Floodplain, the predominant class, had a users’ accuracy of 73.8%, followed by Lowland Herbaceous and Shrub Floodplain at 82.9% and 71.2%, respectively. The coastal zone wetland classes’ users’ accuracy varied from 83.1% to 89.5% for Tidal Flat and Mangrove 89.5%. The Salt Marsh users’ accuracy was 87.8% (Table S4 in File S4).
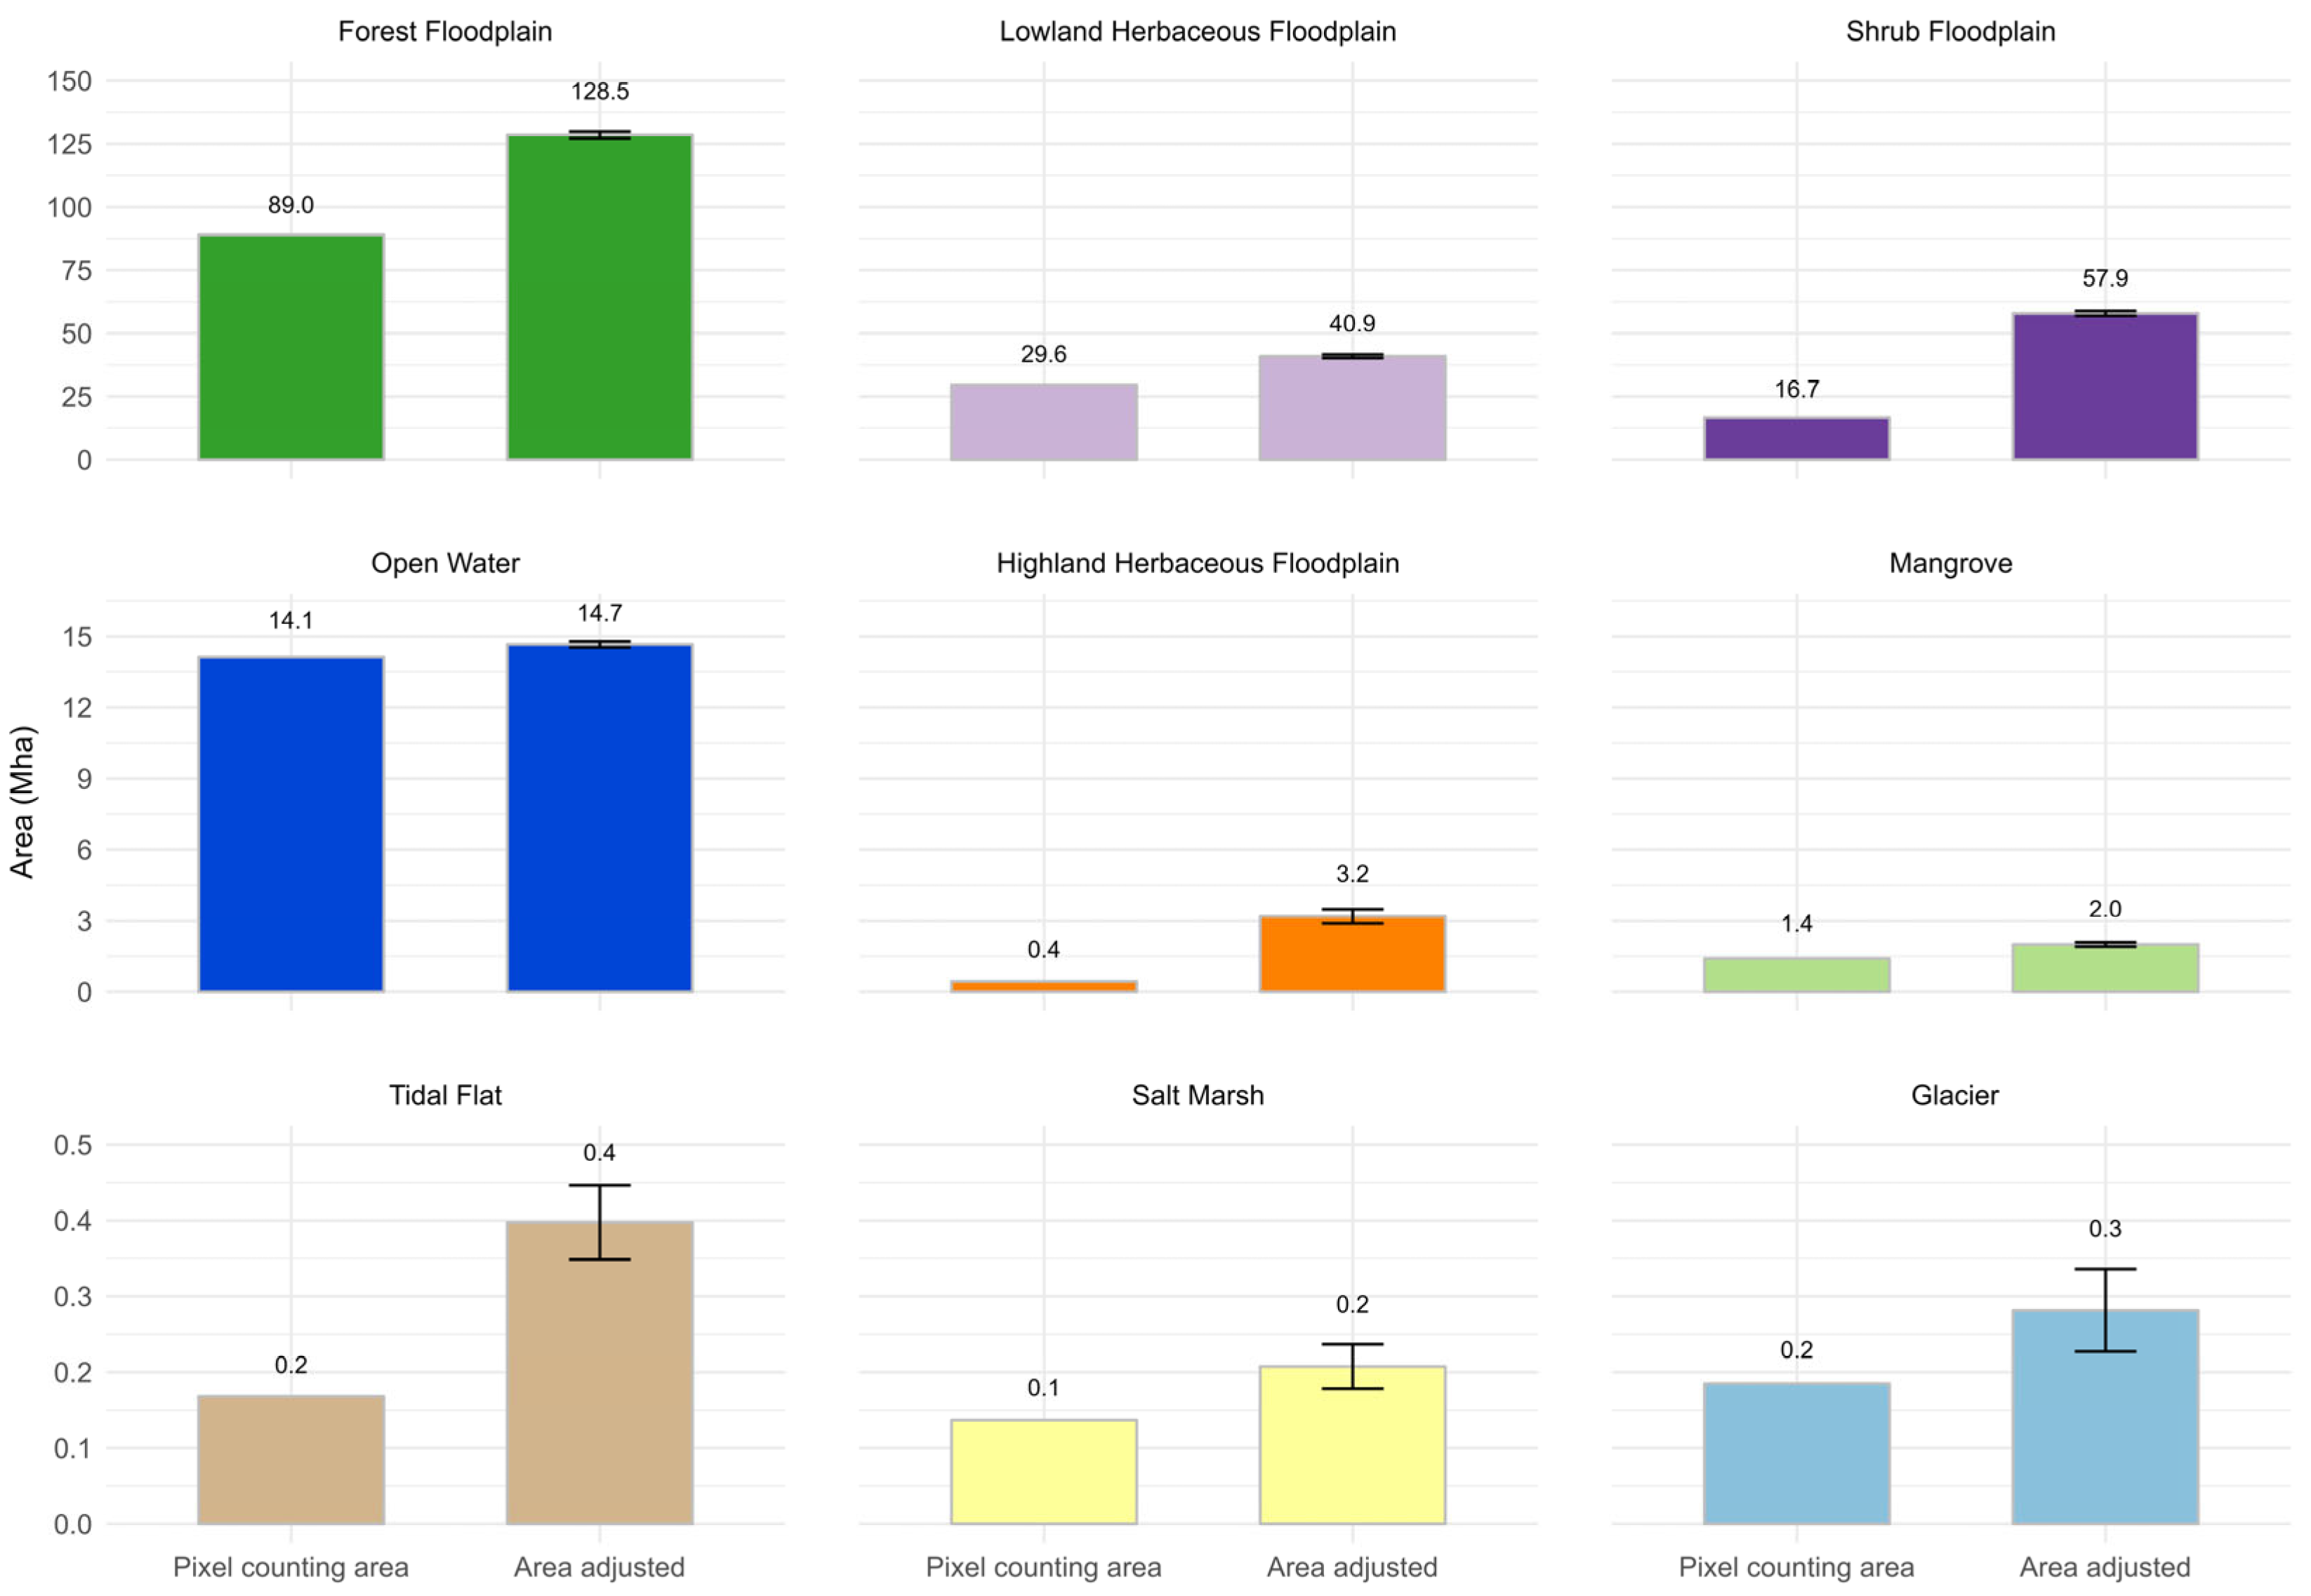
The producers’ and users’ accuracy metrics can be used to assess the area estimation error of the classification results [56]. We assessed how pixel counting and area-adjusted area estimations varied in the classification results (Figure 4). The results showed that the majority of the wetland classes are under-mapped, implying that our classification results are conservative. For instance, the area-adjusted estimate for the Forest Floodplain class might be 44% larger compared to the pixel count area estimate, and for the Lowland Floodplain, the difference was 38% (Figure 4). The Shrub Floodplain class was potentially under-mapped by a factor of 3.5. Open Water showed the least difference in the area estimation approaches (i.e., 4%). We will discuss later what could explain why the wetland mapping results are conservative and the implications for using this information in policy decision-making.
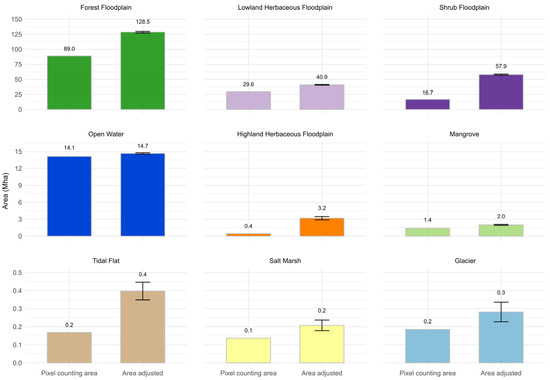
Figure 4.
Area estimation of wetland classes based on pixel counting and area-adjusted using accuracy assessment metrics. The error bars depict the uncertainty of the area-adjusted estimate at a 95% confidence interval.
3.2. Protected Wetlands
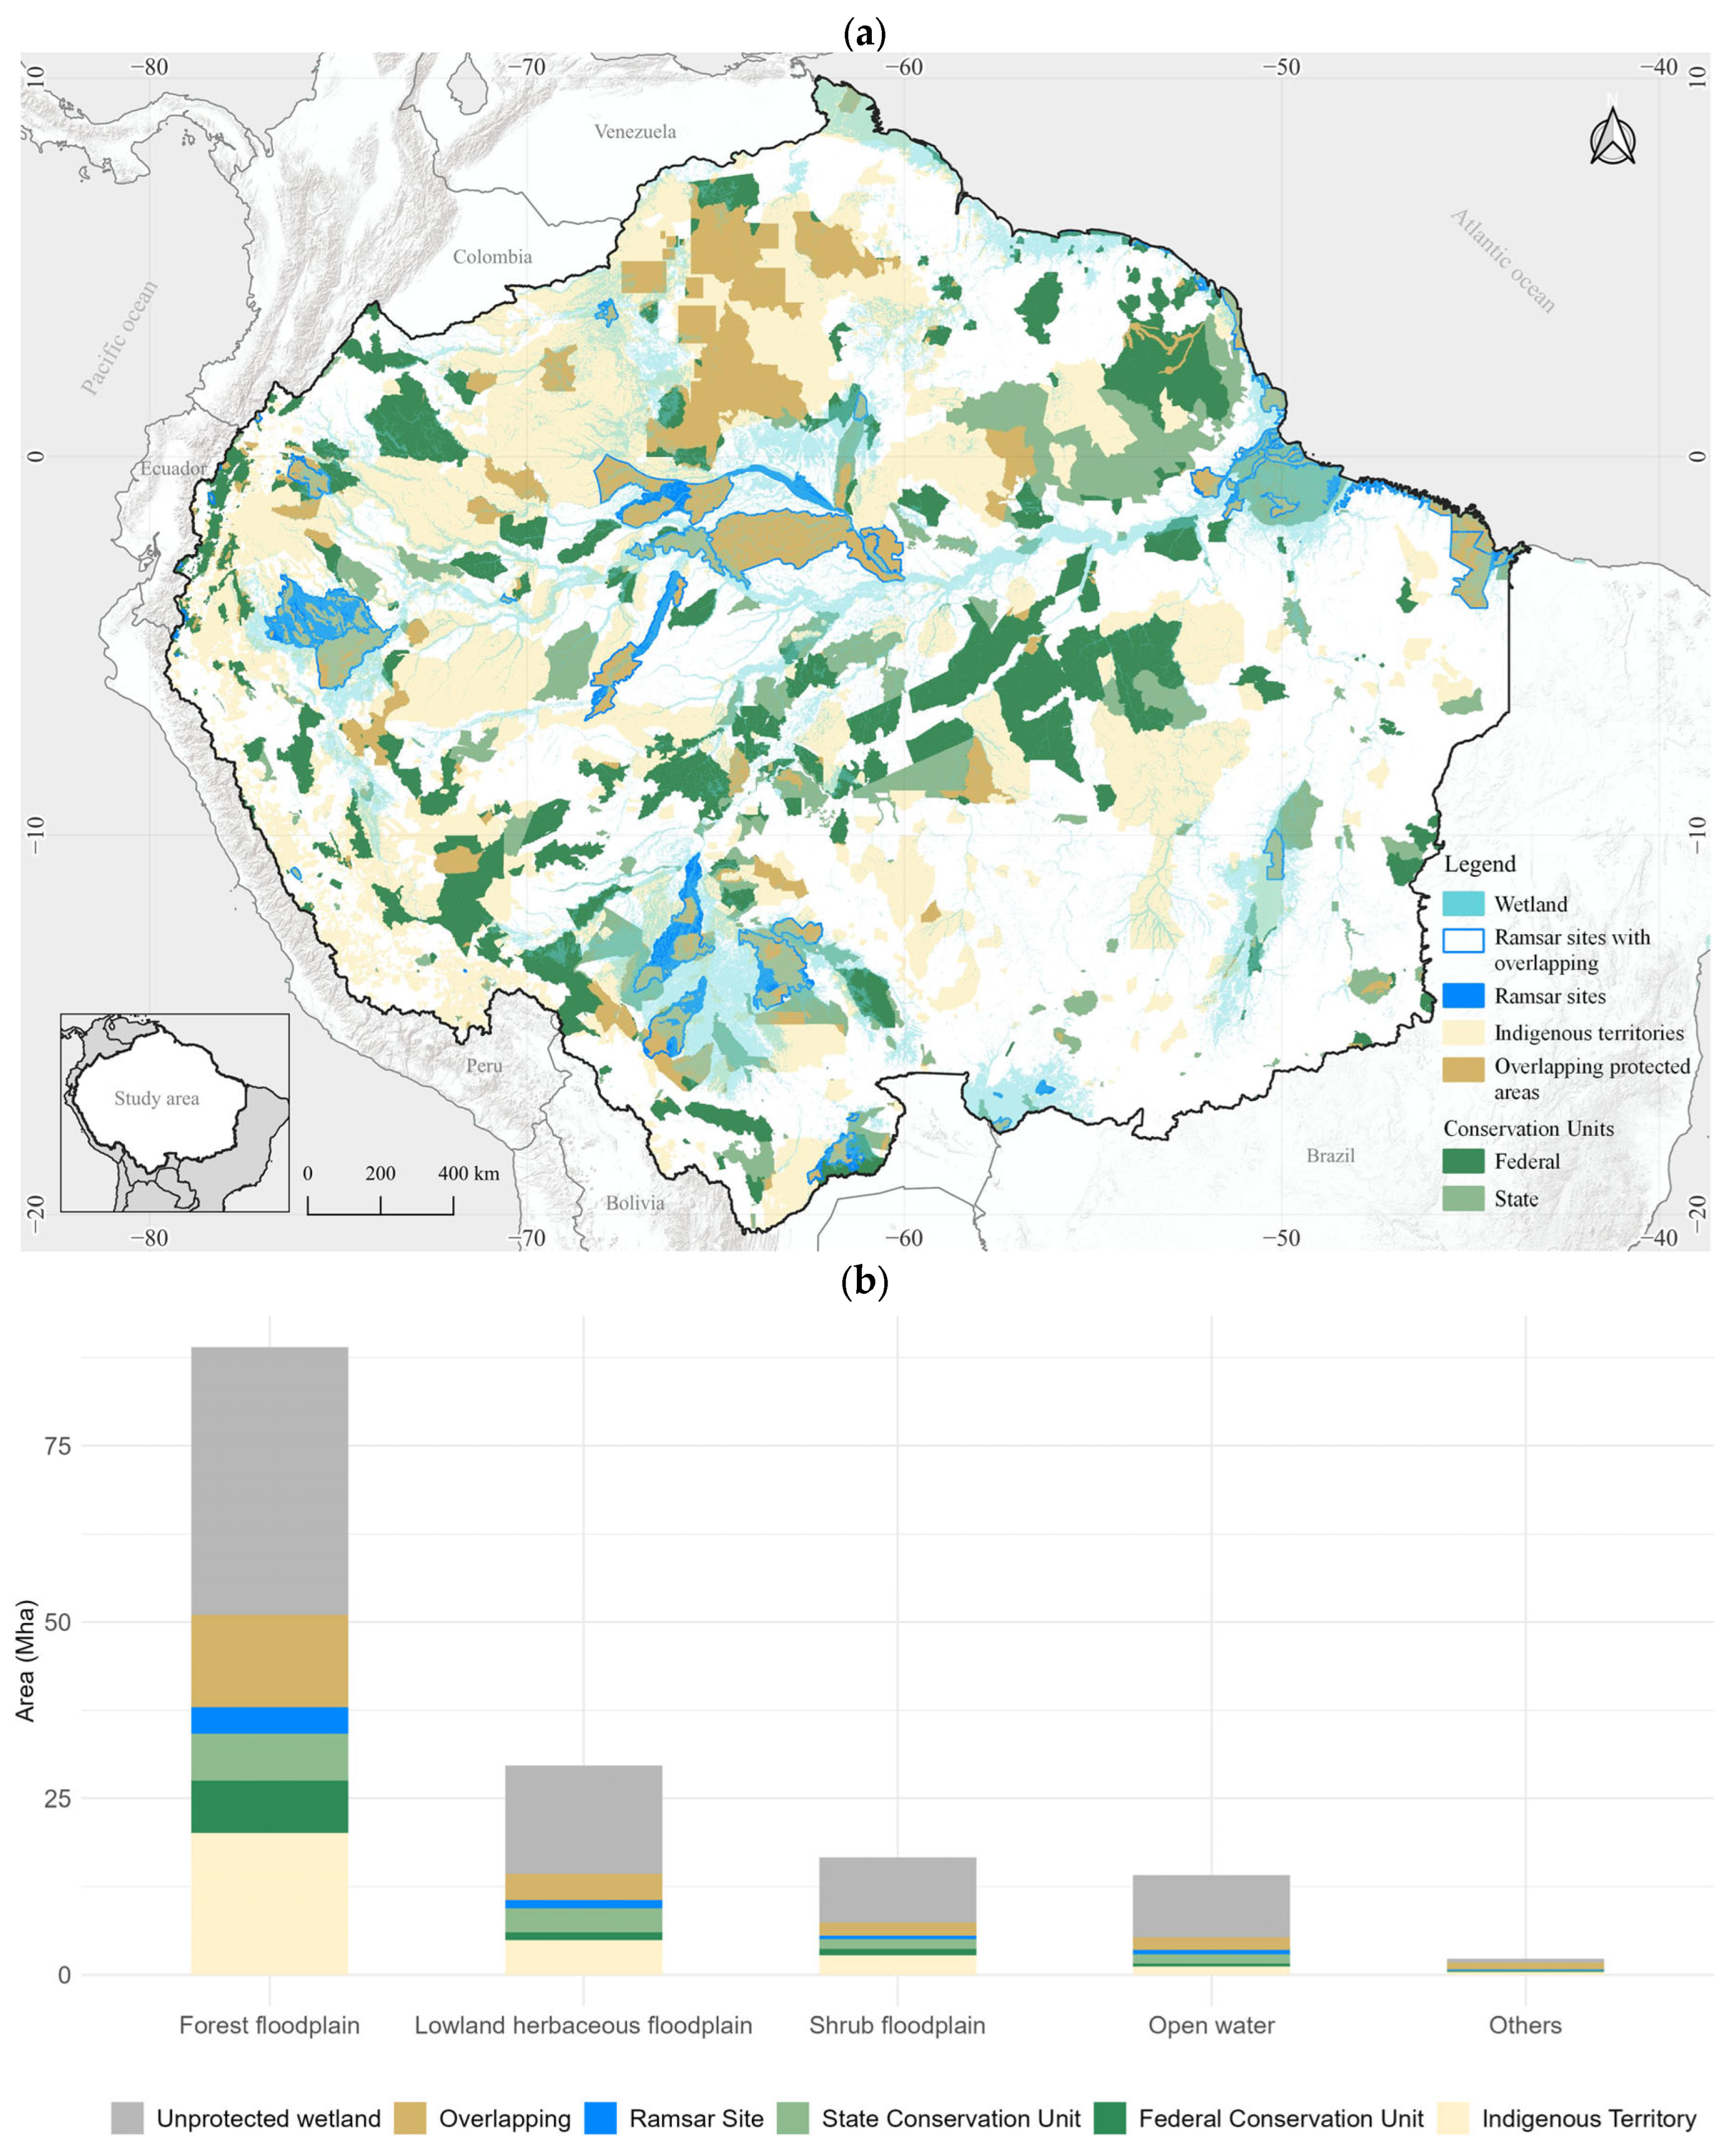
We estimated that 52.6% (i.e., 79.8 Mha) of the mapped wetlands are in one or more categories of protected areas: Indigenous Territory, State and Federal Conservation Units, and Ramsar Site (Figure 5). There are also overlapping protected areas among these categories. The overlap of protected wetlands occurred in areas where two or more categories of protected areas were superimposed, encompassing 21.4 Mha (14%). Of the protected areas categories without overlapping, Indigenous Territory possessed 29.3 Mha (19.3%) of wetlands, followed by State and Federal Conservation Units with 12.9 Mha (8.5%) and 10 Mha (6.6%), respectively, and Ramsar Site with 6.1 Mha (4.1%) (Table S1 in File S5).
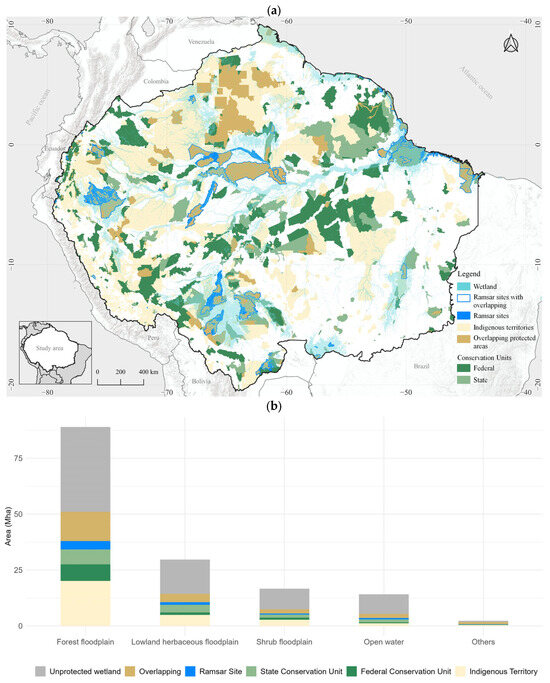
Figure 5.
Spatial distribution of protected wetlands (cyan) in Indigenous Territory (yellow), State (light green) and Federal (dark green) Conservation Units, Ramsar Site (blue), and overlapping protected areas (brown) (a); and distribution of the main wetland classes by protected areas (b).
The Ramsar Site category, a designation of international importance under the Ramsar Convention, aims to promote the wise use and conservation of wetlands but does not constitute a legal protected area per se [58]. They encompass a total area of 38.8 Mha in the study area. Of the total wetlands mapped in 2020, 22.8 Mha are in this category, which comprised 15% of the total wetland mapped area. We also found that 84% (i.e., 32.7 Mha) of the Ramsar Site category overlapped with protected areas categories, indicating that these sites added 6.1 Mha (4.1%) of additional protected wetlands relative to the areas already protected. It is worth noting that, as an international instrument, Ramsar Sites require national regulations and support to ensure their effective enforcement. Therefore, there is potential to create new Ramsar Sites in the remaining unprotected wetlands (i.e., 72 Mha) (Figure 5).
When investigating the classes of wetlands already protected, we found that Forest Floodplain is the class with the most significant extent, covering 51 Mha, which represents 57% of the total mapped area. Lowland Herbaceous Floodplain had 14.3 Mha protected, 48.2% of its extent in 2020, and the Shrub Floodplain 7.4 Mha (44.5%). Open Water occurred in 5.3 Mha within protected areas, which represented 37.4% of its extent. The other categories of wetlands, to a lesser extent, had 5.2% (i.e., 1.78 Mha) of their territory within protected areas (Figure 5b).
3.3. Wetland Threats and Pressures
There are three categories of threats and pressures on wetlands in the study area: (i) land use; (ii) infrastructure; and (iii) climate change. Each of these categories have specific drivers (presented below). Threats to wetlands are external factors that can potentially significantly jeopardize their health and survival. These factors include systemic changes like climate change, urbanization, and invasive species.
In contrast, human activities exert direct pressures that negatively impact wetlands, including agricultural runoff, pollution, and unsustainable resource extraction. These pressures can worsen the risks posed by threats. We combined our Amazonia wetland map with several factors that impose threats and pressures on the Amazon wetlands and estimate their direct and proximity impacts (see File S6 for the proximity analyses).
3.3.1. Land Use
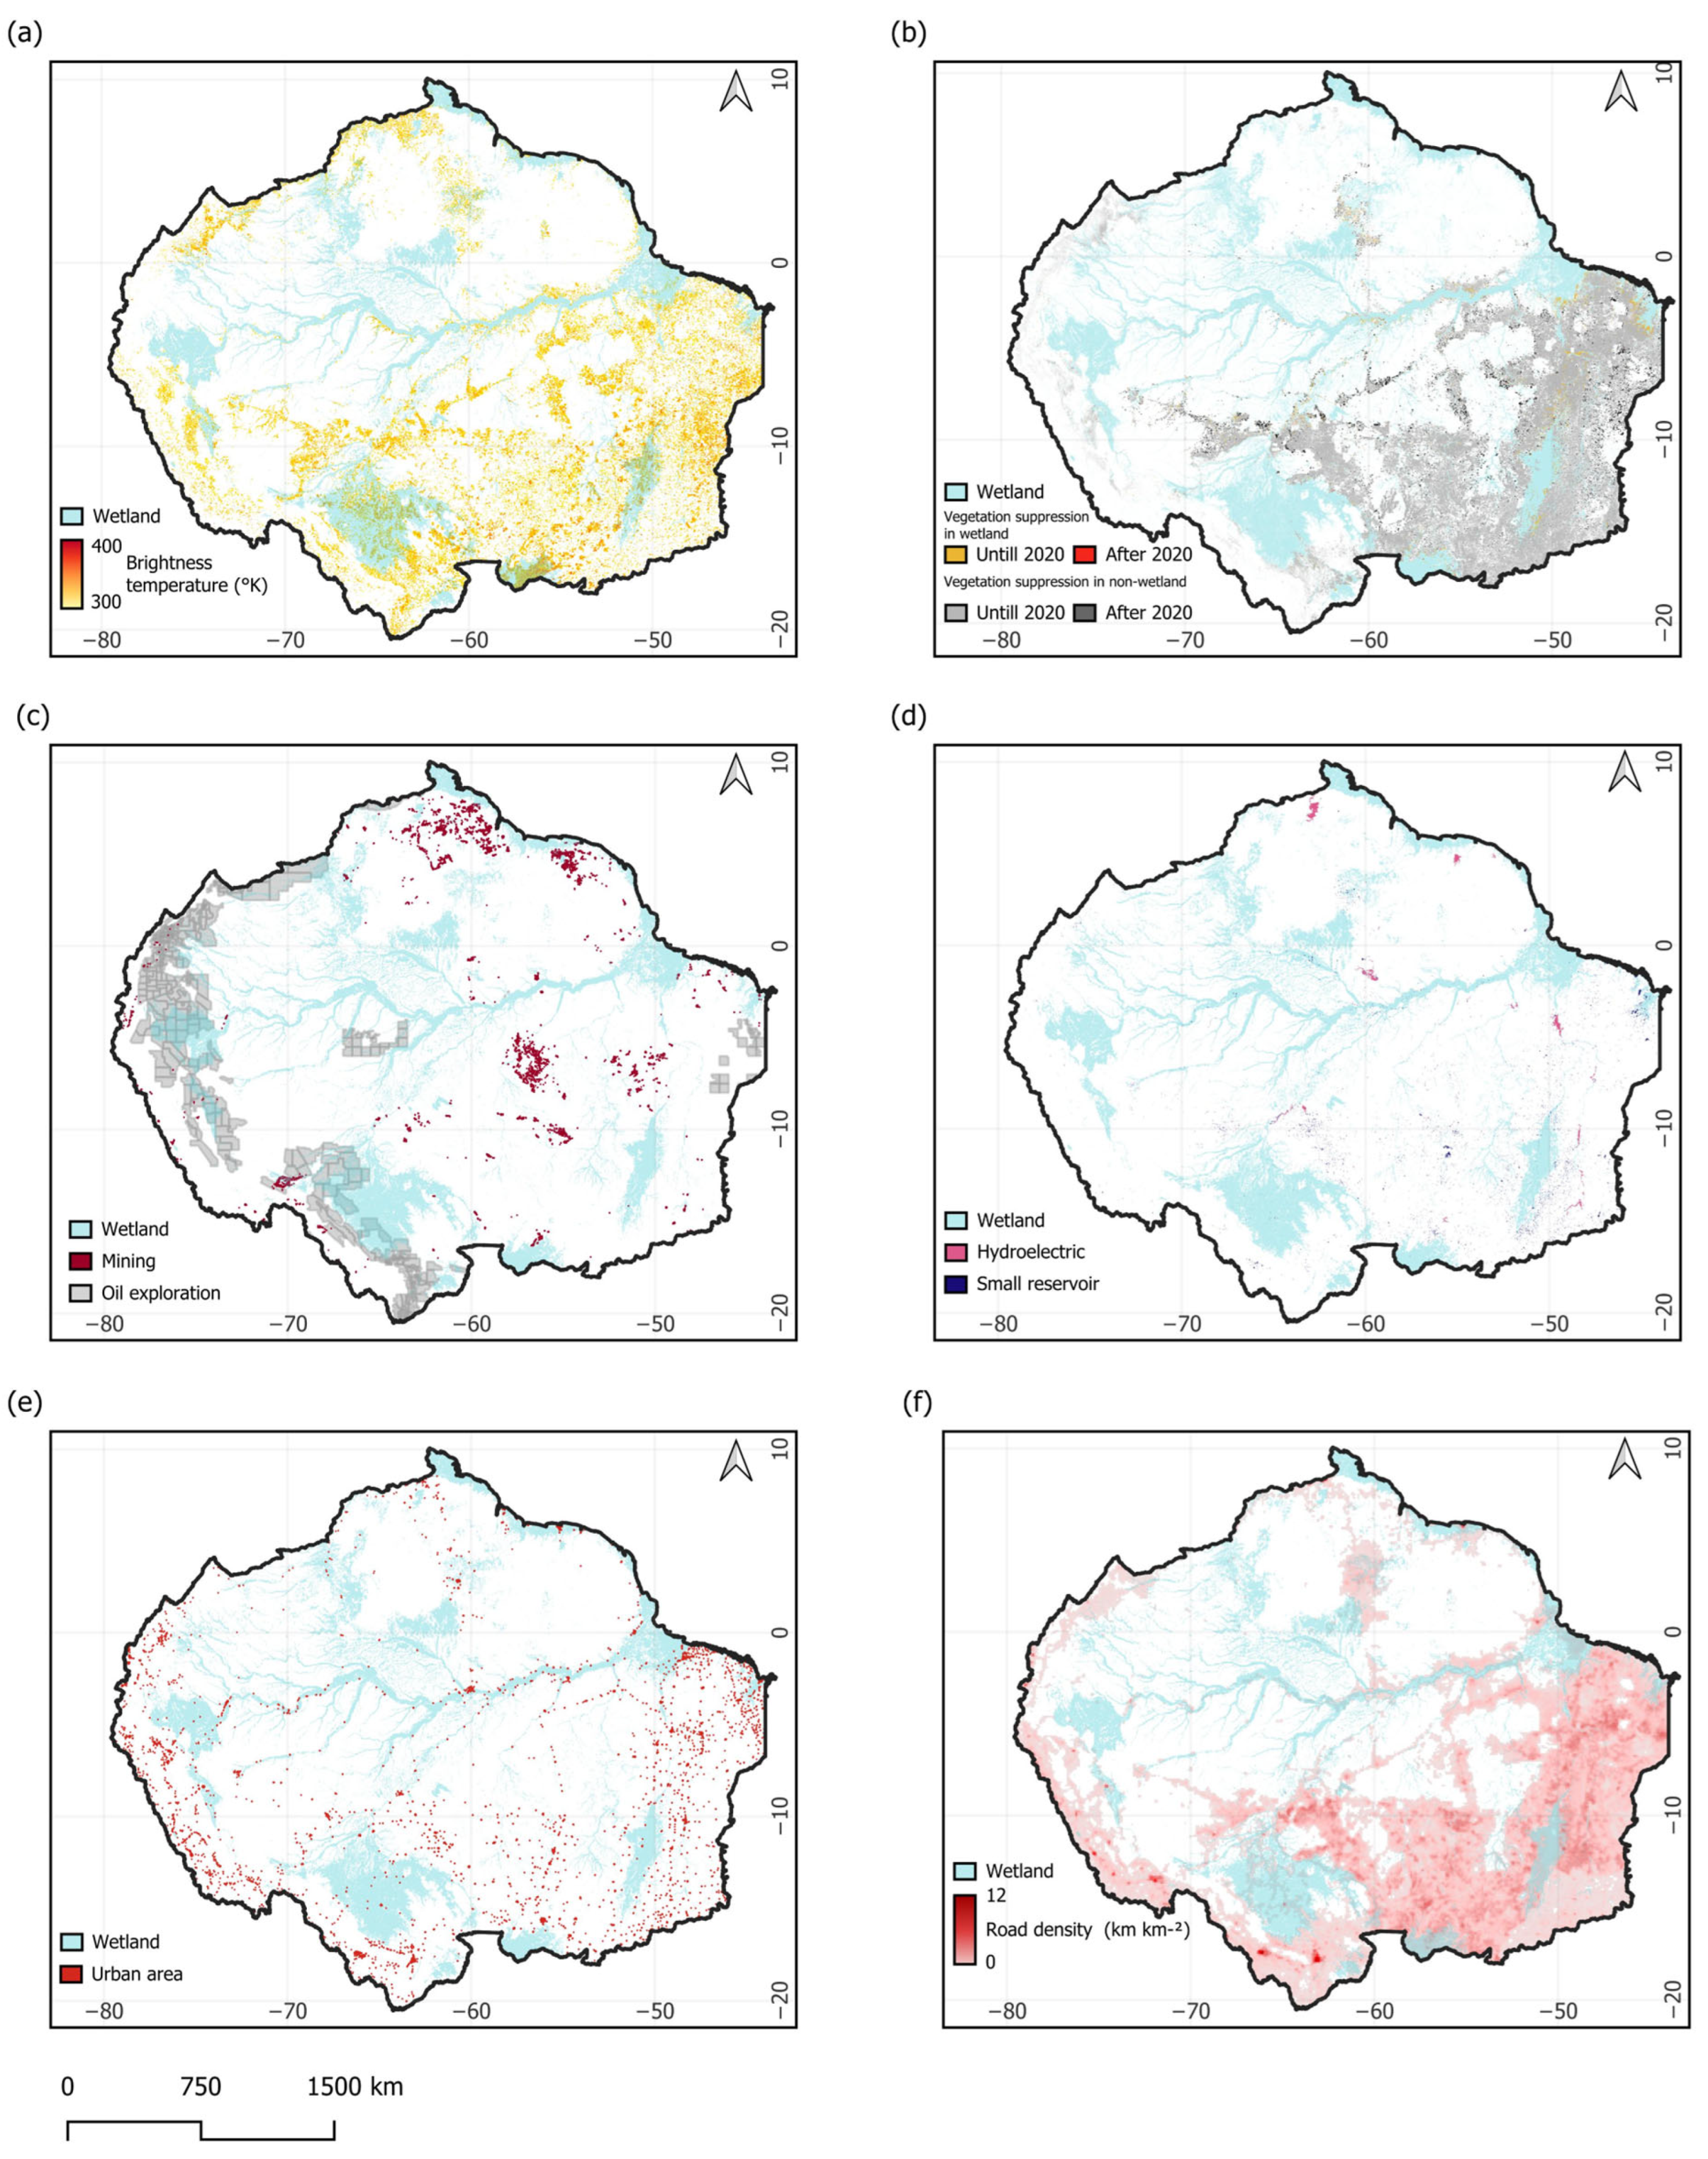
Fires are a common practice in land use management in the study area, as they are used in slash-and-burn deforestation to remove the above-ground biomass of vegetation from grasslands, shrublands, and forests, as well as to clear areas already in use. We estimated that 20% of all FIRMS (Fire Information for Resource Management System) pressured (i.e., lay down directly) the wetlands mapped in 2020, with the majority of fires in the Lowland Floodplain (44% of the fires in wetlands), followed by Forest Floodplain (35%) and Shrub Floodplain (17%), and the remaining fires in other wetland classes (Figure 6a). A small fraction of fires (i.e., <0.3%) occurred in the coastal and highland wetlands. As a result, fires can also threaten wetlands by boosting their nutrient levels. Despite the majority (i.e., 80%) of fires not occurring in wetlands, 80% of fires in 2020 were within 25 km of wetlands (Figure 6a). Fires within and near wetlands may deplete essential wetland nutrients, such as nitrates, altering their nutrient dynamics and hydrology and impacting the plant composition and ecosystem health of wetlands [59]. Fires can also increase greenhouse gas emissions in wetlands, particularly in areas associated with peatlands.
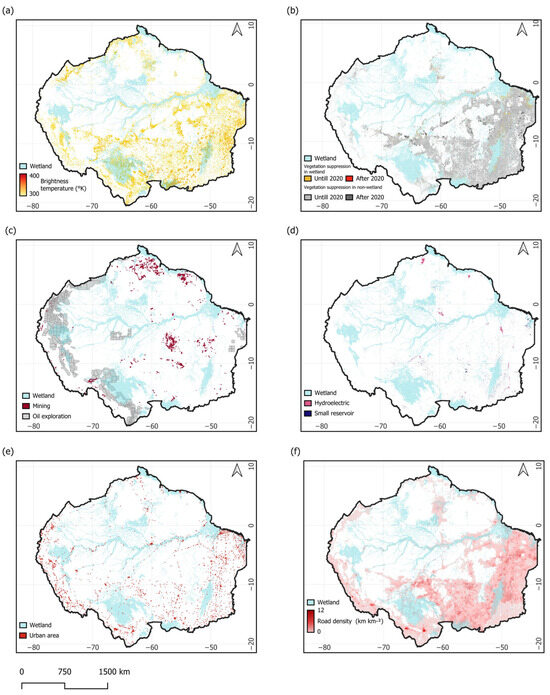
Figure 6.
Anthropogenic threats and pressures associated with fires (a), deforestation (b), mining (c), artificial water bodies (d), urban areas (e), and roads (f).
Deforestation is another significant source of threat and pressure to wetlands (Figure 6b). We estimated that 7.4 Mha of wetlands mapped in this study had been cleared until 2020. This area was excluded from our wetland map (Figure 3) because it has been considered a habitat of wetland loss [60]. Most of the wetland loss due to deforestation occurred in the Shrub Floodplain (47%), Lowland Herbaceous Floodplain (32%), and Forest Floodplain (20%). The proximity analysis revealed that the cumulative deforested areas were near wetlands (i.e., 80% within 28 km) and that deforestation between 2021 and 2024 was even closer (Figure S1b in File S6). The pressure of deforestation in wetlands typically results in threats to drainage and alteration of wetland hydrology, which impacts their ecological function [60].
We also identified significant pressures and threats from large industrial and gold mining operations in wetlands (Figure 6c). The wetland areas under industrial mining exploitation and prospecting reached 19.1 Mha, which is equivalent to 12.6% of the total area. The wetland classes under threat and pressure from industrial mining include Forest Floodplain (13.3 Mha), Lowland Herbaceous Floodplain (2.9 Mha), Shrub Floodplain (2 Mha), and Open Water (0.88 Mha), accounting for 99.8% of the wetland area with industrial mining influence.
The proximity analysis revealed that 30% of the wetlands are located within 30 km of industrial mining, which increases the risk to this aquatic ecosystem (Figure 6c; Figure S1c in File S6). Gold mining is directly linked to wetlands, as this activity often concentrates along rivers. Despite the relatively small footprint of gold mining in these areas, which accumulated ~33,000 ha until 2020, its negative local impacts are significant, including deforestation, soil and water contamination, sedimentation, biodiversity loss, and changes in hydrology [61]. Considering the scale of industrial mining, the negative impacts can be even greater. The potential threats of mining include water pollution, hydrological alteration, and the disruption of natural hydrological regimes, resulting in changes to water availability and quality in wetlands [8].
3.3.2. Infrastructure
Hydroelectric and reservoir dams create extensive artificial wetlands, which means they become artificially part of these aquatic ecosystems, pressuring them. For instance, small dams, primarily associated with agricultural and aquaculture activities, are typically located along or near small rivers and streams [28], and large reservoirs inundate extensive areas (Figure 6d). As threats, the combined large and small dams alter the natural hydrological patterns of surrounding wetlands, disrupting flow and seasonal water availability, creating barriers that hinder the movement of aquatic and terrestrial species and can exacerbate flooding in adjacent wetlands [62]. Additionally, reservoirs contribute to greenhouse gas emissions, particularly methane, from decomposing organic matter, further threatening the ecological integrity of these wetlands [63].
Urban areas and roads are other types of infrastructure that threaten and pressure wetlands. The former exerts a multifaceted impact on Amazon wetlands through habitat fragmentation, hydrological alterations, pollution, invasive species proliferation, and direct resource exploitation. Road networks open areas to agricultural expansion through deforestation and further encroachments [64], potentially destabilizing wetland ecosystems. This expansion often brings about alterations in flow patterns and water levels through the fragmentation of wetlands [65]. Roads and urban areas also promote increased human activity in previously untouched wetlands. Our proximity analysis revealed that 80% of wetlands are ~50 km of urban areas (Figure 6e; Figure S1d in File S6) and roads (Figure 6f; Figure S1e in File S6).
3.3.3. Climate Change
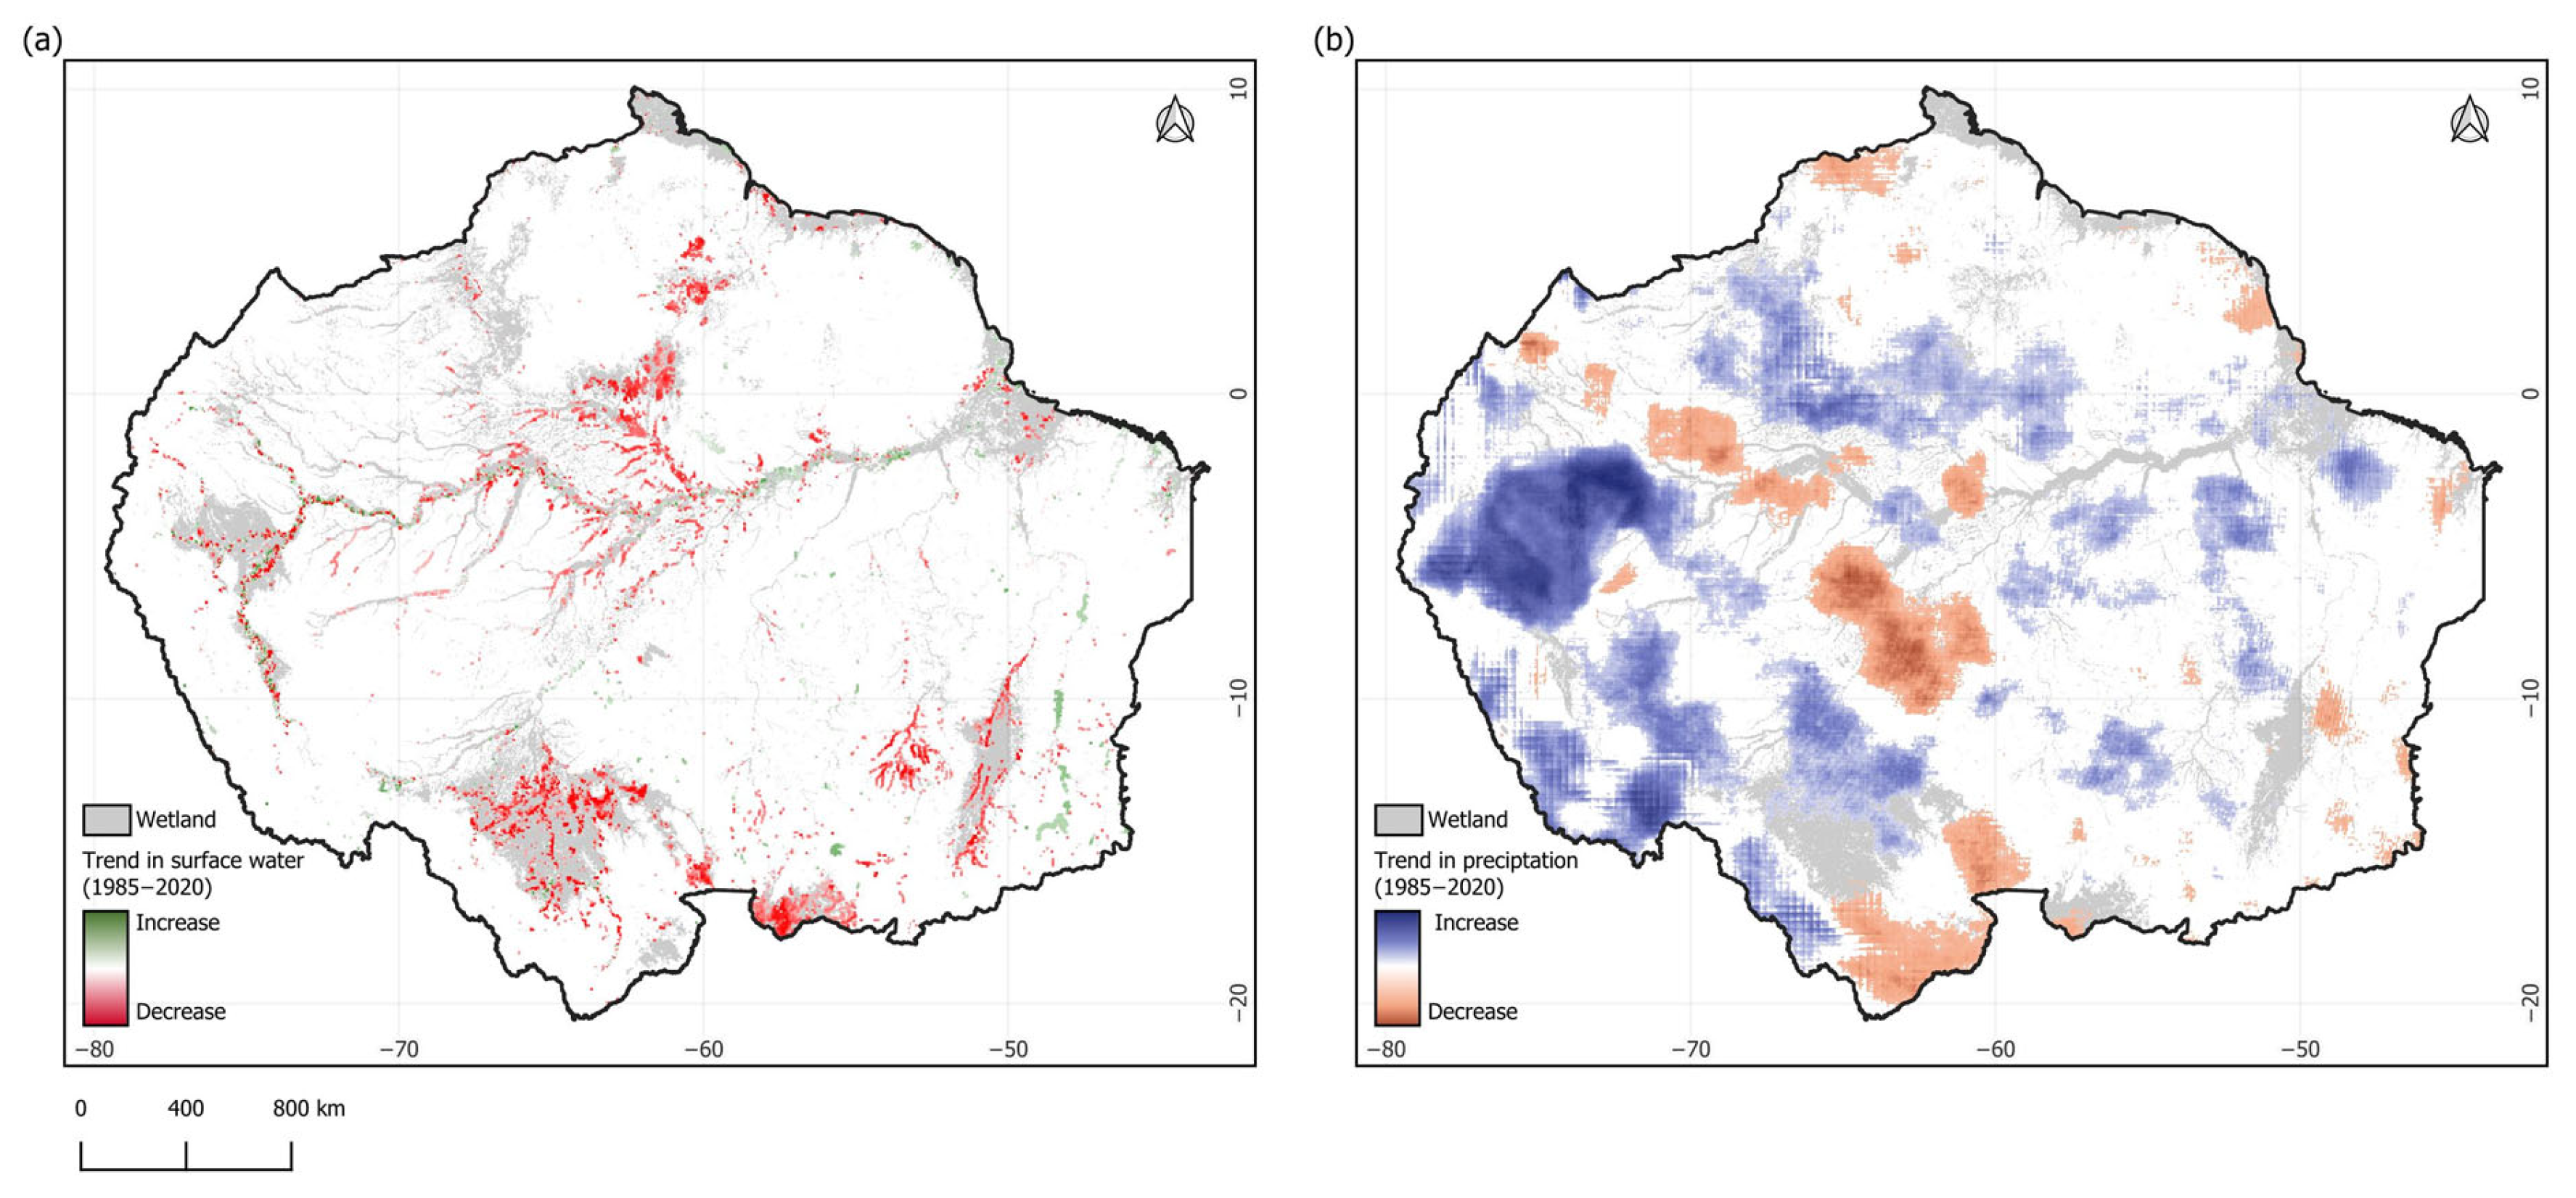
Climate change is also threatening and pressuring the Amazon wetlands. Using monthly Landsat time-series surface water data from 1985 to 2020, we identified wetlands with surface water loss and gain [28]. We estimated 18.6 Mha of wetlands with a surface water loss trend and 6.2 Mha of gain (p = 0.05; Mann–Kendall trend test). For wetland water loss, 36.3% occurred in the Lowland Herbaceous Floodplain, 13.7% in the Shrub Floodplain, and 9.6% in Open Water. It is essential to highlight that the Landsat surface water product does not detect water in closed canopy vegetation, implying that the extent of water losses might be higher. Most of the water gain occurred in the Open Water wetland class (32%), followed by Lowland Herbaceous Floodplain (18.6%), Shrub Floodplain (9.2%), and Mangrove (6.2%) (Figure 7a).
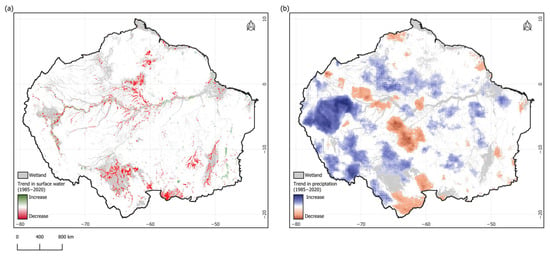
Figure 7.
Temporal trend of surface water loss and gain (a) and precipitation (b), with gains and losses detected with Mann–Kendall trend test; p = 0.05.
Precipitation changes also have the potential to change wetlands [62]. We assessed the monthly gain and loss of precipitation between 1985 and 2020, as detected using the Mann–Kendall trend test (p = 0.05), relative to our wetland map. We found that 13.3 Mha of precipitation had a reducing trend over time, and 46.7 Mha showed an increasing trend (Figure 7b). These changes are likely linked to climate change, which disrupts precipitation patterns, especially during extreme climate events [66], thereby debilitating the relationship between flooding and wetland health. For instance, extreme climate events can lead to prolonged flooding or extended dry spells, significantly impacting wetland ecosystems. Additionally, changes in flooding patterns can lead to a decline in the ecosystem services that wetlands provide, including carbon storage, water purification, and recreational activities [67]. This reduction in ecosystem functionality could harm local communities that depend on wetlands for their livelihoods and cultural values. Further investigation of these potential negative impacts might be carried out and incorporated into climate change adaptation and mitigation policies.
4. Discussion
4.1. Challenges of Mapping Wetlands
Our study area encompasses two large basins, the Amazon and Orinoco, as well as parts of the Pantanal biome and the Northeast Atlantic Basin (Figure 1). It encompasses nearly 8.5 million km2 and comprises a diversity of ecosystems from the coastal zone to the Andes highlands. The wetlands of this vast territory connect the non-wetland ecosystems (e.g., upland terra tirme forests, savannas, natural grasslands) and are an integral part of the territory’s biodiversity, climate, and socioeconomic dynamics. The extent of the study area and the ecosystem diversity impose challenges to map wetlands in this region.
We developed our mapping wetland protocol based on the methods proposed by [39], which included automatic stratified sample extraction from published datasets and class harmonization techniques for training, calibration, and assessment of the classification results. Here, we refined this protocol by employing a map sheet-tile approach to classify wetlands using an extensive training and calibration dataset carefully curated from the harmonized classification map and expert evaluation. We also utilized a selected set of multi-sourced intra-annual remote sensing data, ensuring that temporal variations and seasonal dynamics of wetlands are accurately captured, except for the ALOS PALSAR dataset, which is an annual mosaic dataset. We also used cloud computing from Google Earth Engine to process the vast datasets and run the wetland classifier. Finally, our classification approach differs from global mapping efforts because we propose a general classification system of wetlands suitable for supporting in-country-based classification efforts already in place (e.g., [20]), an ongoing effort of our research project.
Based on pixel classification, we estimated that wetlands covered 151.7 million hectares (Mha) of the study area, with an overall mapping accuracy of 82.2%. Our estimate of wetland class areas exceeds the extent of the published studies (Table 1)—for example, the GLAD LULC and the SBTN WRI estimates for Forest Floodplain were 64.6 Mha and 78.4 Mha, respectively, which are lower than our estimate (i.e., 89 Mha). For the Lowland Herbaceous, the estimates of the abovementioned sources were 31.7 Mha and 21.6 Mha, respectively, while ours was 29.6 Mha. Therefore, the most significant difference in the wetland class estimates was in the Forest Floodplain class. We also compared our mapping results with a harmonized version of the wetland classes in Table 1 (Figure S1 in File S1). The harmonized map indicated an area of 161 Mha of wetland in the study area, which is 5.8% higher than our estimate. The accuracy assessment of the harmonized map was 94.0%, which is an overestimation of the mapping accuracy because the reference dataset was extracted from it.
Applying the statistical good practices [56] for area estimation, the wetland extent can range from 244.4 Mha to 251 Mha (Table S4 in File S4). The difference between the pixel counting (i.e., 151 Mha) and area-adjusted estimate implies that the random forest classifier may underestimate the mapping of wetlands by ~100 Mha. What could explain this? This discrepancy is likely due to the underestimation of the Forest Floodplain and Shrub Floodplain classes, which showed area-adjusted estimates ~40 Mha larger than the original pixel-based estimates. These wetland classes were possibly under-mapped because the yearly ALOS PALSAR mosaic input data [48], does not capture the seasonal variability of water in closed-canopy forested vegetation. The high-density forested vegetation classes obscure water detection under a canopy with Landsat (optical) and even with Sentinel-1 (i.e., C-SAR band) data. Using intra-annual ALOS PALSAR time-series data would be ideal because its L-band frequency is particularly effective in penetrating the forest canopy and high vegetation density to detect sub-surface water and capture maximum and minimum inundation extents over these wetland classes [11]. The discrepancy may also affect the evaluation of wetland areas facing pressures and threats, as well as the effectiveness of conservation and management strategies. Consequently, incorporating a detailed historical intra-annual time-series analysis using L-band SAR data (e.g., ALOS PALSAR or NISAR) will be essential to address these mapping challenges and improve decision-making.
How temporally stable is the RF classification model? We tested it in several map-sheet tiles and the preliminary results are promising. As the next step, we will advance our research by building a temporal reference dataset to expand the mapping of wetlands over a larger period (e.g., starting in 2016, when both Sentinel-1A and Sentinel-1B data became available, to the most recent period possible).
4.2. The Loss of Wetland Habitats
There is a consensus in the scientific literature indicating a trend of wetland habitat loss associated with land use, climate change, infrastructure, and pollution. Currently, the wetlands in the study area are under pressure by agricultural expansion, infrastructure construction such as dams and roads, open-pit mining, and urban expansion converge. Landscape fragmentation has altered the ecological connectivity of wetlands with large and small artificial dams, compromising key functions such as water regulation, reproduction of aquatic species, and aquifer recharge, which directly impacts the water and food security of Amazonian communities. Our study showed that the wetlands mapped in 2020 were under high threats and pressures of fires, and 7.4 Mha had been deforested. Between 2021 and 2024, an additional 800,000 had been lost, mostly for agriculture, followed by urban expansion and gold mining (Figure 6a,b).
Amazon wetlands are highly vulnerable to changes in precipitation and temperature patterns, which directly affect their carbon storage capacity, water regulation, and biodiversity maintenance. The surface temperature in the Amazon region increased by 1 °C over the past decades [68], and a further increase is being projected [69]. Furthermore, a decrease in annual precipitation in the eastern Amazon, and an increase in the western, has been projected [70]. These extreme events can potentially disrupt the hydrological cycles that maintain the flooding pulse of wetlands, reducing their extent, altering the composition of aquatic species, and triggering the release of large amounts of carbon previously stored in flood-prone soils and wetlands. Our trend analyses of precipitation and surface water corroborate these previous studies. Loss of precipitation and surface water directly affected 21 Mha of mapped wetlands in 2020. However, we still lack a precise estimate of the extent of wetland habitat loss associated with these extreme climate events. Further analysis is essential to clearly understand the relationship between rainfall deficits and the decline of the water table, and how these combined effects translate into surface water losses.
4.3. Opportunities for Conservation and Management of Wetlands
The effective conservation and management of Amazon wetlands remain hindered by the lack of integrated, region-wide data and coordinated monitoring mechanisms. A key challenge lies in the fragmentation and limited interoperability of existing information across national and institutional boundaries. To overcome this gap, it is critical to consolidate geospatial and ecological data into a regional platform that supports open access and methodological transparency. The wetland classification and mapping approach presented in this study offer a foundation for such a system, enabling the early detection of threats such as fire, deforestation, and hydrological disruption.
Another challenge is to scale down the mapping and monitoring to the country level, considering countries’ jurisdiction and distinct conservation and management policies, and last but not least, specific national wetland classification systems. To overcome the jurisdictional and policy national specificities, our research team reviewed the law and public policies and identified national actors (e.g., government agencies, NGOs, associations representing indigenous and river side communities) that can benefit from knowledge and information about wetlands. We have also conducted a series of capacity-building workshops to transfer the knowledge and information obtained in this project. Additionaly, we have identified opportunities for policy implementation at the national level and prepared a series of policy briefs addressing the opportunities and challenges to overcome the pressure and threats to the wetlands. Finally, to overcome the challenge of integrating the regional and national wetland classification systems, we designed a general regional classification system (Table 2) to facilitate its application to the national level. This process is being conducted in several countries and will be the subject of future papers. Another scale that our new wetland maps are being applied is at the community level. We have engaged with indigenous, river-side and traditional communities in workshops to present our mapping results, pressure and threat analyses, and identify opportunities to implement conservation and management plans, considering their knowledge and experiences in their territories.
Beyond its technical value, our new wetland map can inform the prioritization of areas for protection, support the creation of new Ramsar Sites, and assist in the expansion of national conservation networks. By aligning with global commitments—such as the Ramsar Convention and the Kunming-Montreal Global Biodiversity Framework—these tools can strengthen governance processes and support inclusive, science-based decision-making by governments, Indigenous Peoples, and local communities.
5. Conclusions
This study proposes a method to enhance the mapping of wetlands in the Amazon region, utilizing existing published maps and expert knowledge. The aim was to harmonize the classification legend and build a robust dataset for training, calibration, and validation and produce a new wetland map for the Amazon region. Using a fully automated classification approach, we mapped 151.7 Mha of wetlands for the year 2020, with an overall accuracy of 82.2%. The updated wetland map offers a standardized classification system that can be integrated at the national level to enhance wetland inventories, management, and conservation policies, which is the main goal of utilizing the new wetland map. The analysis revealed that 47.4% of these wetlands remain unprotected and are increasingly affected by land use change, infrastructure development, and climate variability. The resulting map baseline enables more targeted conservation strategies and supports the implementation of adaptive policies at both national and regional scales. The final wetland map was then used to assess potential threats and pressures from land use, infrastructure, and climate change, indicating that extensive areas of wetland are at risk. These areas are also under significant pressure from climate change. The resulting map revealed that about half (52.6%, i.e., 79.8 Mha) of the wetlands mapped in 2020 are located within existing protected areas. This highlights the urgent need to expand area-based conservation efforts for these essential ecosystems. Further studies will focus on reconstructing the time-series of wetlands and integrating the regional classification scheme at the national level. The results indicate the urgent need for the protection of these areas under the imminent risk of permanent loss of essential ecosystem functions (e.g., climatic resilience, biodiversity maintenance, food security, etc.) and nature-based solutions critical for climate adaptation.
Supplementary Materials
The following supporting information can be downloaded at: https://www.mdpi.com/article/10.3390/rs17213644/s1, File S1: Harmonized wetland map. File S2: Dataset for wetland classification. File S3: List of all reference maps for wetland classification. File S4: Accuracy assessment analysis [56]. File S5: Protected and unprotected wetlands. File S6: Proximity analyses of threats and pressure.
Author Contributions
Conceptualization, C.M.S.J., S.R. and M.A.O.-M.; Data Curation, C.M.S.J., B.G.F., I.M.B., J.A.-B., J.S., E.V., M.A.R.-G., E.M.-V., C.C.A. and J.C.A.; Formal Analysis, C.M.S.J., B.G.F. and I.M.B.; Funding Acquisition, C.M.S.J.; Investigation, C.M.S.J., J.A.-B., E.T., N.R. and M.A.O.-M.; Methodology, C.M.S.J., B.G.F., I.M.B., S.R., J.A.-B., J.S., E.V., M.A.R.-G., E.M.-V., E.T., N.R., L.W.S. and J.C.A.; Project Administration, C.M.S.J. and S.R.; Software, B.G.F., J.A.-B., J.S., E.V., E.M.-V. and J.E.V.G.; Supervision, C.M.S.J., S.R. and J.A.-B.; Validation, B.G.F., I.M.B., S.R., J.A.-B., J.S., M.A.R.-G., L.W.S., J.E.V.G. and J.E.; Visualization, C.M.S.J., B.G.F. and I.M.B.; Writing—Original Draft, C.M.S.J. and J.A.-B.; Writing—Review and Editing, C.M.S.J., B.G.F., I.M.B., S.R., J.S., E.V., M.A.R.-G., E.M.-V., E.T., N.R., L.W.S., M.A.O.-M., C.C.A., J.E.V.G., J.E., J.C.A., T.V.B., S.R.S., J.R.G. and H.C.W. All authors have read and agreed to the published version of the manuscript.
Funding
This research was funded by Gordon and Betty Moore Foundation (GBMF) grant number 12209.
Data Availability Statement
The original contributions presented in this study are included in the article/Supplementary Materials. Further inquiries can be directed to the corresponding author.
Acknowledgments
We are thankful to the Gordon and Betty Moore Foundation (GBMF) for providing the funding for this project. We are grateful for the participants of the regional and country workshops for sharing their knowledge and insights for mapping wetlands in the study area.
Conflicts of Interest
The authors declare no conflicts of interest.
References
- Goulding, M.; Venticinque, E.; Ribeiro, M.L.d.B.; Barthem, R.B.; Leite, R.G.; Forsberg, B.; Petry, P.; Lopes da Silva-Júnior, U.; Ferraz, P.S.; Cañas, C. Ecosystem-Based Management of Amazon Fisheries and Wetlands. Fish Fish. 2019, 20, 138–158. [Google Scholar] [CrossRef]
- Junk, W.J.; Soares, M.G.M.; Bayley, P.B. Freshwater Fishes of the Amazon River Basin: Their Biodiversity, Fisheries, and Habitats. Aquat. Ecosyst. Health Manag. 2007, 10, 153–173. [Google Scholar] [CrossRef]
- Jézéquel, C.; Tedesco, P.A.; Bigorne, R.; Maldonado-Ocampo, J.A.; Ortega, H.; Hidalgo, M.; Martens, K.; Torrente-Vilara, G.; Zuanon, J.; Acosta, A.; et al. A Database of Freshwater Fish Species of the Amazon Basin. Sci. Data 2020, 7, 96. [Google Scholar] [CrossRef]
- Myers, J.P. Conservation of Migrating Shorebirds: Staging Areas, Geographic Bottlenecks, and Regional Movements. Am. Birds 1983, 37, 5. [Google Scholar]
- Junk, W.J.; Brown, M.; Campbell, I.C.; Finlayson, M.; Gopal, B.; Ramberg, L.; Warner, B.G. The Comparative Biodiversity of Seven Globally Important Wetlands: A Synthesis. Aquat. Sci. 2006, 68, 400–414. [Google Scholar] [CrossRef]
- Castello, L.; Mcgrath, D.G.; Hess, L.L.; Coe, M.T.; Lefebvre, P.A.; Petry, P.; Macedo, M.N.; Renó, V.F.; Arantes, C.C. The Vulnerability of Amazon Freshwater Ecosystems. Conserv. Lett. 2013, 6, 217–229. [Google Scholar] [CrossRef]
- Flores, B.M.; Holmgren, M.; Xu, C.; Van Nes, E.H.; Jakovac, C.C.; Mesquita, R.C.G.; Scheffer, M. Floodplains as an Achilles’ Heel of Amazonian Forest Resilience. Proc. Natl. Acad. Sci. USA 2017, 114, 4442–4446. [Google Scholar] [CrossRef]
- Castello, L.; Macedo, M.N. Large-Scale Degradation of Amazonian Freshwater Ecosystems. Glob. Change Biol. 2016, 22, 990–1007. [Google Scholar] [CrossRef] [PubMed]
- Ameli, A.; Creed, I.F. Does Wetland Location Matter When Managing Wetlands for Watershed-Scale Flood and Drought Resilience? Jawra J. Am. Water Resour. Assoc. 2019, 55, 529–542. [Google Scholar] [CrossRef]
- Gumbricht, T.; Roman-Cuesta, R.M.; Verchot, L.; Herold, M.; Wittmann, F.; Householder, E.; Herold, N.; Murdiyarso, D. An Expert System Model for Mapping Tropical Wetlands and Peatlands Reveals South America as the Largest Contributor. Glob. Change Biol. 2017, 23, 3581–3599. [Google Scholar] [CrossRef]
- Lowry, J.; Hess, L.; Rosenqvist, A. Mapping and Monitoring Wetlands Around the World Using ALOS PALSAR: The ALOS Kyoto and Carbon Initiative Wetlands Products; Springer: Berlin/Heidelberg, Germany, 2009; pp. 105–120. [Google Scholar]
- Tootchi, A.; Jost, A.; Ducharne, A. Multi-Source Global Wetland Maps Combining Surface Water Imagery and Groundwater Constraints. Earth Syst. Sci. Data 2019, 11, 189–220. [Google Scholar] [CrossRef]
- Junk, W.J.; Piedade, M.T.F. The Amazon River basin. In The World’s Largest Wetlands: Ecology and Conservation; Fraser, L.H., Keddy, P.A., Eds.; Cambridge University Press: Cambridge, UK, 2005; pp. 63–117. [Google Scholar]
- Yi, Q.; Huixin, G.; Yaomin, Z.; Jinlian, S.; Xingyu, Z.; Huize, Y.; Jiaxin, W.; Zhenguo, N.; Liping, L.; Shudong, W.; et al. Global Conservation Priorities for Wetlands and Setting Post-2025 Targets. Commun. Earth Environ. 2024, 5, 1–11. [Google Scholar] [CrossRef]
- Fluet-Chouinard, E.; Stocker, B.D.; Zhang, Z.; Malhotra, A.; Melton, J.R.; Poulter, B.; Kaplan, J.O.; Goldewijk, K.K.; Siebert, S.; Minayeva, T.; et al. Extensive Global Wetland Loss over the Past Three Centuries. Nature 2023, 614, 281–286. [Google Scholar] [CrossRef]
- Hu, S.; Niu, Z.; Chen, Y.; Li, L.; Zhang, H. Global Wetlands: Potential Distribution, Wetland Loss, and Status. Sci. Total Environ. 2017, 586, 319–327. [Google Scholar] [CrossRef] [PubMed]
- Darrah, S.E.; Shennan-Farpón, Y.; Loh, J.; Davidson, N.C.; Finlayson, C.M.; Gardner, R.C.; Walpole, M.J. Improvements to the Wetland Extent Trends (WET) Index as a Tool for Monitoring Natural and Human-Made Wetlands. Ecol. Indic. 2019, 99, 294–298. [Google Scholar] [CrossRef]
- Scott, D.A.; Jones, T.A. Classification and Inventory of Wetlands: A Global Overview. Vegetatio 1995, 118, 3–16. [Google Scholar] [CrossRef]
- Junk, W.J.; Piedade, M.T.F.; Schöngart, J.; Cohn-Haft, M.; Adeney, J.M.; Wittmann, F. A Classification of Major Naturally-Occurring Amazonian Wetlands. Wetlands 2011, 31, 623–640. [Google Scholar] [CrossRef]
- Junk, W.J.; Piedade, M.T.F.; Lourival, R.; Wittmann, F.; Kandus, P.; Lacerda, L.D.; Bozelli, R.L.; Esteves, F.A.; Nunes da Cunha, C.; Maltchik, L.; et al. Brazilian Wetlands: Their Definition, Delineation, and Classification for Research, Sustainable Management, and Protection. Aquat. Conserv. 2014, 24, 5–22. [Google Scholar] [CrossRef]
- Davidson, N.C.; Finlayson, C.M. Extent, Regional Distribution and Changes in Area of Different Classes of Wetland. Mar. Freshw. Res. 2018, 69, 1525–1533. [Google Scholar] [CrossRef]
- WETLANDS|AMAZON WATERS ALLIANCE. Available online: https://en.aguasamazonicas.org/wetlands (accessed on 26 March 2024).
- Haggar, K.M. Defining Wetlands. Soc. Wetl. Sci. Bull. 2001, 18, 5–10. [Google Scholar] [CrossRef]
- Mahdianpari, M.; Granger, J.; Mohammadimanesh, F.; Salehi, B.; Brisco, B.; Homayouni, S.; Gill, E.W.; Huberty, B.; Lang, M. Meta-Analysis of Wetland Classification Using Remote Sensing: A Systematic Review of a 40-Year Trend in North America. Remote Sens. 2020, 12, 1882. [Google Scholar] [CrossRef]
- Gallant, A.L. The Challenges of Remote Monitoring of Wetlands. Remote Sens. 2015, 7, 10938–10950. [Google Scholar] [CrossRef]
- Fleischmann, A.S.; Papa, F.; Fassoni-Andrade, A.C.; Mélack, J.M.; Wongchuig, S.; Paiva, R.C.D.d.; Hamilton, S.K.; Fluet-Chouinard, E.; Barbedo, R.; Aires, F.; et al. How Much Inundation Occurs in the Amazon River Basin? Remote Sens. Environ. 2022, 278, 113099. [Google Scholar] [CrossRef]
- Amani, M.; Brisco, B.; Afshar, M.; Mirmazloumi, S.M.; Mahdavi, S.; Mirzadeh, S.M.J.; Huang, W.; Granger, J. A Generalized Supervised Classification Scheme to Produce Provincial Wetland Inventory Maps: An Application of Google Earth Engine for Big Geo Data Processing. Big Earth Data 2019, 3, 378–394. [Google Scholar] [CrossRef]
- Souza, C.M.; Kirchhoff, F.T.; Oliveira, B.C.; Ribeiro, J.G.; Sales, M.H. Long-Term Annual Surface Water Change in the Brazilian Amazon Biome: Potential Links with Deforestation, Infrastructure Development and Climate Change. Water 2019, 11, 566. [Google Scholar] [CrossRef]
- Wang, X.; Ling, F.; Yao, H.; Liu, Y.; Xu, S. Unsupervised Sub-Pixel Water Body Mapping with Sentinel-3 OLCI Image. Remote Sens. 2019, 11, 327. [Google Scholar] [CrossRef]
- Yan, X.; Niu, Z. Reliability Evaluation and Migration of Wetland Samples. IEEE J. Sel. Top. Appl. Earth Obs. Remote Sens. 2021, 14, 8089–8099. [Google Scholar] [CrossRef]
- Chaudhary, R.K.; Puri, L.; Acharya, A.K.; Aryal, R.R. Wetland Mapping and Monitoring with Sentinel-1 and Sentinel-2 Data on the Google Earth Engine. J. For. Nat. Resour. Manag. 2023, 3, 1–21. [Google Scholar] [CrossRef]
- Eva, H.; Huber, O.; Achard, F.; Balslev, H.; Beck, S.; Behling, H.; Belward, A.; Beuchle, R.; Cleef, A.; Colchester, M.; et al. (Eds.) A Proposal for Defining the Geographical Boundaries of Amazonia; EUR 21808 EN; JRC68635; Office for Official Publications of the European Communities: Luxembourg, 2005; ISBN 92-79-00012-8. [Google Scholar]
- Infographic—RAISG. Available online: https://www.raisg.org/en/infographic/ (accessed on 26 March 2024).
- Brañas, M.; Fabiano, E.; Schulz, C.; Martín Brañas, M. Scotland’s Rural College Wetland Spirits and Indigenous Knowledge: Implications for the Conservation of Wetlands in the Peruvian Amazon Wetland Spirits and Indigenous Knowledge: Implications for the Conservation of Wetlands in the Peruvian Amazon. Curr. Res. Environ. Sustain. 2021, 3, 100107. [Google Scholar] [CrossRef]
- Legal Amazon|IBGE. Available online: https://www.ibge.gov.br/en/geosciences/maps/regional-maps/17927-legal-amazon.html?edicao=18047 (accessed on 26 March 2024).
- Bunting, P.; Rosenqvist, Å.; Hilarides, L.; Lucas, R.; Thomas, N.; Tadono, T.; Worthington, T.A.; Spalding, M.; Murray, N.; Rebelo, L. Global Mangrove Extent Change 1996–2020: Global Mangrove Watch Version 3.0. Remote Sens. 2022, 14, 3657. [Google Scholar] [CrossRef]
- Zanaga, D.; Van De Kerchove, R.; Daems, D.; De Keersmaecker, W.; Brockmann, C.; Kirches, G.; Wevers, J.; Cartus, O.; Santoro, M.; Fritz, S.; et al. ESA WorldCover 10 m 2021 V200. Zenodo 2021. [Google Scholar] [CrossRef]
- Mazur, E.; Sims, M.; Goldman, E.; Schneider, M.; Daldoss Pirri, M.; Beatty, C.R.; Stolle, F.; Stevenson, M. SBTN Natural Lands Map-Technical Documentation. 2024. Available online: https://sciencebasedtargetsnetwork.org/wp-content/uploads/2024/09/Technical-Guidance-2024-Step3-Land-v1-Natural-Lands-Map.pdf#page=7.10 (accessed on 22 July 2025).
- Zhang, X.; Liu, L.; Zhao, T.; Chen, X.; Lin, S.; Wang, J.; Jun, M.; Liu, W. GWL_FCS30: A Global 30 m Wetland Map with a Fine Classification System Using Multi-Sourced and Time-Series Remote Sensing Imagery in 2020. Earth Syst. Sci. Data 2023, 15, 265–293. [Google Scholar] [CrossRef]
- Murray, N.J.; Phinn, S.P.; Fuller, R.A.; DeWitt, M.; Ferrari, R.; Johnston, R.; Clinton, N.; Lyons, M.B. High-Resolution Global Maps of Tidal Flat Ecosystems from 1984 to 2019. Sci. Data 2022, 9, 542. [Google Scholar] [CrossRef]
- Worthington, T.A.; Spalding, M.; Landis, E.; Maxwell, T.L.; Navarro, A.; Smart, L.S.; Murray, N.J. The Distribution of Global Tidal Marshes from Earth Observation Data. Glob. Ecol. Biogeogr. 2024, 33, e13852. [Google Scholar] [CrossRef]
- Souza, C.M.; Marengo, J.; Ferreira, B.; Ribeiro, J.; Schirmbeck, L.W.; Schirmbeck, J.; Hirye, M.; Cunha, A.; Wiederhecker, H.C.; Latuf, M.O. Amazon Severe Drought in 2023 Triggered Surface Water Loss. Environ. Res. Clim. 2024, 3, 041002. [Google Scholar] [CrossRef]
- Pekel, J.F.; Cottam, A.; Gorelick, N.; Belward, A.S. High-Resolution Mapping of Global Surface Water and Its Long-Term Changes. Nature 2016, 540, 418–422. [Google Scholar] [CrossRef]
- Hess, L.L.; Melack, J.M.; Affonso, A.G.; Barbosa, C.; Gastil-Buhl, M.; Novo, E.M.L.M. Wetlands of the Lowland Amazon Basin: Extent, Vegetative Cover, and Dual-Season Inundated Area as Mapped with JERS-1 Synthetic Aperture Radar. Wetlands 2015, 35, 745–756. [Google Scholar] [CrossRef]
- Potapov, P.; Hansen, M.C.; Pickens, A.; Hernandez-Serna, A.; Tyukavina, A.; Turubanova, S.; Zalles, V.; Li, X.; Khan, A.; Stolle, F.; et al. The Global 2000–2020 Land Cover and Land Use Change Dataset Derived from the Landsat Archive: First Results. Front. Remote Sens. 2022, 3, 18. [Google Scholar] [CrossRef]
- Yury, E.; Cayo, T.; Borja, M.O.; Espinoza-Villar, R.; Moreno, N.; Camargo, R.; Almeida, C.; Hopfgartner, K.; Yarleque, C.; Souza, C.M. Mapping Three Decades of Changes in the Tropical Andean Glaciers Using Landsat Data Processed in the Earth Engine. Remote Sens. 2022, 14, 1974. [Google Scholar] [CrossRef]
- Tan, K.; Sun, D.; Dou, W.; Wang, B.; Sun, Q.; Liu, X.; Zhang, H.; Yang, L.; Lun, F. Mapping Coastal Wetlands and Their Dynamics in the Yellow River Delta over Last Three Decades: Based on a Spectral Endmember Space. Remote Sens. 2023, 15, 5003. [Google Scholar] [CrossRef]
- Shimada, M.; Itoh, T.; Motooka, T.; Watanabe, M.; Shiraishi, T.; Thapa, R.; Lucas, R. New Global Forest/Non-Forest Maps from ALOS PALSAR Data (2007–2010). Remote Sens. Env. 2014, 155, 13–31. [Google Scholar] [CrossRef]
- Adeli, S.; Salehi, B.; Mahdianpari, M.; Quackenbush, L.J.; Brisco, B.; Tamiminia, H.; Shaw, S.B. Wetland Monitoring Using SAR Data: A Meta-Analysis and Comprehensive Review. Remote Sens. 2020, 12, 2190. [Google Scholar] [CrossRef]
- FABDEM (Forest and Buildings Removed Copernicus 30m DEM)—Awesome-Gee-Community-Catalog. Available online: https://gee-community-catalog.org/projects/fabdem/#citation (accessed on 31 March 2025).
- Beven, K.J.; Kirkby, M.J. A Physically Based, Variable Contributing Area Model of Basin Hydrology/Un Modèle à Base Physique de Zone d’appel Variable de l’hydrologie Du Bassin Versant. Hydrol. Sci. J. 1979, 24, 43–69. [Google Scholar] [CrossRef]
- Lang, N.; Jetz, W.; Schindler, K.; Wegner, J.D. A High-Resolution Canopy Height Model of the Earth. Nat. Ecol. Evol. 2023, 7, 1778–1789. [Google Scholar] [CrossRef]
- Du, L.; McCarty, G.W.; Zhang, X.; Lang, M.; Vanderhoof, M.K.; Li, X.; Huang, C.; Lee, S.; Zou, Z. Mapping Forested Wetland Inundation in the Delmarva Peninsula, USA Using Deep Convolutional Neural Networks. Remote Sens. 2020, 12, 644. [Google Scholar] [CrossRef]
- Souza, C.M., Jr.; Roberts, D.A.; Cochrane, M.A. Combining Spectral and Spatial Information to Map Canopy Damage from Selective Logging and Forest Fires. Remote Sens. Environ. 2005, 98, 329–343. [Google Scholar] [CrossRef]
- Rennó, C.D.; Nobre, A.D.; Cuartas, L.A.; Soares, J.V.; Hodnett, M.G.; Tomasella, J.; Waterloo, M.J. HAND, a New Terrain Descriptor Using SRTM-DEM: Mapping Terra-Firme Rainforest Environments in Amazonia. Remote Sens. Environ. 2008, 112, 3469–3481. [Google Scholar] [CrossRef]
- Olofsson, P.; Foody, G.M.; Herold, M.; Stehman, S.V.; Woodcock, C.E.; Wulder, M.A. Good Practices for Estimating Area and Assessing Accuracy of Land Change. Remote Sens. Environ. 2014, 148, 42–57. [Google Scholar] [CrossRef]
- Funk, C.; Peterson, P.; Landsfeld, M.; Pedreros, D.; Verdin, J.; Shukla, S.; Husak, G.; Rowland, J.; Harrison, L.; Hoell, A.; et al. The Climate Hazards Infrared Precipitation with Stations—A New Environmental Record for Monitoring Extremes. Sci. Data 2015, 2, 150066. [Google Scholar] [CrossRef]
- Kingsford, R.T.; Bino, G.; Finlayson, C.M.; Falster, D.S.; Fitzsimons, J.; De, G.; Murray, N.J.; Grillas, P.; Gardner, R.H.; Regan, T.J.; et al. Ramsar Wetlands of International Importance–Improving Conservation Outcomes. Front. Environ. Sci. 2021, 9, 643367. [Google Scholar] [CrossRef]
- Adeleye, M.A.; Haberle, S.; Harris, S.; Connor, S.; Stevenson, J. Assessing Long-Term Ecological Changes in Wetlands of the Bass Strait Islands, Southeast Australia: Palaeoecological Insights and Management Implications. Wetlands 2021, 41, 88. [Google Scholar] [CrossRef]
- Sarkar, P.; Salami, M.F.; Githiora, Y.; Vieira, R.R.S.; Navarro, A.; Clavijo, D.; Padgurschi, M.C.G. A Conceptual Model to Understand the Drivers of Change in Tropical Wetlands: A Comparative Assessment in India and Brazil. Biota Neotrop. 2020, 20 (Suppl. S1), e20190913. [Google Scholar] [CrossRef]
- Caballero, J.; Messinger, M.; Román-Dañobeytia, F.; Ascorra, C.; Fernandez, L.E.; Silman, M.R. Deforestation and Forest Degradation Due to Gold Mining in the Peruvian Amazon: A 34-Year Perspective. Remote Sens. 2018, 10, 1903. [Google Scholar] [CrossRef]
- Borges, A.; Abril, G.; Darchambeau, F.; Teodoru, C.R.; Deborde, J.; Vidal, L.O.; Lambert, T.; Bouillon, S. Divergent Biophysical Controls of Aquatic CO2 and CH4 in the World’s Two Largest Rivers. Sci. Rep. 2015, 5, 15614. [Google Scholar] [CrossRef]
- Fearnside, P.M. Hydroelectric Dams in the Brazilian Amazon as Sources of ‘Greenhouse’ Gases. Environ. Conserv. 1995, 22, 7–19. [Google Scholar] [CrossRef]
- Sonter, L.J.; Herrera, D.; Barrett, D.J.; Galford, G.L.; Moran, C.J.; Soares-Filho, B.S. Mining Drives Extensive Deforestation in the Brazilian Amazon. Nat. Commun. 2017, 8, 1013. [Google Scholar] [CrossRef]
- Findlay, C.; Bourdages, J. Response Time of Wetland Biodiversity to Road Construction on Adjacent Lands. Conserv. Biol. 2000, 14, 86–94. [Google Scholar] [CrossRef]
- Marengo, J.A. Interdecadal Variability and Trends of Rainfall across the Amazon Basin. Theor. Appl. Clim. 2004, 78, 79–96. [Google Scholar] [CrossRef]
- Barros, D.F.; Albernaz, A.L.M. Possible Impacts of Climate Change on Wetlands and Its Biota in the Brazilian Amazon. Braz. J. Biol. 2014, 74, 810–820. [Google Scholar] [CrossRef]
- Nobre, C.A.; Sampaio, G.; Borma, L.S.; Castilla-Rubio, J.C.; Silva, J.S.; Cardoso, M. Land-Use and Climate Change Risks in the Amazon and the Need of a Novel Sustainable Development Paradigm. Proc. Natl. Acad. Sci. USA 2016, 113, 10759–10768. [Google Scholar] [CrossRef] [PubMed]
- Rammig, A.; Jupp, T.E.; Thonicke, K.; Tietjen, B.; Heinke, J.; Ostberg, S.; Lucht, W.; Crämer, W.; Cox, P.M. Estimating the Risk of Amazonian Forest Dieback. New Phytol. 2010, 187, 694–706. [Google Scholar] [CrossRef] [PubMed]
- Duffy, P.B.; Brando, P.M.; Asner, G.P.; Field, C.B. Projections of Future Meteorological Drought and Wet Periods in the Amazon. Proc. Natl. Acad. Sci. USA 2015, 112, 13172–13177. [Google Scholar] [CrossRef] [PubMed]
Disclaimer/Publisher’s Note: The statements, opinions and data contained in all publications are solely those of the individual author(s) and contributor(s) and not of MDPI and/or the editor(s). MDPI and/or the editor(s) disclaim responsibility for any injury to people or property resulting from any ideas, methods, instructions or products referred to in the content. |
© 2025 by the authors. Licensee MDPI, Basel, Switzerland. This article is an open access article distributed under the terms and conditions of the Creative Commons Attribution (CC BY) license (https://creativecommons.org/licenses/by/4.0/).

