Next Issue
Volume 10, February
Previous Issue
Volume 9, December
 
 
remotesensing-logo

Journal Browser

Journal Browser

Remote Sens., Volume 10, Issue 1 (January 2018) – 153 articles

Cover Story (view full-size image): 
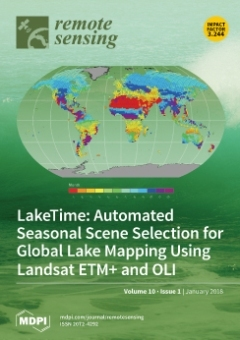
Advances in computing power and the increased availability of high-resolution remote sensing data products have made it possible to map lake surface area at the global scale and monitor changes over time. However, because lake surface area changes seasonally, we must use images acquired from a consistent season in order to isolate long-term changes. At the global scale, this means identifying the hydrological season independently at each location. The LakeTime algorithm uses global hydrological data and a simple water balance model to identify a consistent, ideal lake mapping time for each Landsat tile (Cover Image). When combined with the Landsat archive, we are able to provide nearly complete, seasonally consistent, global coverage for circa 2000 Landsat Enhanced Thematic Mapper Plus (ETM+) and circa 2014 Landsat Operational Land Imager (OLI) imagery. View this paper
  • Issues are regarded as officially published after their release is announced to the table of contents alert mailing list.
  • You may sign up for e-mail alerts to receive table of contents of newly released issues.
  • PDF is the official format for papers published in both, html and pdf forms. To view the papers in pdf format, click on the "PDF Full-text" link, and use the free Adobe Reader to open them.
Order results
Result details
Section
Select all
Export citation of selected articles as:

Editorial

Jump to: Research, Review, Other

44 pages, 318 KiB  
Editorial
Acknowledgement to Reviewers of Remote Sensing in 2017
by Remote Sensing Editorial Office
Remote Sens. 2018, 10(1), 102; https://doi.org/10.3390/rs10010102 - 12 Jan 2018
Viewed by 6577
Abstract
Peer review is an essential part in the publication process, ensuring that Remote Sensing maintains high quality standards for its published papers.[...] Full article

Research

Jump to: Editorial, Review, Other

20 pages, 3286 KiB  
Article
Geospatial Computer Vision Based on Multi-Modal Data—How Valuable Is Shape Information for the Extraction of Semantic Information?
by Martin Weinmann and Michael Weinmann
Remote Sens. 2018, 10(1), 2; https://doi.org/10.3390/rs10010002 - 21 Dec 2017
Cited by 27 | Viewed by 7194
Abstract
In this paper, we investigate the value of different modalities and their combination for the analysis of geospatial data of low spatial resolution. For this purpose, we present a framework that allows for the enrichment of geospatial data with additional semantics based on [...] Read more.
In this paper, we investigate the value of different modalities and their combination for the analysis of geospatial data of low spatial resolution. For this purpose, we present a framework that allows for the enrichment of geospatial data with additional semantics based on given color information, hyperspectral information, and shape information. While the different types of information are used to define a variety of features, classification based on these features is performed using a random forest classifier. To draw conclusions about the relevance of different modalities and their combination for scene analysis, we present and discuss results which have been achieved with our framework on the MUUFL Gulfport Hyperspectral and LiDAR Airborne Data Set. Full article
Show Figures

Graphical abstract

28 pages, 12114 KiB  
Article
Time-Continuous Hemispherical Urban Surface Temperatures
by Michael A. Allen, James A. Voogt and Andreas Christen
Remote Sens. 2018, 10(1), 3; https://doi.org/10.3390/rs10010003 - 21 Dec 2017
Cited by 11 | Viewed by 6211
Abstract
Traditional methods for remote sensing of urban surface temperatures (Tsurf) are subject to a suite of temporal and geometric biases. The effect of these biases on our ability to characterize the true geometric and temporal nature of urban Tsurf is [...] Read more.
Traditional methods for remote sensing of urban surface temperatures (Tsurf) are subject to a suite of temporal and geometric biases. The effect of these biases on our ability to characterize the true geometric and temporal nature of urban Tsurf is currently unknown, but is certainly nontrivial. To quantify and overcome these biases, we present a method to retrieve time-continuous hemispherical radiometric urban Tsurf (Them, r) from broadband upwelling longwave radiation measured via pyrgeometer. By sampling the surface hemispherically, this measure is postulated to be more representative of the complex, three-dimensional structure of the urban surface than those from traditional remote sensors that usually have a narrow nadir or oblique viewing angle. The method uses a sensor view model in conjunction with a radiative transfer code to correct for atmospheric effects in three-dimensions using in situ profiles of air temperature and humidity along with information about surface structure. A practical parameterization is also included. Using the method, an eight-month climatology of Them, r is retrieved for Basel, Switzerland. Results show the importance of a robust, geometrically representative atmospheric correction routine to remove confounding atmospheric effects and to foster inter-site, inter-method, and inter-instrument comparison. In addition, over a month-long summertime intensive observation period, Them, r was compared to Tsurf retrieved from nadir (Tplan) and complete (Tcomp) perspectives of the surface. Large differences were observed between Tcomp, Them, r, and Tplan, with differences between Tplan and Tcomp of up to 8 K under clear-sky viewing conditions, which are the cases when satellite-based observations are available. In general, Them, r provides a better approximation to Tcomp than Tplan, particularly under clear-sky conditions. The magnitude of differences in remote sensed Tsurf based on sensor-surface-sun geometry varies significantly based on time of day and synoptic conditions and prompts further investigation of methodological and instrument bias in remote sensed urban surface temperature records. Full article
(This article belongs to the Special Issue Remote Sensing for 3D Urban Morphology)
Show Figures

Graphical abstract

12 pages, 10061 KiB  
Article
The Impact of Precipitation Deficit and Urbanization on Variations in Water Storage in the Beijing-Tianjin-Hebei Urban Agglomeration
by Zheng Chen, Weiguo Jiang, Wenjie Wang, Yue Deng, Bin He and Kai Jia
Remote Sens. 2018, 10(1), 4; https://doi.org/10.3390/rs10010004 - 22 Dec 2017
Cited by 30 | Viewed by 5843
Abstract
Depletion of water resources has threatened water security in the Beijing-Tianjin-Hebei urban agglomeration, China. However, the relative importance of precipitation and urbanization to water storage change has not been sufficiently studied. In this study, both terrestrial water storage (TWS) and groundwater storage (GWS) [...] Read more.
Depletion of water resources has threatened water security in the Beijing-Tianjin-Hebei urban agglomeration, China. However, the relative importance of precipitation and urbanization to water storage change has not been sufficiently studied. In this study, both terrestrial water storage (TWS) and groundwater storage (GWS) change in Jing-Jin-Ji from 1979 to the 2010s were investigated, based on the global land data assimilation system (GLDAS) and the EartH2Observe (E2O) outputs, and we used a night light index as an index of urbanization. The results showed that TWS anomaly varied in three stages: significant increase from 1981 to 1996, rapid decrease from 1996 to 2002 and increase from 2002 to the 2010s. Simultaneously, GWS has decreased with about 41.5 cm (500% of GWS in 1979). Both urbanization and precipitation change influenced urban water resource variability. Urbanization was a relatively important factor to the depletion of TWS (explains 83%) and GWS (explains 94%) since the 1980s and the precipitation deficit explains 72% and 64% of TWS and GWS variabilities. It indicates that urbanization coupled with precipitation deficit has been a more important factor that impacted depletion of both TWS and GWS than climate change only, in the Jing-Jin-Ji region. Moreover, we suggested that the cumulative effect should be considered when discussing the relationship between influence factors and water storage change. Full article
Show Figures

Graphical abstract

18 pages, 6814 KiB  
Article
The Impact of Lidar Elevation Uncertainty on Mapping Intertidal Habitats on Barrier Islands
by Nicholas M. Enwright, Lei Wang, Sinéad M. Borchert, Richard H. Day, Laura C. Feher and Michael J. Osland
Remote Sens. 2018, 10(1), 5; https://doi.org/10.3390/rs10010005 - 21 Dec 2017
Cited by 26 | Viewed by 8866
Abstract
While airborne lidar data have revolutionized the spatial resolution that elevations can be realized, data limitations are often magnified in coastal settings. Researchers have found that airborne lidar can have a vertical error as high as 60 cm in densely vegetated intertidal areas. [...] Read more.
While airborne lidar data have revolutionized the spatial resolution that elevations can be realized, data limitations are often magnified in coastal settings. Researchers have found that airborne lidar can have a vertical error as high as 60 cm in densely vegetated intertidal areas. The uncertainty of digital elevation models is often left unaddressed; however, in low-relief environments, such as barrier islands, centimeter differences in elevation can affect exposure to physically demanding abiotic conditions, which greatly influence ecosystem structure and function. In this study, we used airborne lidar elevation data, in situ elevation observations, lidar metadata, and tide gauge information to delineate low-lying lands and the intertidal wetlands on Dauphin Island, a barrier island along the coast of Alabama, USA. We compared three different elevation error treatments, which included leaving error untreated and treatments that used Monte Carlo simulations to incorporate elevation vertical uncertainty using general information from lidar metadata and site-specific Real-Time Kinematic Global Position System data, respectively. To aid researchers in instances where limited information is available for error propagation, we conducted a sensitivity test to assess the effect of minor changes to error and bias. Treatment of error with site-specific observations produced the fewest omission errors, although the treatment using the lidar metadata had the most well-balanced results. The percent coverage of intertidal wetlands was increased by up to 80% when treating the vertical error of the digital elevation models. Based on the results from the sensitivity analysis, it could be reasonable to use error and positive bias values from literature for similar environments, conditions, and lidar acquisition characteristics in the event that collection of site-specific data is not feasible and information in the lidar metadata is insufficient. The methodology presented in this study should increase efficiency and enhance results for habitat mapping and analyses in dynamic, low-relief coastal environments. Full article
(This article belongs to the Special Issue Uncertainty in Remote Sensing Image Analysis)
Show Figures

Graphical abstract

20 pages, 3203 KiB  
Article
Big Data Integration in Remote Sensing across a Distributed Metadata-Based Spatial Infrastructure
by Junqing Fan, Jining Yan, Yan Ma and Lizhe Wang
Remote Sens. 2018, 10(1), 7; https://doi.org/10.3390/rs10010007 - 21 Dec 2017
Cited by 42 | Viewed by 7942
Abstract
Since Landsat-1 first started to deliver volumes of pixels in 1972, the volumes of archived data in remote sensing data centers have increased continuously. Due to various satellite orbit parameters and the specifications of different sensors, the storage formats, projections, spatial resolutions, and [...] Read more.
Since Landsat-1 first started to deliver volumes of pixels in 1972, the volumes of archived data in remote sensing data centers have increased continuously. Due to various satellite orbit parameters and the specifications of different sensors, the storage formats, projections, spatial resolutions, and revisit periods of these archived data are vastly different. In addition, the remote sensing data received continuously by each data center arrives at a faster code rate; it is best to ingest and archive the newly received data to ensure users have access to the latest data retrieval and distribution services. Hence, an excellent data integration, organization, and management program is urgently needed. However, the multi-source, massive, heterogeneous, and distributed storage features of remote sensing data have not only caused difficulties for integration across distributed data center spatial infrastructures, but have also resulted in the current modes of data organization and management being unable meet the rapid retrieval and access requirements of users. Hence, this paper proposes an object-oriented data technology (OODT) and SolrCloud-based remote sensing data integration and management framework across a distributed data center spatial infrastructure. In this framework, all of the remote sensing metadata in the distributed sub-centers are transformed into the International Standardization Organization (ISO) 19115-based unified format, and then ingested and transferred to the main center by OODT components, continuously or at regular intervals. In the main data center, in order to improve the efficiency of massive data retrieval, we proposed a logical segmentation indexing (LSI) model-based data organization approach, and took SolrCloud to realize the distributed index and retrieval of massive metadata. Finally, a series of distributed data integration, retrieval, and comparative experiments showed that our proposed distributed data integration and management program is effective and promises superior results. Specifically, the LSI model-based data organization and the SolrCloud-based distributed indexing schema was able to effectively improve the efficiency of massive data retrieval. Full article
Show Figures

Graphical abstract

22 pages, 5754 KiB  
Article
Cross-Domain Ground-Based Cloud Classification Based on Transfer of Local Features and Discriminative Metric Learning
by Zhong Zhang, Donghong Li, Shuang Liu, Baihua Xiao and Xiaozhong Cao
Remote Sens. 2018, 10(1), 8; https://doi.org/10.3390/rs10010008 - 21 Dec 2017
Cited by 29 | Viewed by 3801
Abstract
Cross-domain ground-based cloud classification is a challenging issue as the appearance of cloud images from different cloud databases possesses extreme variations. Two fundamental problems which are essential for cross-domain ground-based cloud classification are feature representation and similarity measurement. In this paper, we propose [...] Read more.
Cross-domain ground-based cloud classification is a challenging issue as the appearance of cloud images from different cloud databases possesses extreme variations. Two fundamental problems which are essential for cross-domain ground-based cloud classification are feature representation and similarity measurement. In this paper, we propose an effective feature representation called transfer of local features (TLF), and measurement method called discriminative metric learning (DML). The TLF is a generalized representation framework that can integrate various kinds of local features, e.g., local binary patterns (LBP), local ternary patterns (LTP) and completed LBP (CLBP). In order to handle domain shift, such as variations of illumination, image resolution, capturing location, occlusion and so on, the TLF mines the maximum response in regions to make a stable representation for domain variations. We also propose to learn a discriminant metric, simultaneously. We make use of sample pairs and the relationship among cloud classes to learn the distance metric. Furthermore, in order to improve the practicability of the proposed method, we replace the original cloud images with the convolutional activation maps which are then applied to TLF and DML. The proposed method has been validated on three cloud databases which are collected in China alone, provided by Chinese Academy of Meteorological Sciences (CAMS), Meteorological Observation Centre (MOC), and Institute of Atmospheric Physics (IAP). The classification accuracies outperform the state-of-the-art methods. Full article
(This article belongs to the Section Remote Sensing Image Processing)
Show Figures

Figure 1

19 pages, 9511 KiB  
Article
The Role of Resolution in the Estimation of Fractal Dimension Maps From SAR Data
by Gerardo Di Martino, Antonio Iodice, Daniele Riccio, Giuseppe Ruello and Ivana Zinno
Remote Sens. 2018, 10(1), 9; https://doi.org/10.3390/rs10010009 - 22 Dec 2017
Cited by 9 | Viewed by 4866
Abstract
This work is aimed at investigating the role of resolution in fractal dimension map estimation, analyzing the role of the different surface spatial scales involved in the considered estimation process. The study is performed using a data set of actual Cosmo/SkyMed Synthetic Aperture [...] Read more.
This work is aimed at investigating the role of resolution in fractal dimension map estimation, analyzing the role of the different surface spatial scales involved in the considered estimation process. The study is performed using a data set of actual Cosmo/SkyMed Synthetic Aperture Radar (SAR) images relevant to two different areas, the region of Bidi in Burkina Faso and the city of Naples in Italy, acquired in stripmap and enhanced spotlight modes. The behavior of fractal dimension maps in the presence of areas with distinctive characteristics from the viewpoint of land-cover and surface features is discussed. Significant differences among the estimated maps are obtained in the presence of fine textural details, which significantly affect the fractal dimension estimation for the higher resolution spotlight images. The obtained results show that if we are interested in obtaining a reliable estimate of the fractal dimension of the observed natural scene, stripmap images should be chosen in view of both economic and computational considerations. In turn, the combination of fractal dimension maps obtained from stripmap and spotlight images can be used to identify areas on the scene presenting non-fractal behavior (e.g., urban areas). Along this guideline, a simple example of stripmap-spotlight data fusion is also presented. Full article
(This article belongs to the Special Issue Advances in SAR: Sensors, Methodologies, and Applications)
Show Figures

Graphical abstract

18 pages, 4709 KiB  
Article
Impact of Error in Lidar-Derived Canopy Height and Canopy Base Height on Modeled Wildfire Behavior in the Sierra Nevada, California, USA
by Maggi Kelly, Yanjun Su, Stefania Di Tommaso, Danny L. Fry, Brandon M. Collins, Scott L. Stephens and Qinghua Guo
Remote Sens. 2018, 10(1), 10; https://doi.org/10.3390/rs10010010 - 22 Dec 2017
Cited by 28 | Viewed by 5848
Abstract
Light detection and ranging (Lidar) data can be used to create wall-to-wall forest structure and fuel products that are required for wildfire behavior simulation models. We know that Lidar-derived forest parameters have a non-negligible error associated with them, yet we do not know [...] Read more.
Light detection and ranging (Lidar) data can be used to create wall-to-wall forest structure and fuel products that are required for wildfire behavior simulation models. We know that Lidar-derived forest parameters have a non-negligible error associated with them, yet we do not know how this error influences the results of fire behavior modeling that use these layers as inputs. Here, we evaluated the influence of error associated with two Lidar data products—canopy height (CH) and canopy base height (CBH)—on simulated fire behavior in a case study in the Sierra Nevada, California, USA. We used a Monte Carlo simulation approach with expected randomized error added to each model input. Model 1 used the original, unmodified data, Model 2 incorporated error in the CH layer, and Model 3 incorporated error in the CBH layer. This sensitivity analysis showed that error in CH and CBH did not greatly influence the modeled conditional burn probability, fire size, or fire size distribution. We found that the expected error associated with CH and CBH did not greatly influence modeled results: conditional burn probability, fire size, and fire size distributions were very similar between Model 1 (original data), Model 2 (error added to CH), and Model 3 (error added to CBH). However, the impact of introduced error was more pronounced with CBH than with CH, and at lower canopy heights, the addition of error increased modeled canopy burn probability. Our work suggests that the use of Lidar data, even with its inherent error, can contribute to reliable and robust estimates of modeled forest fire behavior, and forest managers should be confident in using Lidar data products in their fire behavior modeling workflow. Full article
(This article belongs to the Section Forest Remote Sensing)
Show Figures

Graphical abstract

22 pages, 29098 KiB  
Article
Automated Sensing of Wave Inundation across a Rocky Shore Platform Using a Low-Cost Camera System
by Hannah E. Power, Michael A. Kinsela, Caio E. Stringari, Murray J. Kendall, Bradley D. Morris and David J. Hanslow
Remote Sens. 2018, 10(1), 11; https://doi.org/10.3390/rs10010011 - 23 Dec 2017
Cited by 12 | Viewed by 6500
Abstract
Rocky coastlines are frequently used for recreation, however, they are often highly exposed and hazardous environments resulting in high risk to visitors. Traditional approaches to managing human safety in coastal settings (such as the surf lifesaving clubs that have proven effective on beaches) [...] Read more.
Rocky coastlines are frequently used for recreation, however, they are often highly exposed and hazardous environments resulting in high risk to visitors. Traditional approaches to managing human safety in coastal settings (such as the surf lifesaving clubs that have proven effective on beaches) are not necessarily transferable to rock platforms due to their often remote and fragmented distribution and the different recreational uses. As such, a different approach is required. To address this, we present a low-cost camera system to assess the wave hazard on a high-visitation rocky shore platform: the Figure Eight Pools Rock Platform, New South Wales, Australia. The camera system is shown to be highly effective and allows identification of both the distance and frequency of wave inundation on the platform using a novel pixel analysis technique. Nearshore wave height is shown to be the primary factor driving inundation frequencies along the cross-platform transect investigated with some influence from wave period. The remotely sensed camera data are used to develop a preliminary overwash hazard rating system, and analysis of the first month of data collected suggests that the platform is highly hazardous to visitors. Future work will expand this hazard rating system, developing a predictive tool that estimates the overwash hazard level based on forecast wave and tide conditions to improve visitor safety at the site. Full article
(This article belongs to the Special Issue Instruments and Methods for Ocean Observation and Monitoring)
Show Figures

Figure 1

19 pages, 12474 KiB  
Article
Estimation of Soil Moisture Index Using Multi-Temporal Sentinel-1 Images over Poyang Lake Ungauged Zone
by Yufang Zhang, Jianya Gong, Kun Sun, Jianmin Yin and Xiaoling Chen
Remote Sens. 2018, 10(1), 12; https://doi.org/10.3390/rs10010012 - 22 Dec 2017
Cited by 29 | Viewed by 8888
Abstract
The C-band radar instruments onboard the two-satellite GMES Sentinel-1 constellation provide global measurements with short revisit time (about six days) and medium spatial resolution (5 × 20 m), which are appropriate for watershed scale hydrological applications. This paper aims to explore the potential [...] Read more.
The C-band radar instruments onboard the two-satellite GMES Sentinel-1 constellation provide global measurements with short revisit time (about six days) and medium spatial resolution (5 × 20 m), which are appropriate for watershed scale hydrological applications. This paper aims to explore the potential of Sentinel-1 for estimating surface soil moisture using a multi-temporal approach. To this end, a linear mixed effects (LME) model was developed over Poyang Lake ungauged zone, using time series Sentinel 1A and 1B images and soil moisture ground measurements from 15 automatic observation sites. The model assumed a linear relationship that varied with both time and space between soil moisture and backscattering coefficient (SM- σ 0 ). Results showed that three LME models developed with different polarized σ 0 images all meet the European Space Agency (ESA) accuracy requirement for GMES soil moisture product (≤5% in volume), with the vertical transmit and vertical receive (VV) polarized model achieving the best performance. However, the SM- σ 0 relationship was found to depend strongly on space, making it difficult to predict absolute soil moisture for each grid. Therefore, a relative soil moisture index was then proposed to correct for site effect. When compared with those of the linear fixed effects model, the soil moisture indices predicted by the LME model captured the temporal dynamics of measured soil moisture better, with the overall R2 and cross-validated R2 being 0.68 and 0.64, respectively. These results indicate that the LME model can be effectively applied to estimate soil moisture from multi-temporal Sentinel-1 images, which is useful for monitoring flood and drought disasters, and for improving stream flow prediction over ungauged zones. Full article
(This article belongs to the Special Issue Retrieval, Validation and Application of Satellite Soil Moisture Data)
Show Figures

Graphical abstract

14 pages, 11092 KiB  
Article
Estimating Tree Height and Diameter at Breast Height (DBH) from Digital Surface Models and Orthophotos Obtained with an Unmanned Aerial System for a Japanese Cypress (Chamaecyparis obtusa) Forest
by Kotaro Iizuka, Taichiro Yonehara, Masayuki Itoh and Yoshiko Kosugi
Remote Sens. 2018, 10(1), 13; https://doi.org/10.3390/rs10010013 - 22 Dec 2017
Cited by 128 | Viewed by 16727
Abstract
Methods for accurately measuring biophysical parameters are a key component for quantitative evaluation regarding to various forest applications. Conventional in situ measurements of these parameters take time and expense, encountering difficultness at locations with heterogeneous microtopography. To obtain precise biophysical data in such [...] Read more.
Methods for accurately measuring biophysical parameters are a key component for quantitative evaluation regarding to various forest applications. Conventional in situ measurements of these parameters take time and expense, encountering difficultness at locations with heterogeneous microtopography. To obtain precise biophysical data in such situations, we deployed an unmanned aerial system (UAS) multirotor drone in a cypress forest in a mountainous area of Japan. The structure from motion (SfM) method was used to construct a three-dimensional (3D) model of the forest (tree) structures from aerial photos. Tree height was estimated from the 3D model and compared to in situ ground data. We also analyzed the relationships between a biophysical parameter, diameter at breast height (DBH), of individual trees with canopy width and area measured from orthorectified images. Despite the constraints of ground exposure in a highly dense forest area, tree height was estimated at an accuracy of root mean square error = 1.712 m for observed tree heights ranging from 16 to 24 m. DBH was highly correlated with canopy width (R2 = 0.7786) and canopy area (R2 = 0.7923), where DBH ranged from 11 to 58 cm. The results of estimating forest parameters indicate that drone-based remote-sensing methods can be utilized to accurately analyze the spatial extent of forest structures. Full article
(This article belongs to the Special Issue Advances in Remote Sensing of Forest Structure and Applications)
Show Figures

Figure 1

18 pages, 4799 KiB  
Article
Monitoring Bare Soil Freeze–Thaw Process Using GPS-Interferometric Reflectometry: Simulation and Validation
by Xuerui Wu, Shuanggen Jin and Liang Chang
Remote Sens. 2018, 10(1), 14; https://doi.org/10.3390/rs10010014 - 22 Dec 2017
Cited by 22 | Viewed by 5399
Abstract
Frozen soil and permafrost affect ecosystem diversity and productivity as well as global energy and water cycles. Although some space-based Radar techniques or ground-based sensors can monitor frozen soil and permafrost variations, there are some shortcomings and challenges. For the first time, we [...] Read more.
Frozen soil and permafrost affect ecosystem diversity and productivity as well as global energy and water cycles. Although some space-based Radar techniques or ground-based sensors can monitor frozen soil and permafrost variations, there are some shortcomings and challenges. For the first time, we use GPS-Interferometric Reflectometry (GPS-IR) to monitor and investigate the bare soil freeze–thaw process as a new remote sensing tool. The mixed-texture permittivity models are employed to calculate the frozen and thawed soil permittivities. When the soil freeze/thaw process occurs, there is an abrupt change in the soil permittivity, which will result in soil scattering variations. The corresponding theoretical simulation results from the forward GPS multipath simulator show variations of GPS multipath observables. As for the in-situ measurements, virtual bistatic radar is employed to simplify the analysis. Within the GPS-IR spatial resolution, one SNOTEL site (ID 958) and one corresponding PBO (plate boundary observatory) GPS site (AB33) are used for analysis. In 2011, two representative days (frozen soil on Doy of Year (DOY) 318 and thawed soil on DOY 322) show the SNR changes of phase and amplitude. The GPS site and the corresponding SNOTEL site in four different years are analyzed for comparisons. When the soil freeze/thaw process occurred and no confounding snow depth and soil moisture effects existed, it exhibited a good absolute correlation (|R| = 0.72 in 2009, |R| = 0.902 in 2012, |R| = 0.646 in 2013, and |R| = 0.7017 in 2014) with the average detrended SNR data. Our theoretical simulation and experimental results demonstrate that GPS-IR has potential for monitoring the bare soil temperature during the soil freeze–thaw process, while more test works should be done in the future. GNSS-R polarimetry is also discussed as an option for detection. More retrieval work about elevation and polarization combinations are the focus of future development. Full article
Show Figures

Graphical abstract

18 pages, 3216 KiB  
Article
Diverse Responses of Vegetation Phenology to Climate Change in Different Grasslands in Inner Mongolia during 2000–2016
by Shilong Ren, Shuhua Yi, Matthias Peichl and Xiaoyun Wang
Remote Sens. 2018, 10(1), 17; https://doi.org/10.3390/rs10010017 - 22 Dec 2017
Cited by 94 | Viewed by 7510
Abstract
Vegetation phenology in temperate grasslands is highly sensitive to climate change. However, it is still unclear how the timing of vegetation phenology events (especially for autumn phenology) is altered in response to climate change across different grassland types. In this study, we investigated [...] Read more.
Vegetation phenology in temperate grasslands is highly sensitive to climate change. However, it is still unclear how the timing of vegetation phenology events (especially for autumn phenology) is altered in response to climate change across different grassland types. In this study, we investigated variations of the growing season start (SOS) and end (EOS), derived from Moderate Resolution Imaging Spectroradiometer (MODIS) data (2000–2016), for meadow steppe, typical steppe, and desert steppe in the Inner Mongolian grassland of Northern China. Using gridded climate data (2000–2015), we further analyzed correlations between SOS/EOS and pre-season average air temperature and total precipitation (defined as 90-day period prior to SOS/EOS, i.e., pre-SOS/EOS) in each grid. The results showed that both SOS and EOS occurred later in desert steppe (day of year (doy) 114 and 312) than in meadow steppe (doy 109 and 305) and typical steppe (doy 111 and 307); namely, desert steppe has a relatively late growing season than meadow steppe and typical steppe. For all three grasslands, SOS was mainly controlled by pre-SOS precipitation with the sensitivity being largest in desert steppe. EOS was closely connected with pre-EOS air temperature in meadow steppe and typical steppe, but more closely related to pre-EOS precipitation in desert steppe. During 2000–2015, SOS in typical steppe and desert steppe has significantly advanced by 2.2 days and 10.6 days due to a significant increase of pre-SOS precipitation. In addition, EOS of desert steppe has also significantly advanced by 6.8 days, likely as a result from the combined effects of elevated preseason temperature and precipitation. Our study highlights the diverse responses in the timing of spring and autumn phenology to preceding temperature and precipitation in different grassland types. Results from this study can help to guide grazing systems and to develop policy frameworks for grasslands protection. Full article
(This article belongs to the Special Issue Land Surface Phenology )
Show Figures

Graphical abstract

19 pages, 2935 KiB  
Article
Remote Sensing of Coral Bleaching Using Temperature and Light: Progress towards an Operational Algorithm
by William Skirving, Susana Enríquez, John D. Hedley, Sophie Dove, C. Mark Eakin, Robert A. B. Mason, Jacqueline L. De La Cour, Gang Liu, Ove Hoegh-Guldberg, Alan E. Strong, Peter J. Mumby and Roberto Iglesias-Prieto
Remote Sens. 2018, 10(1), 18; https://doi.org/10.3390/rs10010018 - 22 Dec 2017
Cited by 65 | Viewed by 11599
Abstract
The National Oceanic and Atmospheric Administration’s Coral Reef Watch program developed and operates several global satellite products to monitor bleaching-level heat stress. While these products have a proven ability to predict the onset of most mass coral bleaching events, they occasionally miss events; [...] Read more.
The National Oceanic and Atmospheric Administration’s Coral Reef Watch program developed and operates several global satellite products to monitor bleaching-level heat stress. While these products have a proven ability to predict the onset of most mass coral bleaching events, they occasionally miss events; inaccurately predict the severity of some mass coral bleaching events; or report false alarms. These products are based solely on temperature and yet coral bleaching is known to result from both temperature and light stress. This study presents a novel methodology (still under development), which combines temperature and light into a single measure of stress to predict the onset and severity of mass coral bleaching. We describe here the biological basis of the Light Stress Damage (LSD) algorithm under development. Then by using empirical relationships derived in separate experiments conducted in mesocosm facilities in the Mexican Caribbean we parameterize the LSD algorithm and demonstrate that it is able to describe three past bleaching events from the Great Barrier Reef (GBR). For this limited example, the LSD algorithm was able to better predict differences in the severity of the three past GBR bleaching events, quantifying the contribution of light to reduce or exacerbate the impact of heat stress. The new Light Stress Damage algorithm we present here is potentially a significant step forward in the evolution of satellite-based bleaching products. Full article
(This article belongs to the Special Issue Sea Surface Temperature Retrievals from Remote Sensing)
Show Figures

Graphical abstract

14 pages, 3230 KiB  
Article
An Approach to Improve the Positioning Performance of GPS/INS/UWB Integrated System with Two-Step Filter
by Zengke Li, Ren Wang, Jingxiang Gao and Jian Wang
Remote Sens. 2018, 10(1), 19; https://doi.org/10.3390/rs10010019 - 23 Dec 2017
Cited by 52 | Viewed by 6354
Abstract
The integration of Inertial Navigation System (INS) and Global Positioning System (GPS) single-point-positioning (SPP) mode cannot meet the requirements of high-accuracy navigation. Range observation through ultra-wideband (UWB) is an effective means to enhance the reliability and accuracy of GPS/INS integrated navigation, particularly in [...] Read more.
The integration of Inertial Navigation System (INS) and Global Positioning System (GPS) single-point-positioning (SPP) mode cannot meet the requirements of high-accuracy navigation. Range observation through ultra-wideband (UWB) is an effective means to enhance the reliability and accuracy of GPS/INS integrated navigation, particularly in environments where GPS availability is poor. Because it is difficult for UWB signal to achieve large-scale intervention coverage, an enhanced GPS/INS/UWB integrated scheme with positioning error correction is proposed to improve the position accuracy in the UWB signal outage scenario. The position difference between the GPS/INS integrated solution and the GPS/INS/UWB integrated solution is predicated as the error correction for GPS/INS/UWB integrated navigation in a UWB signal challenging environment. Position correction information in the north and east directions is input to the two-step filter to decrease the error of GPS/INS integrated navigation in single-point-positioning. In order to validate the proposed method, a real experiment is conducted. The results indicate that the enhanced GPS/INS/UWB integrated scheme with positioning error correction is able to improve the position accuracy of GPS/INS/UWB integrated navigation when UWB signal is unavailable. Full article
Show Figures

Graphical abstract

12 pages, 2239 KiB  
Article
The VIS/NIR Land and Snow BRDF Atlas for RTTOV: Comparison between MODIS MCD43C1 C5 and C6
by Jérôme Vidot, Pascal Brunel, Marie Dumont, Carlo Carmagnola and James Hocking
Remote Sens. 2018, 10(1), 21; https://doi.org/10.3390/rs10010021 - 23 Dec 2017
Cited by 8 | Viewed by 5529
Abstract
A monthly mean land and snow Bidirectional Reflectance Distribution Function (BRDF) atlas for visible and near infrared parts of the spectrum has been developed for Radiative Transfer for Television Infrared Observation Satellite (TIROS) Operational Vertical sounder (TOVS) (RTTOV). The atlas follows the methodology [...] Read more.
A monthly mean land and snow Bidirectional Reflectance Distribution Function (BRDF) atlas for visible and near infrared parts of the spectrum has been developed for Radiative Transfer for Television Infrared Observation Satellite (TIROS) Operational Vertical sounder (TOVS) (RTTOV). The atlas follows the methodology of the RTTOV University of Wisconsin infrared land surface emissivity (UWIREMIS) atlas, i.e., it combines satellite retrievals and a principal component analysis on a dataset of hyper-spectral surface hemispherical reflectance or albedo. The current version of the BRDF atlas is based on the Collection 5 of the Moderate Resolution Imaging (MODIS) MCD43C1 Climate Modeling Grid BRDF kernel-driven model parameters product. The MCD43C1 product combines both Terra and Aqua satellites over a 16-day period of acquisition and is provided globally at 0.05° of spatial resolution. We have improved the RTTOV land surface BRDF atlas by using the last Collection 6 of MODIS product MCD43C1. We firstly found that the MODIS C6 product improved the quality index of the BRDF model as compared with that of C5. When compared with clear-sky top of atmosphere (TOA) reflectance of Spinning Enhanced Visible and InfraRed Imagers (SEVIRI) solar channels over snow-free land surfaces, we showed that the reflectances are simulated with an absolute accuracy of 3% to 5% (i.e., 0.03–0.05 in reflectance units) when either the satellite zenith angle or the solar zenith angle is below 70°, regardless of the MODIS collection. For snow-covered surfaces, we showed that the comparison with in situ snow spectral albedo is improved with C6 with an underestimation of 0.05 in the near infrared. Full article
Show Figures

Graphical abstract

20 pages, 2417 KiB  
Article
Application of Coupled-Wave Wentzel-Kramers-Brillouin Approximation to Ground Penetrating Radar
by Igor Prokopovich, Alexei Popov, Lara Pajewski and Marian Marciniak
Remote Sens. 2018, 10(1), 22; https://doi.org/10.3390/rs10010022 - 23 Dec 2017
Cited by 19 | Viewed by 5648
Abstract
This paper deals with bistatic subsurface probing of a horizontally layered dielectric half-space by means of ultra-wideband electromagnetic waves. In particular, the main objective of this work is to present a new method for the solution of the two-dimensional back-scattering problem arising when [...] Read more.
This paper deals with bistatic subsurface probing of a horizontally layered dielectric half-space by means of ultra-wideband electromagnetic waves. In particular, the main objective of this work is to present a new method for the solution of the two-dimensional back-scattering problem arising when a pulsed electromagnetic signal impinges on a non-uniform dielectric half-space; this scenario is of interest for ground penetrating radar (GPR) applications. For the analytical description of the signal generated by the interaction of the emitted pulse with the environment, we developed and implemented a novel time-domain version of the coupled-wave Wentzel-Kramers-Brillouin approximation. We compared our solution with finite-difference time-domain (FDTD) results, achieving a very good agreement. We then applied the proposed technique to two case studies: in particular, our method was employed for the post-processing of experimental radargrams collected on Lake Chebarkul, in Russia, and for the simulation of GPR probing of the Moon surface, to detect smooth gradients of the dielectric permittivity in lunar regolith. The main conclusions resulting from our study are that our semi-analytical method is accurate, radically accelerates calculations compared to simpler mathematical formulations with a mostly numerical nature (such as the FDTD technique), and can be effectively used to aid the interpretation of GPR data. The method is capable to correctly predict the protracted return signals originated by smooth transition layers of the subsurface dielectric medium. The accuracy and numerical efficiency of our computational approach make promising its further development. Full article
(This article belongs to the Special Issue Recent Advances in GPR Imaging)
Show Figures

Graphical abstract

20 pages, 5663 KiB  
Article
Assessing Different Feature Sets’ Effects on Land Cover Classification in Complex Surface-Mined Landscapes by ZiYuan-3 Satellite Imagery
by Weitao Chen, Xianju Li, Haixia He and Lizhe Wang
Remote Sens. 2018, 10(1), 23; https://doi.org/10.3390/rs10010023 - 23 Dec 2017
Cited by 39 | Viewed by 5238
Abstract
Land cover classification (LCC) in complex surface-mined landscapes has become very important for understanding the influence of mining activities on the regional geo-environment. There are three characteristics of complex surface-mined areas limiting LCC: significant three-dimensional terrain, strong temporal-spatial variability of surface cover, and [...] Read more.
Land cover classification (LCC) in complex surface-mined landscapes has become very important for understanding the influence of mining activities on the regional geo-environment. There are three characteristics of complex surface-mined areas limiting LCC: significant three-dimensional terrain, strong temporal-spatial variability of surface cover, and spectral-spatial homogeneity. Thus, determining effective feature sets are very important as input dataset to improve detailed extent of classification schemes and classification accuracy. In this study, data such as various feature sets derived from ZiYuan-3 stereo satellite imagery, a feature subset resulting from a feature selection (FS) procedure, training data polygons, and test sample sets were firstly obtained; then, feature sets’ effects on classification accuracy was assessed based on different feature set combination schemes, a FS procedure, and random forest algorithm. The following conclusions were drawn. (1) The importance of feature set could be divided into three grades: the vegetation index (VI), principal component bands (PCs), mean filters (Mean), standard deviation filters (StDev), texture measures (Textures), and topographic variables (TVs) were important; the Gaussian low-pass filters (GLP) was just positive; and none were useless. The descending order of their importance was TVs, StDev, Textures, Mean, PCs, VI, and GLP. (2) TVs and StDev both significantly outperformed VI, PCs, GLP, and Mean; Mean outperformed GLP; all other pairs of feature sets had no difference. In general, the study assessed different feature sets’ effects on LCC in complex surface-mined landscapes. Full article
(This article belongs to the Special Issue GIS and Remote Sensing advances in Land Change Science)
Show Figures

Graphical abstract

21 pages, 13853 KiB  
Article
Multi-Temporal Analysis of Forestry and Coastal Environments Using UASs
by Luís Pádua, Jonáš Hruška, José Bessa, Telmo Adão, Luís M. Martins, José A. Gonçalves, Emanuel Peres, António M. R. Sousa, João P. Castro and Joaquim J. Sousa
Remote Sens. 2018, 10(1), 24; https://doi.org/10.3390/rs10010024 - 24 Dec 2017
Cited by 35 | Viewed by 7177
Abstract
Due to strong improvements and developments achieved in the last decade, it is clear that applied research using remote sensing technology such as unmanned aerial vehicles (UAVs) can provide a flexible, efficient, non-destructive, and non-invasive means of acquiring geoscientific data, especially aerial imagery. [...] Read more.
Due to strong improvements and developments achieved in the last decade, it is clear that applied research using remote sensing technology such as unmanned aerial vehicles (UAVs) can provide a flexible, efficient, non-destructive, and non-invasive means of acquiring geoscientific data, especially aerial imagery. Simultaneously, there has been an exponential increase in the development of sensors and instruments that can be installed in UAV platforms. By combining the aforementioned factors, unmanned aerial system (UAS) setups composed of UAVs, sensors, and ground control stations, have been increasingly used for remote sensing applications, with growing potential and abilities. This paper’s overall goal is to identify advantages and challenges related to the use of UAVs for aerial imagery acquisition in forestry and coastal environments for preservation/prevention contexts. Moreover, the importance of monitoring these environments over time will be demonstrated. To achieve these goals, two case studies using UASs were conducted. The first focuses on phytosanitary problem detection and monitoring of chestnut tree health (Padrela region, Valpaços, Portugal). The acquired high-resolution imagery allowed for the identification of tree canopy cover decline by means of multi-temporal analysis. The second case study enabled the rigorous and non-evasive registry process of topographic changes that occurred in the sandspit of Cabedelo (Douro estuary, Porto, Portugal) in different time periods. The obtained results allow us to conclude that the UAS constitutes a low-cost, rigorous, and fairly autonomous form of remote sensing technology, capable of covering large geographical areas and acquiring high precision data to aid decision support systems in forestry preservation and coastal monitoring applications. Its swift evolution makes it a potential big player in remote sensing technologies today and in the near future. Full article
(This article belongs to the Special Issue Analysis of Multi-temporal Remote Sensing Images)
Show Figures

Graphical abstract

19 pages, 4060 KiB  
Article
Evaluation of Accuracy and Practical Applicability of Methods for Measuring Leaf Reflectance and Transmittance Spectra
by Aarne Hovi, Petri Forsström, Matti Mõttus and Miina Rautiainen
Remote Sens. 2018, 10(1), 25; https://doi.org/10.3390/rs10010025 - 24 Dec 2017
Cited by 28 | Viewed by 8474
Abstract
Leaf reflectance and transmittance spectra are urgently needed in interpretation of remote sensing data and modeling energy budgets of vegetation. The measurement methods should be fast to operate and preferably portable to enable quick collection of spectral databases and in situ measurements. At [...] Read more.
Leaf reflectance and transmittance spectra are urgently needed in interpretation of remote sensing data and modeling energy budgets of vegetation. The measurement methods should be fast to operate and preferably portable to enable quick collection of spectral databases and in situ measurements. At the same time, the collected spectra must be comparable across measurement campaigns. We compared three different methods for acquiring leaf reflectance and transmittance spectra. These were a single integrating sphere (ASD RTS-3ZC), a small double integrating sphere (Ocean Optics SpectroClip-TR), and a leaf clip (PP Systems UNI501 Mini Leaf Clip). With all methods, an ASD FieldSpec 4 spectrometer was used to measure white paper and tree leaves. Single and double integrating spheres showed comparable within-method variability in the measurements. Variability with leaf clip was slightly higher. The systematic difference in mean reflectance spectra between single and double integrating spheres was only minor (average relative difference of 1%), whereas a large difference (14%) was observed in transmittance. Reflectance measured with leaf clip was on average 14% higher compared to single integrating sphere. The differences between methods influenced also spectral vegetation indices calculated from the spectra, particularly those that were designed to track small changes in spectra. Measurements with double integrating sphere were four, and with leaf clip six times as fast as with single integrating sphere, if slightly reduced signal level (integration time reduced from optimum) was allowed for the double integrating sphere. Thus, these methods are fast alternatives to a conventional single integrating sphere. However, because the differences between methods depended on the measured target and wavelength, care must be taken when comparing the leaf spectra acquired with different methods. Full article
(This article belongs to the Special Issue Recent Progress and Developments in Imaging Spectroscopy)
Show Figures

Graphical abstract

17 pages, 3447 KiB  
Article
Urban Imperviousness Effects on Summer Surface Temperatures Nearby Residential Buildings in Different Urban Zones of Parma
by Marco Morabito, Alfonso Crisci, Teodoro Georgiadis, Simone Orlandini, Michele Munafò, Luca Congedo, Patrizia Rota and Michele Zazzi
Remote Sens. 2018, 10(1), 26; https://doi.org/10.3390/rs10010026 - 24 Dec 2017
Cited by 37 | Viewed by 9210
Abstract
Rapid and unplanned urban growth is responsible for the continuous conversion of green or generally natural spaces into artificial surfaces. The high degree of imperviousness modifies the urban microclimate and no studies have quantified its influence on the surface temperature (ST) nearby residential [...] Read more.
Rapid and unplanned urban growth is responsible for the continuous conversion of green or generally natural spaces into artificial surfaces. The high degree of imperviousness modifies the urban microclimate and no studies have quantified its influence on the surface temperature (ST) nearby residential building. This topic represents the aim of this study carried out during summer in different urban zones (densely urbanized or park/rural areas) of Parma (Northern Italy). Daytime and nighttime ASTER images, the local urban cartography and the Italian imperviousness databases were used. A reproducible/replicable framework was implemented named “Building Thermal Functional Area” (BTFA) useful to lead building-proxy thermal analyses by using remote sensing data. For each residential building (n = 8898), the BTFA was assessed and the correspondent ASTER-LST value (ST_BTFA) and the imperviousness density were calculated. Both daytime and nighttime ST_BTFA significantly (p < 0.001) increased when high levels of imperviousness density surrounded the residential buildings. These relationships were mostly consistent during daytime and in densely urbanized areas. ST_BTFA differences between urban and park/rural areas were higher during nighttime (above 1 °C) than daytime (about 0.5 °C). These results could help to identify “urban thermal Hot-Spots” that would benefit most from mitigation actions. Full article
(This article belongs to the Special Issue Remote Sensing of Urban Agriculture and Land Cover)
Show Figures

Graphical abstract

14 pages, 3619 KiB  
Article
Remote Sensing of Hydrological Changes in Tian-e-Zhou Oxbow Lake, an Ungauged Area of the Yangtze River Basin
by Chao Yang, Xiaobin Cai and Xuelei Wang
Remote Sens. 2018, 10(1), 27; https://doi.org/10.3390/rs10010027 - 25 Dec 2017
Cited by 16 | Viewed by 6421
Abstract
The hydrological pattern changes have a great influence on the wetland environment. However, some important wetland areas often lack historical observations due to economic and physical conditions. The Tian-e-Zhou oxbow lake wetland is an important habitat for two endangered species and also has [...] Read more.
The hydrological pattern changes have a great influence on the wetland environment. However, some important wetland areas often lack historical observations due to economic and physical conditions. The Tian-e-Zhou oxbow lake wetland is an important habitat for two endangered species and also has very little historical hydrological data. Remote sensing images can be used to explore the historical water area fluctuation of lakes. In addition, remote sensing can also be used to obtain historical water levels based on the water boundary elevation integrated with a topographic data (WBET) method or the level-surface area relationship curve (LRC) method. In order to minimize the uncertainty of the derived results, both methods were introduced in the extraction of the water level of Tian-e-Zhou during 1992–2015. The results reveal that the hydrological regime of the oxbow lake has experienced a significant change after the Shatanzi Levee construction in 1998. With the impact of the levee, the mean annual water surface area of the lake was reduced by 5.8 km2 during the flood season, but, during the non-flood season, it was increased by 1.35 km2. For the same period, the water level of the lake during the flood season also showed a 1.47 m (WBET method) or 3.21 m (LRC method) decrease. The mean annual water level increased by 1.12 m (WBET method) or 0.75 m (LRC method). Both results had a good accuracy with RMSE (root-mean-square errors) of less than 0.4 m. Furthermore, the water level differences between the Yangtze River channel and the oxbow lake increased by at least 0.5 m. It is found that the hydrological pattern of the oxbow lake changed significantly after the levee construction, which could bring some disadvantages to the habitats of the two endangered species. Full article
(This article belongs to the Special Issue Remote Sensing of Floodpath Lakes and Wetlands)
Show Figures

Figure 1

17 pages, 4819 KiB  
Article
Prediction of Soil Organic Matter by VIS–NIR Spectroscopy Using Normalized Soil Moisture Index as a Proxy of Soil Moisture
by Yongsheng Hong, Lei Yu, Yiyun Chen, Yanfang Liu, Yaolin Liu, Yi Liu and Hang Cheng
Remote Sens. 2018, 10(1), 28; https://doi.org/10.3390/rs10010028 - 24 Dec 2017
Cited by 73 | Viewed by 10419
Abstract
Soil organic matter (SOM) is an important parameter of soil fertility, and visible and near-infrared (VIS–NIR) spectroscopy combined with multivariate modeling techniques have provided new possibilities to estimate SOM. However, the spectral signal is strongly influenced by soil moisture (SM) in the field. [...] Read more.
Soil organic matter (SOM) is an important parameter of soil fertility, and visible and near-infrared (VIS–NIR) spectroscopy combined with multivariate modeling techniques have provided new possibilities to estimate SOM. However, the spectral signal is strongly influenced by soil moisture (SM) in the field. Interest in using spectral classification to predict soils in the moist conditions to minimize the influence of SM is growing. The objective of this study was to investigate the transferability of two approaches, SM–based cluster method with known SM (classifying the VIS–NIR spectra into different SM clusters to develop models separately), the normalized soil moisture index (NSMI)–based cluster method with unknown SM (utilizing NSMI to indicate the SM and establish models separately), to predict SOM directly in moist soil spectra. One hundred and twenty one soil samples were collected from Central China, and eight SM levels were obtained for each sample through rewetting experiments. Their reflectance spectra and SOM concentrations were measured in the laboratory. Partial least square-support vector machine (PLS-SVM) was employed to construct SOM prediction models. Specifically, prediction models were developed for NSMI–based clusters with unknown SM data. The models were assessed through three statistics in the processes of calibration and validation: the coefficient of determination (R2), root mean square error (RMSE) and the ratio of the performance to deviation (RPD). Results showed that the variable SM led to reduced VIS–NIR reflectance nonlinearly across the entire spectral range. NSMI was an effective spectral index to indicate the SM. Classifying the VIS–NIR spectra into different SM clusters in known SM states could improve the performance of PLS-SVM models to acceptable prediction accuracies (R2cv = 0.69–0.77, RPD = 1.79–2.08). The estimation of SOM, when using the NSMI–based cluster method with unknown SM (RPD = 1.95–2.04), was similar to the use of the SM–based cluster method with known SM (RPD = 1.79–2.08). The predictive results (RPD = 1.87–2.06) demonstrated that the NSMI-–based cluster method has potential for application outside the laboratory for SOM prediction without knowing the SM explicitly, and this method is also easy to carry out and only requires spectral information. Full article
(This article belongs to the Special Issue Earth Observations for Precision Farming in China (EO4PFiC))
Show Figures

Graphical abstract

14 pages, 5143 KiB  
Article
Vertical Accuracy Simulation of Stereo Mapping Using a Small Matrix Charge-Coupled Device
by Zhichao Guan, Yonghua Jiang and Guo Zhang
Remote Sens. 2018, 10(1), 29; https://doi.org/10.3390/rs10010029 - 25 Dec 2017
Cited by 5 | Viewed by 3884
Abstract
At present, without ground control points (GCPs), the positioning accuracy of remote sensing images often fails to meet the growing requirements for mapping accuracy. Multi-load synergy to improve accuracy without GCPs by eliminating the impact of stereo accuracy, which is caused by on-orbit [...] Read more.
At present, without ground control points (GCPs), the positioning accuracy of remote sensing images often fails to meet the growing requirements for mapping accuracy. Multi-load synergy to improve accuracy without GCPs by eliminating the impact of stereo accuracy, which is caused by on-orbit measurement error, is urgently needed to improve large-scale mapping. In this study, we analyzed error sources in stereo imaging mode and found that vertical accuracy depends on the relative accuracy of attitude during symmetric stereoscopic mapping. With the assistance of small matrix charge-coupled device (CCD) images and the block adjustment method, relative accuracy of attitude was improved, allowing for the improvement in vertical accuracy without GCPs. The simulation results show that vertical accuracy in symmetric stereo mode is not affected by attitude system error. After the restoration of imaging attitude processed by a sequence of matrix CCD images, the relative accuracy of the attitude increased, and the accuracy of the elevation without GCPs improved significantly. The results demonstrate the feasibility of small matrix CCD-assisted stereo mapping. Full article
(This article belongs to the Section Remote Sensing Image Processing)
Show Figures

Graphical abstract

22 pages, 6241 KiB  
Article
Evaluation of Satellite-Based Precipitation Products from IMERG V04A and V03D, CMORPH and TMPA with Gauged Rainfall in Three Climatologic Zones in China
by Guanghua Wei, Haishen Lü, Wade T. Crow, Yonghua Zhu, Jianqun Wang and Jianbin Su
Remote Sens. 2018, 10(1), 30; https://doi.org/10.3390/rs10010030 - 25 Dec 2017
Cited by 61 | Viewed by 6590
Abstract
A critical evaluation of the newly released precipitation data set is very important for both the end users and data developers. Meanwhile, the evaluation may provide a benchmark for the product’s continued development and future improvement. To these ends, the four precipitation estimates [...] Read more.
A critical evaluation of the newly released precipitation data set is very important for both the end users and data developers. Meanwhile, the evaluation may provide a benchmark for the product’s continued development and future improvement. To these ends, the four precipitation estimates including IMERG (the Integrated Multi-satellitE Retrievals for the Global Precipitation Measurement) V04A, IMERG V03D, CMORPH (the Climate Prediction Center Morphing technique)-CRT and TRMM (the Tropical Rainfall Measuring Mission) 3B42 are systematically evaluated against the gauge precipitation estimates at multiple spatiotemporal scales from 1 June 2014 to 30 November 2015 over three different topographic and climatic watersheds in China. Meanwhile, the statistical methods are utilized to quantize the performance of the four satellite-based precipitation estimates. The results show that: (1) over the Tibetan Plateau cold region, among all products, IMERG V04A underestimates precipitation with the largest RB (−46.98%) during the study period and the similar results are seen at the seasonal scale. However, IMERG V03D demonstrates the best performance according to RB (7.46%), RMSE (0.44 mm/day) and RRMSE (28.37%). Except for in summer, TRMM 3B42 perform better than CMORPH according to RMSEs, RRMSEs and Rs; (2) within the semi-humid Huaihe River Basin, IMERG V04A has a slight advantage over the other three satellite-based precipitation products with the lowest RMSE (0.32 mm/day) during the evaluation period and followed by IMERG V03D, TRMM 3B42 and CMORPH orderly; (3) over the arid/semi-arid Weihe River Basin, in comparison with the other three products, TRMM 3B42 demonstrates the best performance with the lowest RMSE (0.1 mm/day), RRMSE (8.44%) and highest R (0.92) during the study period. Meanwhile, IMERG V03D perform better than IMERG V04A according all the statistical indicators; (4) in winter, IMERG V04A and IMERG V03D tend to underestimate the total precipitation with RBs (−70.62% vs. −6.47% over the Tibetan Plateau, −46.92% vs. −0.66% over the Weihe River Basin, respectively); and (5) overall, except for IMERG V04A in Tibetan Plateau, all satellite-based precipitation captured the gauge-based precipitation well over the three regions according to RRMSEs, Rs and Rbs during the study period. IMERG V03D performs better than its predecessors-TRMM 3B42 and CMORPH over the Tibetan Plateau region and the Huaihe River Basin, while IMERG V04A only does so over the latter. Between the two IMERG products, IMERG V04A does not show an advantage over IMERG V03D over the Tibetan Plateau region and the Weihe River Basin. In particular, over the former, IMERG V04A performs far worse than IMERG V03D. These findings provide valuable feedback for both IMERG algorithm developers and data users. Full article
Show Figures

Figure 1

23 pages, 13120 KiB  
Article
Comparison of Different Machine Learning Approaches for Monthly Satellite-Based Soil Moisture Downscaling over Northeast China
by Yangxiaoyue Liu, Yaping Yang, Wenlong Jing and Xiafang Yue
Remote Sens. 2018, 10(1), 31; https://doi.org/10.3390/rs10010031 - 25 Dec 2017
Cited by 72 | Viewed by 8248
Abstract
Although numerous satellite-based soil moisture (SM) products can provide spatiotemporally continuous worldwide datasets, they can hardly be employed in characterizing fine-grained regional land surface processes, owing to their coarse spatial resolution. In this study, we proposed a machine-learning-based method to enhance SM spatial [...] Read more.
Although numerous satellite-based soil moisture (SM) products can provide spatiotemporally continuous worldwide datasets, they can hardly be employed in characterizing fine-grained regional land surface processes, owing to their coarse spatial resolution. In this study, we proposed a machine-learning-based method to enhance SM spatial accuracy and improve the availability of SM data. Four machine learning algorithms, including classification and regression trees (CART), K-nearest neighbors (KNN), Bayesian (BAYE), and random forests (RF), were implemented to downscale the monthly European Space Agency Climate Change Initiative (ESA CCI) SM product from 25-km to 1-km spatial resolution. During the regression, the land surface temperature (including daytime temperature, nighttime temperature, and diurnal fluctuation temperature), normalized difference vegetation index, surface reflections (red band, blue band, NIR band and MIR band), and digital elevation model were taken as explanatory variables to produce fine spatial resolution SM. We chose Northeast China as the study area and acquired corresponding SM data from 2003 to 2012 in unfrozen seasons. The reconstructed SM datasets were validated against in-situ measurements. The results showed that the RF-downscaled results had superior matching performance to both ESA CCI SM and in-situ measurements, and can positively respond to precipitation variation. Additionally, the RF was less affected by parameters, which revealed its robustness. Both CART and KNN ranked second. Compared to KNN, CART had a relatively close correlation with the validation data, but KNN showed preferable precision. Moreover, BAYE ranked last with significantly abnormal regression values. Full article
(This article belongs to the Special Issue Retrieval, Validation and Application of Satellite Soil Moisture Data)
Show Figures

Graphical abstract

22 pages, 7237 KiB  
Article
Examining Land Cover and Greenness Dynamics in Hangzhou Bay in 1985–2016 Using Landsat Time-Series Data
by Dengqiu Li, Dengsheng Lu, Ming Wu, Xuexin Shao and Jinhong Wei
Remote Sens. 2018, 10(1), 32; https://doi.org/10.3390/rs10010032 - 25 Dec 2017
Cited by 36 | Viewed by 6496
Abstract
Land cover changes significantly influence vegetation greenness in different regions. Dense Landsat time series stacks provide unique opportunity to analyze land cover change and vegetation greenness trends at finer spatial scale. In the past three decades, large reclamation activities have greatly changed land [...] Read more.
Land cover changes significantly influence vegetation greenness in different regions. Dense Landsat time series stacks provide unique opportunity to analyze land cover change and vegetation greenness trends at finer spatial scale. In the past three decades, large reclamation activities have greatly changed land cover and vegetation growth of coastal areas. However, rarely has research investigated these frequently changed coastal areas. In this study, Landsat Normalized Difference Vegetation Index time series (1984–2016) data and the Breaks For Additive Seasonal and Trend algorithm were used to detect the intensity and dates of abrupt changes in a typical coastal area—Hangzhou Bay, China. The prior and posterior land cover categories of each change were classified using phenology information through a Random Forest model. The impacts of land cover change on vegetation greenness trends of the inland and reclaimed areas were analyzed through distinguishing gradual and abrupt changes. The results showed that the intensity and date of land cover change were detected successfully with overall accuracies of 88.7% and 86.1%, respectively. The continuous land cover dynamics were retrieved accurately with an overall accuracy of 91.0% for ten land cover classifications. Coastal reclamation did not alleviate local cropland occupation, but prompted the vegetation greenness of the reclaimed area. Most of the inland area showed a browning trend. The main contributors to the greenness and browning trends were also quantified. These findings will help the natural resource management community generate better understanding of coastal reclamation and make better management decisions. Full article
Show Figures

Graphical abstract

19 pages, 5399 KiB  
Article
Soil Moisture Mapping from Satellites: An Intercomparison of SMAP, SMOS, FY3B, AMSR2, and ESA CCI over Two Dense Network Regions at Different Spatial Scales
by Chenyang Cui, Jia Xu, Jiangyuan Zeng, Kun-Shan Chen, Xiaojing Bai, Hui Lu, Quan Chen and Tianjie Zhao
Remote Sens. 2018, 10(1), 33; https://doi.org/10.3390/rs10010033 - 25 Dec 2017
Cited by 159 | Viewed by 11303
Abstract
A good knowledge of the quality of the satellite soil moisture products is of great importance for their application and improvement. This paper examines the performance of eight satellite-based soil moisture products, including the Soil Moisture Active Passive (SMAP) passive Level 3 (L3), [...] Read more.
A good knowledge of the quality of the satellite soil moisture products is of great importance for their application and improvement. This paper examines the performance of eight satellite-based soil moisture products, including the Soil Moisture Active Passive (SMAP) passive Level 3 (L3), the Soil Moisture and Ocean Salinity (SMOS) Centre Aval de Traitement des Données SMOS (CATDS) L3, the Japan Aerospace Exploration Agency (JAXA) Advanced Microwave Scanning Radiometer 2 (AMSR2) L3, the Land Parameter Retrieval Model (LPRM) AMSR2 L3, the European Space Agency (ESA) Climate Change Initiative (CCI) L3, the Chinese Fengyun-3B (FY3B) L2 soil moisture products at a coarse resolution of ~0.25°, and the newly released SMAP enhanced passive L3 and JAXA AMSR2 L3 soil moisture products at a medium resolution of ~0.1°. The ground soil moisture used for validation were collected from two well-calibrated and dense networks, including the Little Washita Watershed (LWW) network in the United States and the REMEDHUS network in Spain, each with different land cover. The results show that the SMAP passive soil moisture product outperformed the other products in the LWW network region, with an unbiased root mean square (ubRMSE) of 0.027 m3 m−3, whereas the FY3B soil moisture performed the best in the REMEDHUS network region, with an ubRMSE of 0.025 m3 m−3. The JAXA product performed much better at 0.25° than at 0.1°, but at both resolutions it underestimated soil moisture most of the time (bias < −0.05 m3 m−3). The SMAP-enhanced passive soil moisture product captured the temporal variation of ground measurements well, with a correlation coefficient larger than 0.8, and was generally superior to the JAXA product. The LPRM showed much larger amplitude and temporal variation than the ground soil moisture, with a wet bias larger than 0.09 m3 m−3. The underestimation of surface temperature may have contributed to the general dry bias found in the SMAP (−0.018 m3 m−3 for LWW and 0.016 m3 m−3 for REMEDHUS) and SMOS (−0.004 m3 m−3 for LWW and −0.012 m3 m−3 for REMEDHUS) soil moisture products. The ESA CCI product showed satisfactory performance with acceptable error metrics (ubRMSE < 0.045 m3 m−3), revealing the effectiveness of merging active and passive soil moisture products. The good performance of SMAP and FY3B demonstrates the potential in integrating them into the existing long-term ESA CCI product, in order to form a more reliable and useful product. Full article
(This article belongs to the Special Issue Soil Moisture Remote Sensing Across Scales)
Show Figures

Graphical abstract

23 pages, 9187 KiB  
Article
Comprehensive Evaluation of Two Successive V3 and V4 IMERG Final Run Precipitation Products over Mainland China
by Haigen Zhao, Shengtian Yang, Songcai You, Yingchun Huang, Qianfeng Wang and Qiuwen Zhou
Remote Sens. 2018, 10(1), 34; https://doi.org/10.3390/rs10010034 - 25 Dec 2017
Cited by 30 | Viewed by 4653
Abstract
The Integrated Multi-satellitE Retrievals for Global Precipitation Measurement Final Run (IMERGF) product has now been upgraded to Version 4 (V4), which has been available since March 2017. Therefore, it is desirable to evaluate the characteristic differences between the V4 and the previous V3 [...] Read more.
The Integrated Multi-satellitE Retrievals for Global Precipitation Measurement Final Run (IMERGF) product has now been upgraded to Version 4 (V4), which has been available since March 2017. Therefore, it is desirable to evaluate the characteristic differences between the V4 and the previous V3 products. A comprehensive performance evaluation of the errors of the successive V3 and V4 IMERGF products is performed with a comparison of the China daily Precipitation Analysis Products (CPAP) from March 2014 to February 2015. The version 6 Global Satellite Mapping of Precipitation (GSMaP) research product (which is another Global Precipitation Measurement (GPM) based precipitation product) is also used as a comparison in this study. Overall, the IMERGF-V4 product does not exhibit the anticipated improvement for China compared to the IMERGF-V3 product. An analysis of the metrics of annual daily average precipitation over China for the IMERGF-V3 and IMERGF-V4 products indicates a decrease of the relative bias (RB) from 3.70% to −7.18%, a decrease of the correlation coefficient (CC) from 0.91 to 0.89, an increase of the fractional standard error (FSE) from 0.49 to 0.56, and an increase of the root-mean-square error (RMSE) from 0.63 mm to 0.72 mm. Compared to the IMERGF-V3 product, the IMERGF-V4 product exhibits a significant underestimation of precipitation in the Qinghai-Tibetan plateau with a much lower RB of −60.91% (−58.19%, −65.30%, and −63.74%) based on the annual (summer, autumn, and winter) daily average precipitation and an even worse performance during winter (−72.33% of RB). In comparison, the GSMaP product outperforms the IMERGF-V3 and IMERGF-V4 products and has the smallest RMSE (0.47 mm/day), highest CC (0.95), lowest FSE (0.37), and best performance of the RB (−2.39%) in terms of annual daily precipitation over China. However, the GSMaP product underestimates the precipitation more than the IMERGF-V3 product for the arid XJ region. Full article
(This article belongs to the Section Atmospheric Remote Sensing)
Show Figures

Graphical abstract

25 pages, 10529 KiB  
Article
Gaussian Half-Wavelength Progressive Decomposition Method for Waveform Processing of Airborne Laser Bathymetry
by Kai Guo, Wenxue Xu, Yanxiong Liu, Xiufeng He and Ziwen Tian
Remote Sens. 2018, 10(1), 35; https://doi.org/10.3390/rs10010035 - 26 Dec 2017
Cited by 36 | Viewed by 5865
Abstract
In an airborne laser bathymetry system, the full-waveform echo signal is usually recorded by discrete sampling. The accuracy of signal recognition and the amount of effective information that can be extracted by conventional methods are limited. To improve the validity and reliability of [...] Read more.
In an airborne laser bathymetry system, the full-waveform echo signal is usually recorded by discrete sampling. The accuracy of signal recognition and the amount of effective information that can be extracted by conventional methods are limited. To improve the validity and reliability of airborne laser bathymetry data and to extract more information to better understand the water reflection characteristics, we select the effective portion of the original waveform for further research, suppress random noise, and decompose the selected portion progressively using the half-wavelength Gaussian function with the time sequence of the received echo signals. After parameter optimization, a reasonable and effective reflection component selection mechanism is established to obtain accurate parameters for the reflected components. The processing strategy proposed in this paper reduces the problems of unreasonable decomposition and the reflected pulse peak-position shift caused by echo waveform superposition and offers good precision for waveform decomposition and peak detection. In another experiment, the regional processing result shows an obvious improvement in the shallow water area, and the bottom point cloud is as accurate as the intelligent waveform digitizer (IWD), a subsystem of airborne laser terrain mapping (ALTM). These findings confirm that the proposed method has high potential for application. Full article
(This article belongs to the Special Issue Instruments and Methods for Ocean Observation and Monitoring)
Show Figures

Graphical abstract

12 pages, 3422 KiB  
Article
Inter-Calibration of Passive Microwave Satellite Brightness Temperatures Observed by F13 SSM/I and F17 SSMIS for the Retrieval of Snow Depth on Arctic First-Year Sea Ice
by Qingquan Liu, Qing Ji, Xiaoping Pang, Xin Gao, Xi Zhao and Ruibo Lei
Remote Sens. 2018, 10(1), 36; https://doi.org/10.3390/rs10010036 - 26 Dec 2017
Cited by 9 | Viewed by 4972
Abstract
Passive microwave satellite brightness temperatures (TB) that were observed by the F13 Special Sensor Microwave/Imager (SSM/I) and the subsequent F17 Special Sensor Microwave Imager/Sounder (SSMIS) were inter-calibrated using empirical relationship models during their overlap period. Snow depth (SD) on the Arctic first-year sea [...] Read more.
Passive microwave satellite brightness temperatures (TB) that were observed by the F13 Special Sensor Microwave/Imager (SSM/I) and the subsequent F17 Special Sensor Microwave Imager/Sounder (SSMIS) were inter-calibrated using empirical relationship models during their overlap period. Snow depth (SD) on the Arctic first-year sea ice was further retrieved. The SDs derived from F17 TB and F13C TB which were calibrated F17 TB using F13 TB as the baseline were then compared and evaluated against in situ SD measurements based on the Operational IceBridge (OIB) airborne observations from 2009 to 2013. Results show that Cavalieri inter-calibration models (CA models) perform smaller root mean square error (RMSE) than Dai inter-calibration models (DA models), and the standard deviation of OIB SDs in the 25 km pixels is around 6 cm on first-year sea ice. Moreover, the SDs derived from the calibrated F17 TB using F13 TB as the baseline were in better agreement than the F17 SDs as compared with OIB SDs, with the biases of −2 cm (RMSE of 5 cm) and −9 cm (RMSE of 10 cm), respectively. We conclude that TB observations from F17 SSMIS calibrated to F13 SSM/I as the baseline should be recommended when performing the sensors’ biases correction for SD purpose based on the existing algorithm. These findings could serve as a reference for generating more consistent and reliable TB, which could help to improve the retrieval and analysis of long-term snow depth on the Arctic first-year sea ice. Full article
(This article belongs to the Special Issue Snow Remote Sensing)
Show Figures

Figure 1

21 pages, 8102 KiB  
Article
Linking Regional Winter Sea Ice Thickness and Surface Roughness to Spring Melt Pond Fraction on Landfast Arctic Sea Ice
by Sasha Nasonova, Randall K. Scharien, Christian Haas and Stephen E. L. Howell
Remote Sens. 2018, 10(1), 37; https://doi.org/10.3390/rs10010037 - 26 Dec 2017
Cited by 8 | Viewed by 5586
Abstract
The Arctic sea ice cover has decreased strongly in extent, thickness, volume and age in recent decades. The melt season presents a significant challenge for sea ice forecasting due to uncertainty associated with the role of surface melt ponds in ice decay at [...] Read more.
The Arctic sea ice cover has decreased strongly in extent, thickness, volume and age in recent decades. The melt season presents a significant challenge for sea ice forecasting due to uncertainty associated with the role of surface melt ponds in ice decay at regional scales. This study quantifies the relationships of spring melt pond fraction (fp) with both winter sea ice roughness and thickness, for landfast first-year sea ice (FYI) and multiyear sea ice (MYI). In 2015, airborne measurements of winter sea ice thickness and roughness, as well as high-resolution optical data of melt pond covered sea ice, were collected along two ~5.2 km long profiles over FYI- and MYI-dominated regions in the Canadian Arctic. Statistics of winter sea ice thickness and roughness were compared to spring fp using three data aggregation approaches, termed object and hybrid-object (based on image segments), and regularly spaced grid-cells. The hybrid-based aggregation approach showed strongest associations because it considers the morphology of the ice as well as footprints of the sensors used to measure winter sea ice thickness and roughness. Using the hybrid-based data aggregation approach it was found that winter sea ice thickness and roughness are related to spring fp. A stronger negative correlation was observed between FYI thickness and fp (Spearman rs = −0.85) compared to FYI roughness and fp (rs = −0.52). The association between MYI thickness and fp was also negative (rs = −0.56), whereas there was no association between MYI roughness and fp. 47% of spring fp variation for FYI and MYI can be explained by mean thickness. Thin sea ice is characterized by low surface roughness allowing for widespread ponding in the spring (high fp) whereas thick sea ice has undergone dynamic thickening and roughening with topographic features constraining melt water into deeper channels (low fp). This work provides an important contribution towards the parameterizations of fp in seasonal and long-term prediction models by quantifying linkages between winter sea ice thickness and roughness, and spring fp. Full article
(This article belongs to the Section Ocean Remote Sensing)
Show Figures

Graphical abstract

17 pages, 27039 KiB  
Article
Quantification of Two-Dimensional Wave Breaking Dissipation in the Surf Zone from Remote Sensing Data
by Harold Díaz, Patricio A. Catalán and Greg W. Wilson
Remote Sens. 2018, 10(1), 38; https://doi.org/10.3390/rs10010038 - 26 Dec 2017
Cited by 12 | Viewed by 4705
Abstract
A method for obtaining two dimensional fields of wave breaking energy dissipation in the surfzone is presented. The method relies on acquiring geometrical parameters of the wave roller from remote sensing data. These parameters are then coupled with a dissipation model to obtain [...] Read more.
A method for obtaining two dimensional fields of wave breaking energy dissipation in the surfzone is presented. The method relies on acquiring geometrical parameters of the wave roller from remote sensing data. These parameters are then coupled with a dissipation model to obtain time averaged two dimensional maps, but also the wave breaking energy dissipation on a wave-by-wave basis. Comparison of dissipation maps as obtained from the present technique and a results from a numerical model, show very good correlation in both structure and magnitude. The location of a rip current can also be observed from the field data. Though in the present work a combination of optical and microwave data is used, the underlying method is independent of the remote sensor platform. Therefore, it offers the possibility to acquire high quality and synoptic estimates that could contribute to the understanding of the surfzone hydrodynamics. Full article
(This article belongs to the Special Issue Instruments and Methods for Ocean Observation and Monitoring)
Show Figures

Figure 1

27 pages, 9314 KiB  
Article
Bayesian and Classical Machine Learning Methods: A Comparison for Tree Species Classification with LiDAR Waveform Signatures
by Tan Zhou, Sorin C. Popescu, A. Michelle Lawing, Marian Eriksson, Bogdan M. Strimbu and Paul C. Bürkner
Remote Sens. 2018, 10(1), 39; https://doi.org/10.3390/rs10010039 - 26 Dec 2017
Cited by 32 | Viewed by 11527
Abstract
A plethora of information contained in full-waveform (FW) Light Detection and Ranging (LiDAR) data offers prospects for characterizing vegetation structures. This study aims to investigate the capacity of FW LiDAR data alone for tree species identification through the integration of waveform metrics with [...] Read more.
A plethora of information contained in full-waveform (FW) Light Detection and Ranging (LiDAR) data offers prospects for characterizing vegetation structures. This study aims to investigate the capacity of FW LiDAR data alone for tree species identification through the integration of waveform metrics with machine learning methods and Bayesian inference. Specifically, we first conducted automatic tree segmentation based on the waveform-based canopy height model (CHM) using three approaches including TreeVaW, watershed algorithms and the combination of TreeVaW and watershed (TW) algorithms. Subsequently, the Random forests (RF) and Conditional inference forests (CF) models were employed to identify important tree-level waveform metrics derived from three distinct sources, such as raw waveforms, composite waveforms, the waveform-based point cloud and the combined variables from these three sources. Further, we discriminated tree (gray pine, blue oak, interior live oak) and shrub species through the RF, CF and Bayesian multinomial logistic regression (BMLR) using important waveform metrics identified in this study. Results of the tree segmentation demonstrated that the TW algorithms outperformed other algorithms for delineating individual tree crowns. The CF model overcomes waveform metrics selection bias caused by the RF model which favors correlated metrics and enhances the accuracy of subsequent classification. We also found that composite waveforms are more informative than raw waveforms and waveform-based point cloud for characterizing tree species in our study area. Both classical machine learning methods (the RF and CF) and the BMLR generated satisfactory average overall accuracy (74% for the RF, 77% for the CF and 81% for the BMLR) and the BMLR slightly outperformed the other two methods. However, these three methods suffered from low individual classification accuracy for the blue oak which is prone to being misclassified as the interior live oak due to the similar characteristics of blue oak and interior live oak. Uncertainty estimates from the BMLR method compensate for this downside by providing classification results in a probabilistic sense and rendering users with more confidence in interpreting and applying classification results to real-world tasks such as forest inventory. Overall, this study recommends the CF method for feature selection and suggests that BMLR could be a superior alternative to classical machining learning methods. Full article
(This article belongs to the Special Issue Lidar for Forest Science and Management)
Show Figures

Figure 1

22 pages, 24264 KiB  
Article
Land Subsidence in Chiayi, Taiwan, from Compaction Well, Leveling and ALOS/PALSAR: Aquaculture-Induced Relative Sea Level Rise
by Wei-Chia Hung, Cheinway Hwang, Yi-An Chen, Lei Zhang, Kuan-Hung Chen, Shiang-Hung Wei, Da-Ren Huang and Shu-Han Lin
Remote Sens. 2018, 10(1), 40; https://doi.org/10.3390/rs10010040 - 26 Dec 2017
Cited by 41 | Viewed by 8913
Abstract
Chiayi County is located in the largest alluvial plain of Taiwan with extensive aquaculture and rice farming sustained by water extracted from groundwater wells. Chiayi is a typical aquaculture area affected by land subsidence, yet such lands worldwide combine to provide nearly 90% [...] Read more.
Chiayi County is located in the largest alluvial plain of Taiwan with extensive aquaculture and rice farming sustained by water extracted from groundwater wells. Chiayi is a typical aquaculture area affected by land subsidence, yet such lands worldwide combine to provide nearly 90% of global aquaculture products, greatly reducing oceanic overfishing problems. This study uses precision leveling, multi-layer compaction monitoring well (MLCW) and spaceborne SAR interferometry (InSAR) to examine the cause and effect of land subsidence in Chiayi associated with groundwater extractions and changes. Heights at benchmarks in a leveling network are measured annually and soil compactions at 24–26 layers up to 300-m depths at 7 MLCWs are collected at one-month intervals. Over 2007–2011, 15 ALOS/PALSAR images are processed by the method of TCPInSAR to produce subsidence rates. All sensors show that land subsidence occur in most parts of Chiayi, with rates reaching 4.5 cm/year around its coast, a result of groundwater pumping from shallow to deep aquifers. MLCWs detect mm-accuracy seasonal soil compactions coinciding with groundwater level fluctuations and causing dynamic compactions. Compactions near Taiwan High Speed Rail may reduce the strength of the rail’s supporting columns to degrade its safety. The SAR images yield subsidence rates consistent with those from leveling and compaction wells after corrections for systematic errors by the leveling result. Subsidence in Chiayi’s coastal area leads to relative sea level rises at rates up to 15 times larger than the global eustatic sea level rising rate, a risk typical for world’s aquaculture-rich regions. At the fish pond-covered Budai Township, InSAR identifies subsidence spots not detected by leveling, providing crucial geo-information for a sustainable land management for aquaculture industry. Full article
(This article belongs to the Special Issue Radar Interferometry for Geohazards)
Show Figures

Figure 1

19 pages, 13907 KiB  
Article
Can Satellite Precipitation Products Estimate Probable Maximum Precipitation: A Comparative Investigation with Gauge Data in the Dadu River Basin
by Yuan Yang, Guoqiang Tang, Xiaohui Lei, Yang Hong and Na Yang
Remote Sens. 2018, 10(1), 41; https://doi.org/10.3390/rs10010041 - 27 Dec 2017
Cited by 26 | Viewed by 6732
Abstract
Probable Maximum Precipitation (PMP) is an essential prerequisite in designing dams, spillways, and reservoirs in order to minimize the risk of overtopping infrastructure collapse, especially under today’s changing climate. This study investigates conventional PMP estimation approach by using both scarce in-situ observations and [...] Read more.
Probable Maximum Precipitation (PMP) is an essential prerequisite in designing dams, spillways, and reservoirs in order to minimize the risk of overtopping infrastructure collapse, especially under today’s changing climate. This study investigates conventional PMP estimation approach by using both scarce in-situ observations and mainstream satellite precipitation products in the Dadu River basin, where plenty of reservoirs and dams are being built. The satellite data include Climate Prediction Center (CPC) MORPHing algorithm (CMORPH), Precipitation Estimation from Remotely Sensed Information using Artificial Neural Networks-Climate Data Record (PERSIANN-CDR), and Tropic Rainfall Measuring Mission (TRMM) Multi-satellite Precipitation Analysis (TMPA) 3B42V7. The evaluation of satellite products shows that CMORPH and 3B42V7 agree well with gauge-based dataset for the period of 1998–2013 at both the grid and basin scales, also capturing the extreme precipitation events, with high Correlation Coefficients (CC) in terms of 0.68 and 0.71, respectively. Also, CMORPH and 3B42V7 show better performance for the magnitude and spatial distribution of 24-h PMP in such complex terrains. PERSIANN-CDR shows an overestimation in the upstream and an underestimation in the downstream. As among the first studies of satellite precipitation-based PMP estimation, this work sheds lights on the suitability of satellite precipitation in PMP estimation and could provide a reference for future extended spatially-distributed PMP estimation in vast ungauged regions. Full article
Show Figures

Graphical abstract

16 pages, 22049 KiB  
Article
Ice Velocity Variations of the Polar Record Glacier (East Antarctica) Using a Rotation-Invariant Feature-Tracking Approach
by Tingting Liu, Muye Niu and Yuande Yang
Remote Sens. 2018, 10(1), 42; https://doi.org/10.3390/rs10010042 - 27 Dec 2017
Cited by 27 | Viewed by 6802
Abstract
In this study, the ice velocity changes from 2004 to 2015 of the Polar Record Glacier (PRG) in East Antarctica were investigated based on a feature-tracking method using Landsat-7 enhanced thematic mapper plus (ETM+) and Landsat-8 operational land imager (OLI) images. The flow [...] Read more.
In this study, the ice velocity changes from 2004 to 2015 of the Polar Record Glacier (PRG) in East Antarctica were investigated based on a feature-tracking method using Landsat-7 enhanced thematic mapper plus (ETM+) and Landsat-8 operational land imager (OLI) images. The flow field of the PRG curves make it difficult to generate ice velocities in some areas using the traditional normalized cross-correlation (NCC)-based feature-tracking method. Therefore, a rotation-invariant parameter from scale-invariant feature transform (SIFT) is introduced to build a novel rotation-invariant feature-tracking approach. The validation was performed based on multi-source images and the making earth system data records for use in research environments (MEaSUREs) interferometric synthetic aperture radar (InSAR)-based Antarctica ice velocity map data set. The results indicate that the proposed method is able to measure the ice velocity in more areas and performs as well as the traditional NCC-based feature-tracking method. The sequential ice velocities obtained present the variations in the PRG during this period. Although the maximum ice velocity of the frontal margin of the PRG and the frontal iceberg reached about 900 m/a and 1000 m/a, respectively, the trend from 2004 to 2015 showed no significant change. Under the interaction of the Polar Times Glacier and the Polarforschung Glacier, both the direction and the displacement of the PRG were influenced. This impact also led to higher velocities in the western areas of the PRG than in the eastern areas. In addition, elevation changes and frontal iceberg calving also impacted the ice velocity of the PRG. Full article
(This article belongs to the Special Issue Cryospheric Remote Sensing II)
Show Figures

Figure 1

22 pages, 18948 KiB  
Article
A New Method for Automatically Tracing Englacial Layers from MCoRDS Data in NW Greenland
by Siting Xiong, Jan-Peter Muller and Raquel Caro Carretero
Remote Sens. 2018, 10(1), 43; https://doi.org/10.3390/rs10010043 - 27 Dec 2017
Cited by 19 | Viewed by 6849
Abstract
Englacial layering reflects ice dynamics within the ice bodies, which improves understanding of ice flow variation, past accumulation rates and vertical flows transferring between the surface and the underlying bedrock. The internal layers can be observed by using Radar Echo Sounding (RES), such [...] Read more.
Englacial layering reflects ice dynamics within the ice bodies, which improves understanding of ice flow variation, past accumulation rates and vertical flows transferring between the surface and the underlying bedrock. The internal layers can be observed by using Radar Echo Sounding (RES), such as the Multi-channel Coherent Radar Depth Sounder (MCoRDS) used in NASA’s Operation IceBridge (OIB) mission. Since the 1960s, the accumulation of the RES data has prompted the development of automated methods to extract the englacial layers. In this study, we propose a new automated method that combines peak detection methods, namely the CWT-based peak detection or the Automatic Phase Picker (APP), with a Hough Transform (HT) to trace boundaries of englacial layers. For CWT-based peak detection, we test it using two different wavelets. The proposed method is tested with twelve MCoRDS radio echograms, which are acquired south of the Northern Greenland Eemian (NEEM) ice drilling site, where the folding of ice layers was observed. The method is evaluated in comparison to the isochrones that were extracted in an independent study. In comparison, the proposed new automated method can restore more than 70% of the englacial layers. This new automated layer-tracing method is publicly available on github. Full article
(This article belongs to the Special Issue Cryospheric Remote Sensing II)
Show Figures

Graphical abstract

20 pages, 7544 KiB  
Article
Comparison of Pixel- and Object-Based Approaches in Phenology-Based Rubber Plantation Mapping in Fragmented Landscapes
by Deli Zhai, Jinwei Dong, Georg Cadisch, Mingcheng Wang, Weili Kou, Jianchu Xu, Xiangming Xiao and Sawaid Abbas
Remote Sens. 2018, 10(1), 44; https://doi.org/10.3390/rs10010044 - 28 Dec 2017
Cited by 42 | Viewed by 6087
Abstract
The increasing expansion of rubber plantations throughout East and Southeast Asia urgently requires improved methods for effective mapping and monitoring. The phenological information from rubber plantations was found effective in rubber mapping. Previous studies have mostly applied rule-pixel-based phenology approaches for rubber plantations [...] Read more.
The increasing expansion of rubber plantations throughout East and Southeast Asia urgently requires improved methods for effective mapping and monitoring. The phenological information from rubber plantations was found effective in rubber mapping. Previous studies have mostly applied rule-pixel-based phenology approaches for rubber plantations mapping, which might result in broken patches in fragmented landscapes. This study introduces a new paradigm by combining phenology information with object-based classification to map fragmented patches of rubber plantations in Xishuangbanna. This research first delineated the time windows of the defoliation and foliation phases of rubber plantations by acquiring the temporal profile and phenological features of rubber plantations and natural forests through the Moderate Resolution Imaging Spectroradiometer (MODIS) Normalized Difference Vegetation Index (NDVI) data. To investigate the ability of finer resolution images at capturing the temporal profile or phenological information, 30 m resolution Landsat image data were used to capture the temporal profile, and a phenology algorithm to separate rubber plantations and natural forests was then defined. The derived phenology algorithm was used by both the object-based and pixel-based classification to investigate whether the object-based approach could improve the mapping accuracy. Whether adding the phenology information to the object-based classification could improve rubber plantation mapping accuracy in mountainous Xishuangbanna was also investigated. This resulted in three approaches: rule-pixel-based phenology, rule-object-based phenology, and nearest-neighbor-object-based phenology. The results showed that the rule-object-based phenology approaches (with overall accuracy 77.5% and Kappa Coefficients of 0.66) and nearest-neighbor-object-based phenology approach (91.0% and 0.86) achieved a higher accuracy than that of the rule-pixel-based phenology approach (72.7% and 0.59). The results proved that (1) object-based approaches could improve the accuracy of rubber plantation mapping compared to the pixel-based approach and (2) incorporating the phenological information from vegetation improved the overall accuracy of the thematic map. Full article
(This article belongs to the Section Forest Remote Sensing)
Show Figures

Graphical abstract

13 pages, 5173 KiB  
Article
Structural Assessment via Ground Penetrating Radar at the Consoli Palace of Gubbio (Italy)
by Ilaria Catapano, Giovanni Ludeno, Francesco Soldovieri, Francesco Tosti and Giuseppina Padeletti
Remote Sens. 2018, 10(1), 45; https://doi.org/10.3390/rs10010045 - 28 Dec 2017
Cited by 37 | Viewed by 5910
Abstract
Ground Penetrating Radar (GPR) is a flexible and cost-effective tool for performing structural integrity assessment and quick damage evaluation of manmade structures, including cultural heritage (CH) assets. In this context, this paper deals with the usefulness of GPR surveys enhanced by the use [...] Read more.
Ground Penetrating Radar (GPR) is a flexible and cost-effective tool for performing structural integrity assessment and quick damage evaluation of manmade structures, including cultural heritage (CH) assets. In this context, this paper deals with the usefulness of GPR surveys enhanced by the use of a Microwave Tomographic data processing approach as a methodology for the diagnosis and monitoring of CH exposed to climate events and natural hazards. Specifically, the paper reports on the results of a measurement campaign carried out at the Loggia of the Consoli Palace of Gubbio (Italy). These results allowed us to increase our knowledge of the architecture of the surveyed zones and their structural hazards. Full article
(This article belongs to the Special Issue Advances in Remote Sensing for Archaeological Heritage)
Show Figures

28 pages, 11270 KiB  
Article
Comparing Pixel- and Object-Based Approaches in Effectively Classifying Wetland-Dominated Landscapes
by Tedros M. Berhane, Charles R. Lane, Qiusheng Wu, Oleg A. Anenkhonov, Victor V. Chepinoga, Bradley C. Autrey and Hongxing Liu
Remote Sens. 2018, 10(1), 46; https://doi.org/10.3390/rs10010046 - 28 Dec 2017
Cited by 59 | Viewed by 8176
Abstract
Wetland ecosystems straddle both terrestrial and aquatic habitats, performing many ecological functions directly and indirectly benefitting humans. However, global wetland losses are substantial. Satellite remote sensing and classification informs wise wetland management and monitoring. Both pixel- and object-based classification approaches using parametric and [...] Read more.
Wetland ecosystems straddle both terrestrial and aquatic habitats, performing many ecological functions directly and indirectly benefitting humans. However, global wetland losses are substantial. Satellite remote sensing and classification informs wise wetland management and monitoring. Both pixel- and object-based classification approaches using parametric and non-parametric algorithms may be effectively used in describing wetland structure and habitat, but which approach should one select? We conducted both pixel- and object-based image analyses (OBIA) using parametric (Iterative Self-Organizing Data Analysis Technique, ISODATA, and maximum likelihood, ML) and non-parametric (random forest, RF) approaches in the Barguzin Valley, a large wetland (~500 km2) in the Lake Baikal, Russia, drainage basin. Four Quickbird multispectral bands plus various spatial and spectral metrics (e.g., texture, Non-Differentiated Vegetation Index, slope, aspect, etc.) were analyzed using field-based regions of interest sampled to characterize an initial 18 ISODATA-based classes. Parsimoniously using a three-layer stack (Quickbird band 3, water ratio index (WRI), and mean texture) in the analyses resulted in the highest accuracy, 87.9% with pixel-based RF, followed by OBIA RF (segmentation scale 5, 84.6% overall accuracy), followed by pixel-based ML (83.9% overall accuracy). Increasing the predictors from three to five by adding Quickbird bands 2 and 4 decreased the pixel-based overall accuracy while increasing the OBIA RF accuracy to 90.4%. However, McNemar’s chi-square test confirmed no statistically significant difference in overall accuracy among the classifiers (pixel-based ML, RF, or object-based RF) for either the three- or five-layer analyses. Although potentially useful in some circumstances, the OBIA approach requires substantial resources and user input (such as segmentation scale selection—which was found to substantially affect overall accuracy). Hence, we conclude that pixel-based RF approaches are likely satisfactory for classifying wetland-dominated landscapes. Full article
(This article belongs to the Special Issue Remote Sensing of Floodpath Lakes and Wetlands)
Show Figures

Graphical abstract

20 pages, 11520 KiB  
Article
Assessing Spatiotemporal Characteristics of Urbanization Dynamics in Southeast Asia Using Time Series of DMSP/OLS Nighttime Light Data
by Min Zhao, Weiming Cheng, Chenghu Zhou, Manchun Li, Kun Huang and Nan Wang
Remote Sens. 2018, 10(1), 47; https://doi.org/10.3390/rs10010047 - 8 Jan 2018
Cited by 76 | Viewed by 7060
Abstract
Intraregional spatial variations of satellite-derived anthropogenic nighttime light signals are gradually applied to identify different lighting areas with various socioeconomic activity and urbanization levels when characterizing urbanization dynamics. However, most previous partitioning approaches are carried out at local scales, easily leading to multi-standards [...] Read more.
Intraregional spatial variations of satellite-derived anthropogenic nighttime light signals are gradually applied to identify different lighting areas with various socioeconomic activity and urbanization levels when characterizing urbanization dynamics. However, most previous partitioning approaches are carried out at local scales, easily leading to multi-standards of the extracted results from local areas, and this inevitably hinders the comparative analysis on the urbanization dynamics of the large region. Therefore, a partitioning approach considering the characteristics of nighttime light signals at both local and regional scales is necessary for studying spatiotemporal characteristics of urbanization dynamics across the large region using nighttime light imagery. Based on the quadratic relationships between the pixel-level nighttime light brightness and the corresponding spatial gradient for individual cities, we here proposed an improved partitioning approach to quickly identify different types of nighttime lighting areas for the entire region of Southeast Asia. Using the calibrated Defense Meteorological Satellite Program/Operational Line-scan System (DMSP/OLS) data with greater comparability, continuity, and intra-urban variability, the annual nighttime light imagery spanning years 1992–2013 were divided into four types of nighttime lighting areas: low, medium, high, and extremely high, associated with different intensity of anthropogenic activity. The results suggest that Southeast Asia has experienced a rapid and diverse urbanization process from 1992 to 2013. Areas with moderate or low anthropogenic activity show a faster growth rate for the spatial expansion than the developed areas with intense anthropogenic activity. Transitions between different nighttime lighting types potentially depict the trajectory of urban development, the darker areas are gradually transitioning to areas with higher lighting, indicating conspicuous trends of gradually intensified anthropogenic activity from central areas to periphery areas, and from megacities to small cities. Additionally, satellite-derived nighttime lighting areas are in good agreement with the radar-derived human settlements, with dense human settlements in extremely high and high nighttime lighting areas, while sparse human settlements in low nighttime lighting areas. Full article
Show Figures

Graphical abstract

10 pages, 8859 KiB  
Article
A Land Product Characterization System for Comparative Analysis of Satellite Data and Products
by Kevin Gallo, Greg Stensaas, John Dwyer and Ryan Longhenry
Remote Sens. 2018, 10(1), 48; https://doi.org/10.3390/rs10010048 - 29 Dec 2017
Cited by 7 | Viewed by 5053
Abstract
A Land Product Characterization System (LPCS) has been developed to provide land data and products to the community of individuals interested in validating space-based land products by comparing them with similar products available from other sensors or surface-based observations. The LPCS facilitates the [...] Read more.
A Land Product Characterization System (LPCS) has been developed to provide land data and products to the community of individuals interested in validating space-based land products by comparing them with similar products available from other sensors or surface-based observations. The LPCS facilitates the application of global multi-satellite and in situ data for characterization and validation of higher-level, satellite-derived, land surface products (e.g., surface reflectance, normalized difference vegetation index, and land surface temperature). The LPCS includes data search, inventory, access, and analysis functions that will permit data to be easily identified, retrieved, co-registered, and compared statistically through a single interface. The system currently includes data and products available from Landsat 4 through 8, Moderate Resolution Imaging Spectroradiometer (MODIS) Terra and Aqua, Suomi National Polar-Orbiting Partnership (S-NPP)/Joint Polar Satellite System (JPSS) Visible Infrared Imaging Radiometer Suite (VIIRS), and simulated data for the Geostationary Operational Environmental Satellite (GOES)-16 Advanced Baseline Imager (ABI). In addition to the future inclusion of in situ data, higher-level land products from the European Space Agency (ESA) Sentinel-2 and -3 series of satellites, and other high and medium resolution spatial sensors, will be included as available. When fully implemented, any of the sensor data or products included in the LPCS would be available for comparative analysis. Full article
(This article belongs to the Special Issue Quantitative Remote Sensing of Land Surface Variables)
Show Figures

Graphical abstract

20 pages, 43494 KiB  
Article
Assessing the Performance of a Low-Cost Method for Video-Monitoring the Water Surface and Bed Level in the Swash Zone of Natural Beaches
by Raimundo Ibaceta, Rafael Almar, Patricio A. Catalán, Chris E. Blenkinsopp, Luis P. Almeida and Rodrigo Cienfuegos
Remote Sens. 2018, 10(1), 49; https://doi.org/10.3390/rs10010049 - 2 Jan 2018
Cited by 10 | Viewed by 4553
Abstract
A method to continuously measure bed and water levels along a cross-shore transect of vertical poles is evaluated. This remote sensing based method uses video imagery of swash flows propagating past an array of vertical poles buried on the beach face. Using datasets [...] Read more.
A method to continuously measure bed and water levels along a cross-shore transect of vertical poles is evaluated. This remote sensing based method uses video imagery of swash flows propagating past an array of vertical poles buried on the beach face. Using datasets collected at two beaches in Chile, the method is compared against measurements obtained with conventional co-localized instruments: LiDAR and ultrasonic distance meters. The present video swash pole technique shows good skill in retrieving swash zone bed level and water levels, while providing the possibility to measure morphological variations at time scales varying from wave groups (tens of seconds) to hours. Discrepancies between video and ultrasonic distance meters are found when short time scales are used, for both depositional and erosion events, but longer duration trends are captured well. Water surface elevations at the wave-by-wave scale proved to be accurate for the backwash phase (root-mean-sqaure-error, RMSE down to 0.028 m, R 2 up to 0.89), when compared against LiDAR. However, discrepancies have been found during the uprush phase (RMSE up to 0.062 m, R 2 down to 0.71), when the influence of the pole on the swash flow generates an overestimation of the water surface. Overall, owing to its simplicity of deployment, low cost and reasonable accuracy, the technique is considered suitable for swash studies. Full article
(This article belongs to the Special Issue Instruments and Methods for Ocean Observation and Monitoring)
Show Figures

Graphical abstract

25 pages, 4599 KiB  
Article
Improving Selection of Spectral Variables for Vegetation Classification of East Dongting Lake, China, Using a Gaofen-1 Image
by Renfei Song, Hui Lin, Guangxing Wang, Enping Yan and Zilin Ye
Remote Sens. 2018, 10(1), 50; https://doi.org/10.3390/rs10010050 - 29 Dec 2017
Cited by 18 | Viewed by 3871
Abstract
There is a large amount of remote sensing data available for land use and land cover (LULC) classification and thus optimizing selection of remote sensing variables is a great challenge. Although many methods such as Jeffreys–Matusita (JM) distance and random forests [...] Read more.
There is a large amount of remote sensing data available for land use and land cover (LULC) classification and thus optimizing selection of remote sensing variables is a great challenge. Although many methods such as Jeffreys–Matusita (JM) distance and random forests (RF) have been developed for this purpose, the existing methods ignore correlation and information duplication among remote sensing variables. In this study, a novel approach was proposed to improve the measures of potential class separability for the selection of remote sensing variables by taking into account correlations among the variables. The proposed method was examined with a total of thirteen spectral variables from a Gaofen-1 image, three class separability measures including JM distance, transformed divergence and B-distance and three classifiers including Bayesian discriminant (BD), Mahalanobis distance (MD) and RF for classification of six LULC types at the East Dongting Lake of Hunan, China. The results showed that (1) The proposed approach selected the first three spectral variables and resulted in statistically stable classification accuracies for three improved class separability measures. That is, the classification accuracies using three or more spectral variables statistically did not significantly differ from each other at a significant level of 0.05; (2) The statistically stable classification accuracies obtained by integrating MD and BD classifiers with the improved class separability measures were also statistically not significantly different from those by RF; (3) The numbers of the selected spectral variables using the improved class separability measures to create the statistically stable classification accuracies by MD and BD classifiers were much smaller than those from the original class separability measures and RF; and (4) Three original class separability measures and RF led to similar ranks of importance of the spectral variables, while the ranks achieved by the improved class separability measures were different due to the consideration of correlations among the variables. This indicated that the proposed method more effectively and quickly selected the spectral variables to produce the statistically stable classification accuracies compared with the original class separability measures and RF and thus improved the selection of the spectral variables for the classification. Full article
Show Figures

Graphical abstract

20 pages, 9230 KiB  
Article
Monitoring Inter- and Intra-Seasonal Dynamics of Rapidly Degrading Ice-Rich Permafrost Riverbanks in the Lena Delta with TerraSAR-X Time Series
by Samuel Stettner, Alison L. Beamish, Annett Bartsch, Birgit Heim, Guido Grosse, Achim Roth and Hugues Lantuit
Remote Sens. 2018, 10(1), 51; https://doi.org/10.3390/rs10010051 - 29 Dec 2017
Cited by 30 | Viewed by 7730
Abstract
Arctic warming is leading to substantial changes to permafrost including rapid degradation of ice and ice-rich coasts and riverbanks. In this study, we present and evaluate a high spatiotemporal resolution three-year time series of X-Band microwave satellite data from the TerraSAR-X (TSX) satellite [...] Read more.
Arctic warming is leading to substantial changes to permafrost including rapid degradation of ice and ice-rich coasts and riverbanks. In this study, we present and evaluate a high spatiotemporal resolution three-year time series of X-Band microwave satellite data from the TerraSAR-X (TSX) satellite to quantify cliff-top erosion (CTE) of an ice-rich permafrost riverbank in the central Lena Delta. We apply a threshold on TSX backscatter images and automatically extract cliff-top lines to derive intra- and inter-annual CTE. In order to examine the drivers of erosion we statistically compare CTE with climatic baseline data using linear mixed models and analysis of variance (ANOVA). Our evaluation of TSX-derived CTE against annual optical-derived CTE and seasonal in situ measurements showed good agreement between all three datasets. We observed continuous erosion from June to September in 2014 and 2015 with no significant seasonality across the thawing season. We found the highest net annual cliff-top erosion of 6.9 m in 2014, in accordance with above-average mean temperatures and thawing degree days as well as low precipitation. We found high net annual erosion and erosion variability in 2015 associated with moderate mean temperatures but above average precipitation. According to linear mixed models, climate parameters alone could not explain intra-seasonal erosional patterns and additional factors such as ground ice content likely drive the observed erosion. Finally, mean backscatter intensity on the cliff surface decreased from −5.29 to −6.69 dB from 2013 to 2015, respectively, likely resulting from changes in surface geometry and properties that could be connected to partial slope stabilization. Overall, we conclude that X-Band backscatter time series can successfully be used to complement optical remote sensing and in situ monitoring of rapid tundra permafrost erosion at riverbanks and coasts by reliably providing information about intra-seasonal dynamics. Full article
(This article belongs to the Special Issue Remote Sensing of Arctic Tundra)
Show Figures

Figure 1

14 pages, 2247 KiB  
Article
Effective Fusion of Multi-Modal Remote Sensing Data in a Fully Convolutional Network for Semantic Labeling
by Wenkai Zhang, Hai Huang, Matthias Schmitz, Xian Sun, Hongqi Wang and Helmut Mayer
Remote Sens. 2018, 10(1), 52; https://doi.org/10.3390/rs10010052 - 29 Dec 2017
Cited by 37 | Viewed by 7674
Abstract
In recent years, Fully Convolutional Networks (FCN) have led to a great improvement of semantic labeling for various applications including multi-modal remote sensing data. Although different fusion strategies have been reported for multi-modal data, there is no in-depth study of the reasons of [...] Read more.
In recent years, Fully Convolutional Networks (FCN) have led to a great improvement of semantic labeling for various applications including multi-modal remote sensing data. Although different fusion strategies have been reported for multi-modal data, there is no in-depth study of the reasons of performance limits. For example, it is unclear, why an early fusion of multi-modal data in FCN does not lead to a satisfying result. In this paper, we investigate the contribution of individual layers inside FCN and propose an effective fusion strategy for the semantic labeling of color or infrared imagery together with elevation (e.g., Digital Surface Models). The sensitivity and contribution of layers concerning classes and multi-modal data are quantified by recall and descent rate of recall in a multi-resolution model. The contribution of different modalities to the pixel-wise prediction is analyzed explaining the reason of the poor performance caused by the plain concatenation of different modalities. Finally, based on the analysis an optimized scheme for the fusion of layers with image and elevation information into a single FCN model is derived. Experiments are performed on the ISPRS Vaihingen 2D Semantic Labeling dataset (infrared and RGB imagery as well as elevation) and the Potsdam dataset (RGB imagery and elevation). Comprehensive evaluations demonstrate the potential of the proposed approach. Full article
Show Figures

Figure 1

27 pages, 6708 KiB  
Article
Issues with Large Area Thematic Accuracy Assessment for Mapping Cropland Extent: A Tale of Three Continents
by Kamini Yadav and Russell G. Congalton
Remote Sens. 2018, 10(1), 53; https://doi.org/10.3390/rs10010053 - 30 Dec 2017
Cited by 15 | Viewed by 5697
Abstract
Accurate, consistent and timely cropland information over large areas is critical to solve food security issues. To predict and respond to food insecurity, global cropland products are readily available from coarse and medium spatial resolution earth observation data. However, while the use of [...] Read more.
Accurate, consistent and timely cropland information over large areas is critical to solve food security issues. To predict and respond to food insecurity, global cropland products are readily available from coarse and medium spatial resolution earth observation data. However, while the use of satellite imagery has great potential to identify cropland areas and their specific types, the full potential of this imagery has yet to be realized due to variability of croplands in different regions. Despite recent calls for statistically robust and transparent accuracy assessment, more attention regarding the accuracy assessment of large area cropland maps is still needed. To conduct a valid assessment of cropland maps, different strategies, issues and constraints need to be addressed depending upon various conditions present in each continent. This study specifically focused on dealing with some specific issues encountered when assessing the cropland extent of North America (confined to the United States), Africa and Australia. The process of accuracy assessment was performed using a simple random sampling design employed within defined strata (i.e., Agro-Ecological Zones (AEZ’s) for the US and Africa and a buffer zone approach around the cropland areas of Australia. Continent-specific sample analysis was performed to ensure that an appropriate reference data set was used to generate a valid error matrix indicative of the actual cropland proportion. Each accuracy assessment was performed within the homogenous regions (i.e., strata) of different continents using different sources of reference data to produce rigorous and valid accuracy results. The results indicate that continent-specific modified assessments performed for the three selected continents demonstrate that the accuracy assessment can be easily accomplished for a large area such as the US that has extensive availability of reference data while more modifications were needed in the sampling design for other continents that had little to no reference data and other constraints. Each continent provided its own unique challenges and opportunities. Therefore, this paper describes a tale of these three continents providing recommendations to adapt accuracy assessment strategies and methodologies for validating global cropland extent maps. Full article
(This article belongs to the Special Issue Uncertainty in Remote Sensing Image Analysis)
Show Figures

Graphical abstract

13 pages, 1061 KiB  
Article
LakeTime: Automated Seasonal Scene Selection for Global Lake Mapping Using Landsat ETM+ and OLI
by Evan A. Lyons and Yongwei Sheng
Remote Sens. 2018, 10(1), 54; https://doi.org/10.3390/rs10010054 - 31 Dec 2017
Cited by 15 | Viewed by 5693
Abstract
The Landsat series of satellites provide a nearly continuous, high resolution data record of the Earth surface from the early 1970s through to the present. The public release of the entire Landsat archive, free of charge, along with modern computing capacity, has enabled [...] Read more.
The Landsat series of satellites provide a nearly continuous, high resolution data record of the Earth surface from the early 1970s through to the present. The public release of the entire Landsat archive, free of charge, along with modern computing capacity, has enabled Earth monitoring at the global scale with high spatial resolution. With the large data volume and seasonality varying across the globe, image selection is a particularly important challenge for regional and global multitemporal studies to remove the interference of seasonality from long term trends. This paper presents an automated method for selecting images for global scale lake mapping to minimize the influence of seasonality, while maintaining long term trends in lake surface area dynamics. Using historical meteorological data and a simple water balance model, we define the most stable period after the rainy season, when inflows equal outflows, independently for each Landsat tile and select images acquired during that ideal period for lake surface area mapping. The images selected using this method provide nearly complete global area coverage at decadal episodes for circa 2000 and circa 2014 from Landsat Enhanced Thematic Mapper Plus (ETM+) and Operational Land Imager (OLI) sensors, respectively. This method is being used in regional and global lake dynamics mapping projects, and is potentially applicable to any regional/global scale remote sensing application. Full article
(This article belongs to the Special Issue Remote Sensing of Floodpath Lakes and Wetlands)
Show Figures

Figure 1

30 pages, 53792 KiB  
Article
Using Multitemporal Sentinel-1 C-band Backscatter to Monitor Phenology and Classify Deciduous and Coniferous Forests in Northern Switzerland
by Marius Rüetschi, Michael E. Schaepman and David Small
Remote Sens. 2018, 10(1), 55; https://doi.org/10.3390/rs10010055 - 31 Dec 2017
Cited by 91 | Viewed by 12697
Abstract
Efficient methods to monitor forested areas help us to better understand their processes. To date, only a few studies have assessed the usability of multitemporal synthetic aperture radar (SAR) datasets in this context. Here we present an analysis of an unprecedented set of [...] Read more.
Efficient methods to monitor forested areas help us to better understand their processes. To date, only a few studies have assessed the usability of multitemporal synthetic aperture radar (SAR) datasets in this context. Here we present an analysis of an unprecedented set of C-band observations of mixed temperate forests. We demonstrate the potential of using multitemporal C-band VV and VH polarisation data for monitoring phenology and classifying forests in northern Switzerland. Each SAR acquisition was first radiometrically terrain corrected using digital elevation model-based image simulations of the local illuminated area. The flattened backscatter values and the local area values were input to a temporal compositing process integrating backscatter values from ascending and descending tracks. The process used local resolution weighting of each input, producing composite backscatter values that strongly mitigated terrain-induced distortions. Several descriptors were calculated to show the seasonal variation of European beech (Fagus sylvatica), oak (Quercus robur, Quercus petraea) and Norway spruce (Picea abies) in C-band data. Using their distinct seasonal signatures, the timing of leaf emergence and leaf fall of the deciduous species were estimated and compared to available ground observations. Furthermore, classifications for the forest types ‘deciduous’ and ‘coniferous’ and the investigated species were implemented using random forest classifiers. The deciduous species backscatter was about 1 dB higher than spruce throughout the year in both polarisations. The forest types showed opposing seasonal backscatter behaviours. At VH, deciduous species showed higher backscatter in winter than in summer, whereas spruce showed higher backscatter in summer than in winter. In VV, this pattern was similar for spruce, while no distinct seasonal behaviour was apparent for the deciduous species. The time differences between the estimations and the ground observations of the phenological events were approximately within the error margin ( ± 12 days) of the temporal resolution. The classification performances were promising, with higher accuracies achieved for the forest types (OA of 86% and κ = 0.73) than for individual species (OA of 72% and κ = 0.58). These results show that multitemporal C-band backscatter data have significant potential to supplement optical remote sensing data for ecological studies and mapping of mixed temperate forests. Full article
(This article belongs to the Section Forest Remote Sensing)
Show Figures

Graphical abstract

17 pages, 8481 KiB  
Article
Sensitivity of BRDF, NDVI and Wind Speed to the Aerodynamic Roughness Length over Sparse Tamarix in the Downstream Heihe River Basin
by Qiang Xing, Bingfang Wu, Nana Yan, Mingzhao Yu and Weiwei Zhu
Remote Sens. 2018, 10(1), 56; https://doi.org/10.3390/rs10010056 - 1 Jan 2018
Cited by 5 | Viewed by 3986
Abstract
The aerodynamic roughness length (z0m) is an important parameter that affects the momentum and energy exchange between the earth surface’s and the atmosphere. In this paper, the gradient wind speed data that were observed from May to October, 2014, at the Si Daoqiao [...] Read more.
The aerodynamic roughness length (z0m) is an important parameter that affects the momentum and energy exchange between the earth surface’s and the atmosphere. In this paper, the gradient wind speed data that were observed from May to October, 2014, at the Si Daoqiao station, which is located in an area of sparse Tamarix in the downstream region of the Heihe River Basin (HRB), are used to evaluate the sensitivity of the moderate-resolution imaging spectroradiometer (MODIS) near-infrared (NIR) bi-directional reflectance distribution function (BRDF) R, the MODIS/Landsat 8 normalized difference vegetation index (NDVI), and the wind speed at 5 m in comparison with the field-measured z0m. The results indicate that the NIR BRDF_R_MODIS and the NDVIMODIS/NDVILandsat8 are less sensitive indicators of the z0m over sparse Tamarix areas (R2: 0.0045 for NIR BRDF_RMODIS; R2: 0.0342 for NDVIMODIS; and, R2: 0.1646 for NDVILandsat8), which differs significantly from the results obtained by previous studies for farmlands and grasslands. However, there is a nearly linear correlation between the wind speed at 5 m and the z0m at the time scale of the NDVILandsat8 acquisitions (R2: 0.3696). Furthermore, the combination of the NDVI and wind speed at 5 m can significantly improve this correlation (R2: 0.7682 for NDVIMODIS; R2: 0.6304 for NDVILandsat8), whereas the combination of the NIR BRDF_RMODIS and wind speed at 5 m still has a low correlation (R2: 0.0886). Finally, the regional z0m of the oasis in the downstream region of the HRB was determined using Landsat 8 surface reflectance data and the wind speed data at the Si Daoqiao station, which properly reflect the temporal evolution of the z0m in that region. The parameterization scheme proposed in this paper has great potential to be applied to evapotranspiration, land surface, and hydrologic model simulations of sparse Tamarix at Si Daoqiao site in the future. Full article
Show Figures

Graphical abstract

19 pages, 3391 KiB  
Article
Early Detection of Vitality Changes of Multi-Temporal Norway Spruce Laboratory Needle Measurements—The Ring-Barking Experiment
by Anne Reichmuth, Lea Henning, Nicole Pinnel, Martin Bachmann and Derek Rogge
Remote Sens. 2018, 10(1), 57; https://doi.org/10.3390/rs10010057 - 3 Jan 2018
Cited by 10 | Viewed by 5228
Abstract
The focus of this analysis is on the early detection of forest health changes, specifically that of Norway spruce (Picea abies L. Karst.). In this analysis, we planned to examine the time (degree of early detection), spectral wavelengths and appropriate method for [...] Read more.
The focus of this analysis is on the early detection of forest health changes, specifically that of Norway spruce (Picea abies L. Karst.). In this analysis, we planned to examine the time (degree of early detection), spectral wavelengths and appropriate method for detecting vitality changes. To accomplish this, a ring-barking experiment with seven subsequent laboratory needle measurements was carried out in 2013 and 2014 in an area in southeastern Germany near Altötting. The experiment was also accompanied by visual crown condition assessment. In total, 140 spruce trees in groups of five were ring-barked with the same number of control trees in groups of five that were selected as reference trees in order to compare their development. The laboratory measurements were analysed regarding the separability of ring-barked and control samples using spectral reflectance, vegetation indices and derivative analysis. Subsequently, a random forest classifier for determining important spectral wavelength regions was applied. Results from the methods are consistent and showed a high importance of the visible (VIS) spectral region, very low importance of the near-infrared (NIR) and minor importance of the shortwave infrared (SWIR) spectral region. Using spectral reflectance data as well as indices, the earliest separation time was found to be 292 days after ring-barking. The derivative analysis showed that a significant separation was observed 152 days after ring-barking for six spectral features spread through VIS and SWIR. A significant separation was detected using a random forest classifier 292 days after ring-barking with 58% separability. The visual crown condition assessment was analysed regarding obvious changes of vitality and the first indication was observed 302 days after ring-barking as bark beetle infestation and yellowing of foliage in the ring-barked trees only. This experiment shows that an early detection, compared with visual crown assessment, is possible using the proposed methods for this specific data set. This study will contribute to ongoing research for early detection of vitality changes that will support foresters and decision makers. Full article
Show Figures

Graphical abstract

25 pages, 18176 KiB  
Article
Incorporation of Satellite Data and Uncertainty in a Nationwide Groundwater Recharge Model in New Zealand
by Rogier Westerhoff, Paul White and Zara Rawlinson
Remote Sens. 2018, 10(1), 58; https://doi.org/10.3390/rs10010058 - 3 Jan 2018
Cited by 12 | Viewed by 6529
Abstract
A nationwide model of groundwater recharge for New Zealand (NGRM), as described in this paper, demonstrated the benefits of satellite data and global models to improve the spatial definition of recharge and the estimation of recharge uncertainty. NGRM was inspired by the global-scale [...] Read more.
A nationwide model of groundwater recharge for New Zealand (NGRM), as described in this paper, demonstrated the benefits of satellite data and global models to improve the spatial definition of recharge and the estimation of recharge uncertainty. NGRM was inspired by the global-scale WaterGAP model but with the key development of rainfall recharge calculation on scales relevant to national- and catchment-scale studies (i.e., a 1 km × 1 km cell size and a monthly timestep in the period 2000–2014) provided by satellite data (i.e., MODIS-derived evapotranspiration, AET and vegetation) in combination with national datasets of rainfall, elevation, soil and geology. The resulting nationwide model calculates groundwater recharge estimates, including their uncertainty, consistent across the country, which makes the model unique compared to all other New Zealand estimates targeted towards groundwater recharge. At the national scale, NGRM estimated an average recharge of 2500 m 3 /s, or 298 mm/year, with a model uncertainty of 17%. Those results were similar to the WaterGAP model, but the improved input data resulted in better spatial characteristics of recharge estimates. Multiple uncertainty analyses led to these main conclusions: the NGRM model could give valuable initial estimates in data-sparse areas, since it compared well to most ground-observed lysimeter data and local recharge models; and the nationwide input data of rainfall and geology caused the largest uncertainty in the model equation, which revealed that the satellite data could improve spatial characteristics without significantly increasing the uncertainty. Clearly the increasing volume and availability of large-scale satellite data is creating more opportunities for the application of national-scale models at the catchment, and smaller, scales. This should result in improved utility of these models including provision of initial estimates in data-sparse areas. Topics for future collaborative research associated with the NGRM model include: improvement of rainfall-runoff models, establishment of snowmelt and river recharge modules, further improvement of estimates of rainfall and AET, and satellite-derived AET in irrigated areas. Importantly, the quantification of uncertainty, which should be associated with all future models, should give further impetus to field measurements of rainfall recharge for the purpose of model calibration. Full article
(This article belongs to the Special Issue Remote Sensing of Groundwater from River Basin to Global Scales)
Show Figures

Graphical abstract

18 pages, 3946 KiB  
Article
Wind in Complex Terrain—Lidar Measurements for Evaluation of CFD Simulations
by Andrea Risan, John Amund Lund, Chi-Yao Chang and Lars Sætran
Remote Sens. 2018, 10(1), 59; https://doi.org/10.3390/rs10010059 - 4 Jan 2018
Cited by 25 | Viewed by 7158
Abstract
Computational Fluid Dynamics (CFD) is widely used to predict wind conditions for wind energy production purposes. However, as wind power development expands into areas of even more complex terrain and challenging flow conditions, more research is needed to investigate the ability of such [...] Read more.
Computational Fluid Dynamics (CFD) is widely used to predict wind conditions for wind energy production purposes. However, as wind power development expands into areas of even more complex terrain and challenging flow conditions, more research is needed to investigate the ability of such models to describe turbulent flow features. In this study, the performance of a hybrid Reynolds-Averaged Navier-Stokes (RANS)/Large Eddy Simulation (LES) model in highly complex terrain has been investigated. The model was compared with measurements from a long range pulsed Lidar, which first were validated with sonic anemometer data. The accuracy of the Lidar was considered to be sufficient for validation of flow model turbulence estimates. By reducing the range gate length of the Lidar a slight additional improvement in accuracy was obtained, but the availability of measurements was reduced due to the increased noise floor in the returned signal. The DES model was able to capture the variations of velocity and turbulence along the line-of-sight of the Lidar beam but overestimated the turbulence level in regions of complex flow. Full article
(This article belongs to the Special Issue Remote Sensing of Atmospheric Conditions for Wind Energy Applications)
Show Figures

Graphical abstract

19 pages, 6948 KiB  
Article
An Improved Predicted Model for BDS Ultra-Rapid Satellite Clock Offsets
by Guanwen Huang, Bobin Cui, Qin Zhang, Wenju Fu and Pingli Li
Remote Sens. 2018, 10(1), 60; https://doi.org/10.3390/rs10010060 - 4 Jan 2018
Cited by 74 | Viewed by 5960
Abstract
The satellite clocks used in the BeiDou-2 satellite navigation System (BDS) are Chinese self-developed Rb atomic clocks, and their performances and stabilities are worse than GPS and Galileo satellite clocks. Due to special periodic noises and nonlinear system errors existing in the BDS [...] Read more.
The satellite clocks used in the BeiDou-2 satellite navigation System (BDS) are Chinese self-developed Rb atomic clocks, and their performances and stabilities are worse than GPS and Galileo satellite clocks. Due to special periodic noises and nonlinear system errors existing in the BDS clock offset series, the GPS ultra-rapid clock model, which uses a simple quadratic polynomial plus one periodic is not suitable for BDS. Therefore, an improved prediction model for BDS satellite clocks is proposed in order to enhance the precision of ultra-rapid predicted clock offsets. First, a basic quadratic polynomial model which is fit for the rubidium (Rb) clock is constructed for BDS. Second, the main cyclic terms are detected and identified by the Fast Fourier Transform (FFT) method according to every satellite clock offset series. The detected results show that most BDS clocks have special cyclic terms which are different from the orbit periods. Therefore, two main cyclic terms are added to absorb the periodic effects. Third, after the quadratic polynomial plus two periodic fitting, some evident nonlinear system errors also exist in the model residual, and the Back Propagation (BP) neural network model is chosen to compensate for these nonlinear system errors. The simulation results show that the performance and precision using the improved model are better than that of China iGMAS ultra-rapid prediction (ISU-P) products and the Deutsches GeoForschungsZentrum GFZ BDS ultra-rapid prediction (GBU-P) products. Comparing to ISU-P products, the average improvements using the proposed model in 3 h, 6 h, 12 h and 24 h are 23.1%, 21.3%, 20.2%, and 19.8%, respectively. Meanwhile the accuracy improvements of the proposed model are 9.9%, 13.9%, 17.3%, and 21.2% compared to GBU-P products. In addition, the kinematic Precise Point Positioning (PPP) example using 8 Multi-GNSS Experiment MGEX stations shows that the precision based on the proposed clock model has improved about 16%, 14%, and 38% in the North (N), East (E) and Height (H) components. Full article
Show Figures

Graphical abstract

18 pages, 18290 KiB  
Article
Using a MODIS Index to Quantify MODIS-AVHRRs Spectral Differences in the Visible Band
by Xingwang Fan and Yuanbo Liu
Remote Sens. 2018, 10(1), 61; https://doi.org/10.3390/rs10010061 - 4 Jan 2018
Cited by 5 | Viewed by 5147
Abstract
Spectral band differences are a critical issue for progressing into an integrated earth observation framework and in particular, in sensor intercalibration. The differences are currently normalized using spectral band adjustment factor (SBAF) that is generated from hyperspectral data. In this context, the current [...] Read more.
Spectral band differences are a critical issue for progressing into an integrated earth observation framework and in particular, in sensor intercalibration. The differences are currently normalized using spectral band adjustment factor (SBAF) that is generated from hyperspectral data. In this context, the current study proposes a method for calculating moderate-resolution imaging spectroradiometer (MODIS)-advanced very high resolution radiometers (AVHRRs) SBAF in the visible band, using the MODIS surface reflectance data. The method involves a uniform ratio index calculated using the MODIS 552-nm and 645-nm bands, and a sensor-specific quadratic equation, producing SBAF data at 500-m spatial resolution. The calculated SBAFs are in good agreement at site scale with literature reported data (relative error < 1.0%), and at local scale with Hyperion-derived data (total uncertainty ≈ 0.001), and significantly improve MODIS-AVHRR surface reflectance data consistency in the visible band (better than 1.0% reflectance units). The calculation is more sensitive to atmospheric effects over the vegetated areas. At global scale, MODIS-AVHRRs SBAFs are generally large (>1.0) over densely vegetated areas and extremely low over deserts and barren lands (0.96–0.98), indicative of large MODIS-AVHRRs differences. Deserts show temporally stable SBAF values, while still suffer from intra-annual BRDF effects and short-term cloud contamination. By means of daily MODIS data, the proposed method can produce ongoing SBAF data at a spatial scale that is comparable to AVHRRs. It increases the sampling of MODIS-AVHRRs image pairs for intercalibration, and offers insight into spectral band conversion, finally contributing to an integrated earth observation at moderate spatial resolutions. Full article
(This article belongs to the Special Issue Analysis of Multi-temporal Remote Sensing Images)
Show Figures

Graphical abstract

15 pages, 5583 KiB  
Article
3-D Water Vapor Tomography in Wuhan from GPS, BDS and GLONASS Observations
by Zhounan Dong and Shuanggen Jin
Remote Sens. 2018, 10(1), 62; https://doi.org/10.3390/rs10010062 - 4 Jan 2018
Cited by 57 | Viewed by 7079
Abstract
Three-dimensional water vapor can be reconstructed from Global Navigation Satellite System (GNSS) observations, which can study 3-D profile variations of atmospheric water vapor and climate. However, there is a large uncertainty of water vapor tomography from single GPS system observations due to limited [...] Read more.
Three-dimensional water vapor can be reconstructed from Global Navigation Satellite System (GNSS) observations, which can study 3-D profile variations of atmospheric water vapor and climate. However, there is a large uncertainty of water vapor tomography from single GPS system observations due to limited satellites. The rapid development of multi-GNSS, including China’s Beidou Navigation Satellite System (BDS) and Russia’s GLONASS, has greatly improved the geometric distribution of satellite ray-path signals, which may improve the performance of water vapor tomography by combining multi-GNSS. In this paper, 3-D water vapor tomography results are the first time obtained using multi-GNSS data from Continuously Operating Reference Stations (CORS) network in Wuhan, China, whose performances are validated by radiosonde and the latest ECMWF ERA5 reanalysis products. The results show that the integrated multi-GNSS can pronouncedly increase the number of effective signals, and 3-D water vapor results are better than those from the GPS-only system, improving by 5% with GPS + GLONASS or GPS + GLONASS + BDS, while BDS has results that are not improved too much. Therefore, multi-GNSS will enhance the reliability and accuracy of 3-D water vapor tomography, which has more potential applications in the future. Full article
Show Figures

Graphical abstract

19 pages, 13223 KiB  
Article
Improved Modeling of Global Ionospheric Total Electron Content Using Prior Information
by Cheng Wang, Chuang Shi, Lei Fan and Hongping Zhang
Remote Sens. 2018, 10(1), 63; https://doi.org/10.3390/rs10010063 - 5 Jan 2018
Cited by 37 | Viewed by 5823
Abstract
The Ionosphere Working Group of the International GNSS Service (IGS) has been a reliable source of global ionospheric maps (GIMs) since 1998. Modeling of the global ionospheric total electron content (TEC) is performed daily by several Ionosphere Associate Analysis Centers (IAACs). Four IAACs [...] Read more.
The Ionosphere Working Group of the International GNSS Service (IGS) has been a reliable source of global ionospheric maps (GIMs) since 1998. Modeling of the global ionospheric total electron content (TEC) is performed daily by several Ionosphere Associate Analysis Centers (IAACs). Four IAACs (CODE, ESA, CAS and WHU) use the spherical harmonic (SH) expansion as their primary method for modeling GIMs. The IAACs generally solve a normal equation to obtain the SH coefficients and Differential Code Biases (DCBs) of satellites and receivers by traditional least-squares estimation (LSE) without any prior knowledge. In this contribution, an improved method is proposed and developed for global ionospheric modeling based on utilizing prior knowledge. Prior values of SH coefficients and DCBs of satellites and receivers, as well as the variance factor and covariance matrix, could be obtained from the ionospheric modeling on the previous day. The parameters can subsequently be updated through GNSS measurements to achieve higher accuracy. Comparisons are carried out between WHU products based either on priori information or original LSE and IGS final products, other IAAC products, and JASON data for the year 2014. The results indicate that there is improved consistency between WHU GIMs and IGS final GIMs, other IAAC products, and JASON data, particularly in comparison with ESA and UPC products, with the probabilities of achieving better consistency with these products exceeding 95%. Moreover, WHU-produced DCBs of satellites also have slightly improved consistency with IGS final GIMs and IAAC products. Full article
Show Figures

Graphical abstract

21 pages, 7387 KiB  
Article
Preliminary Study of Soil Available Nutrient Simulation Using a Modified WOFOST Model and Time-Series Remote Sensing Observations
by Zhiqiang Cheng, Jihua Meng, Yanyou Qiao, Yiming Wang, Wenquan Dong and Yanxin Han
Remote Sens. 2018, 10(1), 64; https://doi.org/10.3390/rs10010064 - 5 Jan 2018
Cited by 29 | Viewed by 5881
Abstract
The approach of using multispectral remote sensing (RS) to estimate soil available nutrients (SANs) has been recently developed and shows promising results. This method overcomes the limitations of commonly used methods by building a statistical model that connects RS-based crop growth and nutrient [...] Read more.
The approach of using multispectral remote sensing (RS) to estimate soil available nutrients (SANs) has been recently developed and shows promising results. This method overcomes the limitations of commonly used methods by building a statistical model that connects RS-based crop growth and nutrient content. However, the stability and accuracy of this model require improvement. In this article, we replaced the statistical model by integrating the World Food Studies (WOFOST) model and time series of remote sensing (T-RS) observations to ensure stability and accuracy. Time series of HJ-1 A/B data was assimilated into the WOFOST model to extrapolate crop growth simulations from a single point to a large area using a specific assimilation method. Because nutrient-limited growth within the growing season is required and the SAN parameters can only be used at the end of the growing season in the original model, the WOFOST model was modified. Notably, the calculation order was changed, and new soil nutrient uptake algorithms were implemented in the model for nutrient-limited growth estimation. Finally, experiments were conducted in the spring maize plots of Hongxing Farm to analyze the effects of nutrient stress on crop growth and the SAN simulation accuracy. The results confirm the differences in crop growth status caused by a lack of soil nutrients. The new approach can take advantage of these differences to provide better SAN estimates. In general, the new approach can overcome the limitations of existing methods and simulate the SAN status with reliable accuracy. Full article
(This article belongs to the Special Issue Earth Observations for Precision Farming in China (EO4PFiC))
Show Figures

Graphical abstract

16 pages, 7375 KiB  
Article
Using an Instrumented Drone to Probe Dust Devils on Oregon’s Alvord Desert
by Brian Jackson, Ralph Lorenz, Karan Davis and Brock Lipple
Remote Sens. 2018, 10(1), 65; https://doi.org/10.3390/rs10010065 - 5 Jan 2018
Cited by 7 | Viewed by 5248
Abstract
Dust devils are low-pressure, small (many to tens of meters) convective vortices powered by surface heating and rendered visible by lofted dust. Dust devils occur ubiquitously on Mars, where they may dominate the supply of atmospheric dust, and since dust contributes significantly to [...] Read more.
Dust devils are low-pressure, small (many to tens of meters) convective vortices powered by surface heating and rendered visible by lofted dust. Dust devils occur ubiquitously on Mars, where they may dominate the supply of atmospheric dust, and since dust contributes significantly to Mars’ atmospheric heat budget, dust devils probably play an important role in its climate. The dust-lifting capacity of a devil likely depends sensitively on its structure, particularly the wind and pressure profiles, but the exact dependencies are poorly constrained. Thus, the exact contribution to Mars’ atmosphere remains unresolved. Analog studies of terrestrial devils have provided some insights into dust devil dynamics and properties but have been limited to near-surface (few meters) or relatively high altitude (hundreds of meters) sampling. Automated aerial vehicles or drones, combined with miniature, digital instrumentation, promise a novel and uniquely powerful platform from which to sample dust devils at a wide variety of altitudes. In this article, we describe a pilot study using an instrumented quadcopter on an active field site in southeastern Oregon, which (to our knowledge) has not previously been surveyed for dust devils. We present preliminary results from the encounters, including stereo image analysis and encounter footage collected onboard the drone. In spite of some technical difficulties, we show that a quadcopter can successfully navigate in an active dust devil, while collecting time-series data about the dust devil’s structure. Full article
Show Figures

Figure 1

23 pages, 7046 KiB  
Article
A Comparison of Regression Techniques for Estimation of Above-Ground Winter Wheat Biomass Using Near-Surface Spectroscopy
by Jibo Yue, Haikuan Feng, Guijun Yang and Zhenhai Li
Remote Sens. 2018, 10(1), 66; https://doi.org/10.3390/rs10010066 - 5 Jan 2018
Cited by 184 | Viewed by 10618
Abstract
Above-ground biomass (AGB) provides a vital link between solar energy consumption and yield, so its correct estimation is crucial to accurately monitor crop growth and predict yield. In this work, we estimate AGB by using 54 vegetation indexes (e.g., Normalized Difference Vegetation Index, [...] Read more.
Above-ground biomass (AGB) provides a vital link between solar energy consumption and yield, so its correct estimation is crucial to accurately monitor crop growth and predict yield. In this work, we estimate AGB by using 54 vegetation indexes (e.g., Normalized Difference Vegetation Index, Soil-Adjusted Vegetation Index) and eight statistical regression techniques: artificial neural network (ANN), multivariable linear regression (MLR), decision-tree regression (DT), boosted binary regression tree (BBRT), partial least squares regression (PLSR), random forest regression (RF), support vector machine regression (SVM), and principal component regression (PCR), which are used to analyze hyperspectral data acquired by using a field spectrophotometer. The vegetation indexes (VIs) determined from the spectra were first used to train regression techniques for modeling and validation to select the best VI input, and then summed with white Gaussian noise to study how remote sensing errors affect the regression techniques. Next, the VIs were divided into groups of different sizes by using various sampling methods for modeling and validation to test the stability of the techniques. Finally, the AGB was estimated by using a leave-one-out cross validation with these powerful techniques. The results of the study demonstrate that, of the eight techniques investigated, PLSR and MLR perform best in terms of stability and are most suitable when high-accuracy and stable estimates are required from relatively few samples. In addition, RF is extremely robust against noise and is best suited to deal with repeated observations involving remote-sensing data (i.e., data affected by atmosphere, clouds, observation times, and/or sensor noise). Finally, the leave-one-out cross-validation method indicates that PLSR provides the highest accuracy (R2 = 0.89, RMSE = 1.20 t/ha, MAE = 0.90 t/ha, NRMSE = 0.07, CV (RMSE) = 0.18); thus, PLSR is best suited for works requiring high-accuracy estimation models. The results indicate that all these techniques provide impressive accuracy. The comparison and analysis provided herein thus reveals the advantages and disadvantages of the ANN, MLR, DT, BBRT, PLSR, RF, SVM, and PCR techniques and can help researchers to build efficient AGB-estimation models. Full article
Show Figures

Graphical abstract

18 pages, 4539 KiB  
Article
Spatiotemporal Evaluation of GNSS-R Based on Future Fully Operational Global Multi-GNSS and Eight-LEO Constellations
by Fan Gao, Tianhe Xu, Nazi Wang, Chunhua Jiang, Yujun Du, Wenfeng Nie and Guochang Xu
Remote Sens. 2018, 10(1), 67; https://doi.org/10.3390/rs10010067 - 5 Jan 2018
Cited by 22 | Viewed by 6883
Abstract
Spaceborne GNSS-R (global navigation satellite system reflectometry) is an innovative and powerful bistatic radar remote sensing technique that uses specialized GNSS-R instruments on LEO (low Earth orbit) satellites to receive GNSS L-band signals reflected by the Earth’s surface. Unlike monostatic radar, the illuminated [...] Read more.
Spaceborne GNSS-R (global navigation satellite system reflectometry) is an innovative and powerful bistatic radar remote sensing technique that uses specialized GNSS-R instruments on LEO (low Earth orbit) satellites to receive GNSS L-band signals reflected by the Earth’s surface. Unlike monostatic radar, the illuminated areas are elliptical regions centered on specular reflection points. Evaluation of the spatiotemporal resolution of the reflections is necessary at the GNSS-R mission design stage for various applications. However, not all specular reflection signals can be received because the size and location of the GNSS-R antenna’s available reflecting ground coverage depends on parameters including the on-board receiver antenna gain, the signal frequency and power, the antenna face direction, and the LEO’s altitude. Additionally, the number of available reflections is strongly related to the number of GNSS-R LEO and GNSS satellites. By 2020, the Galileo and BeiDou Navigation Satellite System (BDS) constellations are scheduled to be fully operational at global scale and nearly 120 multi-GNSS satellites, including Global Positioning System (GPS) and Global Navigation Satellite System (GLONASS) satellites, will be available for use as illuminators. In this paper, to evaluate the future capacity for repetitive GNSS-R observations, we propose a GNSS satellite selection method and simulate the orbit of eight-satellite LEO and partial multi-GNSS constellations. We then analyze the spatiotemporal distribution characteristics of the reflections in two cases: (1) When only GPS satellites are available; (2) when multi-GNSS satellites are available separately. Simulation and analysis results show that the multi-GNSS-R system has major advantages in terms of available satellite numbers and revisit times over the GPS-R system. Additionally, the spatial density of the specular reflections on the Earth’s surface is related to the LEO inclination and constellation construction. Full article
Show Figures

Graphical abstract

20 pages, 10868 KiB  
Article
Comparative Analysis of Chinese HJ-1 CCD, GF-1 WFV and ZY-3 MUX Sensor Data for Leaf Area Index Estimations for Maize
by Jing Zhao, Jing Li, Qinhuo Liu, Hongyan Wang, Chen Chen, Baodong Xu and Shanlong Wu
Remote Sens. 2018, 10(1), 68; https://doi.org/10.3390/rs10010068 - 5 Jan 2018
Cited by 20 | Viewed by 7310
Abstract
In recent years, China has developed and launched several satellites with high spatial resolutions, such as the resources satellite No. 3 (ZY-3) with a multi-spectral camera (MUX) and 5.8 m spatial resolution, the satellite GaoFen No. 1 (GF-1) with a wide field of [...] Read more.
In recent years, China has developed and launched several satellites with high spatial resolutions, such as the resources satellite No. 3 (ZY-3) with a multi-spectral camera (MUX) and 5.8 m spatial resolution, the satellite GaoFen No. 1 (GF-1) with a wide field of view (WFV) camera and 16 m spatial resolution, and the environment satellite (HJ-1A/B) with a charge-coupled device (CCD) sensor and 30 m spatial resolution. First, to analyze the potential application of ZY-3 MUX, GF-1 WFV, and HJ-1 CCD to extract the leaf area index (LAI) at the regional scale, this study estimated LAI from the relationships between physical model-based spectral vegetation indices (SVIs) and LAI values that were generated from look-up tables (LUTs), simulated from the combination of the PROSPECT-5B leaf model and the scattering by arbitrarily inclined leaves with the hot-spot effect (SAILH) canopy reflectance model. Second, to assess the surface reflectance quality of these sensors after data preprocessing, the well-processed surface reflectance products of the Landsat-8 operational land imager (OLI) sensor with a convincing data quality were used to compare the performances of ZY-3 MUX, GF-1 WFV, and HJ-1 CCD sensors both in theory and reality. Apart from several reflectance fluctuations, the reflectance trends were coincident, and the reflectance values of the red and near-infrared (NIR) bands were comparable among these sensors. Finally, to analyze the accuracy of the LAI estimated from ZY-3 MUX, GF-1 WFV, and HJ-1 CCD, the LAI estimations from these sensors were validated based on LAI field measurements in Huailai, Hebei Province, China. The results showed that the performance of the LAI that was inversed from ZY-3 MUX was better than that from GF-1 WFV, and HJ-1 CCD, both of which tended to be systematically underestimated. In addition, the value ranges and accuracies of the LAI inversions both decreased with decreasing spatial resolution. Full article
Show Figures

Graphical abstract

22 pages, 12176 KiB  
Article
Mapping Burned Areas in Tropical Forests Using a Novel Machine Learning Framework
by Varun Mithal, Guruprasad Nayak, Ankush Khandelwal, Vipin Kumar, Ramakrishna Nemani and Nikunj C. Oza
Remote Sens. 2018, 10(1), 69; https://doi.org/10.3390/rs10010069 - 6 Jan 2018
Cited by 36 | Viewed by 10913
Abstract
This paper presents an application of a novel machine-learning framework on MODIS (moderate-resolution imaging spectroradiometer) data to map burned areas over tropical forests of South America and South-east Asia. The RAPT (RAre Class Prediction in the absence of True labels) framework is able [...] Read more.
This paper presents an application of a novel machine-learning framework on MODIS (moderate-resolution imaging spectroradiometer) data to map burned areas over tropical forests of South America and South-east Asia. The RAPT (RAre Class Prediction in the absence of True labels) framework is able to build data adaptive classification models using noisy training labels. It is particularly suitable when expert annotated training samples are difficult to obtain as in the case of wild fires in the tropics. This framework has been used to build burned area maps from MODIS surface reflectance data as features and Active Fire hotspots as training labels that are known to have high commission and omission errors due to the prevalence of cloud cover and smoke, especially in the tropics. Using the RAPT framework we report burned areas for 16 MODIS tiles from 2001 to 2014. The total burned area detected in the tropical forests of South America and South-east Asia during these years is 2,071,378 MODIS (500 m) pixels (approximately 520 K sq. km.), which is almost three times compared to the estimates from collection 5 MODIS MCD64A1 (783,468 MODIS pixels). An evaluation using Landsat-based reference burned area maps indicates that our product has an average user’s accuracy of 53% and producer’s accuracy of 55% while collection 5 MCD64A1 burned area product has an average user’s accuracy of 61% and producer’s accuracy of 27%. Our analysis also indicates that the two products can be complimentary and a combination of the two approaches is likely to provide a more comprehensive assessment of tropical fires. Finally, we have created a publicly accessible web-based viewer that helps the community to visualize the burned area maps produced using RAPT and examine various validation sources corresponding to every detected MODIS pixel. Full article
(This article belongs to the Special Issue Machine Learning Applications in Earth Science Big Data Analysis)
Show Figures

Graphical abstract

15 pages, 3612 KiB  
Article
Mapping Wild Leek through the Forest Canopy Using a UAV
by Marie-Bé Leduc and Anders J. Knudby
Remote Sens. 2018, 10(1), 70; https://doi.org/10.3390/rs10010070 - 6 Jan 2018
Cited by 27 | Viewed by 7887
Abstract
Wild leek, an endangered plant species of Eastern North America, grows on forest floors and greens up to approximately three weeks before the trees it is typically found under, temporarily allowing it to be observed through the canopy by remote sensing instruments. This [...] Read more.
Wild leek, an endangered plant species of Eastern North America, grows on forest floors and greens up to approximately three weeks before the trees it is typically found under, temporarily allowing it to be observed through the canopy by remote sensing instruments. This paper explores the accuracy with which wild leek can be mapped with a low-flying UAV. Nadir video imagery was obtained using a commercial UAV during the spring of 2017 in Gatineau Park, Quebec. Point clouds were generated from the video frames with the Structure-from-Motion framework, and a multiscale curvature classification was used to separate points on the ground, where wild leek grows, from above-ground points belonging to the forest canopy. Five-cm resolution orthomosaics were created from the ground points, and a threshold value of 0.350 for the green chromatic coordinate (GCC) was applied to delineate wild leek from wood, leaves, and other plants on the forest floor, with an F1-score of 0.69 and 0.76 for two different areas. The GCC index was most effective in delineating bigger patches, and therefore often misclassified patches smaller than 30 cm in diameter. Although short flight times and long data processing times are presently technical challenges to upscaling, the low cost and high accuracy of UAV imagery provides a promising method for monitoring the spatial distribution of this endangered species. Full article
(This article belongs to the Special Issue Remote Sensing for Biodiversity, Ecology and Conservation)
Show Figures

Graphical abstract

24 pages, 5162 KiB  
Article
Monitoring Water Surface and Level of a Reservoir Using Different Remote Sensing Approaches and Comparison with Dam Displacements Evaluated via GNSS
by Claudia Pipitone, Antonino Maltese, Gino Dardanelli, Mauro Lo Brutto and Goffredo La Loggia
Remote Sens. 2018, 10(1), 71; https://doi.org/10.3390/rs10010071 - 6 Jan 2018
Cited by 89 | Viewed by 13690
Abstract
Remote sensing allowed monitoring the reservoir water level by estimating its surface extension. Surface extension has been estimated using different approaches, employing both optical (Landsat 5 TM, Landsat 7 ETM+ SLC-Off, Landsat 8 OLI-TIRS and ASTER images) and Synthetic Aperture Radar (SAR) images [...] Read more.
Remote sensing allowed monitoring the reservoir water level by estimating its surface extension. Surface extension has been estimated using different approaches, employing both optical (Landsat 5 TM, Landsat 7 ETM+ SLC-Off, Landsat 8 OLI-TIRS and ASTER images) and Synthetic Aperture Radar (SAR) images (Cosmo SkyMed and TerraSAR-X). Images were characterized by different acquisition modes, geometric and spectral resolutions, allowing the evaluation of alternative and/or complementary techniques. For each kind of image, two techniques have been tested: The first based on an unsupervised classification and suitable to automate the process, the second based on visual matching with contour lines with the aim of fully exploiting the dataset. Their performances were evaluated by comparison with water levels measured in situ (r2 = 0.97 using the unsupervised classification, r2 = 0.95 using visual matching) demonstrating that both techniques are suitable to quantify reservoir surface extension. However ~90% of available images were analyzed using the visual matching method, and just 37 images out of 58 using the other method. The evaluation of the water level from the water surface, using both techniques, could be easily extended to un-gauged reservoirs to manage the variations of the levels during normal operation. In addition, during the period of investigation, the use of Global Navigation Satellite System (GNSS) allowed the estimation of dam displacements. The advantage of using as reference a GNSS permanent station positioned relatively far from the dam, allowed the exclusion of any interaction with the site deformations. By comparing results from both techniques, relationships between the orthogonal displacement component via GNSS, estimated water levels via remote sensing and in situ measurements were investigated. During periods of changing water level (April 2011–September 2011 and October 2011–March 2012), the moving average of displacement time series (middle section on the dam crest) shows a range of variability of ±2 mm. The dam deformation versus reservoir water level behavior differs during the reservoir emptying and filling periods indicating a hysteresis-kind loop. Full article
Show Figures

Graphical abstract

24 pages, 8706 KiB  
Article
Double Weight-Based SAR and Infrared Sensor Fusion for Automatic Ground Target Recognition with Deep Learning
by Sungho Kim, Woo-Jin Song and So-Hyun Kim
Remote Sens. 2018, 10(1), 72; https://doi.org/10.3390/rs10010072 - 11 Jan 2018
Cited by 30 | Viewed by 11061
Abstract
This paper presents a novel double weight-based synthetic aperture radar (SAR) and infrared (IR) sensor fusion method (DW-SIF) for automatic ground target recognition (ATR). IR-based ATR can provide accurate recognition because of its high image resolution but it is affected by the weather [...] Read more.
This paper presents a novel double weight-based synthetic aperture radar (SAR) and infrared (IR) sensor fusion method (DW-SIF) for automatic ground target recognition (ATR). IR-based ATR can provide accurate recognition because of its high image resolution but it is affected by the weather conditions. On the other hand, SAR-based ATR shows a low recognition rate due to the noisy low resolution but can provide consistent performance regardless of the weather conditions. The fusion of an active sensor (SAR) and a passive sensor (IR) can lead to upgraded performance. This paper proposes a doubly weighted neural network fusion scheme at the decision level. The first weight ( α ) can measure the offline sensor confidence per target category based on the classification rate for an evaluation set. The second weight ( β ) can measure the online sensor reliability based on the score distribution for a test target image. The LeNet architecture-based deep convolution network (14 layers) is used as an individual classifier. Doubly weighted sensor scores are fused by two types of fusion schemes, such as the sum-based linear fusion scheme ( α β -sum) and neural network-based nonlinear fusion scheme ( α β -NN). The experimental results confirmed the proposed linear fusion method ( α β -sum) to have the best performance among the linear fusion schemes available (SAR-CNN, IR-CNN, α -sum, β -sum, α β -sum, and Bayesian fusion). In addition, the proposed nonlinear fusion method ( α β -NN) showed superior target recognition performance to linear fusion on the OKTAL-SE-based synthetic database. Full article
(This article belongs to the Special Issue Deep Learning for Remote Sensing)
Show Figures

Graphical abstract

29 pages, 45881 KiB  
Article
Identifying Generalizable Image Segmentation Parameters for Urban Land Cover Mapping through Meta-Analysis and Regression Tree Modeling
by Brian A. Johnson and Shahab E. Jozdani
Remote Sens. 2018, 10(1), 73; https://doi.org/10.3390/rs10010073 - 6 Jan 2018
Cited by 27 | Viewed by 7154
Abstract
The advent of very high resolution (VHR) satellite imagery and the development of Geographic Object-Based Image Analysis (GEOBIA) have led to many new opportunities for fine-scale land cover mapping, especially in urban areas. Image segmentation is an important step in the GEOBIA framework, [...] Read more.
The advent of very high resolution (VHR) satellite imagery and the development of Geographic Object-Based Image Analysis (GEOBIA) have led to many new opportunities for fine-scale land cover mapping, especially in urban areas. Image segmentation is an important step in the GEOBIA framework, so great time/effort is often spent to ensure that computer-generated image segments closely match real-world objects of interest. In the remote sensing community, segmentation is frequently performed using the multiresolution segmentation (MRS) algorithm, which is tuned through three user-defined parameters (the scale, shape/color, and compactness/smoothness parameters). The scale parameter (SP) is the most important parameter and governs the average size of generated image segments. Existing automatic methods to determine suitable SPs for segmentation are scene-specific and often computationally intensive, so an approach to estimating appropriate SPs that is generalizable (i.e., not scene-specific) could speed up the GEOBIA workflow considerably. In this study, we attempted to identify generalizable SPs for five common urban land cover types (buildings, vegetation, roads, bare soil, and water) through meta-analysis and nonlinear regression tree (RT) modeling. First, we performed a literature search of recent studies that employed GEOBIA for urban land cover mapping and extracted the MRS parameters used, the image properties (i.e., spatial and radiometric resolutions), and the land cover classes mapped. Using this data extracted from the literature, we constructed RT models for each land cover class to predict suitable SP values based on the: image spatial resolution, image radiometric resolution, shape/color parameter, and compactness/smoothness parameter. Based on a visual and quantitative analysis of results, we found that for all land cover classes except water, relatively accurate SPs could be identified using our RT modeling results. The main advantage of our approach over existing SP selection approaches is that our RT model results are not scene-specific, so they can be used to quickly identify suitable SPs in other VHR images. Full article
(This article belongs to the Special Issue Geographic Object-Based Image Analysis (GEOBIA))
Show Figures

Graphical abstract

13 pages, 1003 KiB  
Article
SparkCloud: A Cloud-Based Elastic Bushfire Simulation Service
by Saurabh Garg, Nicholas Forbes-Smith, James Hilton and Mahesh Prakash
Remote Sens. 2018, 10(1), 74; https://doi.org/10.3390/rs10010074 - 7 Jan 2018
Cited by 8 | Viewed by 7181
Abstract
The accurate modeling of bushfires is not only complex and contextual but also a computationally intensive task. Ensemble predictions, involving several thousands to millions of simulations, can be required to capture and quantify the uncertain nature of bushfires. Moreover, users’ requirement and configuration [...] Read more.
The accurate modeling of bushfires is not only complex and contextual but also a computationally intensive task. Ensemble predictions, involving several thousands to millions of simulations, can be required to capture and quantify the uncertain nature of bushfires. Moreover, users’ requirement and configuration may change in different situations requiring either more computational resources or modeling to be completed with a stricter time constraint. For example, during emergency situations, the user may need to make time-critical decisions that require the execution of bushfire-spread models within a deadline. Currently, most operational tools are not flexible and scalable enough to consider different users’ time requirements. In this paper, we propose the SparkCloud service, which integrates features of user-defined customizable configuration for bushfire simulations and scalability/elasticity features of the cloud to handle computation requirements. The proposed cloud service utilizes Data61’s Spark, which is a significantly flexible and scalable software system for bushfire-spread prediction and has been used in practical scenarios. The effectiveness of the SparkCloud service is demonstrated using real cases of bushfires and on real cloud computing infrastructure. Full article
Show Figures

Graphical abstract

17 pages, 5783 KiB  
Article
3D Convolutional Neural Networks for Crop Classification with Multi-Temporal Remote Sensing Images
by Shunping Ji, Chi Zhang, Anjian Xu, Yun Shi and Yulin Duan
Remote Sens. 2018, 10(1), 75; https://doi.org/10.3390/rs10010075 - 7 Jan 2018
Cited by 353 | Viewed by 23937
Abstract
This study describes a novel three-dimensional (3D) convolutional neural networks (CNN) based method that automatically classifies crops from spatio-temporal remote sensing images. First, 3D kernel is designed according to the structure of multi-spectral multi-temporal remote sensing data. Secondly, the 3D CNN framework with [...] Read more.
This study describes a novel three-dimensional (3D) convolutional neural networks (CNN) based method that automatically classifies crops from spatio-temporal remote sensing images. First, 3D kernel is designed according to the structure of multi-spectral multi-temporal remote sensing data. Secondly, the 3D CNN framework with fine-tuned parameters is designed for training 3D crop samples and learning spatio-temporal discriminative representations, with the full crop growth cycles being preserved. In addition, we introduce an active learning strategy to the CNN model to improve labelling accuracy up to a required threshold with the most efficiency. Finally, experiments are carried out to test the advantage of the 3D CNN, in comparison to the two-dimensional (2D) CNN and other conventional methods. Our experiments show that the 3D CNN is especially suitable in characterizing the dynamics of crop growth and outperformed the other mainstream methods. Full article
(This article belongs to the Section Remote Sensing in Agriculture and Vegetation)
Show Figures

Figure 1

15 pages, 7434 KiB  
Article
Enhancing Land Cover Mapping through Integration of Pixel-Based and Object-Based Classifications from Remotely Sensed Imagery
by Yuehong Chen, Ya’nan Zhou, Yong Ge, Ru An and Yu Chen
Remote Sens. 2018, 10(1), 77; https://doi.org/10.3390/rs10010077 - 8 Jan 2018
Cited by 43 | Viewed by 7195
Abstract
Pixel-based and object-based classifications are two commonly used approaches in extracting land cover information from remote sensing images. However, they each have their own inherent merits and limitations. This study, therefore, proposes a new classification method through the integration of pixel-based and object-based [...] Read more.
Pixel-based and object-based classifications are two commonly used approaches in extracting land cover information from remote sensing images. However, they each have their own inherent merits and limitations. This study, therefore, proposes a new classification method through the integration of pixel-based and object-based classifications (IPOC). Firstly, it employs pixel-based soft classification to obtain the class proportions of pixels to characterize the land cover details from pixel-scale properties. Secondly, it adopts area-to-point kriging to explore the class spatial dependence between objects for each pixel from object-based soft classification results. Thirdly, the class proportions of pixels and the class spatial dependence of pixels are fused as the class occurrence of pixels. Last, a linear optimization model on objects is built to determine the optimal class label of pixels within each object. Two remote sensing images are used to evaluate the effectiveness of IPOC. The experimental results demonstrate that IPOC performs better than the traditional pixel-based hard classification and object-based hard classification methods. Specifically, the overall accuracy of IPOC is 7.64% higher than that of pixel-based hard classification and 4.64% greater than that of object-based hard classification in the first experiment, while the overall accuracy improvements in the second experiment are 3.59% and 3.42%, respectively. Meanwhile, IPOC produces less salt and pepper effect than the pixel-based hard classification method and generates more accurate land cover details and small patches than the object-based hard classification method. Full article
(This article belongs to the Special Issue Uncertainty in Remote Sensing Image Analysis)
Show Figures

Graphical abstract

19 pages, 28271 KiB  
Article
Wetland Mapping Using SAR Data from the Sentinel-1A and TanDEM-X Missions: A Comparative Study in the Biebrza Floodplain (Poland)
by Magdalena Mleczko and Marek Mróz
Remote Sens. 2018, 10(1), 78; https://doi.org/10.3390/rs10010078 - 9 Jan 2018
Cited by 41 | Viewed by 7462
Abstract
This research is related to the eco-hydrological problems of the herbaceous wetland drying and biodiversity loss in the floodplain lakes of the Middle Basin of the Biebrza River (Poland). An experiment was set up, with its main goals as follows: (i) mapping the [...] Read more.
This research is related to the eco-hydrological problems of the herbaceous wetland drying and biodiversity loss in the floodplain lakes of the Middle Basin of the Biebrza River (Poland). An experiment was set up, with its main goals as follows: (i) mapping the vegetation types and the temporarily or permanently flooded areas, and (ii) comparing the usefulness of the C-band Sentinel-1A (S1A) and X-band TerraSAR-X/TanDEM-X (TSX/TDX) for mapping purposes. The S1A imagery was acquired on a regular basis using the dual polarization VV/VH and the Interferometric Wide Swath Mode. The TSX/TDX data were acquired in quad-pol, a fully polarimetric mode, during the Science Phase. The paper addresses the following aspects: (i) wetland mapping with the S1A multi-temporal series; (ii) wetland mapping with the fully polarimetric TSX/TDX data; (iii) comparing the wetland mapping using dual polarization TSX/TDX subsets, that is, the HH-HV, HH-VV and VV-VH; (iv) comparing wetland mapping using the S1A and TSX/TDX data based on the same polarization (VV-VH); (v) studying the suitability of the Shannon Entropy for wetland mapping; and (vi) assessing the contribution of interferometric coherence for wetland classification. Though the experimental results show the main limitations of the S1A dataset, they also highlight the good accuracy that can be achieved using the TSX/TDX data, especially those taken in fully polarimetric mode. Some practical outcomes significant for the study area management using SAR were also described. Full article
(This article belongs to the Special Issue Remote Sensing of Floodpath Lakes and Wetlands)
Show Figures

Graphical abstract

15 pages, 14549 KiB  
Article
A Novel Method to Remove Fringes for Dispersive Hyperspectral VNIR Imagers Using Back-Illuminated CCDs
by Binlin Hu, Dexin Sun and Yinnian Liu
Remote Sens. 2018, 10(1), 79; https://doi.org/10.3390/rs10010079 - 9 Jan 2018
Cited by 8 | Viewed by 4704
Abstract
Dispersive hyperspectral VNIR (visible and near-infrared) imagers using back-illuminated CCDs will suffer from interference fringes in near-infrared bands, which can cause a sensitivity modulation as high as 40% or more when the spectral resolution gets higher than 5 nm. In addition to the [...] Read more.
Dispersive hyperspectral VNIR (visible and near-infrared) imagers using back-illuminated CCDs will suffer from interference fringes in near-infrared bands, which can cause a sensitivity modulation as high as 40% or more when the spectral resolution gets higher than 5 nm. In addition to the interference fringes that will change with time, there is fixed-pattern non-uniformity between pixels in the spatial dimension due to the small-scale roughness of the imager’s entrance slit, creating a much more complicated problem. A two-step method to remove fringes for dispersive hyperspectral VNIR imagers is proposed and evaluated. It first uses a ridge regression model to suppress the spectral fringes, and then computes spatial correction coefficients from the object data to correct the spatial fringes. In order to evaluate its effectiveness, the method was used to remove fringes for both the calibration data and object data collected from two VNIR grating-based hyperspectral imagers. Results show that the proposed method can preserve the original spectral shape, improve the image quality, and reduce the fringe amplitude in the 700–1000 nm region from about ±23% (10.7% RMSE) to about ±4% (1.9% RMSE). This method is particularly useful for spectra taken through a slit with a grating and shows flexible adaptability to object data, which suffer from time-varying interference fringes. Full article
(This article belongs to the Special Issue Data Restoration and Denoising of Remote Sensing Data)
Show Figures

Graphical abstract

28 pages, 7128 KiB  
Article
Investigation on Reference Frames and Time Systems in Multi-GNSS
by Luca Nicolini and Alessandro Caporali
Remote Sens. 2018, 10(1), 80; https://doi.org/10.3390/rs10010080 - 9 Jan 2018
Cited by 21 | Viewed by 8297
Abstract
Receivers able to track satellites belonging to different GNSSs (Global Navigation Satellite Systems) are available on the market. To compute coordinates and velocities it is necessary to identify all the elements that contribute to interoperability of the different GNSSs. For example the timescales [...] Read more.
Receivers able to track satellites belonging to different GNSSs (Global Navigation Satellite Systems) are available on the market. To compute coordinates and velocities it is necessary to identify all the elements that contribute to interoperability of the different GNSSs. For example the timescales kept by different GNSSs have to be aligned. Receiver-specific biases, or firmware-dependent biases, need to be calibrated. The reference frame used in the representation of the orbits must be unique. In this paper we address the interoperability issues from the standpoint of a Single Point Positioning (SPP) user, i.e., using pseudoranges and broadcast ephemeris. The biases between GNSSs timescales and receiver-dependent biases are analyzed for a set of 31 MGEX (Multi-GNSS Experiment) stations over a time span of more than three years. Time series of biases between timescales of GPS (Global Positioning System), GLONASS (Global Navigation Satellite System), Galileo, BeiDou, QZSS (Quasi-Zenith Satellite System), SBAS (Satellite Based Augmentation System) and NAVIC (Navigation with Indian Constellation) are investigated, in addition to the identification of events like discontinuity of receiver-dependent biases due to firmware updating. The GPS broadcast reference frame is shown to be aligned to the one (IGS14) realized by the precise ephemeris of CODE (Center for Orbit Determination in Europe) to within 0.1 m and 2 milliarcsec, with values dependent on whether IIR-A, IIR-B/M or IIF satellite blocks are considered. Larger offsets are observed for GLONASS, up to 1 m for GLONASS K satellites. For Galileo the alignment of the broadcast orbit to IGS14/CODE is again at the 0.1 m and several milliarcsec level, with the FOC (Full Operational Capability) satellites slightly better than IOV (In Orbit Validation). For BeiDou an alignment of the broadcast frame to IGS14/CODE comparable to GLONASS is observed, regardless of whether IGSO (Inclined Geosynchronous Orbit) or MEO (Medium Earth Orbit) satellites are considered. For all satellites, position differences according to the broadcast ephemeris relative to IGS14/CODE orbits are projected to the radial, along-track and crosstrack triad, with the largest periodic differences affecting mostly the along track component. Sudden discontinuities at the level of up to 1 m and 2–3 ns are observed for the along-track component and the satellite clock, respectively. The time scales of GLONASS, Galileo, QZSS, SBAS and NAVIC are very closely aligned to GPS, with constant offsets depending on receiver type. The offset of the BeiDou time scale to GPS has an oscillatory pattern with peak-to-peak values up to 100 ns. To characterize receiver-dependent biases the average of six Septentrio receivers is taken as reference, and relative offsets of the other receiver types are investigated. These receiver-dependent biases may depend on the individual station, or for the same station on the update of the firmware. A detailed calibration history is presented for each multiGNSS station studied. Full article
Show Figures

Graphical abstract

23 pages, 7615 KiB  
Article
Performance and Requirements of GEO SAR Systems in the Presence of Radio Frequency Interferences
by Yuanhao Li, Andrea Monti Guarnieri, Cheng Hu and Fabio Rocca
Remote Sens. 2018, 10(1), 82; https://doi.org/10.3390/rs10010082 - 9 Jan 2018
Cited by 42 | Viewed by 8240
Abstract
Geosynchronous Synthetic Aperture Radar (GEO SAR) is a possible next generation SAR system, which has the excellent performance of less than one-day revisit and hundreds of kilometres coverage. However, Radio Frequency Interference (RFI) is a serious problem, because the specified primary allocation frequencies [...] Read more.
Geosynchronous Synthetic Aperture Radar (GEO SAR) is a possible next generation SAR system, which has the excellent performance of less than one-day revisit and hundreds of kilometres coverage. However, Radio Frequency Interference (RFI) is a serious problem, because the specified primary allocation frequencies are shared by the increasing number of microwave devices. More seriously, as the high orbit of GEO SAR makes the system have a very large imaging swath, the RFI signals all over the illuminated continent will interfere and deteriorate the GEO SAR signal. Aimed at the RFI impact in GEO SAR case, this paper focuses on the performance evaluation and the system design requirement of GEO SAR in the presence of RFI impact. Under the RFI impact, Signal-to-Interference-plus-Noise Ratio (SINR) and the required power are theoretically deduced both for the ground RFI and the bistatic scattering RFI cases. Based on the theoretical analysis, performance evaluations of the GEO SAR design examples in the presence of RFI are conducted. The results show that higher RFI intensity and lower working frequency will make the GEO SAR have a higher power requirement for compensating the RFI impact. Moreover, specular RFI bistatic scattering will give rise to the extremely serious impact on GEO SAR, which needs incredible power requirements for compensations. At last, real RFI signal behaviours and statistical analyses based on the SMOS satellite, Beidou-2 navigation satellite and Sentinel-1 A data have been given in the appendix. Full article
Show Figures

Graphical abstract

26 pages, 15119 KiB  
Article
The Benefits of the Ka-Band as Evidenced from the SARAL/AltiKa Altimetric Mission: Quality Assessment and Unique Characteristics of AltiKa Data
by Pascal Bonnefond, Jacques Verron, Jérémie Aublanc, K. N. Babu, Muriel Bergé-Nguyen, Mathilde Cancet, Aditya Chaudhary, Jean-François Crétaux, Frédéric Frappart, Bruce J. Haines, Olivier Laurain, Annabelle Ollivier, Jean-Christophe Poisson, Pierre Prandi, Rashmi Sharma, Pierre Thibaut and Christopher Watson
Remote Sens. 2018, 10(1), 83; https://doi.org/10.3390/rs10010083 - 9 Jan 2018
Cited by 65 | Viewed by 9528
Abstract
The India-France SARAL/AltiKa mission is the first Ka-band altimetric mission dedicated to oceanography. The mission objectives are primarily the observation of the oceanic mesoscales but also include coastal oceanography, global and regional sea level monitoring, data assimilation, and operational oceanography. The mission ended [...] Read more.
The India-France SARAL/AltiKa mission is the first Ka-band altimetric mission dedicated to oceanography. The mission objectives are primarily the observation of the oceanic mesoscales but also include coastal oceanography, global and regional sea level monitoring, data assimilation, and operational oceanography. The mission ended its nominal phase after 3 years in orbit and began a new phase (drifting orbit) in July 2016. The objective of this paper is to provide a state of the art of the achievements of the SARAL/AltiKa mission in terms of quality assessment and unique characteristics of AltiKa data. It shows that the AltiKa data have similar accuracy at the centimeter level in term of absolute water level whatever the method (from local to global) and the type of water surfaces (ocean and lakes). It shows also that beyond the fact that AltiKa data quality meets the expectations and initial mission requirements, the unique characteristics of the altimeter and the Ka-band offer unique contributions in fields that were previously not fully foreseen. Full article
(This article belongs to the Special Issue Satellite Altimetry for Earth Sciences)
Show Figures

Graphical abstract

15 pages, 4025 KiB  
Article
Weighting of Multi-GNSS Observations in Real-Time Precise Point Positioning
by Kamil Kazmierski, Tomasz Hadas and Krzysztof Sośnica
Remote Sens. 2018, 10(1), 84; https://doi.org/10.3390/rs10010084 - 10 Jan 2018
Cited by 66 | Viewed by 8144
Abstract
The combination of Global Navigation Satellite Systems (GNSS) may improve the accuracy and precision of estimated coordinates, as well as the convergence time of Precise Point Positioning (PPP) solutions. The key conditions are the correct functional model and the proper weighting of observations, [...] Read more.
The combination of Global Navigation Satellite Systems (GNSS) may improve the accuracy and precision of estimated coordinates, as well as the convergence time of Precise Point Positioning (PPP) solutions. The key conditions are the correct functional model and the proper weighting of observations, for which different characteristics of multi-GNSS signals should be taken into account. In post-processing applications, the optimum stochastic model can be obtained through the analysis of post-fit residuals, but for real-time applications the stochastic model has to be defined in advanced. We propose five different weighting schemes for the GPS + GLONASS + Galileo + BeiDou combination, including two schemes with no intra-system differences, and three schemes that are based on signal noise and/or quality of satellite orbits. We perform GPS-only and five multi-GNSS solutions representing each weighting scheme. We analyze formal errors of coordinates, coordinate repeatability, and solution convergence time. We found that improper or equal weighting may improve formal errors but decreases coordinate repeatability when compared to the GPS-only solution. Intra-system weighting based on satellite orbit quality allows for a reduction of formal errors by 40%, for shortening convergence time by 40% and 47% for horizontal and vertical components, respectively, as well as for improving coordinate repeatability by 6%. Full article
Show Figures

Graphical abstract

17 pages, 17442 KiB  
Article
Estimating Live Fuel Moisture from MODIS Satellite Data for Wildfire Danger Assessment in Southern California USA
by Boksoon Myoung, Seung Hee Kim, Son V. Nghiem, Shenyue Jia, Kristen Whitney and Menas C. Kafatos
Remote Sens. 2018, 10(1), 87; https://doi.org/10.3390/rs10010087 - 10 Jan 2018
Cited by 36 | Viewed by 8774
Abstract
The goal of the research reported here is to assess the capability of satellite vegetation indices from the Moderate Resolution Imaging Spectroradiometer onboard both Terra and Aqua satellites, in order to replicate live fuel moisture content of Southern California chaparral ecosystems. We compared [...] Read more.
The goal of the research reported here is to assess the capability of satellite vegetation indices from the Moderate Resolution Imaging Spectroradiometer onboard both Terra and Aqua satellites, in order to replicate live fuel moisture content of Southern California chaparral ecosystems. We compared seasonal and interannual characteristics of in-situ live fuel moisture with satellite vegetation indices that were averaged over different radial extents around each live fuel moisture observation site. The highest correlations are found using the Aqua Enhanced Vegetation Index for a radius of 10 km, independently verifying the validity of in-situ live fuel moisture measurements over a large extent around each in-situ site. With this optimally averaged Enhanced Vegetation Index, we developed an empirical model function of live fuel moisture. Trends in the wet-to-dry phase of vegetation are well captured by the empirical model function on interannual time-scales, indicating a promising method to monitor fire danger levels by combining satellite, in-situ, and model results during the transition before active fire seasons. An example map of Enhanced Vegetation Index-derived live fuel moisture for the Colby Fire shows a complex spatial pattern of significant live fuel moisture reduction along an extensive wildland-urban interface, and illustrates a key advantage in using satellites across the large extent of wildland areas in Southern California. Full article
(This article belongs to the Special Issue Advances in Remote Sensing-based Disaster Monitoring and Assessment)
Show Figures

Graphical abstract

16 pages, 7656 KiB  
Article
GPR Clutter Amplitude Processing to Detect Shallow Geological Targets
by Victor Salinas Naval, Sonia Santos-Assunçao and Vega Pérez-Gracia
Remote Sens. 2018, 10(1), 88; https://doi.org/10.3390/rs10010088 - 11 Jan 2018
Cited by 26 | Viewed by 5502
Abstract
The analysis of clutter in A-scans produced by energy randomly scattered in some specific geological structures, provides information about changes in the shallow sedimentary geology. The A-scans are composed by the coherent energy received from reflections on electromagnetic discontinuities and the incoherent waves [...] Read more.
The analysis of clutter in A-scans produced by energy randomly scattered in some specific geological structures, provides information about changes in the shallow sedimentary geology. The A-scans are composed by the coherent energy received from reflections on electromagnetic discontinuities and the incoherent waves from the scattering in small heterogeneities. The reflected waves are attenuated as consequence of absorption, geometrical spreading and losses due to reflections and scattering. Therefore, the amplitude of those waves diminishes and at certain two-way travel times becomes on the same magnitude as the background noise in the radargram, mainly produced by the scattering. The amplitude of the mean background noise is higher when the dispersion of the energy increases. Then, the mean amplitude measured in a properly selected time window is a measurement of the amount of the scattered energy and, therefore, a measurement of the increase of scatterers in the ground. This paper presents a simple processing that allows determining the Mean Amplitude of Incoherent Energy (MAEI) for each A-scan, which is represented in front of the position of the trace. This procedure is tested in a field study, in a city built on a sedimentary basin. The basin is crossed by a large number of hidden subterranean streams and paleochannels. The sedimentary structures due to alluvial deposits produce an amount of the random backscattering of the energy that is measured in a time window. The results are compared along the entire radar line, allowing the location of streams and paleochannels. Numerical models were also used in order to compare the synthetic traces with the field radargrams and to test the proposed processing methodology. The results underscore the amount of the MAEI over the streams and also the existence of a surrounding zone where the amplitude is increasing from the average value to the maximum obtained over the structure. Simulations show that this zone does not correspond to any particular geological change but is consequence of the path of the antenna that receives the scattered energy before arriving to the alluvial deposits. Full article
(This article belongs to the Special Issue Recent Advances in GPR Imaging)
Show Figures

Graphical abstract

20 pages, 15802 KiB  
Article
Object-Based Mangrove Species Classification Using Unmanned Aerial Vehicle Hyperspectral Images and Digital Surface Models
by Jingjing Cao, Wanchun Leng, Kai Liu, Lin Liu, Zhi He and Yuanhui Zhu
Remote Sens. 2018, 10(1), 89; https://doi.org/10.3390/rs10010089 - 11 Jan 2018
Cited by 254 | Viewed by 19237
Abstract
Mangroves are one of the most important coastal wetland ecosystems, and the compositions and distributions of mangrove species are essential for conservation and restoration efforts. Many studies have explored this topic using remote sensing images that were obtained by satellite-borne and airborne sensors, [...] Read more.
Mangroves are one of the most important coastal wetland ecosystems, and the compositions and distributions of mangrove species are essential for conservation and restoration efforts. Many studies have explored this topic using remote sensing images that were obtained by satellite-borne and airborne sensors, which are known to be efficient for monitoring the mangrove ecosystem. With improvements in carrier platforms and sensor technology, unmanned aerial vehicles (UAVs) with high-resolution hyperspectral images in both spectral and spatial domains have been used to monitor crops, forests, and other landscapes of interest. This study aims to classify mangrove species on Qi’ao Island using object-based image analysis techniques based on UAV hyperspectral images obtained from a commercial hyperspectral imaging sensor (UHD 185) onboard a UAV platform. First, the image objects were obtained by segmenting the UAV hyperspectral image and the UAV-derived digital surface model (DSM) data. Second, spectral features, textural features, and vegetation indices (VIs) were extracted from the UAV hyperspectral image, and the UAV-derived DSM data were used to extract height information. Third, the classification and regression tree (CART) method was used to selection bands, and the correlation-based feature selection (CFS) algorithm was employed for feature reduction. Finally, the objects were classified into different mangrove species and other land covers based on their spectral and spatial characteristic differences. The classification results showed that when considering the three features (spectral features, textural features, and hyperspectral VIs), the overall classification accuracies of the two classifiers used in this paper, i.e., k-nearest neighbor (KNN) and support vector machine (SVM), were 76.12% (Kappa = 0.73) and 82.39% (Kappa = 0.801), respectively. After incorporating tree height into the classification features, the accuracy of species classification increased, and the overall classification accuracies of KNN and SVM reached 82.09% (Kappa = 0.797) and 88.66% (Kappa = 0.871), respectively. It is clear that SVM outperformed KNN for mangrove species classification. These results also suggest that height information is effective for discriminating mangrove species with similar spectral signatures, but different heights. In addition, the classification accuracy and performance of SVM can be further improved by feature reduction. The overall results provided evidence for the effectiveness and potential of UAV hyperspectral data for mangrove species identification. Full article
Show Figures

Graphical abstract

18 pages, 613 KiB  
Article
The Role of Advanced Microwave Scanning Radiometer 2 Channels within an Optimal Estimation Scheme for Sea Surface Temperature
by Kevin Pearson, Christopher Merchant, Owen Embury and Craig Donlon
Remote Sens. 2018, 10(1), 90; https://doi.org/10.3390/rs10010090 - 11 Jan 2018
Cited by 14 | Viewed by 6935
Abstract
We present an analysis of information content for sea surface temperature (SST) retrieval from the Advanced Microwave Scanning Radiometer 2 (AMSR2). We find that SST uncertainty of ∼0.37 K can be achieved within an optimal estimation framework in the presence of wind, water [...] Read more.
We present an analysis of information content for sea surface temperature (SST) retrieval from the Advanced Microwave Scanning Radiometer 2 (AMSR2). We find that SST uncertainty of ∼0.37 K can be achieved within an optimal estimation framework in the presence of wind, water vapour and cloud liquid water effects, given appropriate assumptions for instrumental uncertainty and prior knowledge, and using all channels. We test all possible combinations of AMSR2 channels and demonstrate the importance of including cloud liquid water in the retrieval vector. The channel combinations, with the minimum number of channels, that carry most SST information content are calculated, since in practice calibration error drives a trade-off between retrieved SST uncertainty and the number of channels used. The most informative set of five channels is 6.9 V, 6.9 H, 7.3 V, 10.7 V and 36.5 H and these are suitable for optimal estimation retrievals. We discuss the relevance of microwave SSTs and issues related to them compared to SSTs derived from infra-red observations. Full article
(This article belongs to the Special Issue Sea Surface Temperature Retrievals from Remote Sensing)
Show Figures

Graphical abstract

19 pages, 3647 KiB  
Article
Analysis of the Spatial Variability of Land Surface Variables for ET Estimation: Case Study in HiWATER Campaign
by Xiaojun Li, Xiaozhou Xin, Zhiqing Peng, Hailong Zhang, Chuanxiang Yi and Bin Li
Remote Sens. 2018, 10(1), 91; https://doi.org/10.3390/rs10010091 - 11 Jan 2018
Cited by 22 | Viewed by 4464
Abstract
Heterogeneity, including the inhomogeneity of landscapes and surface variables, significantly affects the accuracy of evapotranspiration (ET) (or latent heat flux, LE) estimated from remote sensing satellite data. However, most of the current research uses statistical methods in the mixed pixel to correct the [...] Read more.
Heterogeneity, including the inhomogeneity of landscapes and surface variables, significantly affects the accuracy of evapotranspiration (ET) (or latent heat flux, LE) estimated from remote sensing satellite data. However, most of the current research uses statistical methods in the mixed pixel to correct the ET or LE estimation error, and there is a lack of research from the perspective of the remote sensing model. The method of using frequency distributions or generalized probability density functions (PDFs), which is called the “statistical-dynamical” approach to describe the heterogeneity of land surface characteristics, is a good way to solve the problem. However, in attempting to produce an efficient PDF-based parameterization of remotely sensed ET or LE, first and foremost, it is necessary to systematically understand the variables that are most consistent with the heterogeneity (i.e., variability for a fixed target area or landscape, where the variation in the surface parameter value is primarily concerned with the PDF-based model) of surface turbulence flux. However, the use of PDF alone does not facilitate direct comparisons of the spatial variability of surface variables. To address this issue, the objective of this study is to find an indicator based on PDF to express variability of surface variables. We select the dimensionless or dimensional consistent coefficient of variation (CV), Gini coefficient and entropy to express variability. Based on the analysis of simulated data and field experimental data, we find that entropy is more stable and accurate than the CV and Gini coefficient for expressing the variability of surface variables. In addition, the results of the three methods show that the variability of the leaf area index (LAI) is greater than that of the land surface temperature (LST). Our results provide a suitable method for comparing the variability of different variables. Full article
Show Figures

Graphical abstract

14 pages, 10313 KiB  
Article
Calibrating the SAR SSH of Sentinel-3A and CryoSat-2 over the Corsica Facilities
by Pascal Bonnefond, Olivier Laurain, Pierre Exertier, François Boy, Thierry Guinle, Nicolas Picot, Sylvie Labroue, Matthias Raynal, Craig Donlon, Pierre Féménias, Tommaso Parrinello and Salvatore Dinardo
Remote Sens. 2018, 10(1), 92; https://doi.org/10.3390/rs10010092 - 11 Jan 2018
Cited by 33 | Viewed by 6901
Abstract
Initially developed to monitor the performance of TOPEX/Poseidon and to follow the Jason legacy satellite altimeters at Senetosa Cape, Corsica, this calibration/validation site has been extended to include a new location at Ajaccio. This addition enables the site to monitor Envisat and ERS [...] Read more.
Initially developed to monitor the performance of TOPEX/Poseidon and to follow the Jason legacy satellite altimeters at Senetosa Cape, Corsica, this calibration/validation site has been extended to include a new location at Ajaccio. This addition enables the site to monitor Envisat and ERS missions, CryoSat-2 and, more recently, the SARAL/AltiKa mission and Sentinel-3A satellites. Sentinel-3A and CryoSat-2 carry altimeters that use a synthetic aperture radar (SAR) mode that is different to the conventional pulse-bandwidth limited altimeters often termed “low resolution mode” (LRM). The aim of this study is to characterize the sea surface height (SSH) bias of the new SAR altimeter instruments and to demonstrate the improvement of data quality close to the coast. Moreover, some passes of Sentinel-3A and CryoSat-2 overfly both Senetosa and Ajaccio with only a few seconds time difference, allowing us to evaluate the reliability and homogeneity of both ground sites in term of geodetic datum. The Sentinel-3A and CryoSat-2 SSH biases for the SAR mode are respectively +22 ± 7 mm and −73 ± 5 mm (for CryoSat-2 baseline C products). The results show that the stability of the SAR SSH bias time series is better than standard LRM altimetry. Moreover, compared to standard LRM data, for which the measurements closer than ~10 km from the coast were generally unusable, SAR mode altimeters provide measurements that are reliable at less than few hundred meters from the coast. Full article
(This article belongs to the Special Issue Satellite Altimetry for Earth Sciences)
Show Figures

Graphical abstract

21 pages, 12330 KiB  
Article
Multi-Satellite Altimeter Validation along the French Atlantic Coast in the Southern Bay of Biscay from ERS-2 to SARAL
by Phuong Lan Vu, Frédéric Frappart, José Darrozes, Vincent Marieu, Fabien Blarel, Guillaume Ramillien, Pascal Bonnefond and Florence Birol
Remote Sens. 2018, 10(1), 93; https://doi.org/10.3390/rs10010093 - 11 Jan 2018
Cited by 34 | Viewed by 7822
Abstract
Monitoring changes in coastal sea levels is necessary given the impacts of climate change. Information on the sea level and its changes are important parameters in connection to climate change processes. In this study, radar altimetry data from successive satellite missions, European Remote [...] Read more.
Monitoring changes in coastal sea levels is necessary given the impacts of climate change. Information on the sea level and its changes are important parameters in connection to climate change processes. In this study, radar altimetry data from successive satellite missions, European Remote Sensing-2 (ERS-2), Jason-1, Envisat, Jason-2, and Satellite with ARgos and ALtiKa (SARAL), were used to measure sea surface heights (SSH). Altimetry-derived SSH was validated for the southern Bay of Biscay, using records from seven tide gauges located along the French Atlantic coast. More detailed comparisons were performed at La Rochelle, as this was the only tide gauge whose records covered the entire observation period for the different radar altimetry missions. The results of the comparison between the altimetry-based and in-situ SSH, recorded from zero to five kilometers away from the coast, had root mean square errors (RMSE) ranging from 0.08 m to 0.21 m, 0.17 m to 0.34 m, 0.1 m to 0.29 m, 0.18 m to 0.9 m, and 0.22 m to 0.89 m for SARAL, Jason-2, Jason-1, ENVISAT, and ERS-2, respectively. Comparing the missions on the same orbit, ENVISAT had better results than ERS-2, which can be accounted for by the improvements in the sensor mode of operation, whereas the better results obtained using SARAL are related to the first-time use of the Ka-band for an altimetry sensor. For Jason-1 and Jason-2, improvements were found in the ocean retracking algorithm (MLE-4 against MLE-3), and also in the bi-frequency ionosphere and radiometer wet troposphere corrections. Close to the shore, the use of model-based ionosphere (GIM) and wet troposphere (ECMWF) corrections, as applied to land surfaces, reduced the error on the SSH estimates. Full article
(This article belongs to the Special Issue Satellite Altimetry for Earth Sciences)
Show Figures

Figure 1

22 pages, 5076 KiB  
Article
The Impact of Eclipsing GNSS Satellites on the Precise Point Positioning
by Xinyun Cao, Shoujian Zhang, Kaifa Kuang, Tianjun Liu and Kang Gao
Remote Sens. 2018, 10(1), 94; https://doi.org/10.3390/rs10010094 - 11 Jan 2018
Cited by 16 | Viewed by 5552
Abstract
When satellites enter into the noon maneuver or the shadow crossing regimes, the actual attitudes will depart from their nominal values. If improper attitude models are used, the induced-errors due to the wind-up effect and satellite antenna PCO (Phase Center Offset) will deteriorate [...] Read more.
When satellites enter into the noon maneuver or the shadow crossing regimes, the actual attitudes will depart from their nominal values. If improper attitude models are used, the induced-errors due to the wind-up effect and satellite antenna PCO (Phase Center Offset) will deteriorate the positioning accuracy. Because different generations of satellites adopt different attitude control models, the influences on the positioning performances deserve further study. Consequently, the impact of three eclipsing strategies on the single-system and multi-GNSS (Global Navigation Satellite System) Precise Point Positioning (PPP) are analyzed. According to the results of the eclipsing monitor, 65 globally distributed MGEX (Multi-GNSS EXperiment) stations for 31-day period in July 2017 are selected to perform G/R/E/C/GR/GREC PPP in both static and kinematic modes. The results show that the influences of non-nominal attitudes are related to the magnitude of the PCO values, maximum yaw angle differences, the duration of maneuver, the value of the sun angle and the satellite geometric strength. For single-system, using modeled attitudes rather than the nominal ones will greatly improve the positioning accuracy of GLONASS-only and BDS-only PPP while slightly contributions to the GPS-only and GALILEO-only PPP. Deleting the eclipsing satellites may sometimes induce a longer convergence time and a worse solution due to the poor satellite geometry, especially for GLONASS kinematic PPP when stations are located in the low latitude and BDS kinematic PPP. When multi-GNSS data are available, especially four navigation systems, the accuracy improvements of using the modeled attitudes or deleting eclipsing satellites are non-significant. Full article
Show Figures

Graphical abstract

21 pages, 14807 KiB  
Article
Vegetation Changes along the Qinghai-Tibet Plateau Engineering Corridor Since 2000 Induced by Climate Change and Human Activities
by Yi Song, Long Jin and Haibo Wang
Remote Sens. 2018, 10(1), 95; https://doi.org/10.3390/rs10010095 - 12 Jan 2018
Cited by 86 | Viewed by 7703
Abstract
The Qinghai-Tibet (QT) Plateau Engineering Corridor is located in the hinterland of the QT Plateau, which is highly sensitive to global climate change. Climate change causes permafrost degradation, which subsequently affects vegetation growth. This study focused on the vegetation dynamics and their relationships [...] Read more.
The Qinghai-Tibet (QT) Plateau Engineering Corridor is located in the hinterland of the QT Plateau, which is highly sensitive to global climate change. Climate change causes permafrost degradation, which subsequently affects vegetation growth. This study focused on the vegetation dynamics and their relationships with climate change and human activities in the region surrounding the QT Plateau Engineering Corridor. The vegetation changes were inferred by applying trend analysis, the Mann-Kendall trend test and abrupt change analysis. Six key regions, each containing 40 nested quadrats that ranged in size from 500 × 500 m to 20 × 20 km, were selected to determine the spatial scales of the impacts from different factors. Cumulative growing season integrated enhanced vegetation index (CGSIEVI) values were calculated for each of the nested quadrats of different sizes to indicate the overall vegetation state over the entire year at different spatial scales. The impacts from human activities, a sudden increase in precipitation and permafrost degradation were quantified at different spatial scales using the CGSIEVI values and meteorological data based on the double mass curve method. Three conclusions were derived. First, the vegetation displayed a significant increasing trend over 23.6% of the study area. The areas displaying increases were mainly distributed in the Hoh Xil. Of the area where the vegetation displayed a significant decreasing trend, 72.4% was made up of alpine meadows. Second, more vegetation, especially the alpine meadows, has begun to degenerate or experience more rapid degradation since 2007 due to permafrost degradation and overgrazing. Finally, an active layer depth of 3 m to 3.2 m represents a limiting depth for alpine meadows. Full article
(This article belongs to the Special Issue Remote Sensing of Dynamic Permafrost Regions)
Show Figures

Figure 1

26 pages, 25284 KiB  
Article
Adaptive Window-Based Constrained Energy Minimization for Detection of Newly Grown Tree Leaves
by Shih-Yu Chen, Chinsu Lin, Chia-Hui Tai and Shang-Ju Chuang
Remote Sens. 2018, 10(1), 96; https://doi.org/10.3390/rs10010096 - 12 Jan 2018
Cited by 26 | Viewed by 5132
Abstract
Leaf maturation from initiation to senescence is a phenological event of plants that results from the influences of temperature and water availability on physiological activities during a life cycle. Detection of newly grown leaves (NGL) is therefore useful for the diagnosis of tree [...] Read more.
Leaf maturation from initiation to senescence is a phenological event of plants that results from the influences of temperature and water availability on physiological activities during a life cycle. Detection of newly grown leaves (NGL) is therefore useful for the diagnosis of tree growth, tree stress, and even climatic change. This paper applies Constrained Energy Minimization (CEM), which is a hyperspectral target detection technique to spot grown leaves in a UAV multispectral image. According to the proportion of NGL in different regions, this paper proposes three innovative CEM based detectors: Subset CEM, Sliding Window-based CEM (SW CEM), and Adaptive Sliding Window-based CEM (AWS CEM). AWS CEM can especially adjust the window size according to the proportion of NGL around the current pixel. The results show that AWS CEM improves the accuracy of NGL detection and also reduces the false alarm rate. In addition, the results of the supervised target detection depend on the appropriate signature. In this case, we propose the Optimal Signature Generation Process (OSGP) to extract the optimal signature. The experimental results illustrate that OSGP can effectively improve the stability and the detection rate. Full article
(This article belongs to the Special Issue Hyperspectral Imaging and Applications)
Show Figures

Graphical abstract

21 pages, 1996 KiB  
Article
Bayesian Cloud Detection for 37 Years of Advanced Very High Resolution Radiometer (AVHRR) Global Area Coverage (GAC) Data
by Claire E. Bulgin, Jonathan P. D. Mittaz, Owen Embury, Steinar Eastwood and Christopher J. Merchant
Remote Sens. 2018, 10(1), 97; https://doi.org/10.3390/rs10010097 - 12 Jan 2018
Cited by 24 | Viewed by 6762
Abstract
Cloud detection is a source of significant errors in retrieval of sea surface temperature (SST). We apply a Bayesian cloud detection scheme to 37 years of Advanced Very High Resolution Radiometer (AVHRR) Global Area Coverage (GAC) data, which is an important source of [...] Read more.
Cloud detection is a source of significant errors in retrieval of sea surface temperature (SST). We apply a Bayesian cloud detection scheme to 37 years of Advanced Very High Resolution Radiometer (AVHRR) Global Area Coverage (GAC) data, which is an important source of multi-decadal global SST information. The Bayesian scheme calculates a probability of clear-sky for each image pixel, conditional on the satellite observations and prior probability. We compare the cloud detection performance to the operational Clouds from AVHRR Extended algorithm (CLAVR-x), as a measure of improvement from reduced cloud-related errors. To do this we use sea surface temperature differences between satellite retrievals and in situ observations from drifting buoys and the Global Tropical Moored Buoy Array (GTMBA). The Bayesian scheme reduces the absolute difference between the mean and median SST biases and reduces the standard deviation of the SST differences by ~10% for both daytime and nighttime retrievals. These reductions are indicative of removing cloud contaminated outliers in the distribution, as these fall only on one side of the distribution forming a cold tail. At a probability threshold of 0.9 typically used to determine a binary cloud mask for SST retrieval, the Bayesian mask also reduces the robust standard deviation by ~5–10% during the day, in comparison with the operational cloud mask. This shows an improvement in the central distribution of SST differences for daytime retrievals. Full article
(This article belongs to the Special Issue Sea Surface Temperature Retrievals from Remote Sensing)
Show Figures

Graphical abstract

15 pages, 4842 KiB  
Article
Correction of Pushbroom Satellite Imagery Interior Distortions Independent of Ground Control Points
by Guo Zhang, Kai Xu, Qingjun Zhang and Deren Li
Remote Sens. 2018, 10(1), 98; https://doi.org/10.3390/rs10010098 - 12 Jan 2018
Cited by 11 | Viewed by 5460
Abstract
Compensating for distortions in pushbroom satellite imagery has a bearing on subsequent earth observation applications. Traditional distortion correction methods usually depend on ground control points (GCPs) acquired from a high-accuracy geometric calibration field (GCF). Due to the high construction costs and site constraints [...] Read more.
Compensating for distortions in pushbroom satellite imagery has a bearing on subsequent earth observation applications. Traditional distortion correction methods usually depend on ground control points (GCPs) acquired from a high-accuracy geometric calibration field (GCF). Due to the high construction costs and site constraints of GCF, it is difficult to perform distortion detection regularly. To solve this problem, distortion detection methods without using GCPs have been proposed, but their application is restricted by rigorous conditions, such as demanding a large amount of calculation or good satellite agility which are not met by most remote sensing satellites. This paper proposes a novel method to correct interior distortions of satellite imagery independent of GCPs. First, a classic geometric calibration method for pushbroom satellite is built and at least three images with overlapping areas are collected, then the forward intersection residual between corresponding points in the images are used to calculate interior distortions. Experiments using the Gaofen-1 (GF-1) wide-field view-1 (WFV-1) sensor demonstrate that the proposed method can increase the level of orientation accuracy from several pixels to within one pixel, thereby almost eliminating interior distortions. Compared with the orientation accuracy by classic GCF method, there exists maximum difference of approximately 0.4 pixel, and the reasons for this discrepancy are analyzed. Generally, this method could be a supplementary method to conventional methods to detect and correct the interior distortion. Full article
(This article belongs to the Section Remote Sensing Image Processing)
Show Figures

Graphical abstract

13 pages, 5558 KiB  
Article
Assessing Global Ocean Wind Energy Resources Using Multiple Satellite Data
by Qiaoying Guo, Xiazhen Xu, Kangyu Zhang, Zhengquan Li, Weijiao Huang, Lamin R. Mansaray, Weiwei Liu, Xiuzhen Wang, Jian Gao and Jingfeng Huang
Remote Sens. 2018, 10(1), 100; https://doi.org/10.3390/rs10010100 - 12 Jan 2018
Cited by 42 | Viewed by 7338
Abstract
Wind energy, as a vital renewable energy source, also plays a significant role in reducing carbon emissions and mitigating climate change. It is therefore of utmost necessity to evaluate ocean wind energy resources for electricity generation and environmental management. Ocean wind distribution around [...] Read more.
Wind energy, as a vital renewable energy source, also plays a significant role in reducing carbon emissions and mitigating climate change. It is therefore of utmost necessity to evaluate ocean wind energy resources for electricity generation and environmental management. Ocean wind distribution around the globe can be obtained from satellite observations to compensate for limited in situ measurements. However, previous studies have largely ignored uncertainties in ocean wind energy resources assessment with multiple satellite data. It is against this background that the current study compares mean wind speeds (MWS) and wind power densities (WPD) retrieved from scatterometers (QuikSCAT, ASCAT) and radiometers (WindSAT) and their different combinations with National Data Buoy Center (NDBC) buoy measurements at heights of 10 m and 100 m (wind turbine hub height) above sea level. Our results show an improvement in the accuracy of wind resources estimation with the use of multiple satellite observations. This has implications for the acquisition of reliable data on ocean wind energy in support of management policies. Full article
(This article belongs to the Special Issue Remote Sensing of Atmospheric Conditions for Wind Energy Applications)
Show Figures

Figure 1

16 pages, 3631 KiB  
Article
Design of a Novel Spectral Albedometer for Validating the MODerate Resolution Imaging Spectroradiometer Spectral Albedo Product
by Hongmin Zhou, Jindi Wang and Shunlin Liang
Remote Sens. 2018, 10(1), 101; https://doi.org/10.3390/rs10010101 - 12 Jan 2018
Cited by 7 | Viewed by 4937
Abstract
Land surface shortwave broadband albedo is a key parameter in general circulation models and surface energy budget models. Multispectral satellite data are typically used to generate broadband albedo products in a three-step process: atmospheric correction, for converting the top-of-atmosphere observations to surface directional [...] Read more.
Land surface shortwave broadband albedo is a key parameter in general circulation models and surface energy budget models. Multispectral satellite data are typically used to generate broadband albedo products in a three-step process: atmospheric correction, for converting the top-of-atmosphere observations to surface directional reflectance; angular modeling, for converting the surface directional reflectance to spectral albedo of each individual band; and finally, narrowband-to-broadband conversion, for transforming the spectral albedos to broadband albedos. Spectroradiometers can be used for validating surface directional reflectance products and pyranometers or broadband albedometers, for validating broadband albedo products, but spectral albedo products are rarely validated using ground measurements. In this study, we designed a new type of albedometer that can measure spectral albedos. It consists of multiple interference filters and a silicon detector, for measuring irradiance from 400–1100 nm. The linearity of the sensors is 99%, and the designed albedometer exhibits consistency up to 0.993, with a widely-used commercial instrument. A field experiment for measuring spectral albedo of grassland using this new albedometer was conducted in Yudaokou, China and the measurements are used for validating the MODerate Resolution Imaging Spectroradiometer (MODIS) spectral albedos. The results show that the biases of the MODIS spectral albedos of the first four bands are −0.0094, 0.0065, 0.0159, and −0.0001, respectively. This new instrument provides an effective technique for validating spectral albedos of any satellite sensor in this spectral range, which is critical for improving satellite broadband albedo products. Full article
Show Figures

Graphical abstract

17 pages, 2146 KiB  
Article
Recursive Local Summation of RX Detection for Hyperspectral Image Using Sliding Windows
by Liaoying Zhao, Weijun Lin, Yulei Wang and Xiaorun Li
Remote Sens. 2018, 10(1), 103; https://doi.org/10.3390/rs10010103 - 13 Jan 2018
Cited by 14 | Viewed by 4528
Abstract
Anomaly detection has received considerable interest for hyperspectral data exploitation due to its high spectral resolution. Fast processing and good detection performance are practically significant in real world problems. Aiming at these requirements, this paper develops a recursive local summation RX anomaly detection [...] Read more.
Anomaly detection has received considerable interest for hyperspectral data exploitation due to its high spectral resolution. Fast processing and good detection performance are practically significant in real world problems. Aiming at these requirements, this paper develops a recursive local summation RX anomaly detection approach by virtue of sliding windows. This paper develops a recursive local summation RX anomaly detection approach by virtue of sliding windows. A causal sample covariance/correlation matrix is derived for local window background. As for the real-time sliding windows, the W o o d b u r y identity is used in recursive update equations, which could avoid the calculation of historical information and thus speed up the processing. Furthermore, a background suppression algorithm is also proposed in this paper, which removes the current under test pixel from the recursively update processing. Experiments are implemented on a real hyperspectral image. The experiment results demonstrate that the proposed anomaly detector outperforms the traditional real-time local background detector and has a significant speed-up effect on calculation time compared with the traditional detectors. Full article
(This article belongs to the Special Issue Hyperspectral Imaging and Applications)
Show Figures

Graphical abstract

17 pages, 3985 KiB  
Article
Disaggregation of Landsat-8 Thermal Data Using Guided SWIR Imagery on the Scene of a Wildfire
by Kangjoon Cho, Yonghyun Kim and Yongil Kim
Remote Sens. 2018, 10(1), 105; https://doi.org/10.3390/rs10010105 - 13 Jan 2018
Cited by 19 | Viewed by 6123
Abstract
Thermal data products derived from remotely sensed data play significant roles as key parameters for biophysical phenomena. However, a trade-off between spatial and spectral resolutions has existed in thermal infrared (TIR) remote sensing systems, with the end product being the limited resolution of [...] Read more.
Thermal data products derived from remotely sensed data play significant roles as key parameters for biophysical phenomena. However, a trade-off between spatial and spectral resolutions has existed in thermal infrared (TIR) remote sensing systems, with the end product being the limited resolution of the TIR sensor. In order to treat this problem, various disaggregation methods of TIR data, based on the indices from visible and near-infrared (VNIR), have been developed to sharpen the coarser spatial resolution of TIR data. Although these methods were reported to exhibit sufficient performance in each study, preservation of thermal variation in the original TIR data is still difficult, especially in fire areas due to the distortion of the VNIR reflectance by the impact of smoke. To solve this issue, this study proposes an efficient and improved disaggregation algorithm of TIR imagery on wildfire areas using guided shortwave infrared (SWIR) band imagery via a guided image filter (GF). Radiometric characteristics of SWIR wavelengths could preserve spatially high frequency temperature components in flaming combustion, and the GF preserved thermal variation of the original TIR data in the disaggregated result. The proposed algorithm was evaluated using Landsat-8 operational land imager (OLI) and thermal infrared sensor (TIRS) images on wildfire areas, and compared with other algorithms based on a vegetation index (VI) originating from VNIR. In quantitative analysis, the proposed disaggregation method yielded the best values of root mean square error (RMSE), mean absolute error (MAE), correlation coefficient (CC), erreur relative globale adimensionelle de synthèse (ERGAS), and universal image quality index (UIQI). Furthermore, unlike in other methods, the disaggregated temperature map in the proposed method reflected the thermal variation of wildfire in visual analysis. The experimental results showed that the proposed algorithm was successfully applied to the TIR data, especially to wildfire areas in terms of quantitative and visual assessments. Full article
Show Figures

Figure 1

20 pages, 9090 KiB  
Article
Incorporating Satellite Precipitation Estimates into a Radar-Gauge Multi-Sensor Precipitation Estimation Algorithm
by Yuxiang He, Yu Zhang, Robert Kuligowski, Robert Cifelli and David Kitzmiller
Remote Sens. 2018, 10(1), 106; https://doi.org/10.3390/rs10010106 - 13 Jan 2018
Cited by 10 | Viewed by 7337
Abstract
This paper presents a new and enhanced fusion module for the Multi-Sensor Precipitation Estimator (MPE) that would objectively blend real-time satellite quantitative precipitation estimates (SQPE) with radar and gauge estimates. This module consists of a preprocessor that mitigates systematic bias in SQPE, and [...] Read more.
This paper presents a new and enhanced fusion module for the Multi-Sensor Precipitation Estimator (MPE) that would objectively blend real-time satellite quantitative precipitation estimates (SQPE) with radar and gauge estimates. This module consists of a preprocessor that mitigates systematic bias in SQPE, and a two-way blending routine that statistically fuses adjusted SQPE with radar estimates. The preprocessor not only corrects systematic bias in SQPE, but also improves the spatial distribution of precipitation based on SQPE and makes it closely resemble that of radar-based observations. It uses a more sophisticated radar-satellite merging technique to blend preprocessed datasets, and provides a better overall QPE product. The performance of the new satellite-radar-gauge blending module is assessed using independent rain gauge data over a five-year period between 2003–2007, and the assessment evaluates the accuracy of newly developed satellite-radar-gauge (SRG) blended products versus that of radar-gauge products (which represents MPE algorithm currently used in the NWS (National Weather Service) operations) over two regions: (I) Inside radar effective coverage and (II) immediately outside radar coverage. The outcomes of the evaluation indicate (a) ingest of SQPE over areas within effective radar coverage improve the quality of QPE by mitigating the errors in radar estimates in region I; and (b) blending of radar, gauge, and satellite estimates over region II leads to reduction of errors relative to bias-corrected SQPE. In addition, the new module alleviates the discontinuities along the boundaries of radar effective coverage otherwise seen when SQPE is used directly to fill the areas outside of effective radar coverage. Full article
Show Figures

Graphical abstract

23 pages, 3381 KiB  
Article
The Effect of Three Different Data Fusion Approaches on the Quality of Soil Moisture Retrievals from Multiple Passive Microwave Sensors
by Robin Van der Schalie, Richard De Jeu, Robert Parinussa, Nemesio Rodríguez-Fernández, Yann Kerr, Amen Al-Yaari, Jean-Pierre Wigneron and Matthias Drusch
Remote Sens. 2018, 10(1), 107; https://doi.org/10.3390/rs10010107 - 13 Jan 2018
Cited by 28 | Viewed by 8225
Abstract
Long-term climate records of soil moisture are of increased importance to climate researchers. In this study, we aim to evaluate the quality of three different fusion approaches that combine soil moisture retrieval from multiple satellite sensors. The arrival of L-band missions has led [...] Read more.
Long-term climate records of soil moisture are of increased importance to climate researchers. In this study, we aim to evaluate the quality of three different fusion approaches that combine soil moisture retrieval from multiple satellite sensors. The arrival of L-band missions has led to an increased focus on the integration of L-band-based soil moisture retrievals in climate records, emphasizing the need to improve our understanding based on its added value within a multi-sensor framework. The three evaluated approaches were developed on 10-year passive microwave data (2003–2013) from two different satellite sensors, i.e., SMOS (2010–2013) and AMSR-E (2003–2011), and are based on a neural network (NN), regressions (REG), and the Land Parameter Retrieval Model (LPRM). The ability of the different approaches to best match AMSR-E and SMOS in their overlapping period was tested using an inter-comparison exercise between the SMOS and AMSR-E datasets, while the skill of the individual soil moisture products, based on anomalies, was evaluated using two verification techniques; first, a data assimilation technique that links precipitation information to the quality of soil moisture (expressed as the Rvalue), and secondly the triple collocation analysis (TCA). ASCAT soil moisture was included in the skill evaluation, representing the active microwave-based counterpart of soil moisture retrievals. Besides a semi-global analysis, explicit focus was placed on two regions that have strong land–atmosphere coupling, the Sahel (SA) and the central Great Plains (CGP) of North America. The NN approach gives the highest correlation coefficient between SMOS and AMSR-E, closely followed by LPRM and REG, while the absolute error is approximately the same for all three approaches. The Rvalue and TCA show the strength of using different satellite sources and the impact of different merging approaches on the skill to correctly capture soil moisture anomalies. The highest performance is found for AMSR-E over sparse vegetation, for SMOS over moderate vegetation, and for ASCAT over dense vegetation cover. While the two SMOS datasets (L3 and LPRM) show a similar performance, the three AMSR-E datasets do not. The good performance for AMSR-E over spare vegetation is mainly perceived for AMSR-E LPRM, benefiting from the physically based model, while AMSR-E NN shows improved skill in densely vegetated areas, making optimal use of the SMOS L3 training dataset. AMSR-E REG has a reasonable performance over sparsely vegetated areas; however, it quickly loses skill with increasing vegetation density. The findings over the SA and CGP mainly reflect results that are found in earlier sections. This confirms that historical soil moisture datasets based on a combination of these sources are a valuable source of information for climate research. Full article
(This article belongs to the Special Issue Retrieval, Validation and Application of Satellite Soil Moisture Data)
Show Figures

Figure 1

17 pages, 3855 KiB  
Article
Instantaneous 3D Continental-Shelf Scale Imaging of Oceanic Fish by Multi-Spectral Resonance Sensing Reveals Group Behavior during Spawning Migration
by Dong Hoon Yi, Zheng Gong, J. Michael Jech, Purnima Ratilal and Nicholas C. Makris
Remote Sens. 2018, 10(1), 108; https://doi.org/10.3390/rs10010108 - 14 Jan 2018
Cited by 9 | Viewed by 5635
Abstract
The migration of extensive social groups towards specific spawning grounds in vast and diverse ocean environments is an integral part of the regular spawning process of many oceanic fish species. Oceanic fish in such migrations typically seek locations with environmental parameters that maximize [...] Read more.
The migration of extensive social groups towards specific spawning grounds in vast and diverse ocean environments is an integral part of the regular spawning process of many oceanic fish species. Oceanic fish in such migrations typically seek locations with environmental parameters that maximize the probability of successful spawning and egg/larval survival. The 3D spatio-temporal dynamics of these behavioral processes are largely unknown due to technical difficulties in sensing the ocean environment over wide areas. Here, we use ocean acoustic waveguide remote sensing (OAWRS) to instantaneously image immense herring groups over continental-shelf-scale areas at the Georges Bank spawning ground. Via multi-spectral OAWRS measurements, we capture a shift in swimbladder resonance peak correlated with the herring groups’ up-slope spawning migration, enabling 3D spatial behavioral dynamics to be instantaneously inferred over thousands of square kilometers. We show that herring groups maintain near-bottom vertical distributions with negative buoyancy throughout the migration. We find a spatial correlation greater than 0.9 between the average herring group depth and corresponding seafloor depth for migratory paths along the bathymetric gradient. This is consistent with herring groups maintaining near-seafloor paths to both search for optimal spawning conditions and reduce the risk of predator attacks during the migration to shallower waters where near-surface predators are more dangerous. This analysis shows that multi-spectral resonance sensing with OAWRS can be used as an effective tool to instantaneously image and continuously monitor the behavioral dynamics of swimbladder-bearing fish group behavior in three spatial dimensions over continental-shelf scales. Full article
(This article belongs to the Special Issue Advances in Undersea Remote Sensing)
Show Figures

Graphical abstract

19 pages, 6808 KiB  
Article
Urban Area Tomography Using a Sparse Representation Based Two-Dimensional Spectral Analysis Technique
by Lei Liang, Xinwu Li, Laurent Ferro-Famil, Huadong Guo, Lu Zhang and Wenjin Wu
Remote Sens. 2018, 10(1), 109; https://doi.org/10.3390/rs10010109 - 14 Jan 2018
Cited by 18 | Viewed by 4868
Abstract
Synthetic aperture radar (SAR) tomography (TomoSAR) estimates scene reflectivity along elevation coordinates, based on multi-baseline measurements. Common TomoSAR approaches are based on every single range-azimuth cell or the cell’s neighborhood. By using an additional synthetic aperture for elevation, these techniques have higher resolution [...] Read more.
Synthetic aperture radar (SAR) tomography (TomoSAR) estimates scene reflectivity along elevation coordinates, based on multi-baseline measurements. Common TomoSAR approaches are based on every single range-azimuth cell or the cell’s neighborhood. By using an additional synthetic aperture for elevation, these techniques have higher resolution power for elevation, to discriminate scatterers with differences in location in the same range-azimuth cell. However, they cannot provide sufficient range resolution power to discriminate these scatterers by joining different spectra to a wider range spectrum, which limits the resolution power of TomoSAR. Therefore, in this paper, we proposed using a compressive sensing (CS) technique to reconstruct range and elevation signals from multi-baseline SAR images. This TomoSAR method not only retrieves the vertical signals but also improves the resolution in the range, which helps improve the resolution power of the TomoSAR technique. We present the theory of the CS-based two-dimensional TomoSAR technique and compare it to the CS-based one-dimensional TomoSAR technique. The excellent resolution power and scatterer localization accuracy of this novel technique are demonstrated using simulations and real data obtained by RADARSAT-2 in Lanzhou, China. Full article
(This article belongs to the Section Remote Sensing Image Processing)
Show Figures

Figure 1

17 pages, 5142 KiB  
Article
Classification of PolSAR Images Using Multilayer Autoencoders and a Self-Paced Learning Approach
by Wenshuai Chen, Shuiping Gou, Xinlin Wang, Xiaofeng Li and Licheng Jiao
Remote Sens. 2018, 10(1), 110; https://doi.org/10.3390/rs10010110 - 15 Jan 2018
Cited by 36 | Viewed by 6087
Abstract
In this paper, a novel polarimetric synthetic aperture radar (PolSAR) image classification method based on multilayer autoencoders and self-paced learning (SPL) is proposed. The multilayer autoencoders network is used to learn the features, which convert raw data into more abstract expressions. Then, softmax [...] Read more.
In this paper, a novel polarimetric synthetic aperture radar (PolSAR) image classification method based on multilayer autoencoders and self-paced learning (SPL) is proposed. The multilayer autoencoders network is used to learn the features, which convert raw data into more abstract expressions. Then, softmax regression is applied to produce the predicted probability distributions over all the classes of each pixel. When we optimize the multilayer autoencoders network, self-paced learning is used to accelerate the learning convergence and achieve a stronger generalization capability. Under this learning paradigm, the network learns the easier samples first and gradually involves more difficult samples in the training process. The proposed method achieves the overall classification accuracies of 94.73%, 94.82% and 78.12% on the Flevoland dataset from AIRSAR, Flevoland dataset from RADARSAT-2 and Yellow River delta dataset, respectively. Such results are comparable with other state-of-the-art methods. Full article
Show Figures

Graphical abstract

18 pages, 2365 KiB  
Article
Impact of the Initial State on BDS Real-Time Orbit Determination Filter Convergence
by Yun Qing, Yidong Lou, Yang Liu, Xiaolei Dai and Yi Cai
Remote Sens. 2018, 10(1), 111; https://doi.org/10.3390/rs10010111 - 15 Jan 2018
Cited by 4 | Viewed by 4567
Abstract
High precision real-time orbit of navigation satellites are usually predicted based on batch estimation solutions, which is highly dependent on the accuracy of the dynamic model. However, for the BDS satellites, the accuracy and reliability of the predicted orbit usually decrease due to [...] Read more.
High precision real-time orbit of navigation satellites are usually predicted based on batch estimation solutions, which is highly dependent on the accuracy of the dynamic model. However, for the BDS satellites, the accuracy and reliability of the predicted orbit usually decrease due to the inaccurate dynamic model or orbit maneuvers. To improve this situation, the sequential estimation Square Root Information Filtering (SRIF) was applied to determine the real-time BDS orbits. In the filter algorithm, usually a long period is required for the orbit to converge to the final accuracy, due to lake of accurate initial state. This paper focuses on the impact of the initial state with different a priori Standard Deviation (STD) on the BDS orbit convergence performance in both normal and abnormal periods. For the normal period, the Ultra-Rapid (UR) orbit products and the Broadcast Ephemerides (BRDC) used as initial orbits are discussed respectively. For the abnormal period, orbit maneuver is analyzed. Experimental results show that a proper a priori STD of initial state can significantly accelerate the orbit convergence, while a loose a priori STD takes more than 10 h to converge in the radial direction for the BDS GEO/IGSO/MEO satellites. When the UR orbit product is used as the initial orbit, the orbit of the IGSO/MEO satellites can converge to decimeter-level immediately. When the BRDC product is used, the accuracy of meter-level can be obtained for the IGSO/MEO immediately, and converge to decimeter-level in about 6 h. For the period after the orbit maneuver, the real-time orbit accuracy can reach meter-level in about 6 h after the first group of broadcast ephemerides is received. Full article
Show Figures

Figure 1

18 pages, 4726 KiB  
Article
Comparative Analysis of Responses of Land Surface Temperature to Long-Term Land Use/Cover Changes between a Coastal and Inland City: A Case of Freetown and Bo Town in Sierra Leone
by Musa Tarawally, Wenbo Xu, Weiming Hou and Terence Darlington Mushore
Remote Sens. 2018, 10(1), 112; https://doi.org/10.3390/rs10010112 - 15 Jan 2018
Cited by 53 | Viewed by 10014
Abstract
Urban growth and its associated expansion of built-up areas are expected to continue through to the twenty second century and at a faster pace in developing countries. This has the potential to increase thermal discomfort and heat-related distress. There is thus a need [...] Read more.
Urban growth and its associated expansion of built-up areas are expected to continue through to the twenty second century and at a faster pace in developing countries. This has the potential to increase thermal discomfort and heat-related distress. There is thus a need to monitor growth patterns, especially in resource constrained countries such as Africa, where few studies have so far been conducted. In view of this, this study compares urban growth and temperature response patterns in Freetown and Bo town in Sierra Leone. Multispectral Landsat images obtained in 1998, 2000, 2007, and 2015 are used to quantify growth and land surface temperature responses. The contribution index (CI) is used to explain how changes per land use and land cover class (LULC) contributed to average city surface temperatures. The population size of Freetown was about eight times greater than in Bo town. Landsat data mapped urban growth patterns with a high accuracy (Overall Accuracy > 80%) for both cities. Significant changes in LULC were noted in Freetown, characterized by a 114 km2 decrease in agriculture area, 23 km2 increase in dense vegetation, and 77 km2 increase in built-up area. Between 1998 and 2015, built-up area increased by 16 km2, while dense vegetation area decreased by 14 km2 in Bo town. Average surface temperature increased from 23.7 to 25.5 °C in Freetown and from 24.9 to 28.2 °C in Bo town during the same period. Despite the larger population size and greater built-up extent, as well as expansion rate, Freetown was 2 °C cooler than Bo town in all periods. The low temperatures are attributed to proximity to sea and the very large proportion of vegetation surrounding the city. Even close to the sea and abundant vegetation, the built-up area had an elevated temperature compared to the surroundings. The findings are important for formulating heat mitigation strategies for both inland and coastal cities in developing countries. Full article
(This article belongs to the Special Issue Learning to Understand Remote Sensing Images)
Show Figures

Graphical abstract

25 pages, 1759 KiB  
Article
Band Subset Selection for Hyperspectral Image Classification
by Chunyan Yu, Meiping Song and Chein-I Chang
Remote Sens. 2018, 10(1), 113; https://doi.org/10.3390/rs10010113 - 15 Jan 2018
Cited by 38 | Viewed by 6346
Abstract
This paper develops a new approach to band subset selection (BSS) for hyperspectral image classification (HSIC) which selects multiple bands simultaneously as a band subset, referred to as simultaneous multiple band selection (SMMBS), rather than one band at a time sequentially, referred to [...] Read more.
This paper develops a new approach to band subset selection (BSS) for hyperspectral image classification (HSIC) which selects multiple bands simultaneously as a band subset, referred to as simultaneous multiple band selection (SMMBS), rather than one band at a time sequentially, referred to as sequential multiple band selection (SQMBS), as most traditional band selection methods do. In doing so, a criterion is particularly developed for BSS that can be used for HSIC. It is a linearly constrained minimum variance (LCMV) derived from adaptive beamforming in array signal processing which can be used to model misclassification errors as the minimum variance. To avoid an exhaustive search for all possible band subsets, two numerical algorithms, referred to as sequential (SQ) and successive (SC) algorithms are also developed for LCMV-based SMMBS, called SQ LCMV-BSS and SC LCMV-BSS. Experimental results demonstrate that LCMV-based BSS has advantages over SQMBS. Full article
(This article belongs to the Special Issue Hyperspectral Imaging and Applications)
Show Figures

Figure 1

16 pages, 1603 KiB  
Article
Estimation of Water Stress in Grapevines Using Proximal and Remote Sensing Methods
by Alessandro Matese, Rita Baraldi, Andrea Berton, Carla Cesaraccio, Salvatore Filippo Di Gennaro, Pierpaolo Duce, Osvaldo Facini, Massimiliano Giuseppe Mameli, Alessandra Piga and Alessandro Zaldei
Remote Sens. 2018, 10(1), 114; https://doi.org/10.3390/rs10010114 - 16 Jan 2018
Cited by 113 | Viewed by 12722
Abstract
In light of climate change and its impacts on plant physiology, optimizing water usage and improving irrigation practices play a crucial role in crop management. In recent years, new optical remote sensing techniques have become widespread since they allow a non-invasive evaluation of [...] Read more.
In light of climate change and its impacts on plant physiology, optimizing water usage and improving irrigation practices play a crucial role in crop management. In recent years, new optical remote sensing techniques have become widespread since they allow a non-invasive evaluation of plant water stress dynamics in a timely manner. Unmanned aerial vehicles (UAV) currently represent one of the most advanced platforms for remote sensing applications. In this study, remote and proximal sensing measurements were compared with plant physiological variables, with the aim of testing innovative services and support systems to farmers for optimizing irrigation practices and scheduling. The experiment, conducted in two vineyards located in Sardinia, Italy, consisted of two regulated deficit irrigation (RDI) treatments and two reference treatments maintained under stress and well-watered conditions. Indicators of crop water status (Crop Water Stress Index—CWSI—and linear thermal index) were calculated from UAV images and ground infrared thermal images and then related to physiological measurements. The CWSI values for moderate water deficit (RDI-1) were 0.72, 0.28 and 0.43 for ‘Vermentino’, ‘Cabernet’ and ‘Cagnulari’ respectively, while for severe (RDI-2) water deficit the values were 0.90, 0.34 and 0.51. The highest differences for net photosynthetic rate (Pn) and stomatal conductance (Gs) between RDI-1 and RDI-2 were observed in ‘Vermentino’. The highest significant correlations were found between CWSI with Pn (R = −0.80), with ΦPSII (R = −0.49) and with Fv’/Fm’ (R = −0.48) on ‘Cagnulari’, while a unique significant correlation between CWSI and non-photochemical quenching (NPQ) (R = 0.47) was found on ‘Vermentino’. Pn, as well as the efficiency of light use by the photosystem II (PSII), declined under stress conditions and when CWSI values increased. Under the experimental water stress conditions, grapevines were able to recover their efficiency during the night, activating a photosynthetic protection mechanism such as thermal energy dissipation (NPQ) to prevent irreversible damage to the photosystem. The results presented here demonstrate that CWSI values derived from remote and proximal sensors could be valuable indicators for the assessment of the spatial variability of crop water status in Mediterranean vineyards. Full article
(This article belongs to the Section Remote Sensing in Agriculture and Vegetation)
Show Figures

Graphical abstract

20 pages, 2936 KiB  
Article
Merging Satellite Retrievals and Reanalyses to Produce Global Long-Term and Consistent Surface Incident Solar Radiation Datasets
by Fei Feng and Kaicun Wang
Remote Sens. 2018, 10(1), 115; https://doi.org/10.3390/rs10010115 - 16 Jan 2018
Cited by 31 | Viewed by 6056
Abstract
Surface incident solar radiation (Rs) is a key parameter in many climatic and ecological processes. The data from satellites and reanalysis have been widely used. However, for reanalysis, Rs data has been shown to have substantial spatial bias, and [...] Read more.
Surface incident solar radiation (Rs) is a key parameter in many climatic and ecological processes. The data from satellites and reanalysis have been widely used. However, for reanalysis, Rs data has been shown to have substantial spatial bias, and the time span of reliable satellite Rs is too short for climatic and ecological studies. Combining reanalysis and satellite data would be an effective method for generating long-term and consistent Rs datasets. Here, we apply a cumulative probability density function-based (CPDF) method to merge eight reanalyses with the latest available satellite Rs data from Clouds and Earth’s Radiant Energy System Energy Balanced and Filled (CERES EBAF) surface retrievals. The CPDF method not only reduces the spatial bias of the reanalysis Rs data, but also makes the Rs datasets in a global, long-term and consistent way. The observed Rs data collected at 54 Baseline Surface Radiation Network (BSRN) stations from 1992 to 2016 are used to evaluate the method. Results show that the CPDF method could reduce the mean absolute biases (MAB) of the reanalysis Rs effectively by 21.24–64.36%. The European Centre for Medium-Range Weather Forecasts Re-Analysis interim (ERA-interim) reanalysis Rs data, which are available for 1979 onward, perform the best before MAB = 13.20 W·m−2 and after MAB = 10.40 W·m−2 merging. This small post-merging MAB of the ERA-interim reanalysis is caused by the MAB of 9.90 W·m−2 in the satellite Rs retrievals. The Japanese 55-year reanalysis provides Rs values back to 1958, and CPDF can reduce its MAB by 32.87%, to 11.17 W·m−2. The National Oceanic and Atmospheric Administration (NOAA)-CIRES twentieth-century reanalysis (CIRES) and the ECMWF twentieth-century reanalysis (ERA20CM) provide century-long Rs estimates. CIRES performs better after merging. The MAB of CIRES can be reduced by 32.10%, to 12.99 W·m−2, while ERA20CM’s can be reduced by 12.51%, to 16.40 W·m−2. Full article
(This article belongs to the Special Issue Remote Sensing of Land-Atmosphere Interactions)
Show Figures

Graphical abstract

13 pages, 1529 KiB  
Article
Multispectral Image Denoising via Nonlocal Multitask Sparse Learning
by Ya-Ru Fan, Ting-Zhu Huang, Xi-Le Zhao, Liang-Jian Deng and Shanxiong Fan
Remote Sens. 2018, 10(1), 116; https://doi.org/10.3390/rs10010116 - 16 Jan 2018
Cited by 10 | Viewed by 4662
Abstract
The goal of multispectral imaging is to obtain the spectrum for each pixel in the image of a scene and deliver much reliable information. It has been widely applied to several fields including mineralogy, oceanography and astronomy. However, multispectral images (MSIs) are often [...] Read more.
The goal of multispectral imaging is to obtain the spectrum for each pixel in the image of a scene and deliver much reliable information. It has been widely applied to several fields including mineralogy, oceanography and astronomy. However, multispectral images (MSIs) are often corrupted by various noises. In this paper, we propose a MSI denoising model based on nonlocal multitask sparse learning. The nonlocal self-similarity across space and the high correlation of the MSI along the spectrum via multitask sparse learning are fully exploited in the proposed model. A nonnegative matrix factorization (NMF) based algorithm is developed to solve the proposed model. Experimental results on both simulated and real data demonstrate that the proposed method performs better than several existing state-of-the-art denoising methods. Full article
(This article belongs to the Section Remote Sensing Image Processing)
Show Figures

Graphical abstract

18 pages, 17262 KiB  
Article
Performance of the NPP-VIIRS and aqua-MODIS Aerosol Optical Depth Products over the Yangtze River Basin
by Lijie He, Lunche Wang, Aiwen Lin, Ming Zhang, Muhammad Bilal and Jing Wei
Remote Sens. 2018, 10(1), 117; https://doi.org/10.3390/rs10010117 - 16 Jan 2018
Cited by 61 | Viewed by 6177
Abstract
The visible infrared imaging radiometer suite (VIIRS) environmental data record aerosol product (VIIRS_EDR) and the aqua-moderate resolution imaging spectroradiometer (MYD04) collection 6 (C6) aerosol optical depth (AOD) products are validated against the Cimel sun–photometer (CE318) AOD measurements during different air quality conditions over [...] Read more.
The visible infrared imaging radiometer suite (VIIRS) environmental data record aerosol product (VIIRS_EDR) and the aqua-moderate resolution imaging spectroradiometer (MYD04) collection 6 (C6) aerosol optical depth (AOD) products are validated against the Cimel sun–photometer (CE318) AOD measurements during different air quality conditions over the Yangtze river basin (YRB) from 2 May 2012 to 31 December 2016. For VIIRS_EDR, the AOD observations are obtained from the scientific data set (SDS) “aerosol optical depth at 550 nm” at 6 km resolution, and for aqua-MODIS, the AOD observations are obtained from the SDS “image optical depth land and ocean” at 3 km (DT3K) and 10 km (DT10K) resolutions, “deep blue aerosol optical depth 550 land” at 10 km resolution (DB10K), and “AOD 550 dark target deep blue combined” at 10 km resolution (DTB10K). Results show that the high-quality (QF = 3) DTB10K performs the best against the CE318 AOD observations, along with a higher R (0.85) and more retrievals within the expected error (EE) ± (0.05 + 15%) (55%). Besides, there is a 10% overestimation, but the positive bias does not exhibit obvious seasonal variations. Similarly, the DT3K and DT10K products overestimate AOD retrievals by 23% and 15%, respectively, all over the year, but the positive biases become larger in spring and summer. For the DB10K AOD retrievals, there is an overestimation (underestimation) in autumn and winter (spring and summer). Compared to the aqua-MODIS AOD products, the VIIRS_EDR AOD retrievals are less correlated (R = 0.73) and only 44% of the retrievals fall within EE. Meanwhile, the VIIRS_EDR shows larger bias than the aqua-MODIS C6 retrievals, and tends to overestimate AOD retrievals in summer and underestimate in winter. Additionally, there is an underestimation for the VIIRS_EDR AOD retrievals over the regions during high aerosol loadings. These indicate that the VIIRS_EDR retrieval algorithm needs to be improved in further applications over the YRB. Full article
(This article belongs to the Section Atmospheric Remote Sensing)
Show Figures

Graphical abstract

11 pages, 2424 KiB  
Article
Solar Radiation Pressure Models for BeiDou-3 I2-S Satellite: Comparison and Augmentation
by Chen Wang, Jing Guo, Qile Zhao and Jingnan Liu
Remote Sens. 2018, 10(1), 118; https://doi.org/10.3390/rs10010118 - 16 Jan 2018
Cited by 21 | Viewed by 5446
Abstract
As one of the most essential modeling aspects for precise orbit determination, solar radiation pressure (SRP) is the largest non-gravitational force acting on a navigation satellite. This study focuses on SRP modeling of the BeiDou-3 experimental satellite I2-S (PRN C32), for which an [...] Read more.
As one of the most essential modeling aspects for precise orbit determination, solar radiation pressure (SRP) is the largest non-gravitational force acting on a navigation satellite. This study focuses on SRP modeling of the BeiDou-3 experimental satellite I2-S (PRN C32), for which an obvious modeling deficiency that is related to SRP was formerly identified. The satellite laser ranging (SLR) validation demonstrated that the orbit of BeiDou-3 I2-S determined with empirical 5-parameter Extended CODE (Center for Orbit Determination in Europe) Orbit Model (ECOM1) has the sun elongation angle (ε angle) dependent systematic error, as well as a bias of approximately −16.9 cm. Similar performance has been identified for European Galileo and Japanese QZSS Michibiki satellite as well, and can be reduced with the extended ECOM model (ECOM2), or by using the a priori SRP model to augment ECOM1. In this study, the performances of the widely used SRP models for GNSS (Global Navigation Satellite System) satellites, i.e., ECOM1, ECOM2, and adjustable box-wing model have been compared and analyzed for BeiDou-3 I2-S satellite. In addition, the a priori SRP models are derived based on analytical cuboid box model and empirically spectra analysis, respectively. Use of the a priori model combined with ECOM1 was finally demonstrated to reduce the ε-angle-dependent systematic error, and thus improved the radial orbit accuracy by nearly 35 per cent when compared to the solution with standalone ECOM1, as revealed by the one way SLR residuals. Full article
Show Figures

Graphical abstract

27 pages, 12895 KiB  
Article
Fine-Resolution Precipitation Mapping in a Mountainous Watershed: Geostatistical Downscaling of TRMM Products Based on Environmental Variables
by Yueyuan Zhang, Yungang Li, Xuan Ji, Xian Luo and Xue Li
Remote Sens. 2018, 10(1), 119; https://doi.org/10.3390/rs10010119 - 17 Jan 2018
Cited by 58 | Viewed by 8658
Abstract
Accurate precipitation data at a high spatial resolution are essential for hydrological, meteorological, and ecological research at regional scales. This study presented a geostatistical downscaling-calibration procedure to derive the high spatial resolution maps of precipitation over a mountainous watershed affected by a monsoon [...] Read more.
Accurate precipitation data at a high spatial resolution are essential for hydrological, meteorological, and ecological research at regional scales. This study presented a geostatistical downscaling-calibration procedure to derive the high spatial resolution maps of precipitation over a mountainous watershed affected by a monsoon climate. Based on the relationships between precipitation and other environmental variables, such as the Normalized Difference Vegetation Index (NDVI) and digital elevation model (DEM), a regression model with a residual correction method was applied to downscale the Tropical Rainfall Measuring Mission (TRMM) 3B43 product from coarse resolution (25 km) to fine resolution (1 km). Two methods, geographical difference analysis (GDA) and geographical ratio analysis (GRA), were used to calibrate the downscaled TRMM precipitation data. Monthly 1 km precipitation data were obtained by disaggregating 1 km annual downscaled and calibrated precipitation data using monthly fractions derived from original TRMM data. The downscaled precipitation datasets were validated against ground observations measured by rain gauges. According to the comparison of different regression models and residual interpolation methods, a geographically-weighted regression kriging (GWRK) method was accepted to conduct the downscaling of TRMM data. The downscaled TRMM precipitation data obtained using GWRK described the spatial patterns of precipitation reasonably well at a spatial resolution of 1 km with more detailed information when compared with the original TRMM precipitation. The results of validation indicated that the GRA method provided results with higher accuracy than that of the GDA method. The final annual and monthly downscaled precipitation not only had significant improvement in spatial resolution, but also agreed well with data from the validation rain gauge stations (i.e., R2 = 0.72, RMSE = 161.0 mm, MAE = 127.5 mm, and Bias = 0.050 for annual downscaled precipitation during 2001 to 2015; and R2 = 0.91, RMSE = 22.2 mm, MAE = 13.5 mm, and Bias = 0.048 for monthly downscaled precipitation during 2001 to 2015). In general, the downscaling-calibration procedure is useful for complex mountainous areas with insufficient ground gauges. Full article
Show Figures

Graphical abstract

36 pages, 17794 KiB  
Article
Vicarious Radiometric Calibration of the Hyperspectral Imaging Microsatellites SPARK-01 and -02 over Dunhuang, China
by Hao Zhang, Bing Zhang, Zhengchao Chen and Zhihua Huang
Remote Sens. 2018, 10(1), 120; https://doi.org/10.3390/rs10010120 - 17 Jan 2018
Cited by 20 | Viewed by 6237
Abstract
Two wide-swath hyperspectral imaging microsatellites, SPARK-01 and -02, were launched on 22 December 2016. Radiometric calibration coefficients were determined for these two satellites via a calibration experiment performed from the end of February to the beginning of March 2017 at the high-altitude, homogenous [...] Read more.
Two wide-swath hyperspectral imaging microsatellites, SPARK-01 and -02, were launched on 22 December 2016. Radiometric calibration coefficients were determined for these two satellites via a calibration experiment performed from the end of February to the beginning of March 2017 at the high-altitude, homogenous Dunhuang calibration site in the Gobi Desert in China. In-situ measurements, including ground reflectance, direct transmittance, diffuse-to-global irradiance ratio, and radiosonde vertical profile, were acquired. A unique relative calibration procedure was developed using actual satellite images. This procedure included dark current computation and non-uniform correction processes. The former was computed by averaging multiple lines of long strip imagery acquired over open oceans during nighttime, while the latter was computed using images acquired after the adjustment of the satellite yaw angle to 90°. This technique was shown to be suitable for large-swath satellite image relative calibration. After relative calibration, reflectance, irradiance, and improved irradiance-based methods were used to conduct absolute radiometric calibrations in order to predict the top-of-atmosphere (TOA) radiance. The SPARK-01 and -02 satellites passed over the calibration site on 7 March and 28 February 2017, during which time fair and non-ideal weather occurred, respectively. Thus, the SPARK-01 calibration coefficient was derived using reflectance- and irradiance-based methods, while that of SPARK -02 was derived using reflectance- and improved irradiance-based methods. The sources of calibration uncertainty, which include aerosol-type assumptions, transmittance measurements, water vapor content retrieval, spectral wavelength shift and satellite image misregistration, were explored in detail for different calibration methods. Using the reflectance and irradiance-based methods, the total uncertainty for SPARK-01 was estimated to be 4.7% and 4.1%, respectively, in the <1000 nm spectral range. For SPARK-02, total uncertainties of 8.1% and of 5.9% were estimated using the reflectance- and improved irradiance-based methods, respectively. The calibration methods were also verified using MODIS images, which confirmed that the calibration accuracies were within the expected range. These in-situ measurements, analyses, and results provide a basis for in-orbit radiometric calibration of the SPARK-01 and -02 satellites. These experiments strongly support the use of diffuse-to-global ratio measurements in in-situ vicarious calibration experiments and the addition of spectrally continuous measurements for direct transmittance, which is important for hyperspectral satellite sensors. Full article
(This article belongs to the Special Issue Hyperspectral Imaging and Applications)
Show Figures

Graphical abstract

17 pages, 4461 KiB  
Article
Tree Death Not Resulting in Gap Creation: An Investigation of Canopy Dynamics of Northern Temperate Deciduous Forests
by Jean-Francois Senécal, Frédérik Doyon and Christian Messier
Remote Sens. 2018, 10(1), 121; https://doi.org/10.3390/rs10010121 - 17 Jan 2018
Cited by 17 | Viewed by 5262
Abstract
Several decades of research have shown that canopy gaps drive tree renewal processes in the temperate deciduous forest biome. In the literature, canopy gaps are usually defined as canopy openings that are created by partial or total tree death of one or more [...] Read more.
Several decades of research have shown that canopy gaps drive tree renewal processes in the temperate deciduous forest biome. In the literature, canopy gaps are usually defined as canopy openings that are created by partial or total tree death of one or more canopy trees. In this study, we investigate linkages between tree damage mechanisms and the formation or not of new canopy gaps in northern temperate deciduous forests. We studied height loss processes in unmanaged and managed forests recovering from partial cutting with multi-temporal airborne Lidar data. The Lidar dataset was used to detect areas where canopy height reduction occurred, which were then field-studied to identify the tree damage mechanisms implicated. We also sampled the density of leaf material along transects to characterize canopy structure. We used the dataset of the canopy height reduction areas in a multi-model inference analysis to determine whether canopy structures or tree damage mechanisms most influenced the creation of new canopy gaps within canopy height reduction areas. According to our model, new canopy gaps are created mainly when canopy damage enlarges existing gaps or when height is reduced over areas without an already established dense sub-canopy tree layer. Full article
(This article belongs to the Special Issue Lidar for Forest Science and Management)
Show Figures

Graphical abstract

16 pages, 9275 KiB  
Article
Determining the Start of the Growing Season from MODIS Data in the Indian Monsoon Region: Identifying Available Data in the Rainy Season and Modeling the Varied Vegetation Growth Trajectories
by Rong Shang, Ronggao Liu, Mingzhu Xu, Yang Liu, Jadunandun Dash and Quansheng Ge
Remote Sens. 2018, 10(1), 122; https://doi.org/10.3390/rs10010122 - 18 Jan 2018
Cited by 15 | Viewed by 6847 | Correction
Abstract
In the Indian monsoon region, frequent cloud cover in the rainy season results in less valid satellite observations during the vegetation growth period, making it difficult to extract land surface phenology (LSP). Even worse, many valid but humid observations were misidentified as clouds [...] Read more.
In the Indian monsoon region, frequent cloud cover in the rainy season results in less valid satellite observations during the vegetation growth period, making it difficult to extract land surface phenology (LSP). Even worse, many valid but humid observations were misidentified as clouds in the MODIS cloud mask, causing severe gaps in the LSP product. Using a refined cloud detection approach to separate clear-sky and cloudy observations, this study found that potentially valid observations during the vegetation growth period could be identified. Furthermore, the varied vegetation growth trajectories cannot be well-fitted by a global curve-fitting approach, but can be modelled by using the locally adjusted cubic-spline capping approach, which performed well for any seasonal patterns. Applying this approach, the start of growing season (SOS) was determined with 9.18% of vegetation growth amplitude between the maximum and minimum NDVI to generate the SOS product (2000–2016). The valid percentage of this regional product largely increased from 29.30% to 69.76% compared with the MCD12Q2 product, and its reliability was approximate to that of deciduous broadleaf forest in North America and Europe. This product could serve as a basis for understanding the response of terrestrial ecosystems to the changing Indian monsoon. Full article
(This article belongs to the Special Issue Land Surface Phenology )
Show Figures

Graphical abstract

20 pages, 28594 KiB  
Article
Analysis of Azimuthal Variations Using Multi-Aperture Polarimetric Entropy with Circular SAR Images
by Feiteng Xue, Yun Lin, Wen Hong, Qiang Yin, Bingchen Zhang, Wenjie Shen and Yue Zhao
Remote Sens. 2018, 10(1), 123; https://doi.org/10.3390/rs10010123 - 19 Jan 2018
Cited by 16 | Viewed by 5368
Abstract
In conventional synthetic aperture radar (SAR), sensors with a fixed look angle are assumed, and the scattering properties are considered as invariant in the azimuth. In some new SAR modes such as wide-angle SAR and circular SAR (CSAR), the azimuthal angle of view [...] Read more.
In conventional synthetic aperture radar (SAR), sensors with a fixed look angle are assumed, and the scattering properties are considered as invariant in the azimuth. In some new SAR modes such as wide-angle SAR and circular SAR (CSAR), the azimuthal angle of view is much larger. Anisotropic targets which have different physical shapes from different angles of view are difficult to interpret in the traditional observation model if variations remain unconsidered. Meanwhile, SAR polarimetry is a powerful tool to analyze and interpret targets’ scattering properties. Anisotropic targets can be precisely described with polarimetric signatures from different angles of view. In this paper, polarimetric data is separated into sub-apertures to provide polarimetric properties from different angles of view. A multi-aperture observation model which contains full polarimetric information from all angles of view is then established. Based on the multi-aperture observation model, multi-aperture polarimetric entropy (MAPE) is defined and is suggested as an extension of polarimetric entropy in multi-aperture situations. MAPE describes both targets’ polarimetric properties and variations across sub-apertures. Variations across the azimuth are analyzed and anisotropic and isotropic targets are identified by MAPE. MAPE can be used in many polarimetric wide angle and CSAR applications. Potential applications in target discrimination and classification are discussed. The effectiveness and advantages of MAPE are demonstrated with polarimetric CSAR data acquired from the Institute of Electronics, Chinese Academy of Sciences airborne CSAR system at P-band. Full article
(This article belongs to the Special Issue Uncertainty in Remote Sensing Image Analysis)
Show Figures

Figure 1

21 pages, 8116 KiB  
Article
A CNN-Based Method of Vehicle Detection from Aerial Images Using Hard Example Mining
by Yohei Koga, Hiroyuki Miyazaki and Ryosuke Shibasaki
Remote Sens. 2018, 10(1), 124; https://doi.org/10.3390/rs10010124 - 18 Jan 2018
Cited by 65 | Viewed by 8527
Abstract
Recently, deep learning techniques have had a practical role in vehicle detection. While much effort has been spent on applying deep learning to vehicle detection, the effective use of training data has not been thoroughly studied, although it has great potential for improving [...] Read more.
Recently, deep learning techniques have had a practical role in vehicle detection. While much effort has been spent on applying deep learning to vehicle detection, the effective use of training data has not been thoroughly studied, although it has great potential for improving training results, especially in cases where the training data are sparse. In this paper, we proposed using hard example mining (HEM) in the training process of a convolutional neural network (CNN) for vehicle detection in aerial images. We applied HEM to stochastic gradient descent (SGD) to choose the most informative training data by calculating the loss values in each batch and employing the examples with the largest losses. We picked 100 out of both 500 and 1000 examples for training in one iteration, and we tested different ratios of positive to negative examples in the training data to evaluate how the balance of positive and negative examples would affect the performance. In any case, our method always outperformed the plain SGD. The experimental results for images from New York showed improved performance over a CNN trained in plain SGD where the F1 score of our method was 0.02 higher. Full article
Show Figures

Graphical abstract

16 pages, 8920 KiB  
Article
Ground-Based Remote Sensing of Volcanic CO2 Fluxes at Solfatara (Italy)—Direct Versus Inverse Bayesian Retrieval
by Manuel Queißer, Mike Burton, Domenico Granieri and Matthew Varnam
Remote Sens. 2018, 10(1), 125; https://doi.org/10.3390/rs10010125 - 18 Jan 2018
Cited by 1 | Viewed by 5033
Abstract
CO2 is the second most abundant volatile species of degassing magma. CO2 fluxes carry information of incredible value, such as periods of volcanic unrest. Ground-based laser remote sensing is a powerful technique to measure CO2 fluxes in a spatially integrated [...] Read more.
CO2 is the second most abundant volatile species of degassing magma. CO2 fluxes carry information of incredible value, such as periods of volcanic unrest. Ground-based laser remote sensing is a powerful technique to measure CO2 fluxes in a spatially integrated manner, quickly and from a safe distance, but it needs accurate knowledge of the plume speed. The latter is often difficult to estimate, particularly for complex topographies. So, a supplementary or even alternative way of retrieving fluxes would be beneficial. Here, we assess Bayesian inversion as a potential technique for the case of the volcanic crater of Solfatara (Italy), a complex terrain hosting two major CO2 degassing fumarolic vents close to a steep slope. Direct integration of remotely sensed CO2 concentrations of these vents using plume speed derived from optical flow analysis yielded a flux of 717 ± 121 t day−1, in agreement with independent measurements. The flux from Bayesian inversion based on a simple Gaussian plume model was in excellent agreement under certain conditions. In conclusion, Bayesian inversion is a promising retrieval tool for CO2 fluxes, especially in situations where plume speed estimation methods fail, e.g., optical flow for transparent plumes. The results have implications beyond volcanology, including ground-based remote sensing of greenhouse gases and verification of satellite soundings. Full article
(This article belongs to the Section Atmospheric Remote Sensing)
Show Figures

Graphical abstract

22 pages, 5775 KiB  
Article
Stability Assessment of the (A)ATSR Sea Surface Temperature Climate Dataset from the European Space Agency Climate Change Initiative
by David I. Berry, Gary K. Corlett, Owen Embury and Christopher J. Merchant
Remote Sens. 2018, 10(1), 126; https://doi.org/10.3390/rs10010126 - 18 Jan 2018
Cited by 12 | Viewed by 7450
Abstract
Sea surface temperature is a key component of the climate record, with multiple independent records giving confidence in observed changes. As part of the European Space Agencies (ESA) Climate Change Initiative (CCI) the satellite archives have been reprocessed with the aim of creating [...] Read more.
Sea surface temperature is a key component of the climate record, with multiple independent records giving confidence in observed changes. As part of the European Space Agencies (ESA) Climate Change Initiative (CCI) the satellite archives have been reprocessed with the aim of creating a new dataset that is independent of the in situ observations, and stable with no artificial drift (<0.1 K decade−1 globally) or step changes. We present a method to assess the satellite sea surface temperature (SST) record for step changes using the Penalized Maximal t Test (PMT) applied to aggregate time series. We demonstrated the application of the method using data from version EXP1.8 of the ESA SST CCI dataset averaged on a 7 km grid and in situ observations from moored buoys, drifting buoys and Argo floats. The CCI dataset was shown to be stable after ~1994, with minimal divergence (~0.01 K decade−1) between the CCI data and in situ observations. Two steps were identified due to the failure of a gyroscope on the ERS-2 satellite, and subsequent correction mechanisms applied. These had minimal impact on the stability due to having equal magnitudes but opposite signs. The statistical power and false alarm rate of the method were assessed. Full article
(This article belongs to the Special Issue Sea Surface Temperature Retrievals from Remote Sensing)
Show Figures

Graphical abstract

19 pages, 17419 KiB  
Article
Role of El Niño Southern Oscillation (ENSO) Events on Temperature and Salinity Variability in the Agulhas Leakage Region
by Morgan L. Paris and Bulusu Subrahmanyam
Remote Sens. 2018, 10(1), 127; https://doi.org/10.3390/rs10010127 - 18 Jan 2018
Cited by 7 | Viewed by 7682
Abstract
This study explores the relationship between the Agulhas Current system and El Niño Southern Oscillation (ENSO) events. Specifically, it addresses monthly to yearly variations in Agulhas leakage where the Agulhas Current sheds waters into the Atlantic Ocean, in turn affecting meridional overturning circulation [...] Read more.
This study explores the relationship between the Agulhas Current system and El Niño Southern Oscillation (ENSO) events. Specifically, it addresses monthly to yearly variations in Agulhas leakage where the Agulhas Current sheds waters into the Atlantic Ocean, in turn affecting meridional overturning circulation (MOC). Sea surface temperature (SST) data from the National Oceanic and Atmospheric Administration’s (NOAA) Advanced Very High Resolution Radiometer (AVHRR) combined with sea surface salinity (SSS) from Soil Moisture Ocean Salinity (SMOS) and Simple Ocean Data Assimilation (SODA) reanalysis are used to explore changes in Agulhas leakage dynamics. Agulhas leakage is anomalously warm in response to El Niño and anomalously cool in response to La Niña. The corresponding SSS signal shows both a primary and secondary signal response. At first, the SSS signal of Agulhas leakage is anomalously fresh in response to El Niño, but this primary signal is replaced by a secondary anomalously saline signal. In response to La Niña, the primary SSS signal of Agulhas leakage is anomalously saline, while the secondary SSS signal is anomalously fresh. The lag between the peak of ENSO and the response in SST and the corresponding primary SSS signal of Agulhas leakage is about 20 months, followed by the secondary SSS signal at a lag of about 26 months. In general, increasing ENSO strength increases the extremes of the resulting anomalous SST and SSS signal and impacts the Agulhas leakage region earlier during El Niño and slightly later during La Niña. Full article
(This article belongs to the Special Issue Sea Surface Temperature Retrievals from Remote Sensing)
Show Figures

Graphical abstract

25 pages, 8879 KiB  
Article
Impacts on the Urban Environment: Land Cover Change Trajectories and Landscape Fragmentation in Post-War Western Area, Sierra Leone
by Solomon Peter Gbanie, Amy L. Griffin and Alec Thornton
Remote Sens. 2018, 10(1), 129; https://doi.org/10.3390/rs10010129 - 19 Jan 2018
Cited by 64 | Viewed by 10666
Abstract
An influential underlying driver of human-induced landscape change is civil war and other forms of conflict that cause human displacement. Internally displaced persons (IDPs) increase environmental pressures at their destination locations while reducing them at their origins. This increased pressure presents an environment [...] Read more.
An influential underlying driver of human-induced landscape change is civil war and other forms of conflict that cause human displacement. Internally displaced persons (IDPs) increase environmental pressures at their destination locations while reducing them at their origins. This increased pressure presents an environment for increased land cover change (LCC) rates and landscape fragmentation. To test whether this hypothesis is correct, this research sought to understand LCC dynamics in the Western Area of Sierra Leone from 1976 to 2011, a period including pre-conflict, conflict, and post-conflict eras, using Landsat and SPOT satellite imagery. A trajectory analysis of classified images compared LCC trajectories before and during the war (1976–2000) with after the war (2003–2011). Over the 35-year period, the built-up land class rapidly increased, in parallel with an increase in urban and peri-urban agriculture. During the war, urban and peri-urban agriculture became a major livelihood activity for displaced rural residents to make the region food self-sufficient, especially when the war destabilised food production activities. The reluctance of IDPs to return to their rural homes after the war caused an increased demand for land driven by housing needs. Meanwhile, protected forest and other forest declined. A significant finding to emerge from this research is that landscape fragmentation increased in conjunction with declining forest cover while built-up areas aggregated. This has important implications for the region’s flora, fauna, and human populations given that other research has shown that landscape fragmentation affects the landscape’s ability to provide important ecosystem services. Full article
(This article belongs to the Special Issue Remote Sensing of Urban Agriculture and Land Cover)
Show Figures

Figure 1

24 pages, 5113 KiB  
Article
A Zipf’s Law-Based Method for Mapping Urban Areas Using NPP-VIIRS Nighttime Light Data
by Wenjia Wu, Hongrui Zhao and Shulong Jiang
Remote Sens. 2018, 10(1), 130; https://doi.org/10.3390/rs10010130 - 18 Jan 2018
Cited by 31 | Viewed by 6591
Abstract
A significant difficulty in urban studies is obtaining urban areas. Nighttime light (NTL) data provide efficient approaches to map urban areas. Previous methods have utilized visual particularities of cities with ancillary data to obtain the optimal thresholds. How cities behave differently from rural [...] Read more.
A significant difficulty in urban studies is obtaining urban areas. Nighttime light (NTL) data provide efficient approaches to map urban areas. Previous methods have utilized visual particularities of cities with ancillary data to obtain the optimal thresholds. How cities behave differently from rural areas should be considered. A Zipf’s law-based method is proposed to bootstrap the optimal threshold based on the statistical properties of a Zipf’s law model on continuous thresholds at the country scale. In our method, the Zipf’s law model is utilized to quantify fractal, self-organized, and agglomeration behaviors of cities. The three-phase cluster dynamics are discovered and the abrupt transition between Phase 1 and Phase 2 denotes the rural-urban demarcation point. The urban areas are derived by the proposed method from the Suomi National Polar-Orbiting Partnership Visible Infrared Imaging Radiometer Suite (NPP-VIIRS) NTL data in 2013 in China. An accuracy assessment is conducted to compare it with the GlobeLand30-2010 data and the overall accuracy has directly confirmed the effectiveness of the method. The validation using point of interest (POI) data verifies that the urban areas show strong responses to social interactions and production with R2 values of 0.91 and 0.92, respectively, implying that the city areas extracted by our method can be a proxy for human activities. Comparisons with existing methods validate the effectiveness and high degree of automation of the proposed method in mapping urban areas at the country level. According to our analyses, the Zipf’s law-based method shows great potential to provide a universal criterion to map urban areas from the perspective of the behaviors of urban systems without ancillary data, and a valuable tool for spatial and temporal urban studies. Full article
Show Figures

Graphical abstract

21 pages, 19273 KiB  
Article
Geospatial Object Detection in High Resolution Satellite Images Based on Multi-Scale Convolutional Neural Network
by Wei Guo, Wen Yang, Haijian Zhang and Guang Hua
Remote Sens. 2018, 10(1), 131; https://doi.org/10.3390/rs10010131 - 18 Jan 2018
Cited by 165 | Viewed by 18659
Abstract
Daily acquisition of large amounts of aerial and satellite images has facilitated subsequent automatic interpretations of these images. One such interpretation is object detection. Despite the great progress made in this domain, the detection of multi-scale objects, especially small objects in high resolution [...] Read more.
Daily acquisition of large amounts of aerial and satellite images has facilitated subsequent automatic interpretations of these images. One such interpretation is object detection. Despite the great progress made in this domain, the detection of multi-scale objects, especially small objects in high resolution satellite (HRS) images, has not been adequately explored. As a result, the detection performance turns out to be poor. To address this problem, we first propose a unified multi-scale convolutional neural network (CNN) for geospatial object detection in HRS images. It consists of a multi-scale object proposal network and a multi-scale object detection network, both of which share a multi-scale base network. The base network can produce feature maps with different receptive fields to be responsible for objects with different scales. Then, we use the multi-scale object proposal network to generate high quality object proposals from the feature maps. Finally, we use these object proposals with the multi-scale object detection network to train a good object detector. Comprehensive evaluations on a publicly available remote sensing object detection dataset and comparisons with several state-of-the-art approaches demonstrate the effectiveness of the presented method. The proposed method achieves the best mean average precision (mAP) value of 89.6%, runs at 10 frames per second (FPS) on a GTX 1080Ti GPU. Full article
(This article belongs to the Section Remote Sensing Image Processing)
Show Figures

Graphical abstract

14 pages, 16161 KiB  
Article
Automatic Ship Detection in Remote Sensing Images from Google Earth of Complex Scenes Based on Multiscale Rotation Dense Feature Pyramid Networks
by Xue Yang, Hao Sun, Kun Fu, Jirui Yang, Xian Sun, Menglong Yan and Zhi Guo
Remote Sens. 2018, 10(1), 132; https://doi.org/10.3390/rs10010132 - 18 Jan 2018
Cited by 522 | Viewed by 20780
Abstract
Ship detection has been playing a significant role in the field of remote sensing for a long time, but it is still full of challenges. The main limitations of traditional ship detection methods usually lie in the complexity of application scenarios, the difficulty [...] Read more.
Ship detection has been playing a significant role in the field of remote sensing for a long time, but it is still full of challenges. The main limitations of traditional ship detection methods usually lie in the complexity of application scenarios, the difficulty of intensive object detection, and the redundancy of the detection region. In order to solve these problems above, we propose a framework called Rotation Dense Feature Pyramid Networks (R-DFPN) which can effectively detect ships in different scenes including ocean and port. Specifically, we put forward the Dense Feature Pyramid Network (DFPN), which is aimed at solving problems resulting from the narrow width of the ship. Compared with previous multiscale detectors such as Feature Pyramid Network (FPN), DFPN builds high-level semantic feature-maps for all scales by means of dense connections, through which feature propagation is enhanced and feature reuse is encouraged. Additionally, in the case of ship rotation and dense arrangement, we design a rotation anchor strategy to predict the minimum circumscribed rectangle of the object so as to reduce the redundant detection region and improve the recall. Furthermore, we also propose multiscale region of interest (ROI) Align for the purpose of maintaining the completeness of the semantic and spatial information. Experiments based on remote sensing images from Google Earth for ship detection show that our detection method based on R-DFPN representation has state-of-the-art performance. Full article
(This article belongs to the Special Issue Deep Learning for Remote Sensing)
Show Figures

Graphical abstract

22 pages, 12811 KiB  
Article
Unsupervised Clustering Method for Complexity Reduction of Terrestrial Lidar Data in Marshes
by Chuyen Nguyen, Michael J. Starek, Philippe Tissot and James Gibeaut
Remote Sens. 2018, 10(1), 133; https://doi.org/10.3390/rs10010133 - 18 Jan 2018
Cited by 18 | Viewed by 6721
Abstract
Accurate characterization of marsh elevation and landcover evolution is important for coastal management and conservation. This research proposes a novel unsupervised clustering method specifically developed for segmenting dense terrestrial laser scanning (TLS) data in coastal marsh environments. The framework implements unsupervised clustering with [...] Read more.
Accurate characterization of marsh elevation and landcover evolution is important for coastal management and conservation. This research proposes a novel unsupervised clustering method specifically developed for segmenting dense terrestrial laser scanning (TLS) data in coastal marsh environments. The framework implements unsupervised clustering with the well-known K-means algorithm by applying an optimization to determine the “k” clusters. The fundamental idea behind this novel framework is the application of multi-scale voxel representation of 3D space to create a set of features that characterizes the local complexity and geometry of the terrain. A combination of point- and voxel-generated features are utilized to segment 3D point clouds into homogenous groups in order to study surface changes and vegetation cover. Results suggest that the combination of point and voxel features represent the dataset well. The developed method compresses millions of 3D points representing the complex marsh environment into eight distinct clusters representing different landcover: tidal flat, mangrove, low marsh to high marsh, upland, and power lines. A quantitative assessment of the automated delineation of the tidal flat areas shows acceptable results considering the proposed method is unsupervised with no training data. Clustering results based on K-means are also compared to results based on the Self Organizing Map (SOM) clustering algorithm. Results demonstrate that the developed multi-scale voxelization approach and representative feature set are transferrable to other clustering algorithms, thereby providing an unsupervised framework for intelligent scene segmentation of TLS point cloud data in marshes. Full article
(This article belongs to the Special Issue 3D Modelling from Point Clouds: Algorithms and Methods)
Show Figures

Graphical abstract

21 pages, 14664 KiB  
Article
Water Loss Due to Increasing Planted Vegetation over the Badain Jaran Desert, China
by Xunhe Zhang, Nai’ang Wang, Zunyi Xie, Xuanlong Ma and Alfredo Huete
Remote Sens. 2018, 10(1), 134; https://doi.org/10.3390/rs10010134 - 18 Jan 2018
Cited by 22 | Viewed by 7476
Abstract
Water resources play a vital role in ecosystem stability, human survival, and social development in drylands. Human activities, such as afforestation and irrigation, have had a large impact on the water cycle and vegetation in drylands over recent years. The Badain Jaran Desert [...] Read more.
Water resources play a vital role in ecosystem stability, human survival, and social development in drylands. Human activities, such as afforestation and irrigation, have had a large impact on the water cycle and vegetation in drylands over recent years. The Badain Jaran Desert (BJD) is one of the driest regions in China with increasing human activities, yet the connection between human management and the ecohydrology of this area remains largely unclear. In this study, we firstly investigated the ecohydrological dynamics and their relationship across different spatial scales over the BJD, using multi-source observational data from 2001 to 2014, including: total water storage anomaly (TWSA) from Gravity Recovery and Climate Experiment (GRACE), normalized difference vegetation index (NDVI) from Moderate Resolution Imaging Spectroradiometer (MODIS), lake extent from Landsat, and precipitation from in situ meteorological stations. We further studied the response of the local hydrological conditions to large scale vegetation and climatic dynamics, also conducting a change analysis of water levels over four selected lakes within the BJD region from 2011. To normalize the effect of inter-annual variations of precipitation on vegetation, we also employed a relationship between annual average NDVI and annual precipitation, or modified rain-use efficiency, termed the RUEmo. A focus of this study is to understand the impact of the increasing planted vegetation on local ecohydrological systems over the BJD region. Results showed that vegetation increases were largely found to be confined to the areas intensely influenced by human activities, such as croplands and urban areas. With precipitation patterns remaining stable during the study period, there was a significant increasing trend in vegetation greenness per unit of rainfall, or RUEmo over the BJD, while at the same time, total water storage as measured by satellites has been continually decreasing since 2003. This suggested that the increased trend in vegetation and apparent increase in RUEmo can be attributed to the extraction of ground water for human-planted irrigated vegetation. In the hinterland of the BJD, we identified human-planted vegetation around the lakes using MODIS observations and field investigations. Four lake basins were chosen to validate the relationship between lake levels and planted vegetation. Our results indicated that increasing human-planted vegetation significantly increased the water loss over the BJD region. This study highlights the value of combining observational data from space-borne sensors and ground instruments to monitor the ecohydrological dynamics and the impact of human activities on water resources and ecosystems over the drylands. Full article
(This article belongs to the Special Issue Remote Sensing of Arid/Semiarid Lands)
Show Figures

Graphical abstract

28 pages, 5146 KiB  
Article
Identifying Forest Impacted by Development in the Commonwealth of Virginia through the Use of Landsat and Known Change Indicators
by Matthew N. House and Randolph H. Wynne
Remote Sens. 2018, 10(1), 135; https://doi.org/10.3390/rs10010135 - 18 Jan 2018
Cited by 1 | Viewed by 4260
Abstract
This study examines the effectiveness of using the Normalized Difference Vegetation Index (NDVI) derived from 1326 different Landsat Thematic Mapper and Enhanced Thematic Mapper images in finding low density development within the Commonwealth of Virginia’s forests. Individual NDVI images were stacked by year [...] Read more.
This study examines the effectiveness of using the Normalized Difference Vegetation Index (NDVI) derived from 1326 different Landsat Thematic Mapper and Enhanced Thematic Mapper images in finding low density development within the Commonwealth of Virginia’s forests. Individual NDVI images were stacked by year for the years 1995–2011 and the yearly maximum for each pixel was extracted, resulting in a 17-year image stack of all yearly maxima (a 98.7% data reduction). Using location data from housing starts and well permits, known previously forested housing starts were isolated from all other forest disturbance types. Samples from development disturbances and other forest disturbances, as well as from undisturbed forest, were used to derive vegetation index thresholds enabling separation of disturbed forest from undisturbed forest. Disturbances, once identified, could be separated into Development Disturbances and Non-Development Disturbances using a classification tree and only two variables from the Disturbance Detection and Diagnostics (D3) algorithm: the maximum NDVI in the available recovery period and the slope between the NDVI value at the time of the disturbance and the maximum NDVI in the available recovery period. Low density development disturbances of previous forest land cover had an F-measure, combining precision and recall into a single class-specific accuracy (β = 1), of 0.663. We compared our results to the NLCD 2001–2011 land cover changes from any forest (classes 41, 42, 43, and 90) to any developed (classes 21, 22, 23, and 24), resulting in an F-measure of 0.00 for the same validation points. Landsat time series stacks thus show promise for identifying even the small changes associated with low density development that have been historically overlooked/underestimated by prior mapping efforts. However, further research is needed to ensure that (1) the approach will work in other forest biomes and (2) enabling detection of these important, but spatially and spectrally subtle, disturbances still ensures accurate detection of other forest disturbances. Full article
(This article belongs to the Section Forest Remote Sensing)
Show Figures

Graphical abstract

22 pages, 7397 KiB  
Article
Tracking Snow Variations in the Northern Hemisphere Using Multi-Source Remote Sensing Data (2000–2015)
by Yunlong Wang, Xiaodong Huang, Hui Liang, Yanhua Sun, Qisheng Feng and Tiangang Liang
Remote Sens. 2018, 10(1), 136; https://doi.org/10.3390/rs10010136 - 18 Jan 2018
Cited by 50 | Viewed by 7191
Abstract
Multi-source remote sensing data were used to generate 500-m resolution cloud-free daily snow cover images for the Northern Hemisphere. Simultaneously, the spatial and temporal dynamic variations of snow in the Northern Hemisphere were evaluated from 2000 to 2015. The results indicated that (1) [...] Read more.
Multi-source remote sensing data were used to generate 500-m resolution cloud-free daily snow cover images for the Northern Hemisphere. Simultaneously, the spatial and temporal dynamic variations of snow in the Northern Hemisphere were evaluated from 2000 to 2015. The results indicated that (1) the maximum, minimum, and annual average snow-covered area (SCA) in the Northern Hemisphere exhibited a fluctuating downward trend; the variation of snow cover in the Northern Hemisphere had well-defined inter-annual and regional differences; (2) the average SCA in the Northern Hemisphere was the largest in January and the smallest in August; the SCA exhibited a downward trend for the monthly variations from February to April; and the seasonal variation in the SCA exhibited a downward trend in the spring, summer, and fall in the Northern Hemisphere (no pronounced variation trend in the winter was observed) during the 2000–2015 period; (3) the spatial distribution of the annual average snow-covered day (SCD) was related to the latitudinal zonality, and the areas exhibiting an upward trend were mainly at the mid to low latitudes with unstable SCA variations; and (4) the snow reduction was significant in the perennial SCA in the Northern Hemisphere, including high-latitude and high-elevation mountainous regions (between 35° and 50°N), such as the Tibetan Plateau, the Tianshan Mountains, the Pamir Plateau in Asia, the Alps in Europe, the Caucasus Mountains, and the Cordillera Mountains in North America. Full article
(This article belongs to the Special Issue Snow Remote Sensing)
Show Figures

Graphical abstract

19 pages, 30570 KiB  
Article
Aerosol Optical Depth Retrieval over East Asia Using Himawari-8/AHI Data
by Wenhao Zhang, Hui Xu and Fengjie Zheng
Remote Sens. 2018, 10(1), 137; https://doi.org/10.3390/rs10010137 - 19 Jan 2018
Cited by 55 | Viewed by 8759
Abstract
This paper presents a new algorithm to retrieve the aerosol optical depth (AOD) from a Himawari-8 Advanced Himawari Imager (AHI). Six typical aerosol models that derived from the long-term ground-based observations of East Asia are used in AOD retrieval. To accurately determine the [...] Read more.
This paper presents a new algorithm to retrieve the aerosol optical depth (AOD) from a Himawari-8 Advanced Himawari Imager (AHI). Six typical aerosol models that derived from the long-term ground-based observations of East Asia are used in AOD retrieval. To accurately determine the surface reflectance, improved channel relationships between red, blue, and shortwave infrared (SWIR) are built up according to the infrared Normalized Difference Vegetation Index (NDVISWIR). Based on the new derived aerosol models and improved channel relationships, AOD over East Asian is retrieved by using the AHI data. The results are compared with Moderate Resolution Imaging Spectroradiometer (MODIS) aerosol products (MOD04 and MYD04) and yielded a correlation coefficient lager than 0.8 (R = 0.87 and 0.92, respectively). In addition, the retrieved AOD values are also validated by ground-based measurements at 12 Aerosol Robotic Network (AERONET) locations and revealed a good agreement between them (R = 0.86). Full article
(This article belongs to the Special Issue Aerosol Remote Sensing)
Show Figures

Graphical abstract

19 pages, 3791 KiB  
Article
Target Recognition in SAR Images Based on Information-Decoupled Representation
by Ming Chang and Xuqun You
Remote Sens. 2018, 10(1), 138; https://doi.org/10.3390/rs10010138 - 19 Jan 2018
Cited by 21 | Viewed by 6569
Abstract
This paper proposes an automatic target recognition (ATR) method for synthetic aperture radar (SAR) images based on information-decoupled representation. A typical SAR image of a ground target can be divided into three parts: target region, shadow and background. From the aspect of SAR [...] Read more.
This paper proposes an automatic target recognition (ATR) method for synthetic aperture radar (SAR) images based on information-decoupled representation. A typical SAR image of a ground target can be divided into three parts: target region, shadow and background. From the aspect of SAR target recognition, the target region and shadow contain discriminative information. However, they also include some confusing information because of the similarities of different targets. The background mainly contains redundant information, which has little contribution to the target recognition. Because the target segmentation may impair the discriminative information in the target region, the relatively simpler shadow segmentation is performed to separate the shadow region for information decoupling. Then, the information-decoupled representations are generated, i.e., the target image, shadow and original image. The background is retained in the target image, which represents the coupling of target backscattering and background. The original image and generated target image are classified using the sparse representation-based classification (SRC). Then, their classification results are combined by a score-level fusion for target recognition. The shadow image is not used because of its lower discriminability and possible segmentation errors. To evaluate the performance of the proposed method, extensive experiments are conducted on the Moving and Stationary Target Acquisition and Recognition (MSTAR) dataset under both standard operating condition (SOC) and various extended operating conditions (EOCs). The proposed method can correctly classify 10 classes of targets with the percentage of correct classification (PCC) of 94.88% under SOC. With the PCCs of 93.15% and 75.03% under configuration variance and 45° depression angle, respectively, the superiority of the proposed is demonstrated in comparison with other methods. The robustness of the proposed method to both uniform and nonuniform shadow segmentation errors is validated with the PCCs over 93%. Moreover, with the maximum average precision of 0.9580, the proposed method is more effective than the reference methods on outlier rejection. Full article
(This article belongs to the Section Remote Sensing Image Processing)
Show Figures

Figure 1

15 pages, 8383 KiB  
Article
End-to-End Airplane Detection Using Transfer Learning in Remote Sensing Images
by Zhong Chen, Ting Zhang and Chao Ouyang
Remote Sens. 2018, 10(1), 139; https://doi.org/10.3390/rs10010139 - 18 Jan 2018
Cited by 192 | Viewed by 12852
Abstract
Airplane detection in remote sensing images remains a challenging problem due to the complexity of backgrounds. In recent years, with the development of deep learning, object detection has also obtained great breakthroughs. For object detection tasks in natural images, such as the PASCAL [...] Read more.
Airplane detection in remote sensing images remains a challenging problem due to the complexity of backgrounds. In recent years, with the development of deep learning, object detection has also obtained great breakthroughs. For object detection tasks in natural images, such as the PASCAL (Pattern Analysis, Statistical Modelling and Computational Learning) VOC (Visual Object Classes) Challenge, the major trend of current development is to use a large amount of labeled classification data to pre-train the deep neural network as a base network, and then use a small amount of annotated detection data to fine-tune the network for detection. In this paper, we use object detection technology based on deep learning for airplane detection in remote sensing images. In addition to using some characteristics of remote sensing images, some new data augmentation techniques have been proposed. We also use transfer learning and adopt a single deep convolutional neural network and limited training samples to implement end-to-end trainable airplane detection. Classification and positioning are no longer divided into multistage tasks; end-to-end detection attempts to combine them for optimization, which ensures an optimal solution for the final stage. In our experiment, we use remote sensing images of airports collected from Google Earth. The experimental results show that the proposed algorithm is highly accurate and meaningful for remote sensing object detection. Full article
Show Figures

Figure 1

20 pages, 11558 KiB  
Article
An Accelerated Backprojection Algorithm for Monostatic and Bistatic SAR Processing
by Heng Zhang, Jiangwen Tang, Robert Wang, Yunkai Deng, Wei Wang and Ning Li
Remote Sens. 2018, 10(1), 140; https://doi.org/10.3390/rs10010140 - 18 Jan 2018
Cited by 26 | Viewed by 5440
Abstract
The backprojection (BP) algorithm has been applied to every SAR mode due to its great focusing quality and adaptability. However, the BP algorithm suffers from immense computational complexity. To improve the efficiency of the conventional BP algorithm, several fast BP (FBP) algorithms, such [...] Read more.
The backprojection (BP) algorithm has been applied to every SAR mode due to its great focusing quality and adaptability. However, the BP algorithm suffers from immense computational complexity. To improve the efficiency of the conventional BP algorithm, several fast BP (FBP) algorithms, such as the fast factorization BP (FFBP) and Block_FFBP, have been developed in recent studies. In the derivation of Block_FFBP, range data are divided into blocks, and the upsampling process is performed using an interpolation kernel instead of a fast Fourier transform (FFT), which reduces the processing efficiency. To circumvent these limitations, an accelerated BP algorithm based on Block_FFBP is proposed. In this algorithm, a fixed number of pivots rather than the beam centers is applied to construct the relationship of the propagation time delay between the “new” and “old” subapertures. Partition in the range dimension is avoided, and the range data are processed as a bulk. This accelerated BP algorithm benefits from the integrated range processing scheme and is extended to bistatic SAR processing. In this sense, the proposed algorithm can be referred to simply as MoBulk_FFBP for the monostatic SAR case and BiBulk_FFBP for the bistatic SAR case. Furthermore, for monostatic and azimuth-invariant bistatic SAR cases where the platform runs along a straight trajectory, the slant range mapping can be expressed in a continuous and analytical form. Real data from the spaceborne/stationary bistatic SAR experiment with TerraSAR-X operating in the staring spotlight mode and from the airborne spotlight SAR experiment acquired in 2016 are used to validate the performances of BiBulk_FFBP and MoBulk_FFBP, respectively. Full article
(This article belongs to the Special Issue Advances in SAR: Sensors, Methodologies, and Applications)
Show Figures

Graphical abstract

20 pages, 9749 KiB  
Article
Portraying Urban Functional Zones by Coupling Remote Sensing Imagery and Human Sensing Data
by Wei Tu, Zhongwen Hu, Lefei Li, Jinzhou Cao, Jincheng Jiang, Qiuping Li and Qingquan Li
Remote Sens. 2018, 10(1), 141; https://doi.org/10.3390/rs10010141 - 18 Jan 2018
Cited by 124 | Viewed by 11071
Abstract
Portraying urban functional zones provides useful insights into understanding complex urban systems and establishing rational urban planning. Although several studies have confirmed the efficacy of remote sensing imagery in urban studies, coupling remote sensing and new human sensing data like mobile phone positioning [...] Read more.
Portraying urban functional zones provides useful insights into understanding complex urban systems and establishing rational urban planning. Although several studies have confirmed the efficacy of remote sensing imagery in urban studies, coupling remote sensing and new human sensing data like mobile phone positioning data to identify urban functional zones has still not been investigated. In this study, a new framework integrating remote sensing imagery and mobile phone positioning data was developed to analyze urban functional zones with landscape and human activity metrics. Landscapes metrics were calculated based on land cover from remote sensing images. Human activities were extracted from massive mobile phone positioning data. By integrating them, urban functional zones (urban center, sub-center, suburbs, urban buffer, transit region and ecological area) were identified by a hierarchical clustering. Finally, gradient analysis in three typical transects was conducted to investigate the pattern of landscapes and human activities. Taking Shenzhen, China, as an example, the conducted experiment shows that the pattern of landscapes and human activities in the urban functional zones in Shenzhen does not totally conform to the classical urban theories. It demonstrates that the fusion of remote sensing imagery and human sensing data can characterize the complex urban spatial structure in Shenzhen well. Urban functional zones have the potential to act as bridges between the urban structure, human activity and urban planning policy, providing scientific support for rational urban planning and sustainable urban development policymaking. Full article
Show Figures

Graphical abstract

20 pages, 4781 KiB  
Article
Dependence of C-Band Backscatter on Ground Temperature, Air Temperature and Snow Depth in Arctic Permafrost Regions
by Helena Bergstedt, Simon Zwieback, Annett Bartsch and Marina Leibman
Remote Sens. 2018, 10(1), 142; https://doi.org/10.3390/rs10010142 - 19 Jan 2018
Cited by 29 | Viewed by 7132
Abstract
Microwave remote sensing has found numerous applications in areas affected by permafrost and seasonally frozen ground. In this study, we focused on data obtained by the Advanced Scatterometer (ASCAT, C-band) during winter periods when the ground is assumed to be frozen. This paper [...] Read more.
Microwave remote sensing has found numerous applications in areas affected by permafrost and seasonally frozen ground. In this study, we focused on data obtained by the Advanced Scatterometer (ASCAT, C-band) during winter periods when the ground is assumed to be frozen. This paper discusses the relationships of ASCAT backscatter with snow depth, air and ground temperature through correlations and the analysis of covariance (ANCOVA) to quantify influences on backscatter values during situations of frozen ground. We studied sites in Alaska, Northern Canada, Scandinavia and Siberia. Air temperature and snow depth data were obtained from 19 World Meteorological Organization (WMO) and 4 Snow Telemetry (SNOTEL) stations. Ground temperature data were obtained from 36 boreholes through the Global Terrestrial Network for Permafrost Database (GTN-P) and additional records from central Yamal. Results suggest distinct differences between sites with and without underlying continuous permafrost. Sites characterized by high freezing indices (>4000 degree-days) have consistently stronger median correlations of ASCAT backscatter with ground temperature for all measurement depths. We show that the dynamics in winter-time backscatter cannot be solely explained through snow processes, but are also highly correlated with ground temperature up to a considerable depth (60 cm). These findings have important implications for both freeze/thaw and snow water equivalent retrieval algorithms based on C-band radar measurements. Full article
(This article belongs to the Special Issue Cryospheric Remote Sensing II)
Show Figures

Graphical abstract

18 pages, 1962 KiB  
Article
Downscaling GRACE Remote Sensing Datasets to High-Resolution Groundwater Storage Change Maps of California’s Central Valley
by Michelle E. Miro and James S. Famiglietti
Remote Sens. 2018, 10(1), 143; https://doi.org/10.3390/rs10010143 - 19 Jan 2018
Cited by 117 | Viewed by 14056
Abstract
NASA’s Gravity Recovery and Climate Experiment (GRACE) has already proven to be a powerful data source for regional groundwater assessments in many areas around the world. However, the applicability of GRACE data products to more localized studies and their utility to water management [...] Read more.
NASA’s Gravity Recovery and Climate Experiment (GRACE) has already proven to be a powerful data source for regional groundwater assessments in many areas around the world. However, the applicability of GRACE data products to more localized studies and their utility to water management authorities have been constrained by their limited spatial resolution (~200,000 km2). Researchers have begun to address these shortcomings with data assimilation approaches that integrate GRACE-derived total water storage estimates into complex regional models, producing higher-resolution estimates of hydrologic variables (~2500 km2). Here we take those approaches one step further by developing an empirically based model capable of downscaling GRACE data to a high-resolution (~16 km2) dataset of groundwater storage changes over a portion of California’s Central Valley. The model utilizes an artificial neural network to generate a series of high-resolution maps of groundwater storage change from 2002 to 2010 using GRACE estimates of variations in total water storage and a series of widely available hydrologic variables (PRISM precipitation and temperature data, digital elevation model (DEM)-derived slope, and Natural Resources Conservation Service (NRCS) soil type). The neural network downscaling model is able to accurately reproduce local groundwater behavior, with acceptable Nash-Sutcliffe efficiency (NSE) values for calibration and validation (ranging from 0.2445 to 0.9577 and 0.0391 to 0.7511, respectively). Ultimately, the model generates maps of local groundwater storage change at a 100-fold higher resolution than GRACE gridded data products without the use of computationally intensive physical models. The model’s simulated maps have the potential for application to local groundwater management initiatives in the region. Full article
(This article belongs to the Special Issue Remote Sensing of Groundwater from River Basin to Global Scales)
Show Figures

Graphical abstract

18 pages, 11465 KiB  
Article
Building Extraction in Very High Resolution Remote Sensing Imagery Using Deep Learning and Guided Filters
by Yongyang Xu, Liang Wu, Zhong Xie and Zhanlong Chen
Remote Sens. 2018, 10(1), 144; https://doi.org/10.3390/rs10010144 - 19 Jan 2018
Cited by 426 | Viewed by 22872
Abstract
Very high resolution (VHR) remote sensing imagery has been used for land cover classification, and it tends to a transition from land-use classification to pixel-level semantic segmentation. Inspired by the recent success of deep learning and the filter method in computer vision, this [...] Read more.
Very high resolution (VHR) remote sensing imagery has been used for land cover classification, and it tends to a transition from land-use classification to pixel-level semantic segmentation. Inspired by the recent success of deep learning and the filter method in computer vision, this work provides a segmentation model, which designs an image segmentation neural network based on the deep residual networks and uses a guided filter to extract buildings in remote sensing imagery. Our method includes the following steps: first, the VHR remote sensing imagery is preprocessed and some hand-crafted features are calculated. Second, a designed deep network architecture is trained with the urban district remote sensing image to extract buildings at the pixel level. Third, a guided filter is employed to optimize the classification map produced by deep learning; at the same time, some salt-and-pepper noise is removed. Experimental results based on the Vaihingen and Potsdam datasets demonstrate that our method, which benefits from neural networks and guided filtering, achieves a higher overall accuracy when compared with other machine learning and deep learning methods. The method proposed shows outstanding performance in terms of the building extraction from diversified objects in the urban district. Full article
(This article belongs to the Special Issue Deep Learning for Remote Sensing)
Show Figures

Graphical abstract

18 pages, 5863 KiB  
Article
Trend Detection for the Extent of Irrigated Agriculture in Idaho’s Snake River Plain, 1984–2016
by Eric W. Chance, Kelly M. Cobourn and Valerie A. Thomas
Remote Sens. 2018, 10(1), 145; https://doi.org/10.3390/rs10010145 - 19 Jan 2018
Cited by 13 | Viewed by 5368
Abstract
Understanding irrigator responses to changes in water availability is critical for building strategies to support effective management of water resources. Using remote sensing data, we examine farmer responses to seasonal changes in water availability in Idaho’s Snake River Plain for the time series [...] Read more.
Understanding irrigator responses to changes in water availability is critical for building strategies to support effective management of water resources. Using remote sensing data, we examine farmer responses to seasonal changes in water availability in Idaho’s Snake River Plain for the time series 1984–2016. We apply a binary threshold based on the seasonal maximum of the Normalized Difference Moisture Index (NDMI) using Landsat 5–8 images to distinguish irrigated from non-irrigated lands. We find that the NDMI of irrigated lands increased over time, consistent with trends in irrigation technology adoption and increased crop productivity. By combining remote sensing data with geospatial data describing water rights for irrigation, we show that the trend in NDMI is not universal, but differs by farm size and water source. Farmers with small farms that rely on surface water are more likely than average to have a large contraction (over −25%) in irrigated area over the 33-year period of record. In contrast, those with large farms and access to groundwater are more likely than average to have a large expansion (over +25%) in irrigated area over the same period. Full article
(This article belongs to the Section Remote Sensing in Agriculture and Vegetation)
Show Figures

Graphical abstract

13 pages, 14597 KiB  
Communication
Mineral Mapping Using the Automatized Gaussian Model (AGM)—Application to Two Industrial French Sites at Gardanne and Thann
by Rodolphe Marion and Véronique Carrère
Remote Sens. 2018, 10(1), 146; https://doi.org/10.3390/rs10010146 - 19 Jan 2018
Cited by 10 | Viewed by 6302
Abstract
The identification and mapping of the mineral composition of by-products and residues on industrial sites is a topic of growing interest because it may provide information on plant-processing activities and their impact on the surrounding environment. Imaging spectroscopy can provide such information based [...] Read more.
The identification and mapping of the mineral composition of by-products and residues on industrial sites is a topic of growing interest because it may provide information on plant-processing activities and their impact on the surrounding environment. Imaging spectroscopy can provide such information based on the spectral signatures of soil mineral markers. In this study, we use the automatized Gaussian model (AGM), an automated, physically based method relying on spectral deconvolution. Originally developed for the short-wavelength infrared (SWIR) range, it has been extended to include information from the visible and near-infrared (VNIR) range to take iron oxides/hydroxides into account. We present the results of its application to two French industrial sites: (i) the Altéo Environnement site in Gardanne, southern France, dedicated to the extraction of alumina from bauxite; and (ii) the Millennium Inorganic Chemicals site in Thann, eastern France, which produces titanium dioxide from ilmenite and rutile, and its associated Séché Éco Services site used to neutralize the resulting effluents, producing gypsum. HySpex hyperspectral images were acquired over Gardanne in September 2013 and an APEX image was acquired over Thann in June 2013. In both cases, reflectance spectra were measured and samples were collected in the field and analyzed for mineralogical and chemical composition. When applying the AGM to the images, both in the VNIR and SWIR ranges, we successfully identified and mapped minerals of interest characteristic of each site: bauxite, Bauxaline® and alumina for Gardanne; and red and white gypsum and calcite for Thann. Identifications and maps were consistent with in situ measurements. Full article
(This article belongs to the Section Remote Sensing in Geology, Geomorphology and Hydrology)
Show Figures

Figure 1

25 pages, 3214 KiB  
Article
Hyperspectral Shallow-Water Remote Sensing with an Enhanced Benthic Classifier
by Rodrigo A. Garcia, Zhongping Lee and Eric J. Hochberg
Remote Sens. 2018, 10(1), 147; https://doi.org/10.3390/rs10010147 - 19 Jan 2018
Cited by 58 | Viewed by 7706
Abstract
Hyperspectral remote sensing inversion models utilize spectral information over optically shallow waters to retrieve optical properties of the water column, bottom depth and reflectance, with the latter used in benthic classification. Accuracy of these retrievals is dependent on the spectral endmember(s) used to [...] Read more.
Hyperspectral remote sensing inversion models utilize spectral information over optically shallow waters to retrieve optical properties of the water column, bottom depth and reflectance, with the latter used in benthic classification. Accuracy of these retrievals is dependent on the spectral endmember(s) used to model the bottom reflectance during the inversion. Without prior knowledge of these endmember(s) current approaches must iterate through a list of endmember—a computationally demanding task. To address this, a novel lookup table classification approach termed HOPE-LUT was developed for selecting the likely benthic endmembers of any hyperspectral image pixel. HOPE-LUT classifies a pixel as sand, mixture or non-sand, then the latter two are resolved into the three most likely classes. Optimization subsequently selects the class (out of the three) that generated the best fit to the remote sensing reflectance. For a coral reef case, modeling results indicate very high benthic classification accuracy (>90%) for depths less than 4 m of common coral reef benthos. These accuracies decrease substantially with increasing depth due to the loss of bottom information, especially the spectral signatures. We applied this technique to hyperspectral airborne imagery of Heron Reef, Great Barrier Reef and generated benthic habitat maps with higher classification accuracy compared to standard inversion models. Full article
(This article belongs to the Section Remote Sensing Image Processing)
Show Figures

Graphical abstract

26 pages, 11882 KiB  
Article
Comparison of the Spatial Characteristics of Four Remotely Sensed Leaf Area Index Products over China: Direct Validation and Relative Uncertainties
by Xinlu Li, Hui Lu, Le Yu and Kun Yang
Remote Sens. 2018, 10(1), 148; https://doi.org/10.3390/rs10010148 - 22 Jan 2018
Cited by 46 | Viewed by 8346
Abstract
Leaf area index (LAI) is a key input for many land surface models, ecological models, and yield prediction models. In order to make the model simulation and/or prediction more reliable and applicable, it is crucial to know the characteristics and uncertainties of remotely [...] Read more.
Leaf area index (LAI) is a key input for many land surface models, ecological models, and yield prediction models. In order to make the model simulation and/or prediction more reliable and applicable, it is crucial to know the characteristics and uncertainties of remotely sensed LAI products before they are input into models. In this study, we conducted a comparison of four global remotely sensed LAI products—Global Land Surface Satellite (GLASS), Global LAI Product of Beijing Normal University (GLOBALBNU), Global LAI Map of Chinese Academy of Sciences (GLOBMAP), and Moderate-resolution Imaging Spectrometer (MODIS) LAI, while the former three products are newly developed by three Chinese research groups on the basis of the MODIS land reflectance product over China between 2001 and 2011. Direct validation by comparing the four products to ground LAI observations both globally and over China demonstrates that GLASS LAI shows the best performance, with R2 = 0.70 and RMSE = 0.96 globally and R2 = 0.94 and RMSE = 0.61 over China; MODIS performs worst (R2 = 0.55, RMSE = 1.23 globally and R2 = 0.03, RMSE = 2.12 over China), and GLOBALBNU and GLOBMAP performs moderately. Comparison of the four products shows that they are generally consistent with each other, giving the smallest spatial correlation coefficient of 0.7 and the relative standard deviation around the order of 0.3. Compared with MODIS LAI, GLOBALBNU LAI is the most similar, followed by GLASS LAI and GLOBMAP. Large differences mainly occur in southern regions of China. LAI difference analysis indicates that evergreen needleleaf forest (ENF), woody savannas (SAV) biome types and temperate dry hot summer, temperate warm summer dry winter and temperate hot summer no dry season climate types correspond to high standard deviation, while ENF and grassland (GRA) biome types and temperate warm summer dry winter and cold dry winter warm summer climate types are responsible for the large relative standard deviation of the four products. Our results indicate that although the three newly developed products have improved the accuracy of LAI estimates, much work remains to improve the LAI products especially in ENF, SAV, and GRA regions and temperate climate zones. Findings from our study can provide guidance to communities regarding the performance of different LAI products over mainland China. Full article
(This article belongs to the Special Issue Earth Observations for Addressing Global Challenges)
Show Figures

Graphical abstract

20 pages, 3132 KiB  
Article
A Satellite-Based Model for Simulating Ecosystem Respiration in the Tibetan and Inner Mongolian Grasslands
by Rong Ge, Honglin He, Xiaoli Ren, Li Zhang, Pan Li, Na Zeng, Guirui Yu, Liyun Zhang, Shi-Yong Yu, Fawei Zhang, Hongqin Li, Peili Shi, Shiping Chen, Yanfen Wang, Xiaoping Xin, Yaoming Ma, Mingguo Ma, Yu Zhang and Mingyuan Du
Remote Sens. 2018, 10(1), 149; https://doi.org/10.3390/rs10010149 - 19 Jan 2018
Cited by 15 | Viewed by 6703
Abstract
It is important to accurately evaluate ecosystem respiration (RE) in the alpine grasslands of the Tibetan Plateau and the temperate grasslands of the Inner Mongolian Plateau, as it serves as a sensitivity indicator of regional and global carbon cycles. Here, we [...] Read more.
It is important to accurately evaluate ecosystem respiration (RE) in the alpine grasslands of the Tibetan Plateau and the temperate grasslands of the Inner Mongolian Plateau, as it serves as a sensitivity indicator of regional and global carbon cycles. Here, we combined flux measurements taken between 2003 and 2013 from 16 grassland sites across northern China and the corresponding MODIS land surface temperature (LST), enhanced vegetation index (EVI), and land surface water index (LSWI) to build a satellite-based model to estimate RE at a regional scale. First, the dependencies of both spatial and temporal variations of RE on these biotic and climatic factors were examined explicitly. We found that plant productivity and moisture, but not temperature, can best explain the spatial pattern of RE in northern China’s grasslands; while temperature plays a major role in regulating the temporal variability of RE in the alpine grasslands, and moisture is equally as important as temperature in the temperate grasslands. However, the moisture effect on RE and the explicit representation of spatial variation process are often lacking in most of the existing satellite-based RE models. On this basis, we developed a model by comprehensively considering moisture, temperature, and productivity effects on both temporal and spatial processes of RE, and then, we evaluated the model performance. Our results showed that the model well explained the observed RE in both the alpine (R2 = 0.79, RMSE = 0.77 g C m−2 day−1) and temperate grasslands (R2 = 0.75, RMSE = 0.60 g C m−2 day−1). The inclusion of the LSWI as the water-limiting factor substantially improved the model performance in arid and semi-arid ecosystems, and the spatialized basal respiration rate as an indicator for spatial variation largely determined the regional pattern of RE. Finally, the model accurately reproduced the seasonal and inter-annual variations and spatial variability of RE, and it avoided overestimating RE in water-limited regions compared to the popular process-based model. These findings provide a better understanding of the biotic and climatic controls over spatiotemporal patterns of RE for two typical grasslands and a new alternative up-scaling method for large-scale RE evaluation in grassland ecosystems. Full article
(This article belongs to the Section Biogeosciences Remote Sensing)
Show Figures

Figure 1

14 pages, 5499 KiB  
Article
L-Band Temporal Coherence Assessment and Modeling Using Amplitude and Snow Depth over Interior Alaska
by Yusuf Eshqi Molan, Jin-Woo Kim, Zhong Lu and Piyush Agram
Remote Sens. 2018, 10(1), 150; https://doi.org/10.3390/rs10010150 - 20 Jan 2018
Cited by 17 | Viewed by 6183
Abstract
Interferometric synthetic aperture radar (InSAR) provides the capability to detect surface deformation. Numerous processing approaches have been developed to improve InSAR results and overcome its limitations. Regardless of the processing methodology, however, temporal decorrelation is a major obstacle for all InSAR applications, especially [...] Read more.
Interferometric synthetic aperture radar (InSAR) provides the capability to detect surface deformation. Numerous processing approaches have been developed to improve InSAR results and overcome its limitations. Regardless of the processing methodology, however, temporal decorrelation is a major obstacle for all InSAR applications, especially over vegetated areas and dynamic environments, such as Interior Alaska. Temporal coherence is usually modeled as a univariate exponential function of temporal baseline. It has been, however, documented that temporal variations in surface backscattering due to the change in surface parameters, i.e., dielectric constant, roughness, and the geometry of scatterers, can result in gradual, seasonal, or sudden decorrelations and loss of InSAR coherence. The coherence models introduced so far have largely neglected the effect of the temporal change in backscattering on InSAR coherence. Here, we introduce a new temporal decorrelation model that considers changes in surface backscattering by utilizing the relative change in SAR intensity between two images as a proxy for the change in surface scattering parameters. The model also takes into account the decorrelation due to the change in snow depth between two images. Using the L-band Advanced Land Observation Satellite (ALOS-2) Phased Array type L-band Synthetic Aperture Radar (PALSAR-2) data, the model has been assessed over forested and shrub landscapes in Delta Junction, Interior Alaska. The model decreases the RMS error of temporal coherence estimation from 0.18 to 0.09 on average. The improvements made by the model have been statistically proved to be significant at the 99% confidence level. Additionally, the model shows that the coherence of forested areas are more prone to changes in backscattering than shrub landscape. The model is based on L-band data and may not be expanded to C-band or X-band InSAR observations. Full article
(This article belongs to the Special Issue Advances in SAR: Sensors, Methodologies, and Applications)
Show Figures

Graphical abstract

24 pages, 23379 KiB  
Article
New Insights for Detecting and Deriving Thermal Properties of Lava Flow Using Infrared Satellite during 2014–2015 Effusive Eruption at Holuhraun, Iceland
by Muhammad Aufaristama, Armann Hoskuldsson, Ingibjorg Jonsdottir, Magnus Orn Ulfarsson and Thorvaldur Thordarson
Remote Sens. 2018, 10(1), 151; https://doi.org/10.3390/rs10010151 - 20 Jan 2018
Cited by 22 | Viewed by 13267
Abstract
A new lava field was formed at Holuhraun in the Icelandic Highlands, north of Vatnajökull glacier, in 2014–2015. It was the largest effusive eruption in Iceland for 230 years, with an estimated lava bulk volume of ~1.44 km3 covering an area of [...] Read more.
A new lava field was formed at Holuhraun in the Icelandic Highlands, north of Vatnajökull glacier, in 2014–2015. It was the largest effusive eruption in Iceland for 230 years, with an estimated lava bulk volume of ~1.44 km3 covering an area of ~84 km2. Satellite-based remote sensing is commonly used as preliminary assessment of large scale eruptions since it is relatively efficient for collecting and processing the data. Landsat-8 infrared datasets were used in this study, and we used dual-band technique to determine the subpixel temperature (Th) of the lava. We developed a new spectral index called the thermal eruption index (TEI) based on the shortwave infrared (SWIR) and thermal infrared (TIR) bands allowing us to differentiate thermal domain within the lava flow field. Lava surface roughness effects are accounted by using the Hurst coefficient (H) for deriving the radiant flux ( Φ rad ) and the crust thickness (Δh). Here, we compare the results derived from satellite images with field measurements. The result from 2 December 2014 shows that a temperature estimate (1096 °C; occupying area of 3.05 m2) from a lava breakout has a close correspondence with a thermal camera measurement (1047 °C; occupying area of 4.52 m2). We also found that the crust thickness estimate in the lava channel during 6 September 2014 (~3.4–7.7 m) compares closely with the lava height measurement from the field (~2.6–6.6 m); meanwhile, the total radiant flux peak is underestimated (~8 GW) compared to other studies (~25 GW), although the trend shows good agreement with both field observation and other studies. This study provides new insights for monitoring future effusive eruption using infrared satellite images. Full article
(This article belongs to the Section Remote Sensing in Geology, Geomorphology and Hydrology)
Show Figures

Graphical abstract

24 pages, 9013 KiB  
Article
Onboard Spectral and Spatial Cloud Detection for Hyperspectral Remote Sensing Images
by Haoyang Li, Hong Zheng, Chuanzhao Han, Haibo Wang and Min Miao
Remote Sens. 2018, 10(1), 152; https://doi.org/10.3390/rs10010152 - 20 Jan 2018
Cited by 31 | Viewed by 8371
Abstract
The accurate onboard detection of clouds in hyperspectral images before lossless compression is beneficial. However, conventional onboard cloud detection methods are not applicable all the time, especially for shadowed clouds or darkened snow-covered surfaces that are not identified in normalized difference snow index [...] Read more.
The accurate onboard detection of clouds in hyperspectral images before lossless compression is beneficial. However, conventional onboard cloud detection methods are not applicable all the time, especially for shadowed clouds or darkened snow-covered surfaces that are not identified in normalized difference snow index (NDSI) tests. In this paper, we propose a new spectral-spatial classification strategy to enhance the performance of an orbiting cloud screen obtained on hyperspectral images by integrating a threshold exponential spectral angle map (TESAM), adaptive Markov random field (aMRF) and dynamic stochastic resonance (DSR). TESAM is applied to roughly classify cloud pixels based on spectral information. Then aMRF is used to do optimal process by using spatial information, which improved the classification performance significantly. Nevertheless, misclassifications occur due to noisy data in the onboard environments, and DSR is employed to eliminate noise data produced by aMRF in binary labeled images. We used level 0.5 data from Hyperion as a dataset, and the average tested accuracy of the proposed algorithm was 96.28% by test. This method can provide cloud mask for the on-going EO-1 and related satellites with the same spectral settings without manual intervention. Experiments indicate that the proposed method has better performance than the conventional onboard cloud detection methods or current state-of-the-art hyperspectral classification methods. Full article
(This article belongs to the Section Remote Sensing Image Processing)
Show Figures

Graphical abstract

28 pages, 5909 KiB  
Article
On Statistical Approaches to Generate Level 3 Products from Satellite Remote Sensing Retrievals
by Andrew Zammit-Mangion, Noel Cressie and Clint Shumack
Remote Sens. 2018, 10(1), 155; https://doi.org/10.3390/rs10010155 - 22 Jan 2018
Cited by 28 | Viewed by 6576
Abstract
Satellite remote sensing of trace gases such as carbon dioxide (CO2) has increased our ability to observe and understand Earth’s climate. However, these remote sensing data, specifically Level 2 retrievals, tend to be irregular in space and time, and hence, spatio-temporal [...] Read more.
Satellite remote sensing of trace gases such as carbon dioxide (CO2) has increased our ability to observe and understand Earth’s climate. However, these remote sensing data, specifically Level 2 retrievals, tend to be irregular in space and time, and hence, spatio-temporal prediction is required to infer values at any location and time point. Such inferences are not only required to answer important questions about our climate, but they are also needed for validating the satellite instrument, since Level 2 retrievals are generally not co-located with ground-based remote sensing instruments. Here, we discuss statistical approaches to construct Level 3 products from Level 2 retrievals, placing particular emphasis on the strengths and potential pitfalls when using statistical prediction in this context. Following this discussion, we use a spatio-temporal statistical modelling framework known as fixed rank kriging (FRK) to obtain global predictions and prediction standard errors of column-averaged carbon dioxide based on Version 7r and Version 8r retrievals from the Orbiting Carbon Observatory-2 (OCO-2) satellite. The FRK predictions allow us to validate statistically the Level 2 retrievals globally even though the data are at locations and at time points that do not coincide with validation data. Importantly, the validation takes into account the prediction uncertainty, which is dependent both on the temporally-varying density of observations around the ground-based measurement sites and on the spatio-temporal high-frequency components of the trace gas field that are not explicitly modelled. Here, for validation of remotely-sensed CO2 data, we use observations from the Total Carbon Column Observing Network. We demonstrate that the resulting FRK product based on Version 8r compares better with TCCON data than that based on Version 7r, in terms of both prediction accuracy and uncertainty quantification. Full article
(This article belongs to the Special Issue Remote Sensing of Greenhouse Gases)
Show Figures

Graphical abstract

Review

Jump to: Editorial, Research, Other

19 pages, 1943 KiB  
Review
A Review of Fine-Scale Land Use and Land Cover Classification in Open-Pit Mining Areas by Remote Sensing Techniques
by Weitao Chen, Xianju Li, Haixia He and Lizhe Wang
Remote Sens. 2018, 10(1), 15; https://doi.org/10.3390/rs10010015 - 22 Dec 2017
Cited by 119 | Viewed by 11847
Abstract
Over recent decades, fine-scale land use and land cover classification in open-pit mine areas (LCCMA) has become very important for understanding the influence of mining activities on the regional geo-environment, and for environmental impact assessment procedure. This research reviews advances in fine-scale LCCMA [...] Read more.
Over recent decades, fine-scale land use and land cover classification in open-pit mine areas (LCCMA) has become very important for understanding the influence of mining activities on the regional geo-environment, and for environmental impact assessment procedure. This research reviews advances in fine-scale LCCMA from the following aspects. Firstly, it analyzes and proposes classification thematic resolution for LCCMA. Secondly, remote sensing data sources, features, feature selection methods, and classification algorithms for LCCMA are summarized. Thirdly, three major factors that affect LCCMA are discussed: significant three-dimensional terrain features, strong LCCMA feature variability, and homogeneity of spectral-spatial features. Correspondingly, three key scientific issues that limit the accuracy of LCCMA are presented. Finally, several future research directions are discussed: (1) unitization of new sensors, particularly those with stereo survey ability; (2) procurement of sensitive features by new sensors and combinations of sensitive features using novel feature selection methods; (3) development of robust and self-adjusted classification algorithms, such as ensemble learning and deep learning for LCCMA; and (4) application of fine-scale mining information for regularity and management of mines. Full article
(This article belongs to the Special Issue GIS and Remote Sensing advances in Land Change Science)
Show Figures

Figure 1

26 pages, 3215 KiB  
Review
Evaluation of the PROSAIL Model Capabilities for Future Hyperspectral Model Environments: A Review Study
by Katja Berger, Clement Atzberger, Martin Danner, Guido D’Urso, Wolfram Mauser, Francesco Vuolo and Tobias Hank
Remote Sens. 2018, 10(1), 85; https://doi.org/10.3390/rs10010085 - 10 Jan 2018
Cited by 250 | Viewed by 18065
Abstract
Upcoming satellite hyperspectral sensors require powerful and robust methodologies for making optimum use of the rich spectral data. This paper reviews the widely applied coupled PROSPECT and SAIL radiative transfer models (PROSAIL), regarding their suitability for the retrieval of biophysical and biochemical variables [...] Read more.
Upcoming satellite hyperspectral sensors require powerful and robust methodologies for making optimum use of the rich spectral data. This paper reviews the widely applied coupled PROSPECT and SAIL radiative transfer models (PROSAIL), regarding their suitability for the retrieval of biophysical and biochemical variables in the context of agricultural crop monitoring. Evaluation was carried out using a systematic literature review of 281 scientific publications with regard to their (i) spectral exploitation, (ii) vegetation type analyzed, (iii) variables retrieved, and (iv) choice of retrieval methods. From the analysis, current trends were derived, and problems identified and discussed. Our analysis clearly shows that the PROSAIL model is well suited for the analysis of imaging spectrometer data from future satellite missions and that the model should be integrated in appropriate software tools that are being developed in this context for agricultural applications. The review supports the decision of potential users to employ PROSAIL for their specific data analysis and provides guidelines for choosing between the diverse retrieval techniques. Full article
(This article belongs to the Special Issue Recent Progress and Developments in Imaging Spectroscopy)
Show Figures

Graphical abstract

32 pages, 2433 KiB  
Review
Remote Sensing and Cropping Practices: A Review
by Agnès Bégué, Damien Arvor, Beatriz Bellon, Julie Betbeder, Diego De Abelleyra, Rodrigo P. D. Ferraz, Valentine Lebourgeois, Camille Lelong, Margareth Simões and Santiago R. Verón
Remote Sens. 2018, 10(1), 99; https://doi.org/10.3390/rs10010099 - 12 Jan 2018
Cited by 329 | Viewed by 33112
Abstract
For agronomic, environmental, and economic reasons, the need for spatialized information about agricultural practices is expected to rapidly increase. In this context, we reviewed the literature on remote sensing for mapping cropping practices. The reviewed studies were grouped into three categories of practices: [...] Read more.
For agronomic, environmental, and economic reasons, the need for spatialized information about agricultural practices is expected to rapidly increase. In this context, we reviewed the literature on remote sensing for mapping cropping practices. The reviewed studies were grouped into three categories of practices: crop succession (crop rotation and fallowing), cropping pattern (single tree crop planting pattern, sequential cropping, and intercropping/agroforestry), and cropping techniques (irrigation, soil tillage, harvest and post-harvest practices, crop varieties, and agro-ecological infrastructures). We observed that the majority of the studies were exploratory investigations, tested on a local scale with a high dependence on ground data, and used only one type of remote sensing sensor. Furthermore, to be correctly implemented, most of the methods relied heavily on local knowledge on the management practices, the environment, and the biological material. These limitations point to future research directions, such as the use of land stratification, multi-sensor data combination, and expert knowledge-driven methods. Finally, the new spatial technologies, and particularly the Sentinel constellation, are expected to improve the monitoring of cropping practices in the challenging context of food security and better management of agro-environmental issues. Full article
(This article belongs to the Section Remote Sensing in Agriculture and Vegetation)
Show Figures

Graphical abstract

Other

12 pages, 1770 KiB  
Letter
Extreme Wave Height Events in NW Spain: A Combined Multi-Sensor and Model Approach
by Pablo Lorente, Marcos G. Sotillo, Lotfi Aouf, Arancha Amo-Baladrón, Ernesto Barrera, Alice Dalphinet, Cristina Toledano, Romain Rainaud, Marta De Alfonso, Silvia Piedracoba, Ana Basañez, Jose Maria García-Valdecasas, Vicente Pérez-Muñuzuri and Enrique Álvarez-Fanjul
Remote Sens. 2018, 10(1), 1; https://doi.org/10.3390/rs10010001 - 21 Dec 2017
Cited by 106 | Viewed by 5538
Abstract
The Galician coast (NW Spain) is a region that is strongly influenced by the presence of low pressure systems in the mid-Atlantic Ocean and the periodic passage of storms that give rise to severe sea states. Since its wave climate is one of [...] Read more.
The Galician coast (NW Spain) is a region that is strongly influenced by the presence of low pressure systems in the mid-Atlantic Ocean and the periodic passage of storms that give rise to severe sea states. Since its wave climate is one of the most energetic in Europe, the objectives of this paper were twofold. The first objective was to characterize the most extreme wave height events in Galicia over the wintertime of a two-year period (2015–2016) by using reliable high-frequency radar wave parameters in concert with predictions from a regional wave (WAV) forecasting system running operationally in the Iberia-Biscay-Ireland (IBI) area, denominatedIBI-WAV. The second objective was to showcase the application of satellite wave altimetry (in particular, remote-sensed three-hourly wave height estimations) for the daily skill assessment of the IBI-WAV model product. Special attention was focused on monitoring Ophelia—one of the major hurricanes on record in the easternmost Atlantic—during its 3-day track over Ireland and the UK (15–17 October 2017). Overall, the results reveal the significant accuracy of IBI-WAV forecasts and prove that a combined observational and modeling approach can provide a comprehensive characterization of severe wave conditions in coastal areas and shows the benefits from the complementary nature of both systems. Full article
(This article belongs to the Special Issue Radar Remote Sensing of Oceans and Coastal Areas)
Show Figures

Graphical abstract

12 pages, 3284 KiB  
Technical Note
Remote Sensing Image Classification Based on Stacked Denoising Autoencoder
by Peng Liang, Wenzhong Shi and Xiaokang Zhang
Remote Sens. 2018, 10(1), 16; https://doi.org/10.3390/rs10010016 - 22 Dec 2017
Cited by 81 | Viewed by 8736
Abstract
Focused on the issue that conventional remote sensing image classification methods have run into the bottlenecks in accuracy, a new remote sensing image classification method inspired by deep learning is proposed, which is based on Stacked Denoising Autoencoder. First, the deep network model [...] Read more.
Focused on the issue that conventional remote sensing image classification methods have run into the bottlenecks in accuracy, a new remote sensing image classification method inspired by deep learning is proposed, which is based on Stacked Denoising Autoencoder. First, the deep network model is built through the stacked layers of Denoising Autoencoder. Then, with noised input, the unsupervised Greedy layer-wise training algorithm is used to train each layer in turn for more robust expressing, characteristics are obtained in supervised learning by Back Propagation (BP) neural network, and the whole network is optimized by error back propagation. Finally, Gaofen-1 satellite (GF-1) remote sensing data are used for evaluation, and the total accuracy and kappa accuracy reach 95.7% and 0.955, respectively, which are higher than that of the Support Vector Machine and Back Propagation neural network. The experiment results show that the proposed method can effectively improve the accuracy of remote sensing image classification. Full article
Show Figures

Graphical abstract

2 pages, 150 KiB  
Addendum
Addendum: Using Satellite Data for the Characterization of Local Animal Reservoir Populations of Hantaan Virus on the Weihe Plain, China. Remote Sens. 2017, 9, 1076
by Pengbo Yu, Yidan Li, Bo Xu, Jing Wei, Shen Li, Jianhua Dong, Jianhui Qu, Jing Xu, Zheng Y.X. Huang, Chaofeng Ma, Jing Yang, Guogang Zhang, Bin Chen, Shanqian Huang, Chunming Shi, Hongwei Gao, Feng Liu, Huaiyu Tian, Nils Chr. Stenseth, Bing Xu and Jingjun Wangadd Show full author list remove Hide full author list
Remote Sens. 2018, 10(1), 20; https://doi.org/10.3390/rs10010020 - 23 Dec 2017
Cited by 7 | Viewed by 2958
Abstract
After publication of the research paper[...] Full article
10 pages, 2334 KiB  
Letter
Ocean Dynamics Observed by VIIRS Day/Night Band Satellite Observations
by Wei Shi and Menghua Wang
Remote Sens. 2018, 10(1), 76; https://doi.org/10.3390/rs10010076 - 8 Jan 2018
Cited by 12 | Viewed by 5577
Abstract
Three cases of Day/Night Band (DNB) observations of the Visible Infrared Imaging Radiometer Suite (VIIRS) onboard the Suomi National Polar-orbiting Partnership (SNPP) are explored for applications to assess the ocean environment and monitor ocean dynamics. An approach to use the ratio between the [...] Read more.
Three cases of Day/Night Band (DNB) observations of the Visible Infrared Imaging Radiometer Suite (VIIRS) onboard the Suomi National Polar-orbiting Partnership (SNPP) are explored for applications to assess the ocean environment and monitor ocean dynamics. An approach to use the ratio between the target radiance and the reference radiance was developed in order to better assess the ocean diurnal and short-term environmental changes with VIIRS DNB observations. In the La Plata River Estuary, the sediment fronts showed 20–25 km diurnal inshore-offshore movements on 13 March 2017. In the waters off the coast of Argentina in the South Atlantic, VIIRS DNB measurements provided both daytime and nighttime observations and monitoring of the algal bloom development and migration between 24 and 26 March 2016. This algal bloom generally kept the same spatial patterns, but moved nearly 20 km eastward in the three-day period. In the Yangtze River Estuary and Hangzhou Bay region along China’s east coast, VIIRS DNB observations also revealed complicated coastal dynamic changes between 12 and 14 April 2017. Even though there are still some challenges and limitations for monitoring the ocean environment with VIIRS DNB observations, this study shows that satellite DNB observations can provide additional data sources for ocean observations, especially observations during the nighttime. Full article
(This article belongs to the Section Ocean Remote Sensing)
Show Figures

Graphical abstract

10 pages, 33562 KiB  
Technical Note
Tracking of a Fluorescent Dye in a Freshwater Lake with an Unmanned Surface Vehicle and an Unmanned Aircraft System
by Craig Powers, Regina Hanlon and David G. Schmale III
Remote Sens. 2018, 10(1), 81; https://doi.org/10.3390/rs10010081 - 9 Jan 2018
Cited by 40 | Viewed by 9419
Abstract
Recent catastrophic events in our oceans, including the spill of toxic oil from the explosion of the Deepwater Horizon drilling rig and the rapid dispersion of radioactive particulates from the meltdown of the Fukushima Daiichi nuclear plant, underscore the need for new tools [...] Read more.
Recent catastrophic events in our oceans, including the spill of toxic oil from the explosion of the Deepwater Horizon drilling rig and the rapid dispersion of radioactive particulates from the meltdown of the Fukushima Daiichi nuclear plant, underscore the need for new tools and technologies to rapidly respond to hazardous agents. Our understanding of the movement and aerosolization of hazardous agents from natural aquatic systems can be expanded upon and used in prevention and tracking. New technologies with coordinated unmanned robotic systems could lead to faster identification and mitigation of hazardous agents in lakes, rivers, and oceans. In this study, we released a fluorescent dye (fluorescein) into a freshwater lake from an anchored floating platform. A fluorometer (fluorescence sensor) was mounted underneath an unmanned surface vehicle (USV, unmanned boat) and was used to detect and track the released dye in situ in real-time. An unmanned aircraft system (UAS) was used to visualize the dye and direct the USV to sample different areas of the dye plume. Image processing tools were used to map concentration profiles of the dye plume from aerial images acquired from the UAS, and these were associated with concentration measurements collected from the sensors onboard the USV. The results of this project have the potential to transform monitoring strategies for hazardous agents, enabling timely and accurate exposure assessment and response in affected areas. Fast response is essential in reacting to the introduction of hazardous agents, in order to quickly predict and contain their spread. Full article
(This article belongs to the Special Issue Remote Sensing from Unmanned Aerial Vehicles (UAVs))
Show Figures

Graphical abstract

1 pages, 141 KiB  
Correction
Correction: Garthwaite, M.C. on the Design of Radar Corner Reflectors for Deformation Monitoring in Multi-Frequency InSAR. Remote Sens. 2017, 9, 648
by Matthew C. Garthwaite
Remote Sens. 2018, 10(1), 86; https://doi.org/10.3390/rs10010086 - 10 Jan 2018
Cited by 1 | Viewed by 3755
Abstract
After publication of the research paper [1], the author wishes to make the following correction to the paper.[...] Full article
(This article belongs to the Special Issue Advances in SAR: Sensors, Methodologies, and Applications)
13 pages, 5497 KiB  
Technical Note
Knowledge-Based Generalized Side-Lobe Canceller for Ionospheric Clutter Suppression in HFSWR
by Xin Zhang, Di Yao, Qiang Yang, Yingning Dong and Weibo Deng
Remote Sens. 2018, 10(1), 104; https://doi.org/10.3390/rs10010104 - 13 Jan 2018
Cited by 15 | Viewed by 4877
Abstract
High frequency surface wave radar (HFSWR) has been successfully developed for early warning and remote sensing. However, the ionospheric clutter is a difficult challenge that can make HFSWR system inefficient. The Generalized Side-lobe Canceller (GSC) has been proved to be an effective algorithm [...] Read more.
High frequency surface wave radar (HFSWR) has been successfully developed for early warning and remote sensing. However, the ionospheric clutter is a difficult challenge that can make HFSWR system inefficient. The Generalized Side-lobe Canceller (GSC) has been proved to be an effective algorithm for clutter suppression in theory, but it suffers from the performance degradation for some non-ideal conditions in practice. The most intolerable shortcoming is the signal to noise ratio (SNR) loss caused by the residual signal in the secondary data. In this paper, a knowledge-based GSC (KB-GSC) method has been proposed via an adaptive single notch filter design to reject the residual signal for reducing the SNR loss. The feasibility and availability has been demonstrated by measured data. Full article
(This article belongs to the Special Issue Instruments and Methods for Ocean Observation and Monitoring)
Show Figures

Graphical abstract

1 pages, 171 KiB  
Addendum
Addendum: Arvor, D. et al. Monitoring Rainfall Patterns in the Southern Amazon with PERSIANN-CDR Data: Long-Term Characteristics and Trends. Remote Sens. 2017, 9, 889
by Damien Arvor, Beatriz M. Funatsu, Véronique Michot and Vincent Dubreuil
Remote Sens. 2018, 10(1), 128; https://doi.org/10.3390/rs10010128 - 18 Jan 2018
Viewed by 3199
Abstract
After publication of the paper [1] it was found that the Acknowledgments section did not mention the institutions that supported this research [...]
Full article
10 pages, 1301 KiB  
Letter
Image Degradation for Quality Assessment of Pan-Sharpening Methods
by Wen Dou
Remote Sens. 2018, 10(1), 154; https://doi.org/10.3390/rs10010154 - 22 Jan 2018
Cited by 19 | Viewed by 6227
Abstract
Wald’s protocol is the most widely accepted protocol to assess pan-sharpening algorithms. In particular, the synthesis property—which is usually validated on a reduced scale—is thought to be a necessary and sufficient condition of a success image fusion. Usually, the synthesis property is evaluated [...] Read more.
Wald’s protocol is the most widely accepted protocol to assess pan-sharpening algorithms. In particular, the synthesis property—which is usually validated on a reduced scale—is thought to be a necessary and sufficient condition of a success image fusion. Usually, the synthesis property is evaluated at a reduced resolution scale to take the original multispectral (MS) image as reference; thus, the image degradation method that is employed to produce reduced resolution images is crucial. In the past decade, the standard method has been to decimate the low-pass-filtered image where the filter is designed to match the modulation transfer function (MTF) of the sensor. The paper pointed out the deficiency of the method, and proposed a new image degradation method, referred to as method of spatial degradation for fusion validation (MSD4FV), which takes MTF compensation into account based on a simplified MTF model. The simulation results supported the implicit assumption of Wald’s protocol that image fusion performance is invariant among scales if the images have been properly degraded. Full article
(This article belongs to the Section Remote Sensing Image Processing)
Show Figures

Graphical abstract

Previous Issue
Next Issue
Back to TopTop