1. Introduction
The spread of hazardous agents such as radioactive particulates, oil, and harmful algal blooms have important economical [
1], ecological [
2], and national security [
3] consequences. There are numerous mathematical models and methods for understanding and predicting how these agents are transported and dispersed, from ground water contamination to volcanic eruptions [
4,
5]. Many of these methods are computationally costly or may not be adaptive for highly variable environments that exist in real world scenarios. Additionally, these computational approaches may not be applicable for first responder scenarios for remote locations, where there is limited information available to populate necessary model parameters. In many cases, diffusion and advection dominance is highly variable and competition between the two transport mechanisms can be complex. This occurs especially at the marine atmospheric boundary layer (MABL), where both aquatic and wind currents interact, further complicating modeling techniques. In these situations, when a fast solution is required and the exact solution may not be important, a simpler approach is needed. Heuristic methods represent such an approach [
6].
Oil is one hazardous agent that can have immediate and lasting impacts in marine environments for a considerable time after initial release, and in the case of salt marshes and mangrove swamps, effects can persist for decades [
7]. Oil leakage from offshore oil and natural gas exploration can be affected by factors at the ocean bottom not encountered at the sea surface, complicating detection and tracking [
8]. Spills from large oil tankers, though dangerous occurrences, account for only 5% of worldwide oil pollution, with 95% accounted for by illegal discharges [
9]. Other hazardous agents include harmful algal blooms (HABs), microscopic algae or phytoplankton that can be beneficial in nature, but also can be harmful to marine resources and human health [
10]. In some cases, surface roughness at the marine atmospheric boundary layer can make satellite measurements prone to errors [
11]. Versatile and adaptable tracking methods are needed.
A number of tracer dyes have been used to understand the transport of hazardous agents in aquatic environments. These dyes are often fluorophores, like rhodamine and fluorescein [
12,
13,
14], and sensors known as fluorometers have been developed to detect these dyes following their release [
15,
16]. These sensors have been used to test simulated fluorophore plume identification and verification algorithms in near-shore oceanic environments [
17]. In addition to specially developed sensors, effective lower cost methods have been used. Cameras have been used to measure the motion of fluorescent particles in surface flow studies [
18]. Fluorescent dyes have been used in underwater studies to test the effectiveness of hydrocarbon detection [
12]. Direct measurements of fluorescent organisms is another method of plume detection and tracking. Algae can absorb certain wavelengths of light and remit this gained energy at another wavelength [
19] similar to fluorophores. Consequently, fluorometers have been developed to detect algae in situ [
20]. Fluorophores for aquatic studies are often used that absorb and emit light in wavelengths that naturally pass through water unaffected over the scale lengths from the sensor emitter to sensor receiver.
Unmanned systems have become important tools to increase our understanding of vital environmental processes. Recent advances in unmanned systems have created new possibilities for environmental sensing [
21]. Low cost unmanned surface vehicles (USVs) have been developed allowing water quality testing by citizen science programs that would not be possible otherwise due to budgetary constraints [
22]. Theses systems are effective outreach tools promoting environmental science to the general public [
23]. Likewise, low-cost recreational unmanned aircraft systems (UASs) with gimbal mounted cameras have served as platforms for surface flow measurement mapping using natural and artificial tracers and large-scale surface velocity fields [
24,
25]. UASs have applications in hydrological studies to measure lake and river water levels to increase our understanding of hydrologic processes and reliability of hydrologic predictions [
26,
27].
There are significant knowledge gaps in the transport of hazardous agents in aquatic systems, and unmanned systems help fill this gap by incorporating measurements of fluorescence to mimic hazardous agent dispersal. The specific objectives of this work were to detect and track a released dye in a freshwater lake with a UAS and a USV, and (2) compare in situ measurements of the dye from the USV to estimated concentrations of dye from UAS images. Here, we describe a series of field studies where a fluorescent dye (fluorescein) was released into a lake from an anchored floating platform. A fluorometer (fluorescence sensor) was mounted underneath a USV, and was used to detect the released dye in situ. A UAS was used to visualize the dye and direct the USV to sample different areas of the plume. Existing image processing tools were used to map concentration profiles of the dye plume from stationary aerial images acquired from the UAS, and these were compared to concentration measurements collected from the sensors onboard the USV. The results of this project have the potential to transform monitoring strategies for hazardous agents, enabling timely cost effective, and accurate exposure assessment and response initiatives in affected areas. Fast response and versatile methods are essential in reacting to the introduction of hazardous agents, in order to quickly predict their spread and contain the event [
28].
2. Materials and Methods
2.1. Study Site and Design
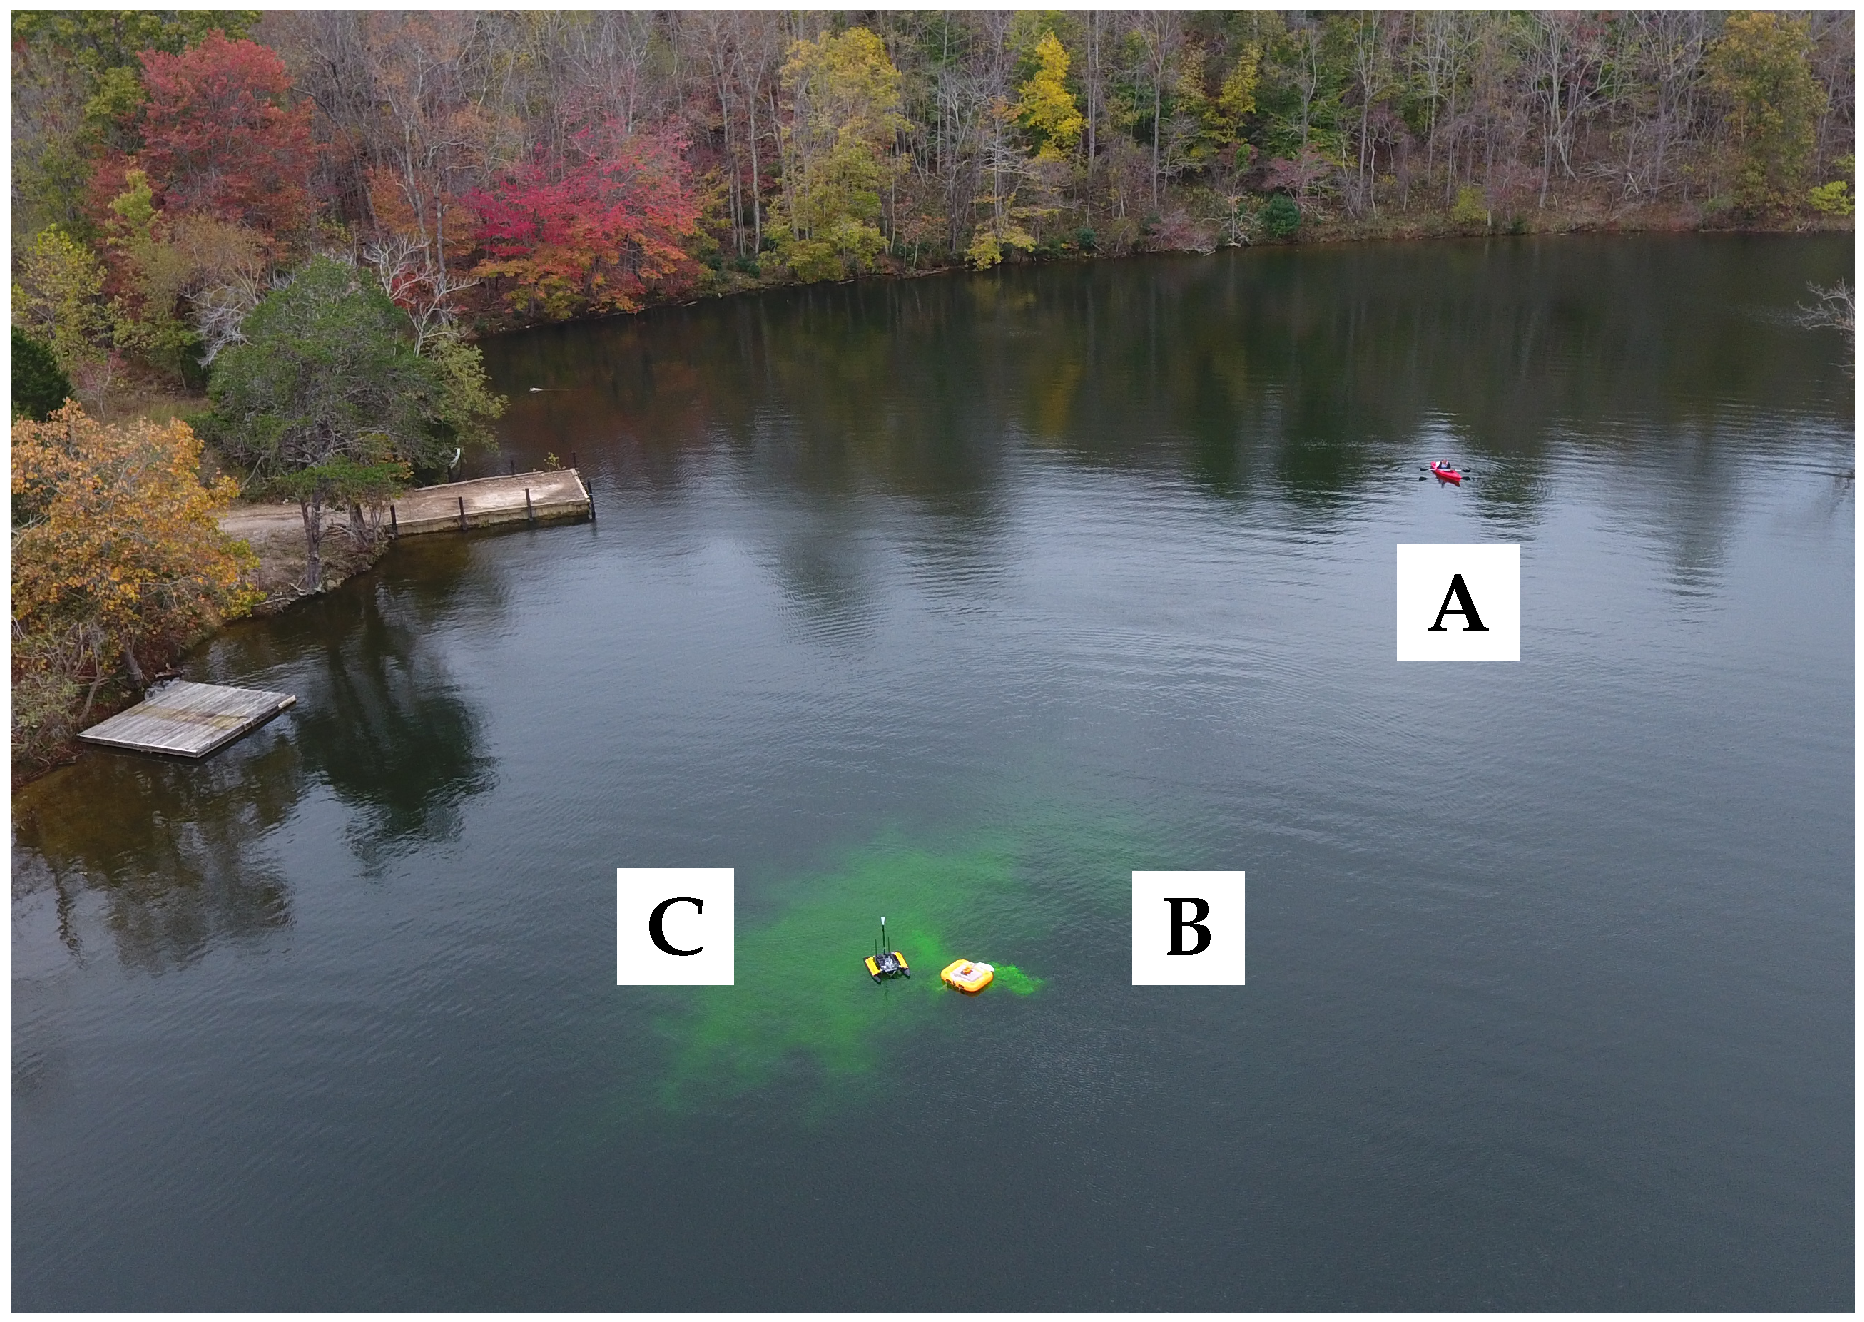
Field studies were conducted on 25 October 2017 in a cove located at 37.053846, −80.640771 on Claytor Lake VA, USA (
Figure 1). Claytor Lake is a 34 km long man-made reservoir with an approximate surface area of 18.2 square kilometers. Since the study was conducted in a small cove off the main body of the lake, this provided a natural isolated area to contain the dye and minimize interference from the general public. Though no permits were required to release the dye into Claytor Lake, local officials from Appalachian Power, Claytor Lake State Park, the Virginia Department of Game and Inland Fisheries, and the Friends of Claytor Lake were informed of our planned activities in advance of the dye release.
Field studies were performed from 1400 to 1500 EST. Twelve transects were performed by the USV across the dye plume. Two UAS missions were conducted (the flight time of the UAS was limited to about 20 min for each mission). GPS of the UAS, USV, and the plume generator were recorded throughout the study. Meteorological data and fluorescein data were recorded at 1 Hz by the USV.
2.2. Unmanned Surface Vehicle
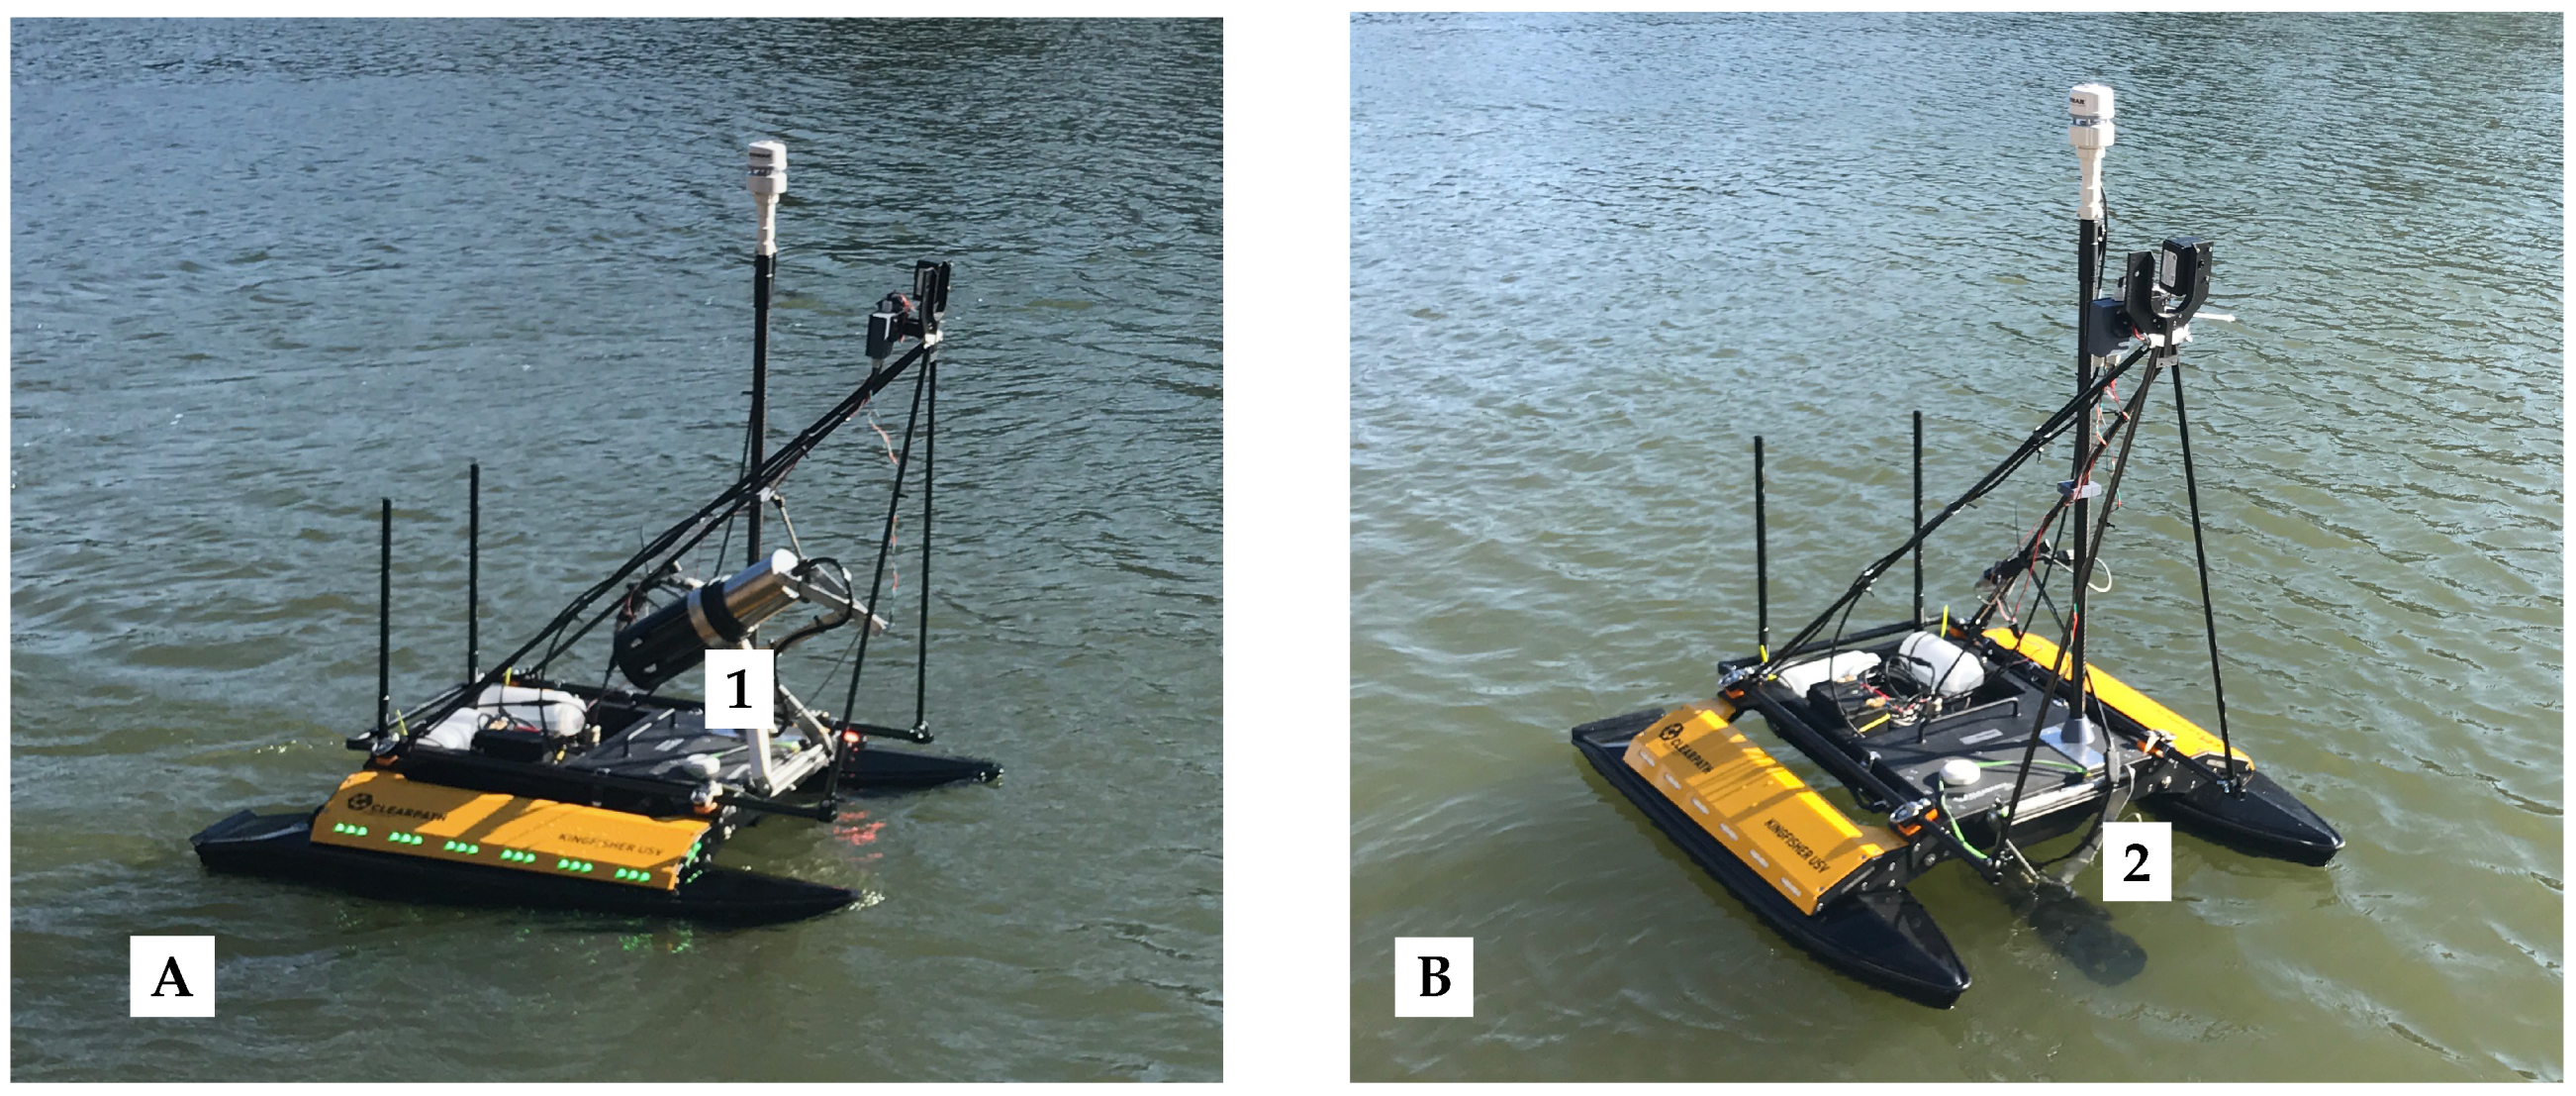
A Clearpath Robotics Kingfisher M200 USV (Clearpath Robotics, Kitchener, ON, Canada) was used to detect and track the dye (
Figure 2). The Kingfisher USV weighed 28 kg, was 1.35 m × 0.98 m × 0.32 m (L × W × H), had a maximum payload of 10 kg, and was operated by remote control. The onboard computer as provided by the manufacturer was a Commell LE-376 (Commell IPC Division, Xizhi District, New Taipei City, Taiwan). The USV was powered by a removable 29 Ah battery with about three hours of continuous runtime at normal operation speeds. The propulsion system consisted of twin electric impeller thrusters, allowing a maximum speed of 1.7 m/s and steering with differential thrust. This configuration allowed for extremely precise, controlled movements and shallow operations with minimal disturbance to the plume of the released dye. The live video feed from the UAS was used to guide the USV along the plume transects.
2.3. Unmanned Aircraft System
A DJI Phantom 4 (DJI, Shenzhen, China) UAS was used to capture 4K video and images of the dye plume and to provide visual navigation of the plume for the pilot of the USV. The Phantom 4 UAS weighed 1.38 kg, and was equipped with a gimbaled high definition camera. The camera was a 1/2.3" CMOS with a lens having 94° field of view, 20 mm f/2.8 focus at ∞. The UAS was launched and recovered from a manned pontoon boat anchored about 100 m from the center of the dye release. The pilot-in-command (PIC, Schmale) was an FAA-certified remote pilot, Certificate Number 4038906. Raw data (e.g., GPS, timestamp, gimbal setting, etc.) associated with the images captured with the UAS are provided as a supplemental spreadsheet file to this manuscript.
2.4. Sensor Integration
A Turner Designs C6 multi-sensor platform (Turner Designs, San Jose, CA, USA) was used for fluorescein concentration measurements. The C6 sensor array accepts up to six individual fluorescence and turbidity sensors. The sensor weighed 2.74 kg and was 33.8 cm × 10.2 cm (L × D). The C6 can be operated at depths down to 600 m and from −2 to 50 °C (as per the manufacturer specifications). In our studies, the C6 was used to measure depth (pressure), water temperature, turbidity (Model #2100-000-T), and fluorescein (Model #2100-000-F). A mounting system was developed for the C6 sensor to allow the sensor to operate 16cm below the water surface when deployed (
Figure 2). The sensor was located in the middle and slightly aft of the pontoon mid-point. The mounting system allowed for the sensor to be folded up and out of the water for transport and launching (
Figure 2). The C6 unit was used to calibrate the turbidity sensor in a 2 L solution of 50 NTU Turbidity Standard (StablCal #26606-49, Cole Parmer, Vernon Hills, IL 60061, USA) The fluorescein sensor was calibrated with the C6 unit in 2 L of a 40 PPB solution (Fluorescein 400 PPB #10-509, Turner Designs, San Jose, CA 95112, USA). Calibrations were carried out in the lab by submerging the entire C6 unit and casing into a container wrapped in a black velvet cloth to eliminate light during calibration. The installed sensors for Turbidity and Fluorescein were calibrated with with the C6 sensor suite on 24 October 2017. The Turbidity sensor had a blank background RFU value of 17.64 in distilled water, and a working RFU value of 1279.60 in a standard solution of 50 NTU. The Standard RFU for this experimental data was set to 1280.80 with background Blank RFU values for the calibration at 288.00, 41.20 and 17.36 for the predetermined gain values of ×1, ×10, ×100, respectively. The Fluorescein sensor had a working RFU value of 3833.60 in a standard solution of 40 ppb. The Standard RFU for this experimental data was set to 3834.00 with background Blank RFU values for the calibration at 284.00, 33.20, and 8.64 for the predetermined gain values of ×1, ×10, ×100, respectively. An Airmar 200WX meteorological sensor (Airmar Technology Corporation, Milford, NH, USA) was used for environmental measurements such as wind speed, wind direction, air temperature and atmospheric pressure (
Figure 2). Both sensors were connected to the onboard USV computer for data collection and recording.
2.5. Plume Generation
A fluorescein puck (Bright Dyes yellow/green cake cat #102001, Kingscote Chemicals, Mi- amisburg, OH 45342, USA) weighing 56.14 g was used to generate the dye plume. The fluorescein puck was suspended underwater from an Intex cooler float (Intex Recreation Corp., Long Beach, CA, USA) in a mesh bag at a depth of 67 cm. The float was anchored in place (37.0535180, −80.6427000) with a 4.5 kg Greenfield Products anchor. The 30 cm anchor rested on the bottom of the lake and was attached to 10 m of 5/8 cm utility line. The puck was allowed to disperse fluorescein by diffusion only (i.e., the dye was not forcibly released, and there were no currents in the lake). The movement of the float by wind interaction aided in dispersion of the tracer dye. Tracking of this motion was not recorded.
2.6. Image Processing
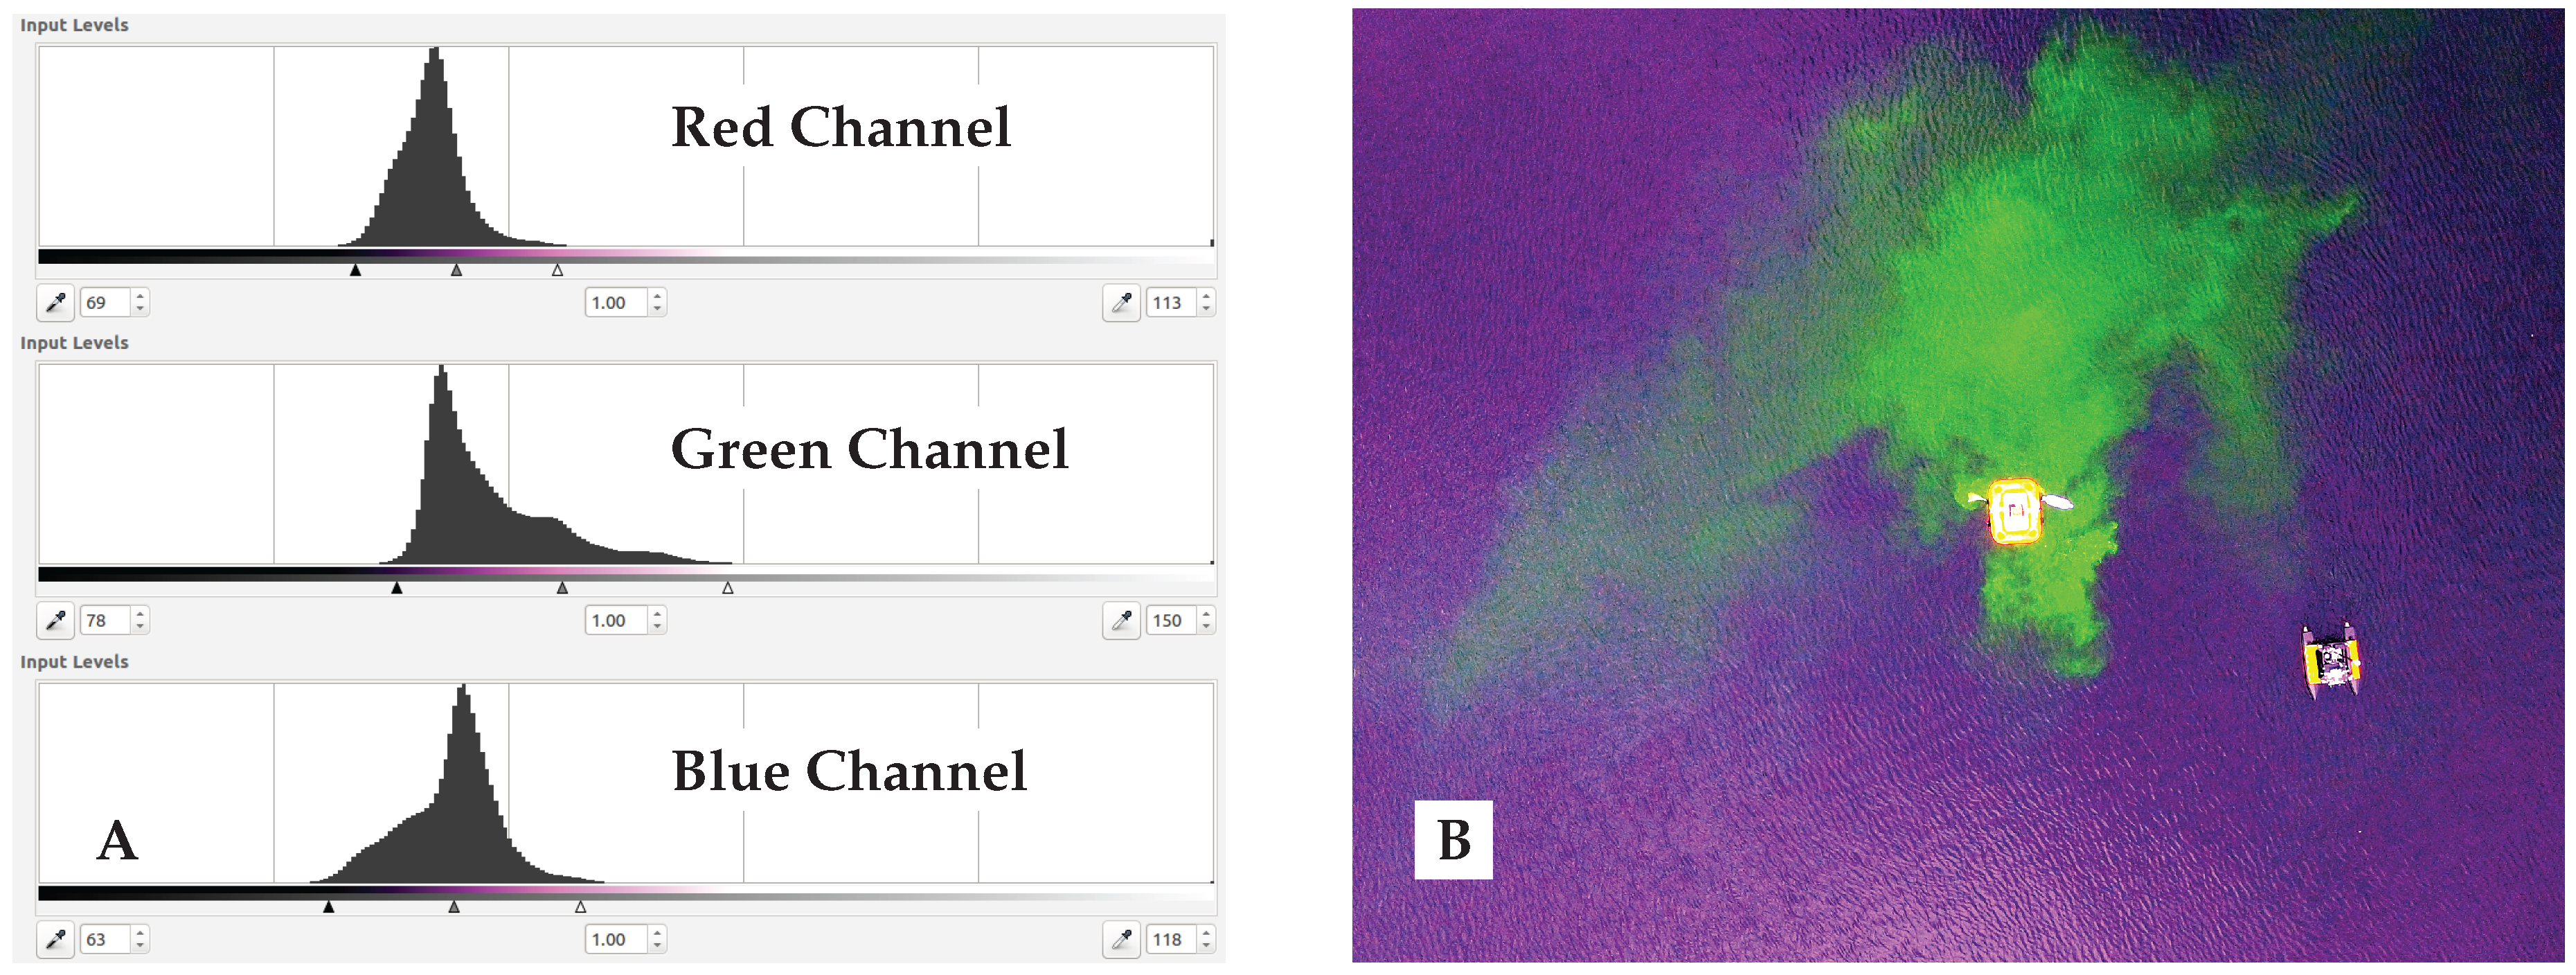
Image processing was completed using ImageMagick version 6.8.9-9 and Gimp version 2.8.16 software. Images were used over video for ease of analysis, in particular for lower computational cost needed for future live UAS image processing. Images were 2400 × 1800 (W × H) in size. Images were captured from 25 m at approximately one image for every 3 s. Pixel sizes were 1.5 cm in length. Enhanced color reference images were created using Gimp by adjusting the red, green and blue (RGB) levels to the values in (
Figure 3), in order to increase the dye plume contrast (shown in
Figure 3) to aid in visual identification of plume concentration structures.
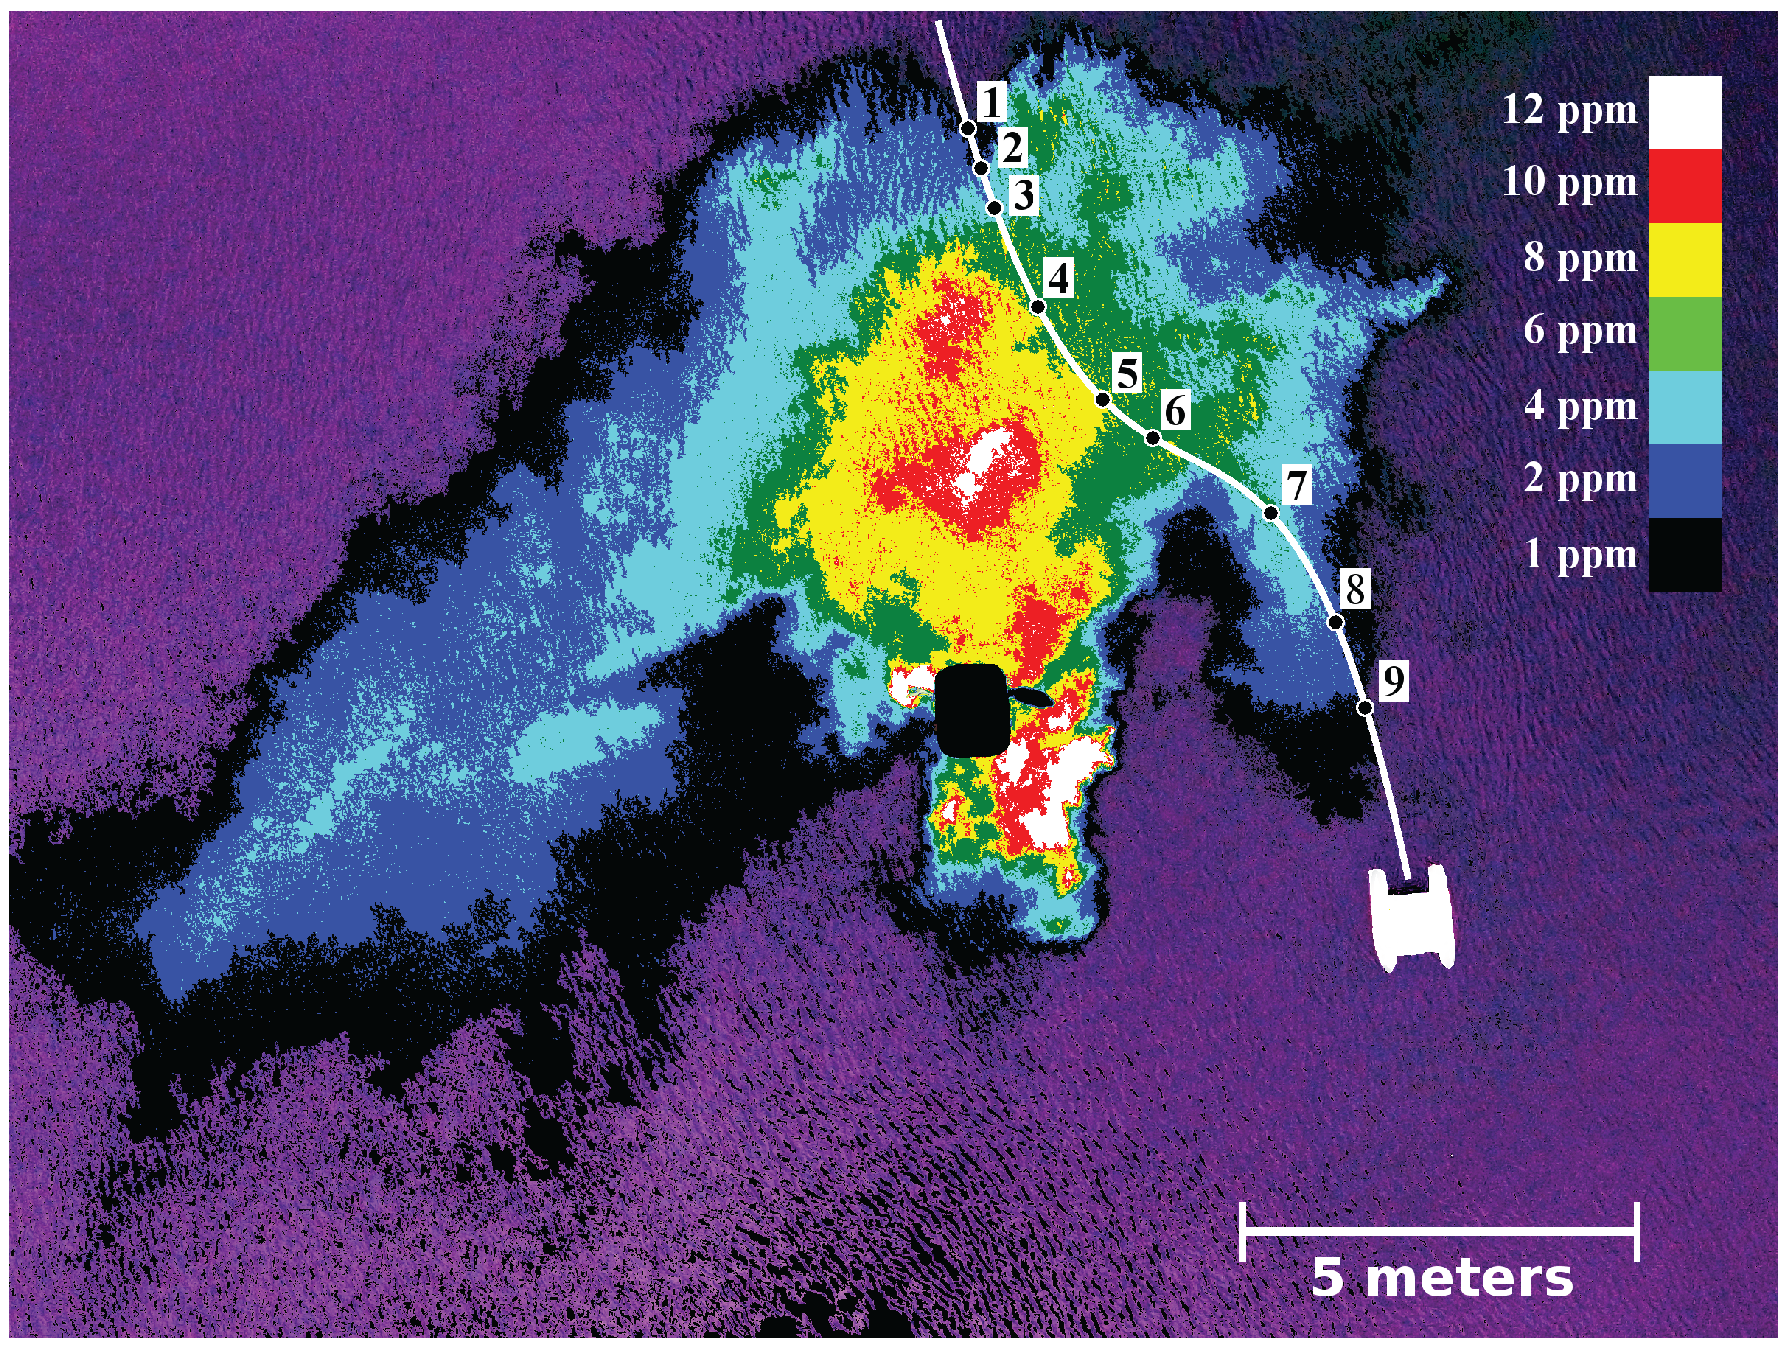
The convert function from ImageMagick (command line operation), was used on the raw images to create color maps known as heatmaps by assigning a chosen color (heat) to represent a change in concentration. Heatmaps were generated by converting image pixels matching (by percentage of maximum possible color intensity) the fluorescein dye color represented by the RGB value (100,200,60) to the chosen heatmap colors. Percentages ranged from 13% to 23% in 2% increments, representing red, yellow, green, cyan, blue and black respectively, and were assigned decreasing parts per million (PPM) values based on minimum and maximum concentrations from the USV fluorescein sensor. The color white represented 12 ppm where percentage of maximum possible intensity was from 0% to 12.9% and was matched to the maximum concentration recorded by the USV fluorescein sensor. A scale of 2 ppm per increase in heatmap concentration was used with the exception of 1 ppm. Exchangeable image file format (EXIF) data from UAS imagery was used to rename the images by timestamp and to connect with USV data.
3. Results and Discussion
A series of field studies were conducted to track a fluorescent dye released into a lake from an anchored floating platform. A UAS was used to visualize the dye and direct the USV to sample different areas of the plume. Image processing tools were used to map concentration profiles of the dye plume from aerial images acquired from the UAS, and these were compared to concentration measurements collected from the sensors onboard the USV. In situ fluorescein concentration profiles measured with the USV were similar to the intensity of the plume as seen by raw images from the UAS (
Figure 4). Color enhanced images revealed subtle differences in concentrations not seen in the raw images (such as
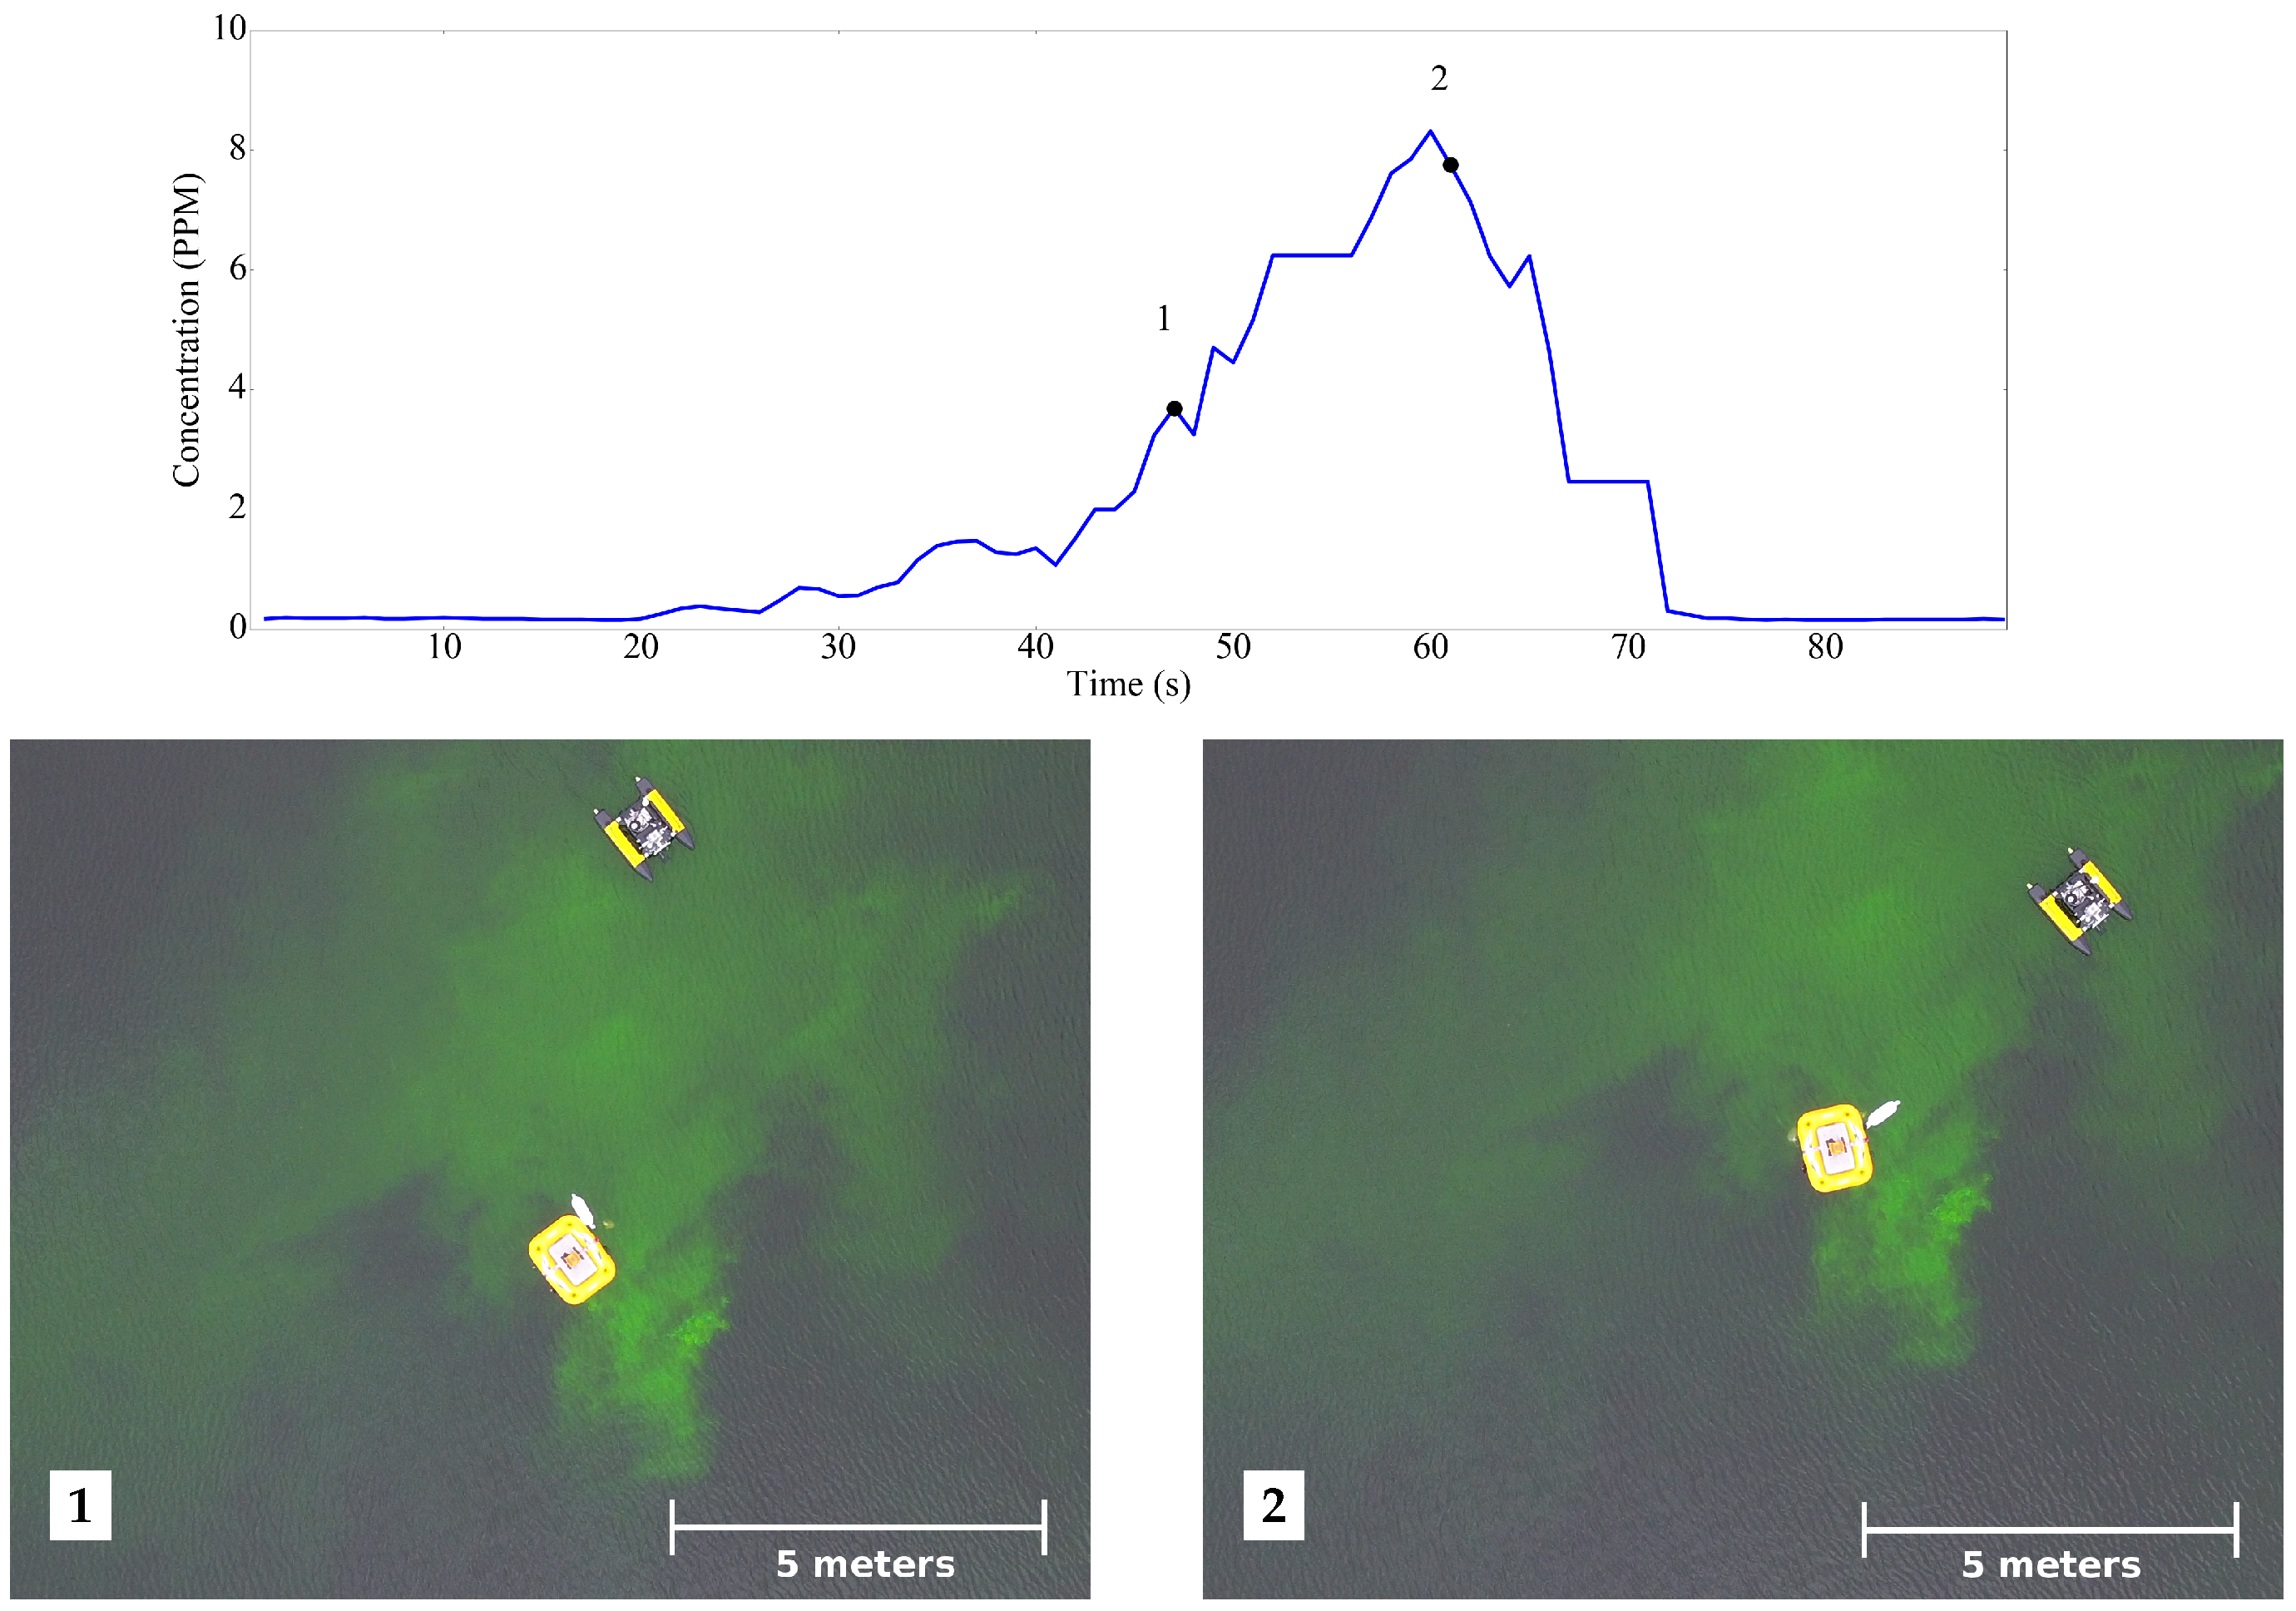
Figure 3). For the transect shown by the white line in (
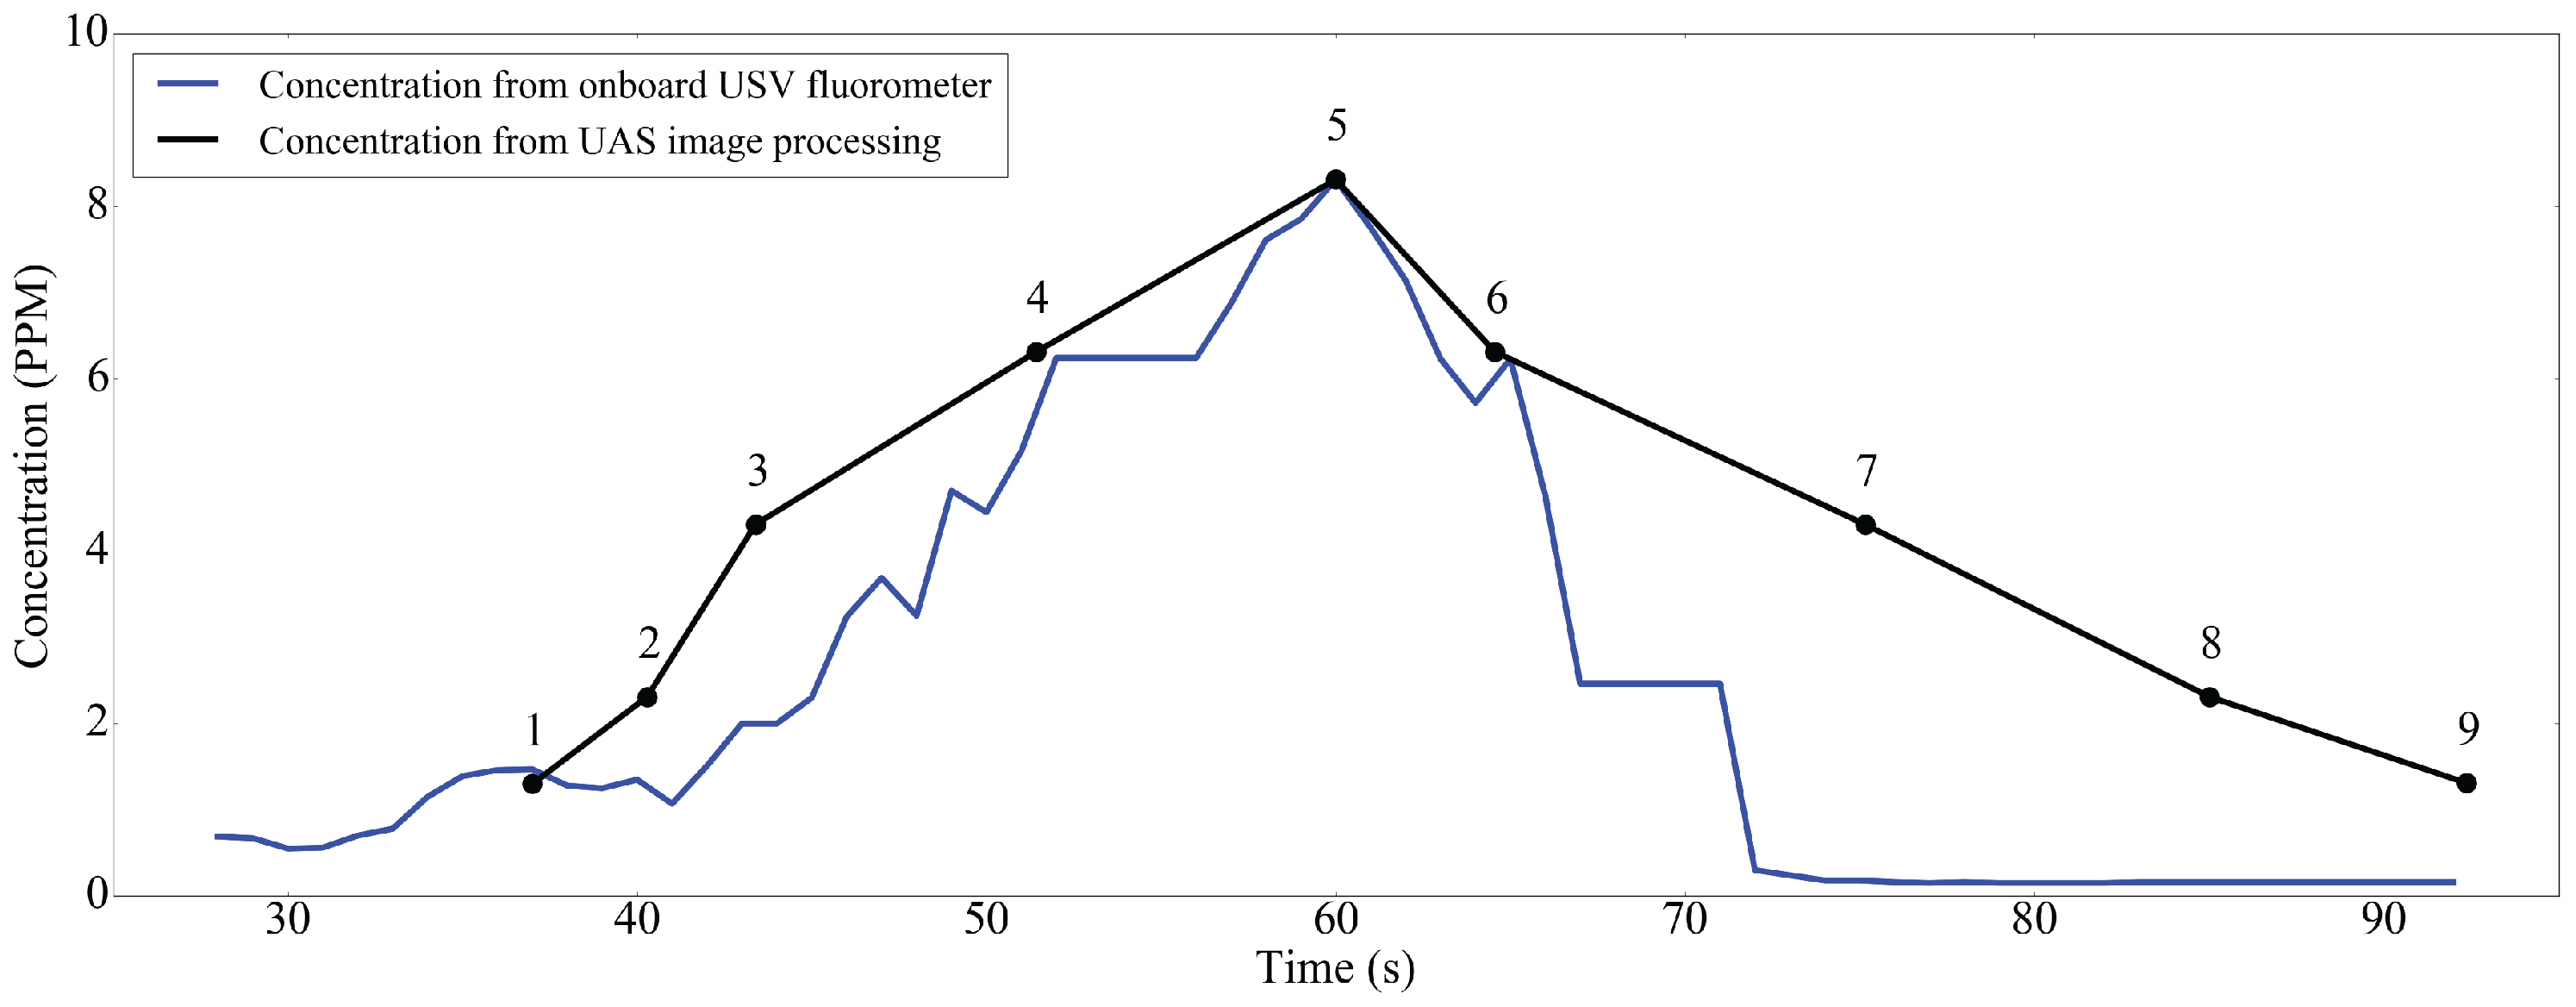
Figure 5), we assigned concentrations to color values (heat) to the raw image based on the minimum and maximum values recorded by the Turner C6 sensor on the USV. Plot points for time were chosen according to when the USVs path was in the midpoint between the discretized concentration boundaries represented by the colors of the heatmap. This was then compared to the Turner C6 concentrations recorded for the transect shown in (
Figure 6). The shape of both curves in
Figure 6 were similar, demonstrating that the processed images from the UAS could be used to accurately predict dye concentrations near the water surface (i.e., the USV provided the ground-truthing needed to validate these image predictions).
Hazardous agent spills represent an important economic and health cost to the global community. There are knowledge gaps in understanding the transport of these agents in aquatic environments such as the fate and transport of spilled oil [
29]. The coordinated aspect of this study provides a base for future development of completely autonomous multifaceted hazardous plume concentration measurements. The technologies used and the techniques developed in this study could eventually be used to provide comprehensive spatial and temporal maps of hazardous plume concentrations. Though typical measurements of agents such as HABs are made using satellite imagery, these measurements can be prone to errors when the water surface turbulence is large enough [
11] and may need in situ measurements (ground-truthing) to calibrate the measurements [
30]. Moreover, some types (species) of HABs are not detectable by satellite imagery [
31]. Coordinated systems of autonomous unmanned vehicles could be used to patrol coast lines to help identify HABs before they become large and dangerous.
Though our coordination of unmanned systems provided a good agreement in concentrations from aerial optical measurements with near surface fluorescein concentration measurements (
Figure 6), some slight deviations could be observed. First, some of the error in the comparison of the in situ dye detection and the heat maps of concentrations extracted from the digital images could be partially eliminated by using Real Time Kinematic GPS systems in the future. This GPS technology can map locations as small as 2 cm and could account for changes in the speed of the USV that was not accounted for in our study and would help localize concentration measurements from the USV both temporally and spatially. Second, errors might also be explained by changes of speed of the USV which could skew a concentration profile. It’s also important to note that the visual surface concentration will not completely match the concentration measurements from the Turner C6 sensor due to the 16 cm depth the sensor was operated. Using a finer scale conversion of color matching to create heatmaps would lead to higher resolution concentration profiles to aid in automated image validation however, a finer scale is not needed for visual inspection. Spectral and radiometric calibrations of the UAS camera is also needed to increase both accuracy and precision of the image processing. Moreover, accounting for more image property variables such as brightness and hue and using turbidity data could also lead to more accurate heatmaps with a better understanding of how much depth from the surface impacts the visual based concentration profiles. Future studies are also needed to elucidate minimum concentrations that can be mapped by a UAS and to monitor actual concentrations of dye using color intensity (compared to relative concentrations used in this study). Eliminating the manned component as a next step could remove additional error by using precise command and control algorithms that manned control cannot duplicate. Direct UAS to USV communication coordination as a type of heterogeneous swarm [
32] could allow for highly efficient search and mapping of dyes and hazardous agents in the future.
4. Conclusions
A fluorescent dye was released into a freshwater lake from an anchored floating platform. A fluorometer was mounted underneath a USV, and was used to detect and track the released dye in situ in real-time. A UAS was used to visualize the dye and direct the USV to sample different areas of the dye plume. Image processing tools were used to map concentration profiles of the dye plume from aerial images acquired from the UAS, and these were associated with concentration measurements collected from the sensors onboard the USV. In situ fluorescein concentration profiles measured with the USV were similar to the intensity of the plume as seen by raw images from the UAS. Color-enhanced images revealed subtle differences in concentrations not seen in the raw images. The concentration profiles revealed from the USV and UAS were similar, demonstrating that the processed images from the UAS could be used to accurately predict dye concentrations near the water surface.
This work establishes the concepts and techniques needed to use coordinated unmanned systems to safely and cost effectively identify and map hazardous agents. Additionally with further development, this work can be adapted to allow the UAS to work individually to locate and quantify hazardous agents when ocean conditions are prohibitive for USV operations. Hazardous agents represent a hazard to marine resources and human health and effect the economies of most coastal communities. Using these systems and techniques, or variations of the systems and techniques developed in this work, could provide a fast tool to identify and localize hazardous agents in the future.


