

Remote Sens., Volume 17, Issue 15 (August-1 2025) – 211 articles
Cover Story (view full-size image):
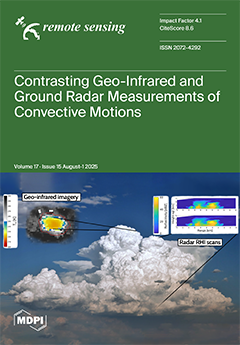
Convection is a key driver of the global atmospheric circulation and the climate system. However, its representation in high-resolution models remains challenging. In this study, we examine selected convective cases from the TRACER/ESCAPE campaign in Houston, TX, in the summer of 2022. Ground-based radar and GOES-R geostationary visible and infrared sensor data are used to track and analyse convective cores. While radar observations provide an unparalleled view of the internal structure of convective cells, GOES infrared brightness temperatures aid the tracking of early convective stages via cloud-top cooling rates, but, in the presence of sub-kilometer convective structures, the coarse resolution of the instrument limits their effectiveness. Combining the two instruments provides a broader temporal and spatial context, offering a more complete view of the stages of convection. View this paper
- Issues are regarded as officially published after their release is announced to the table of contents alert mailing list.
- You may sign up for e-mail alerts to receive table of contents of newly released issues.
- PDF is the official format for papers published in both, html and pdf forms. To view the papers in pdf format, click on the "PDF Full-text" link, and use the free Adobe Reader to open them.
Previous Issue
Next Issue