Article

Performance of the NPP-VIIRS and aqua-MODIS Aerosol Optical Depth Products over the Yangtze River Basin

1
School of Resource and Environmental Science, Wuhan University, Wuhan 430079, China
2
Laboratory of Critical Zone Evolution, School of Earth Sciences, China University of Geosciences, Wuhan 430074, China
3
School of Marine Sciences, Nanjing University of Information Science and Technology, Nanjing, 210044, China
4
Institute of Space and Earth Information Science, The Chinese University of Hong Kong, Hong Kong, China
*
Authors to whom correspondence should be addressed.
Remote Sens. 2018, 10(1), 117; https://doi.org/10.3390/rs10010117
Submission received: 2 December 2017 / Revised: 11 January 2018 / Accepted: 13 January 2018 / Published: 16 January 2018
(This article belongs to the Section Atmospheric Remote Sensing)

Abstract

:
The visible infrared imaging radiometer suite (VIIRS) environmental data record aerosol product (VIIRS_EDR) and the Aqua-moderate resolution imaging spectroradiometer (MYD04) collection 6 (C6) aerosol optical depth (AOD) products are validated against the Cimel sun–photometer (CE318) AOD measurements during different air quality conditions over the Yangtze river basin (YRB) from 2 May 2012 to 31 December 2016. For VIIRS_EDR, the AOD observations are obtained from the scientific data set (SDS) “aerosol optical depth at 550 nm” at 6 km resolution, and for Aqua-MODIS, the AOD observations are obtained from the SDS “image optical depth land and ocean” at 3 km (DT3K) and 10 km (DT10K) resolutions, “deep blue aerosol optical depth 550 land” at 10 km resolution (DB10K), and “AOD 550 dark target deep blue combined” at 10 km resolution (DTB10K). Results show that the high-quality (QF = 3) DTB10K performs the best against the CE318 AOD observations, along with a higher R (0.85) and more retrievals within the expected error (EE) ± (0.05 + 15%) (55%). Besides, there is a 10% overestimation, but the positive bias does not exhibit obvious seasonal variations. Similarly, the DT3K and DT10K products overestimate AOD retrievals by 23% and 15%, respectively, all over the year, but the positive biases become larger in spring and summer. For the DB10K AOD retrievals, there is an overestimation (underestimation) in autumn and winter (spring and summer). Compared to the Aqua-MODIS AOD products, the VIIRS_EDR AOD retrievals are less correlated (R = 0.73) and only 44% of the retrievals fall within EE. Meanwhile, the VIIRS_EDR shows larger bias than the Aqua-MODIS C6 retrievals, and tends to overestimate AOD retrievals in summer and underestimate in winter. Additionally, there is an underestimation for the VIIRS_EDR AOD retrievals over the regions during high aerosol loadings. These indicate that the VIIRS_EDR retrieval algorithm needs to be improved in further applications over the YRB.

Graphical Abstract

1. Introduction

Aerosols are small suspended particles in the atmosphere of the earth, which have a significant effect on climate change, air quality, visibility and human health [1]. Especially, the particulate matter with diameters less than 2.5 μm (PM2.5), has the capacity of remaining in the atmosphere for a long time and can be breathed into the lungs, resulting in various diseases [2]. Therefore, in order to meet the requirements of air quality monitoring and climate change assessment, long-term continuous aerosol observations over regional scales are necessary and critical.
Many efforts have been paid for constructing global and national aerosol foundation networks, such as the aerosol robotic network (AERONET) and the China aerosol remote sensing network (CARSNET). The ground-level aerosol observations are retrieved directly by sun photometer, thus, avoiding surface reflectance contamination [3,4,5]. However, there is a sparse distribution of aerosol ground sites all over the world, especially in the remote countryside, due to their high operating costs. Therefore, with the improvement of satellites resolution, satellite remote sensing is expected as an ideal technology for retrieving aerosol optical and radiative properties at global and regional scales. During the past decades, various satellite sensors have been launched, such as the moderate resolution imaging spectroradiometer (MODIS) and the visible infrared imaging radiometer suite (VIIRS). VIIRS is the next-generation polar-orbiting operational environment sensor launched in October 2011, which is expected to continue to provide, in the long run, global aerosol retrievals after MODIS. Although there are some small differences in cloud masking and pixel selection, the VIIRS AOD retrieval algorithm is based on the MODIS heritage [6]. However, compared with MODIS C6 aerosol products, the VIIRS_EDR AOD retrievals showed lower accuracy (−0.009 vs. −0.005) and larger uncertainty (0.130 vs. 0.106) over global land [6,7]. Thus, the robustness of the VIIRS_EDR retrieval algorithm needs to be improved.
Recently, these MODIS C6 and VIIRS_EDR aerosol products have been widely validated against ground observations in clear sky over the global land and ocean [8,9], India [10,11], Southeast Asia [12], East Asia [13,14], Greece [15,16] and China [17,18,19]. However, their performances over frequent haze-fog areas are still unclear [20]. Bail et al. [21] reported that both DT and DB MODIS C6 AOD retrievals were reduced during several random haze events in 2013 over the Beijing–Tianjin–Hebei region. Wang et al. [22] further analyzed that the missing VIIRS AOD retrievals during heavy aerosol loadings over the North China Plain were attributed to cloud masking, ephemeral water body and poor data quality. Additionally, for air quality remote sensing, the relationship between the MODIS AOD retrievals and the corresponding PM2.5 concentrations was estimated over Beijing and China mainland by [23] and [2], respectively. In other words, the evaluations of the MODIS C6 and VIIRS_EDR aerosol products during heavily polluted conditions usually focused on the eastern developed regions of China, such as the Beijing-Tianjin-Hebei [21,22,23,24,25], Hong Kong [26] and Wuhan [27,28]. However, to our knowledge, few related studies were performed over central and western China like the whole Yangtze river basin (YRB).
The Yangtze river basin is one of the most developed regions in China, along with intensive industrialization and urbanization activities, causing serious air pollution [18]. Due to lack of ground-level aerosol sites and air quality sites, especially in the middle and upper reaches of the YRB, MODIS and VIIRS are treated as suitable tools to evaluate aerosol properties and monitor air quality over the YRB. However, the various aerosol sources and diverse underlying surfaces over the YRB may amplify the biases in AOD for aerosol products [18]. Thus, before the scientific application of satellite aerosol retrievals, it is necessary to evaluate their performance over the whole YRB.
The major objectives of this study are to evaluate the performances of the Aqua-MODIS C6 (DT3K, DT10K, DB10K and DTB10K) and VIIRSEDR (6 km, 6 K) AOD products for different quality flags over a frequent haze-fog area like the YRB. The study is organized as follows: Data and methods are described in Section 2, Section 3 and Section 4 refer to the results and the discussion, respectively, and finally, conclusions are summarized in Section 5.

2. Data and Methods

2.1. MODIS C6 Data

The Aqua-MODIS Level 2 Collection 6 (C6) aerosol products can be obtained from https://ladsweb.modaps.eosdis.nasa.gov/ since 2002. Compared to the previous Collection 5.1 (C51), the MODIS C6 aerosol products present significant improvements on the retrieval algorithm and spatial resolution [8,14,21]. The MODIS C6 product provides AOD observations based on two algorithms: dark target and deep blue. Generally, the dark target algorithm (DT) is suitable for the vegetated surfaces, while the enhanced C6 deep blue algorithm (DB) can retrieve AOD values over bright and vegetated land surfaces but not over oceans. Both algorithms are unsuitable for snow-covered surfaces. The details about the two retrieval algorithms were already reported in previous researches [29,30,31,32]. The MODIS C6 10 km aerosol product also provides a set of DT and DB combined database (DTB). The quality flags of the MODIS AOD retrievals are classified as 0, 1, 2 and 3, for unproduced, low, medium, and high quality, respectively. Additionally, for monitoring air quality, C6 also provides AOD observations at 3 km resolution based on the DT algorithm. In this study, the Aqua-MODIS C6 DT AOD at 3 km and 10 km, DB at 10 km, and DTB AOD retrievals at 10 km for all quality flags (Table 1) are obtained to compare with ground-level AOD observations.

2.2. VIIRS_EDR Data

VIIRS is the next-generation environmental sensor aboard the Suomi National Polar-Orbiting Partnership (S–NPP) satellite, which was launched in October 2011. Similar to Aqua-MODIS, the passing time of VIIRS is also approximately at the local time of 13:30. The level 2.0 aerosol VIIRS_EDR product provides AOD values for 11 wavelengths (412–2250 nm) since 2 May 2012 at www.class.noaa.gov. The VIIRS_EDR retrieval is created from 8 × 8 pixel aggregations of the intermediate product (IP) values (0.75 km), and therefore, the spatial resolution of the VIIRS_EDR AOD is about 6 km resolution at nadir. The VIIRS_EDR AOD values are retrieved for the unproduced (QF = 0), low (QF = 1), medium (QF = 2) and high (QF = 3) quality flags. Furthermore, the retrieval algorithm of the VIIRS_EDR product was analyzed in the previous studies over land and water and can be found here [6,7,33]. In this study, the VIIRS_EDR AOD values at 550 nm for different quality flags are obtained for the period of 2 May 2012–31 December 2016 over YRB (Table 1).

2.3. Ground-Based Measurements

The AERONET (aerosol robotic network) and the CARSNET (China aerosol remote sensing network) are two common ground-based aerosol networks, which retrieve aerosol optical properties by using the CIMEL sun photometer (CE318). The CE318 sun photometer performs direct solar radiation measurements at eight wavelengths ranging from 340 nm to 1020 nm, but excludes 550 nm. As reported in previous studies, the systemic bias of AERONET AOD values was about 0.01–0.02 [34]. More details about the retrieval algorithm and instrument calibration of the CE318 sun photometer can be found in [4,5]. As shown in Table 2 and Figure 1, in order to verify the performance of satellite AOD retrievals over theYRB, CE318 measurements are obtained for Taihu (TH), Hefei (HF) and Wuhan (WH) from 2 May 2012 to 31 December 2016, whereas for the Kunming (KM), these measurements are obtained from 2 May 2012 to 31 December 2013. All the sites are located in urban area, except TH (suburban site).

2.4. Comparison Methods

According to previous research [18,35], the comparison procedures of satellite AOD retrievals against CE318 AOD observations are performed as follows. Firstly, the CE318 AOD values at 550 nm are calculated from Equations (1) and (2).
A O D λ i = β λ i α
α = ln ( A O D λ 1 / A O D λ 2 ) ln ( λ 1 / λ 2 ) , β = A O D λ 2 λ 2 α
where α refers to the Ångström exponent, β is the turbidity coefficient, λ1 and λ2 are the respective wavelengths at 440 nm and 870 nm, which are not interfered by water vapor. Secondly, the CE318 AOD values at 550 nm are collected only within ±30 min of the MODIS (Aqua) and VIIRS passing time (13:30 local time). Only when at least two CE318 observations during the satellite passing time are available, then the CE318 AOD values are averaged. Thirdly, the satellite AOD retrievals are collected only within 3 × 3 pixels centered on the CE318 ground sites. That is to say, for the MODIS C6 10 km (DT, DB and DTB) products, the sampling area is 30 km × 30 km; for the MODIS C6 3 km and VIIRS_EDR (6 km) products, the sampling areas are 9 km × 9 km and 18 km × 18 km, respectively. In order to reduce the satellite retrieval errors, it is necessary that at least two pixels of satellite retrievals fall in their corresponding sampling areas. Finally, the linear regressions of the MODIS C6 and VIIRS_EDR AOD retrievals against the CE318 AOD observations are performed over the YRB during 2 May 2012–31 December 2016. The regression parameters include the slope, the y-intercept, the correlation coefficient (R) and the root mean square error (RMSE, Equation (3)). Furthermore, the uncertainty on the satellite retrieval algorithms is examined based on the expected error (EE, Equation (4)), the mean absolute error (MAE, Equation (5)) and the relative mean bias (RMB, Equation (6)).
R M S E = 1 n i = 1 n ( A O D ( s a t e l l i t e ) i A O D ( C E 318 ) i ) 2
E E = ± ( 0.05 + 0.15 A O D C E 318 )
M A E = 1 n i = 1 n ( A O D ( s a t e l l i t e ) i A O D ( C E 318 ) i )
R M B = ( A O D s a t e l l i t e ¯ / A O D C E 318 ¯ )
The value of RMB > 1 and RMB < 1 indicate over- and under-estimation in the satellite AOD observations, respectively.

3. Results

3.1. Comparison of VIIRS and Aqua-MODIS C6 AOD vs. CE318 AOD

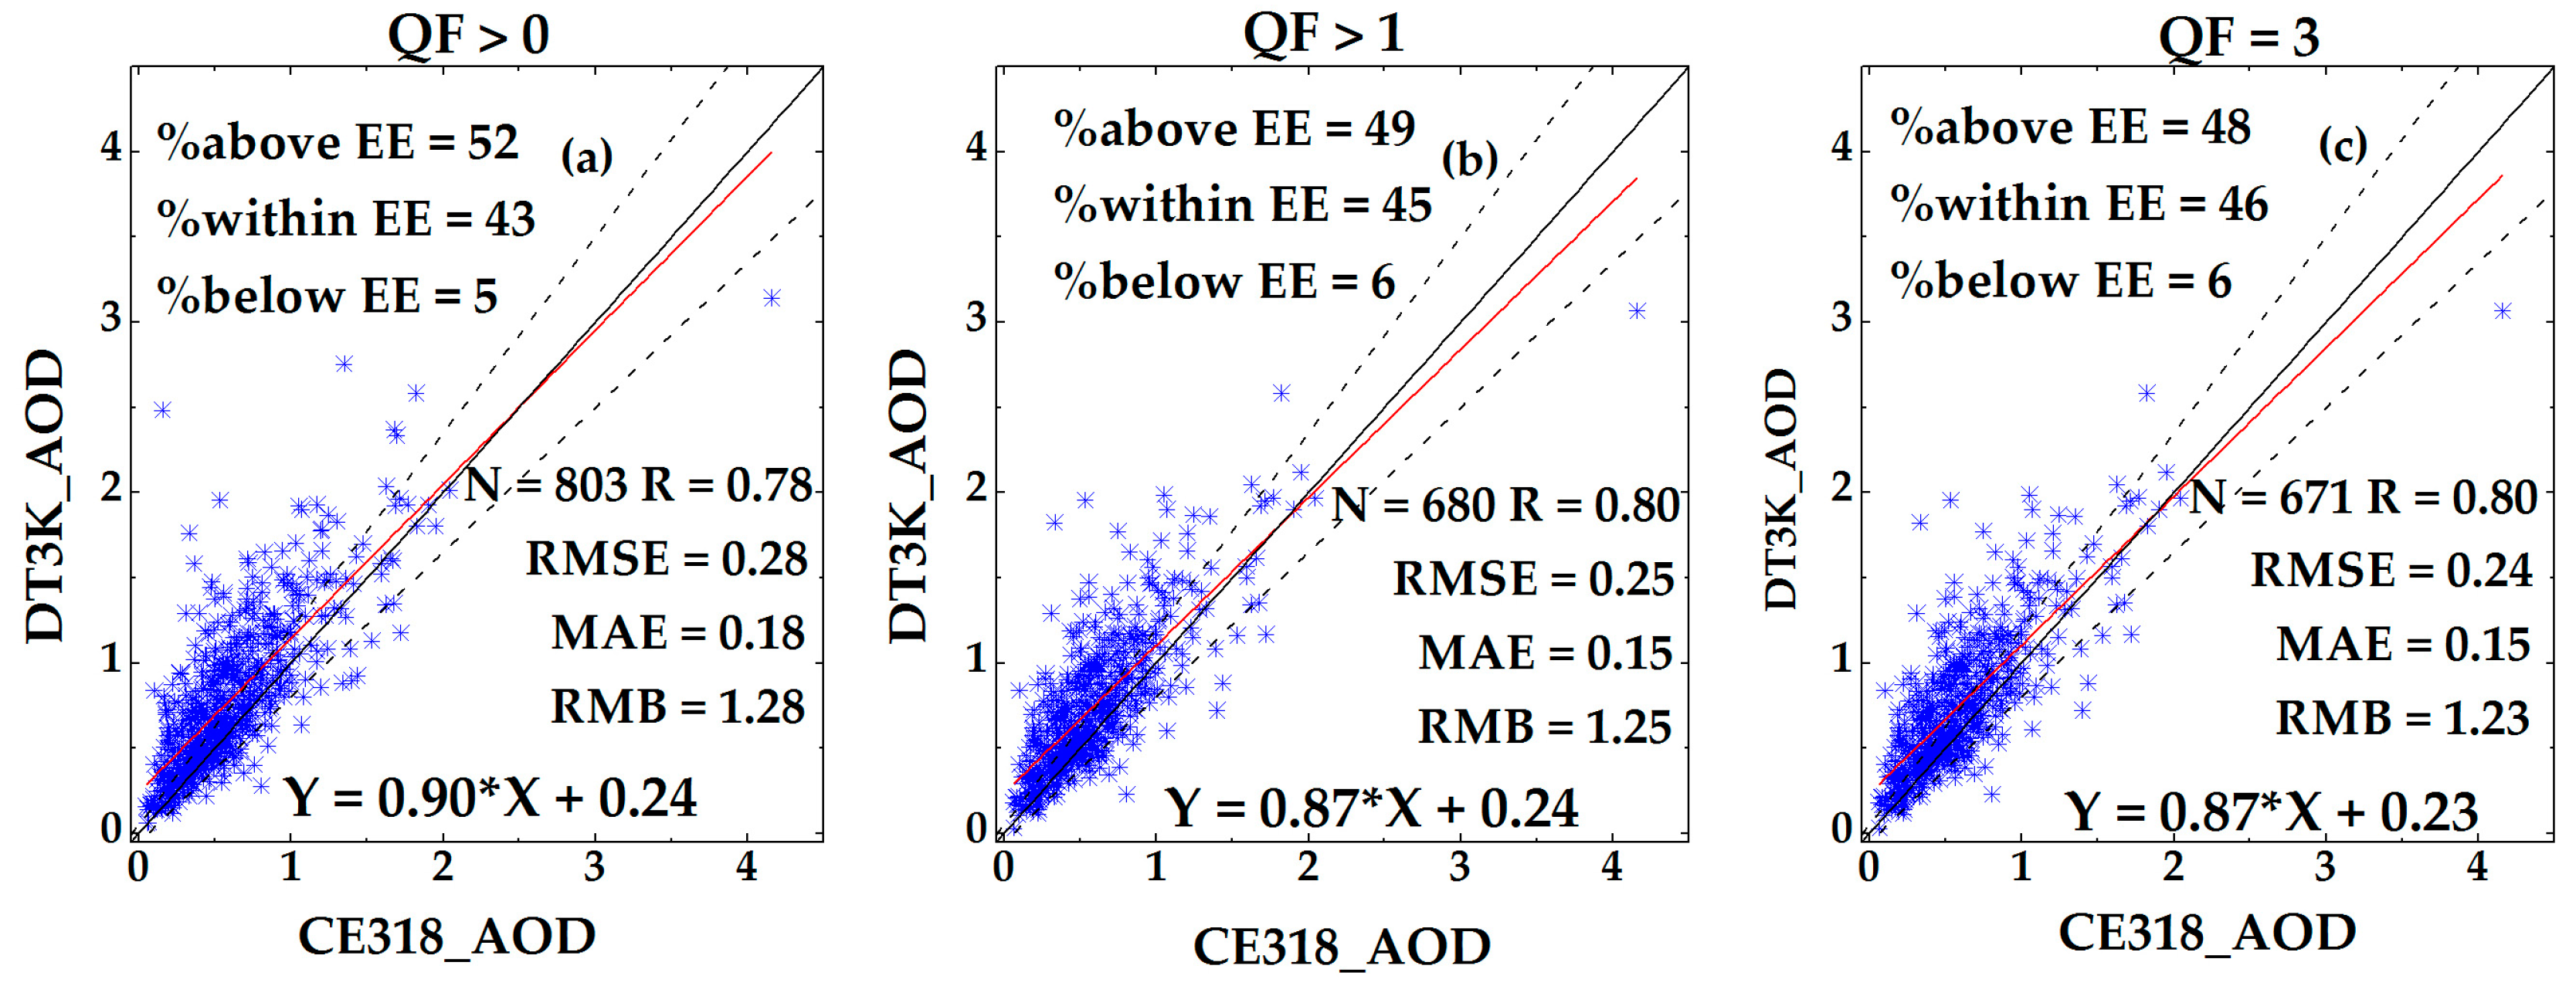
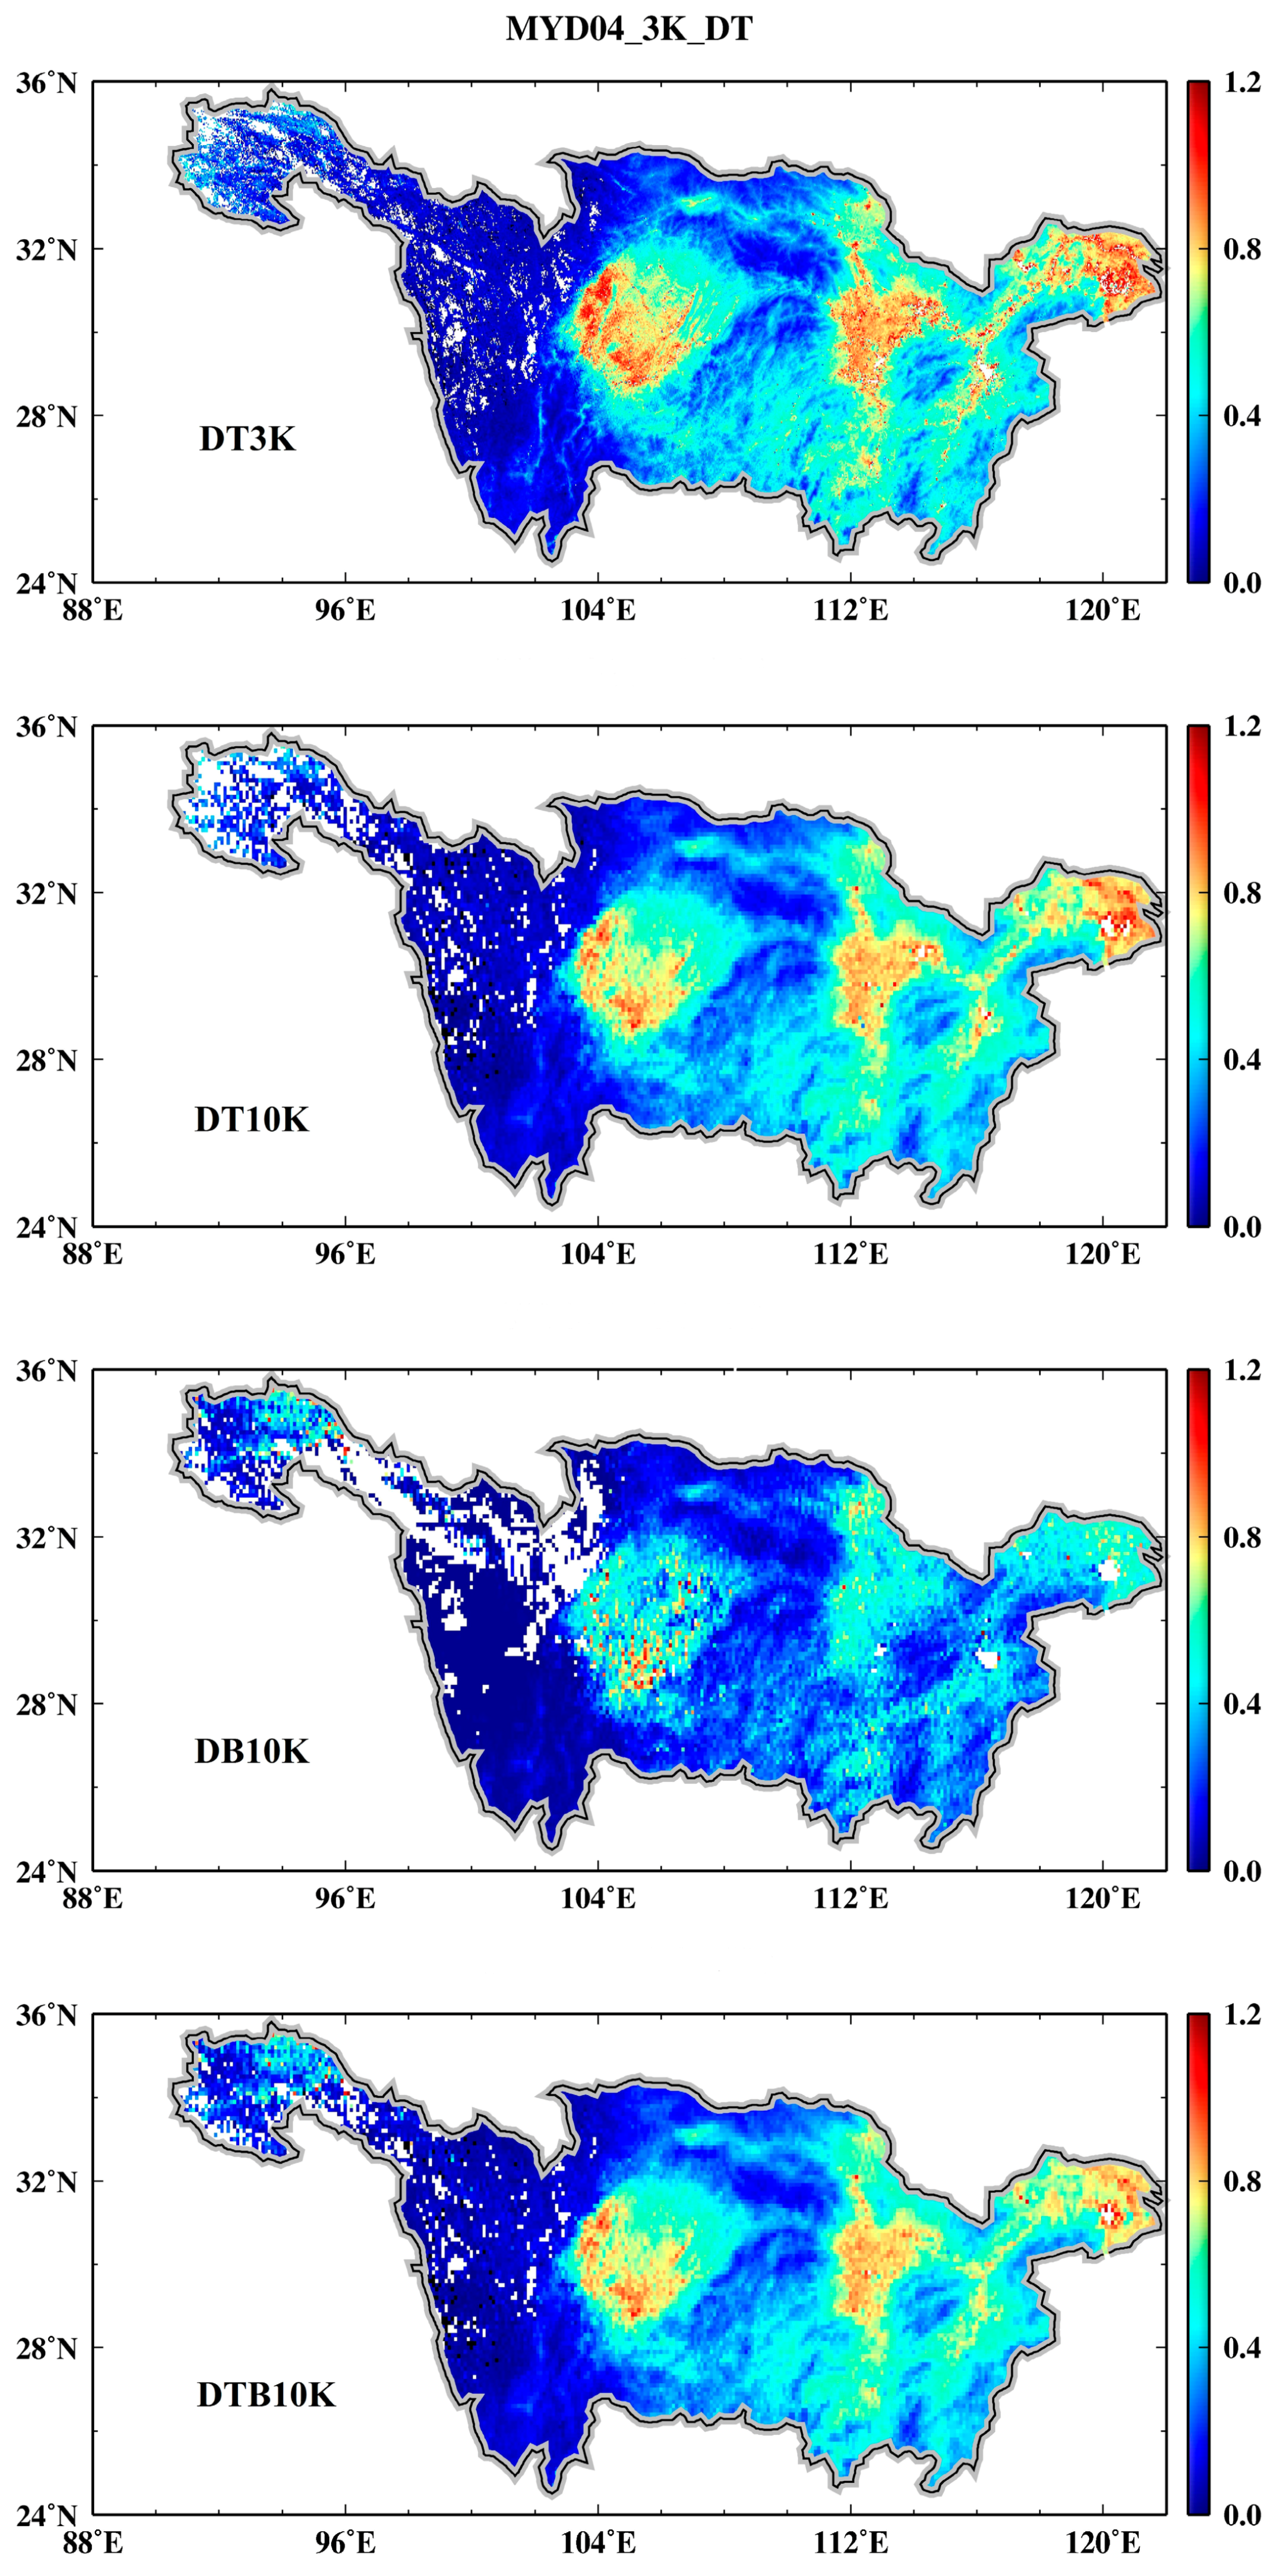
Figure 2 shows the comparison of the DT3K AOD and the collocated CE318 AOD at different quality flags (QF) over YRB for the period of 2 May 2012 to 31 December 2016. There are 803, 680 and 671 successful DT3K–CE318 matchups for QF > 0, QF > 1 and QF = 3, respectively. Note that QF > 0 includes AOD retrievals with all quality flags, and QF > 1 includes those of QF = 2 and QF = 3. Overall, filtering by quality flags (QF > 1), the comparison has been improved for all statistics, i.e., RMSE is decreased by 11%, the R and the percentage of retrievals within the EE are increased up to 3% and 5%, respectively. However, constraining to only high-quality flag (QF = 3) does not improve the overall agreement any further. The reason is likely that there are too few AOD retrievals (only nine points over 4.5 years) for QF = 2. These issues need to be further studied site by site. In terms of the site-by-site comparison over YRB (Table 3), filtering by quality flags (QF > 1), the improvement can be observed at TH, HF and WH. However, for the KM site, the matchup statistics are poor, and increasing QF does not help, probably due to the very low number of samples (67–77) [28]. In Figure 2, the correlation coefficient (R) is in the range of 0.78–0.81, along with 43–46% of DT3K AOD retrievals falling into the expected error (EE) envelope. This indicates that although the correlation is good, the DT3K still does not meet the requirements of the EE as the percentage within the EE is less than one standard deviation (i.e., 68%). Also, it has large RMB (1.23–1.28) which indicates significant overestimation in the algorithm. This overestimation is likely due to the underestimation in the estimated surface reflectance in the visible channels over urban and suburban areas [8]. Besides, obviously in Table 3, the best performance of DT3K AOD retrievals appears at WH with all statistical metrics (R = 0.84–0.86, RMB = 1.06–1.11, MAE = 0.05–0.07 and 59–63% of retrievals within the EE). Similar comparison results at WH were also reported by [28]. Approximately 72% of the DT3K-CE318 AOD matchups fell into the EE with a high R value (0.87) and nearly 7% of the DT3K AOD retrievals (RMB = 1.07) were overestimated [28].
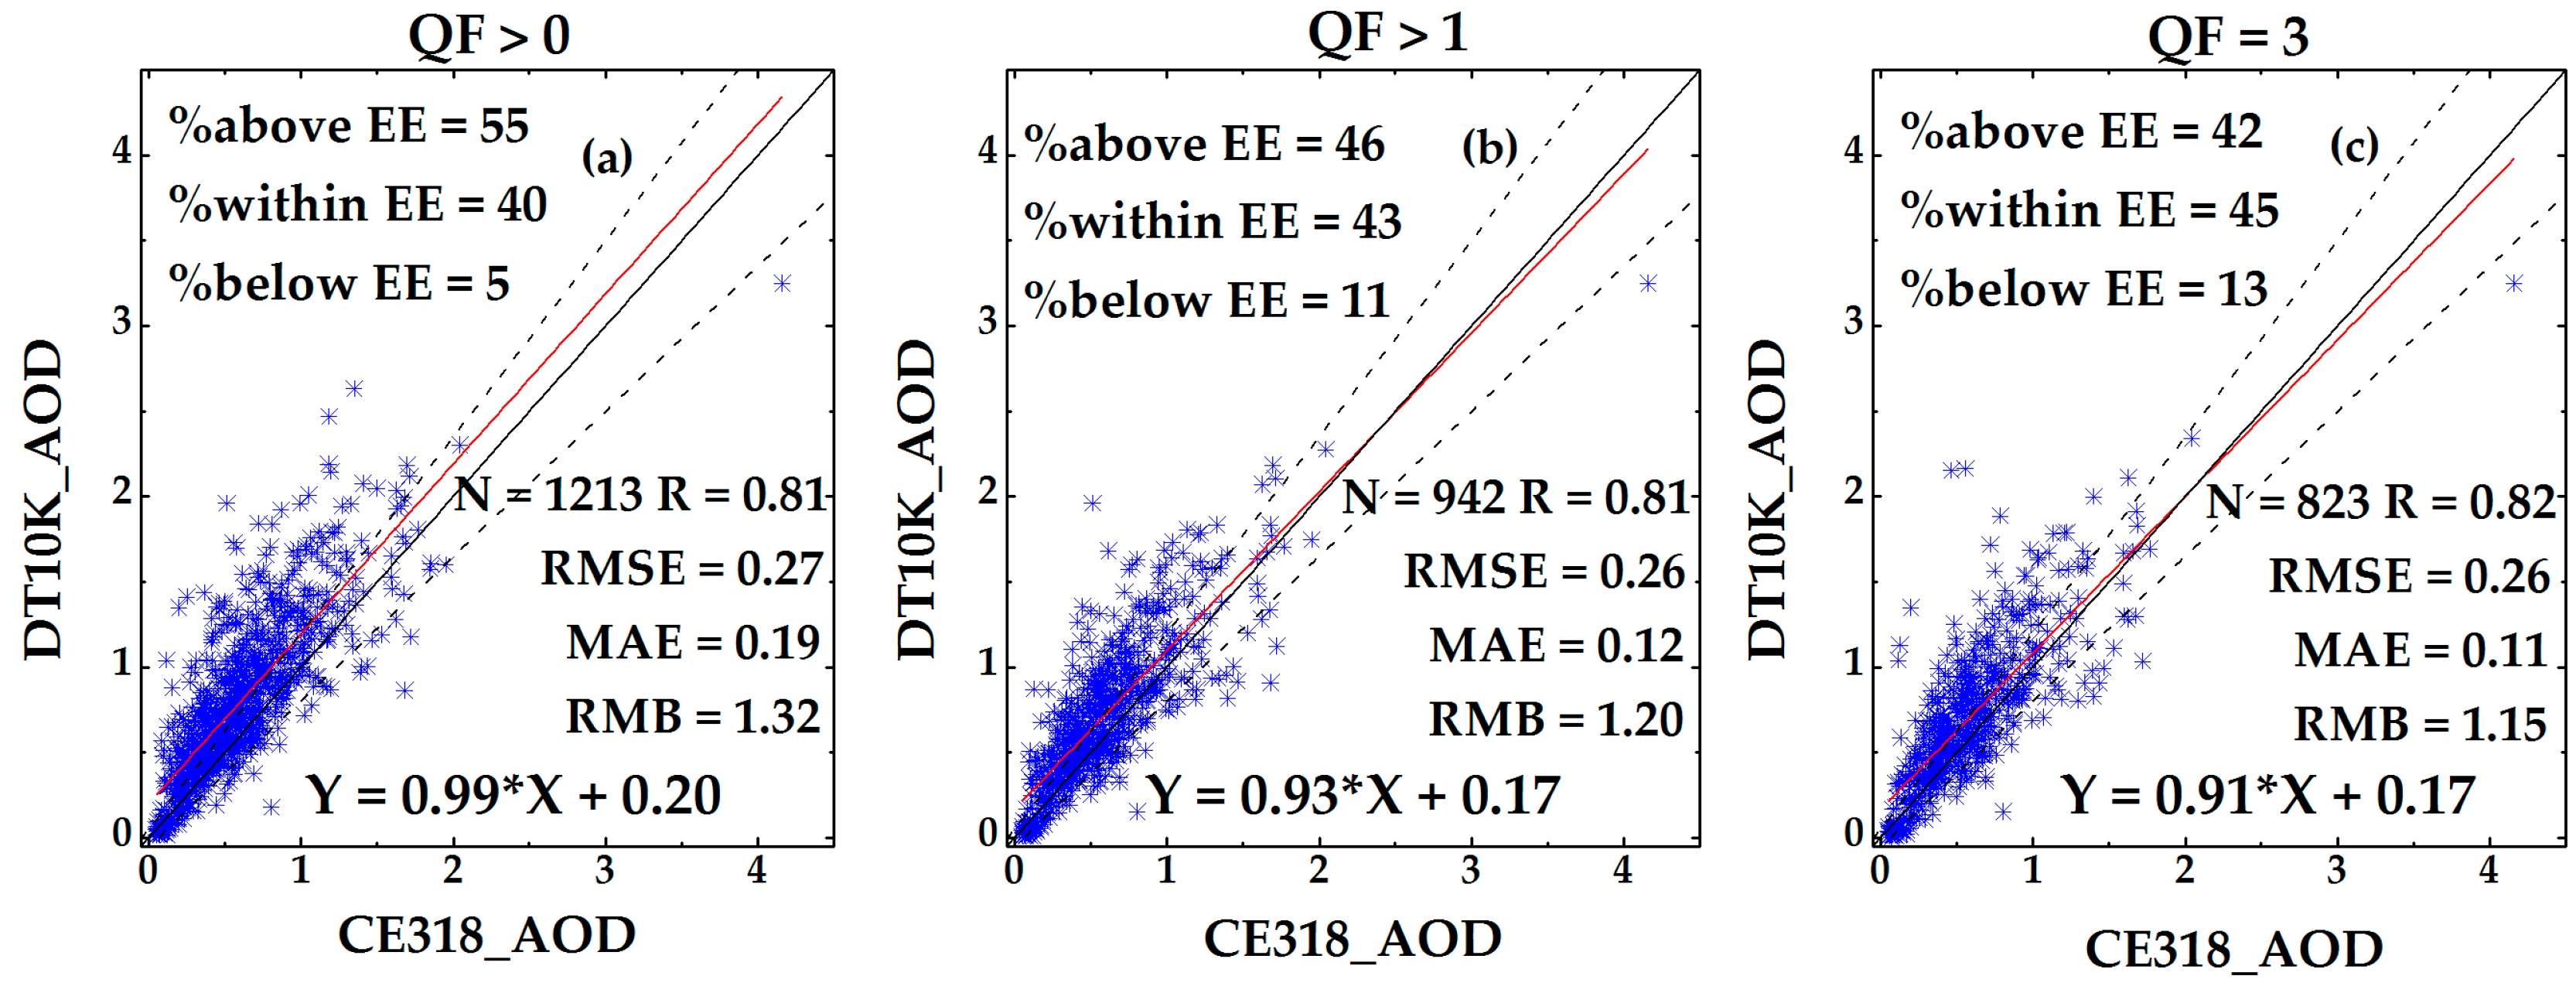
Figure 3 also reports the comparison results of the DT10K and CE318 AOD retrievals. A total of 1213, 942 and 823 matchups are successfully obtained for QF > 0, QF > 1 and QF = 3, respectively. The quality flag analysis results for DT10K are similar to those for the DT3K. Using higher-quality DT10K AOD retrievals lead to the better performance at the TH, HF and WH sites, but it is not suitable at the KM site (Table 4). Besides, compared to the DT3K, the more numbers of DT10K-CE318 AOD matchups may be due to their different sampling criteria used in the AOD retrievals [36,37].The DT10K retrievals are well matched with ground observations by high R values (0.81–0.82), but nearly 42–55% of the DT10K AOD retrievals fall above the EE, resulting in 15–32% overestimation (RMB = 1.15–1.32) compared to the CE318 observations. From the site-by-site comparison in Table 4, there are also 37–51%, 25–31% and 5–19% overestimations for the DT10K, respectively at TH, HF and WH. However, DT10K AOD retrievals at KM are lower than the corresponding CE318 observations by 2–17%, probably due to its low AOD values (nearly 70% of the total CE318 observations less than 0.3). Similar result was also reported by [8], i.e., that the DT10K product tends to slightly underestimate AOD retrievals in the condition with low aerosol loadings (AOD < 0.3) over global land.
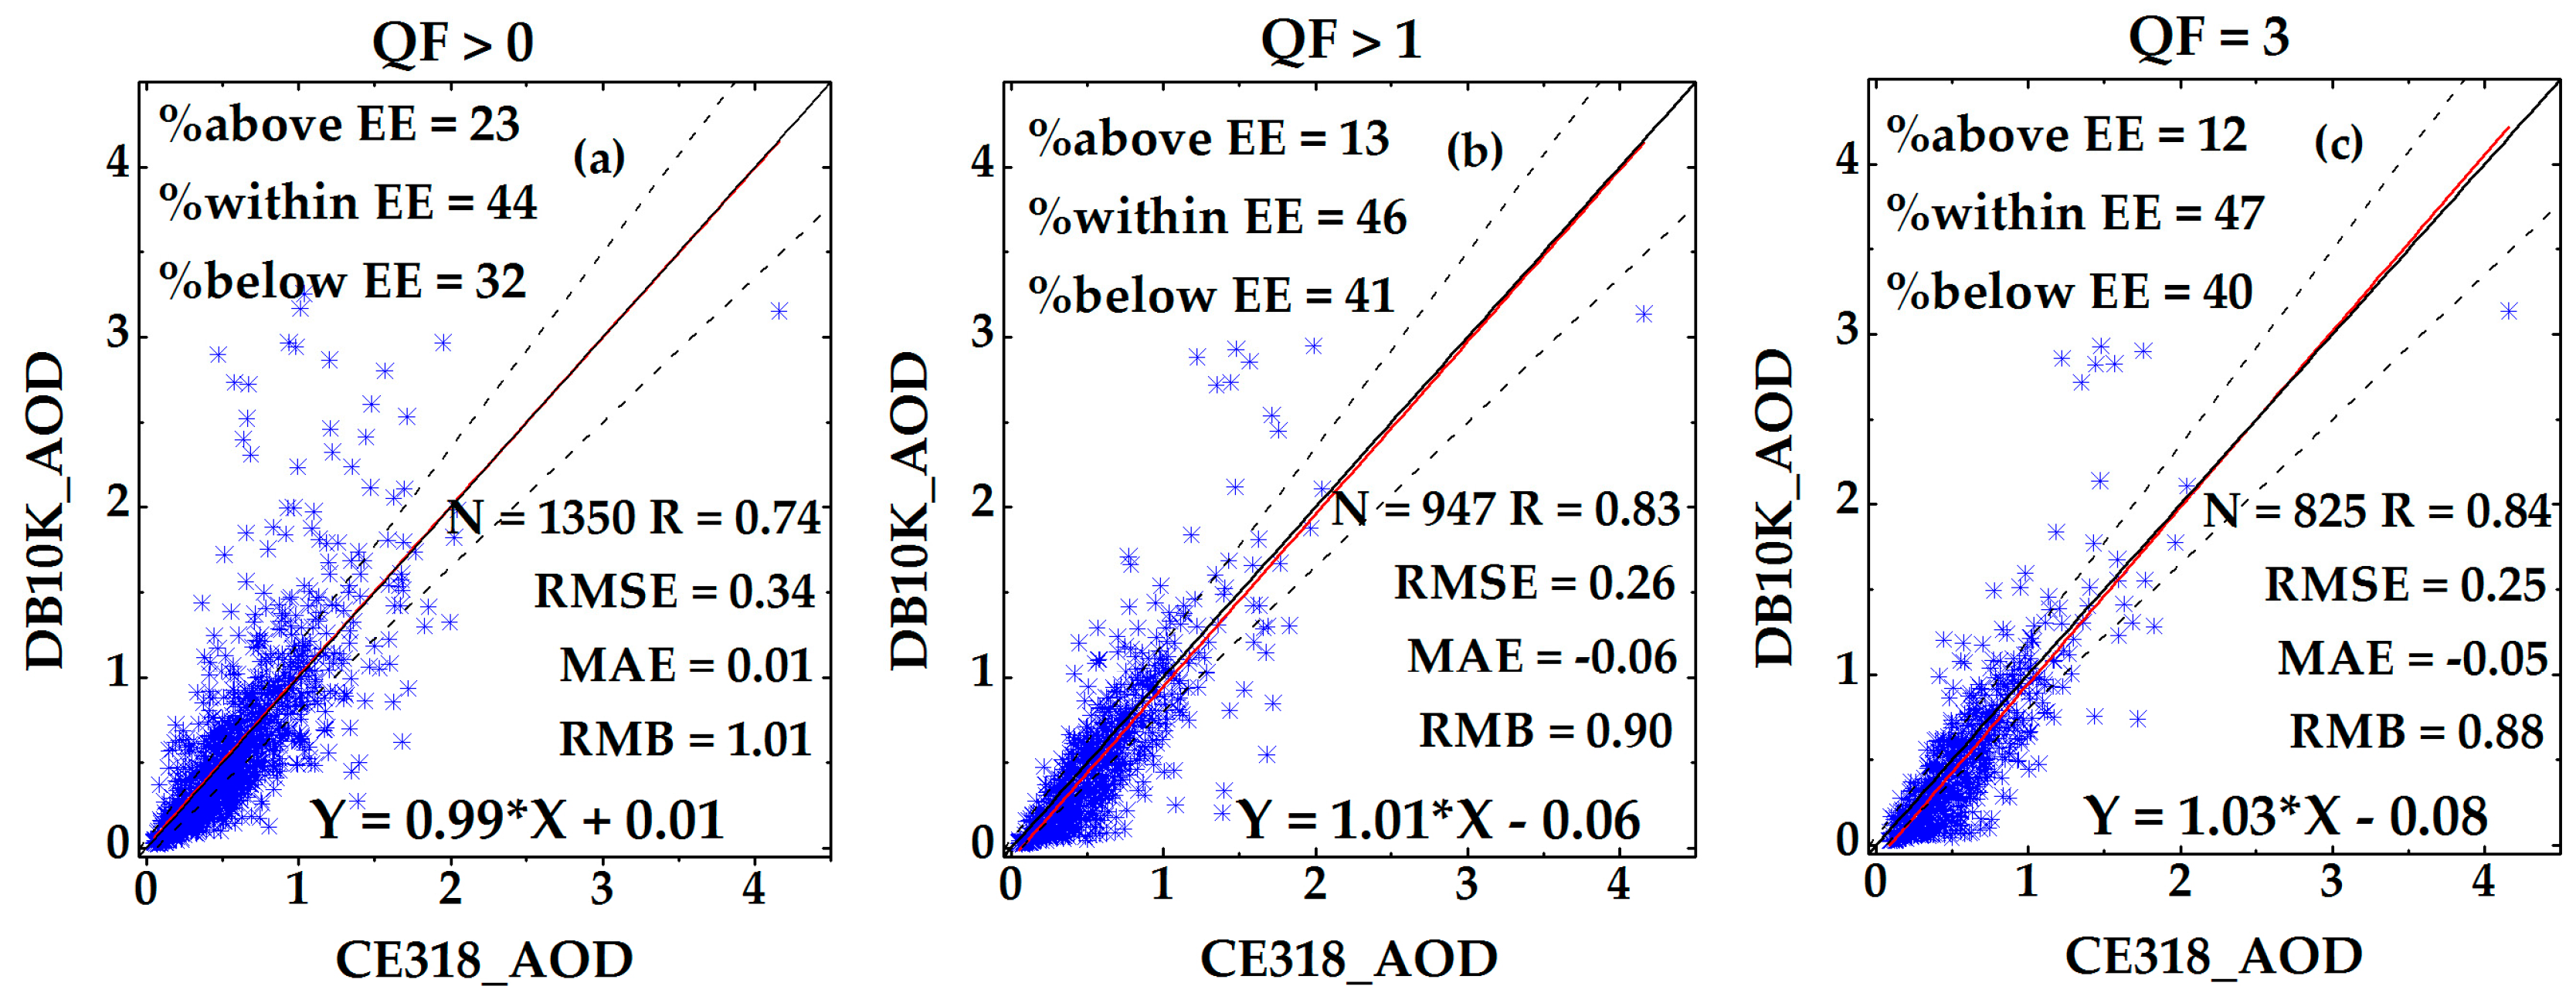
As shown in Figure 4, there are 1350, 947 and 825 DB10K-CE318 matchups, respectively for QF > 0, QF > 1 and QF = 3 in a total of four sites (TH, HF, WH and KM). Similar to the DT3K and DT10k products, filtering by QF > 1, there is a significant improvement in the DB10K retrievals, i.e., the R is increased up to 12% and the RMSE is decreased by 24% and the increase of the percentage within the EE remains within 5%. However, constraining to only high-quality flag (QF = 3), the improvement does not occur. As seen in Table 5, filtering by QF > 1, the site-by-site comparison except KM supports this recommendation (R and %EE increase and RMSE decreases with increasing QF). Besides, in Figure 4c, the good comparison of high-quality DB10K-CE318 retrievals (R = 0.84, MAE = −0.05) over the YRB is consistent with research over global land (R = 0.92, MAE = −0.01) and Southeast Asia (R = 0.88, MAE = −0.06) [30]. However, approximately 40% of the high-quality DB10K retrievals fall below the EE, leading to a 12% underestimation (RMB = 0.88) compared to the CE318 observations. For QF > 0 (Figure 4a), the DB10K became slightly overestimated with a positive MAE (0.01), which is similar to the MAE (0.03) over global land [30]. In terms of the evaluations over individual sites of YRB (Table 5), the DB10K tend to underestimate AOD retrievals for all quality flags except the TH site.
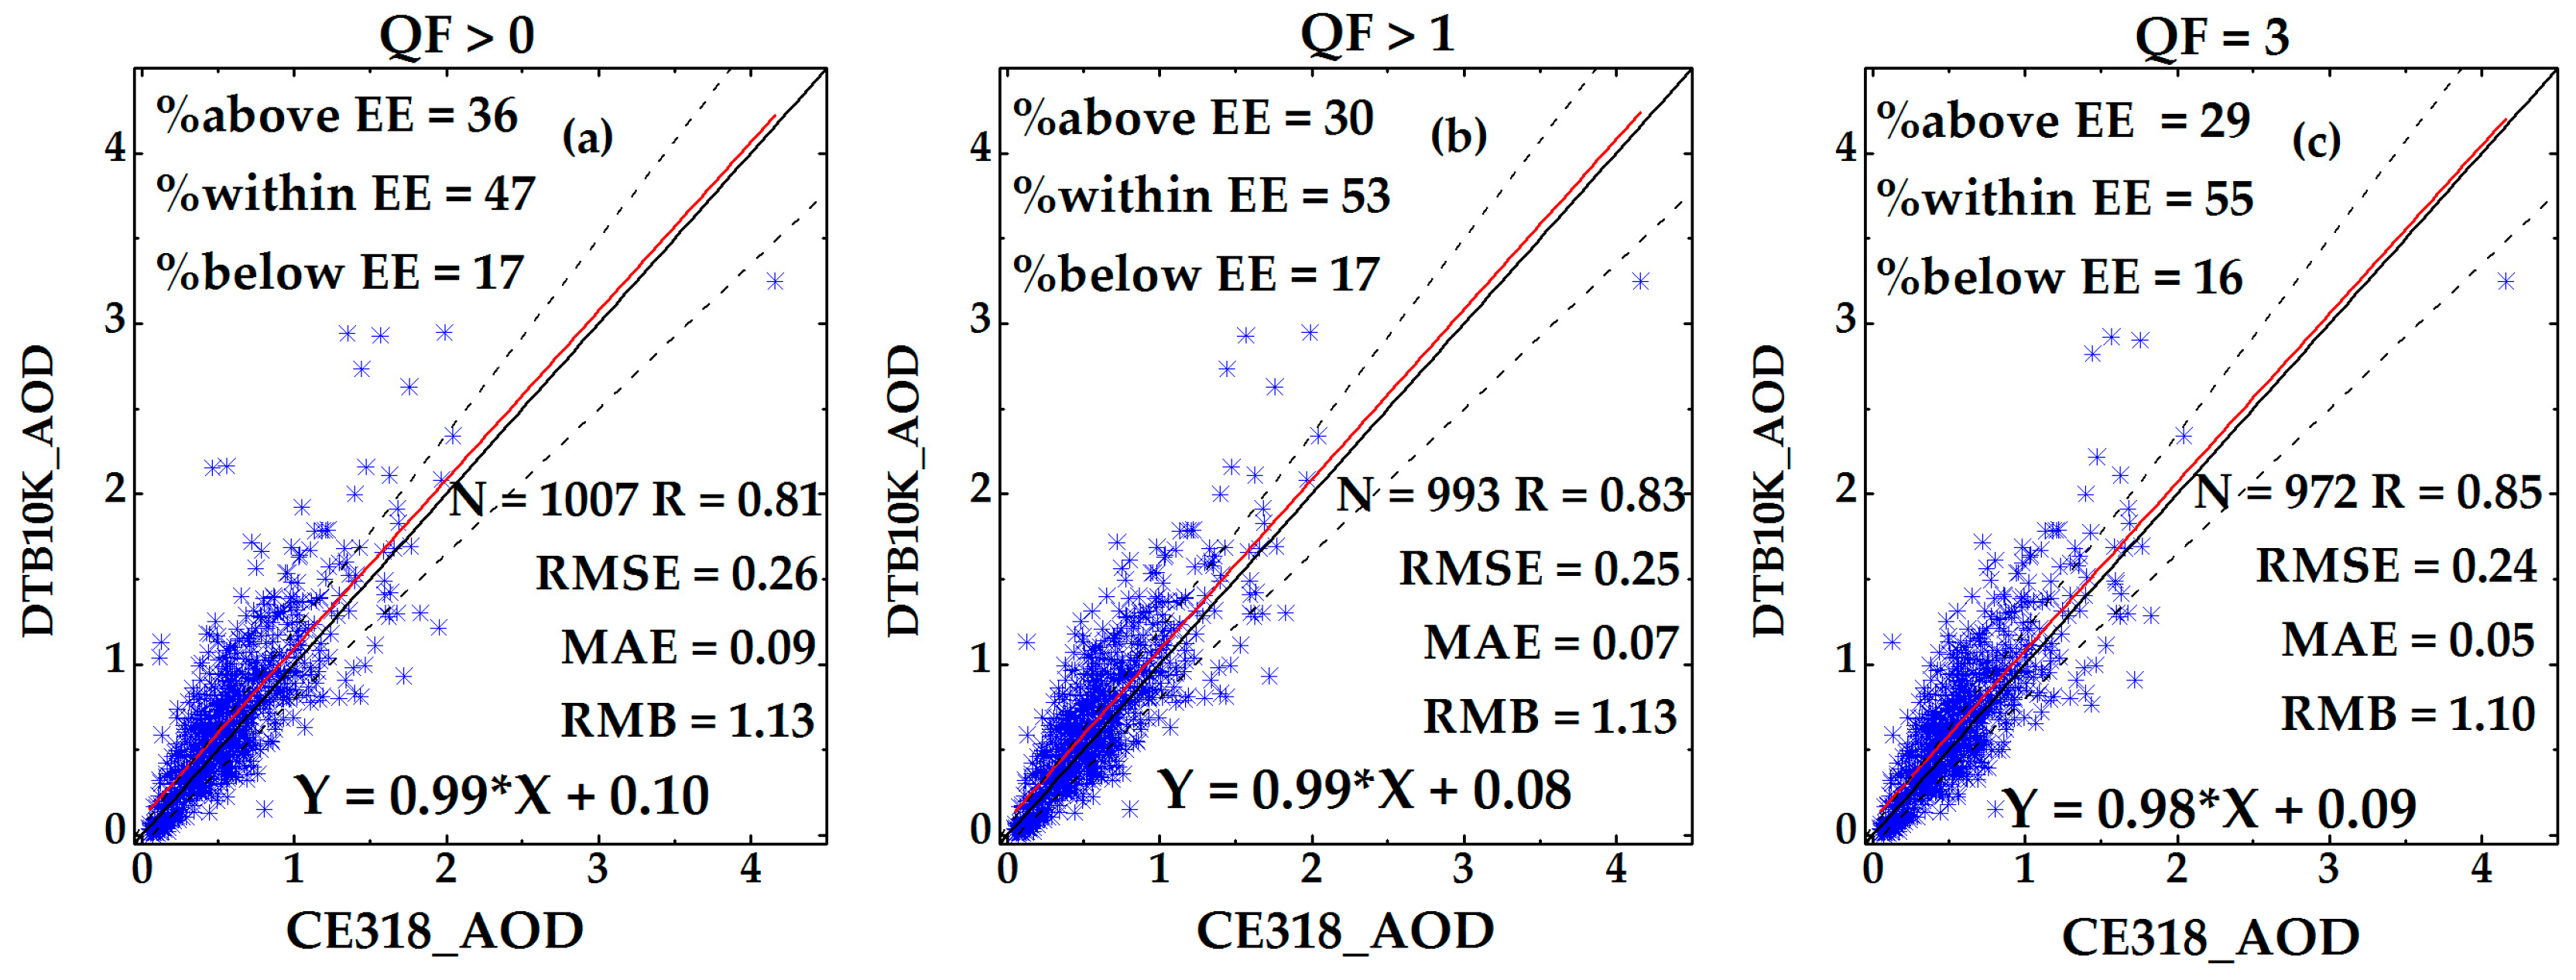
Figure 5 also reports the validation of the DTB10K against the CE318 AOD retrievals for QF > 0 (N = 1007), QF > 1 (N = 993) and QF = 3 (N = 972), respectively. Obviously, with the improvement of the quality flags, the DTB10K AOD retrievals are better matched with the CE318 observations. For example, the R values increase from 0.81 to 0.85, the MAE values decrease from 0.09 to 0.07 and more AOD retrievals fall within the EE (55%). Besides, as analyzed in Section 2.1, the DTB10K AOD is a set of combined data by using the DT and DB algorithms in different surface reflectance. It can be retrieved over vegetated and bright land surfaces. For this reason, compared to other high-quality Aqua-MODIS C6 products (Figure 2c and Figure 4c), the high-quality DTB10K retrievals perform best, i.e., the R and the percentage within the EE (Figure 5c) are increased up to 1–5% and 17–22%, respectively, and the RMSE is decreased by 7%. Besides, the bias is small and positive (0.05), causing an overestimation of 10%. However, larger overestimations were reported by [21] at Beijing_RADI (21%) and Beijing_CAMS (26%) sites. For the individual comparison at each site of YRB (Table 6), approximately 19% of the DTB10K AOD retrievals are underestimated with a negative MAE (−0.07) at KM; the best performance appears at WH.
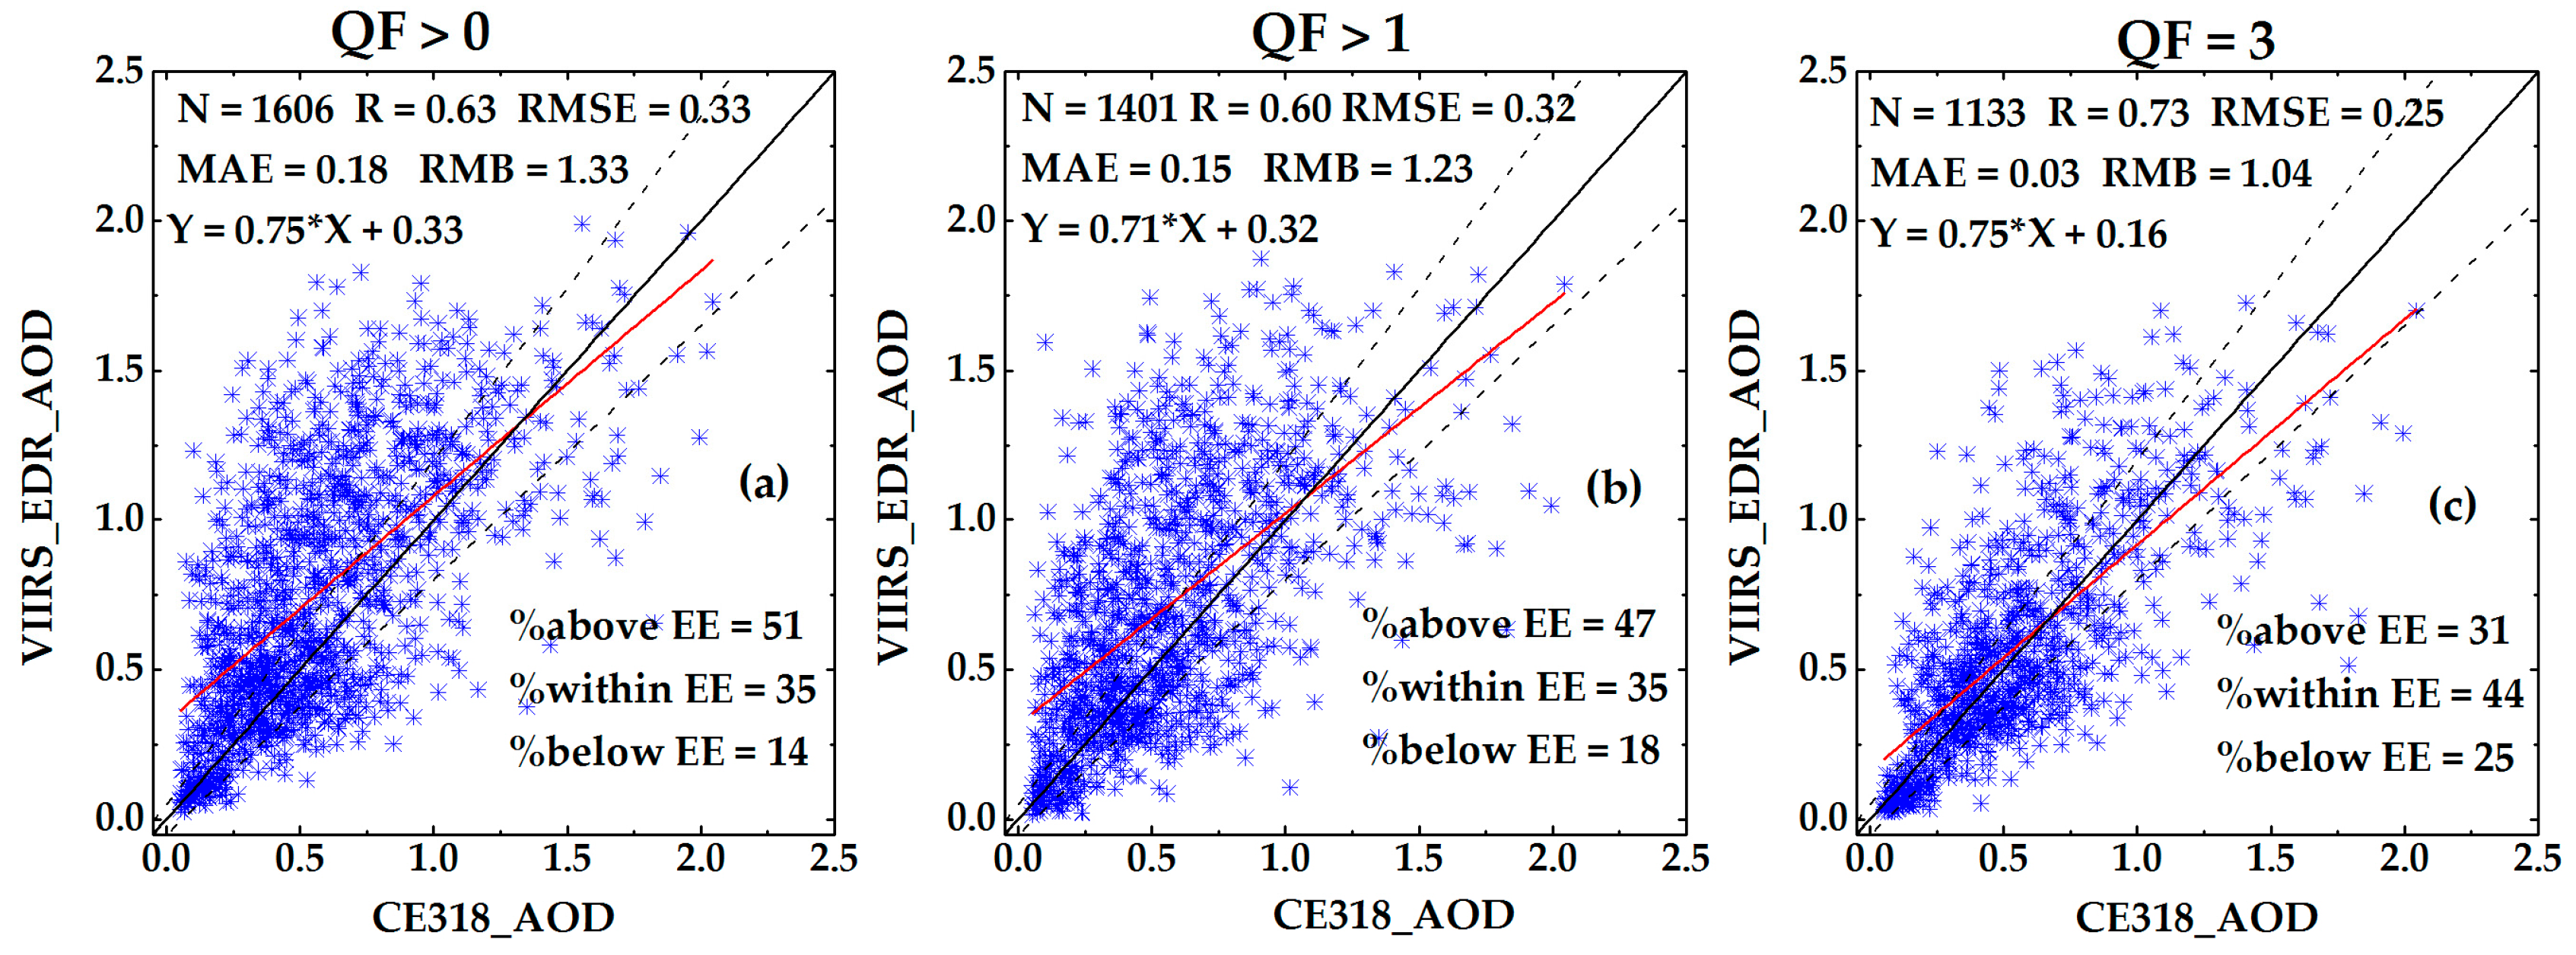
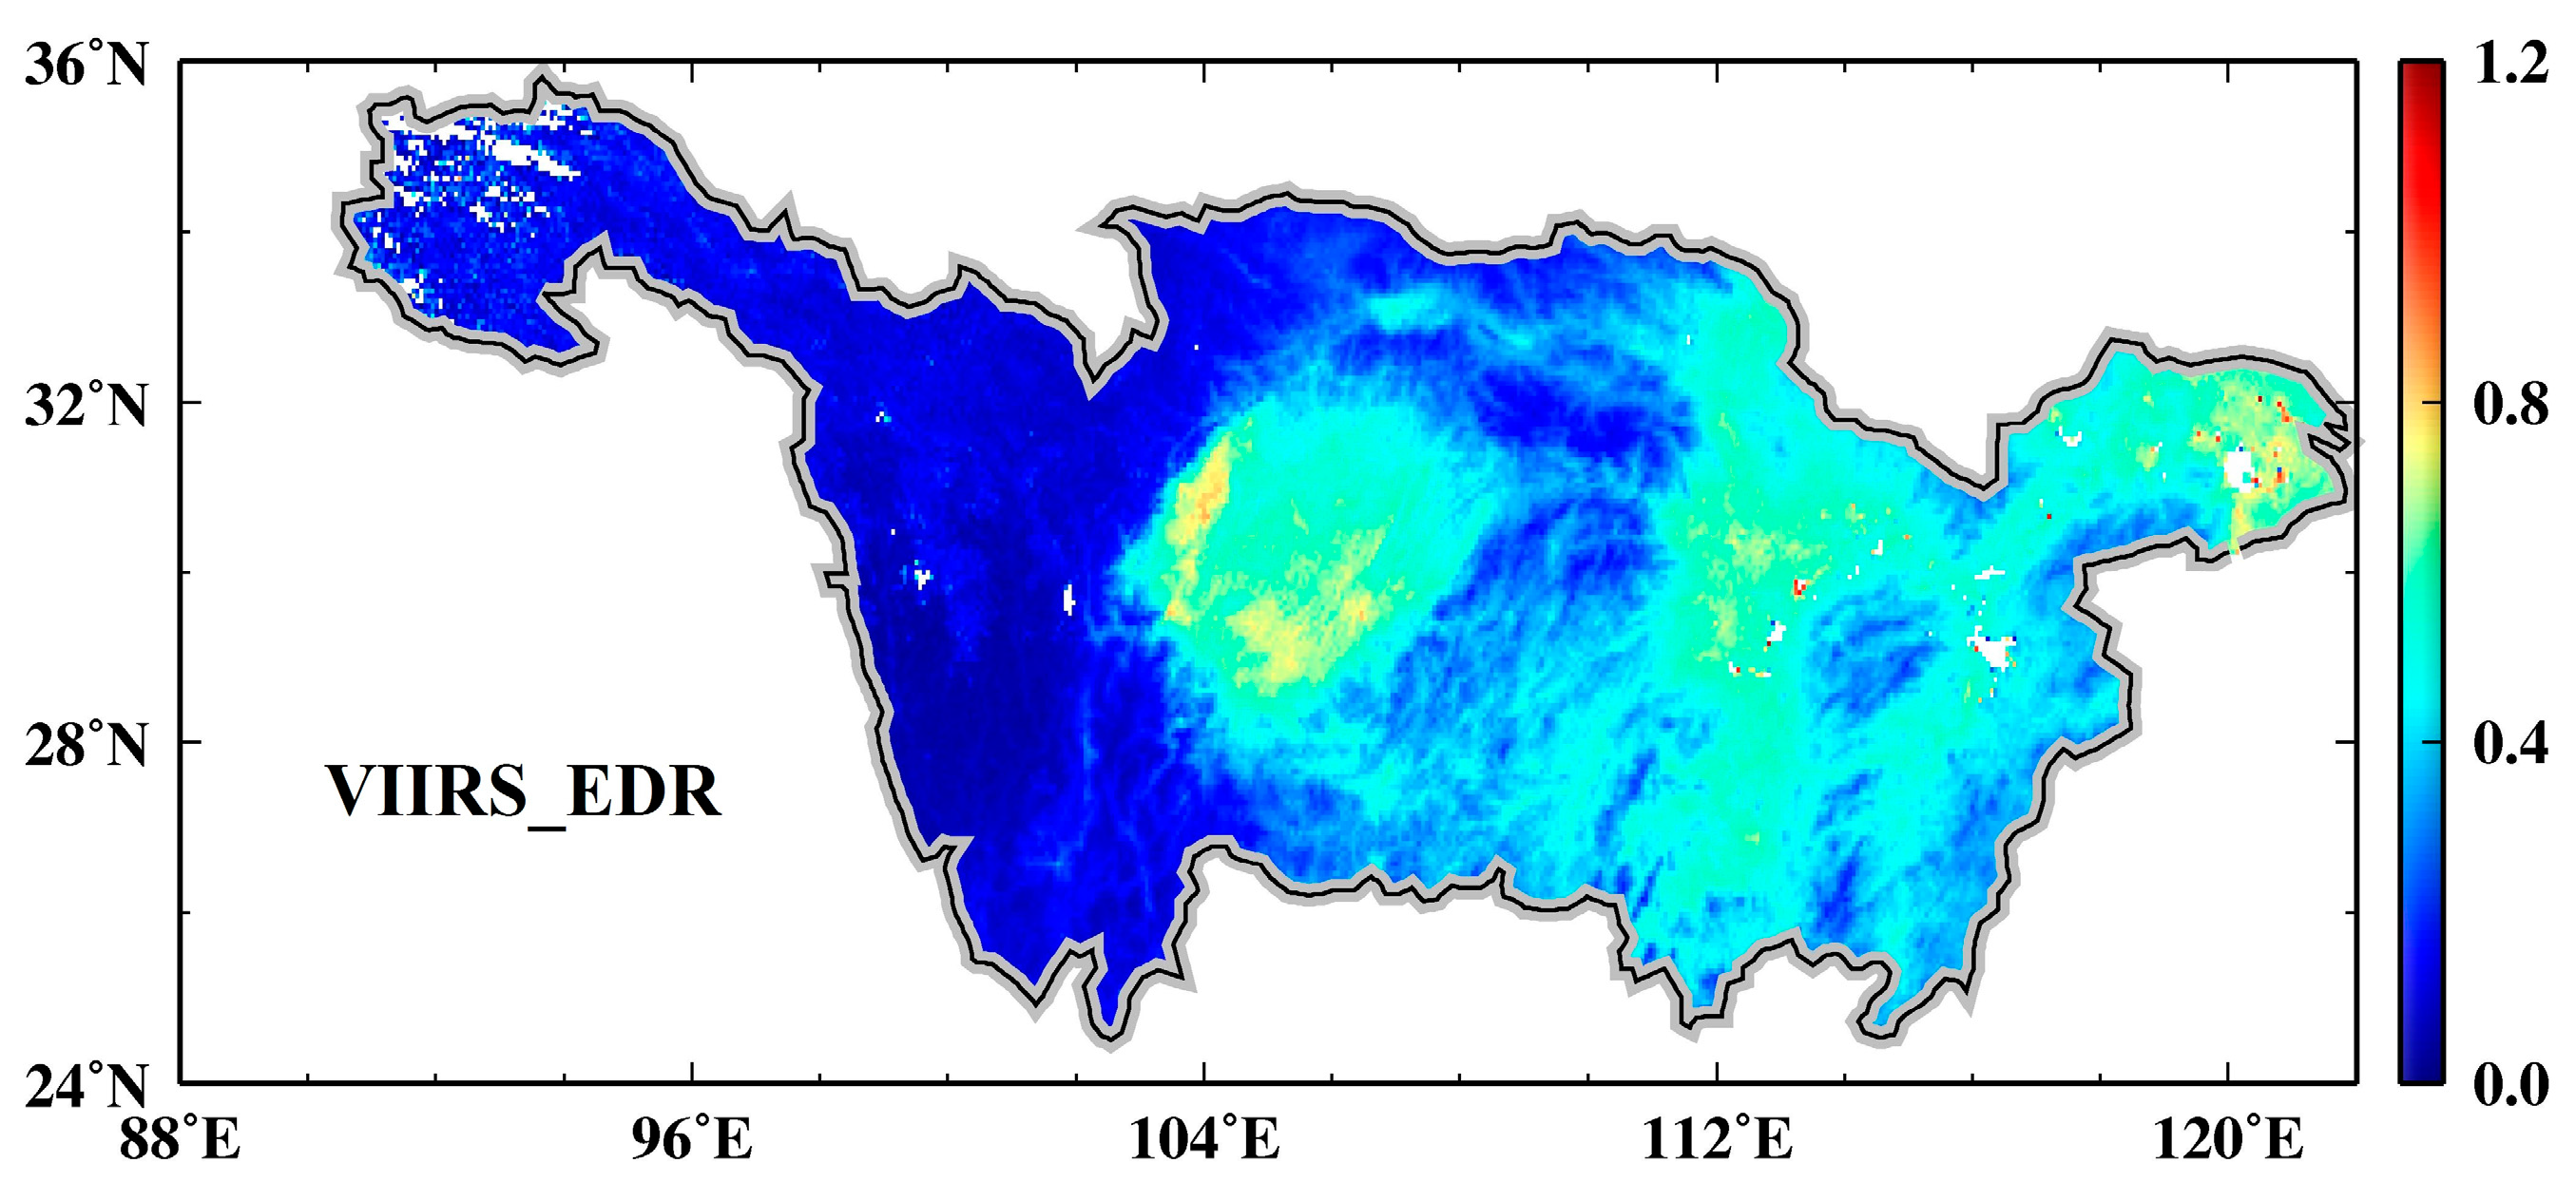
In Figure 6, a total of 1606, 1401 and 1133 VIIRS_EDR-CE318 AOD retrievals successfully performed over YRB, respectively, for QF > 0, QF > 1 and QF = 3. Different from the results of quality flag analyses of the Aqua-MODIS C6 AOD products, filtering by OF > 1, the VIIRS_EDR retrievals are not significantly improved for all statistical metrics. However, constraining to only high-quality flag (QF = 3), the significant improvement occurs, i.e., the R and the percentage of retrievals within the EE are increased up to 16% and 26%, respectively, and the RMSE is decreased by 24%.The same quality flag results can be found at each site over YRB (Table 7). This indicates that the high-quality VIIRS_EDR product is recommended for aerosol application over the YRB. Besides, compared to all high-quality Aqua-MODIS C6 products (Figure 2c, Figure 3c, Figure 4c, Figure 5c), although the number of the high-quality VIIRS_EDR-CE318 matchups (Figure 6c) is increased up to 16–68%, the R (0.73) and the percentage of the retrievals within the EE (44%) are decreased by 10–14% and 4–20%, respectively. The results demonstrate that the robustness of the VIIRS_EDR retrieval algorithm needs to be improved. Additionally, nearly 31% of the high-quality retrievals fall above the EE, causing 4% overestimation compared to the CE318 observations. The bias (0.03) is consistent with previous research over East Asia (0.05) [13], but slightly larger than that over global land (−0.01) [6]. This reason is explained in Table 7. HF, WH and KM are all urban ground sites, so it is inappropriate to replace the surface reflectance of an individual site with the global averaged surface reflectance. In Table 7, there is a better performance of VIIRS_EDR-CE318 retrievals at WH compared to those at the other sites, with a higher R (0.76), more retrievals within the EE (61%) and a slightly negative bias (−0.06). Similar results were also reported by [28] at WH with 52% of retrievals within the EE and an underestimation of about 5%.
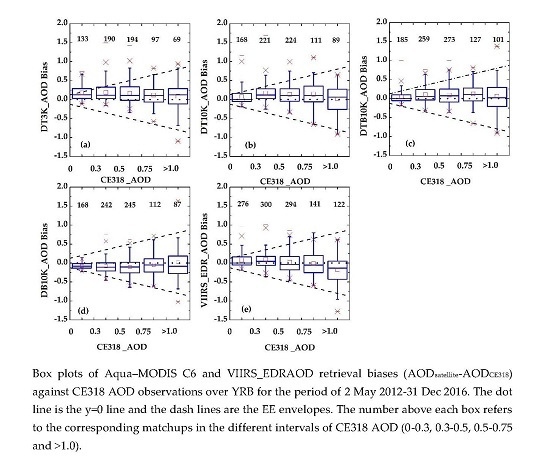
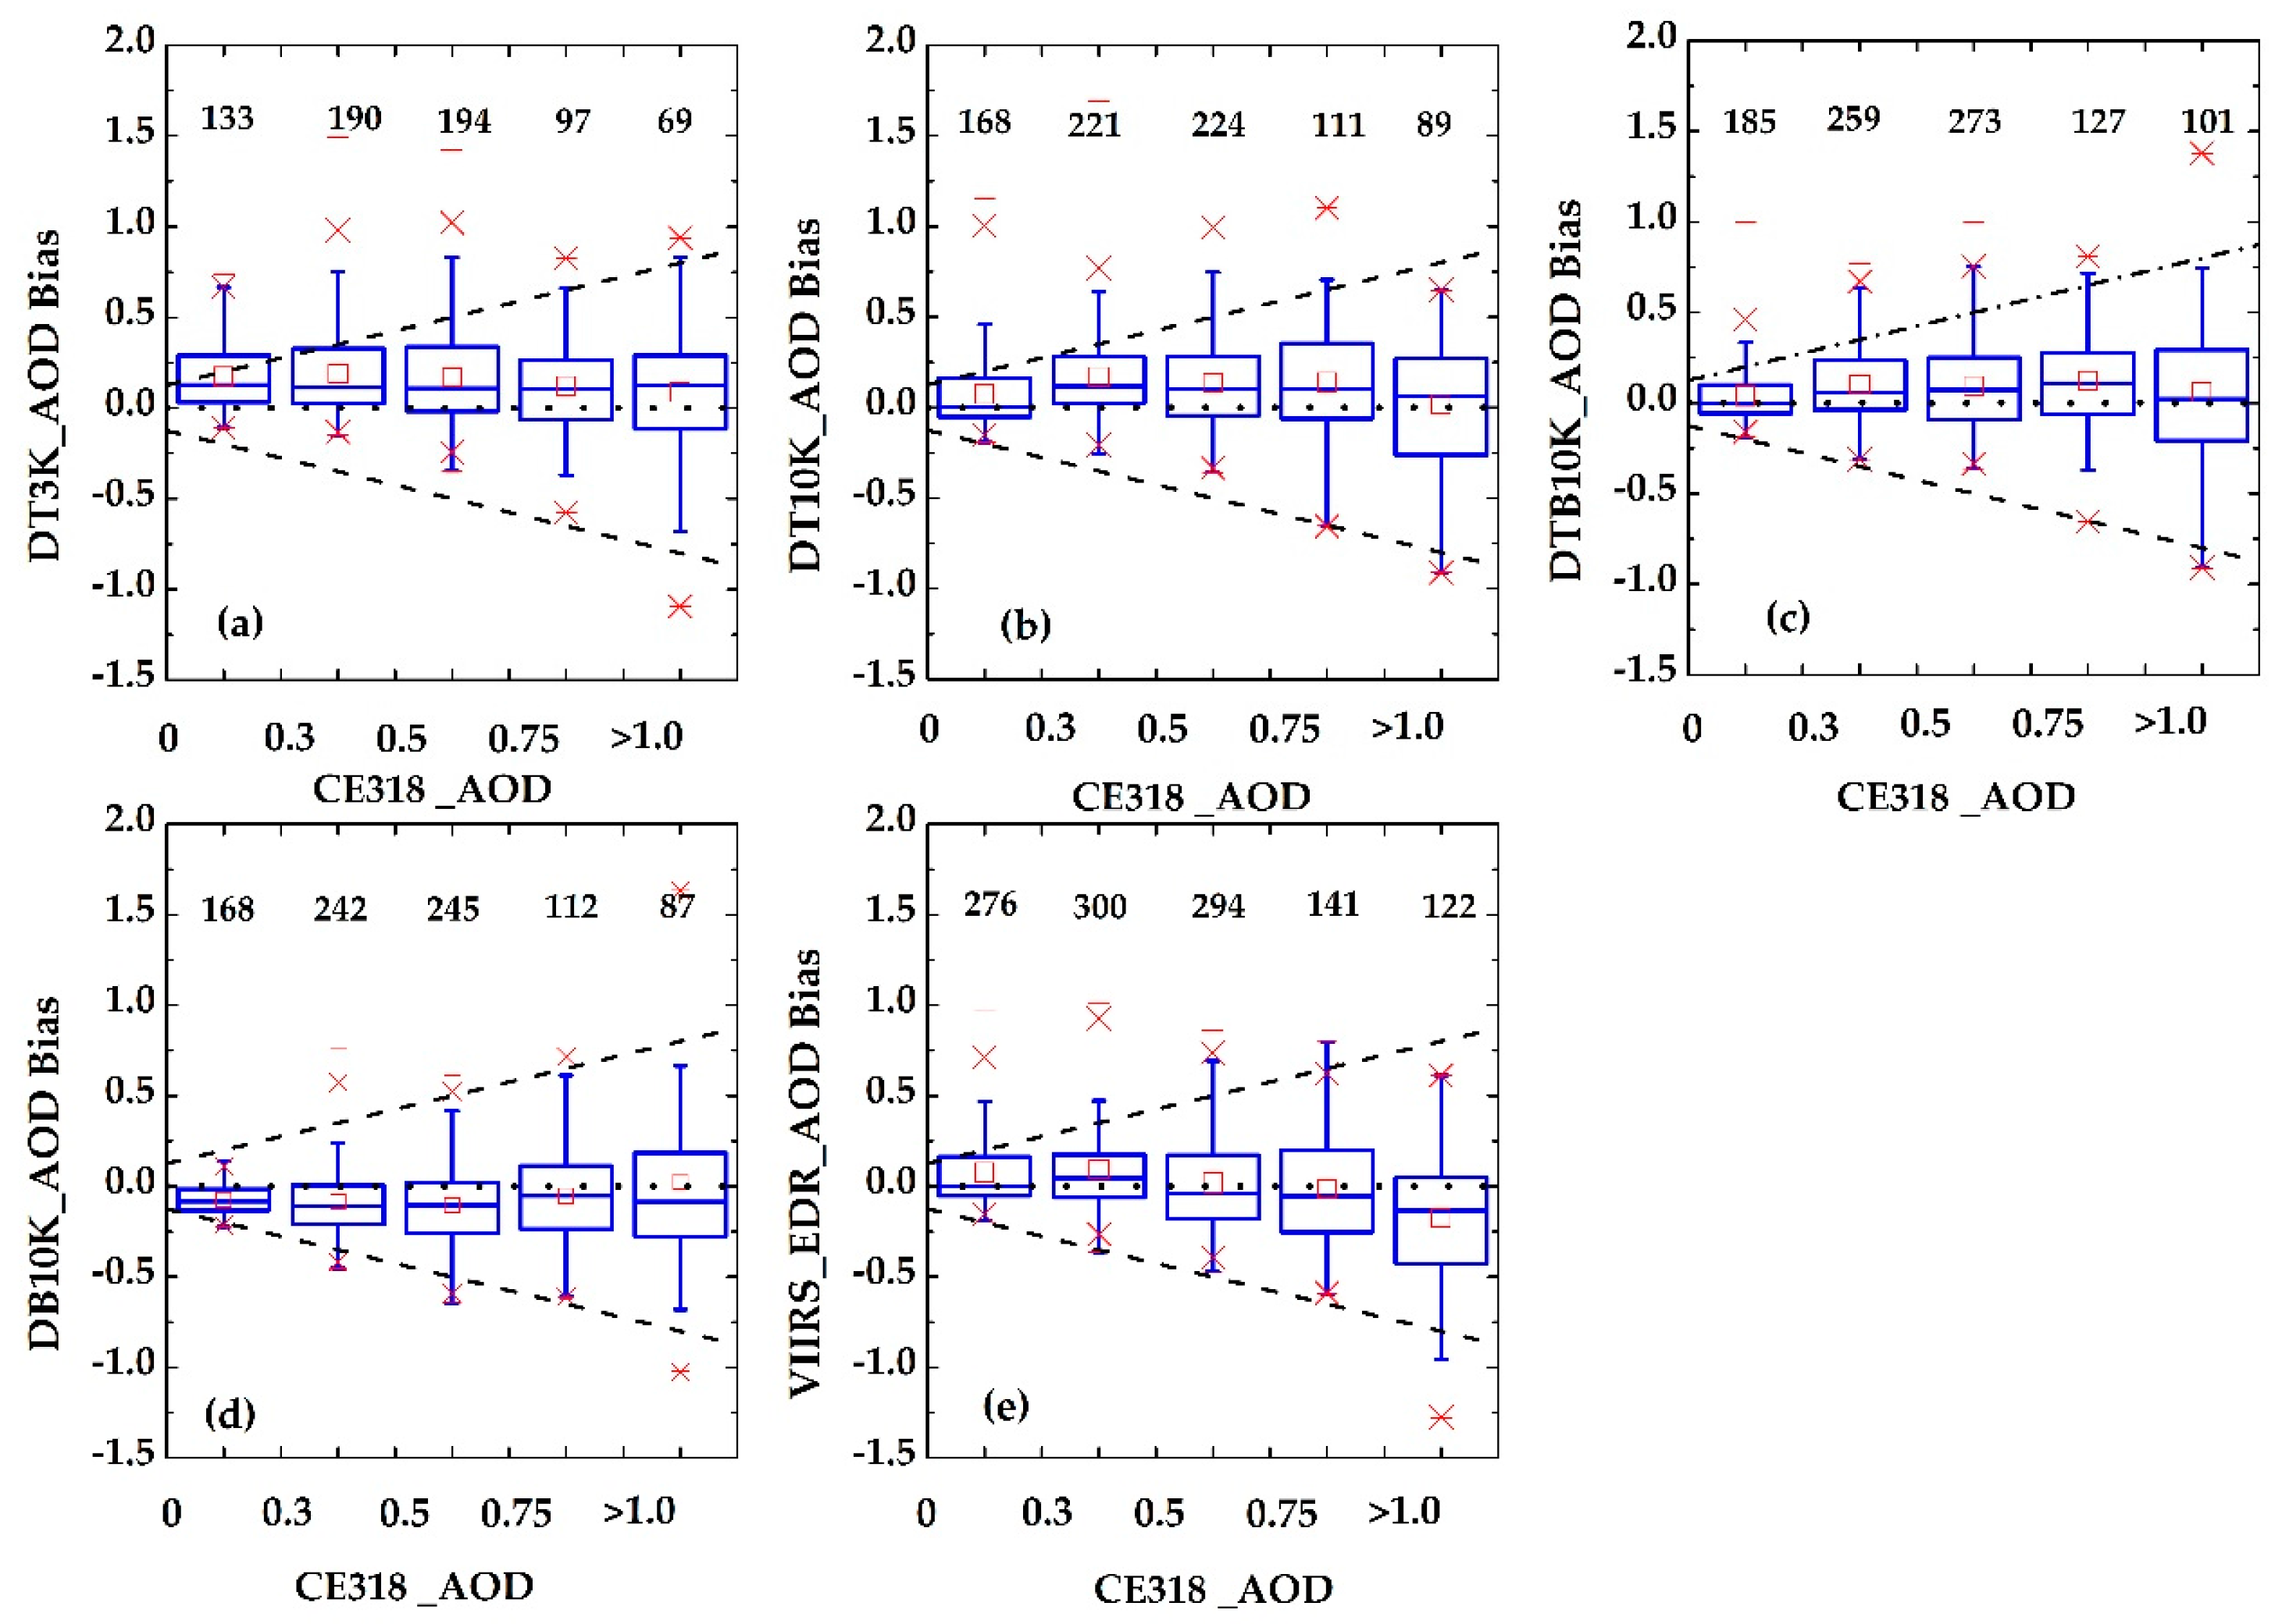
Figure 7 shows the boxplots of the high-quality AOD biases (AODsatellite-AODCE318) against the CE318 observations over YRB from 2 May 2012 to 31 December 2016. Overall, for DT3K (Figure 7a), DT10K (Figure 7b) and DB10K (Figure 7c) retrievals, the AOD biases are usually greater than zero, and become larger with an increase in CE318 AOD values. This is consistent with previous global and regional evaluations [13,36]. In other words, the MODIS C6 DT and DTB products overestimate the AOD retrievals compared with the CE318 AOD observations over the YRB. However, there is an opposite trend for the DB10K AOD bias (Figure 7d). Generally, the DB10K AOD retrievals tend to be underestimated at CE318 AOD < 1.0 and slightly overestimated at AOD > 1.0. As for VIIRS_EDR AOD (Figure 7e), it matches well with CE318 AOD observations in the range of less than 1.0. But, there is an underestimation for CE318 AOD > 1.0. A similar evaluation was also analyzed at WH by [28].

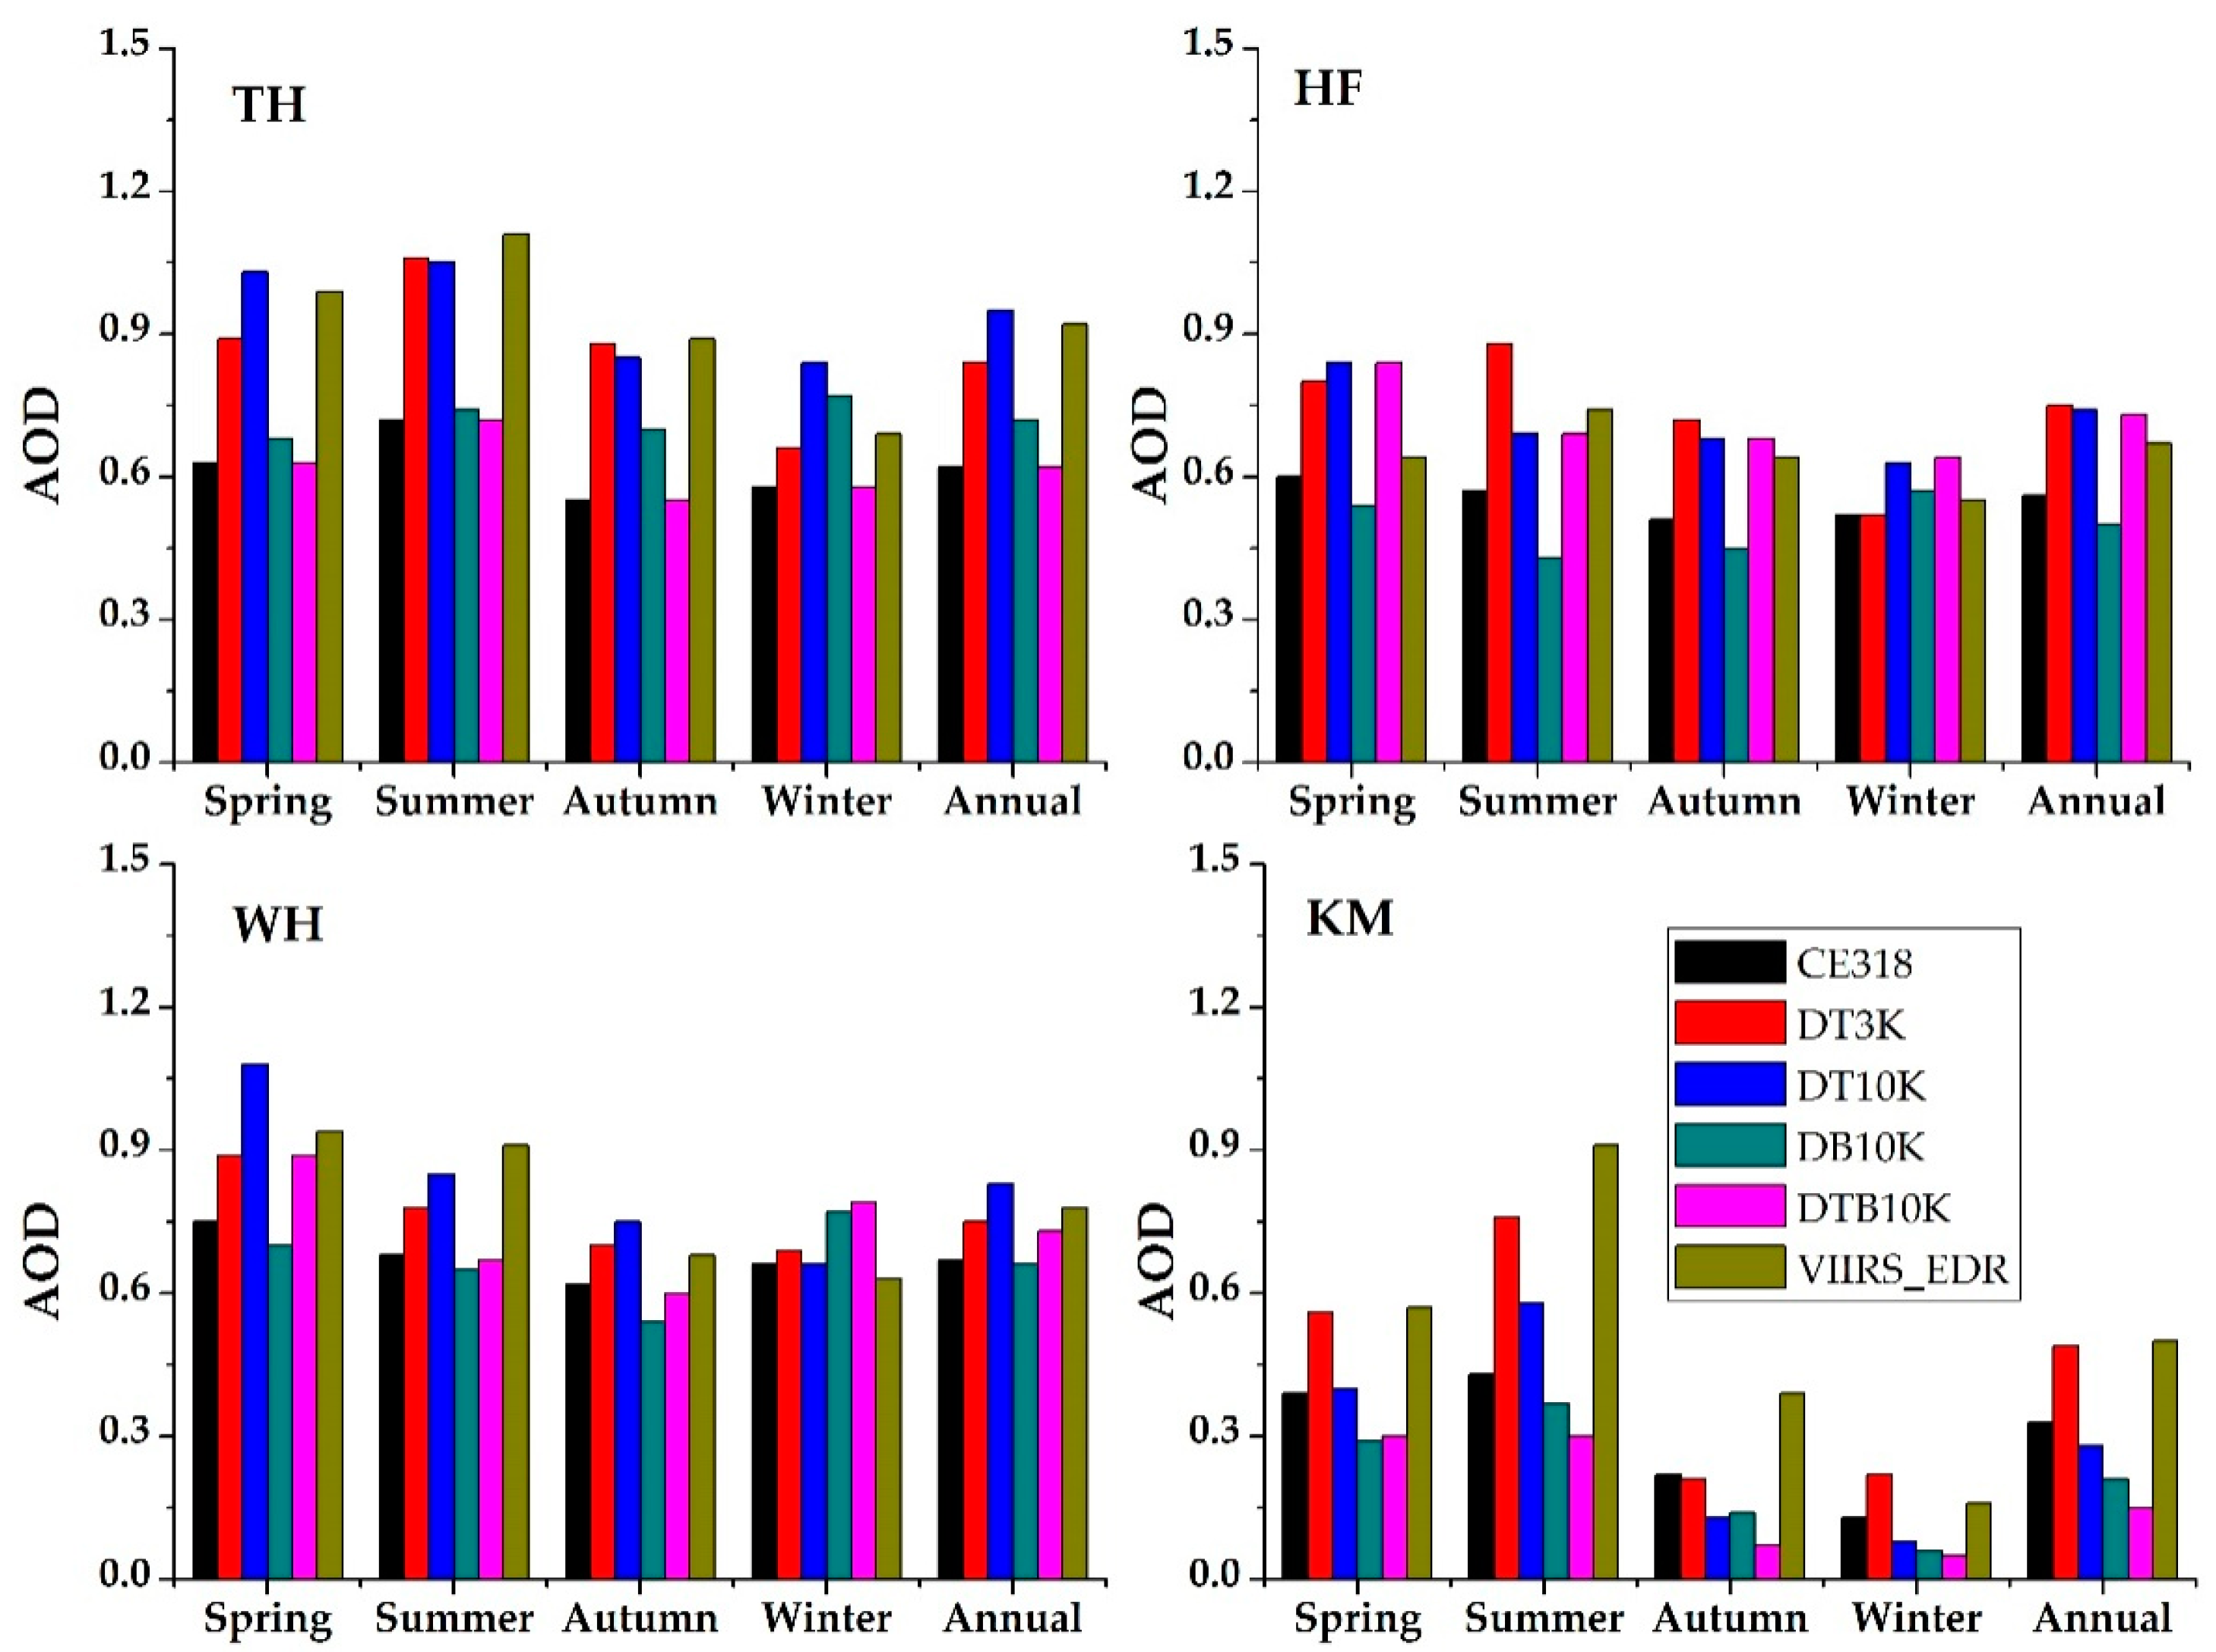
3.2. Seasonal Variation of AOD Retrieval Bias

Figure 8 illustrates the AOD seasonal variation of the high-quality satellite retrievals and CE318 observations, respectively at TH, HF, WH and KM from 2 May 2012 to 31 December 2016. Overall, for each AOD product at every ground site, the higher AOD values appear in spring and summer than the autumn and winter. Similar findings were observed by [35] at WH and by [18] over the YRB. The reason is likely that there are frequent dust events from North China in spring and local straw burnings in summer. Besides, since the VIIRS retrieval algorithm is based on the joint heritage of the Aqua-MODIS DT algorithm [6,7,8], the DT10K and DT3K AOD retrievals act similarly to those of the VIIRS_EDR product for all seasons at TH, HF and WH. However, it doesn’t appear at KM. The reason may be the differences of aerosol type and surface reflectance between KM and the other sites [32].
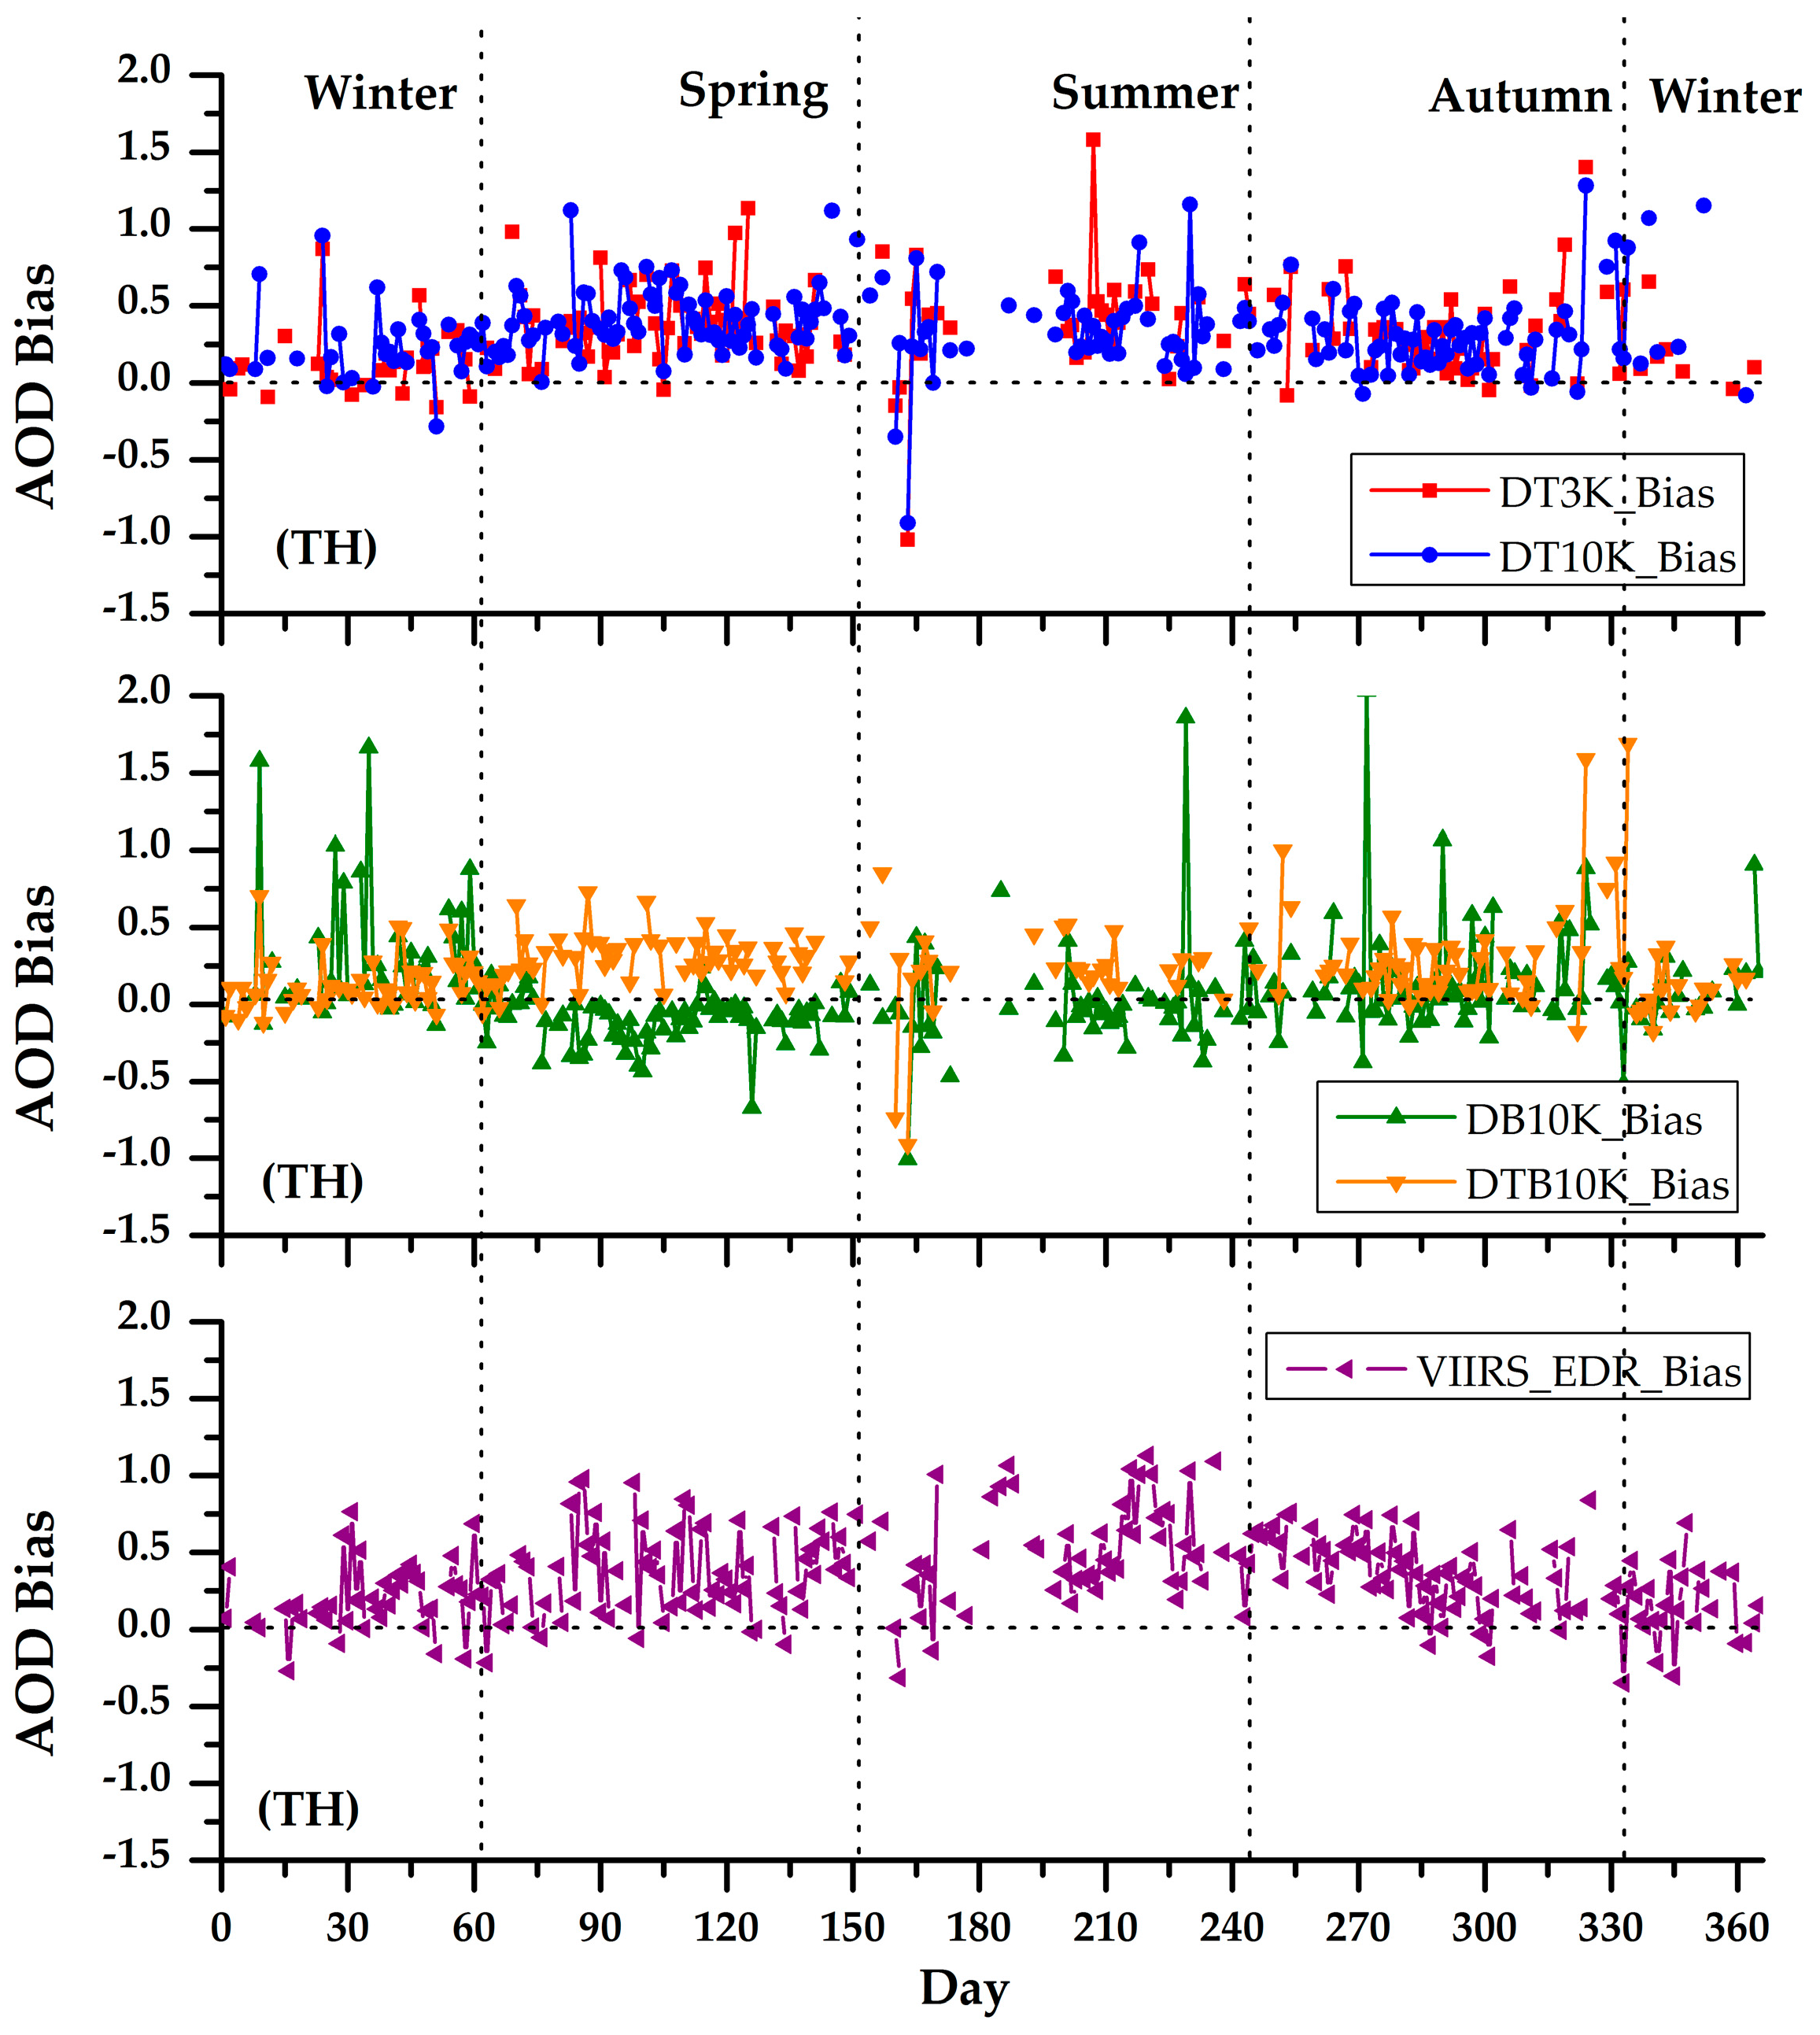
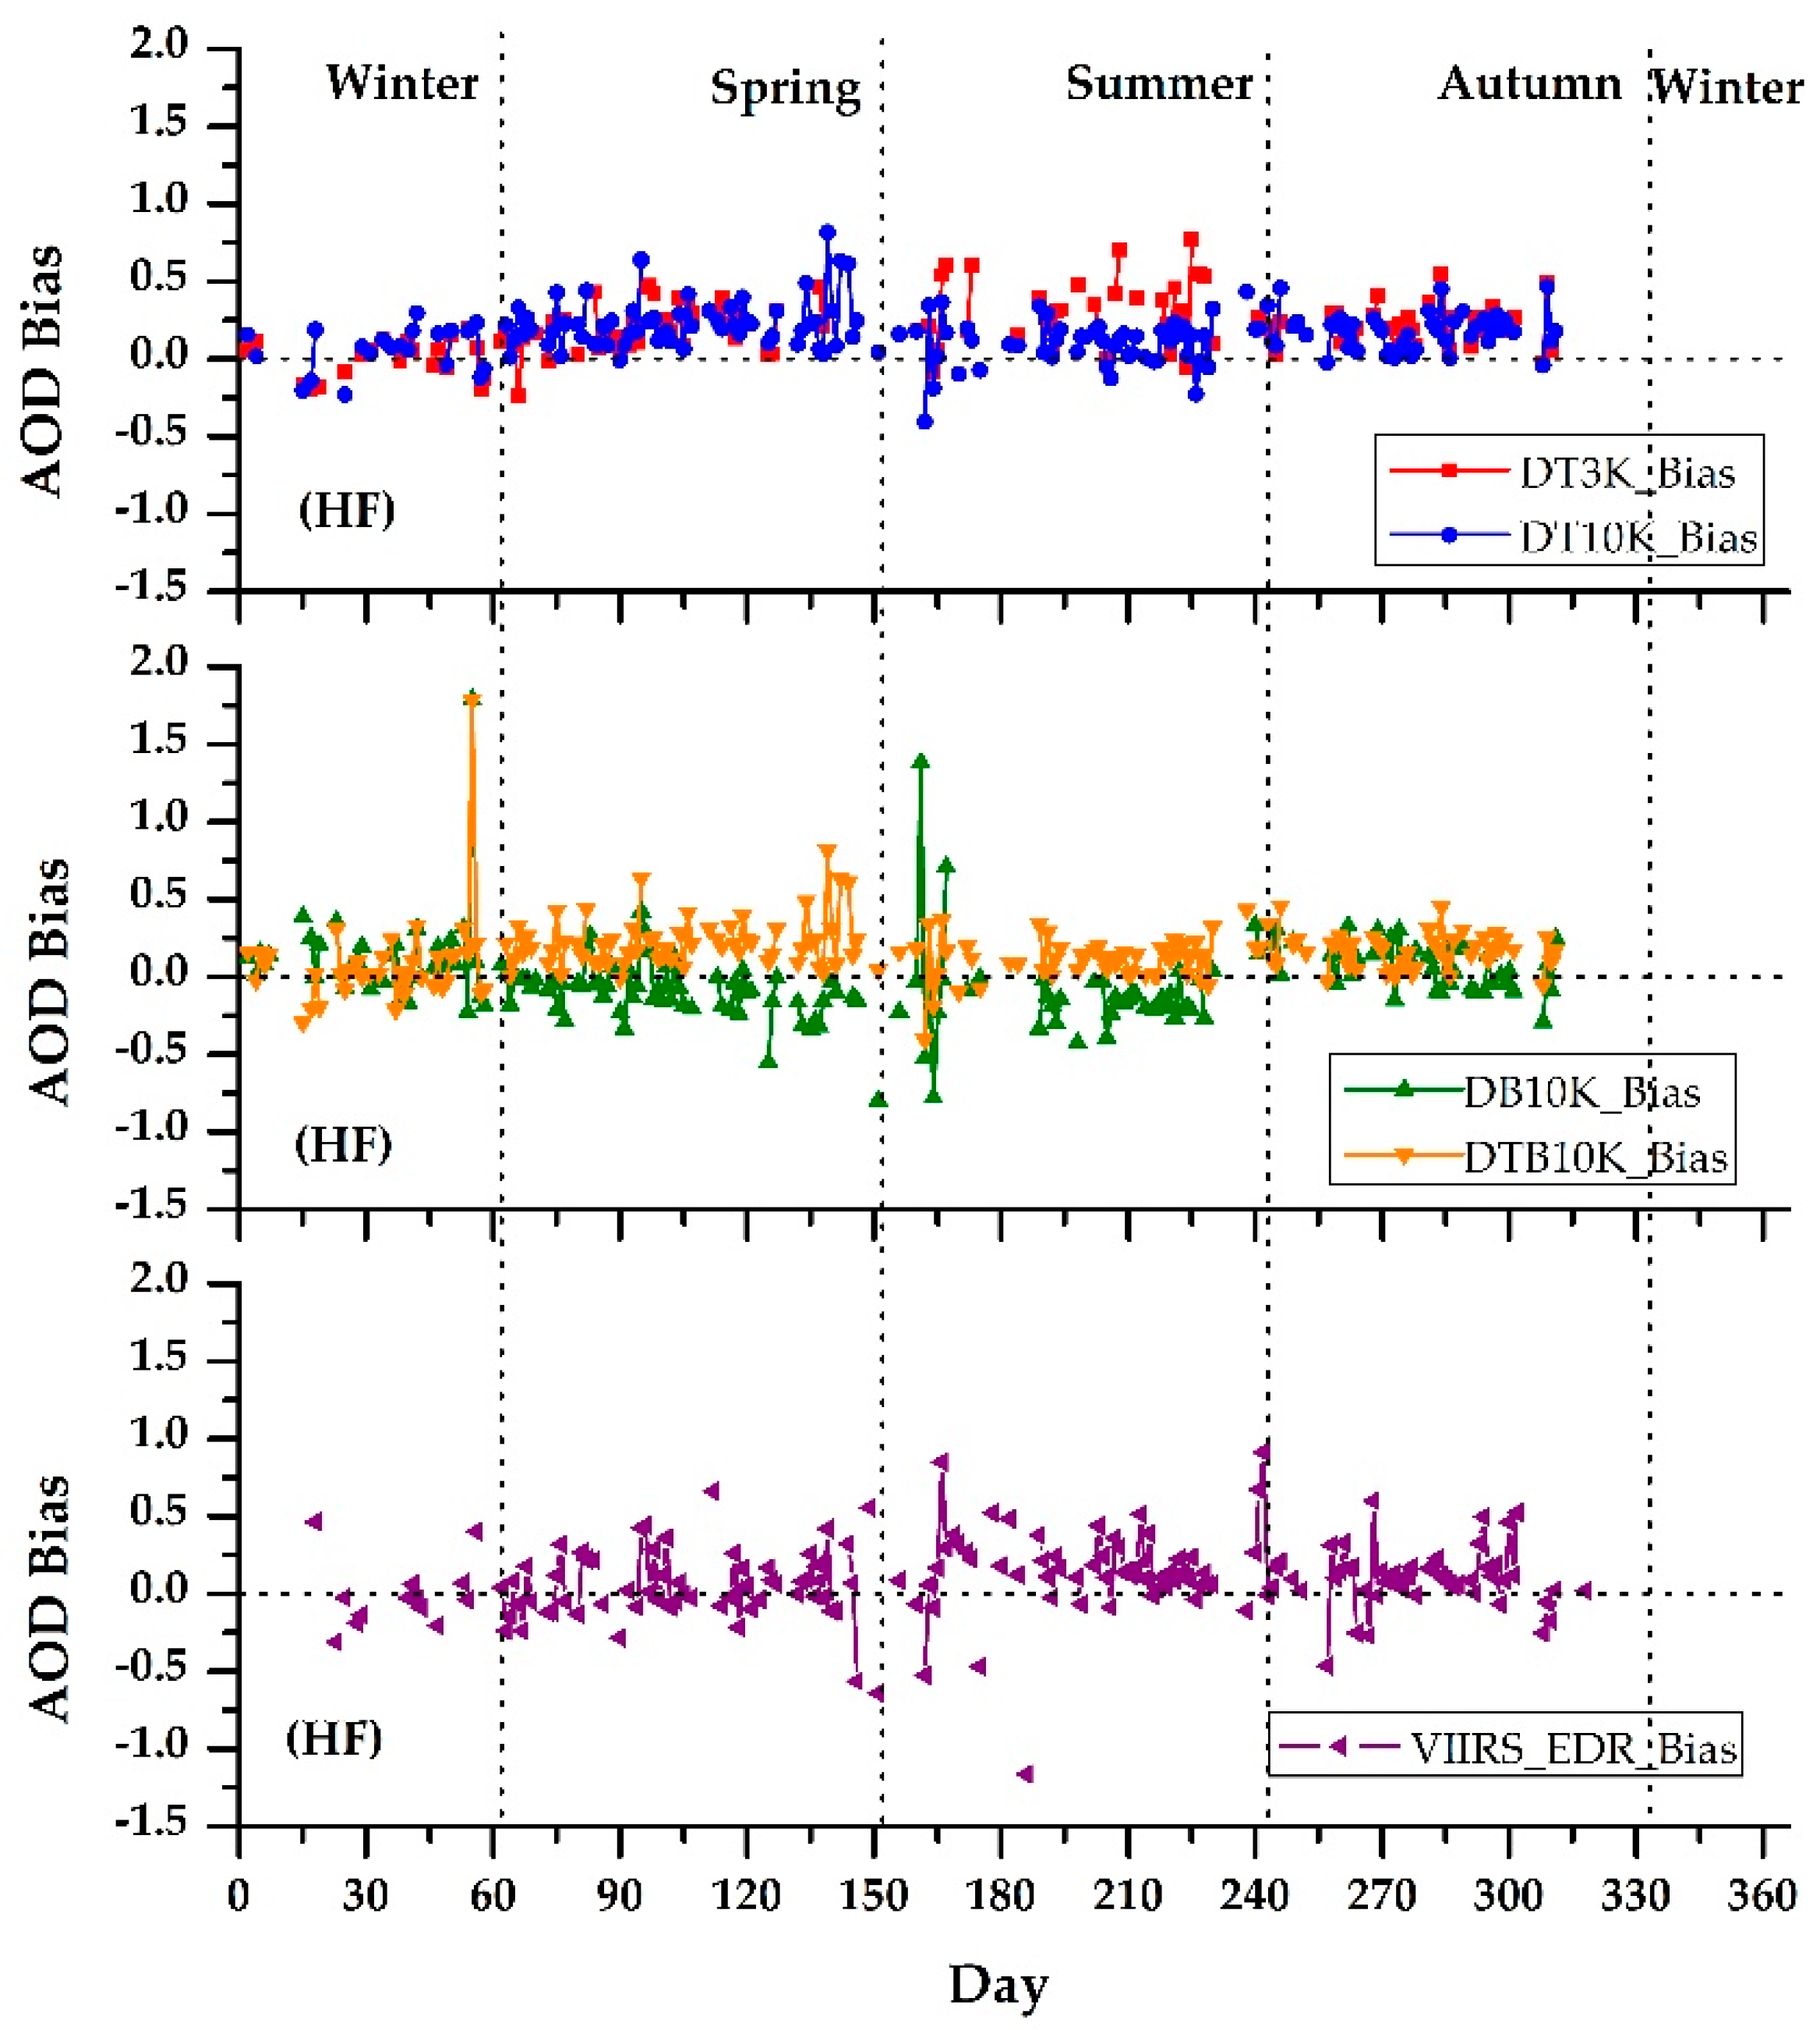
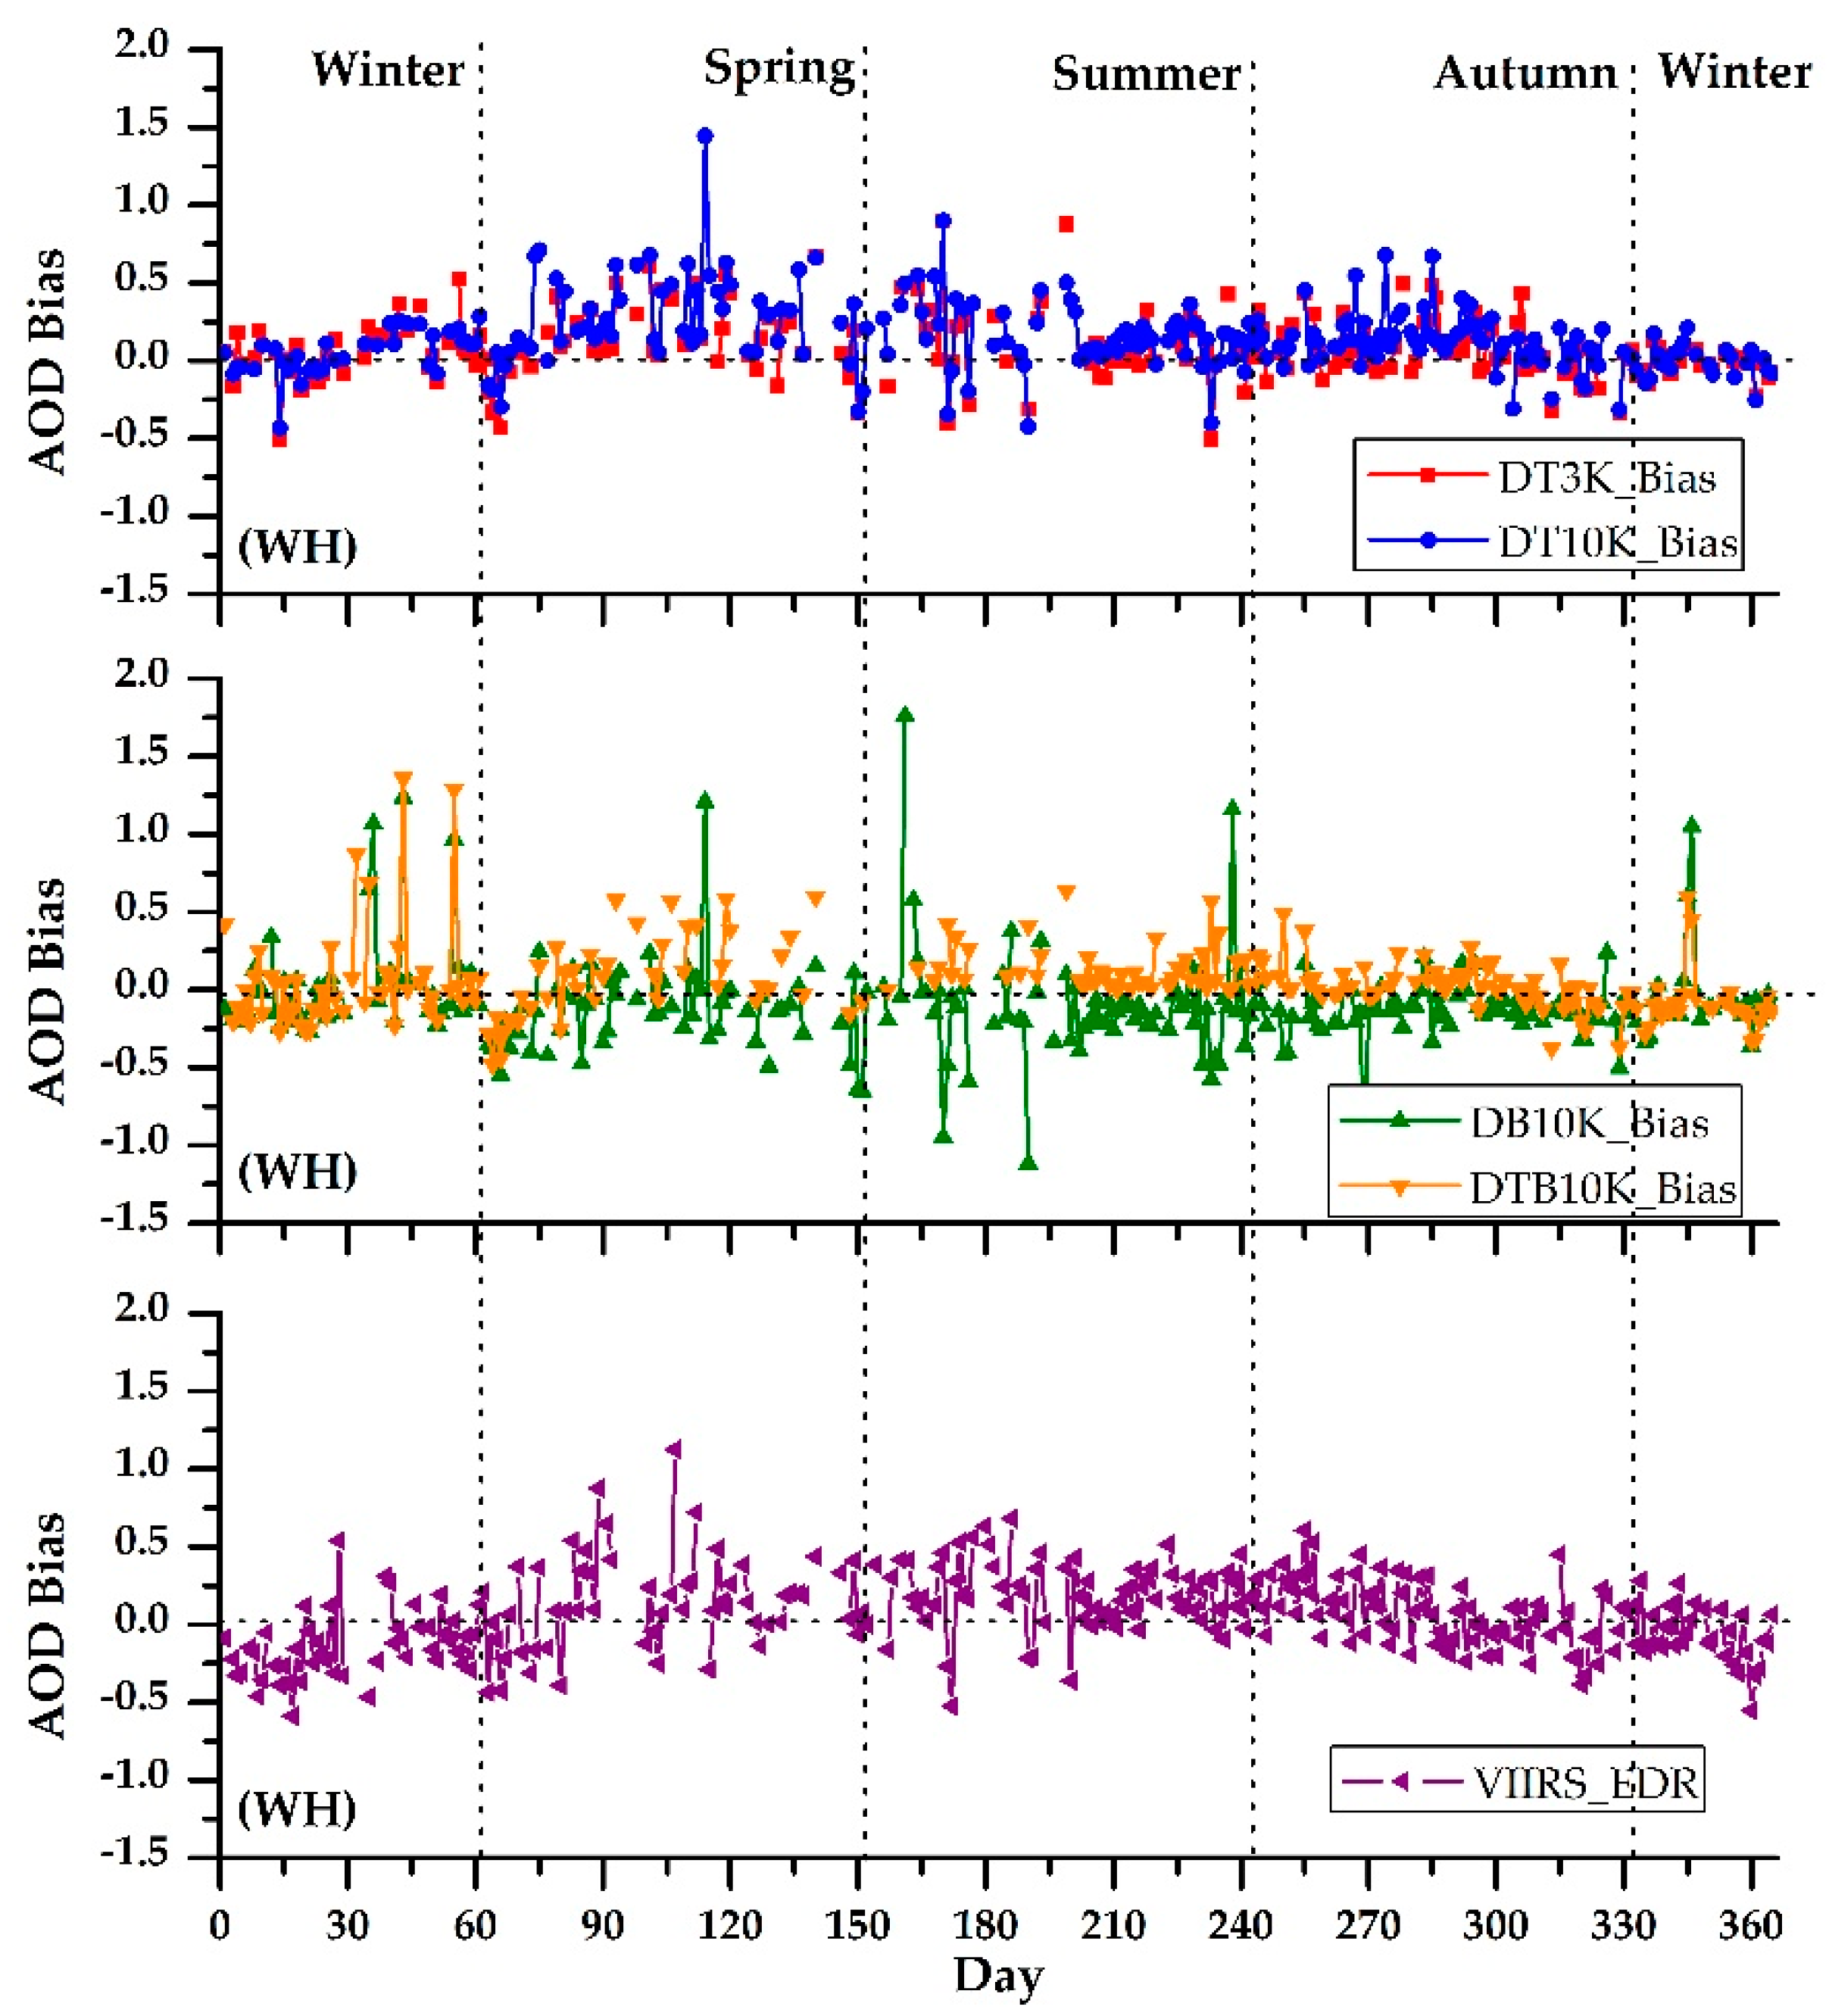
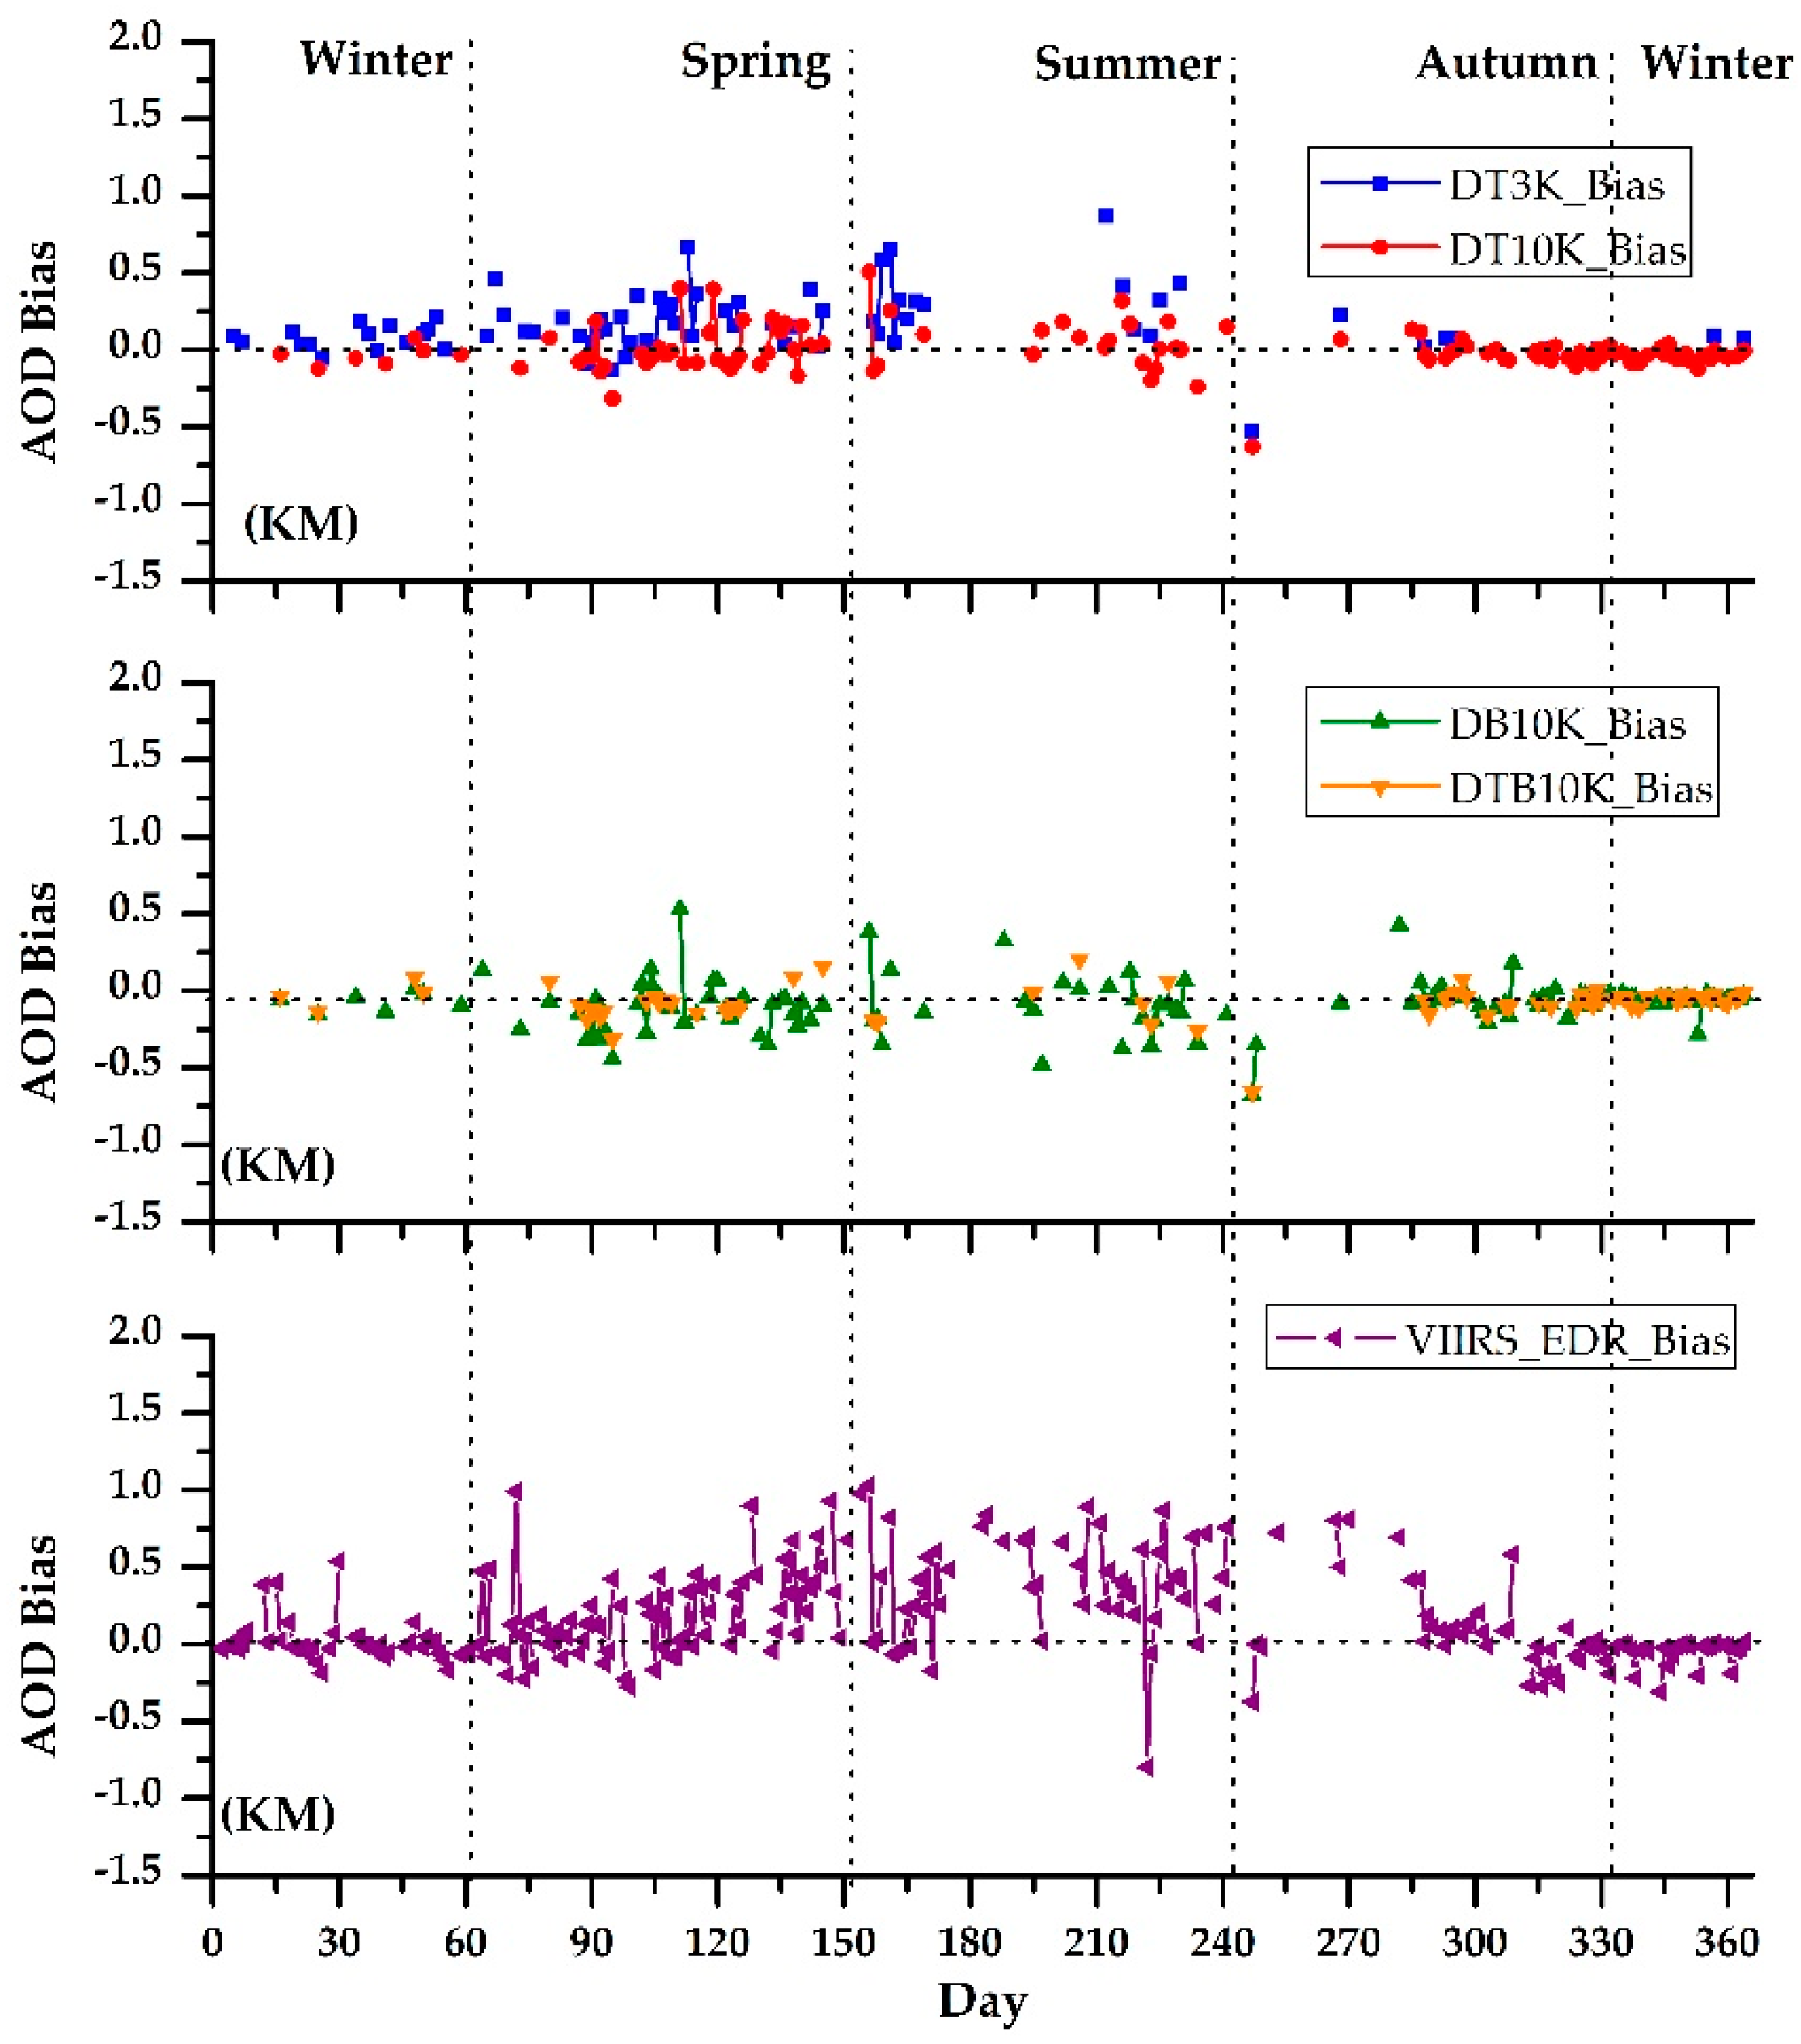
In order to have a good knowledge of the influence of the seasons on the satellite retrievals, according to [32], the daily mean Aqua-MODIS C6 (DT, DB and DTB) and VIIRS_EDR retrieval biases (AODsatellite-AODCE318) have been performed over TH (Figure 9), HF (Figure 10), WH (Figure 11) and KM (Figure 12) for the period of 2 May 2012–31 December 2016. Notice that in order to decrease the interference of the surface reflectance, the satellite-CE318 retrieval biases are selected only during AODCE318 > 0.4.
As illustrated in the middle and lower reaches of the YRB (TH, HF and WH), there are similar seasonal variations for the same satellite retrieval bias (Figure 1, Figure 2, Figure 3, Figure 4, Figure 5, Figure 6, Figure 7, Figure 8, Figure 9, Figure 10 and Figure 11). Despite few exceptions, the Aqua-MODIS C6 DT (3 km and 10 km) retrieval biases are almost positive for the whole year, and become larger in spring and summer. By contrast, the DB10K retrievals are easily underestimated in spring and summer, and overestimated in autumn and winter. Similar seasonal variations of the Aqua-MODIS C6 DT and DB AOD retrievals were analyzed in Eastern China by [32]. Besides, as for the DTB10K retrievals, the positive biases do not exhibit obvious seasonal variations, and are smaller than the other MODIS C6 products. This demonstrates that the combined DTB product is more suitable for retrieving AOD values over the YRB compared to the individual DT and DB algorithms. However, the VIIRS_EDR shows larger bias than the MODIS C6 retrievals, and tends to overestimate the AOD retrievals in summer and underestimate in winter. Huang et al. [7] also reported a similar seasonal variation of the VIIRS_EDR retrieval bias over global land. The reason is somewhat attributed to the seasonal surface reflectance changes [6,7].
As shown in Figure 12 the seasonal variation of the VIIRS_EDR retrieval bias at KM, is similar to those in the middle and lower reaches of YRB. However, there is a notable change for Aqua-MODIS C6 AOD retrievals at KM. Different from the overestimation during winter in the middle and lower reaches of YRB, the DB10K retrievals show continuously negative biases all the year round in KM. Meanwhile, the DTB10K AOD bias switches from positive at TH and HF to slightly negative at KM for the whole year.

4. Discussion

The spatial distribution of the Aqua-MODIS C6 and VIIRS_EDR AOD retrievals (QF = 3) are performed, respectively in Figure 13 and Figure 14 over the YRB for the period of 2 May 2012–31 December 2016. The transparent areas refer to where there are no retrievals. As clearly shown in Figure 13 and Figure 14, there are different missing patterns for each AOD product, probably due to their different retrieval algorithm. The Aqua-MODIS C6 DT and DTB products can retrieve AOD values over inland water with few missing data, while there are no high-quality retrievals for the DB10K and VIIRS_EDR products over inland water such as the Taihu Lake and Dongting Lake. However, over the plateau areas of the upper reaches of the YRB, the high-quality VIIRS_EDR retrievals provide better performance than all the Aqua-MODIS C6 products.
As shown in Figure 13 and Figure 14, there is similar spatial distribution for all the five Aqua-MODIS and VIIRS AOD products over the YRB. Generally, the high aerosol loadings (AOD > 0.8) appear in the YRD, Sichuan Basin and the middle reaches of the YRB, mainly due to the intensive industrial and urban activities. While the low values (AOD < 0.4) are usually observed in high mountains of the upper reaches of the YRB. The result is consistent with previous findings over China [17,18]. However, over the areas of the YRB with high aerosol loadings, the VIIRS_EDR retrievals exhibit lower values than the Aqua-MODIS C6 DT and DTB products. Because the AOD retrievals of the VIIRS_EDR product are limited only in the range of 0.0–2.0, it tends to be underestimated over areas with high aerosol loadings, such as the YRD and Sichuan basin [6,7,13]. By contrast, over the upper reaches of the YRB with low aerosol loadings, the VIIRS_EDR product provides slightly higher AOD values. Liu et al. [6] also reported that the VIIRS_EDR retrievals were likely to be overestimated over vegetated surfaces (e.g., the upper reaches of YRB).
In Figure 14, the DT3K retrievals exhibit slightly higher AOD values compared to those of the DT10K product, especially over the YRD and Sichuan Basin. This may be because the DT3K product has the ability to retrieve small-scale AOD values. On the contrary, the small-scale retrievals are likely smoothed by the DT10K product, due to its low spatial resolution. Furthermore, relative to the DT and DTB products, there is a notable underestimation for the DB10K retrievals, especially over the YRD, Sichuan Basin and the middle reaches of the YRB. The result is consistent with the comparison of the DB10K retrievals against CE318 observations in Figure 4.

5. Conclusions

In this study, a comparison of the Aqua-MODIS C6 and VIIRS_EDR AOD products against the CE318 AOD observations was performed during different air quality situations over the YRB for the period of 2 May 2012–31 December 2016. The conclusions are shown as follows.
Apart from some exception at KM, quality flag analyses demonstrated that the high-quality (QF = 3) MODIS C6 and VIIRS_EDR AOD products are recommended for the whole YRB. The best performance was for the high-quality DTB10K AOD product, along with a higher R (0.85) and more retrievals within the EE (55%). However, compared to the Aqua-MODIS C6 AOD products, although there were more matchups, the high-quality VIIRS_EDR AOD retrievals exhibited poor agreement with the CE318 AOD observations (R = 0.73). This result demonstrated that the retrieval algorithm of the VIIRS_EDR AOD product needs to be further improved.
Generally, both DT3K and DT10K AOD products (QF = 3) tend to overestimate the AOD values, respectively with mean overestimations of 23% and 15% over the YRB. The overestimations became larger in spring and summer, probably due to higher aerosol loadings appearing in these seasons. For the DTB AOD product (QF = 3), there was also a slight overestimation of 10% but the positive bias did not exhibit obvious seasonal variations. On the contrary, the DB10K AOD product (QF = 3) showed mean underestimation of 12% over the YRB, but there was a slight overestimation during AODCE318 > 1.0. The seasonal variation analyses exhibited that there was an underestimation (overestimation) in spring and summer (winter and autumn) for the DB product. Different from the MODIS C6 AOD products, the VIIRS_EDR AOD retrievals (QF = 3) exhibited positive biases in summer and negative biases in winter, along with a mean overestimation of 4% over the YRB.
There were similar AOD spatial distributions for all the Aqua-MODIS C6 and VIIRS_EDR products. The high AOD values appeared in the YRD, Sichuan basin and the middle reaches of the YRB, while the low AOD values were observed in high mountains over the upper reaches of the YRB. However, over the regions with high aerosol loadings, the VIIRS_EDR AOD product retrieved lower AOD values than the DT and DTB products. Meanwhile, the VIIRS_EDR product had no capacity of retrieving AOD values over inland lakes, but it had a better performance than the Aqua-MODIS C6 products in the Tibet plateau.

Acknowledgments

This work was financially supported by the National Natural Science Foundation of China (No. 41601044), the Special Fund for Basic Scientific Research of Central Colleges, China University of Geosciences, Wuhan (No.CUG15063 and CUGL170401), the Opening Foundation of Key Laboratory of Middle Atmosphere and Global environment Observation (LAGEO), Institute of Atmospheric Physics, Chinese Academy of Sciences and the Natural Science Foundation for Distinguished Young Scholars of Hubei Province of China (No. 2016CFA051).

Author Contributions

Lunche Wang, Lijie He and Aiwen Lin designed the research; Lijie He and Ming Zhang performed the experiments and analyzed the data; Lijie He and Lunche Wang wrote the manuscript; Lunche Wang, Wei Jing and Muhammad Bilal revised the manuscript.

Conflicts of Interest

The authors declare no conflict of interest.

References

  1. Intergovernmental Panel on Climate Change(IPCC). Climate change 2013: The physical science basis. In Contribution of Working Group I to the Fifth Assessment Report of the Intergovernmental Panel on Climate Change; Stocker, T.F., Qin, D., Plattner, G.-K., Tignor, M., Allen, S.K., Boschung, J., Nauels, A., Xia, Y., Bex, V., Midgley, P.M., Eds.; Cambridge University Press: Cambridge, UK; New York, NY, USA, 2013; p. 1535. [Google Scholar]
  2. Guo, J.; Xia, F.; Zhang, Y.; Liu, H.; Li, J.; Lou, M.; Zhai, P. Impact of diurnal variability and meteorological factors on the PM 2.5-AOD relationship: Implications for PM 2.5 remote sensing. Environ. Pollut. 2017, 221, 94–104. [Google Scholar] [CrossRef] [PubMed]
  3. Dubovik, O.; Smirnov, A.; Holben, B.N.; King, M.D.; Kaufman, Y.J.; Eck, T.F.; Slutsker, I. Accuracy assessments of aerosol optical properties retrieved from Aerosol Robotic Network (AERONET) Sun and sky radiance measurements. J. Geophys. Res. Atmos. 2000, 105, 9791–9806. [Google Scholar] [CrossRef]
  4. Che, H.; Xia, X.; Zhu, J.; Li, Z.; Dubovik, O.; Holben, B.; Goloub, P.; Chen, H.; Estelles, V.; Cuevas-Agulló, E.; et al. Column aerosol optical properties and aerosol radiative forcing during a serious haze-fog month over North China Plain in 2013 based on ground-based sunphotometer measurements. Atmos. Chem. Phys. 2014, 14, 2125–2138. [Google Scholar] [CrossRef] [Green Version]
  5. Che, H.; Zhang, X.Y.; Xia, X.; Goloub, P.; Holben, B.; Zhao, H.; Damiri, B. Ground-based aerosol climatology of China: Aerosol optical depths from the China Aerosol Remote Sensing Network (CARSNET) 2002–2013. Atmos. Chem. Phys. 2015, 15, 7619–7652. [Google Scholar] [CrossRef]
  6. Liu, H.; Remer, L.A.; Huang, J.; Huang, H.C.; Kondragunta, S.; Laszlo, I.; Jackson, J.M. Preliminary evaluation of S-NPP VIIRS aerosol optical thickness. J. Geophys. Res. Atmos. 2014, 119, 3942–3962. [Google Scholar] [CrossRef]
  7. Huang, J.; Kondragunta, S.; Laszlo, I.; Liu, H.; Remer, L.A.; Zhang, H.; Petrenko, M. Validation and expected error estimation of Suomi-NPP VIIRS aerosol optical thickness and Ångström exponent with AERONET. J. Geophys. Res. Atmos. 2016, 121, 7139–7160. [Google Scholar] [CrossRef]
  8. Levy, R.C.; Mattoo, S.; Munchak, L.A.; Remer, L.A.; Sayer, A.M.; Patadia, F.; Hsu, N.C. The Collection 6 MODIS aerosol products over land and ocean. Atmos. Meas. Tech. 2013, 6, 2989–3034. [Google Scholar] [CrossRef]
  9. Patadia, F.; Gupta, P.; Christopher, S.A. First observational estimates of global clear sky shortwave aerosol direct radiative effect over land. Geophys. Res. Lett. 2008, 35. [Google Scholar] [CrossRef]
  10. Biswas, J.; Pathak, B.; Patadia, F.; Bhuyan, P.K.; Gogoi, M.M.; Babu, S.S. Satellite-retrieved direct radiative forcing of aerosols over North-East India and adjoining areas: Climatology and impact assessment. Int. J. Climatol. 2017. [Google Scholar] [CrossRef]
  11. Kharol, S.K.; Badarinath, K.V.S.; Sharma, A.R.; Kaskaoutis, D.G.; Kambezidis, H.D. Multiyear analysis of Terra/Aqua MODIS aerosol optical depth and ground observations over tropical urban region of Hyderabad, India. Atmos. Environ. 2011, 45, 1532–1542. [Google Scholar] [CrossRef]
  12. Feng, N.; Christopher, S.A. Clear sky direct radiative effects of aerosols over Southeast Asia based on satellite observations and radiative transfer calculations. Remote Sens. Environ. 2014, 152, 333–344. [Google Scholar] [CrossRef]
  13. Xiao, Q.; Zhang, H.; Choi, M.; Li, S.; Kondragunta, S.; Kim, J.; Liu, Y. Evaluation of VIIRS, GOCI, and MODIS Collection 6 AOD retrievals against ground sunphotometer observations over East Asia. Atmos. Chem. Phys. 2016, 16, 1255–1269. [Google Scholar] [CrossRef]
  14. Nichol, J.E.; Bilal, M. Validation of MODIS 3 km resolution aerosol optical depth retrievals over Asia. Remote Sens. 2016, 8, 328. [Google Scholar] [CrossRef]
  15. Kaskaoutis, D.; Kosmopoulos, P.; Kambezidis, H.; Nastos, P. Aerosol climatology and discrimination of different types over Athens, Greece, based on MODIS data. Atmos. Environ. 2007, 41, 7315–7329. [Google Scholar] [CrossRef]
  16. Kosmopoulos, P.G.; Kaskaoutis, D.G.; Nastos, P.T.; Kambezidis, H.D. Seasonal variation of columnar aerosol optical properties over Athens, Greece, based on MODIS data. Remote Sens. Environ. 2008, 112, 2354–2366. [Google Scholar] [CrossRef]
  17. Xia, X.; Che, H.; Zhu, J.; Chen, H.; Cong, Z.; Deng, X.; Liu, Q. Ground-based remote sensing of aerosol climatology in China: Aerosol optical properties, direct radiative effect and its parameterization. Atmos. Environ. 2016, 124, 243–251. [Google Scholar] [CrossRef]
  18. He, L.; Wang, L.; Lin, A.; Zhang, M.; Bilal, M.; Tao, M. Aerosol Optical Properties and Associated Direct Radiative Forcing over the Yangtze River Basin during 2001–2015. Remote Sens. 2017, 9, 746. [Google Scholar] [CrossRef]
  19. Meng, F.; Cao, C.; Shao, X. Spatiotemporal variability of Suomi-NPP VIIRS-derived aerosol optical thickness over China in 2013. Remote Sens. Environ. 2015, 163, 61–69. [Google Scholar] [CrossRef]
  20. Li, J.; Carlson, B.E.; Lacis, A.A. How well do satelliteAOD observations represent the spatial and temporal variability of PM 2.5, concentration for the United States? Atmos. Environ. 2015, 102, 260–273. [Google Scholar] [CrossRef]
  21. Bilal, M.; Nichol, J.E. Evaluation of MODIS aerosol retrieval algorithms over the Beijing-Tianjin-Hebei region during low to very high pollution events. J. Geophys. Res. Atmos. 2015, 120, 7941–7957. [Google Scholar] [CrossRef]
  22. Wang, Y.; Chen, L.; Li, S.; Wang, X.; Yu, C.; Si, Y.; Zhang, Z. Interference of heavy aerosol loading on the VIIRS aerosol optical depth (AOD) retrieval algorithm. Remote Sens. 2017, 9, 397. [Google Scholar] [CrossRef]
  23. Chen, W.; Fan, A.; Yan, L. Performance of MODIS C6 aerosol product during frequent haze-fog events: A case study of Beijing. Remote Sens. 2017, 9, 496. [Google Scholar] [CrossRef]
  24. Bilal, M.; Nichol, J.E.; Chan, P.W. Validation and accuracy assessment of a Simplified Aerosol Retrieval Algorithm (SARA) over Beijing under low and high aerosol loadings and dust storms. Remote Sens. Environ. 2014, 153, 50–60. [Google Scholar] [CrossRef]
  25. Wei, J.; Sun, L. Comparison and evaluation of different modis aerosol optical depth products over the Beijing-Tianjin-Hebei region in China. IEEE J. Sel. Top. Appl. Earth Obs. Remote Sens. 2016, 10, 835–844. [Google Scholar] [CrossRef]
  26. Bilal, M.; Nazeer, M.; Nichol, J.E. Validation of MODIS and VIIRS derived aerosol optical depth over complex coastal waters. Atmos. Res. 2017, 186, 43–50. [Google Scholar] [CrossRef]
  27. Zhang, M.; Ma, Y.; Gong, W.; Wang, L.; Xia, X.; Che, H.; Liu, B. Aerosol radiative effect in UV, VIS, NIR, and SW spectra under haze and high-humidity urban conditions. Atmos. Environ. 2017, 166, 9–21. [Google Scholar] [CrossRef]
  28. Wang, W.; Mao, F.; Pan, Z.; Du, L.; Gong, W. Validation of viirsaod through a comparison with a sun photometer and MODIS AODs over Wuhan. Remote Sens. 2017, 9, 403. [Google Scholar] [CrossRef]
  29. Hsu, N.C.; Jeong, M.-J.; Bettenhausen, C.; Sayer, A.M.; Hansell, R.; Seftor, C.S.; Huang, J.; Tsay, S.-C. Enhanced deep blue aerosol retrieval algorithm: The second generation. J. Geophys. Res. Atmos. 2013, 118, 9296–9315. [Google Scholar] [CrossRef]
  30. Sayer, A.M.; Hsu, N.C.; Bettenhausen, C.; Jeong, M.J. Validation and uncertainty estimates for MODIS Collection 6 “Deep Blue” aerosol data. J. Geophys. Res. Atmos. 2013, 118, 7864–7872. [Google Scholar] [CrossRef]
  31. Sayer, A.M.; Munchak, L.A.; Hsu, N.C.; Levy, R.C.; Bettenhausen, C.; Jeong, M.J. MODIS Collection 6 aerosol products: Comparison between Aqua’s e-Deep Blue, Dark Target, and “merged” data sets, and usage recommendations. J. Geophys. Res. Atmos. 2014, 119, 13965–13989. [Google Scholar] [CrossRef]
  32. Tao, M.; Wang, Z.; Tao, J.; Chen, L.; Wang, J.; Hou, C.; Zhu, H. How do aerosol properties affect the temporal variation of MODIS AOD bias in eastern China? Remote Sens. 2017, 9, 800. [Google Scholar] [CrossRef]
  33. Zhu, J.; Xia, X.; Wang, J.; Che, H.; Chen, H.; Zhang, J.; Ayoub, M. Evaluation of aerosol optical depth and aerosol models from VIIRS retrieval algorithms over North China Plain. Remote Sens. 2017, 9, 432. [Google Scholar] [CrossRef]
  34. Eck, T.F.; Holben, B.N.; Reid, J.S.; Dubovik, O.; Smirnov, A.; O’neill, N.T.; Kinne, S. Wavelength dependence of the optical depth of biomass burning, urban, and desert dust aerosols. J. Geophys. Res. Atmos. 1999, 104, 31333–31349. [Google Scholar] [CrossRef]
  35. Wang, L.; Gong, W.; Xia, X.; Zhu, J.; Li, J.; Zhu, Z. Long-term observations of aerosol optical properties at Wuhan, an urban site in central China. Atmos. Environ. 2015, 101, 94–102. [Google Scholar] [CrossRef]
  36. Remer, L.A.; Mattoo, S.; Levy, R.C.; Munchak, L.A. MODIS 3 km aerosol product: Algorithm and global perspective. Atmos. Meas. Tech. 2013, 6, 1829–1844. [Google Scholar] [CrossRef]
  37. Bilal, M.; Nichol, J.E.; Wang, L. New customized methods for improvement of the MODIS C6 Dark Target and Deep Blue merged aerosol product. Remote Sens. Environ. 2017, 197, 115–124. [Google Scholar] [CrossRef]
Figure 1. The location of the aerosol ground sites (triangle symbol) over YRB.
Remotesensing 10 00117 g001
Figure 2. Comparison of DT3K AOD products against CE318 AOD observations over the YRB for the period of 2 May 2012–31 December 2016. The DT3K AOD retrievals are classified by all (QF > 0, (a)), medium (QF > 1, (b)) and high (QF = 3, (c)) quality flags. The black straight line is the 1:1 line; the red straight line is the regression line and the dot lines are the expected error (EE) envelopes.
Remotesensing 10 00117 g002
Figure 3. As in Figure 2, but comparison of the DT10K AOD products. The DT10K AOD retrievals with QF > 0, QF > 1 and QF = 3 are presented in (ac), respectively.
Remotesensing 10 00117 g003
Figure 4. As in Figure 2, but comparison of the DB10K AOD products. The DT10K AOD retrievals with QF > 0, QF > 1 and QF = 3 are presented in (ac), respectively.
Remotesensing 10 00117 g004
Figure 5. As in Figure 2, but comparison of the DTB10K AOD products. The DT10K AOD retrievals with QF > 0, QF > 1 and QF = 3 are presented in (ac), respectively.
Remotesensing 10 00117 g005
Figure 6. As in Figure 2, but comparison of the VIIRS_EDR AOD products. The DT10K AOD retrievals with QF > 0, QF > 1 and QF = 3 are presented in (ac), respectively.
Remotesensing 10 00117 g006
Figure 7. Box plots of high-quality Aqua-MODIS C6 and VIIRS_EDRAOD retrieval biases (AODsatellite-AODCE318) against CE318 AOD observations over YRB for the period of 2 May 2012–31 December 2016. The dot line is the y = 0 line and the dashed lines are the EE envelopes. The number above each box refers to the corresponding matchups in the different intervals of CE318 AOD (1–0.3, 0.1–0.5, 0.1–0.75 and >1.0). The DT3K, DT10K, DTB10K, DB10K and VIIRS_EDRAOD retrieval biases are presented in (ae), respectively.
Remotesensing 10 00117 g007
Figure 8. Seasonal and annual variation of the Aqua-MODIS C6 and VIIRS_EDR AOD retrievals (QF = 3) and CE318 AOD observations, respectively at TH, HF, WH and KM for the period of 2 May 2012–31 December 2016.
Remotesensing 10 00117 g008
Figure 9. Seasonal variation of Aqua-MODIS C6 and VIIRS_EDR AOD retrieval biases (QF = 3) only during CE318 AOD observations >0.4 at TH site. Notice that y-axis refers to the multi-year daily mean AOD bias values for the period of 2 May 2012–31 December 2016.
Remotesensing 10 00117 g009
Figure 10. As in Figure 9, but for HF.
Remotesensing 10 00117 g010
Figure 11. As in Figure 9, but for WH.
Remotesensing 10 00117 g011
Figure 12. As in Figure 9, but for KM during 2 May 2012–31 December 2013.
Remotesensing 10 00117 g012
Figure 13. Spatial distribution of the annual high-quality VIIRS_EDR AOD retrievals (QF = 3) over the YRB for the period of 2 May 2012–31 December 2016. The color scale refers to AOD values.
Remotesensing 10 00117 g013
Figure 14. As in Figure 13, but for the Aqua-MODIS C6 AOD products.
Remotesensing 10 00117 g014
Table 1. Characteristics of Aqua-MODIS C6 and VIIRS_EDR AOD products used in this study over the Yangtze river basin (YRB) during 2 May 2012–31 December 2016.
SatelliteProductScientific Data Set (SDS)
Aerosol Optical DepthQuality Flag
Suomi–NPPVIIRS_EDRAerosol Optical Depth_at_550 nmQF1_VIIRSAEROEDR
AquaDT10KImage_Optical_Depth_Land_And_OceanLand_Ocean_Quality_Flag
DB10KDeep_Blue_Aerosol_Optical_Depth_550_LandDeep_Blue_Aerosol_Optical_Depth_550_Land_QA_Flag
DTB10KAOD_550_Dark_Target_Deep_Blue_CombinedAOD_550_Dark_Target_Deep_Blue_Combined_QA_Flag
DT3KImage_Optical_Depth_Land_And_OceanLand_Ocean_Quality_Flag
Table 2. Statistics of CE318 ground sites over YRB from 2012 to 2016 used in this study.
RegionCE318 SiteLon(E)/Lat(N)Station TypeQuality FlagTime
YRDTaihu (TH)120.12/31.25AERONET (suburban)level 1.52012.05.02–2016.12.31
MidstreamHefei (HF)117.17/31.90CARANET (urban)level 2.02012.05.02–2016.12.31
Wuhan (WH)114.21/30.32CARANET (urban)level 2.02012.05.02–2016.12.31
Source area Kunming (KM)102.42/25.02CARANET (urban)level 1.52012.05.02–2013.12.31
Table 3. Comparison of DT3K AOD products (QF > 0, QF > 1 and QF = 3) against CE318 AOD observations at TH, HF, WH and KM for the period of 2 May 2012–31 December 2016.
StationQFNSlopey-intRMAERMBRMSEWithin EE%
DT3K vs. CE318
THQF > 02360.840.420.750.321.530.3126
QF > 11820.790.450.790.311.450.2629
QF = 31820.790.450.790.311.450.2629
HFQF > 01781.060.200.820.231.410.2430
QF > 11591.030.190.850.201.350.2032
QF = 31591.030.190.850.201.350.2032
WHQF > 03120.970.090.840.071.110.2259
QF > 12730.950.080.850.041.060.2063
QF = 32700.960.070.860.051.060.2063
KMQF > 0771.010.170.780.171.480.1932
QF > 1690.910.190.750.161.420.1831
QF = 3670.900.200.740.161.420.1831
Table 4. As in Table 3, but comparison of the DT10K AOD products.
StationQFNSlopey-intRMAERMBRMSEWithin EE%
DT10K vs. CE318
THQF > 03580.890.390.780.321.510.2618
QF > 12770.850.350.850.251.390.2021
QF = 32370.810.380.850.241.370.2527
HFQF > 03210.900.260.810.201.310.2433
QF > 12810.900.230.830.171.270.2237
QF = 32530.890.210.840.151.250.2142
WHQF > 04090.990.150.810.141.190.2451
QF > 12990.910.110.810.051.070.2259
QF = 32610.890.100.840.031.050.2063
KMQF > 01251.03−0.020.88−0.010.980.1370
QF > 1850.80−0.010.83−0.050.850.1262
QF = 3680.75−0.020.85−0.070.830.0949
Table 5. As in Table 3, but comparison of the DB10K AOD products.
StationQFNSlopey-intRMAERMBRMSEWithin EE%
DB10K vs. CE318
THQF > 04181.040.090.730.111.170.3654
QF > 12671.040.030.830.051.070.2460
QF = 32311.020.020.840.041.070.2463
HFQF > 03290.970.010.780.001.000.2949
QF > 12730.96−0.050.80−0.070.880.2647
QF = 32491.06−0.110.82−0.070.880.2449
WHQF > 04621.00−0.060.73−0.060.930.3441
QF > 13461.07−0.190.83−0.130.810.2642
QF = 33071.11−0.230.86−0.140.780.2342
KMQF > 01410.650.020.77−0.080.760.1349
QF > 1610.46−0.010.87−0.110.410.0439
QF = 3590.55−0.020.88−0.090.440.0539
Table 6. As in Table 3, but comparison of the DTB10K AOD products.
StationQFNSlopey-intRMAERMBRMSEWithin EE%
DTB10K vs. CE318
THQF > 03120.900.290.780.231.370.2735
QF > 12980.920.250.830.211.300.2237
QF = 32900.930.260.840.201.270.2138
HFQF > 02800.950.170.820.141.230.2344
QF > 12800.950.170.820.141.230.2344
QF = 32760.940.180.830.141.220.2347
WHQF > 03451.05−0.030.850.011.010.2467
QF > 13451.05−0.030.850.011.010.2467
QF = 33361.03−0.020.830.001.010.2469
KMQF > 0700.75−0.010.85−0.070.810.0954
QF > 1700.75−0.010.85−0.070.810.0954
QF = 3700.75−0.010.85−0.070.810.0954
Table 7. As in Table 3, but comparison of the VIIRS_EDR AOD products.
StationQFNSlopey-intRMAERMBRMSEWithin EE%
VIIRS_EDR vs. CE318
THQF > 04360.730.480.580.331.610.3226
QF > 13550.710.510.530.321.520.3328
QF = 32710.790.320.670.211.320.2535
HFQF > 03390.720.370.680.201.330.3135
QF > 12910.670.440.600.241.380.3330
QF = 32510.780.220.760.091.140.2445
WHQF > 05740.720.250.660.051.090.3047
QF > 15040.700.220.630.011.020.3141
QF = 34340.720.120.76−0.060.900.2261
KMQF > 02601.120.160.730.201.560.2942
QF > 12510.850.180.660.111.270.2642
QF = 31780.710.050.74−0.030.890.1645

