Article

The Impact of Precipitation Deficit and Urbanization on Variations in Water Storage in the Beijing-Tianjin-Hebei Urban Agglomeration

1
Key Laboratory for Remote Sensing of Environment and Digital Cities, Faculty of Geographical Science, Beijing Normal University, Beijing 100875, China
2
Faculty of Geographical Science, Beijing Normal University, Beijing 100875, China
3
Chinese Research Academy of Environmental Sciences, Beijing 100012, China
4
College of Global Change and Earth System Science, Beijing Normal University, Beijing 100875, China
*
Authors to whom correspondence should be addressed.
Remote Sens. 2018, 10(1), 4; https://doi.org/10.3390/rs10010004
Submission received: 31 October 2017 / Revised: 11 December 2017 / Accepted: 13 December 2017 / Published: 22 December 2017

Abstract

:
Depletion of water resources has threatened water security in the Beijing-Tianjin-Hebei urban agglomeration, China. However, the relative importance of precipitation and urbanization to water storage change has not been sufficiently studied. In this study, both terrestrial water storage (TWS) and groundwater storage (GWS) change in Jing-Jin-Ji from 1979 to the 2010s were investigated, based on the global land data assimilation system (GLDAS) and the EartH2Observe (E2O) outputs, and we used a night light index as an index of urbanization. The results showed that TWS anomaly varied in three stages: significant increase from 1981 to 1996, rapid decrease from 1996 to 2002 and increase from 2002 to the 2010s. Simultaneously, GWS has decreased with about 41.5 cm (500% of GWS in 1979). Both urbanization and precipitation change influenced urban water resource variability. Urbanization was a relatively important factor to the depletion of TWS (explains 83%) and GWS (explains 94%) since the 1980s and the precipitation deficit explains 72% and 64% of TWS and GWS variabilities. It indicates that urbanization coupled with precipitation deficit has been a more important factor that impacted depletion of both TWS and GWS than climate change only, in the Jing-Jin-Ji region. Moreover, we suggested that the cumulative effect should be considered when discussing the relationship between influence factors and water storage change.

Graphical Abstract

1. Introduction

As an important resource, terrestrial water storage (TWS) is jointly influenced by climate change and anthropogenic activities [1]. In the past three decades, the Beijing-Tianjin-Hebei region has experienced a rapid urban expansion [2,3]. During the process, extensive cultivated land was converted to built up and the soil was replaced by impervious surface [4]. Land cover change has immediate impacts on the urban hydrological cycle [5,6]. The depletion of TWS and groundwater storage (GWS) was significant in this region, attributed to groundwater extraction and climate change. Thus, it is necessary to analyze variability in water storage, which, at present, is crucial to urban water resource management.
Conventionally, changes in TWS and GWS were measured by ground-based observation. Being sparsely distributed, the measurement is impractical for water storage change studies on either global or regional scales [1,7]. In the recent decade, remotely sensed data have been widely used in examining terrestrial water storage change, since the Gravity Recovery and Climate Experiment satellites (GRACE) launched in 2002. GRACE offers an effective way to detect TWS change both globally and regionally, with a spatial resolution of 1 × 1° [8,9,10,11]. However, the study area chosen must be larger than 200,000 km2 when using GRACE, so there are many limitations and uncertainties when referring to water storage change in a small region [12]. In addition, hydrological models and land surface models were also used to investigate water storage change. For instance, outputs derived from Global Land Data Assimilation System (GLDAS) have been widely used in water storage change researches with 0.25 × 0.25° and 1 × 1° resolutions [13]. Outputs derived from WaterGAP Global Hydrological Model (WGHM), including soil moisture storage (SMS), surface water storage (SWS) and GWS, are simulated comprehensively by natural groundwater recharge and discharge, human-induced groundwater abstractions and return flow with a resolution of 0.5 × 0.5° [1,14]. Spatially, TWS derived from GLDAS is more detailed than GRACE and WGHM, but GWS is not included. Furthermore, the EartH2Observe (E2O) project integrates observation-based data, models and assesses global water resources, with a resolution of 0.5 × 0.5°. Although outputs derived from E2O have certain advantages, this dataset has not been widely used to study regional water storage change.
Both natural and anthropogenic factors influence water resources. Precipitation and recharge from rivers are the main sources of water storage, while evapotranspiration, runoff and human water use are outputs of water storage at a regional scale [15]. Changes in precipitation and temperature could cause variability in water storage [15,16]. Mo et al. suggested that both precipitation and runoff show large impacts on water storage change [17]. Anthropogenic activities such as irrigation also impact water storage change by increasing evapotranspiration and groundwater abstraction [9,18]. Furthermore, the increased population also enhances the pressure on water supply [19] and land cover change. Previous research suggested that land cover change has a strong effect on the global hydrological cycle [6,20].
The Beijing-Tianjin-Hebei urban agglomeration (the Jing-Jin-Ji region), one of the world’s largest agglomerations, is the political, economic and cultural centre of China, and has an area of about 214,900 km2 [21]. During the past 30 years, the Jing-Jin-Ji region has rapidly experienced an urbanization process [22]. It contains approximately 8% of China’s total population and contributes to approximately 11% of the Gross Domestic Product (GDP) [23]. The Jing-Jin-Ji region is located at the edge of China’s ecologically fragile environment and suffers from a serious water resource shortage [22,24]. Due to the excessive demand, groundwater was overexploited, resulting in a series of ecological problems, such as groundwater drawdown cones [23,25] and land subsidence [26]. The South-to-North Water Diversion project has been carried out in an effort to alleviate water stress, and has been supplying water to Jing-Jin-Ji since late 2014 [27].
In the context of urbanization and climate change, water resource management is critical, especially for the Jing-Jin-Ji region. However, the relative importance of precipitation change and urbanization to water storage change is not clear now. To support water resource management, long-term water storage changes must be investigated and influencing factors should be identified. In this paper, we aimed to (1) investigate spatial and temporal changes in TWS and GWS of the Jing-Jin-Ji region in the most recent 30 years with GLDAS and E2O datasets; and (2) evaluate the relative importance of land cover change and climate change to variability in TWS and GWS, respectively.

2. Materials and Methods
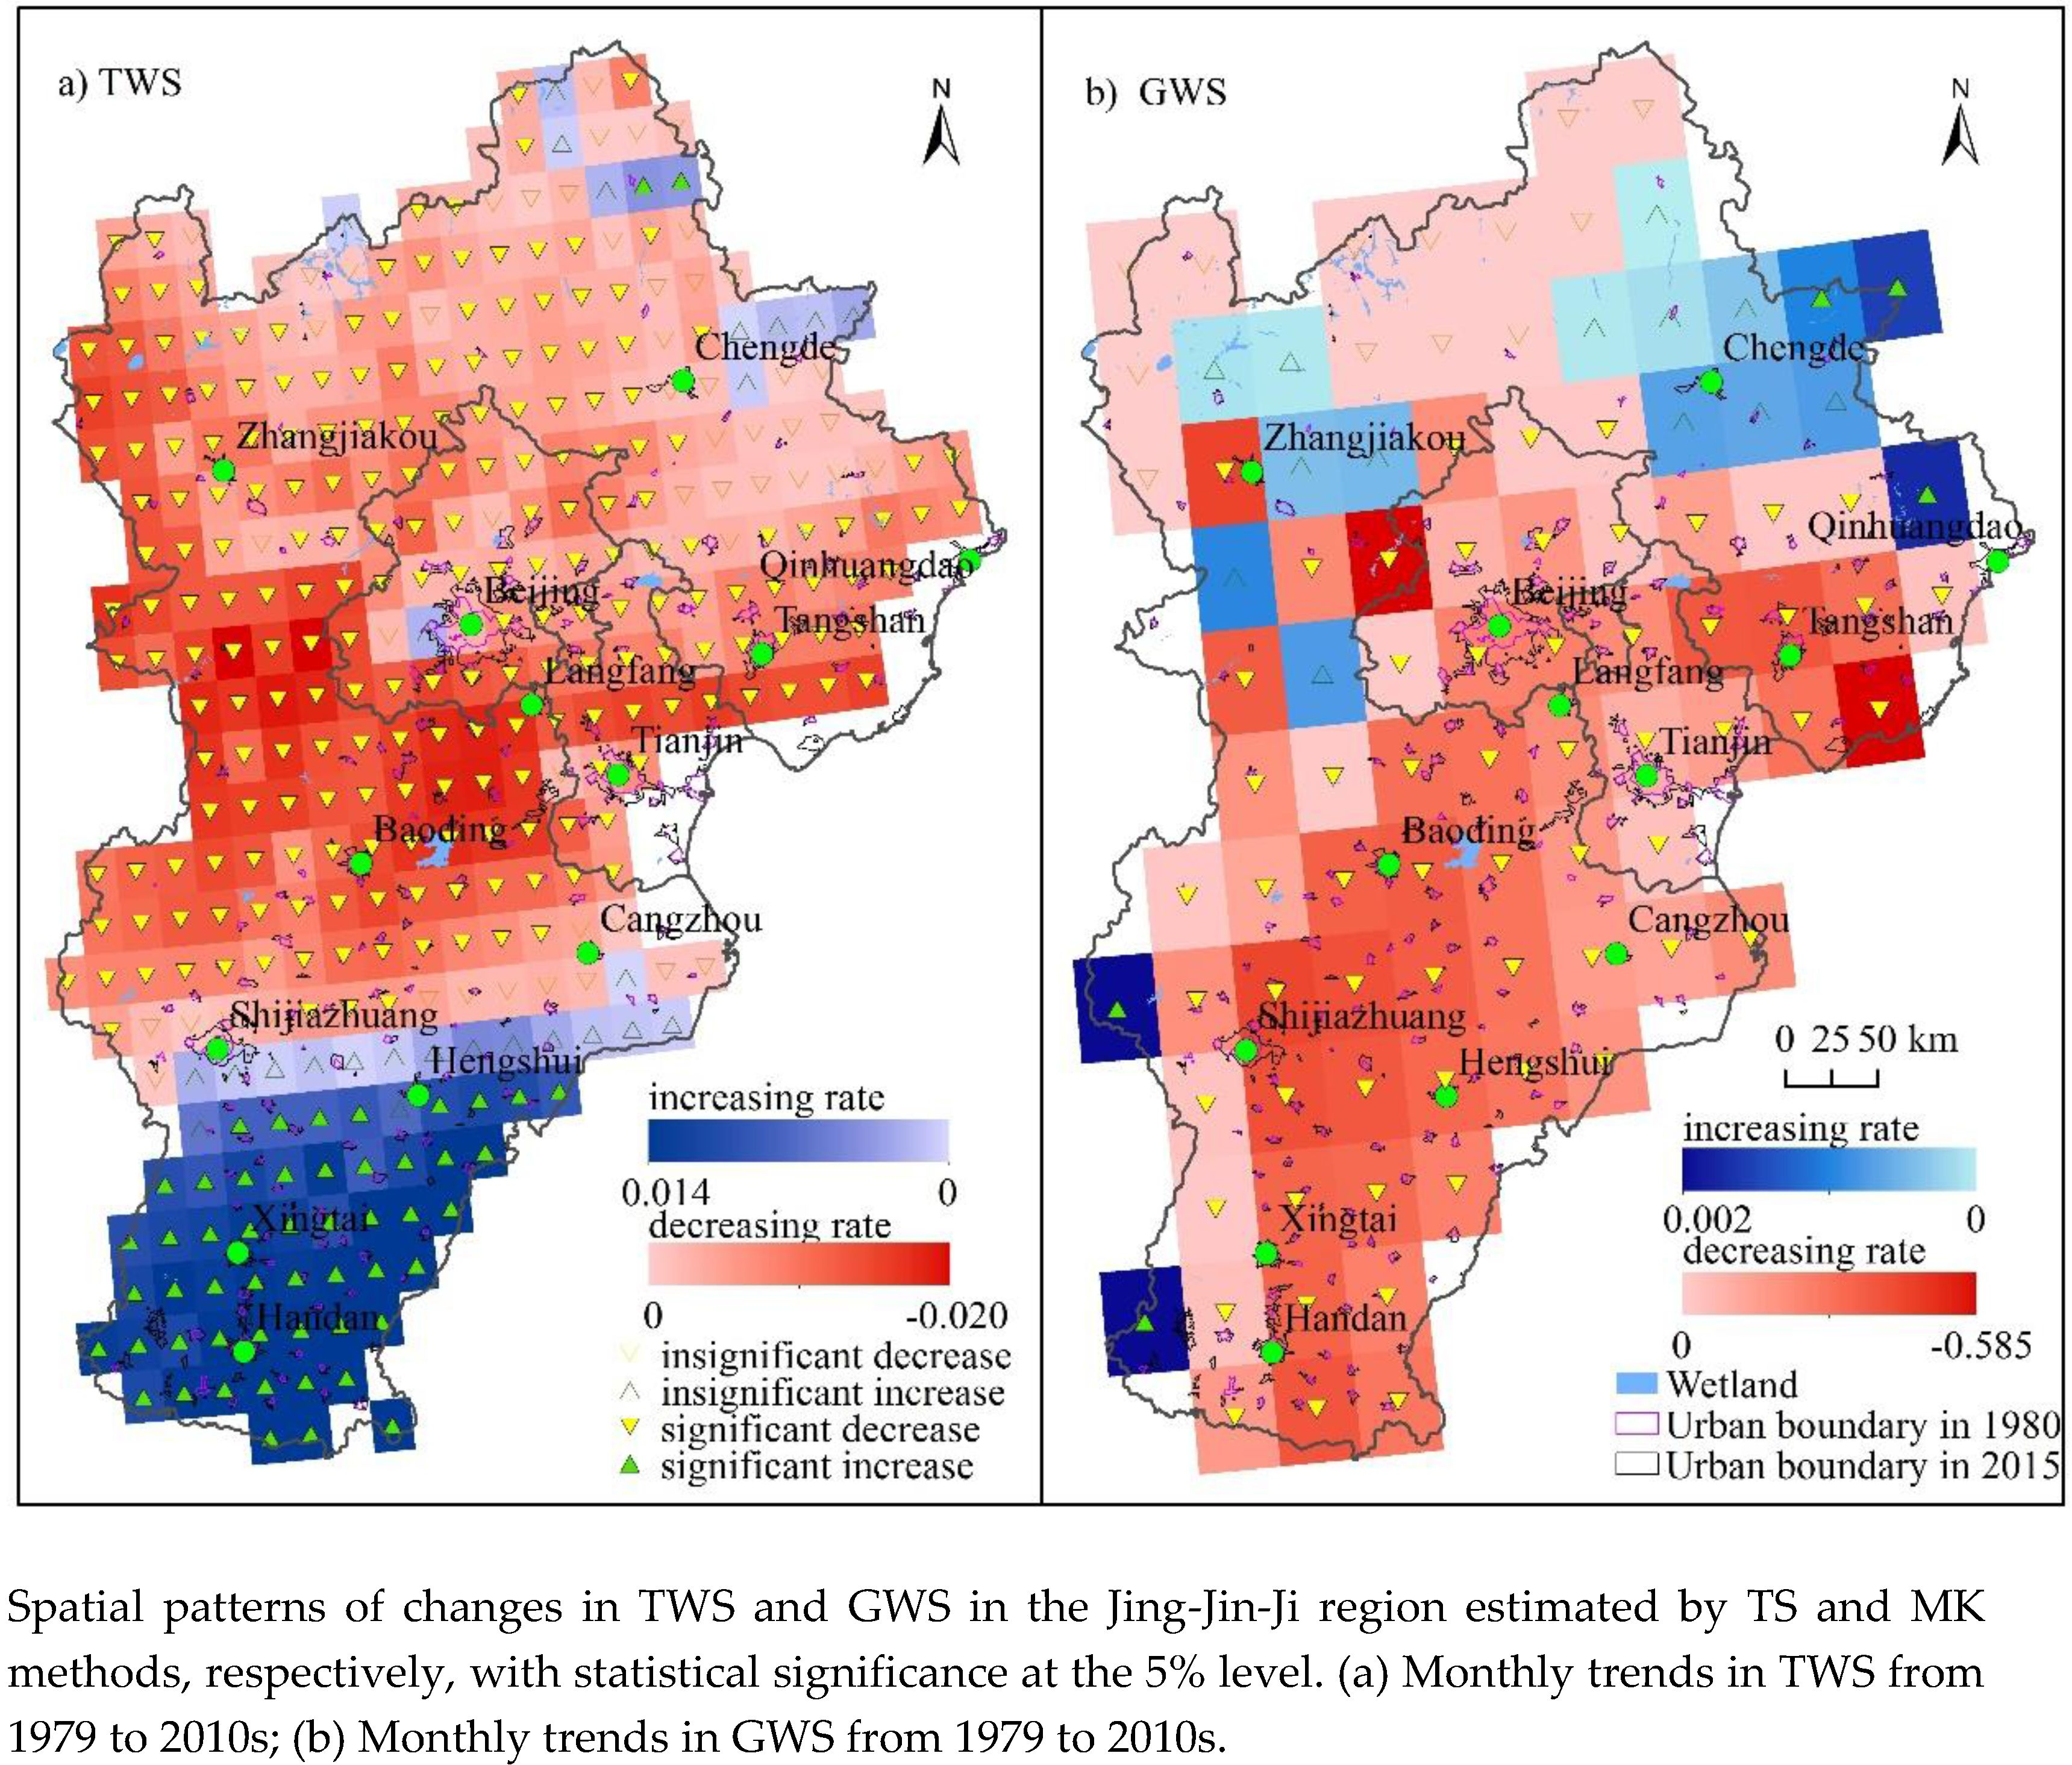
2.1. Study Area

The Beijing-Tianjin-Hebei urban agglomeration is one of the fastest urbanized areas with rapid population growth and dramatic land cover change since 1978, located at the North China Plain [28] and covers the majority of the Haihe River Basin. This study examines the urban agglomeration, including Beijing, Tianjin and Hebei Province, thirteen main cities in total (Figure 1). This region belongs to the semi-arid temperate continental monsoon climate with an annual average precipitation of 500–600 mm and an annual potential evaporation of 1100–2000 mm [23]. The precipitation mainly occurs in summer and the climate is typically dry during spring and winter. Lying north of the North China Plain with mountains behind and facing the Bohai Sea in front, the study area consists of diverse topography. Most of the cultivated land is located south of Hebei province. Since 1979, urbanization has occurred mainly within plains, and a large region of cultivated land has been replaced with urbanized land.

2.2. Data Sources

GLDAS was jointly developed by National Aeronautics and Space Administration (NASA) and the US National Oceanic and Atmospheric Administration (NOAA), incorporated satellite and ground based observations [13]. It drives four land surface models: Mosaic, Noah, Community Land Model (CLM) and Variable Infiltration Capacity (VIC) [17]. We obtained GLDAS2.0 and GLDAS2.1 Noah outputs to investigate TWS change in the Jing-Jin-Ji region from 1979–2010s for its high spatial resolution of 0.25 × 0.25°. E2O is a collaborative project funded under the European Commission Directorate-General (DG) Research Framework Programme 7 (FP7) programme [29]. The overall object is to contribute to the assessment of global water resources through the use of new earth observation datasets and techniques. We obtained the data from the Centre for Ecology and Hydrology (CEH) and Joint Research Centre (JRC) at a spatial resolution of 0.5° to detect GWS variability from 1979–2010s. WGHM was developed by Döll et al. in 2003. It is a submodel of the global water use and availability model WaterGAP 2 and computes surface runoff, groundwater recharge and river discharge at a spatial resolution of 0.5° and is able to calculate reliable and meaningful indicators of water availability at a high spatial resolution [14]. Outputs from all three of the datasets above partially contain surface water storage components (such as snow water equivalent and canopy water storage) as well as SMS, and WGHM and E2O also provide additional GWS data. As suggested by Long et al. [1], TWS anomaly (TWSA) changes derived from WGHM showed the lowest uncertainty compared with those derived from GLDAS and GRACE in sixty basins. Thus, we obtained the outputs from WGHM between 2003 and 2014 to evaluate TWS and GWS derived from GLDAS and E2O.
The Operational Line-scan System (OLS), running from 1992 to 2012 on the Defense Meteorological Satellite Program (DMSP) has the capacity for detecting city lights, gas flares and fires at night, benefitting from a low-light detecting capability [30]. It provides an effective way for analyzing the relationship between urbanization and anthropogenic activities and was widely used in urban studies [31,32]. In this paper, the DMSP/OLS dataset was used to present the dynamics of urbanization in the Jing-Jin-Ji region from 1980 to 2015. Additionally, the population and water consumption were obtained from yearbooks of Beijing, Tianjin and Hebei as extra data.
The precipitation data obtained from the National Climatic Centre of the Chinese Meteorological Administration was used to inform precipitation changes from 1979 to 2015. To analyze trends, only meteorological stations without missing data were selected (33 stations in total).

2.3. Methods

In this study, we obtained calculated TWS by summing up the total soil moisture (SM), snow water equivalent (SWE) and canopy surface water (CSW) from GLDAS, E2O and WGHM and calculated TWSA by subtracting the average TWS from 1979 to 2015:
TWS = SM + SWE + CSW ,
TWSA = TWS ij TWS ¯ ,
where TWSij is TWS in month i of year j and TWS ¯ is average TWS from 1979 to 2015. The accumulated yearly TWSA, GWSA and precipitation anomaly are calculated by the following equation:
S i t = W 1 t + W 2 t + + W i t S i g = W 1 g + W 2 g + + W i g S i p = W 1 p + W 2 p + + W i p ,
where Sit, Sig, Sip is the accumulated yearly TWSA, GWSA and precipitation anomaly, respectively, and Wit, Wig, Wip is the annual average TWSA, GWSA and precipitation anomaly, respectively.
The Theil–Sen median trend analysis (TS) and Mann–Kendall test (MK) methods were used to analyze TWS and GWS change trends within the Jing-Jin-Ji region. The Pearson correlation coefficient (r) was utilized to describe the relationship between water storage change and influencing factors. The relative contribution was estimated using a coefficient of determination (R2).
The Theil–Sen Median trend analysis method can be effectively combined with a Mann–Kendall test to evaluate the trend of long-term data [33]. As a robust statistical method for identifying trends, the TS method calculates the median slopes between all n(n − 1)/2 pair-wise combinations of the time series data [33]. The value of TS median ranges from −1 to 1 and a value of 0‒1 indicates that water storage increased, and any other value indicates water storage decreased. The MK method has been widely used to analyze trends and variability at sites with hydrological and meteorological time series due to its advantages in the description of the significance of changing trends [33]. In this study, a trend is considered significant if the value (p) is less than 0.05.
As an effective measure of the linear correlation between two variables, the Pearson correlation coefficient (r) has been widely used to study the degree of linear dependence between different variables [34]. When r values range from 0 to 1, the variables have a positive correlation, while any negative value indicates a negative correlation between the two variables.

3. Results

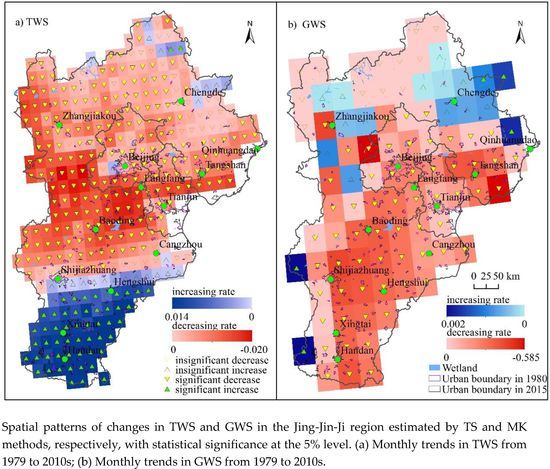
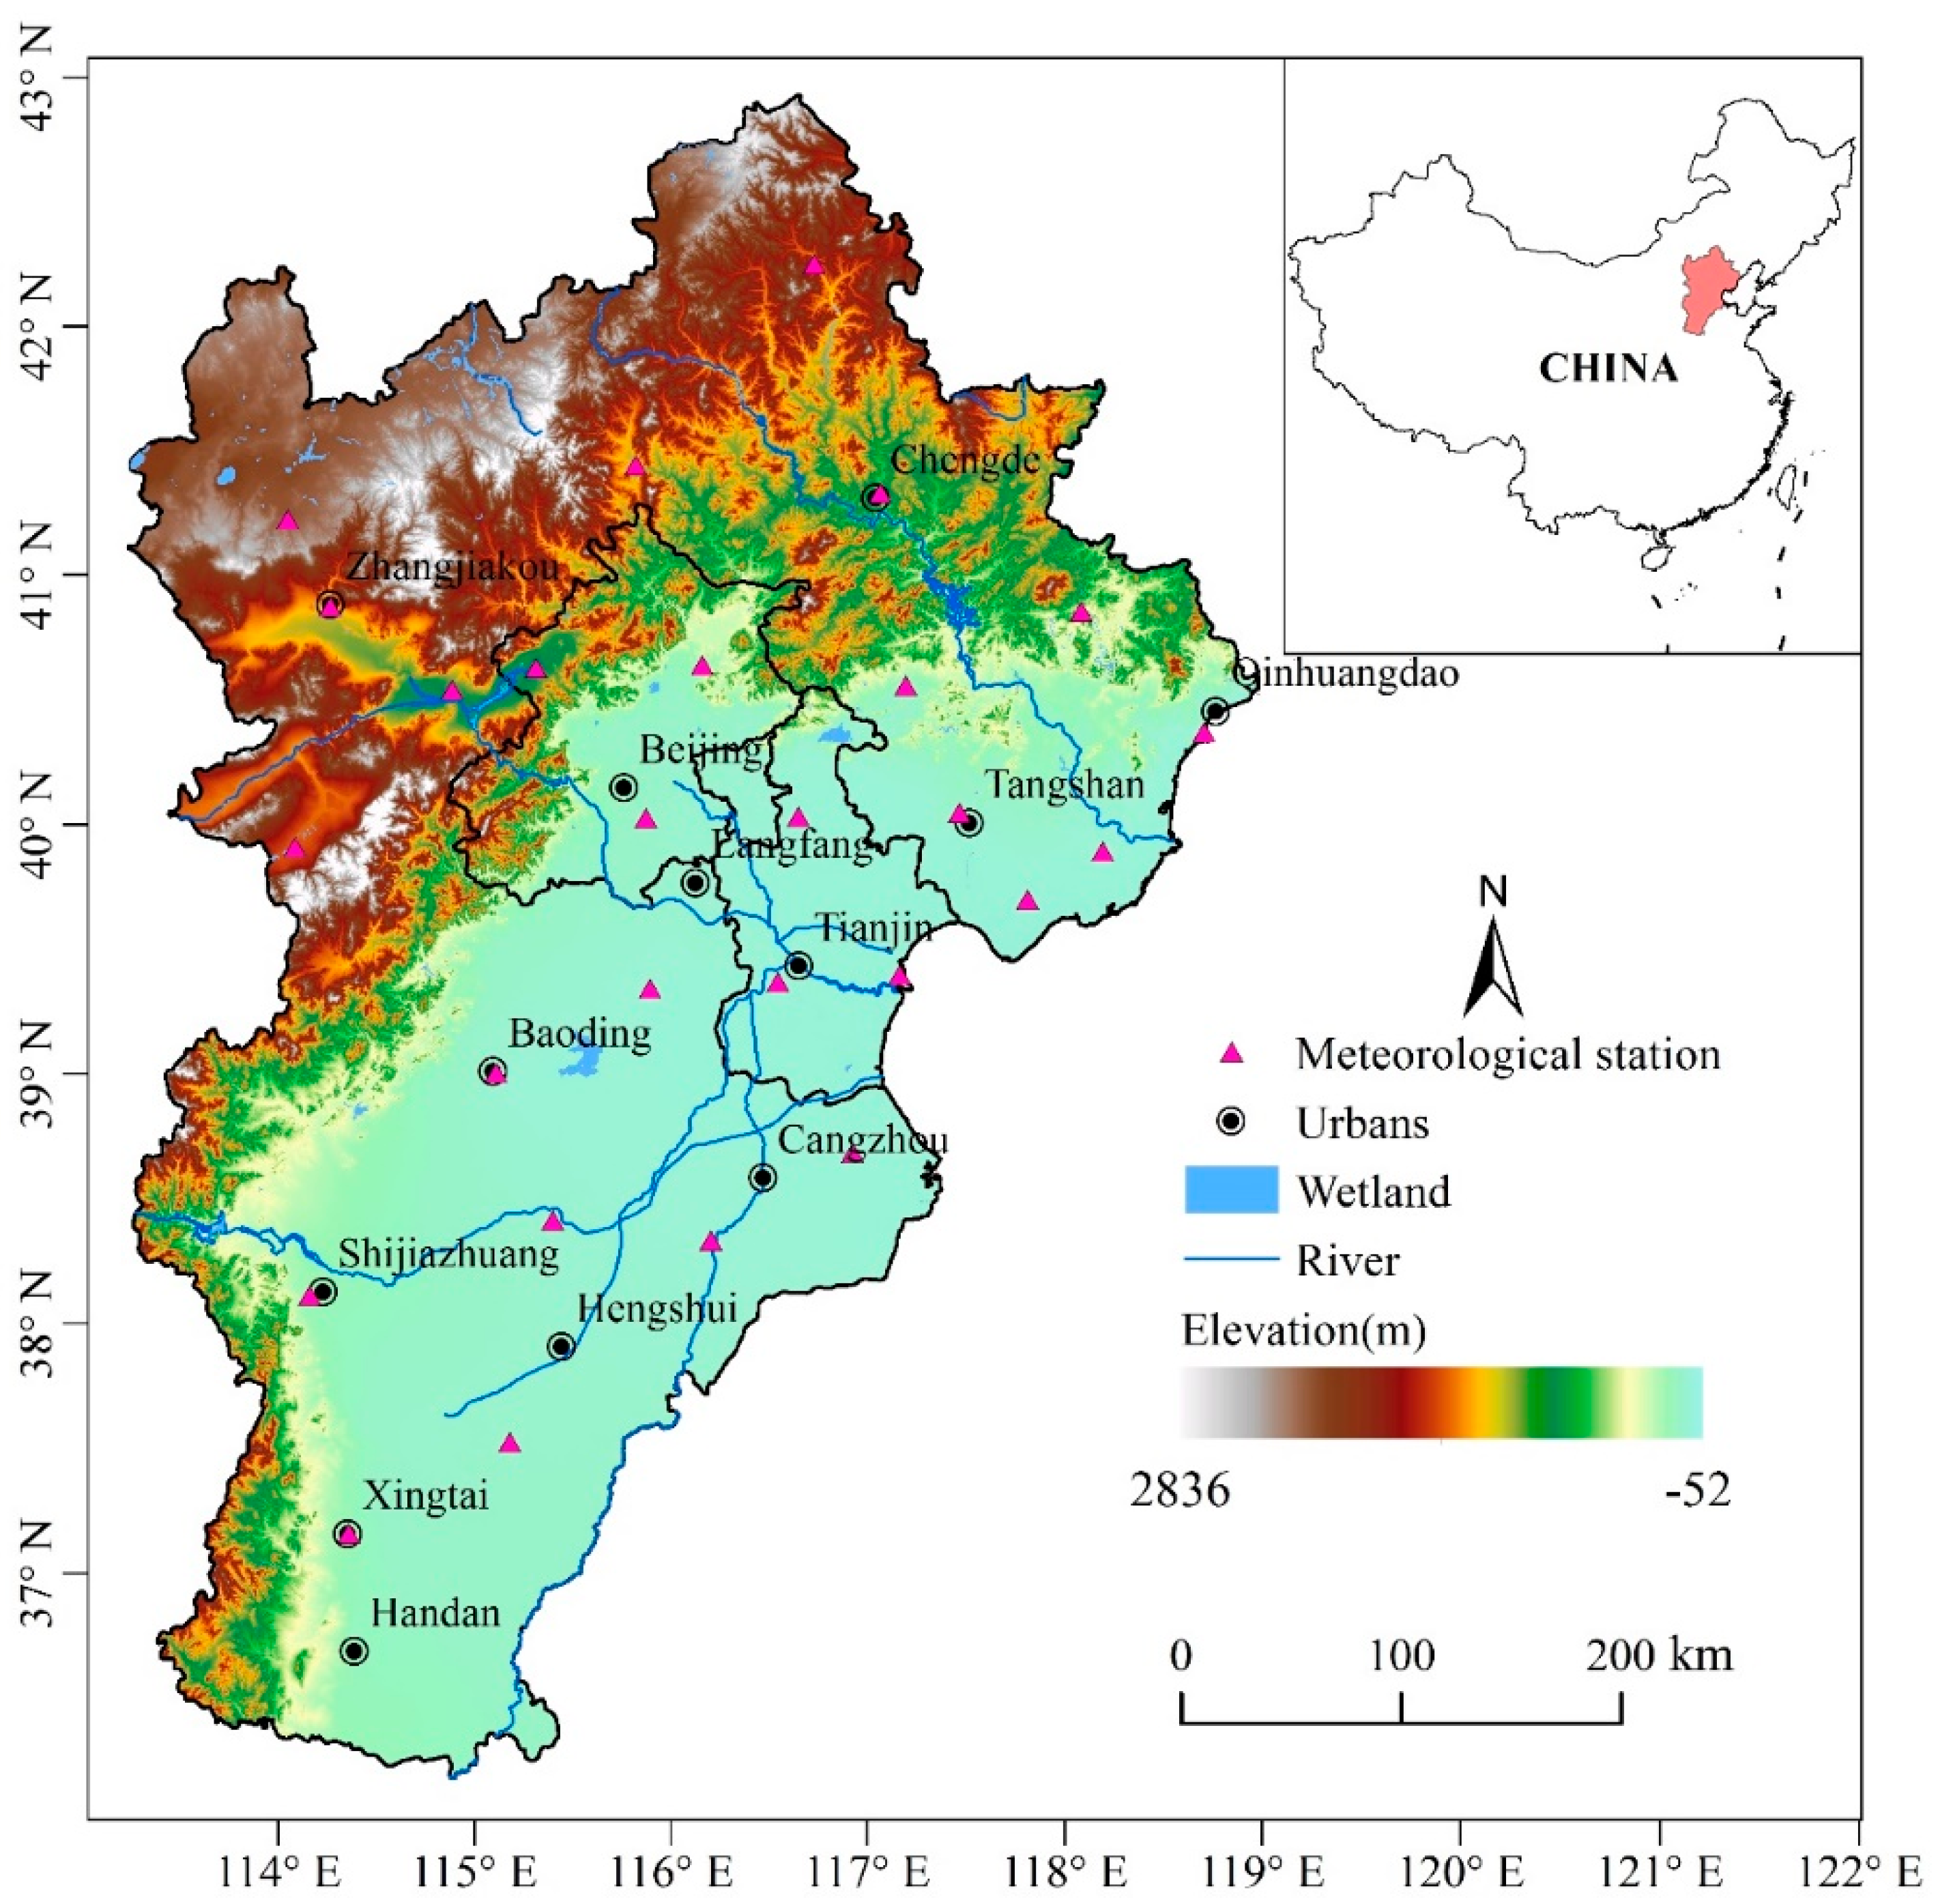
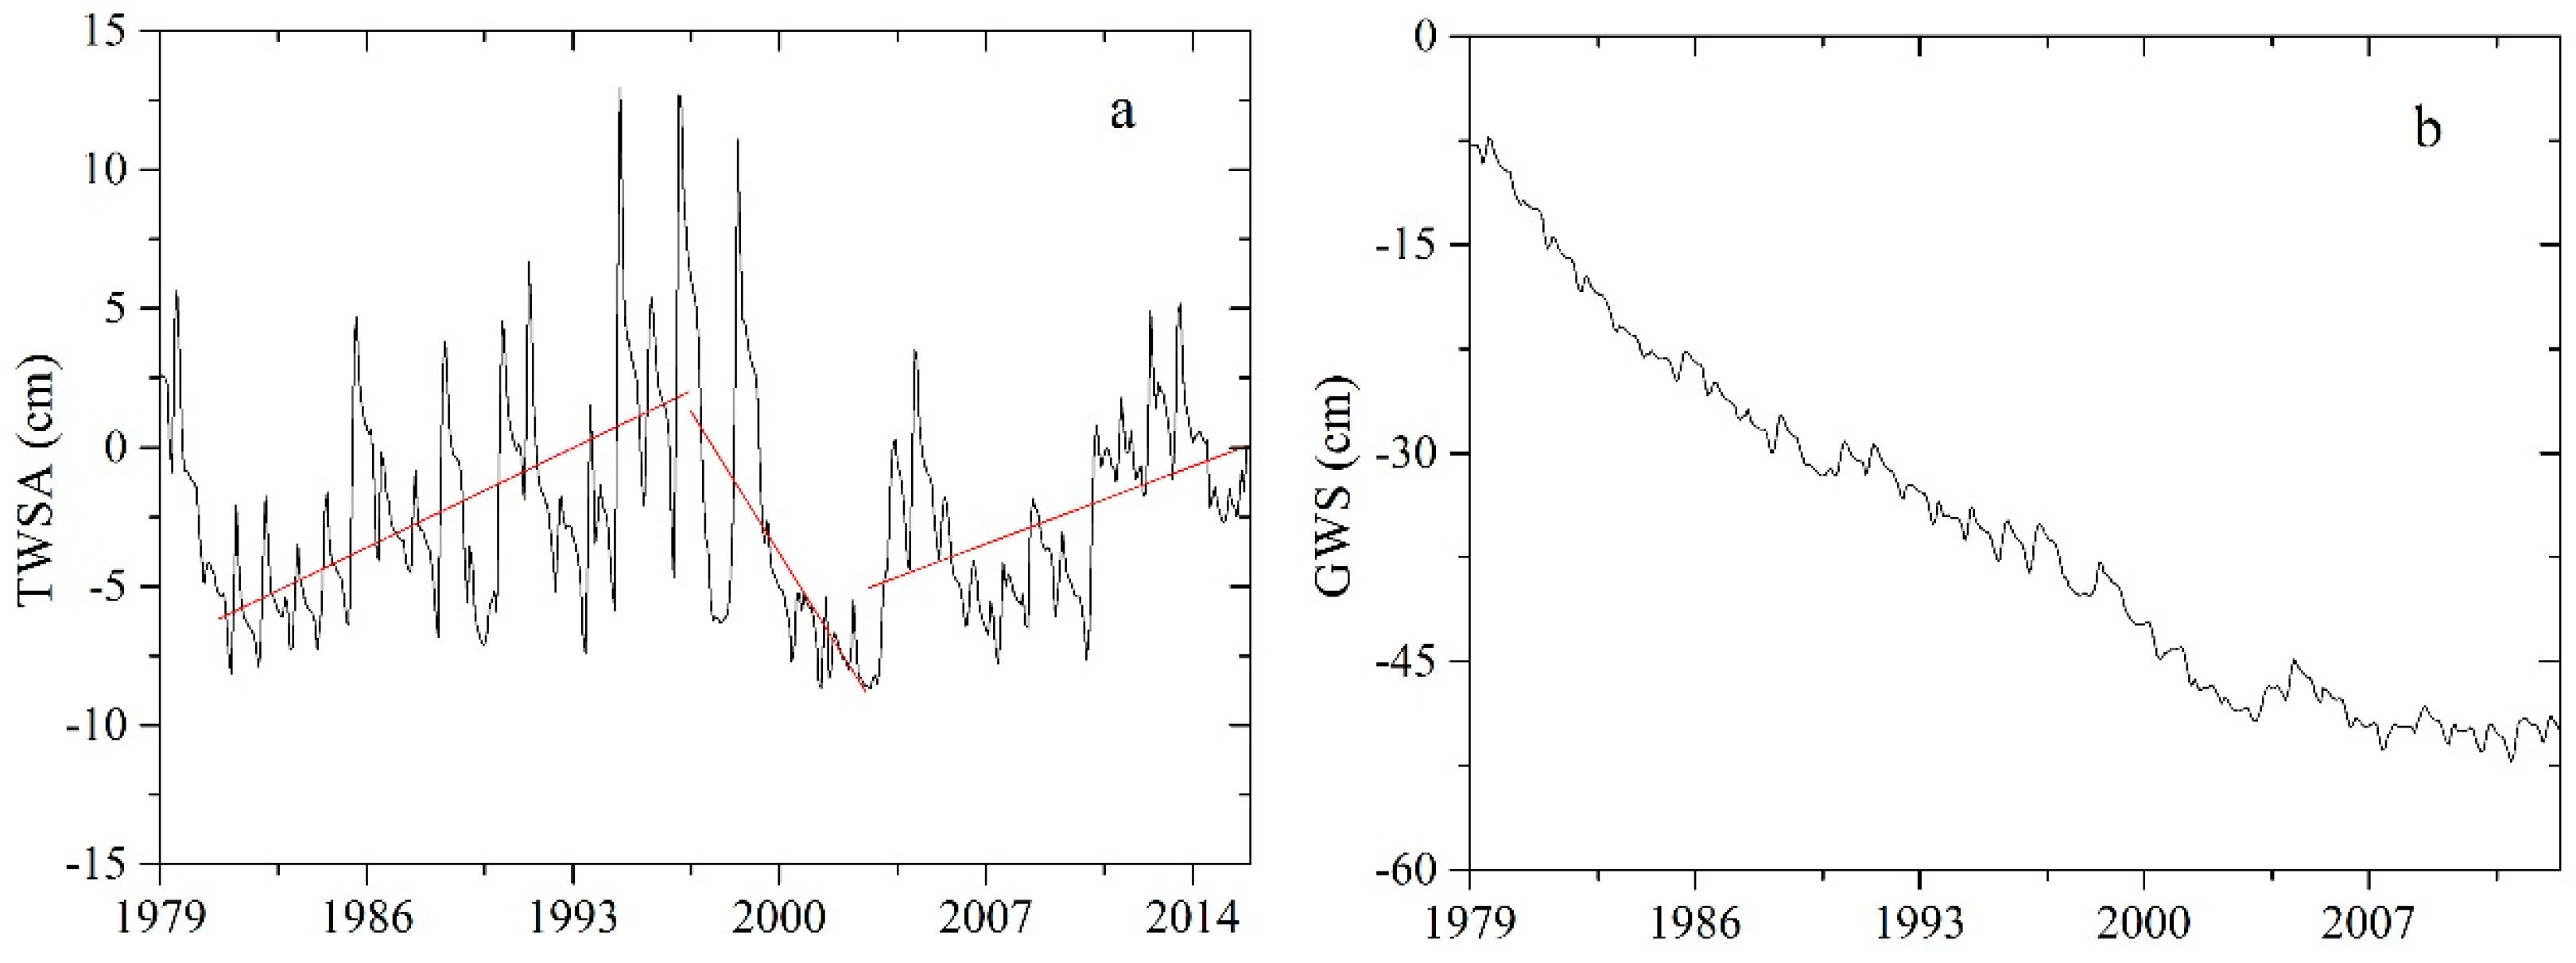
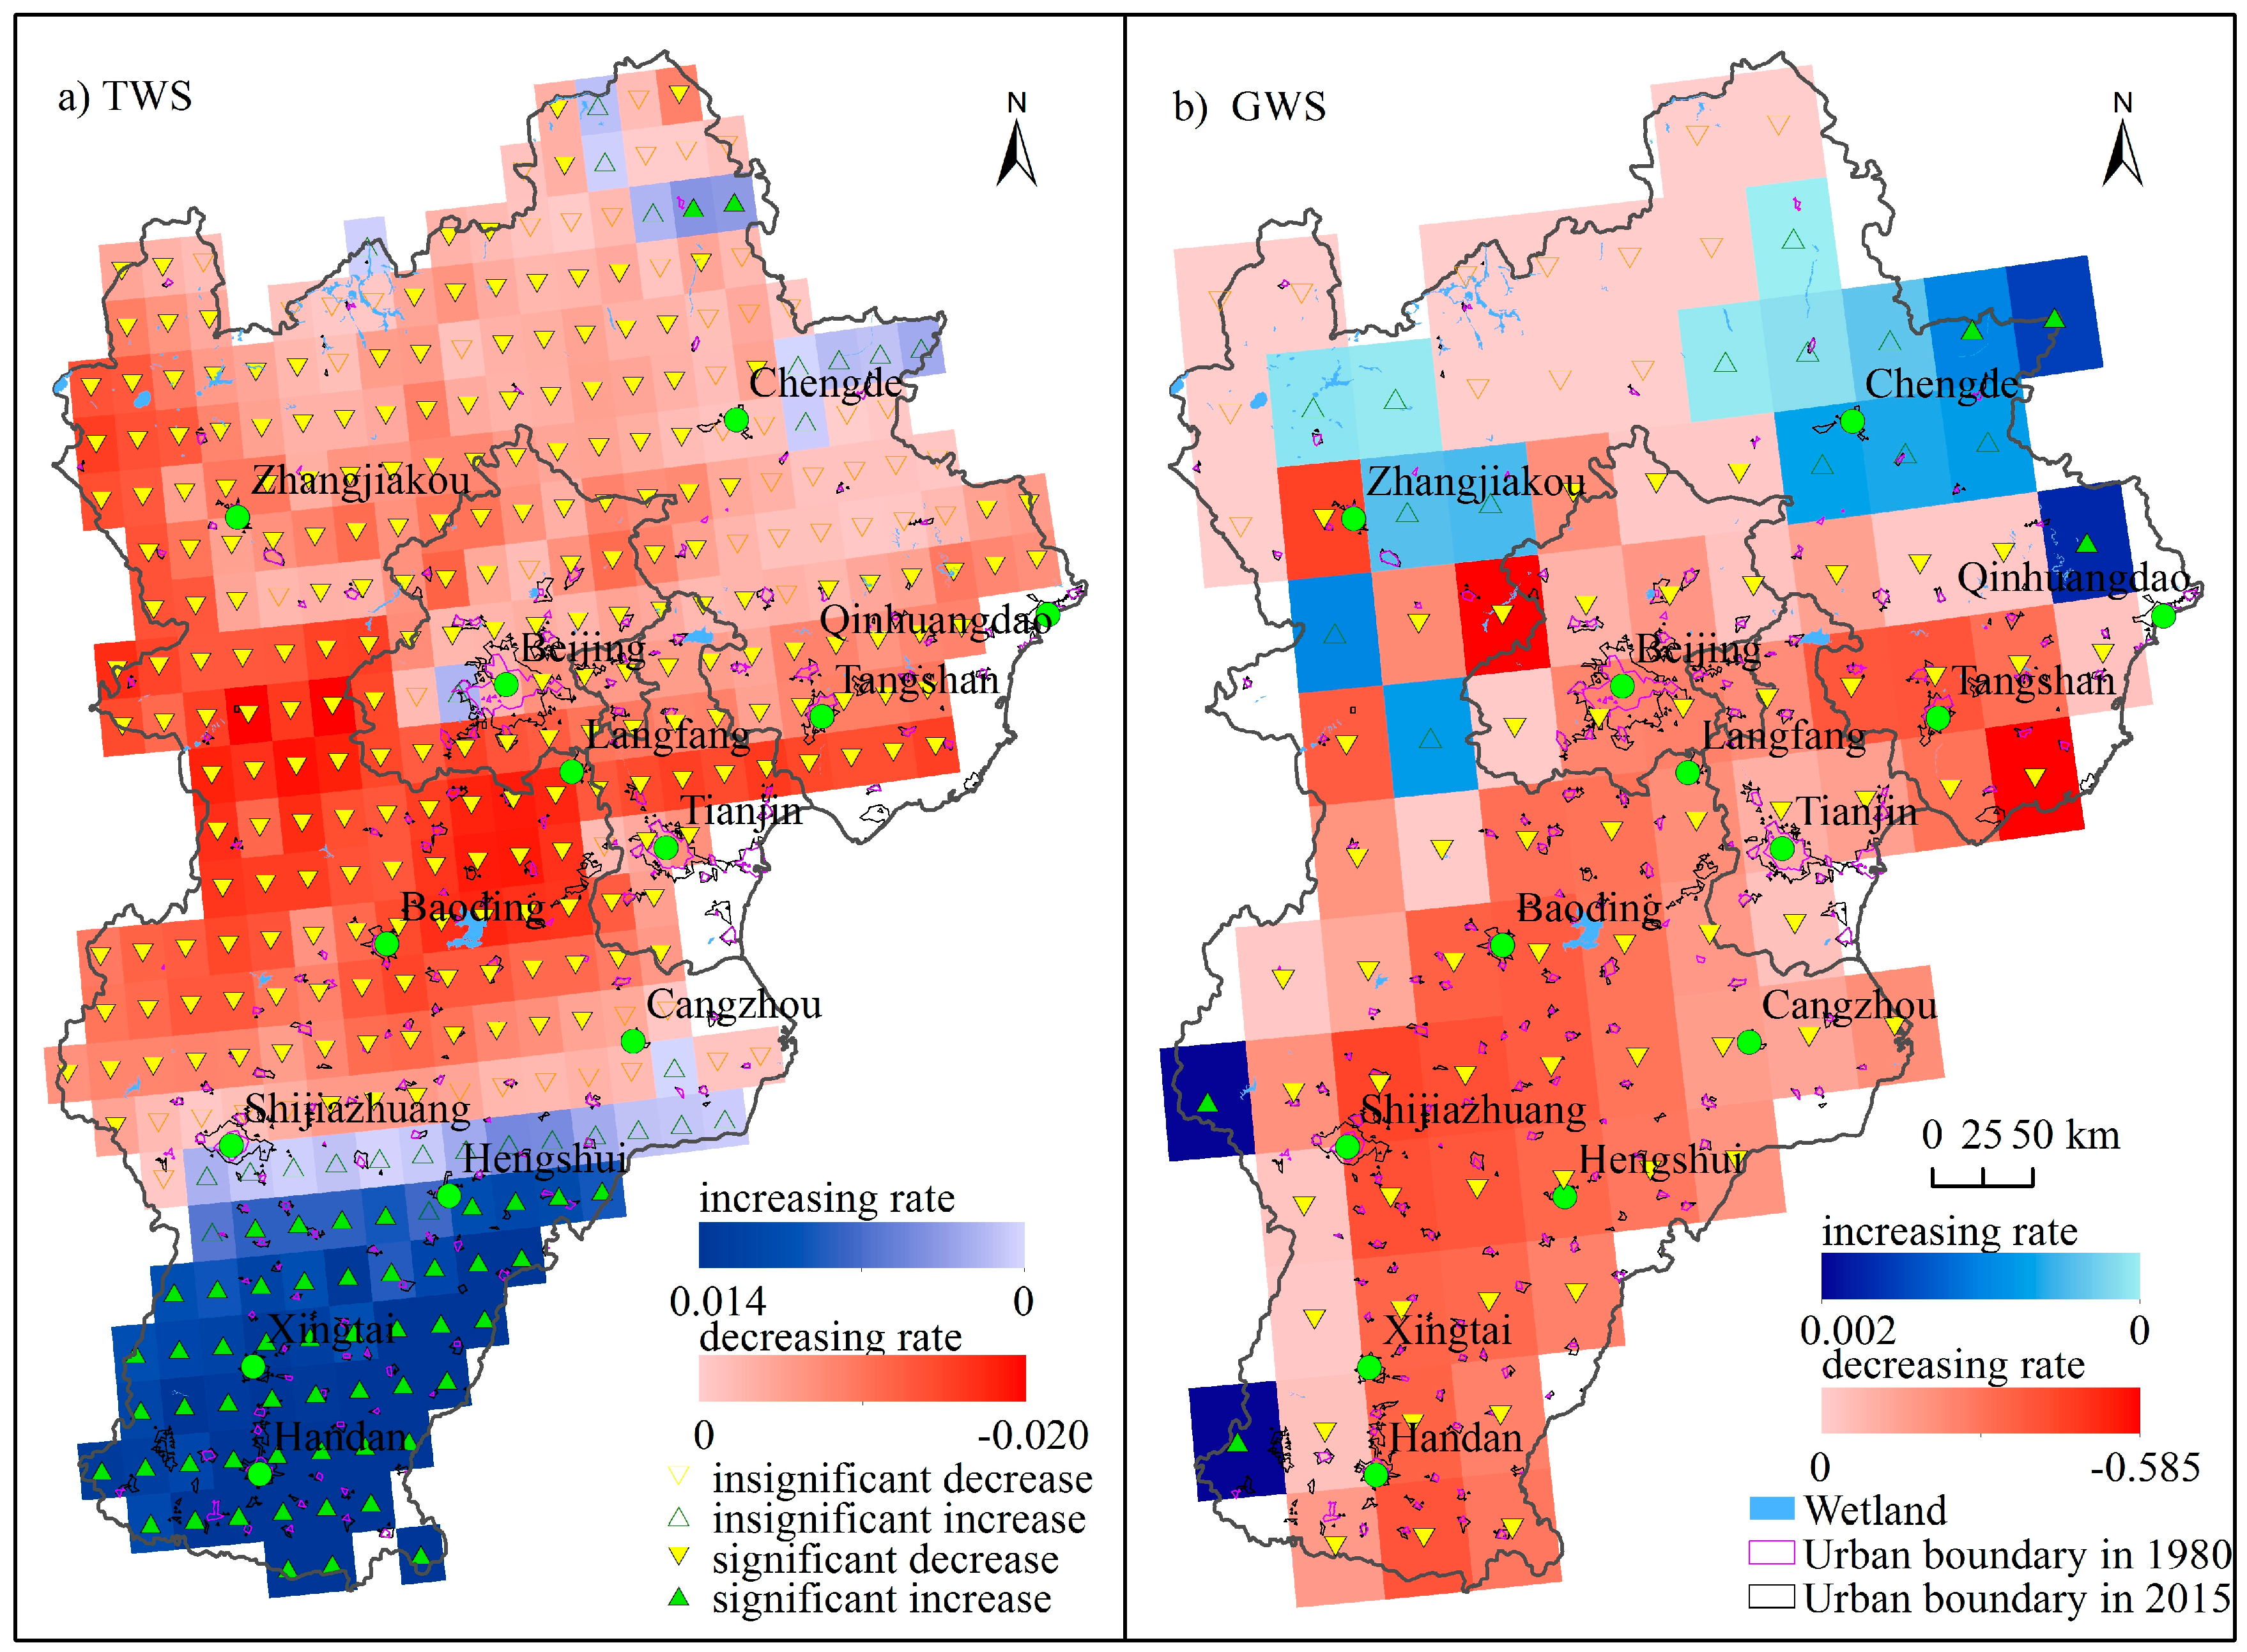
3.1. Changes in Water Storage

We evaluated TWS changes derived from GLDAS by the results derived from WGHM and E2O, as seen in Figure 2a. All TWS variation patterns derived from GLDAS, WGHM and E2O are similar. However, the amplitude of WGHM was more intense than GLDAS and E2O. From 2008 to 2010, there were significant differences among TWSAs derived from GLDAS, WGHM and E2O. From 2008 and 2010, GLDAS and E2O reach maximum values in August or September, while WGHM reaches maximum values in January or February. Furthermore, GLDAS and E2O decreases from February 2006 to June 2007, while WGHM increases during this period. Overall, E2O and GLDAS agree well (r = 0.92) while WGHM is discordant with GLDAS and E2O (r = 0.4 and r = 0.37). WGHM-based TWSA changes show more uncertainty in the smaller region of Jing-Jin-Ji. Additionally, GLDAS was selected to analyze TWSA change in the Jing-Jin-Ji region because it covers the period from 1979 to 2010s.
The evaluation of GWS was based on E2O and WGHM. As Figure 2b shows, GWS decreases from 2003 to 2012 in both E2O and WGHM datasets. Although both datasets reveal a trend in the same direction, WGHM decreases rapidly, while E2O decreases slightly during 2003 to 2012. Moreover, between 2008 and 2012, E2O has almost no significant change, while WGHM continues to decrease. According to Li et al. [35], GWS varies slightly after 2000 (Figure S1). In this case, E2O was more available in our study.
TWS and GWS changes were analyzed from 1979 to the 2010s. The results show that TWS varies at three different stages: first, there was a significant increase in water storage from 1981 to 1996, and then a rapid decrease from 1996 to 2002. Finally, there was an increase in water storage from 2002 to 2015 (Figure 3a). Although TWSA increased slightly from 1979 to 2010s, TWSAs were less than the annual average in 29 years. The accumulated yearly TWSA was less than 0 from 1980 to 2015, and water storage deficit had been increasing continuously (Figure S2). This suggests that water storage in the Jing-Jin-Ji region is at a deficit, although that state was distinctly ameliorated from 1992 to 1995. GWS is another important factor of water resources. As can be seen, GWS has decreased rapidly and continuously between 1979 and the 2010s, with a total decline of approximately 41.5 cm (500% of GW in 1979) (Figure 3b). According to Li et al. [35], the water table depth in the Jing-Jin-Ji plain area increased rapidly between 1981 and 1997, at a rate of about 0.62 m/yr, then decreased slightly from 1998 to 2010. This therefore suggests that groundwater resources in the Jing-Jin-Ji region have been decreasing rapidly and continuously, although the loss of GWS has slowed down in the recent decade.
The results in Figure 4 spatially illustrate monthly trends in TWS and GWS estimated by TS and MK methods. TWS and GWS have declined significantly in the Jing-Jin-Ji urban agglomeration between 1979 and the 2010s. Moreover, changes in both TWS and GWS revealed declining trends in the majority of the Jing-Jin-Ji region. TWS decreased significantly in 62.6% of the Jing-Jing-Ji region, especially in the middle area (TWSA decreased at a rate of more than 0.01 cm/yr, and the area accounts for more than 20% of the entire region) (Figure 4a). In the southern region, TWS increased significantly (about 14.3%), and it covers over 60% of the increased area (where TWSA increased at a rate of less than 0.01 cm/yr). Changes in GWS revealed significant declines in the whole plain area (about 66.3% of the Jing-Jing-Ji region), including the entirety of Beijing, Tianjin, Tangshan, and the southern region of Hebei Province (Figure 4b). In Southern Hebei Province (part of the Jing-Jin-Ji plain), GWS declined rapidly and obviously, at a rate of about 0.22 cm/yr, while it showed a slightly increasing trend (less than 0.002 cm/yr) in the northeast area.

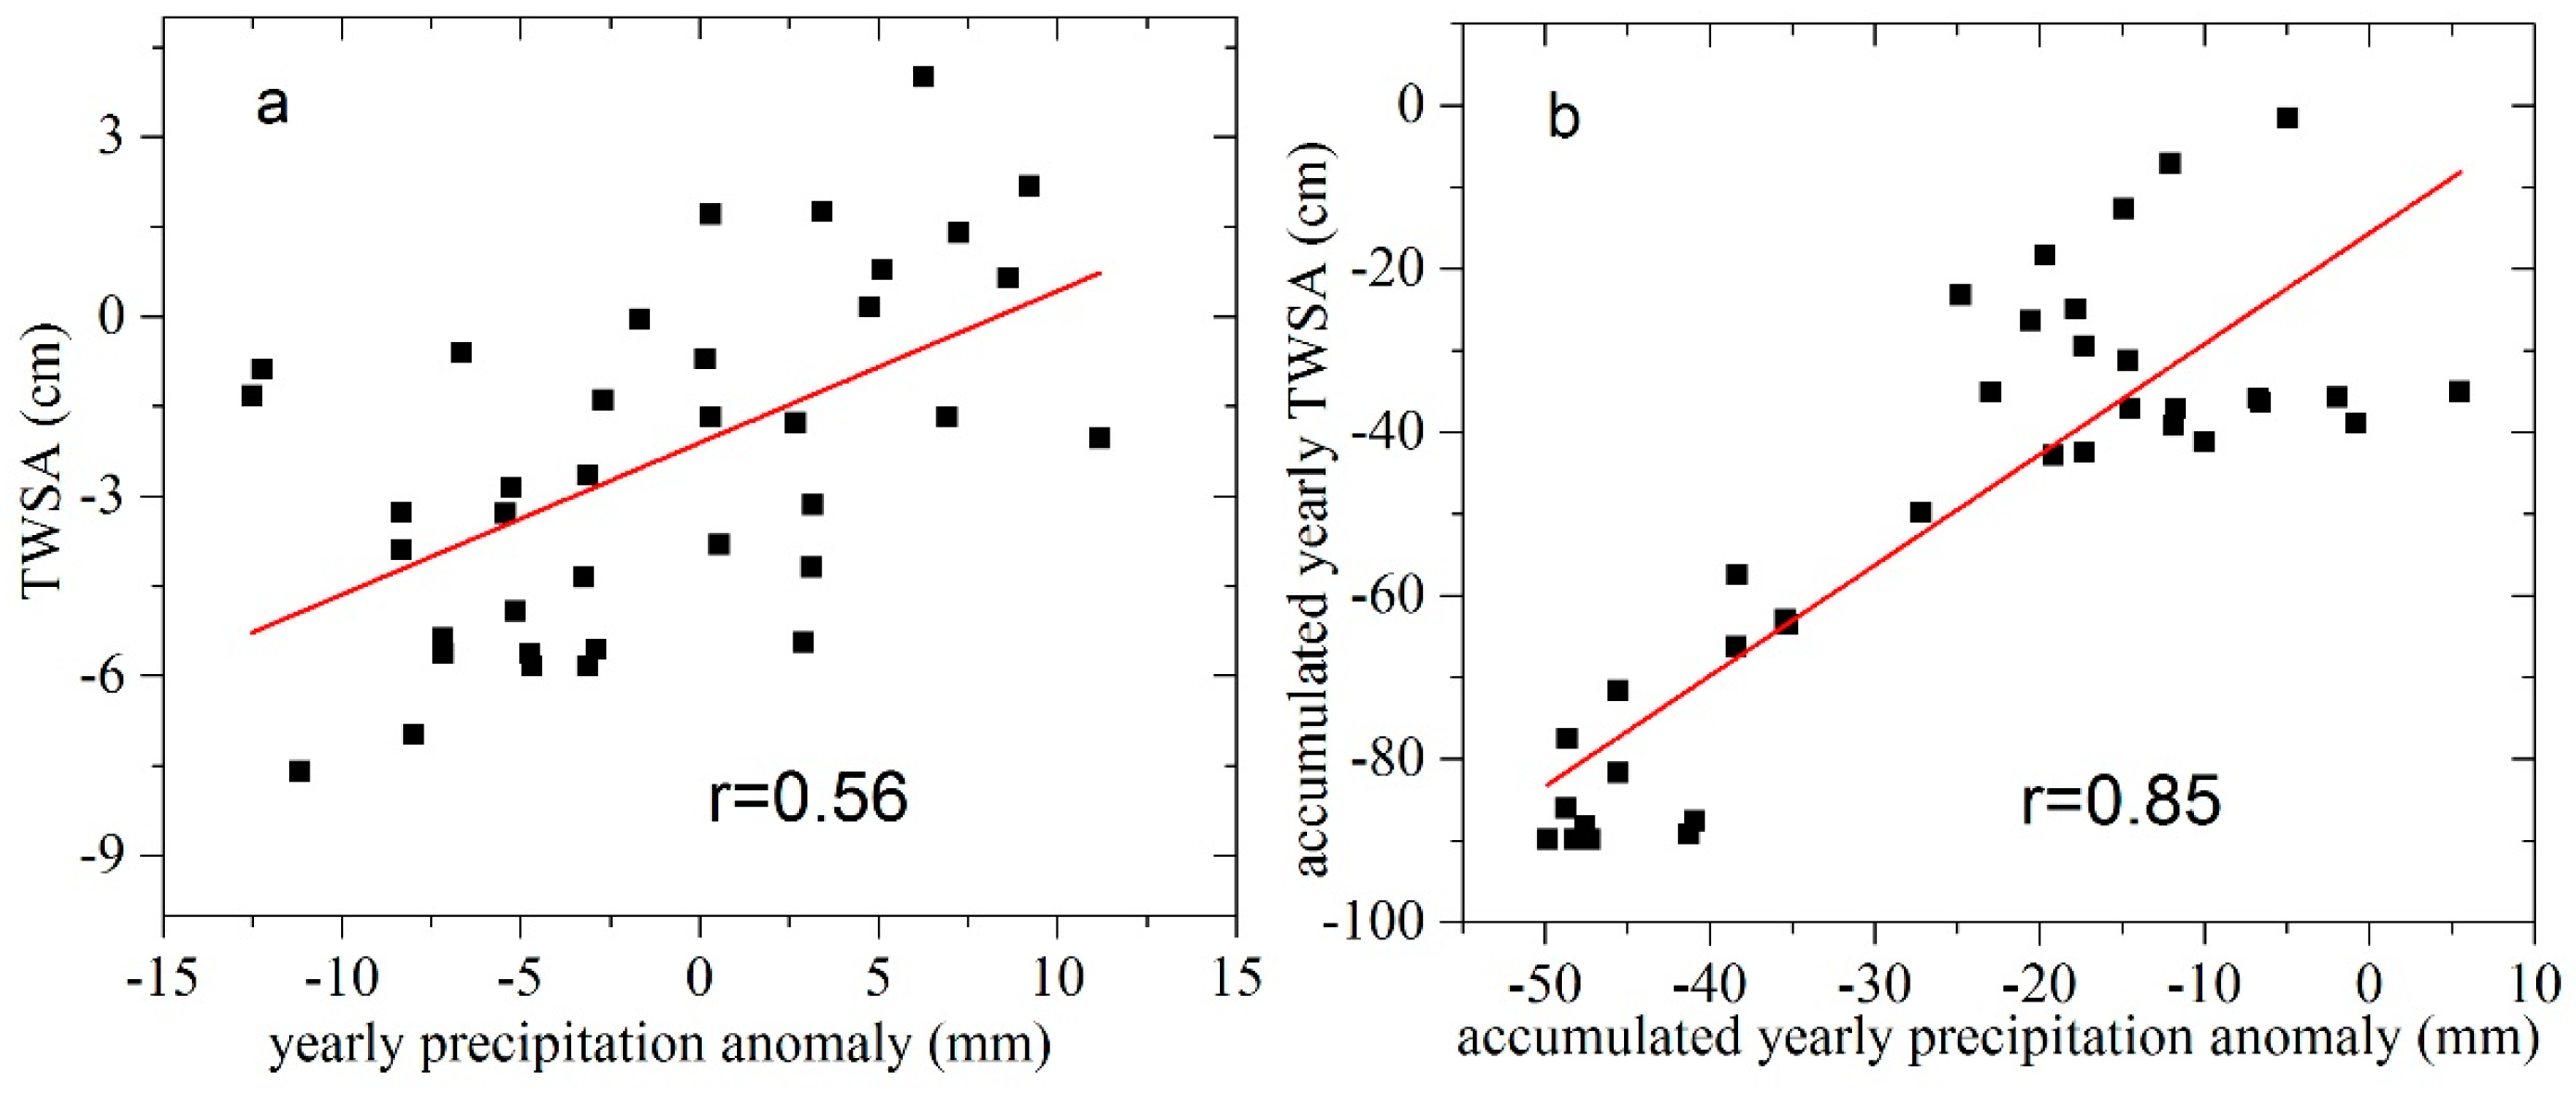
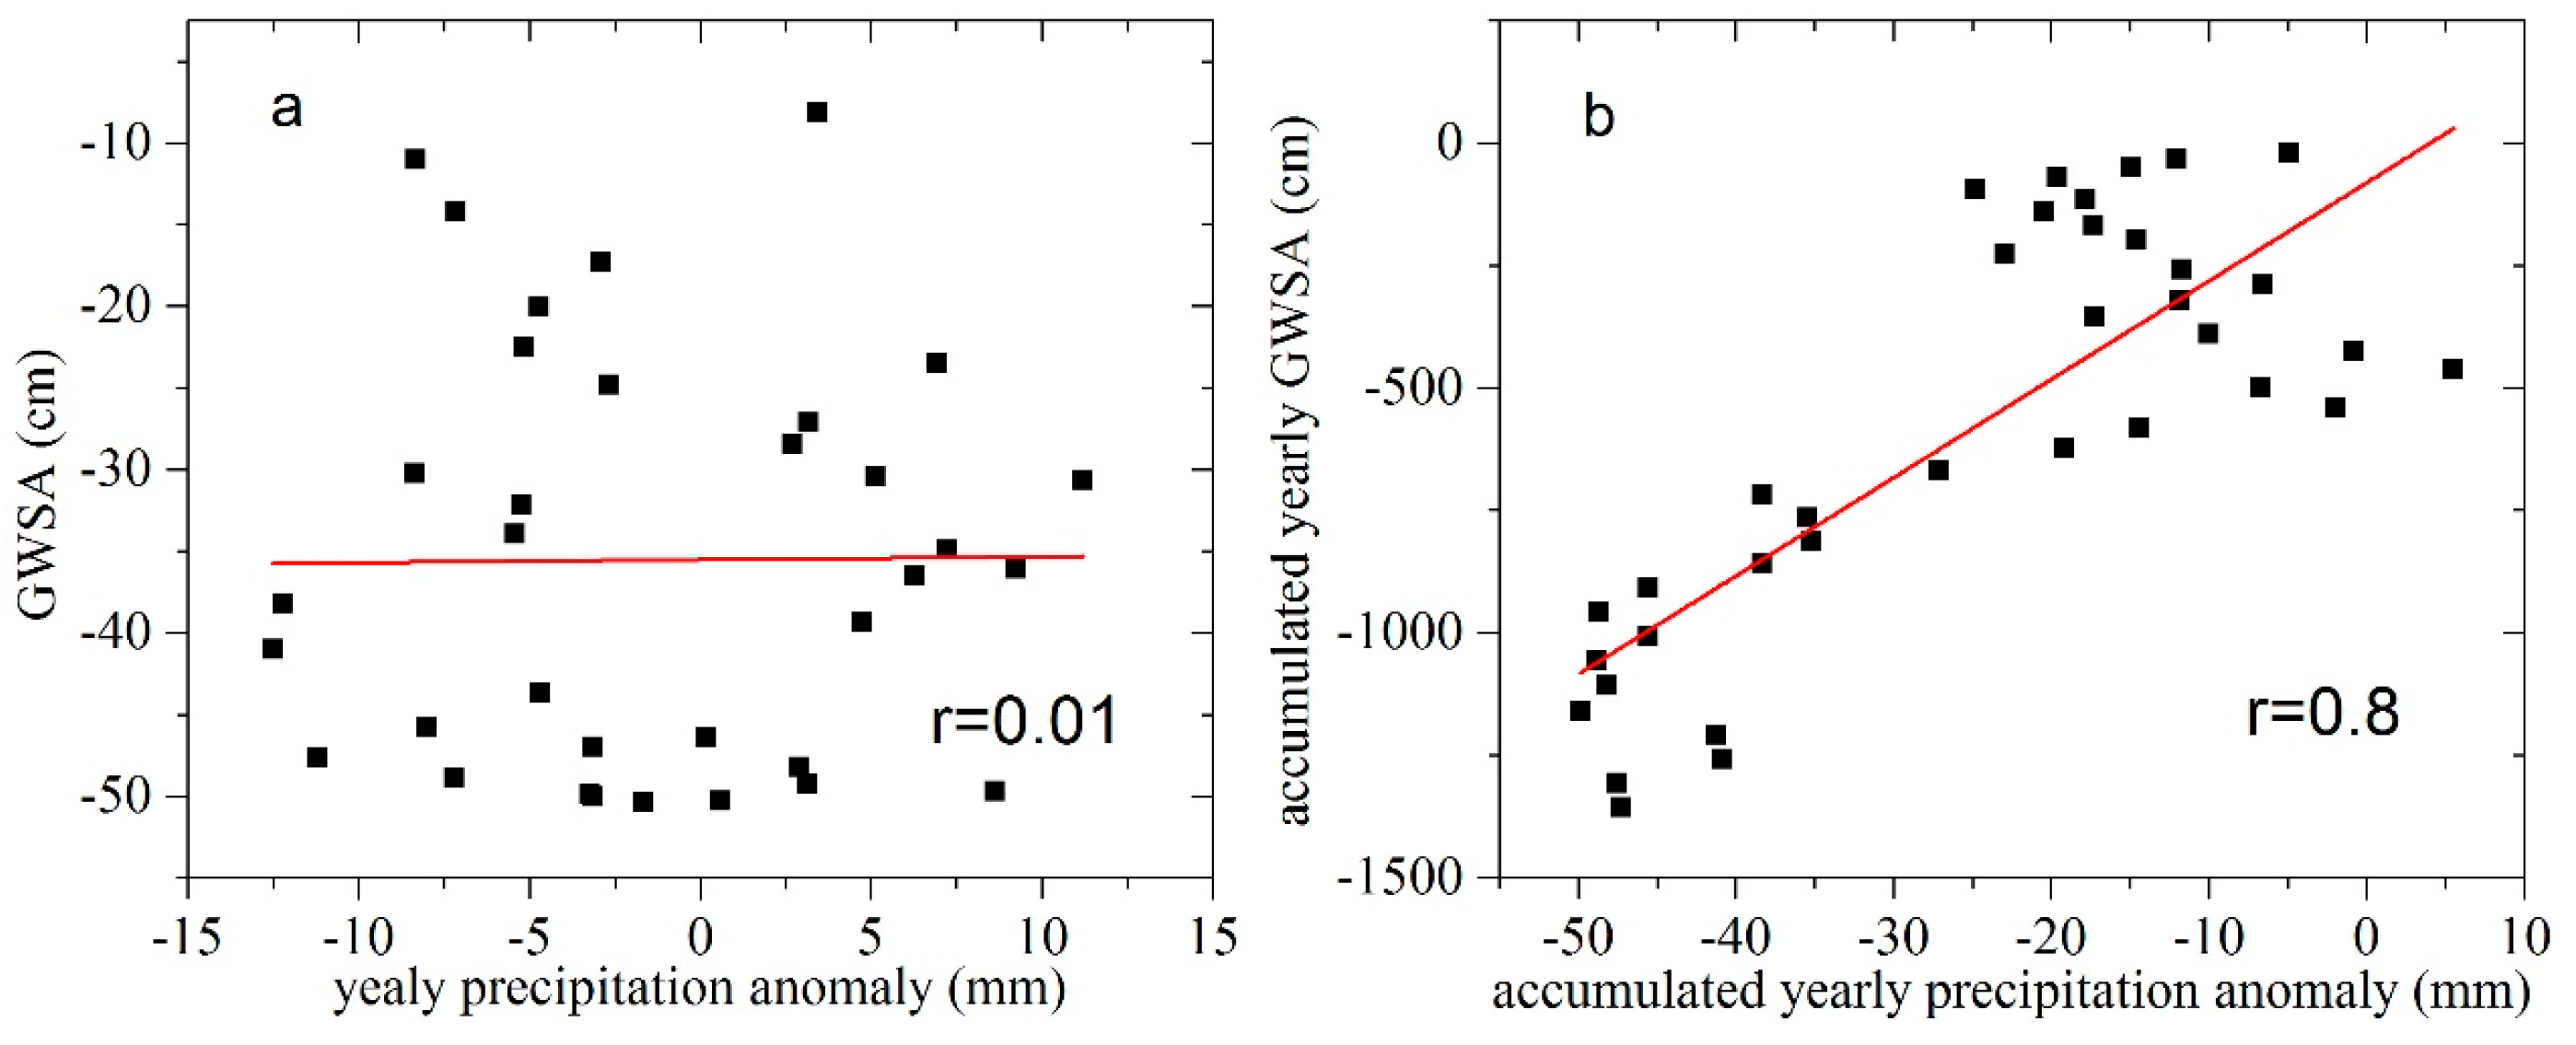
3.2. Precipitation and Water Storage Change

Precipitation is an important factor that influences water storage change directly. In this study, the correlation between precipitation and water storage change is estimated by the Pearson correlation coefficient. Results indicate that precipitation in the Jing-Jin-Ji region has changed in three stages: first, there was a significant increase from 1981 to 1995, and then a rapid decrease from 1996 to 2002, and, finally, there was an increase from 2002 to 2010s (Figure S3a). Spatially, precipitation increased in the southern area but decreased in the Beijing-Tianjin-Tangshan (Jing-Jin-Tang) region (Figure S4).
As Figure 3 and Figure 4 demonstrate, precipitation change pattern is corresponding to TWSA and there is a significant positive correlation between TWSA and precipitation (r = 0.56, p < 0.01) (Figure 5a). The only difference is that TWSA increased while precipitation decreased in 1996. Whereas, although precipitation tended to decrease from 1996, but it was still larger than annual average level and that could be the reason why TWSA increased in 1996. Moreover, the accumulated yearly precipitation anomaly is in deficit almost over the whole period, except 1996 (Figure S3b). The increase in the annual precipitation anomaly from 1984 to 1996 relieved depletion of TWS. The accumulated yearly precipitation anomaly explains about 72% of accumulated yearly TWSA change (Figure 5b).
As shown in Figure 6a, the relation between GWS and precipitation changes is not significant. It seems that precipitation change has little influence on GWS variability. However, precipitation is an important factor to GWS variability. The result shows a high positive correlation between accumulated yearly precipitation anomaly and accumulated yearly GWSA and precipitation change explains 64% of the depletion of GWS (Figure 6b).

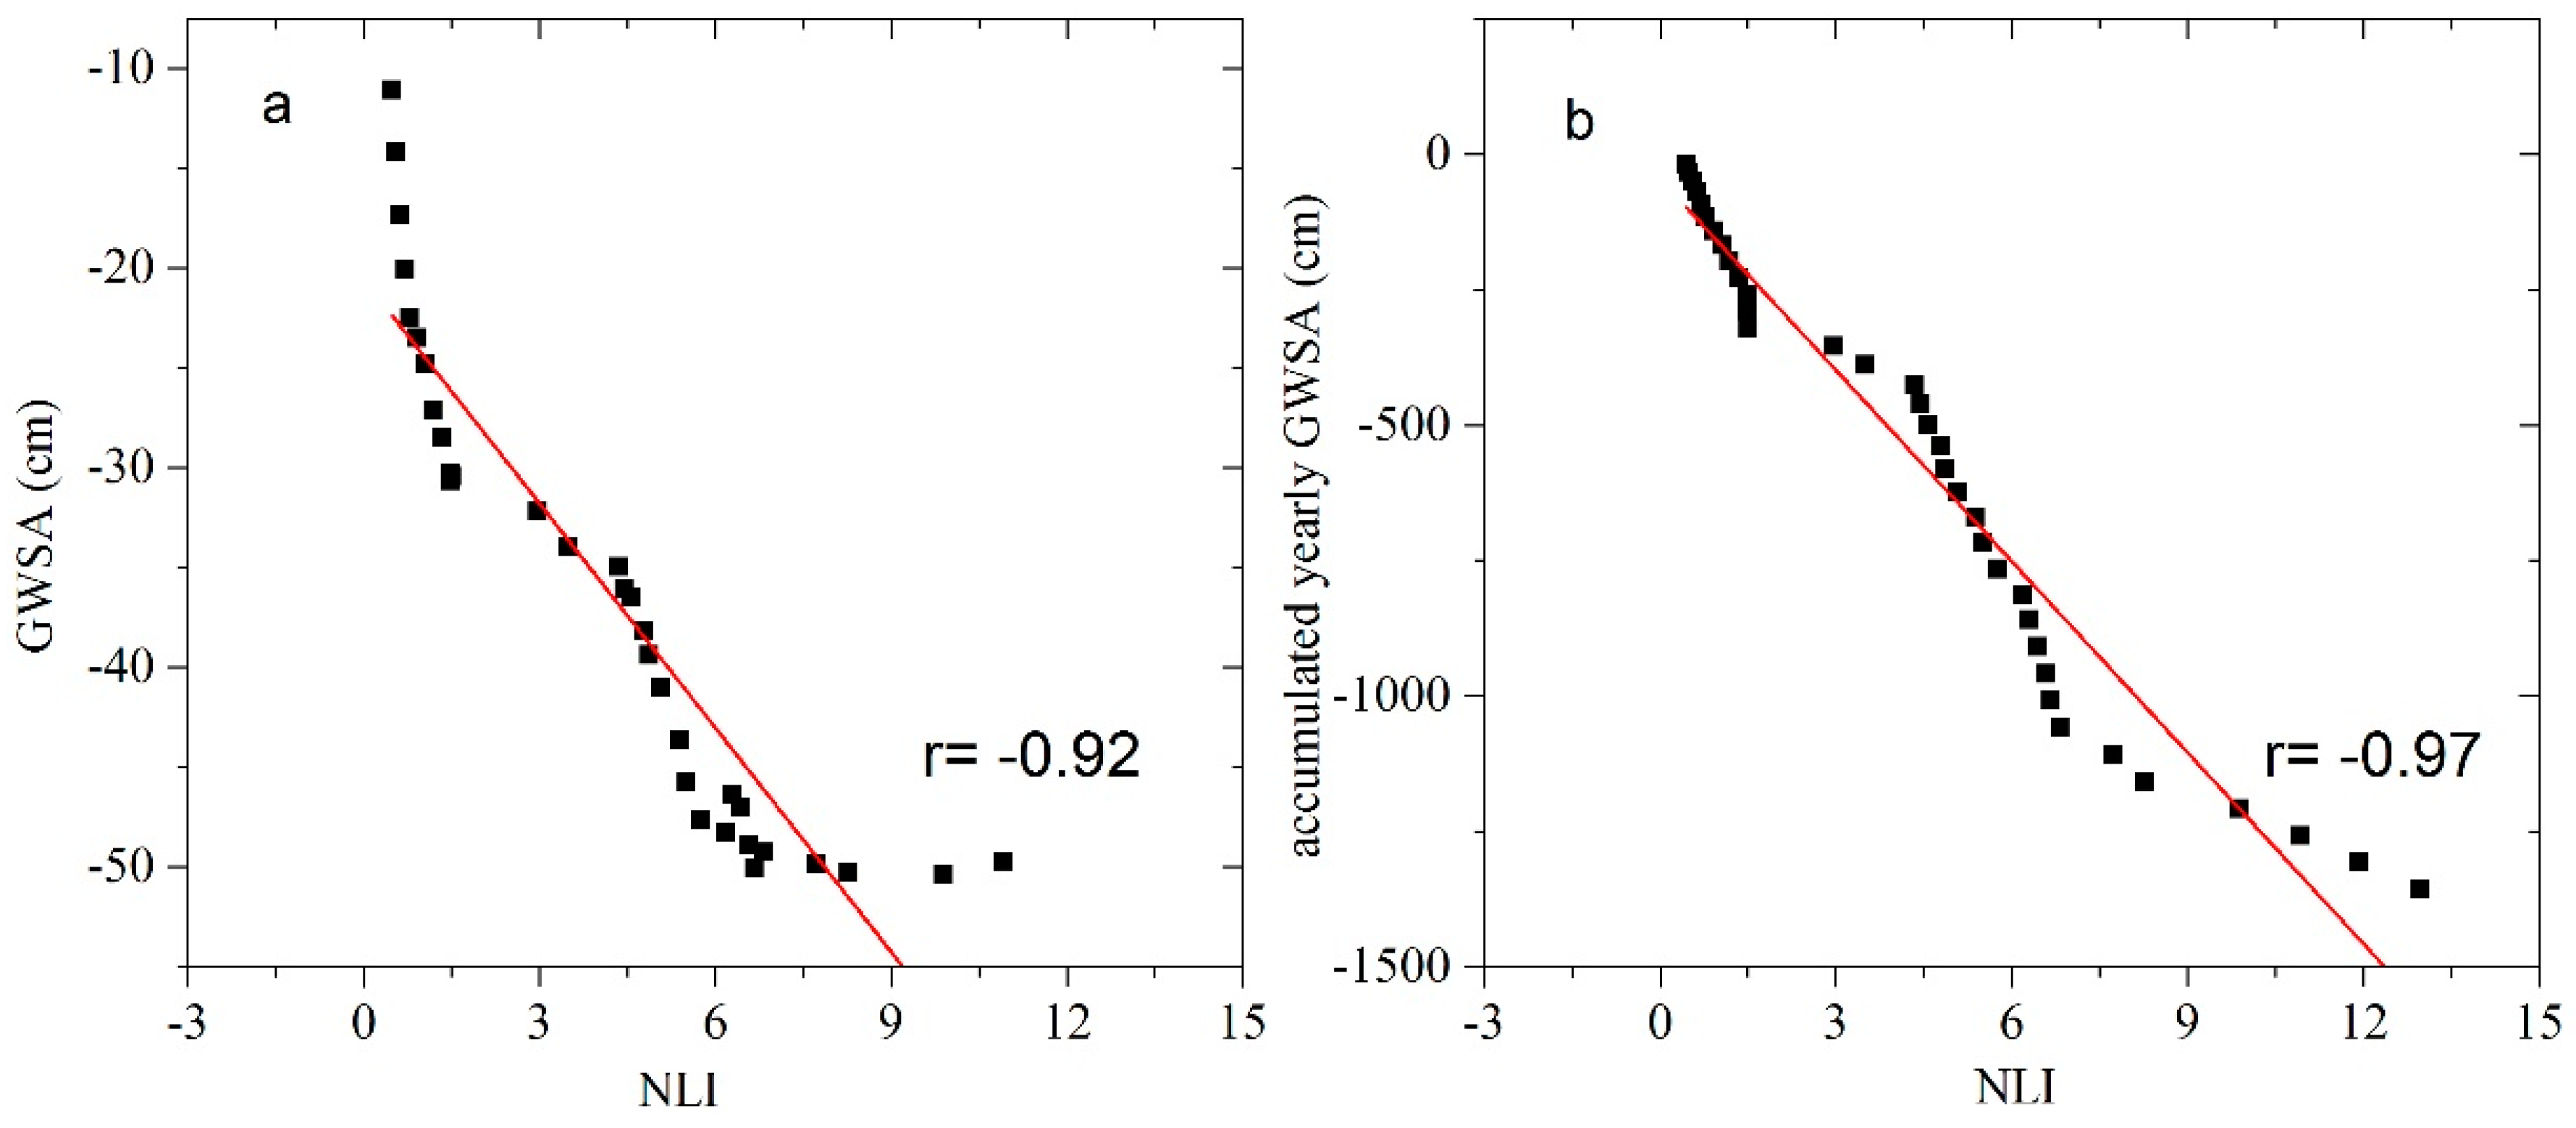
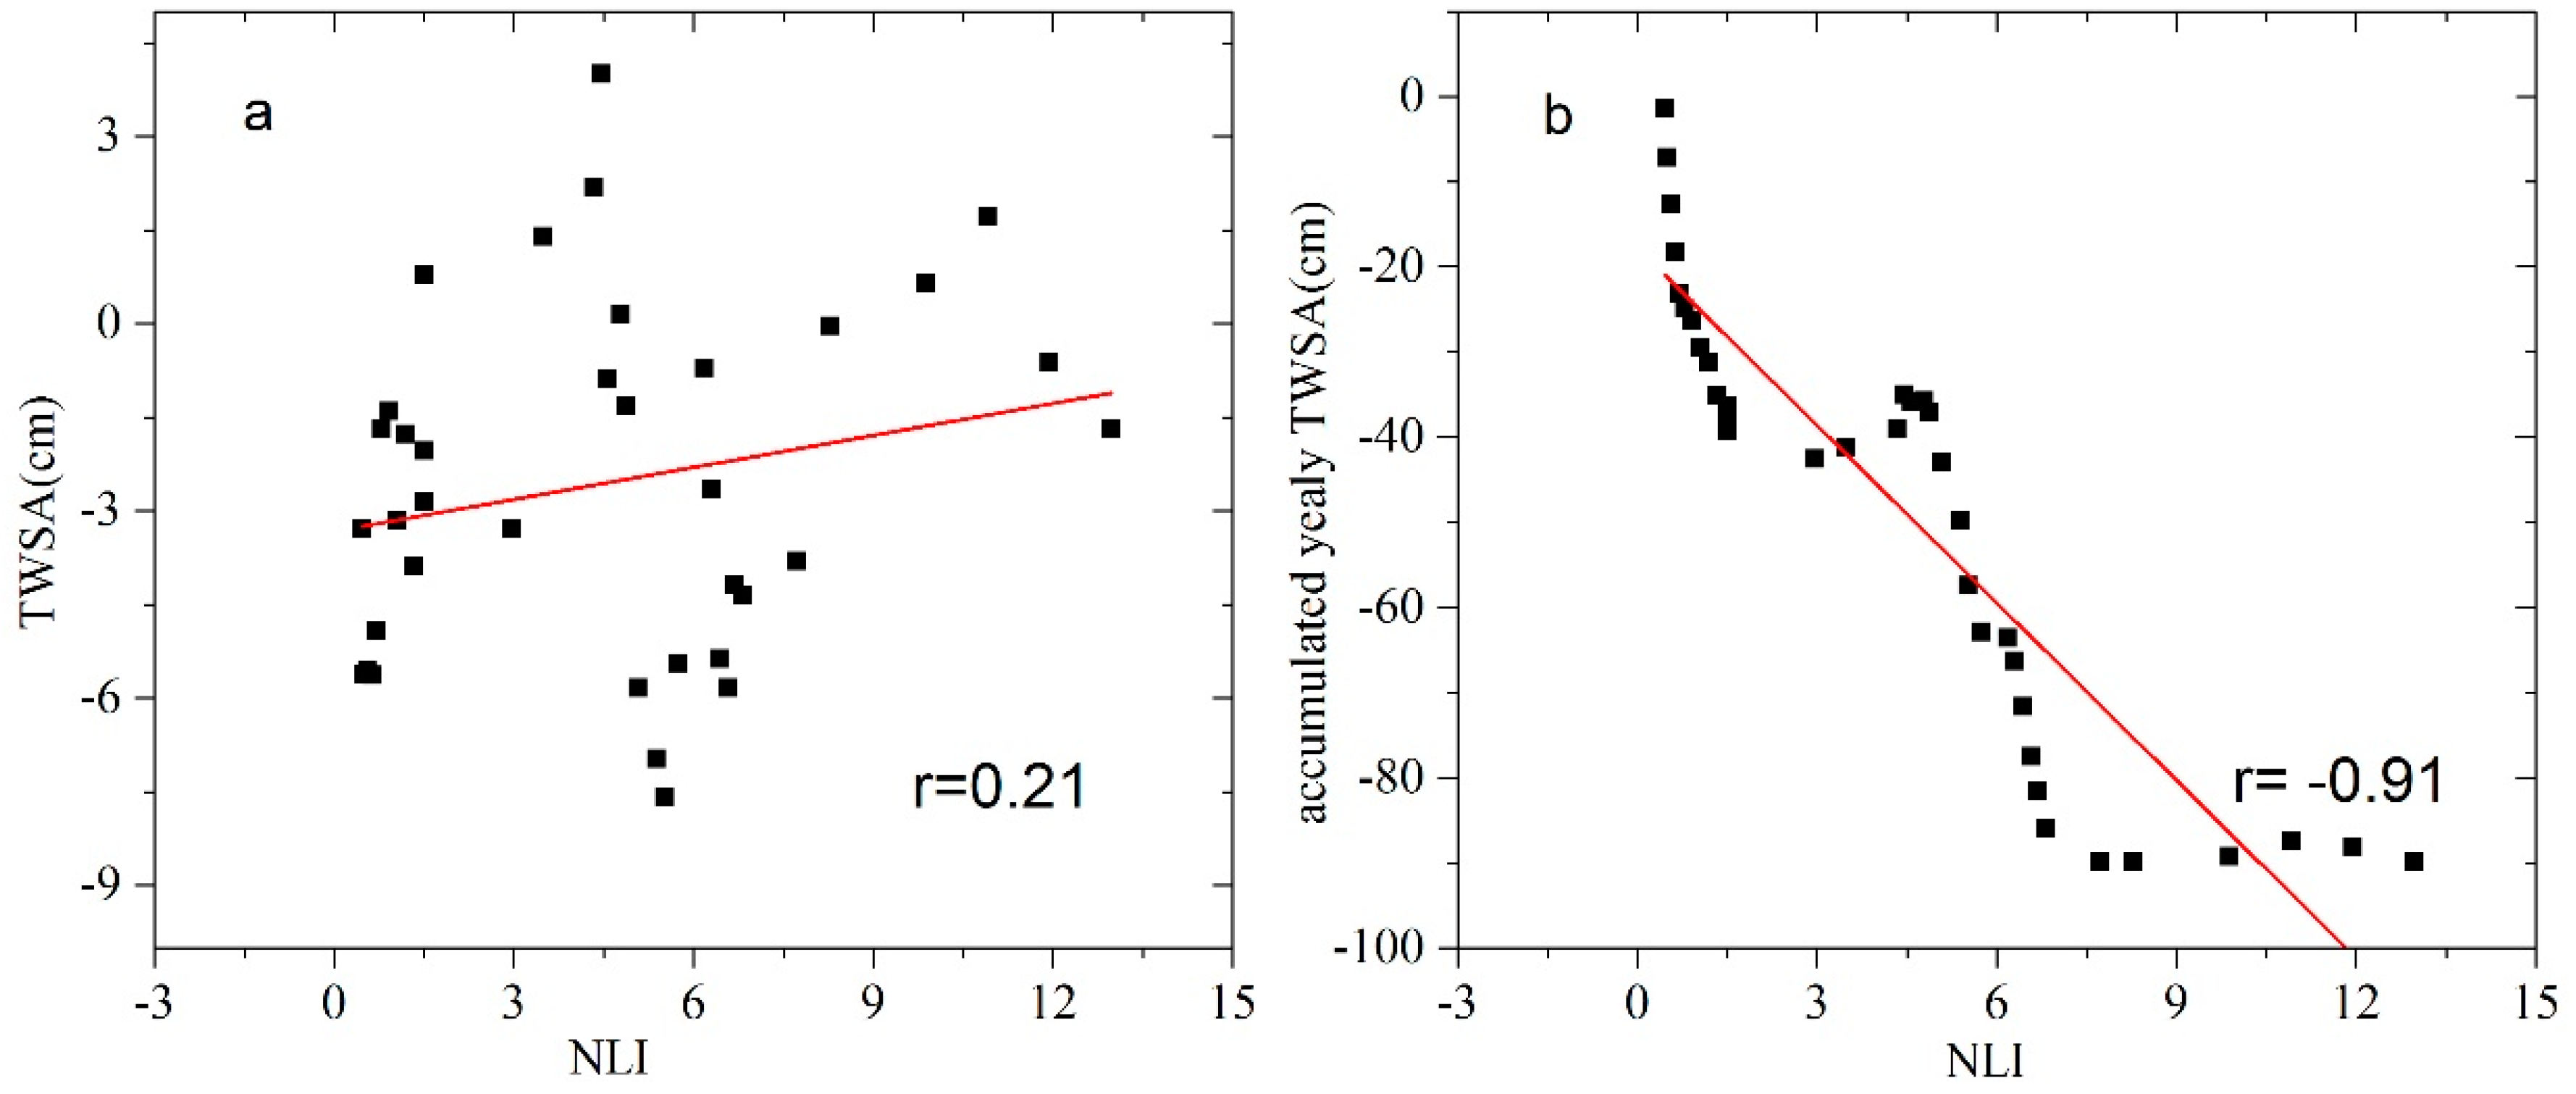
3.3. Urbanization and Water Storage Change

Variation in water storage was also affected by human activities. Since 1980, urbanization is one of the most important human activities in China. Between 1980 and the 2010s, the Jing-Jin-Ji urban agglomeration developed rapidly by about 5651 km2, making urban regions 268% as big as they were in 1980 (Figure S5). Cities in Hebei Province have experienced a slower urbanization process (urban area increased about 1.8%), but urban area increased the most with about 3391 km2 (Figure S6). Beijing had the highest rate of urbanization, with urban areas increasing by about 1538 km2 (approximately 9.2%) during the same period. Urbanization and residential growth increased residents living water consumption (Figure S7). The demand of water supply has led to more groundwater extraction in the last 20 years. Nevertheless, most of the new urban area (about 75%) was converted from cultivated land, and the loss of cultivated land, in turn, resulted in a decrease of agricultural water consumption. Ultimately, total water consumption decreased in the past 20 years as the decreased agricultural and industrial water consumption overcame the water consumption demand arising from the increased population.
The average night light index (NLI) from 1980 to 2015 (exception of 1992 to 2012) was estimated by the significant positive linear relationship between NLI and population (r = 0.97, p < 0.01, Figure S8a). This revealed that urbanization was the direct result of population growth. There is not a significant trend of TWSA with urbanization, but urbanization explains 83% of TWSA deficit (Figure 7). Moreover, soil water storage is the major component of TWS and urbanization has affected it seriously because most of the soil was replaced by an impervious surface during urbanization. However, the accumulated yearly TWSA stops decreasing when urbanization reaches a relative high level.
Urbanization affects GWS more seriously than TWS. Population growth is the major reason for urbanization. In the past 30 years, population growth explains 98% of cumulative groundwater abstraction increase (Figure S8b), despite water supplied by groundwater decreased from 1998 to 2015 (Figure S7). As illustrated in Figure 8a, there is a significant negative correlation between GWSA and urbanization (r = −0.92, p < 0.01), which indicates that urbanization causes GWS decrease in the Jing-Jin-Ji region. Additionally, urbanization is a cumulative process. A large fraction of variation in accumulated yearly GWSA can be explained by urbanization (94%, Figure 8b).
Overall, urbanization is the relative important factor to variability in total water storage in the Jing-Jin-Ji region. Firstly, urbanization increased groundwater deficit. Secondly, land use/land cover change (LUCC) changed land surface characteristics and water permeability and the groundwater recharge decreased during urbanization development.

4. Discussion

Water storage variability has been studied at global scale and regional scale. Most previous studies focused on the hot-spot area, such as the Tibet plateau, and there are few studies of water storage change in urban areas. On the one hand, urban areas are small in general. Most of the datasets are too coarse to study water storage change in the urban areas. On the other hand, fresh water shortage in urban areas attracts more attention than other water resources. However, total water storage change is also an important factor for large urban agglomerations.
Between 1979 and the 2010s, water storage decreased significantly [36], and GWS decreased more significantly than TWS. As shown in Figure 3a, the number of TWSAs is less than 0 in most years. Even so, difference values between two years are small and cannot reflect the depletion of water storage. Moreover, the rate of recharge of GWS is slow and GWS cannot vary immediately when the precipitation rate changes. It needs a relatively long time to recover GWS, and the depletion of GWS is a cumulative result. Thus, the cumulative effect was considered in our work, including precipitation anomaly yearly accumulation, TWSA yearly accumulation, GWSA yearly accumulation and urbanization. In the previous studies, the cumulative effect is usually ignored [15]. The accumulated precipitation anomaly, TWSA and GWSA illustrate water shortage in the Jing-Jin-Ji region very well. In addition, cumulative effect could affect estimation of the relationship between water storage change and driving factors. In this condition, we found that precipitation deficit is important to both of TWS and GWS shortage. In this paper, soil water storage is the major component and affected by precipitation change easily. Moreover, the precipitation deficit reduced the recharge of groundwater and the abstraction further intensified the depletion of GWS.
In addition, LUCC was found to influence the hydrological cycle including precipitation, evapotranspiration, infiltration and runoff [37]. Evapotranspiration decreased rapidly from 1980 to 1998, and then decreased slightly from 1999 to 2015 (Figure S9a). This study examined the nonlinear relationship between evapotranspiration and land cover change by Spearman’s rank correlation coefficient. Results revealed a significant correlation between evapotranspiration variation and LUCC (Figure S9b,c). The annual average of evapotranspiration decreased with the reduction of cultivated land, which indicates a significant positive relationship between them (r = 0.86, p < 0.01). Since irrigation is common in the Jing-Jin-Ji plain area, the reduction of irrigation arising from the loss of cultivated land during urbanization resulted in a decrease in evapotranspiration [38]. Therefore, it formed a highly significant negative relationship between the evapotranspiration anomaly (annual average) and urban area (r = −0.93, p < 0.01). This finding is derived from the fact that the evaporation capacity decreased as the surface became more impervious during the urbanization process [39]. It also confirms that the runoff increase is highly correlated with urban expansion [5].
Overall, both urbanization and precipitation change influence the urban hydrological cycle and water storage change. The findings suggest that urbanization coupled with precipitation deficit has a stronger impact on the depletion of both TWS and GWS than climate change only in the Jing-Jin-Ji region. Additionally, TWS is influenced more easily by precipitation than GWS, while urbanization has more impact on GWS than TWS.

5. Conclusions

The Beijing-Tianjin-Hebei urban agglomeration (the Jing-Jin-Ji region) was selected as the study area for investigating water storage change and its correlation with climate change and anthropogenic activity. The GLDAS and E2O outputs were used to detect the variation patterns of water storage between 1979 and the 2010s.
It was found that the TWSA decreased slightly and varied in three stages: first, there was a significant increase in water storage from 1981 to 1996, and then there was a rapid decrease from 1996 to 2002. Finally, there was an increase in water storage from 2002 to 2010s. TWSA in the Jing-Jin-Ji region was in a deficit, although this state was distinctly ameliorated from 1992 to 1995. Spatially, TWSA declined significantly in the middle of the Jing-Jin-Ji region and increased in the southern region of Hebei Province. From 1979 to the 2010s, GWS decreased rapidly and continuously, declining about 41.5 cm (500% of GW in 1979). Change in GWS showed significant declines in the whole plain area that was observed (about 66.3% of the Jing-Jing-Ji region), including the entirety of Beijing, Tianjin, Tangshan, and the southern region of Hebei Province. In the southern region of Hebei Province (part of the Jing-Jin-Ji plain), GWS declined rapidly and, obviously, at a rate of approximately 0.22 cm/yr, while in the northeast area, groundwater storage showed a slightly increased trend (less than 0.002 cm/yr).
To further investigate the relationship among water storage change, urbanization and precipitation, the accumulations of TWSA, GWS and precipitation yearly anomaly were also examined. Results indicate that urbanization coupled with precipitation deficit have a stronger impact on the depletion of both TWS and GWS in the Jing-Jin-Ji region than climate change. TWS is influenced more easily by precipitation than GWS, and urbanization has more impact on GWS than TWS.

Supplementary Materials

The following are available online at www.mdpi.com/2072-4292/10/1/4/s1, Figure S1: The yearly water table depth of the Jing-Jin-Ji plain from 1980 to 2010 (Li et al., 2017b), Figure S2: The accumulated yearly TWSA from 1980 to 2010s, where red bar mark the year from 1992 to 1995, Figure S3: (a) The yearly precipitation anomaly from 1979 to 2010s; (b) The accumulated yearly precipitation anomaly from 1980 to 2010s, Figure S4: Change in precipitation based on observation stations from 1979 to 2015 in the Jing-Jin-Ji area, as estimated by linear regression, Figure S5: The urbanization process of Beijing, Tianjin and Hebei in 1980 and 2015. Land cover maps of the Jing-Jin-Ji region in 1980 and 2015 were obtained and urban areas (bars) and percentages of urban areas (lines) of Beijing, Tianjin and Hebei were calculated in 1980 and 2015, Figure S6: The process of urbanization in the Jing-Jin-Ji region from 1980 to 2015, Figure S7: Water consumption utilized for agricultural, living and industrial purposes from 1998 to 2015 and groundwater supplies, Figure S8: (a) The correlation between population and NLI; (b) The correlation between population and accumulated groundwater abstraction, Figure S9: Variation in the annual evapotranspiration average and its relationship with LUCC. (a) The trend and variability of annual evapotranspiration anomaly average in the Jing-Jin-Ji region from 1980 to 2015; (b) The relationship between cultivated land area and evapotranspiration; (c) The relationship between urban areas and evapotranspiration.

Acknowledgments

This study was supported by the National Key Research and Development Program of China (2016YFC0503002) and the National Natural Science Foundation of China (41571077). We would like to thank Petra Döll with the Institute of Physical Geography, Goethe University Frankfurt, Germany, for her providing the WGHM output. We would like to thank NASA for providing GLDAS outputs (http://disc.sci.gsfc.nasa.gov/hydrology/data-holdings) and EartH2Observe for providing E2O outputs (https://wci.earth2observe.eu/data/group/earth2observe?page=2).

Author Contributions

Z.C. and W.J. conceived this research. Z.C. and W.J. wrote the manuscript. W.W. contributed to the discussion and edited the manuscript. Y.D., B.H. and K.J. performed the main data analysis. All authors discussed and reviewed the manuscript.

Conflicts of Interest

The authors declare no conflict of interest.

References

  1. Long, D.; Pan, Y.; Zhou, J.; Chen, Y.; Hou, X.Y.; Hong, Y.; Scanlon, B.R.; Longuevergne, L. Global analysis of spatiotemporal variability in merged total water storage changes using multiple GRACE products and global hydrological models. Remote Sens. Environ. 2017, 192, 198–216. [Google Scholar] [CrossRef]
  2. He, C.Y.; Gao, B.; Huang, Q.X.; Ma, Q.; Dou, Y.Y. Environmental degradation in the urban areas of China: Evidence from multi-source remote sensing data. Remote Sens. Environ. 2017, 193, 65–75. [Google Scholar] [CrossRef]
  3. Bai, X.M.; Shi, P.J.; Liu, Y.S. Realizing China’s urban dream. Nature 2014, 509, 158–160. [Google Scholar] [CrossRef] [PubMed]
  4. Liu, F.; Zhang, Z.X.; Shi, L.F.; Zhao, X.L.; Xu, J.Y.; Yi, L.; Liu, B.; Wen, Q.K.; Hu, S.G.; Wang, X.; et al. Urban expansion in China and its spatial-temporal differences over the past four decades. J. Geogr. Sci. 2016, 26, 1477–1496. [Google Scholar] [CrossRef]
  5. Sun, Z.C.; Li, X.W.; Fu, W.X.; Li, Y.K.; Tang, D.S. Long-term effects of land use/land cover change on surface runoff in urban areas of Beijing, China. J. Appl. Remote Sens. 2014, 8, 084596. [Google Scholar] [CrossRef]
  6. Bosmans, J.H.C.; van Beek, L.P.H.; Sutanudjaja, E.H.; Bierkens, M.F.P. Hydrological impacts of global land cover change and human water use. Hydrol. Earth Syst. Sci. Discuss. 2016, 21, 5603. [Google Scholar] [CrossRef]
  7. Koirala, S.; Jung, M.; Reichstein, M.; de Graaf, I.E.M.; Camps-Valls, G.; Ichii, K.; Papale, D.; Raduly, B.; Schwalm, C.R.; Tramontana, G.; et al. Global distribution of groundwater-vegetation spatial covariation. Geophys. Res. Lett. 2017, 44, 4134–4142. [Google Scholar] [CrossRef]
  8. Alsdorf, D.; Han, S.C.; Bates, P.; Melack, J. Seasonal water storage on the Amazon floodplain measured from satellites. Remote Sens. Environ. 2010, 114, 2448–2456. [Google Scholar] [CrossRef]
  9. Asoka, A.; Gleeson, T.; Wada, Y.; Mishra, V. Relative contribution of monsoon precipitation and pumping to changes in groundwater storage in India. Nat. Geosci. 2017, 10, 109–117. [Google Scholar] [CrossRef]
  10. Matsuo, K.; Heki, K. Anomalous precipitation signatures of the Arctic Oscillation in the time-variable gravity field by GRACE. Geophys. J. Int. 2012, 190, 1495–1506. [Google Scholar] [CrossRef]
  11. Suzuki, K.; Matsuo, K.; Hiyama, T. Satellite gravimetry-based analysis of terrestrial water storage and its relationship with run-off from the Lena River in Eastern Siberia. Int. J. Remote Sens. 2016, 37, 2198–2210. [Google Scholar] [CrossRef]
  12. Awange, J.L.; Forootan, E.; Kuhn, M.; Kusche, J.; Heck, B. Water storage changes and climate variability within the Nile Basin between 2002 and 2011. Adv. Water Resour. 2014, 73, 1–15. [Google Scholar] [CrossRef]
  13. Rodell, M.; Houser, P.R.; Jambor, U.; Gottschalck, J.; Mitchell, K.; Meng, C.J.; Arsenault, K.; Cosgrove, B.; Radakovich, J.; Bosilovich, M.; et al. The global land data assimilation system. Bull. Am. Meteorol. Soc. 2004, 85, 381–394. [Google Scholar] [CrossRef]
  14. Döll, P.; Kaspar, F.; Lehner, B. A global hydrological model for deriving water availability indicators: Model tuning and validation. J. Hydrol. 2003, 270, 105–134. [Google Scholar] [CrossRef]
  15. Deng, H.J.; Chen, Y.N. Influences of recent climate change and human activities on water storage variations in Central Asia. J. Hydrol. 2017, 544, 46–57. [Google Scholar] [CrossRef]
  16. Huang, Y.; Salama, M.S.; Krol, M.S.; van der Velde, R.; Hoekstra, A.Y.; Zhou, Y.; Su, Z. Analysis of long-term terrestrial water storage variations in the Yangtze River basin. Hydrol. Earth Syst. Sci. 2013, 17, 1985–2000. [Google Scholar] [CrossRef]
  17. Mo, X.Y.; Wu, J.J.; Wang, Q.; Zhou, H. Variations in water storage in China over recent decades from GRACE observations and GLDAS. Nat. Hazards Earth Syst. Sci. 2016, 16, 469–482. [Google Scholar] [CrossRef]
  18. Huang, Y.; Salama, M.S.; Krol, M.S.; Su, Z.B.; Hoekstra, A.Y.; Zeng, Y.J.; Zhou, Y.X. Estimation of human-induced changes in terrestrial water storage through integration of GRACE satellite detection and hydrological modeling: A case study of the Yangtze River basin. Water Resour. Res. 2015, 51, 8494–8516. [Google Scholar] [CrossRef]
  19. Awange, J.L.; Anyah, R.; Agola, N.; Forootan, E.; Omondi, P. Potential impacts of climate and environmental change on the stored water of Lake Victoria Basin and economic implications. Water Resour. Res. 2013, 49, 8160–8173. [Google Scholar] [CrossRef]
  20. McGrane, S.J. Impacts of urbanization on hydrological and water quality dynamics, and urban water management: A review. Hydrol. Sci. J. 2016, 61, 2295–2311. [Google Scholar] [CrossRef]
  21. Tan, M.H.; Li, X.B.; Xie, H.; Lu, C.H. Urban land expansion and arable land loss in China—A case study of Beijing-Tianjin-Hebei region. Land Use Policy 2005, 22, 187–196. [Google Scholar] [CrossRef]
  22. Wu, W.J.; Zhao, S.Q.; Zhu, C.; Jiang, J.L. A comparative study of urban expansion in Beijing, Tianjin and Shijiazhuang over the past three decades. Landsc. Urban Plan. 2015, 134, 93–106. [Google Scholar] [CrossRef]
  23. Li, X.; Ye, S.Y.; Wei, A.H.; Zhou, P.P.; Wang, L.H. Modelling the response of shallow groundwater levels to combined climate and water-diversion scenarios in Beijing-Tianjin-Hebei Plain, China. Hydrogeol. J. 2017. [Google Scholar] [CrossRef]
  24. Jiang, D.; Zhuang, D.F.; Xu, X.L.; Ying, L. Integrated evaluation of urban development suitability based on remote sensing and GIS techniques—A case study in Jingjinji Area, China. Sensors 2008, 8, 5975–5986. [Google Scholar] [CrossRef]
  25. Shi, Y.S.; Xiao, J.Y.; Shen, Y.J.; Yamaguchi, Y. Quantifying the spatial differences of landscape change in the Hai River Basin, China, in the 1990s. Int. J. Remote Sens. 2012, 33, 4482–4501. [Google Scholar] [CrossRef]
  26. Gao, M.L.; Gong, H.L.; Chen, B.B.; Zhou, C.F.; Chen, W.F.; Liang, Y.; Shi, M.; Si, Y. InSAR time-series investigation of long-term ground displacement at Beijing Capital International Airport, China. Tectonophysics 2016, 691, 271–281. [Google Scholar] [CrossRef]
  27. Webber, M.; Crow-Miller, B.; Rogers, S. The South–North water transfer project: Remaking the geography of China. Reg. Stud. 2017, 51, 370–382. [Google Scholar] [CrossRef]
  28. Wang, J.; Huang, B.; Fu, D.J.; Atkinson, P.M.; Zhang, X.Z. Response of urban heat island to future urban expansion over the Beijing-Tianjin-Hebei metropolitan area. Appl. Geogr. 2016, 70, 26–36. [Google Scholar] [CrossRef]
  29. EartH2Observe “Global Earth Observation for Integrated Water Resource Assessment”. Available online: http://www.earth2observe.eu/ (accessed on 14 December 2017).
  30. Gao, B.; Huang, Q.X.; He, C.Y.; Ma, Q. Dynamics of urbanization levels in China from 1992 to 2012: Perspective from DMSP/OLS nighttime light data. Remote Sens. 2015, 7, 1721–1735. [Google Scholar] [CrossRef]
  31. Fan, J.F.; Ma, T.; Zhou, C.H.; Zhou, Y.K.; Xu, T. Comparative estimation of urban development in China’s cities using socioeconomic and DMSP/OLS night light data. Remote Sens. 2014, 6, 7840–7856. [Google Scholar] [CrossRef]
  32. Ma, T.; Zhou, C.H.; Pei, T.; Haynie, S.; Fan, J.F. Quantitative estimation of urbanization dynamics using time series of DMSP/OLS nighttime light data: A comparative case study from China’s cities. Remote Sens. Environ. 2012, 124, 99–107. [Google Scholar] [CrossRef]
  33. Jiang, W.G.; Yuan, L.H.; Wang, W.J.; Cao, R.; Zhang, Y.F.; Shen, W.M. Spatio-temporal analysis of vegetation variation in the Yellow River Basin. Ecol. Indic. 2015, 51, 117–126. [Google Scholar] [CrossRef]
  34. Guo, W.; Ni, X.N.; Jing, D.Y.; Li, S.H. Spatial-temporal patterns of vegetation dynamics and their relationships to climate variations in Qinghai Lake Basin using MODIS time-series data. J. Geogr. Sci. 2014, 24, 1009–1021. [Google Scholar] [CrossRef]
  35. Li, X.; Zhang, Y.; Zhou, P.P.; Ye, S.Y. Dynamics and evolution of the groundwater in Beijing-Tianjin-Hebei Plain in a long time scale. J. Arid Land Resour. Environ. 2017, 31, 164–170. (In Chinese) [Google Scholar]
  36. Chen, Z.; Jiang, W.G.; Wu, J.J.; Chen, K.; Deng, Y.; Jia, K.; Mo, X.Y. Detection of the spatial patterns of water storage variation over China in recent 70 years. Sci. Rep. 2017, 7, 6423. [Google Scholar] [CrossRef] [PubMed]
  37. Yin, J.; He, F.; Xiong, Y.J.; Qiu, G.Y. Effect of land use/land cover and climate changes on surface runoff in a semi-humid and semi-arid transition zone in Northwest China. Hydrol. Earth Syst. Sci. 2017, 21, 183–196. [Google Scholar] [CrossRef]
  38. Huang, Z.Y.; Pan, Y.; Gong, H.L.; Yeh, P.J.F.; Li, X.J.; Zhou, D.M.; Zhao, W.J. Subregional-scale groundwater depletion detected by GRACE for both shallow and deep aquifers in North China Plain. Geophys. Res. Lett. 2015, 42, 1791–1799. [Google Scholar] [CrossRef]
  39. Tang, T.; Ran, S.H.; Tan, M.H. Urbanization and its impact on the evapotranspiration in Beijing-Tianjin-Tangshan area. J. Geo-Inf. Sci. 2013, 15, 233–240. (In Chinese) [Google Scholar] [CrossRef]
Figure 1. The location of the Jing-Jin-Ji region and main cities observed in this study.
Remotesensing 10 00004 g001
Figure 2. Evaluation of TWSA and GWS derived from GLDAS and E2O, respectively. (a) evaluation of TWSA derived from GLDAS with that derived from WGHM and E2O; (b) evaluation of GWS derived from E2O with that derived from WGHM.
Remotesensing 10 00004 g002
Figure 3. Variation patterns of TWSA and GWS in the Jing-Jin-Ji region. (a) changes of monthly TWSA from 1979 to 2010s, where red lines indicate linear fitting results of three various stages; (b) changes in monthly GWS from 1979 to the 2010s.
Remotesensing 10 00004 g003
Figure 4. Spatial patterns of changes in TWS and GWS in the Jing-Jin-Ji region estimated by TS and MK methods, respectively, with statistical significance at the 5% level. (a) monthly trends in TWS from 1979 to the 2010s; (b) monthly trends in GWS from 1979 to the 2010s.
Remotesensing 10 00004 g004
Figure 5. The relationship between precipitation and TWS as evaluated by the Pearson correlation coefficient at the 5% level. (a) The relationship between the precipitation anomaly and TWSA (r = 0.56, p < 0.01); (b) The relationship between accumulated precipitation anomaly and TWSA (r = 0.85, p < 0.01).
Remotesensing 10 00004 g005
Figure 6. The relationship between precipitation and GWS anomaly (GWSA) as evaluated by the Pearson correlation coefficient at the 5% level. (a) the relationship between the precipitation anomaly and GWSA (r = 0.01, p > 0.05); (b) the relationship between accumulated precipitation anomaly and GWSA (r = 0.80, p < 0.01).
Remotesensing 10 00004 g006
Figure 7. The relationship between night light index (NLI) and TWSA as evaluated by the Pearson correlation coefficient at the 5% level. (a) the relationship between NLI and TWSA (r = 0.21, p > 0.05); (b) the relationship between NLI and accumulated yearly TWSA (r = −0.91, p < 0.01).
Remotesensing 10 00004 g007
Figure 8. The relationship between night light index (NLI) and GWSA as evaluated by the Pearson correlation coefficient at the 5% level. (a) the relationship between NLI and GWSA (r = −0.92, p < 0.01); (b) the relationship between NLI and accumulated yearly GWSA (r = −0.97, p < 0.01).
Remotesensing 10 00004 g008

