The authors wish to make the following corrections to this paper [
1]:
Old graphical abstract:
Revised graphical abstract:
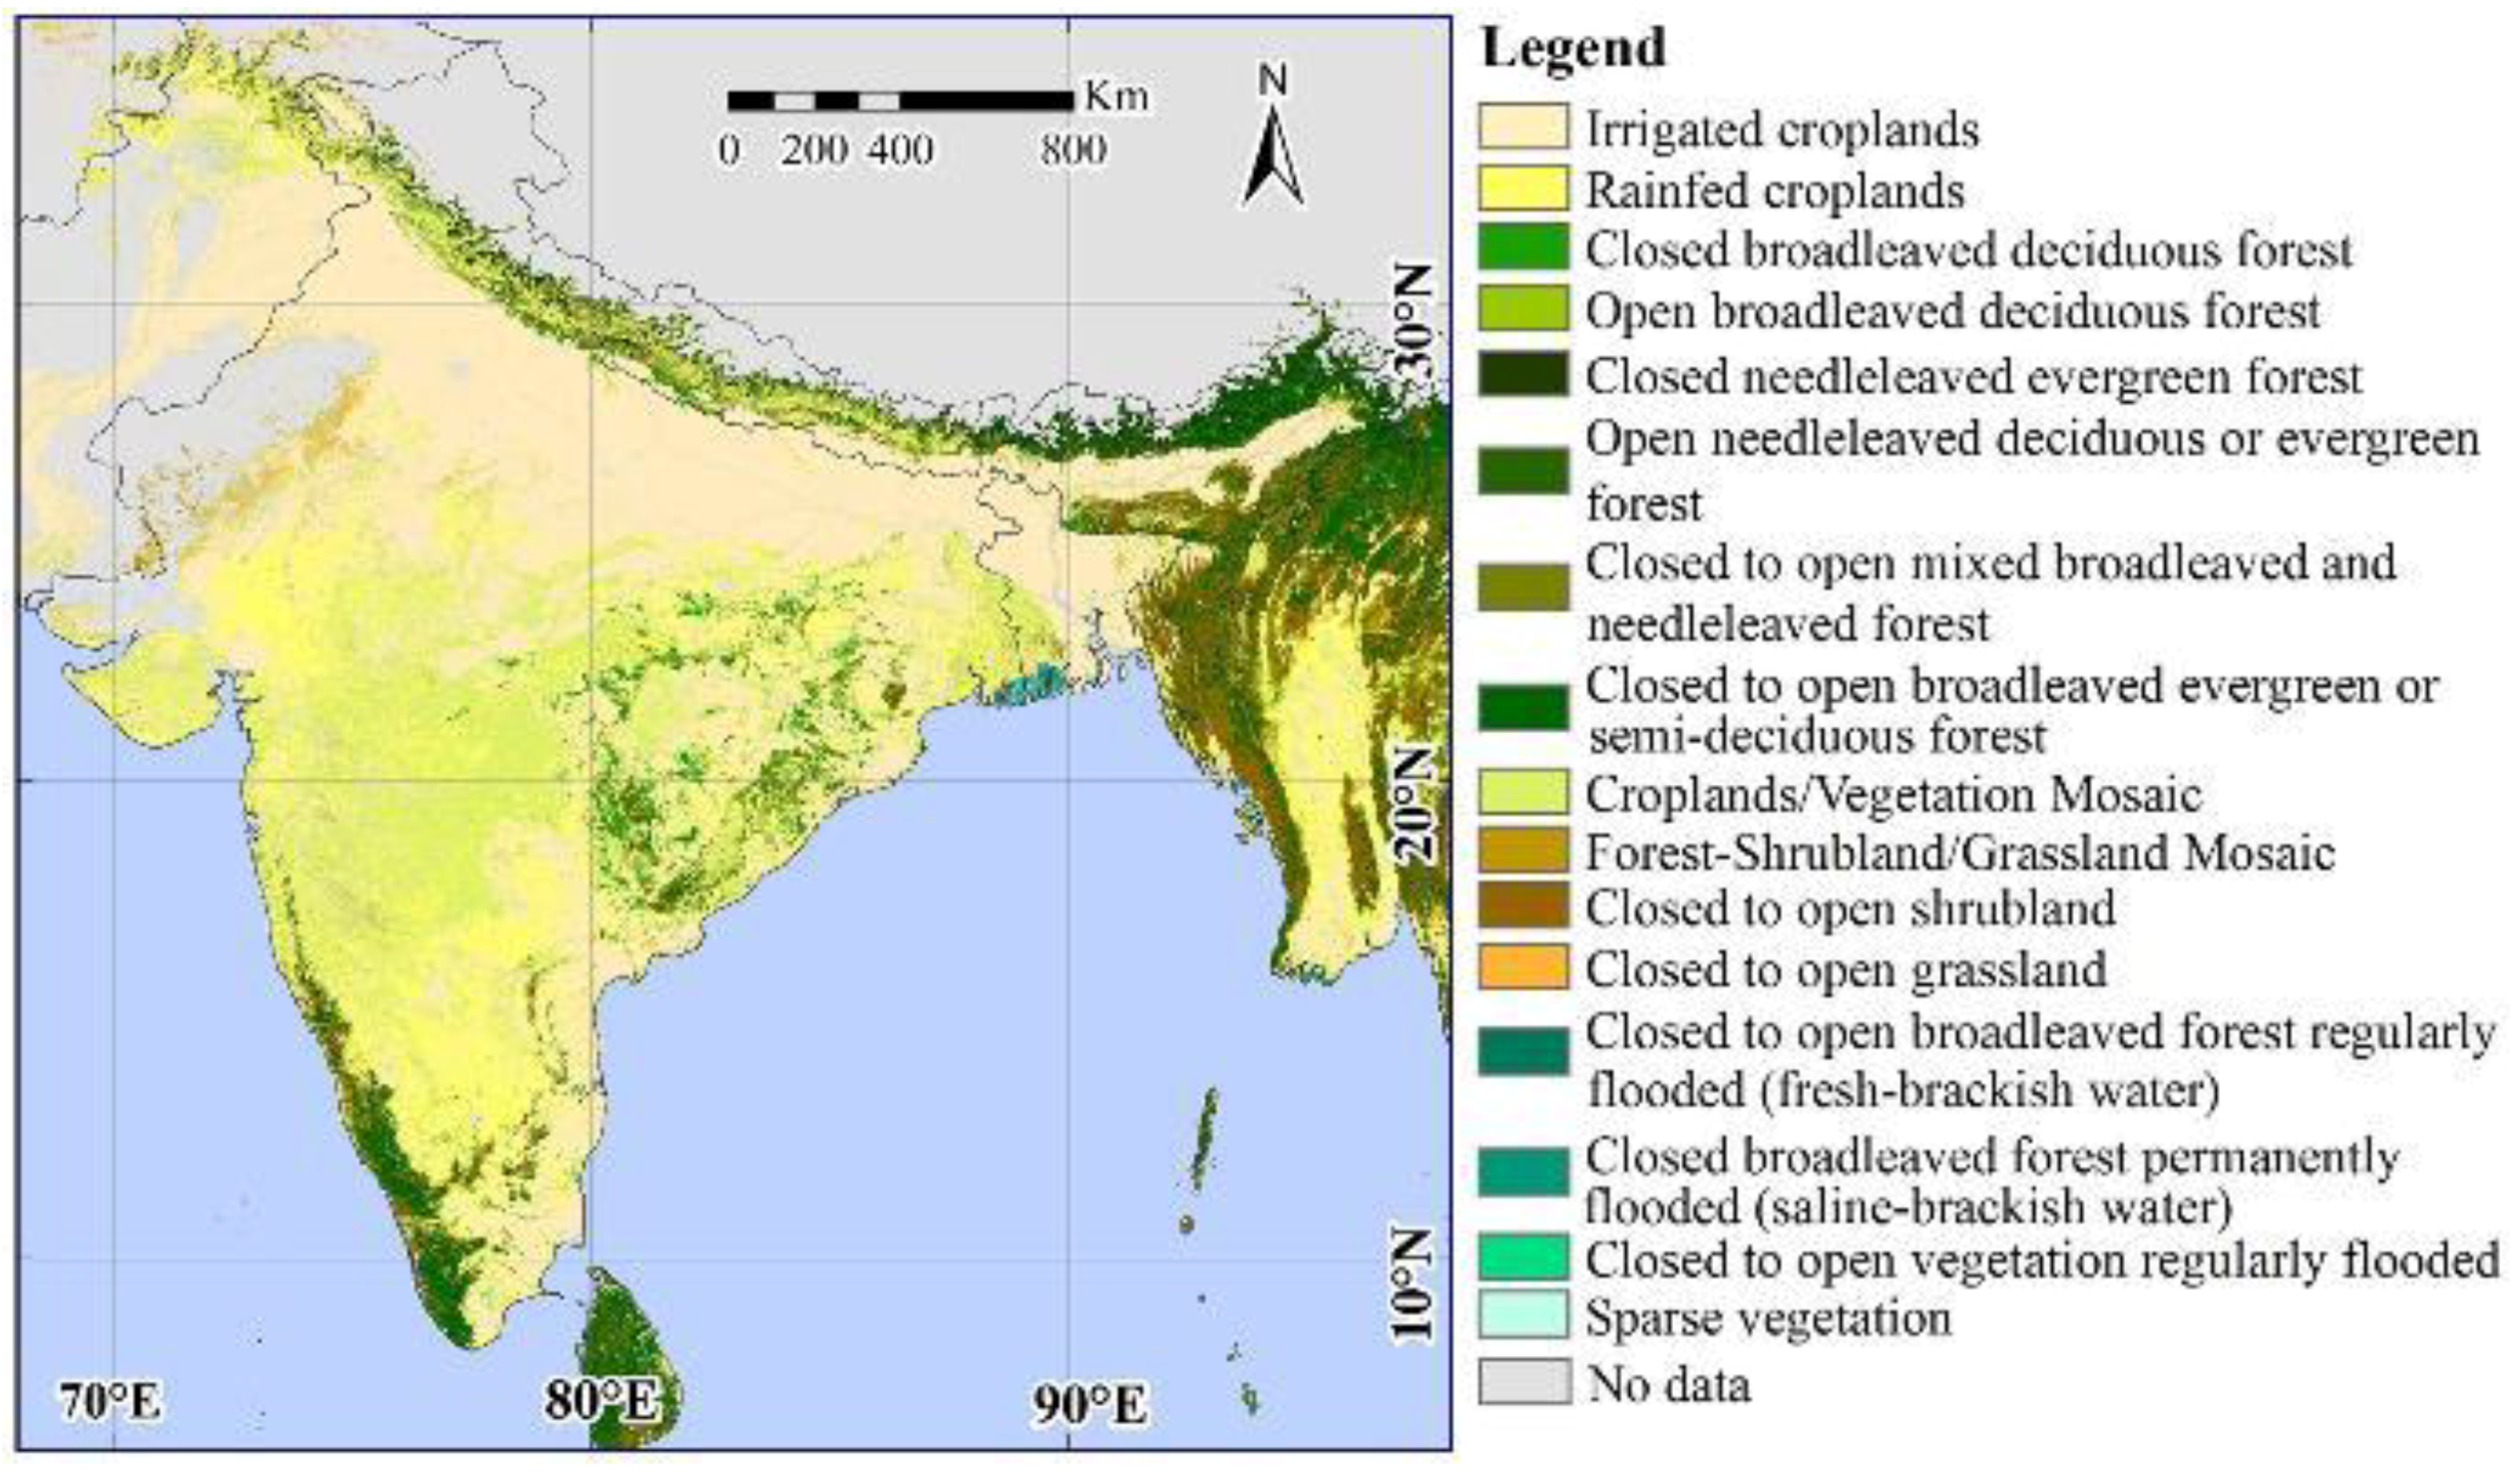
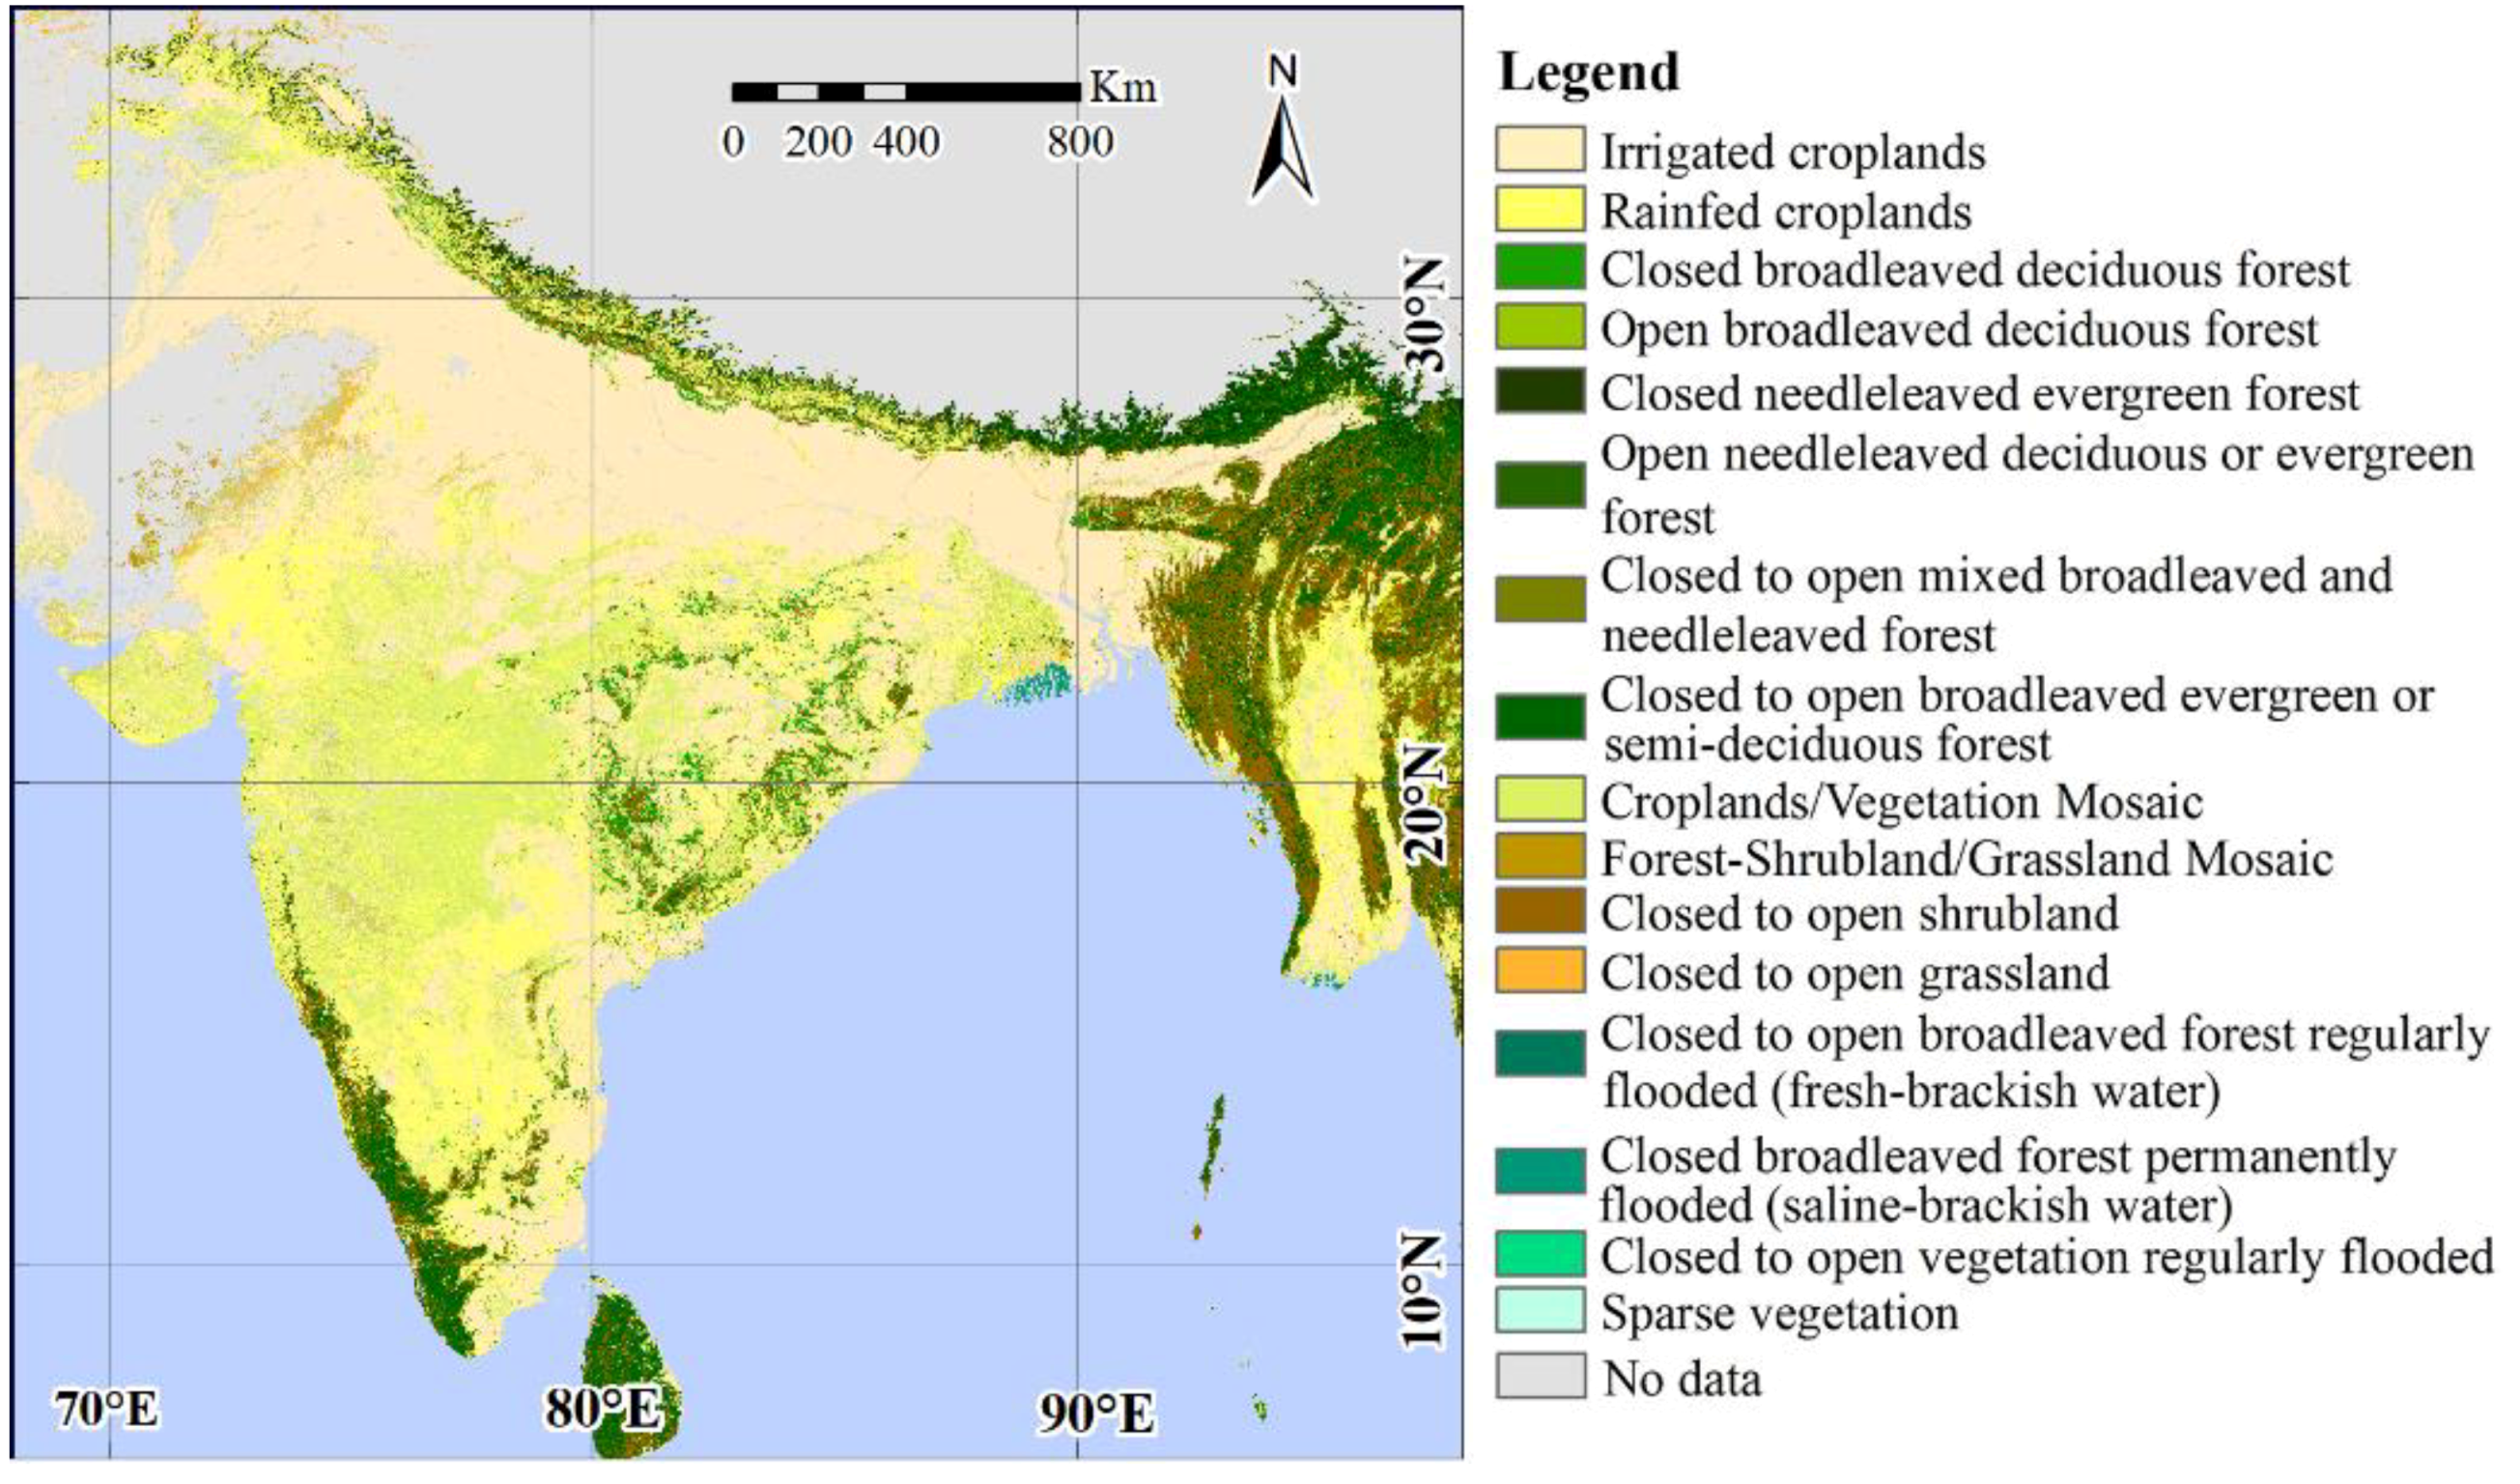
Figure 1.
The vegetation map of the study area derived from the Globcover2009 dataset.
Figure 1.
The vegetation map of the study area derived from the Globcover2009 dataset.
Figure 1.
The vegetation map of the study area derived from the Globcover2009 dataset.
Figure 1.
The vegetation map of the study area derived from the Globcover2009 dataset.
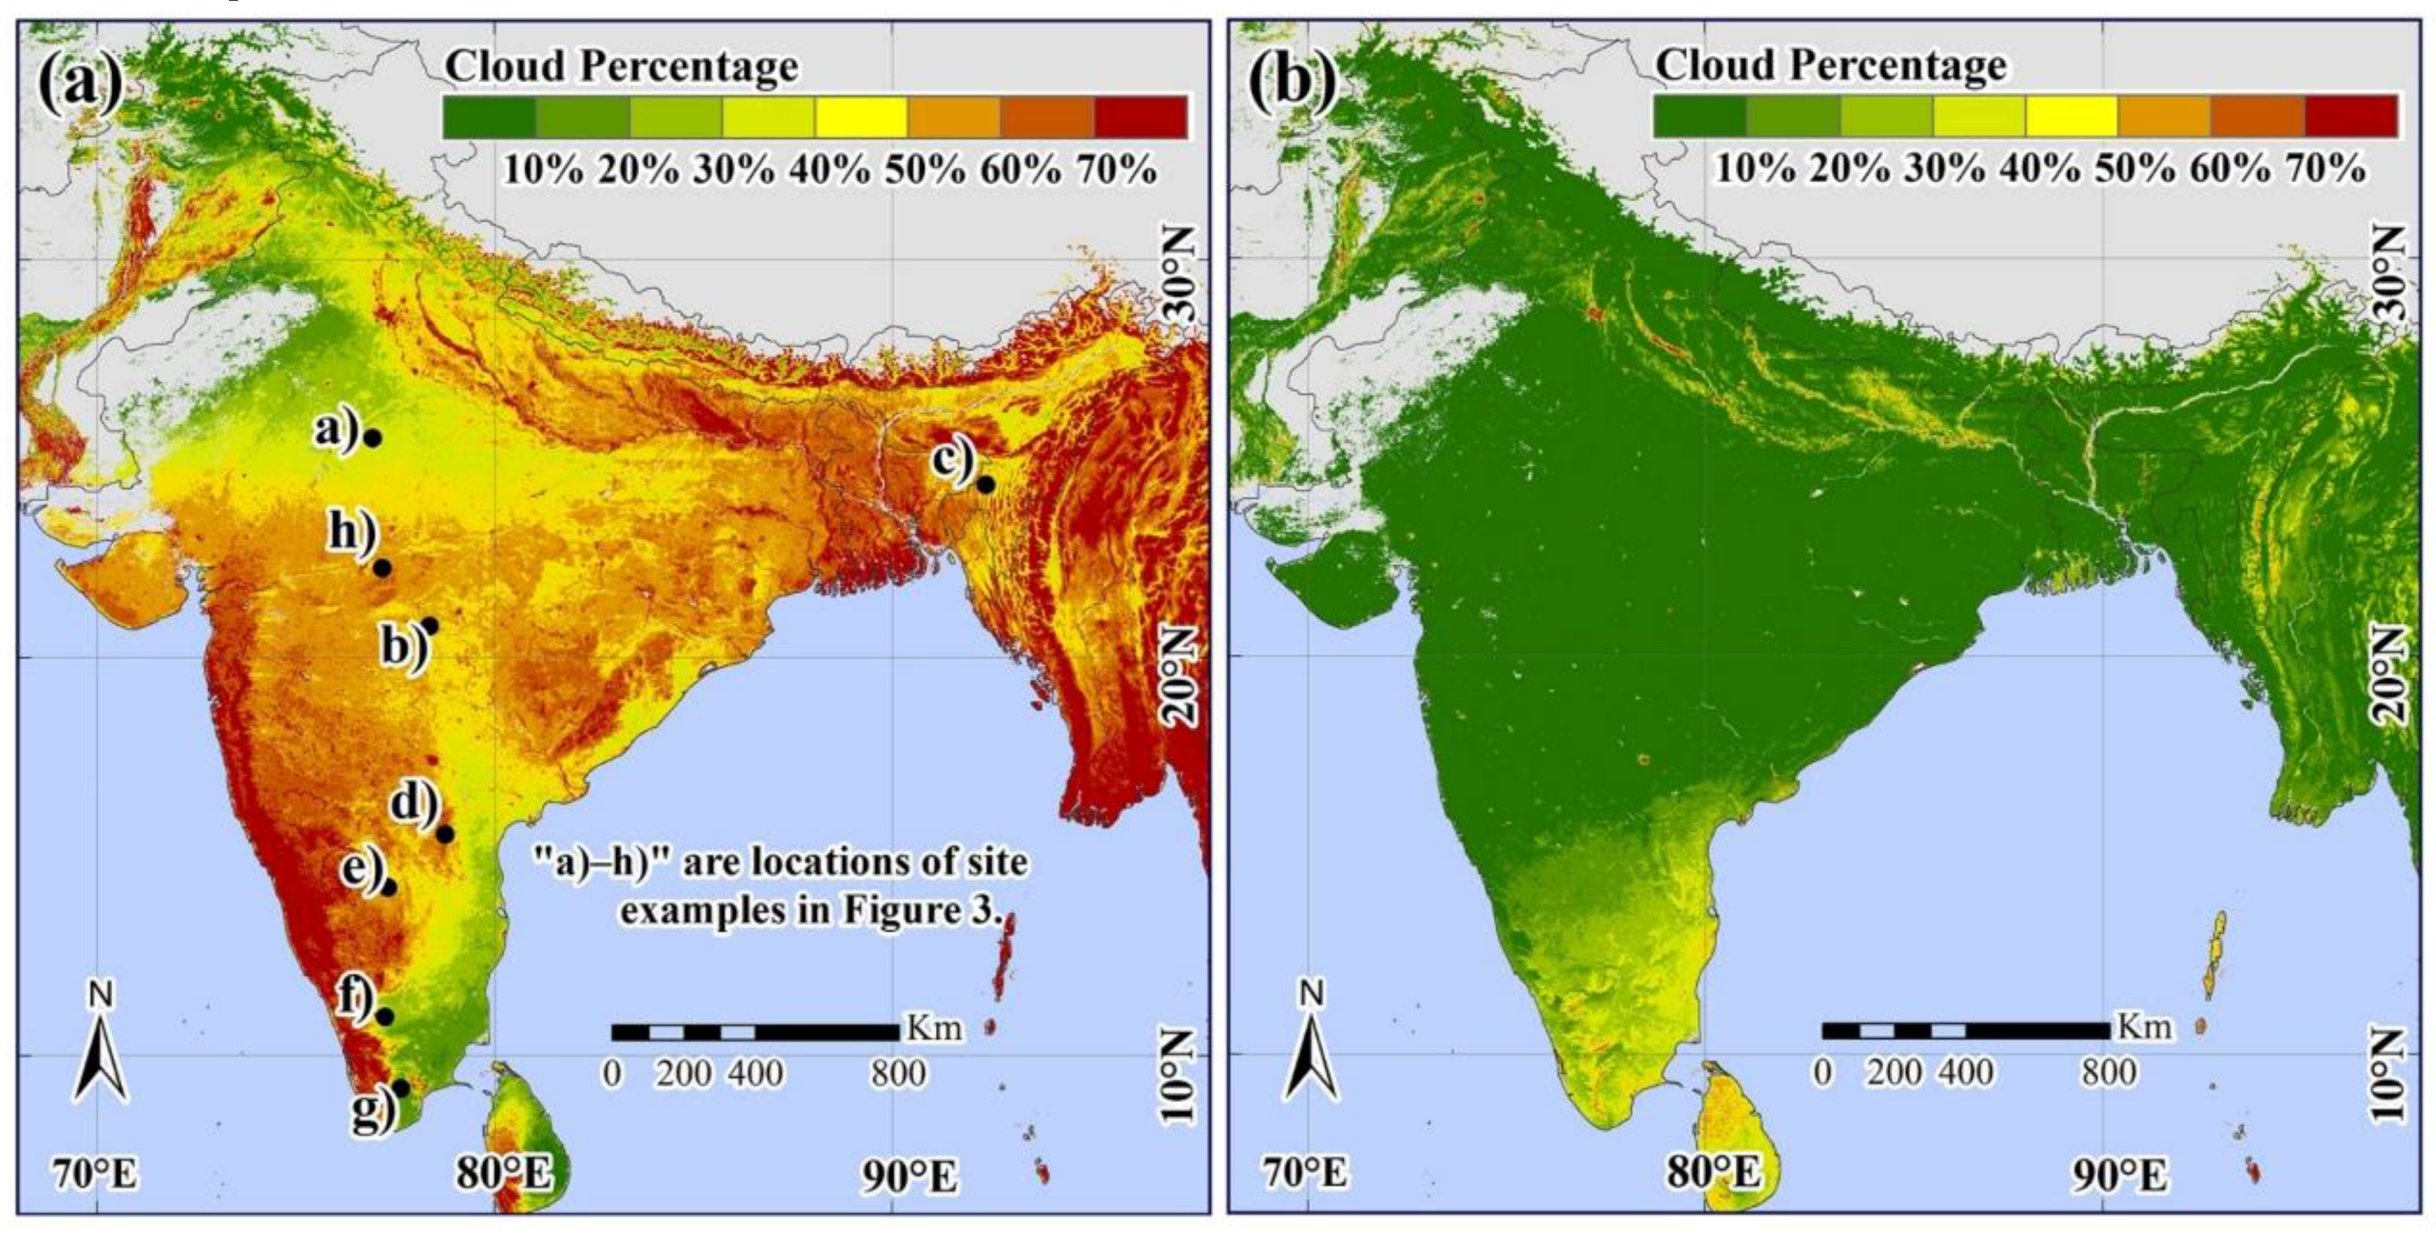
Figure 2.
The percentage of cloud cover from 2000 to 2016 during the southwest monsoon season (June to September) (
a) and the post-monsoon season (October to November) (
b) in MOD09A1. The black points are the locations of the eight examples shown in
Figure 3.
Figure 2.
The percentage of cloud cover from 2000 to 2016 during the southwest monsoon season (June to September) (
a) and the post-monsoon season (October to November) (
b) in MOD09A1. The black points are the locations of the eight examples shown in
Figure 3.
Figure 2.
The percentage of cloud cover from 2000 to 2016 during the southwest monsoon season (June to September) (
a) and the post-monsoon season (October to November) (
b) in MOD09A1. The black points are the locations of the eight examples shown in
Figure 3.
Figure 2.
The percentage of cloud cover from 2000 to 2016 during the southwest monsoon season (June to September) (
a) and the post-monsoon season (October to November) (
b) in MOD09A1. The black points are the locations of the eight examples shown in
Figure 3.
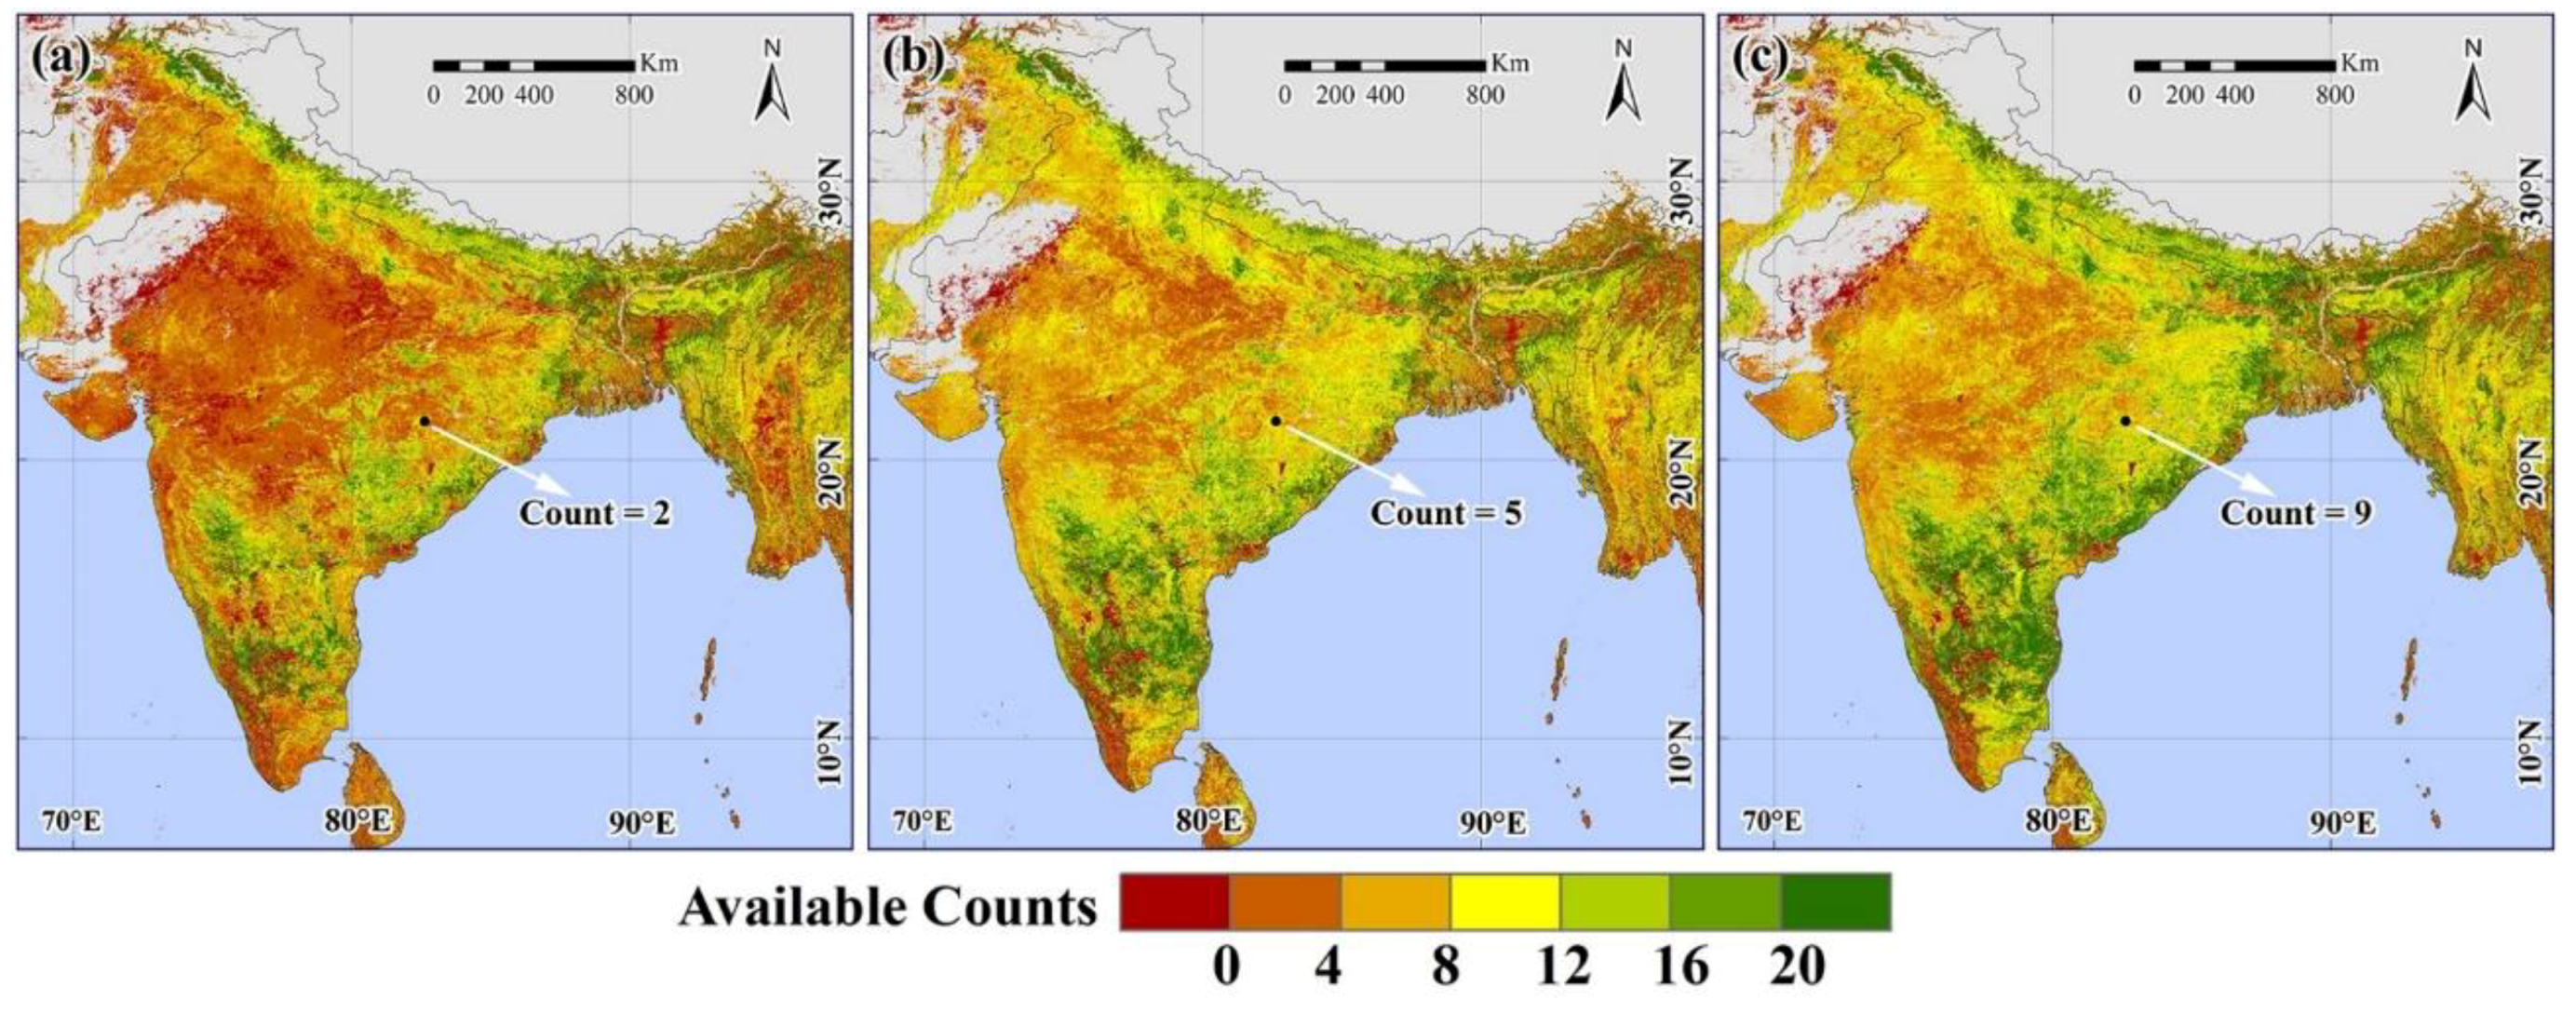
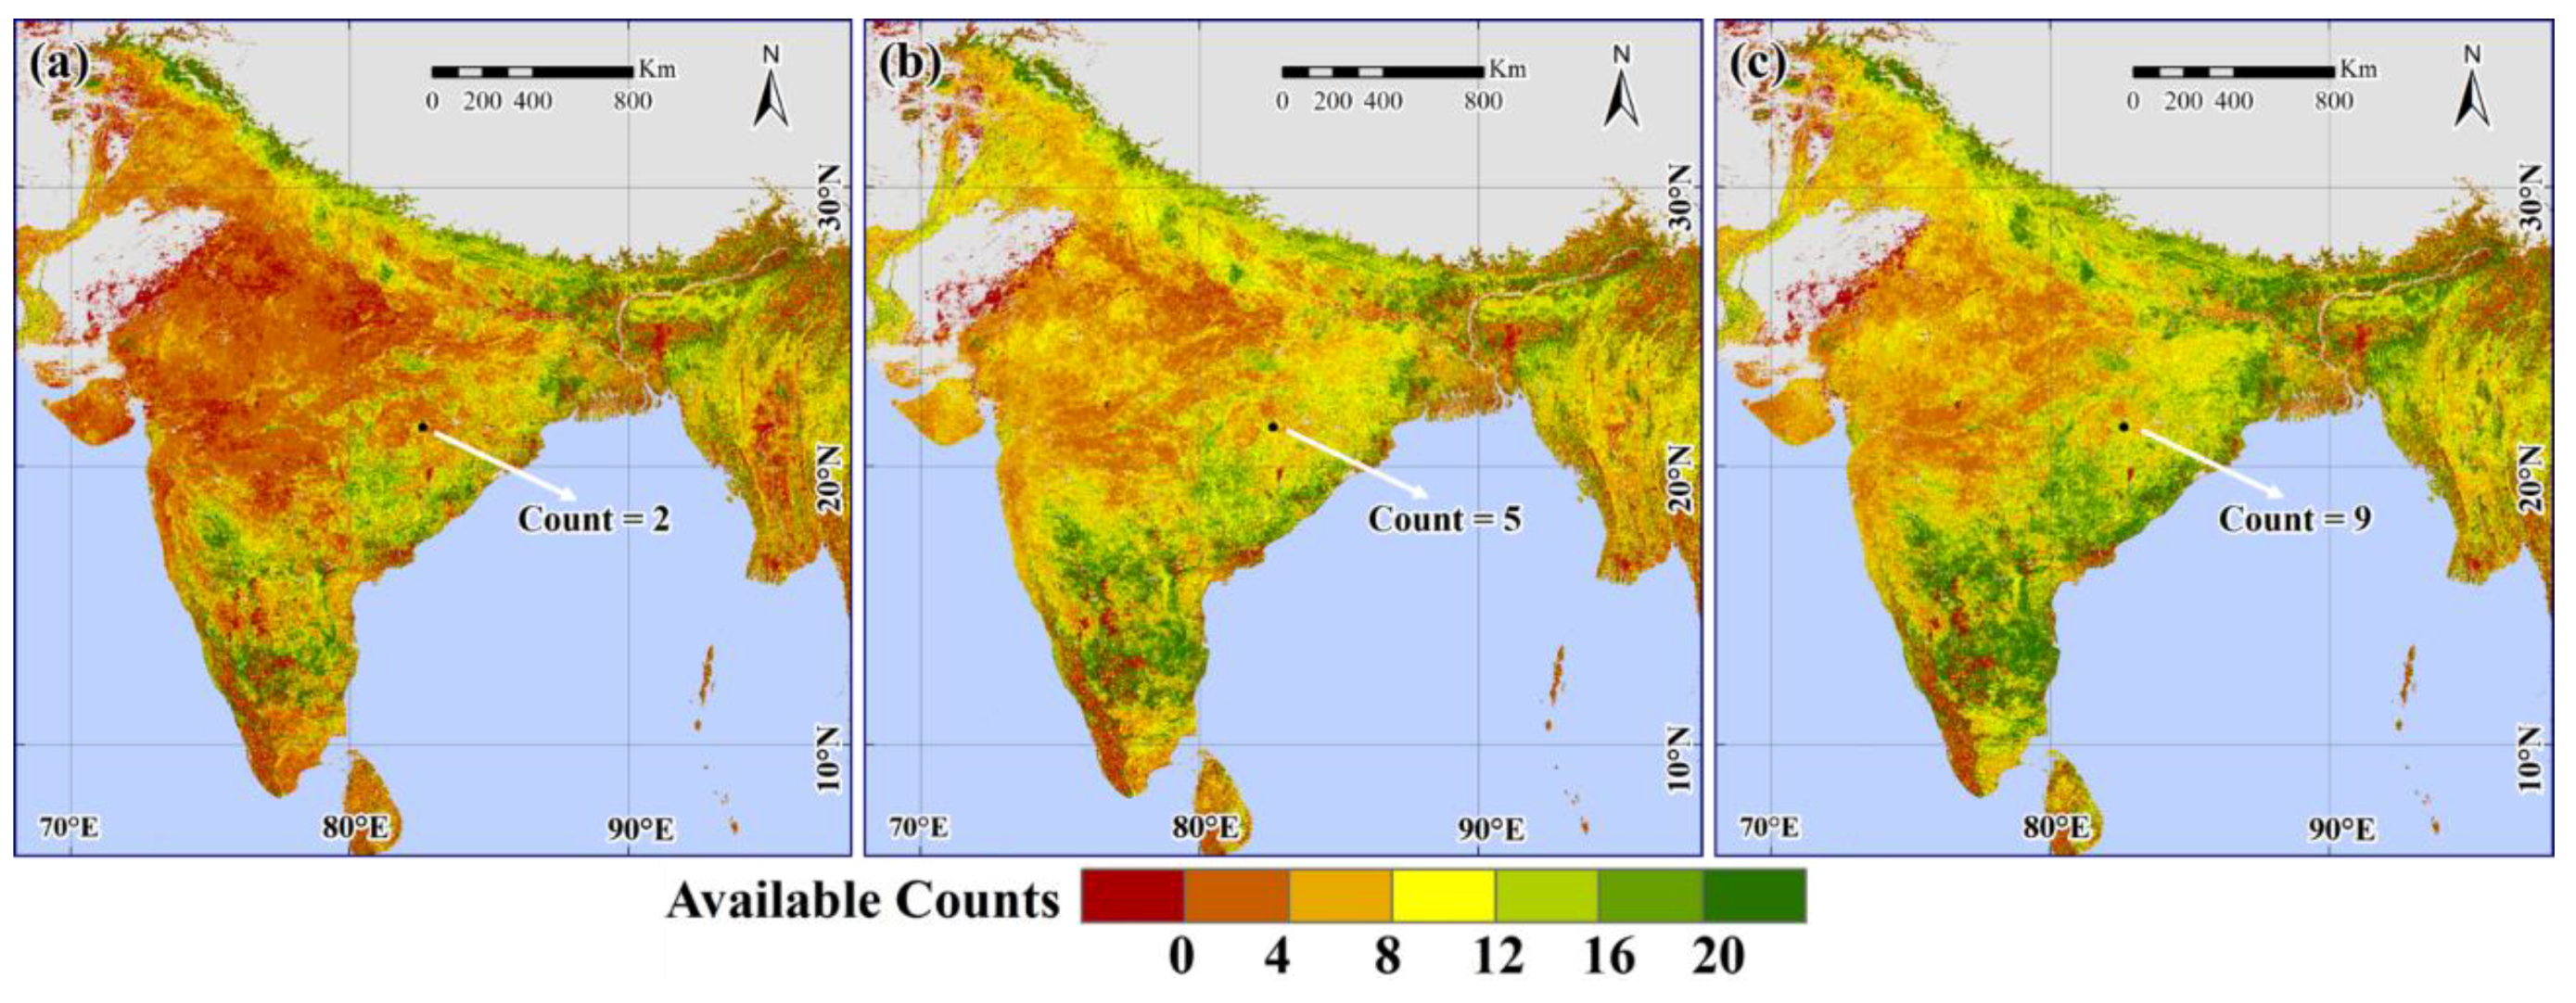
Figure 5.
The spatial distribution of Count90 for three different data sources in 2006: (
a) MOD09A1_C5, (
b) MOD09A1_C6, and (
c) IBCD_C6. The black point indicates the location of
Figure 6.
Figure 5.
The spatial distribution of Count90 for three different data sources in 2006: (
a) MOD09A1_C5, (
b) MOD09A1_C6, and (
c) IBCD_C6. The black point indicates the location of
Figure 6.
Figure 5.
The spatial distribution of Count90 for three different data sources in 2006: (
a) MOD09A1_C5, (
b) MOD09A1_C6, and (
c) IBCD_C6. The black point indicates the location of
Figure 6.
Figure 5.
The spatial distribution of Count90 for three different data sources in 2006: (
a) MOD09A1_C5, (
b) MOD09A1_C6, and (
c) IBCD_C6. The black point indicates the location of
Figure 6.
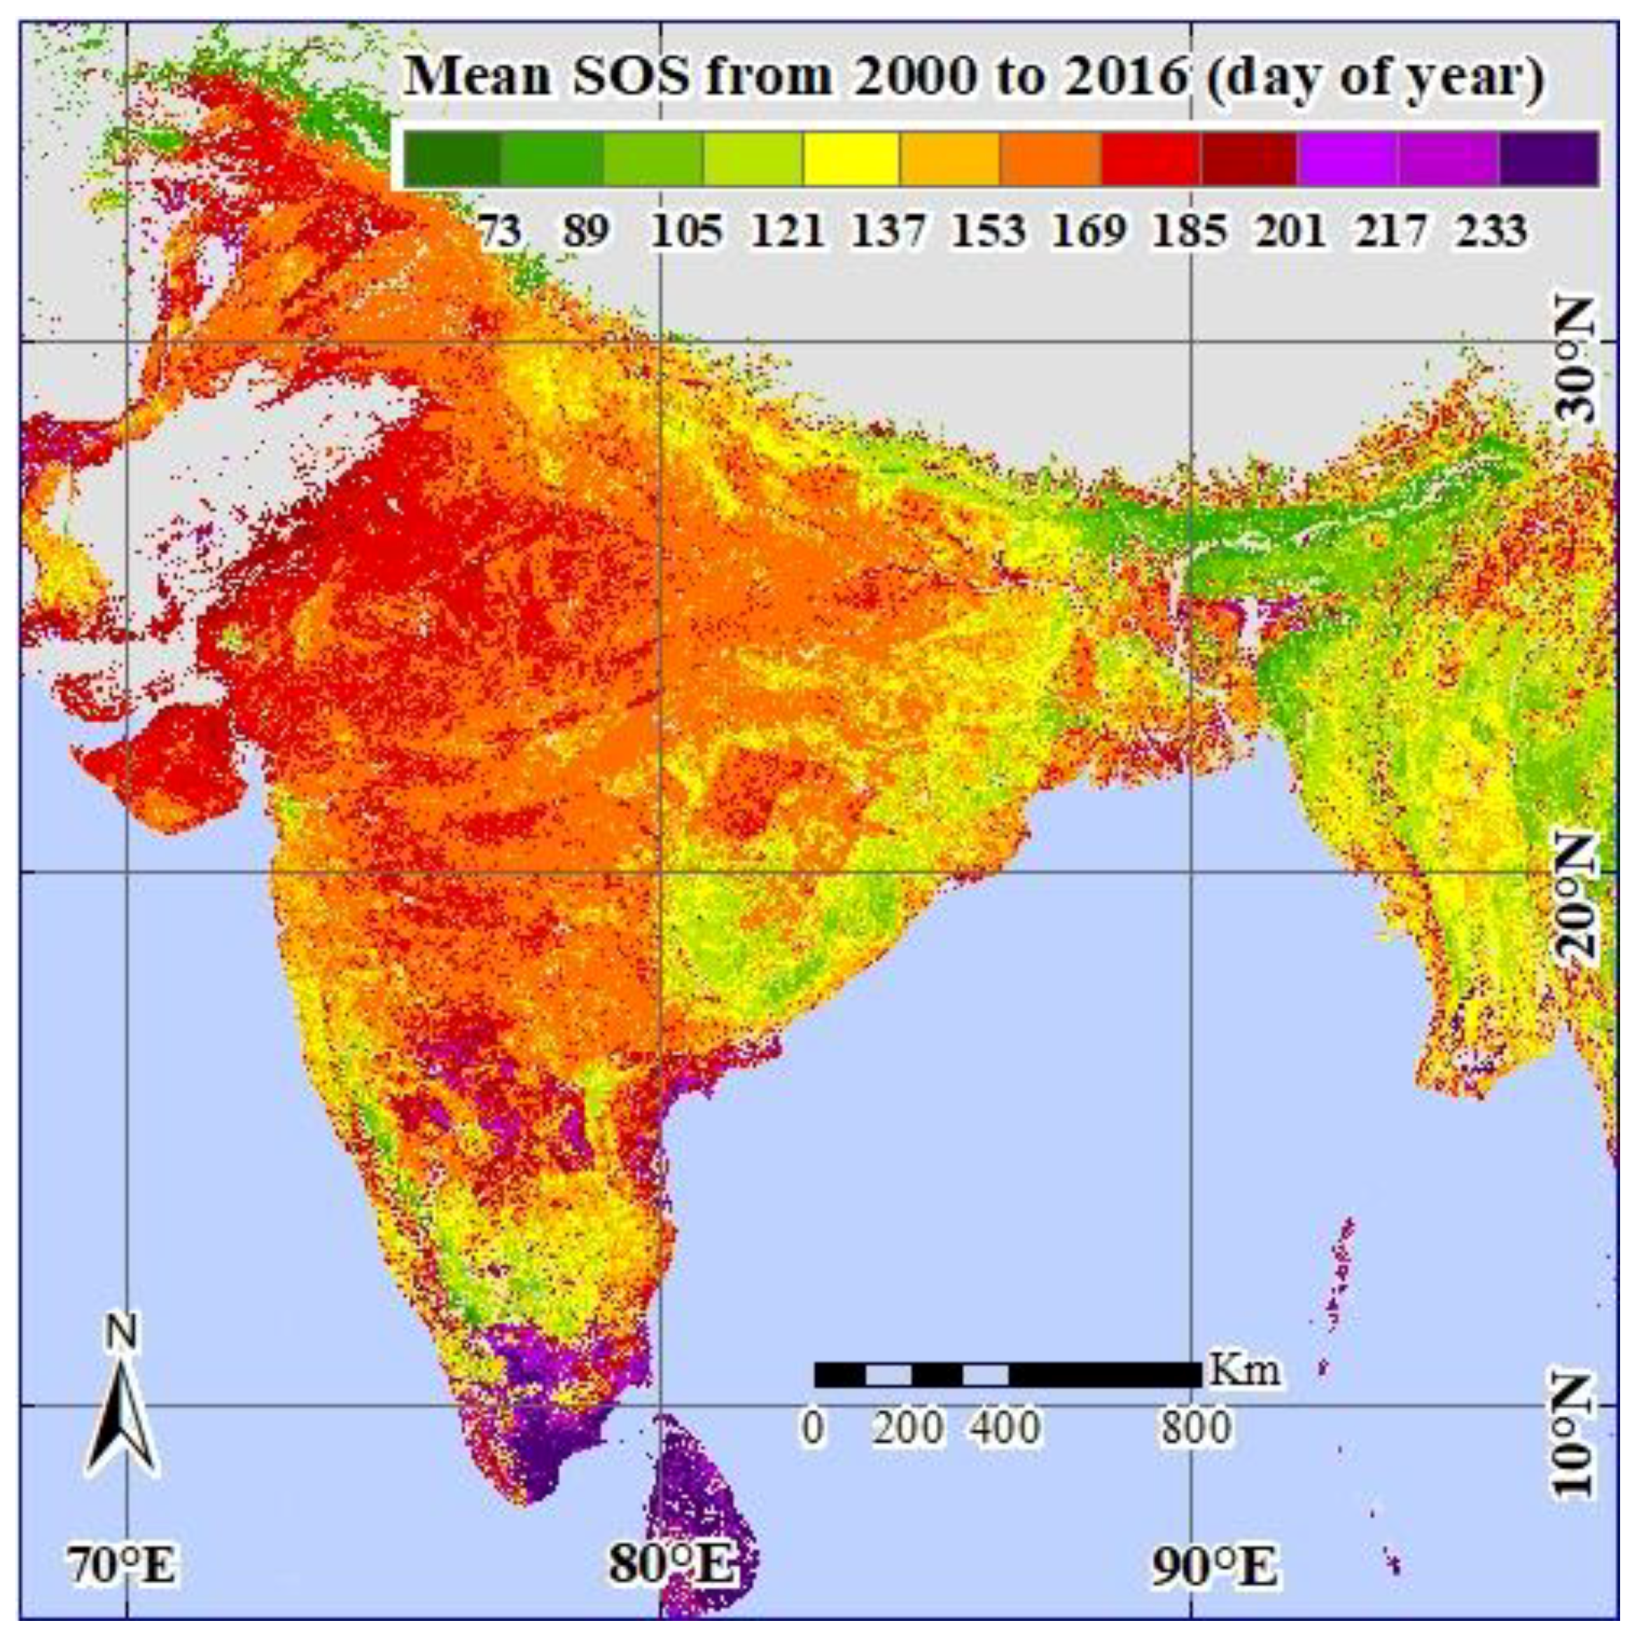
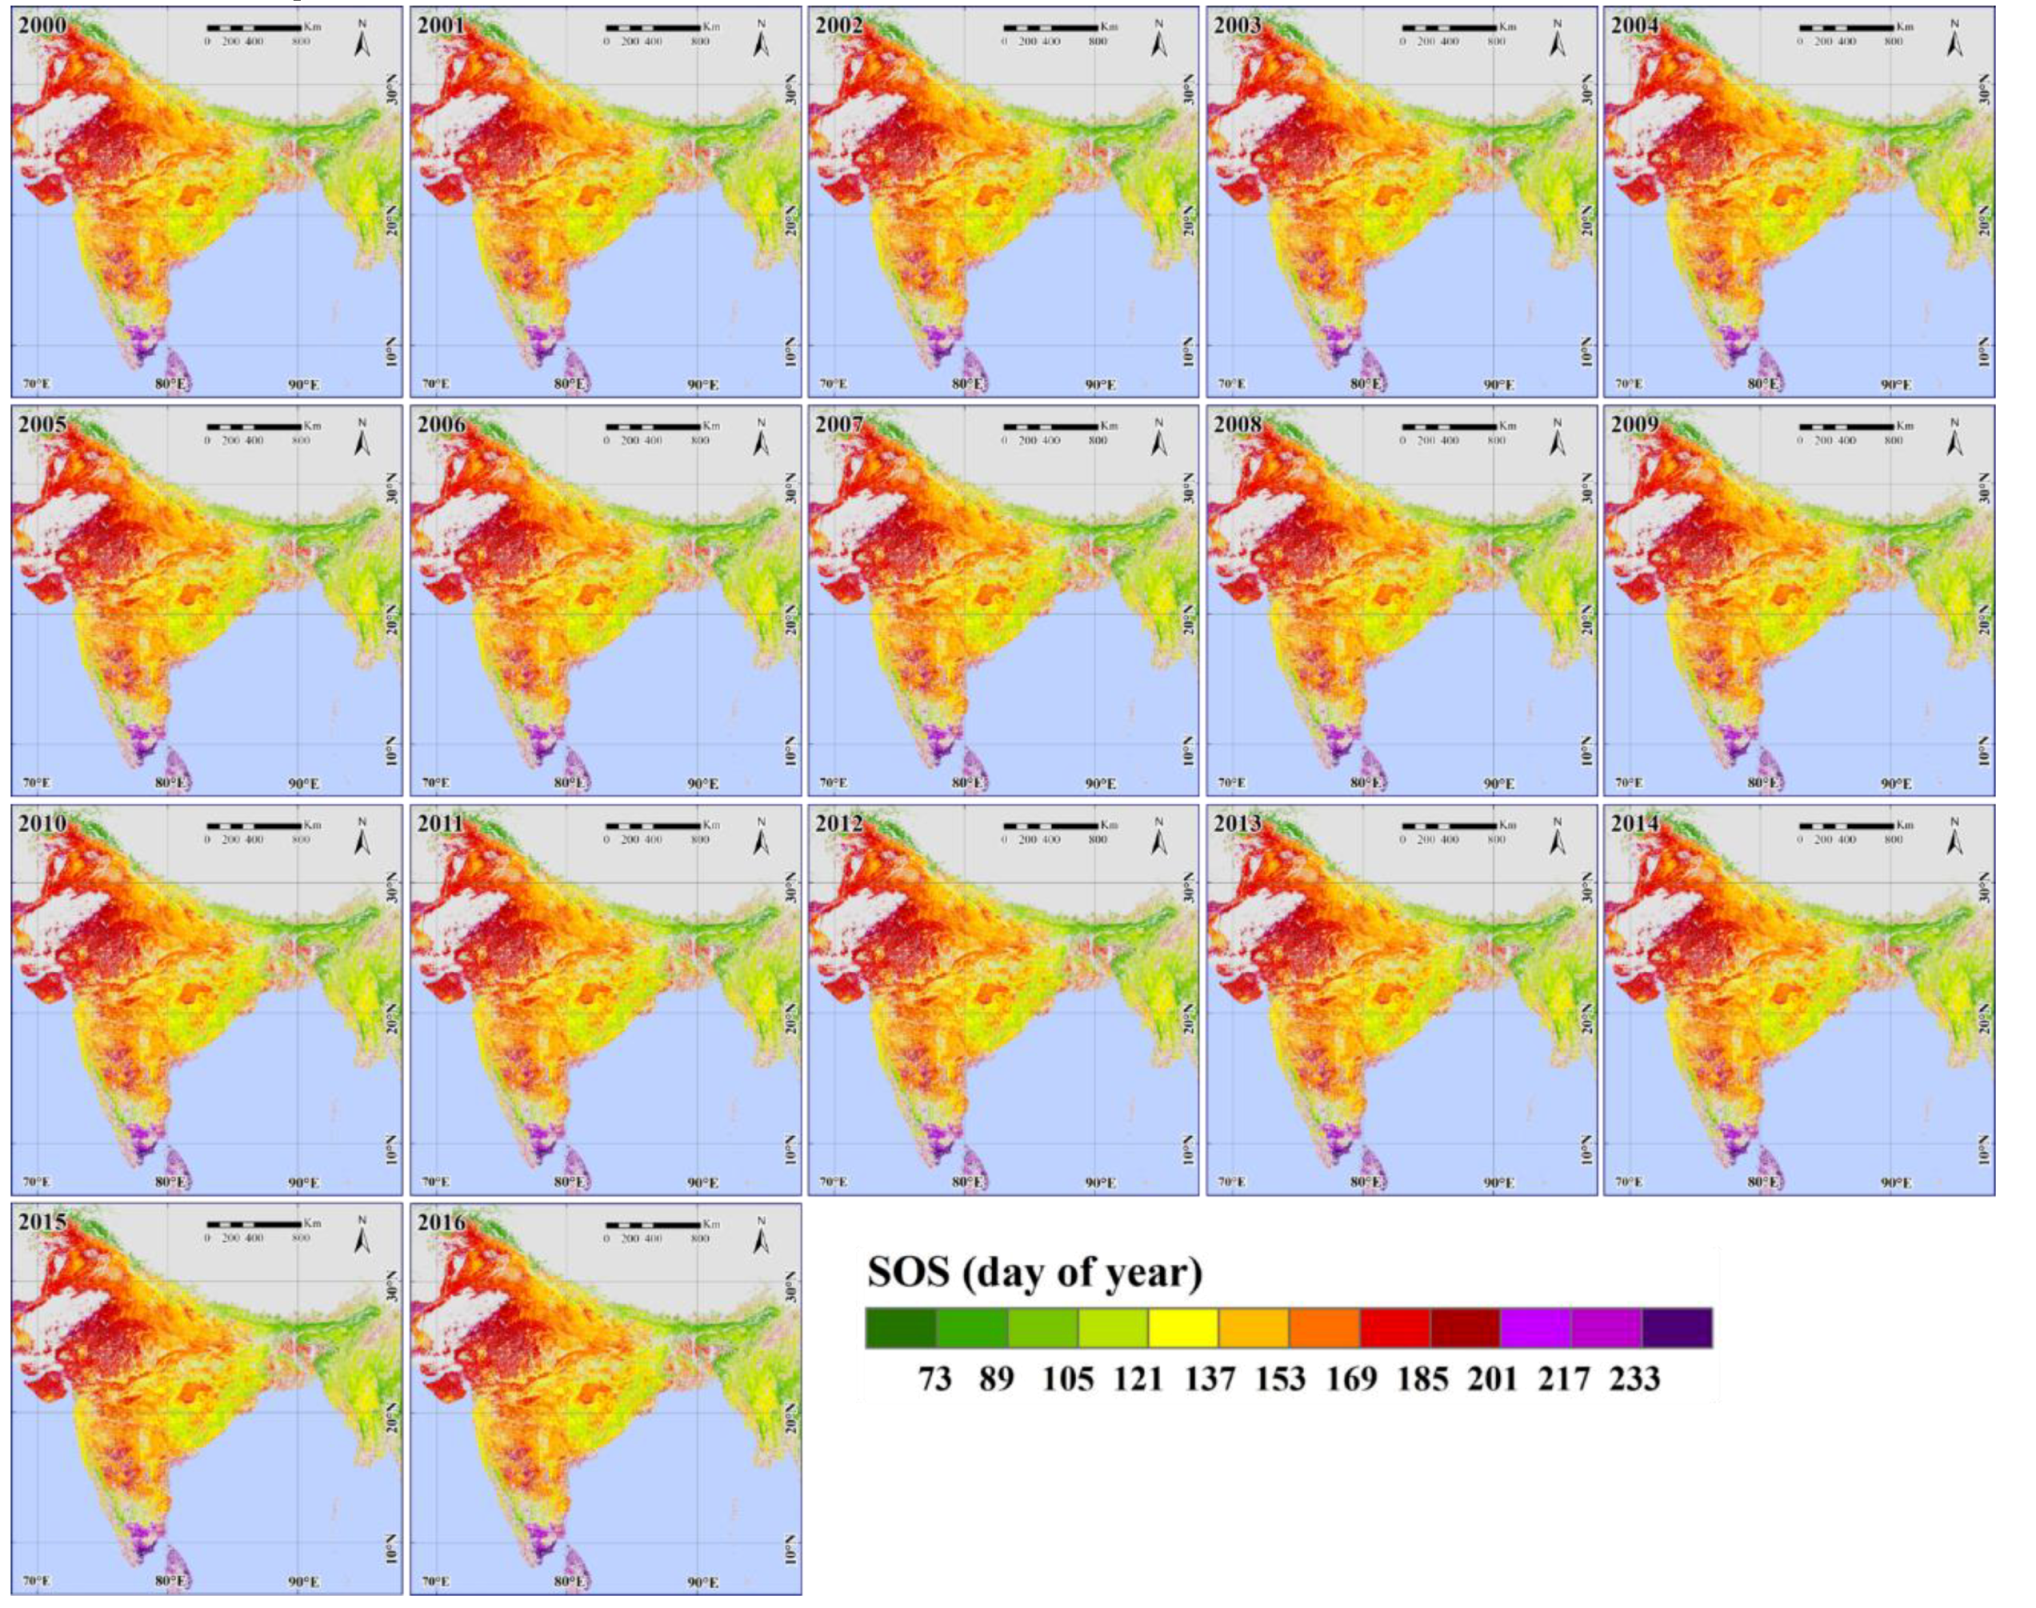
Figure 7.
The SOS in the Indian monsoon region from 2000 to 2016.
Figure 7.
The SOS in the Indian monsoon region from 2000 to 2016.
Figure 7.
The SOS in the Indian monsoon region from 2000 to 2016.
Figure 7.
The SOS in the Indian monsoon region from 2000 to 2016.
Figure 8.
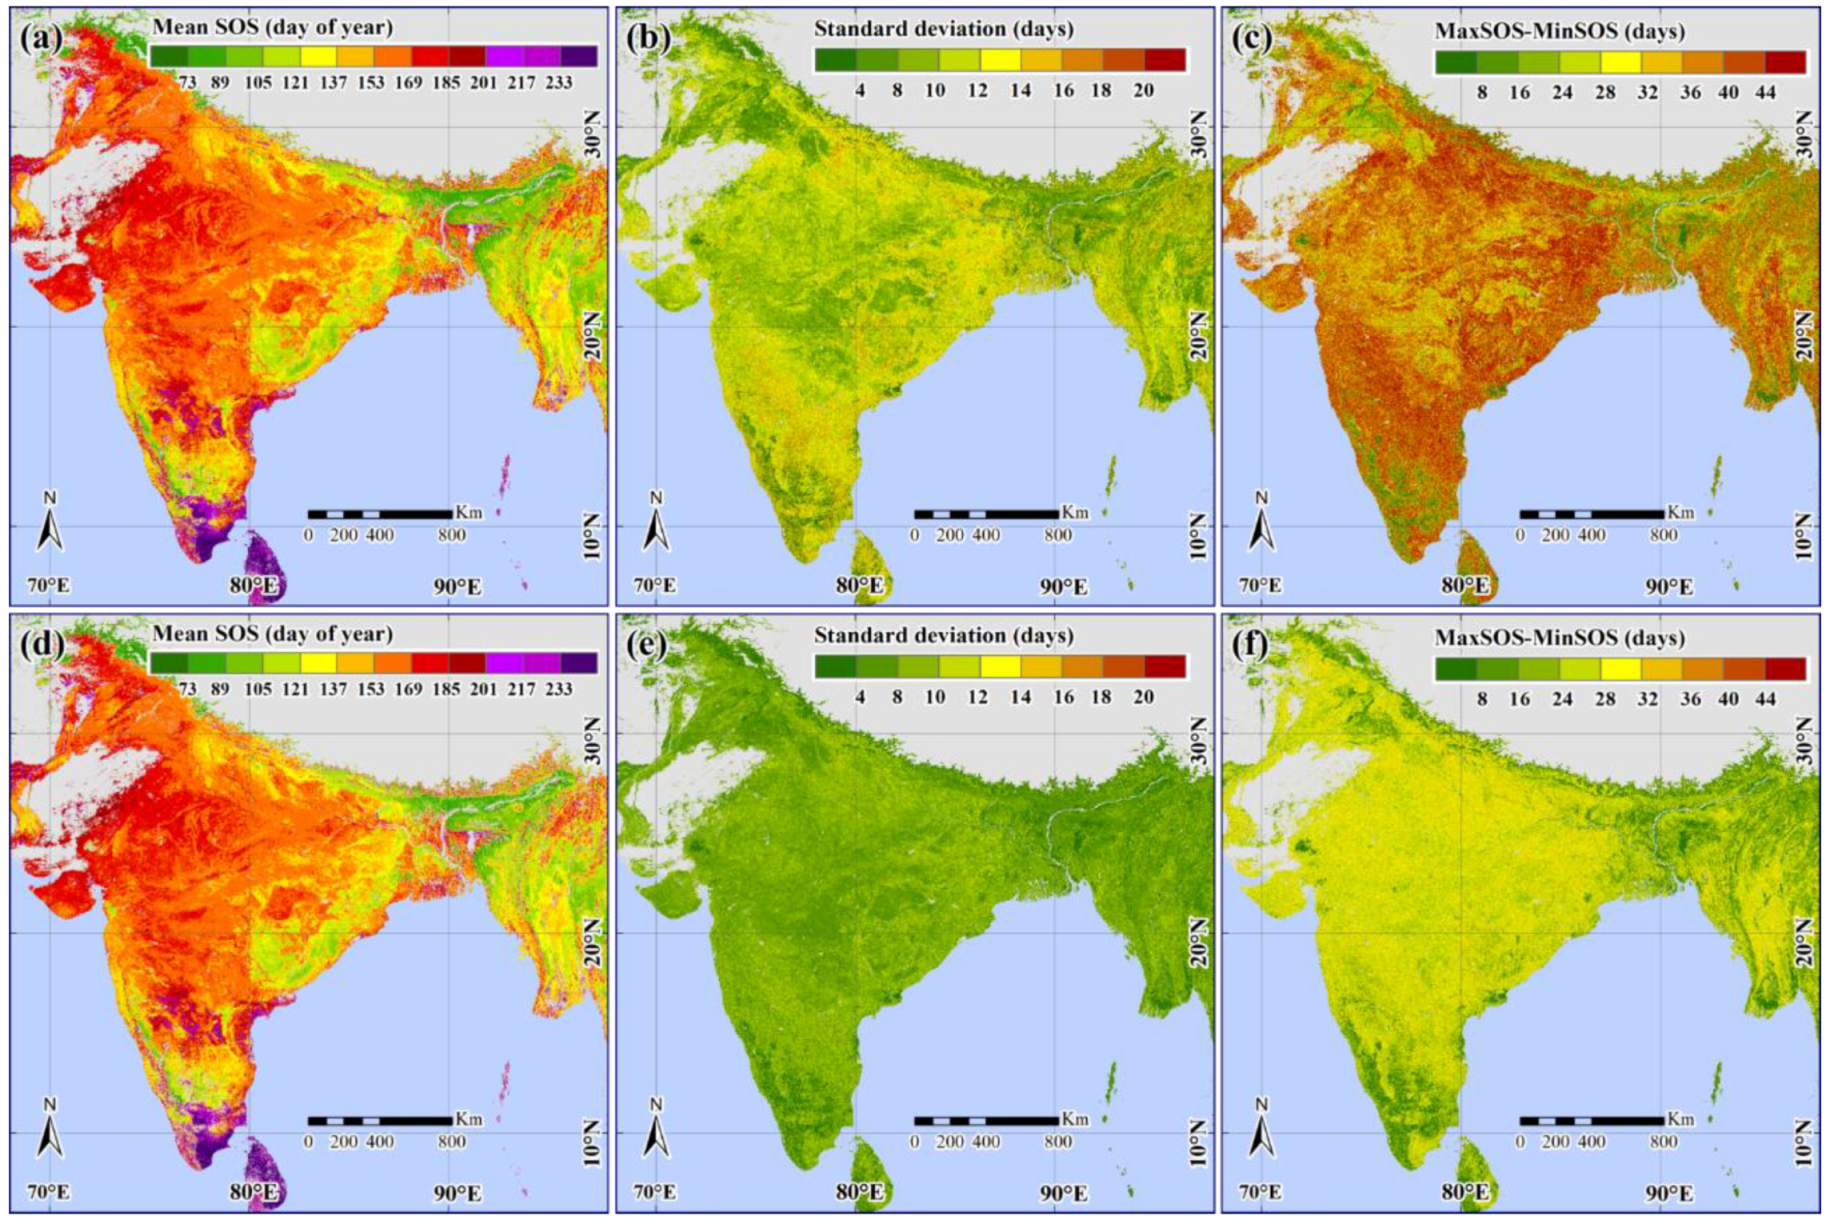
The mean SOS (a,d), standard deviation (b,e), and difference between the maximum and minimum SOS (e,f) in the Indian monsoon region from 2000 to 2016. (a–c) are calculated from SOS with QC > 1, and (d–f) are calculated from SOS with QC > 2.
Figure 8.
The mean SOS (a,d), standard deviation (b,e), and difference between the maximum and minimum SOS (e,f) in the Indian monsoon region from 2000 to 2016. (a–c) are calculated from SOS with QC > 1, and (d–f) are calculated from SOS with QC > 2.
Figure 8.
The mean SOS (a,d), standard deviation (b,e), and difference between the maximum and minimum SOS (e,f) in the Indian monsoon region from 2000 to 2016. (a–c) are calculated from SOS with QC > 1, and (d–f) are calculated from SOS with QC > 2.
Figure 8.
The mean SOS (a,d), standard deviation (b,e), and difference between the maximum and minimum SOS (e,f) in the Indian monsoon region from 2000 to 2016. (a–c) are calculated from SOS with QC > 1, and (d–f) are calculated from SOS with QC > 2.
Figure 9.
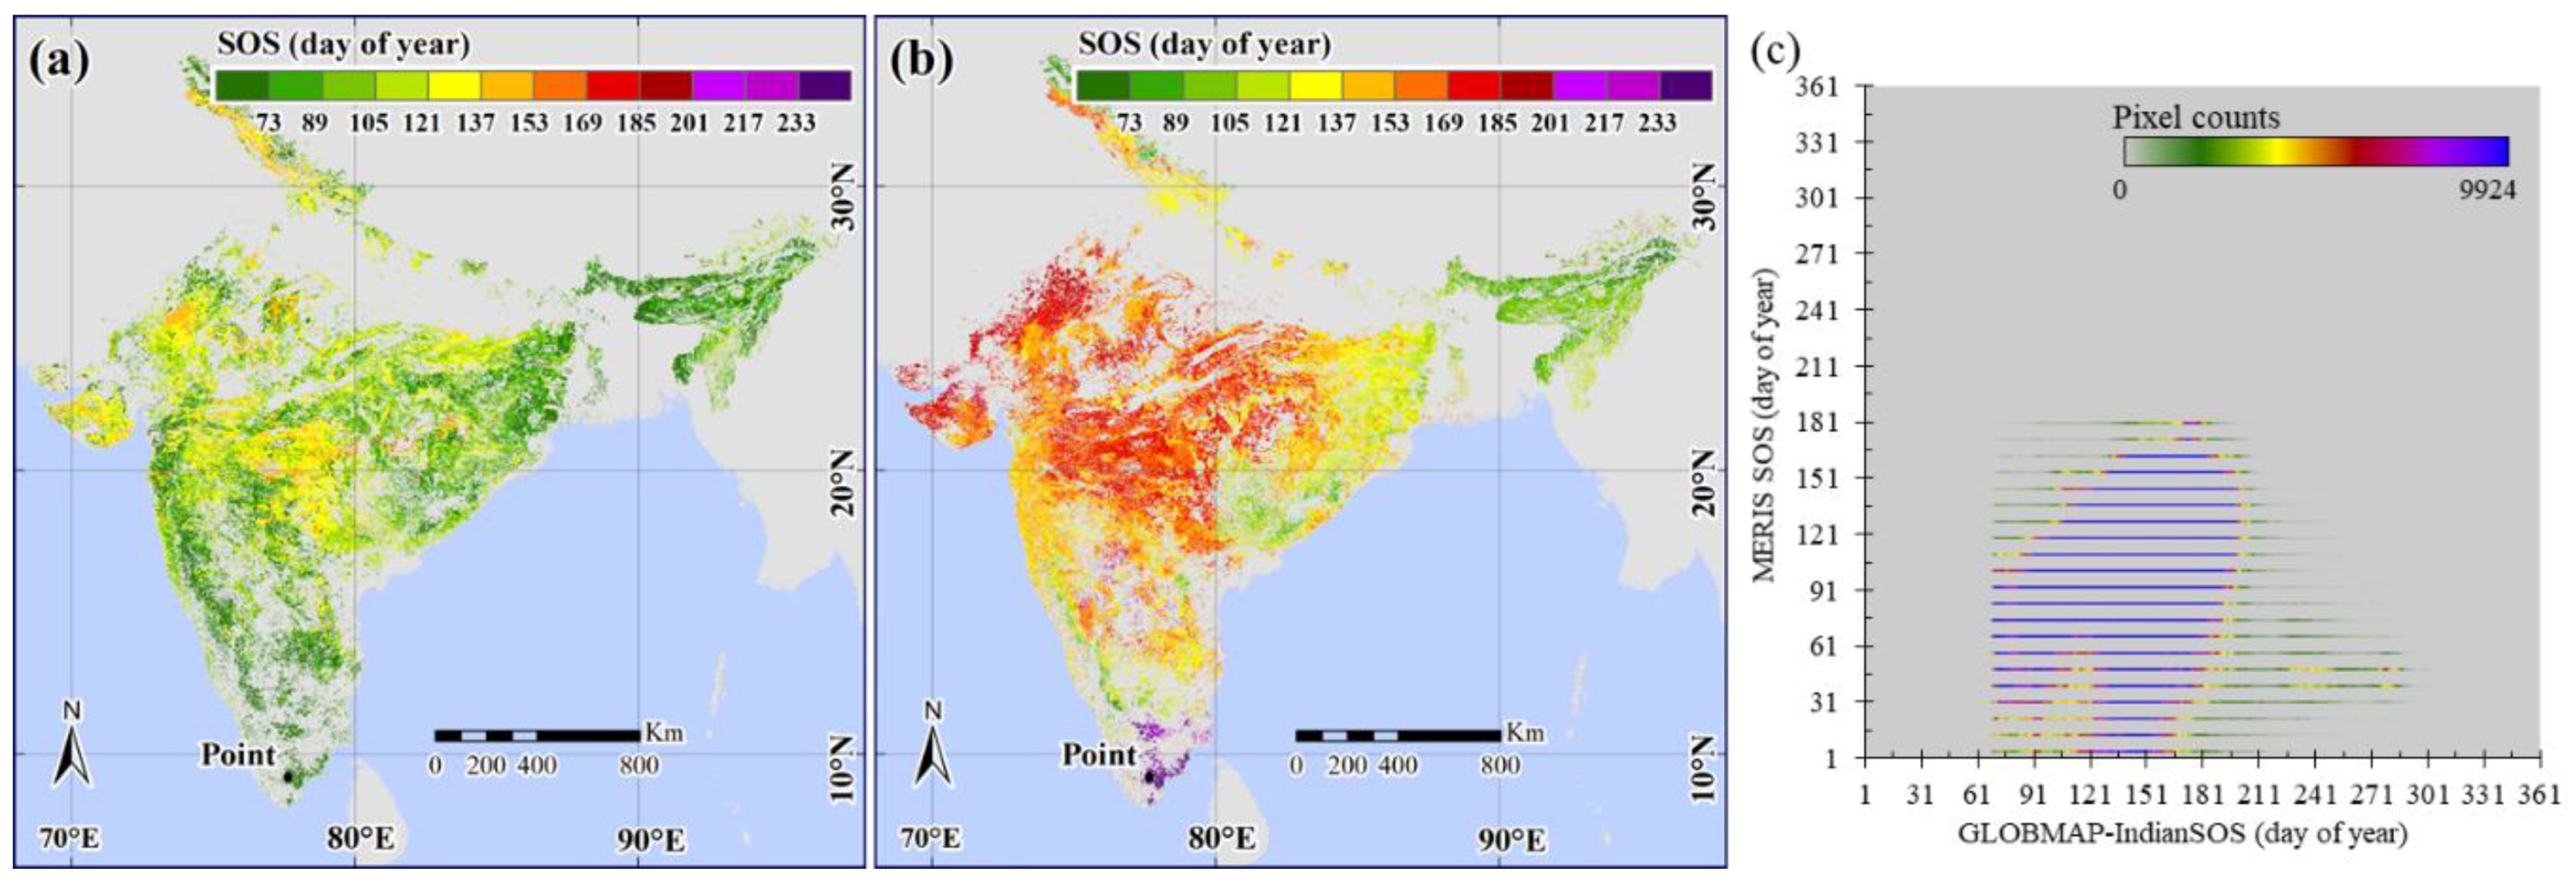
(a) The SOS derived from MERIS Terrestrial Chlorophyll Index data in 2006 (the croplands with more than one growing season were masked), (b) the SOS from the GLOBMAP-IndianSOS product in 2006, and (c) the density scatterplot of these two products.
Figure 9.
(a) The SOS derived from MERIS Terrestrial Chlorophyll Index data in 2006 (the croplands with more than one growing season were masked), (b) the SOS from the GLOBMAP-IndianSOS product in 2006, and (c) the density scatterplot of these two products.
Figure 9.
(a) The SOS derived from MERIS Terrestrial Chlorophyll Index data in 2006 (the croplands with more than one growing season were masked), (b) the SOS from the GLOBMAP-IndianSOS product in 2006, and (c) the density scatterplot of these two products.
Figure 9.
(a) The SOS derived from MERIS Terrestrial Chlorophyll Index data in 2006 (the croplands with more than one growing season were masked), (b) the SOS from the GLOBMAP-IndianSOS product in 2006, and (c) the density scatterplot of these two products.
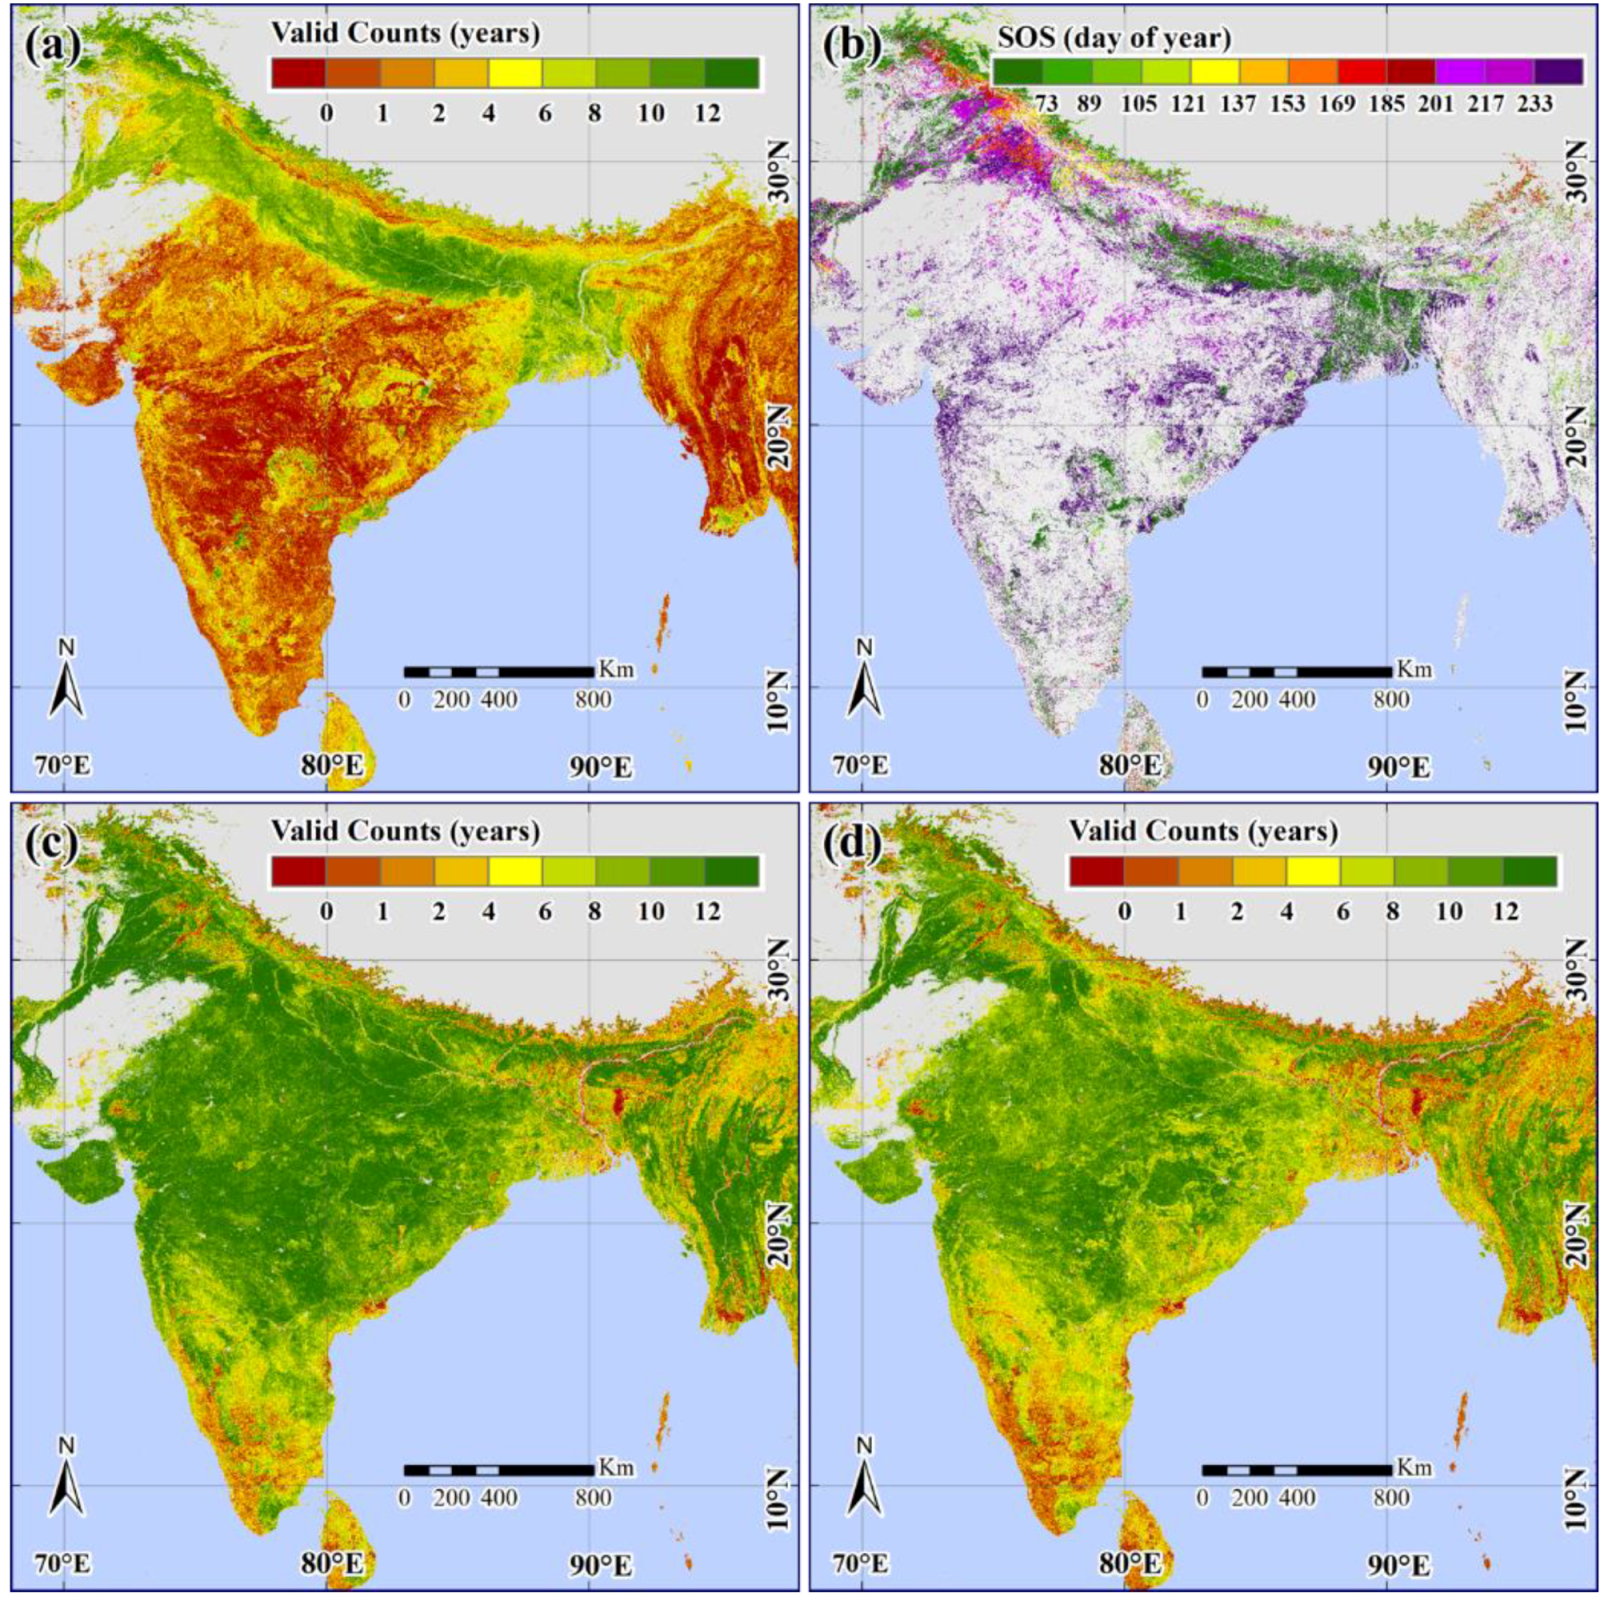
Figure 11.
(a) The counts of valid SOS retrievals in the MOD12Q2 product from 2001 to 2014, (b) the SOS in the MOD12Q2 product in 2006, (c) the counts of valid SOS retrievals in the GLOBMAP-IndianSOS product with QC > 1 from 2001 to 2014, and (d) the counts of valid SOS retrievals in the GLOBMAP-IndianSOS product with QC > 2 from 2001 to 2014.
Figure 11.
(a) The counts of valid SOS retrievals in the MOD12Q2 product from 2001 to 2014, (b) the SOS in the MOD12Q2 product in 2006, (c) the counts of valid SOS retrievals in the GLOBMAP-IndianSOS product with QC > 1 from 2001 to 2014, (d) the counts of valid SOS retrievals in the GLOBMAP-IndianSOS product with QC > 2 from 2001 to 2014.
The above changes do not affect the scientific results. The manuscript will be updated and the original will remain online on the article webpage, with a reference to this correction. The authors would like to apologize for any inconvenience caused.


