Next Issue
Volume 17, August-1
Previous Issue
Volume 17, July-1
 
 
remotesensing-logo

Journal Browser

Journal Browser

Remote Sens., Volume 17, Issue 14 (July-2 2025) – 205 articles

Cover Story (view full-size image): 
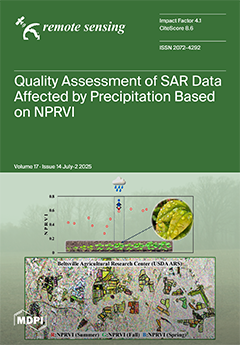
This study presents a quality assessment framework to address precipitation-induced effects in dual-polarization SAR data, utilizing the Normalized Polarimetric Radar Vegetation Index (NPRVI). By incorporating both in situ and GPM precipitation data within a 6-hour window prior to satellite overpass, the method identifies and adjusts precipitation-affected observations through interpolation. The corrected NPRVI time series show improved temporal consistency and stronger alignment with optical vegetation indices, particularly during periods of saturation or limited variability. Although demonstrated using Sentinel-1 over crop fields, the framework is extendable to other radar parameters and frequencies, supporting enhanced integration of radar and optical datasets for agricultural and vegetation monitoring under the influence of precipitation. View this paper
  • Issues are regarded as officially published after their release is announced to the table of contents alert mailing list.
  • You may sign up for e-mail alerts to receive table of contents of newly released issues.
  • PDF is the official format for papers published in both, html and pdf forms. To view the papers in pdf format, click on the "PDF Full-text" link, and use the free Adobe Reader to open them.
Order results
Result details
Section
Select all
Export citation of selected articles as:
24 pages, 4139 KiB  
Article
Multidimensional Identification of County-Level Shrinkage by Improved Mapping of Urban Entities Based on Time-Series Remote Sensing Data: A Case Study of Yangtze River Delta Urban Agglomerations
by Lin Chen, Mingyue Liu and Weidong Man
Remote Sens. 2025, 17(14), 2536; https://doi.org/10.3390/rs17142536 - 21 Jul 2025
Viewed by 315
Abstract
Although measurements of urban shrinkage in China have received much attention, most have relied on statistical yearbook data based on political–administrative city boundaries, and remote-sensing-based quantification is mainly one-dimensional. This has caused problems in incorporating rural areas and spatiotemporal inconsistencies, as well as [...] Read more.
Although measurements of urban shrinkage in China have received much attention, most have relied on statistical yearbook data based on political–administrative city boundaries, and remote-sensing-based quantification is mainly one-dimensional. This has caused problems in incorporating rural areas and spatiotemporal inconsistencies, as well as an inadequate understanding, which has subsequently resulted in an inaccurate shrinkage identification. This study merely utilized the latest multisensory and time-series remote sensing data, including nighttime light, land use, and population grids, to quantify the spatiotemporal patterns of multidimensional shrinkage based on the county-level urban entity mapping of Yangtze River Delta urban agglomerations (YRD-UAs) from 2003 to 2023. County-level urban entities were acquired from a pioneering mapping effort that utilized city-specific commuting distance and land use maps. The results demonstrated that urban entities in 215 counties grew at a generally slowing pace. The degree of economic, population, and space shrinkage was mainly slight, and the shrinking trajectory was dominated by temporary shrinkage. Most counties experienced population shrinkage in their coastal-oriented distribution, whereas economic shrinkage affected the fewest counties, with the lowest spatial clustering occurring northward. Population shrinkage also displayed the highest spatial autocorrelation, but its agglomeration weakened against space shrinkage clustering. This study concluded that the exclusive utilization of remote sensing products to measure urban-entity-based multidimensional shrinkage reduced the uncertainty associated with rural area inclusion and resulted in satisfactory assessment accuracy. The spatiotemporal patterns of multidimensional shrinkage suggested strengthening ecological land allocation within urban entities across the entire region, implementing polycentric development strategies in the north, as well as enhancing county-level economic governance in the northwest. This study presents a spatiotemporally comparable methodology for quantifying the multidimensional shrinking of county-level urban entities at a large scale and contributes to further optimizing the developments of YRD-UAs. Full article
Show Figures

Figure 1

22 pages, 3348 KiB  
Article
Comparison of NeRF- and SfM-Based Methods for Point Cloud Reconstruction for Small-Sized Archaeological Artifacts
by Miguel Ángel Maté-González, Roy Yali, Jesús Rodríguez-Hernández, Enrique González-González and Julián Aguirre de Mata
Remote Sens. 2025, 17(14), 2535; https://doi.org/10.3390/rs17142535 - 21 Jul 2025
Viewed by 231
Abstract
This study presents a critical evaluation of image-based 3D reconstruction techniques for small archaeological artifacts, focusing on a quantitative comparison between Neural Radiance Fields (NeRF), its recent Gaussian Splatting (GS) variant, and traditional Structure-from-Motion (SfM) photogrammetry. The research targets artifacts smaller than 5 [...] Read more.
This study presents a critical evaluation of image-based 3D reconstruction techniques for small archaeological artifacts, focusing on a quantitative comparison between Neural Radiance Fields (NeRF), its recent Gaussian Splatting (GS) variant, and traditional Structure-from-Motion (SfM) photogrammetry. The research targets artifacts smaller than 5 cm, characterized by complex geometries and reflective surfaces that pose challenges for conventional recording methods. To address the limitations of traditional methods without resorting to the high costs associated with laser scanning, this study explores NeRF and GS as cost-effective and efficient alternatives. A comprehensive experimental framework was established, incorporating ground-truth data obtained using a metrological articulated arm and a rigorous quantitative evaluation based on root mean square (RMS) error, Chamfer distance, and point cloud density. The results indicate that while NeRF outperforms GS in terms of geometric fidelity, both techniques still exhibit lower accuracy compared to SfM, particularly in preserving fine geometric details. Nonetheless, NeRF demonstrates strong potential for rapid, high-quality 3D documentation suitable for visualization and dissemination purposes in cultural heritage. These findings highlight both the current capabilities and limitations of neural rendering techniques for archaeological documentation and suggest promising future research directions combining AI-based models with traditional photogrammetric pipelines. Full article
Show Figures

Figure 1

28 pages, 4950 KiB  
Article
A Method for Auto Generating a Remote Sensing Building Detection Sample Dataset Based on OpenStreetMap and Bing Maps
by Jiawei Gu, Chen Ji, Houlin Chen, Xiangtian Zheng, Liangbao Jiao and Liang Cheng
Remote Sens. 2025, 17(14), 2534; https://doi.org/10.3390/rs17142534 - 21 Jul 2025
Viewed by 259
Abstract
In remote sensing building detection tasks, data acquisition remains a critical bottleneck that limits both model performance and large-scale deployment. Due to the high cost of manual annotation, limited geographic coverage, and constraints of image acquisition conditions, obtaining large-scale, high-quality labeled datasets remains [...] Read more.
In remote sensing building detection tasks, data acquisition remains a critical bottleneck that limits both model performance and large-scale deployment. Due to the high cost of manual annotation, limited geographic coverage, and constraints of image acquisition conditions, obtaining large-scale, high-quality labeled datasets remains a significant challenge. To address this issue, this study proposes an automatic semantic labeling framework for remote sensing imagery. The framework leverages geospatial vector data provided by OpenStreetMap, precisely aligns it with high-resolution satellite imagery from Bing Maps through projection transformation, and incorporates a quality-aware sample filtering strategy to automatically generate accurate annotations for building detection. The resulting dataset comprises 36,647 samples, covering buildings in both urban and suburban areas across multiple cities. To evaluate its effectiveness, we selected three publicly available datasets—WHU, INRIA, and DZU—and conducted three types of experiments using the following four representative object detection models: SSD, Faster R-CNN, DETR, and YOLOv11s. The experiments include benchmark performance evaluation, input perturbation robustness testing, and cross-dataset generalization analysis. Results show that our dataset achieved a mAP at 0.5 intersection over union of up to 93.2%, with a precision of 89.4% and a recall of 90.6%, outperforming the open-source benchmarks across all four models. Furthermore, when simulating real-world noise in satellite image acquisition—such as motion blur and brightness variation—our dataset maintained a mean average precision of 90.4% under the most severe perturbation, indicating strong robustness. In addition, it demonstrated superior cross-dataset stability compared to the benchmarks. Finally, comparative experiments conducted on public test areas further validated the effectiveness and reliability of the proposed annotation framework. Full article
Show Figures

Figure 1

27 pages, 18863 KiB  
Article
Angular Super-Resolution of Forward-Looking Scanning Radar via Grid-Updating Split SPICE-TV
by Ruitao Li, Jiawei Luo, Yin Zhang, Yongchao Zhang, Lu Jiao, Deqing Mao, Yulin Huang and Jianyu Yang
Remote Sens. 2025, 17(14), 2533; https://doi.org/10.3390/rs17142533 - 21 Jul 2025
Viewed by 167
Abstract
The sparse iterative covariance-based estimation (SPICE) method has recently gained significant attraction in the field of scanning radar super-resolution imaging because of its angular resolution enhancement capability. However, it is unable to preserve the target profile, and the estimator is constrained by high [...] Read more.
The sparse iterative covariance-based estimation (SPICE) method has recently gained significant attraction in the field of scanning radar super-resolution imaging because of its angular resolution enhancement capability. However, it is unable to preserve the target profile, and the estimator is constrained by high computational complexity and memory consumption. In this paper, a grid-updating split SPICE-TV algorithm is presented. The method allows for the efficient updating of reconstruction results with both contour and resolution, and a recursive grid-updating implementation framework of the split SPICE-TV has the capability to reduce the computational complexity. First, the scanning radar angular super-resolution problem is transformed into a constrained optimization problem by simultaneously employing sparse covariance fitting criteria and TV regularization constraints. Then, the split Bregman method is employed to derive an efficient closed-form solution to the problem. Ultimately, the matrix inversion problem is transformed into an online iterative equation to reduce the computational complexity and memory consumption. The superiority of the proposed method is verified by simulation and experimental data. Full article
Show Figures

Figure 1

27 pages, 21494 KiB  
Article
Deep Learning and Transformer Models for Groundwater Level Prediction in the Marvdasht Plain: Protecting UNESCO Heritage Sites—Persepolis and Naqsh-e Rustam
by Peyman Heidarian, Franz Pablo Antezana Lopez, Yumin Tan, Somayeh Fathtabar Firozjaee, Tahmouras Yousefi, Habib Salehi, Ava Osman Pour, Maria Elena Oscori Marca, Guanhua Zhou, Ali Azhdari and Reza Shahbazi
Remote Sens. 2025, 17(14), 2532; https://doi.org/10.3390/rs17142532 - 21 Jul 2025
Viewed by 492
Abstract
Groundwater level monitoring is crucial for assessing hydrological responses to climate change and human activities, which pose significant threats to the sustainability of semi-arid aquifers and the cultural heritage they sustain. This study presents an integrated remote sensing and transformer-based deep learning framework [...] Read more.
Groundwater level monitoring is crucial for assessing hydrological responses to climate change and human activities, which pose significant threats to the sustainability of semi-arid aquifers and the cultural heritage they sustain. This study presents an integrated remote sensing and transformer-based deep learning framework that combines diverse geospatial datasets to predict spatiotemporal variations across the plain near the Persepolis and Naqsh-e Rustam archaeological complexes—UNESCO World Heritage Sites situated at the plain’s edge. We assemble 432 synthetic aperture radar (SAR) scenes (2015–2022) and derive vertical ground motion rates greater than −180 mm yr−1, which are co-localized with multisource geoinformation, including hydrometeorological indices, biophysical parameters, and terrain attributes, to train transformer models with traditional deep learning methods. A sparse probabilistic transformer (ConvTransformer) trained on 95 gridded variables achieves an out-of-sample R2 = 0.83 and RMSE = 6.15 m, outperforming bidirectional deep learning models by >40%. Scenario analysis indicates that, in the absence of intervention, subsidence may exceed 200 mm per year within a decade, threatening irreplaceable Achaemenid stone reliefs. Our results indicate that attention-based networks, when coupled to synergistic geodetic constraints, enable early-warning quantification of groundwater stress over heritage sites and provide a scalable template for sustainable aquifer governance worldwide. Full article
Show Figures

Figure 1

17 pages, 2164 KiB  
Technical Note
Contributions of Dust and Non-Dust Weather to Dust Emissions: A Case Study from the Central Taklimakan Desert
by Xinghua Yang, Mingjie Ma, Chenglong Zhou, Fan Yang, Wen Huo, Ali Mamtimin, Qing He and Guohua Wang
Remote Sens. 2025, 17(14), 2531; https://doi.org/10.3390/rs17142531 - 21 Jul 2025
Viewed by 230
Abstract
Dust aerosols can influence climate change, the ecological environment, human health, etc. and are one of the most important factors causing global change. The specific contributions of dust events, gusts, and dust devils to dust emission remain unclear in many regions. In this [...] Read more.
Dust aerosols can influence climate change, the ecological environment, human health, etc. and are one of the most important factors causing global change. The specific contributions of dust events, gusts, and dust devils to dust emission remain unclear in many regions. In this study, we quantified dust emissions generated by dust events, gusts, and dust devils in the center of the Taklimakan Desert of northwestern China and investigated their respective contributions to atmospheric dust aerosols. The results illustrated that monthly dust emissions and the dust emission time for dust events, gusts, and dust devils peaked in July, August, and June, respectively, and the average monthly contributions to dust emissions were 48.2, 10.6, and 41.2% and those to emission time were 60.5, 25.5, and 14.0%, respectively. Although the dust emissions for the dust event were comparable to the sum of gusts and dust devils, the average value of AOD corresponding to the dust event was roughly 2.5 times higher than that of a non-dust day. The results presented in this study not only highlight the undeniable contribution of gusts and dust devils to dust emissions but also indicate that the specific contributions to atmospheric dust aerosols from gusts and dust devils remain uncertain. Full article
(This article belongs to the Section Atmospheric Remote Sensing)
Show Figures

Figure 1

20 pages, 10304 KiB  
Article
Long-Term Hourly Ozone Forecasting via Time–Frequency Analysis of ICEEMDAN-Decomposed Components: A 36-Hour Forecast for a Site in Beijing
by Taotao Lv, Yulu Yi, Zhuowen Zheng, Jie Yang and Siwei Li
Remote Sens. 2025, 17(14), 2530; https://doi.org/10.3390/rs17142530 - 21 Jul 2025
Viewed by 241
Abstract
Surface ozone is a pollutant linked to higher risks of cardiopulmonary diseases with long-term exposure. Timely forecasting of ozone levels helps authorities implement preventive measures to protect public health and safety. However, few studies have been able to reliably provide long-term hourly ozone [...] Read more.
Surface ozone is a pollutant linked to higher risks of cardiopulmonary diseases with long-term exposure. Timely forecasting of ozone levels helps authorities implement preventive measures to protect public health and safety. However, few studies have been able to reliably provide long-term hourly ozone forecasts due to the complexity of ozone’s diurnal variations. To address this issue, this study constructs a hybrid prediction model integrating improved complete ensemble empirical mode decomposition with adaptive noise (ICEEMDAN), bi-directional long short-term memory neural network (BiLSTM), and the persistence model to forecast the hourly ozone concentrations for the next continuous 36 h. The model is trained and tested at the Wanshouxigong site in Beijing. The ICEEMDAN method decomposes the ozone time series data to extract trends and obtain intrinsic mode functions (IMFs) and a residual (Res). Fourier period analysis is employed to elucidate the periodicity of the IMFs, which serves as the basis for selecting the prediction model (BiLSTM or persistence model) for different IMFs. Extensive experiments have shown that a hybrid model of ICEEMDAN, BiLSTM, and persistence model is able to achieve a good performance, with a prediction accuracy of R2 = 0.86 and RMSE = 18.70 µg/m3 for the 36th hour, outperforming other models. Full article
(This article belongs to the Section Environmental Remote Sensing)
Show Figures

Figure 1

18 pages, 4374 KiB  
Article
Elevation-Aware Domain Adaptation for Sematic Segmentation of Aerial Images
by Zihao Sun, Peng Guo, Zehui Li, Xiuwan Chen and Xinbo Liu
Remote Sens. 2025, 17(14), 2529; https://doi.org/10.3390/rs17142529 - 21 Jul 2025
Viewed by 292
Abstract
Recent advancements in Earth observation technologies have accelerated remote sensing (RS) data acquisition, yet cross-domain semantic segmentation remains challenged by domain shifts. Traditional unsupervised domain adaptation (UDA) methods often rely on computationally intensive and unstable generative adversarial networks (GANs). This study introduces elevation-aware [...] Read more.
Recent advancements in Earth observation technologies have accelerated remote sensing (RS) data acquisition, yet cross-domain semantic segmentation remains challenged by domain shifts. Traditional unsupervised domain adaptation (UDA) methods often rely on computationally intensive and unstable generative adversarial networks (GANs). This study introduces elevation-aware domain adaptation (EADA), a multi-task framework that integrates elevation estimation (via digital surface models) with semantic segmentation to address distribution discrepancies. EADA employs a shared encoder and task-specific decoders, enhanced by a spatial attention-based feature fusion module. Experiments on Potsdam and Vaihingen datasets under cross-domain settings (e.g., Potsdam IRRG → Vaihingen IRRG) show that EADA achieves state-of-the-art performance, with a mean IoU of 54.62% and an F1-score of 65.47%, outperforming single-stage baselines. Elevation awareness significantly improves the segmentation of height-sensitive classes, such as buildings, while maintaining computational efficiency. Compared to multi-stage approaches, EADA’s end-to-end design reduces training complexity without sacrificing accuracy. These results demonstrate that incorporating elevation data effectively mitigates domain shifts in RS imagery. However, lower accuracy for elevation-insensitive classes suggests the need for further refinement to enhance overall generalizability. Full article
Show Figures

Figure 1

34 pages, 3579 KiB  
Review
A Comprehensive Review of Mathematical Error Characterization and Mitigation Strategies in Terrestrial Laser Scanning
by Mansoor Sabzali and Lloyd Pilgrim
Remote Sens. 2025, 17(14), 2528; https://doi.org/10.3390/rs17142528 - 20 Jul 2025
Viewed by 352
Abstract
In recent years, there has been an increasing transition from 1D point-based to 3D point-cloud-based data acquisition for monitoring applications and deformation analysis tasks. Previously, many studies relied on point-to-point measurements using total stations to assess structural deformation. However, the introduction of terrestrial [...] Read more.
In recent years, there has been an increasing transition from 1D point-based to 3D point-cloud-based data acquisition for monitoring applications and deformation analysis tasks. Previously, many studies relied on point-to-point measurements using total stations to assess structural deformation. However, the introduction of terrestrial laser scanning (TLS) has commenced a new era in data capture with a high level of efficiency and flexibility for data collection and post processing. Thus, a robust understanding of both data acquisition and processing techniques is required to guarantee high-quality deliverables to geometrically separate the measurement uncertainty and movements. TLS is highly demanding in capturing detailed 3D point coordinates of a scene within either short- or long-range scanning. Although various studies have examined scanner misalignments under controlled conditions within the short range of observation (scanner calibration), there remains a knowledge gap in understanding and characterizing errors related to long-range scanning (scanning calibration). Furthermore, limited information on manufacturer-oriented calibration tests highlights the motivation for designing a user-oriented calibration test. This research focused on investigating four primary sources of error in the generic error model of TLS. These were categorized into four geometries: instrumental imperfections related to the scanner itself, atmospheric effects that impact the laser beam, scanning geometry concerning the setup and varying incidence angles during scanning, and object and surface characteristics affecting the overall data accuracy. This study presents previous findings of TLS calibration relevant to the four error sources and mitigation strategies and identified current challenges that can be implemented as potential research directions. Full article
Show Figures

Figure 1

24 pages, 14887 KiB  
Article
Estimation and Change Analysis of Grassland AGB in the China–Mongolia–Russia Border Area Based on Multi-Source Geospatial Data
by Jiani Ma, Chao Zhang, Cong Ou, Chi Qiu, Cuicui Yang, Beibei Wang and Urtnasan Mandakh
Remote Sens. 2025, 17(14), 2527; https://doi.org/10.3390/rs17142527 - 20 Jul 2025
Viewed by 371
Abstract
Aboveground biomass (AGB) is a critical indicator for assessing carbon sequestration and ecosystem health in transboundary ecologically fragile areas. High-precision estimation and spatiotemporal inversion of AGB are the key to investigating transition zones. However, inadequate feature selection and complex parameter tuning limit accuracy [...] Read more.
Aboveground biomass (AGB) is a critical indicator for assessing carbon sequestration and ecosystem health in transboundary ecologically fragile areas. High-precision estimation and spatiotemporal inversion of AGB are the key to investigating transition zones. However, inadequate feature selection and complex parameter tuning limit accuracy and spatiotemporal representation in the estimation model. An AGB estimation model that integrates SHAP-based feature selection with a particle swarm optimization-enhanced random forest model (RF_PSO) was proposed. Then AGB trajectory clustering was used to characterize the grassland change pattern. The method was applied to grasslands across the China–Mongolia–Russia (CMR) border area from 2000 to 2020. The results show that (1) the SHAP-RF_PSO model achieved the highest accuracy (R2 = 0.87, RMSE = 45.8 g/m2), outperforming other estimation models. (2) AGB improvements were observed in 72.13% of the area, mainly in MN_EA, MN_CE, and CN_NMG, while 27.39% showed degradation, concentrated in CN_NMG and MN_CE. The stable area accounts for 0.48%, which is scattered in RU_BU and RU_ZA.CN_NMG. (3) Four change patterns, namely Fluctuating Low, Stable Low, Fluctuating High, and Stable High, were identified, with major shifts in 2007, 2012, and 2014. (4) Projections indicate that 80% of the region may maintain current trends, 13% may reverse, and 7% remain uncertain, requiring targeted interventions. This study offers a robust tool for high-precision AGB estimation and supports dynamic monitoring in the CMR border area. Full article
Show Figures

Figure 1

24 pages, 7947 KiB  
Article
Spatial Downscaling of GRACE Groundwater Storage Based on DTW Distance Clustering and an Analysis of Its Driving Factors
by Huazhu Xue, Hao Wang, Guotao Dong and Zhi Li
Remote Sens. 2025, 17(14), 2526; https://doi.org/10.3390/rs17142526 - 20 Jul 2025
Viewed by 323
Abstract
High-resolution groundwater storage is essential for effective regional water resource management. While Gravity Recovery and Climate Experiment (GRACE) satellite data offer global coverage, the coarse spatial resolution (0.25–0.5°) limits the data’s applicability at regional scales. Traditional downscaling methods often fail to effectively capture [...] Read more.
High-resolution groundwater storage is essential for effective regional water resource management. While Gravity Recovery and Climate Experiment (GRACE) satellite data offer global coverage, the coarse spatial resolution (0.25–0.5°) limits the data’s applicability at regional scales. Traditional downscaling methods often fail to effectively capture spatial heterogeneity within regions, leading to reduced model performance. To overcome this limitation, a zoned downscaling strategy based on time series clustering is proposed. A K-means clustering algorithm with dynamic time warping (DTW) distance, combined with a random forest (RF) model, was employed to partition the Hexi Corridor region into relatively homogeneous subregions for downscaling. Results demonstrated that this clustering strategy significantly enhanced downscaling model performance. Correlation coefficients rose from 0.10 without clustering to above 0.84 with K-means clustering and the RF model, while correlation with the groundwater monitoring well data improved from a mean of 0.47 to 0.54 in the first subregion (a) and from 0.40 to 0.45 in the second subregion (b). The driving factor analysis revealed notable differences in dominant factors between subregions. In the first subregion (a), potential evapotranspiration (PET) was found to be the primary driving factor, accounting for 33.70% of the variation. In the second subregion (b), the normalized difference vegetation index (NDVI) was the dominant factor, contributing 29.73% to the observed changes. These findings highlight the effectiveness of spatial clustering downscaling methods based on DTW distance, which can mitigate the effects of spatial heterogeneity and provide high-precision groundwater monitoring data at a 1 km spatial resolution, ultimately improving water resource management in arid regions. Full article
(This article belongs to the Special Issue Remote Sensing for Groundwater Hydrology)
Show Figures

Figure 1

20 pages, 4598 KiB  
Article
Risk Evaluation of Agricultural Non-Point Source Pollution in Typical Hilly and Mountainous Areas: A Case Study of Yongchuan District, Chongqing City, China
by Yanrong Lu, Guoying Dong, Rongjin Yang, Meiying Sun, Le Zhang, Yuying Zhang, Yitong Yin and Xiuhong Li
Remote Sens. 2025, 17(14), 2525; https://doi.org/10.3390/rs17142525 - 20 Jul 2025
Viewed by 242
Abstract
While significant progress has been made in controlling point source pollution, agricultural non-point source pollution (AGNPSP) has emerged as a major contributor to global water pollution, posing a severe threat to ecological quality. According to China’s Second National Pollution Source Census, AGNPSP constitutes [...] Read more.
While significant progress has been made in controlling point source pollution, agricultural non-point source pollution (AGNPSP) has emerged as a major contributor to global water pollution, posing a severe threat to ecological quality. According to China’s Second National Pollution Source Census, AGNPSP constitutes a substantial proportion of water pollution, making its mitigation a critical challenge. Identifying AGNPSP risk zones is essential for targeted management and effective intervention. This study focuses on Yongchuan District, a representative hilly–mountainous area in the Yangtze River Basin. Applying the landscape ecology “source–sink” theory, we selected seven natural factors influencing AGNPSP and constructed a minimum cumulative resistance model using remote sensing post-processing data. An attempt was made to classify the “source” and “sink” landscapes, and ultimately conduct a risk assessment of AGNPSP in Yongchuan District, identifying the key areas for AGNPSP control. Key findings include: 1. Vegetation coverage is the most significant natural factor affecting AGNPSP. 2. Extremely high- and high-risk zones cover 90% of Yongchuan, primarily concentrated in the central and southern regions, indicating severe AGNPSP pressure that demands urgent management. 3. The levels of ammonia nitrogen and total phosphorus in the typical sections are related to the risk levels of the corresponding sections. Consequently, the risk level of AGNPSP directly correlates with the pollutant concentrations measured in the sections. This study provides a robust scientific basis for AGNPSP risk assessment and targeted control strategies, offering valuable insights for pollution management in Yongchuan and similar regions. Full article
Show Figures

Figure 1

27 pages, 15898 KiB  
Article
Modeling Multivariable Associations and Inter-Eddy Interactions: A Dual-Graph Learning Framework for Mesoscale Eddy Trajectory Forecasting
by Yanling Du, Bin Zhang, Jian Wang, Zhenli Qian and Wei Song
Remote Sens. 2025, 17(14), 2524; https://doi.org/10.3390/rs17142524 - 20 Jul 2025
Viewed by 225
Abstract
The precise forecasting of mesoscale eddy trajectories holds significant importance for understanding their mechanisms in driving global oceanic mass and heat transport. However, mesoscale eddies are influenced by numerous stochastic and uncertain factors, leading to substantial fluctuations in their attribute variables. Additionally, the [...] Read more.
The precise forecasting of mesoscale eddy trajectories holds significant importance for understanding their mechanisms in driving global oceanic mass and heat transport. However, mesoscale eddies are influenced by numerous stochastic and uncertain factors, leading to substantial fluctuations in their attribute variables. Additionally, the trajectories of eddies are related to historical trends and interact with surrounding eddies. These render the accurate forecasting of mesoscale eddy trajectories a formidable challenge. This study proposes a novel dynamic forecasting framework for eddies’ trajectories, termed EddyGnet, a dual graph neural network framework that synergistically models the complex multivariable association and the spatiotemporal eddy association. In this framework, the dynamic association among eddy attribute variables is first explored by a multivariable association graph (MAG) learning module. Subsequently, the spatial and temporal association among eddies are concurrently analyzed using a spatiotemporal eddy association graph (STEAG) learning module. Finally, a decayed volatility loss function is designed to properly handle the complex and variable data features and improve the forecasting performance. The experimental results on the eddy dataset verify the effectiveness of our proposed EddyGnet, demonstrating superior predictive accuracy and stability compared with existing classical methods. The findings advance the mechanistic understanding of eddy dynamics and provide a transferable paradigm for geoscientific spatiotemporal modeling. Full article
(This article belongs to the Special Issue Artificial Intelligence and Big Data for Oceanography (2nd Edition))
Show Figures

Figure 1

27 pages, 2736 KiB  
Article
Estimation of Tree Diameter at Breast Height (DBH) and Biomass from Allometric Models Using LiDAR Data: A Case of the Lake Broadwater Forest in Southeast Queensland, Australia
by Zibonele Mhlaba Bhebhe, Xiaoye Liu, Zhenyu Zhang and Dev Raj Paudyal
Remote Sens. 2025, 17(14), 2523; https://doi.org/10.3390/rs17142523 - 20 Jul 2025
Viewed by 460
Abstract
Light Detection and Ranging (LiDAR) provides three-dimensional information that can be used to extract tree parameter measurements such as height (H), canopy volume (CV), canopy diameter (CD), canopy area (CA), and tree stand density. LiDAR data does not directly give diameter at breast [...] Read more.
Light Detection and Ranging (LiDAR) provides three-dimensional information that can be used to extract tree parameter measurements such as height (H), canopy volume (CV), canopy diameter (CD), canopy area (CA), and tree stand density. LiDAR data does not directly give diameter at breast height (DBH), an important input into allometric equations to estimate biomass. The main objective of this study is to estimate tree DBH using existing allometric models. Specifically, it compares three global DBH pantropical models to calculate DBH and to estimate the aboveground biomass (AGB) of the Lake Broadwater Forest located in Southeast (SE) Queensland, Australia. LiDAR data collected in mid-2022 was used to test these models, with field validation data collected at the beginning of 2024. The three DBH estimation models—the Jucker model, Gonzalez-Benecke model 1, and Gonzalez-Benecke model 2—all used tree H, and the Jucker and Gonzalez-Benecke model 2 additionally used CD and CA, respectively. Model performance was assessed using five statistical metrics: root mean squared error (RMSE), mean absolute error (MAE), mean absolute percentage error (MAPE), percentage bias (MBias), and the coefficient of determination (R2). The Jucker model was the best-performing model, followed by Gonzalez-Benecke model 2 and Gonzalez-Benecke model 1. The Jucker model had an RMSE of 8.7 cm, an MAE of −13.54 cm, an MAPE of 7%, an MBias of 13.73 cm, and an R2 of 0.9005. The Chave AGB model was used to estimate the AGB at the tree, plot, and per hectare levels using the Jucker model-calculated DBH and the field-measured DBH. AGB was used to estimate total biomass, dry weight, carbon (C), and carbon dioxide (CO2) sequestered per hectare. The Lake Broadwater Forest was estimated to have an AGB of 161.5 Mg/ha in 2022, a Total C of 65.6 Mg/ha, and a CO2 sequestered of 240.7 Mg/ha in 2022. These findings highlight the substantial carbon storage potential of the Lake Broadwater Forest, reinforcing the opportunity for landholders to participate in the carbon credit systems, which offer financial benefits and enable contributions to carbon mitigation programs, thereby helping to meet national and global carbon reduction targets. Full article
Show Figures

Figure 1

25 pages, 11642 KiB  
Article
Non-Invasive Estimation of Crop Water Stress Index and Irrigation Management with Upscaling from Field to Regional Level Using Remote Sensing and Agrometeorological Data
by Emmanouil Psomiadis, Panos I. Philippopoulos and George Kakaletris
Remote Sens. 2025, 17(14), 2522; https://doi.org/10.3390/rs17142522 - 20 Jul 2025
Viewed by 339
Abstract
Precision irrigation plays a crucial role in managing crop production in a sustainable and environmentally friendly manner. This study builds on the results of the GreenWaterDrone project, aiming to estimate, in real time, the actual water requirements of crop fields using the crop [...] Read more.
Precision irrigation plays a crucial role in managing crop production in a sustainable and environmentally friendly manner. This study builds on the results of the GreenWaterDrone project, aiming to estimate, in real time, the actual water requirements of crop fields using the crop water stress index, integrating infrared canopy temperature, air temperature, relative humidity, and thermal and near-infrared imagery. To achieve this, a state-of-the-art aerial micrometeorological station (AMMS), equipped with an infrared thermal sensor, temperature–humidity sensor, and advanced multispectral and thermal cameras is mounted on an unmanned aerial system (UAS), thus minimizing crop field intervention and permanently installed equipment maintenance. Additionally, data from satellite systems and ground micrometeorological stations (GMMS) are integrated to enhance and upscale system results from the local field to the regional level. The research was conducted over two years of pilot testing in the municipality of Trifilia (Peloponnese, Greece) on pilot potato and watermelon crops, which are primary cultivations in the region. Results revealed that empirical irrigation applied to the rhizosphere significantly exceeded crop water needs, with over-irrigation exceeding by 390% the maximum requirement in the case of potato. Furthermore, correlations between high-resolution remote and proximal sensors were strong, while associations with coarser Landsat 8 satellite data, to upscale the local pilot field experimental results, were moderate. By applying a comprehensive model for upscaling pilot field results, to the overall Trifilia region, project findings proved adequate for supporting sustainable irrigation planning through simulation scenarios. The results of this study, in the context of the overall services introduced by the project, provide valuable insights for farmers, agricultural scientists, and local/regional authorities and stakeholders, facilitating improved regional water management and sustainable agricultural policies. Full article
Show Figures

Figure 1

20 pages, 3898 KiB  
Article
Synergistic Multi-Model Approach for GPR Data Interpretation: Forward Modeling and Robust Object Detection
by Hang Zhang, Zhijie Ma, Xinyu Fan and Feifei Hou
Remote Sens. 2025, 17(14), 2521; https://doi.org/10.3390/rs17142521 - 20 Jul 2025
Viewed by 263
Abstract
Ground penetrating radar (GPR) is widely used for subsurface object detection, but manual interpretation of hyperbolic features in B-scan images remains inefficient and error-prone. In addition, traditional forward modeling methods suffer from low computational efficiency and strong dependence on field measurements. To address [...] Read more.
Ground penetrating radar (GPR) is widely used for subsurface object detection, but manual interpretation of hyperbolic features in B-scan images remains inefficient and error-prone. In addition, traditional forward modeling methods suffer from low computational efficiency and strong dependence on field measurements. To address these challenges, we propose an unsupervised data augmentation framework that utilizes CycleGAN-based model to generates diverse synthetic B-scan images by simulating varying geological parameters and scanning configurations. This approach achieves GPR data forward modeling and enhances the scenario coverage of training data. We then apply the EfficientDet architecture, which incorporates a bidirectional feature pyramid network (BiFPN) for multi-scale feature fusion, to enhance the detection capability of hyperbolic signatures in B-scan images under challenging conditions such as partial occlusions and background noise. The proposed method achieves a mean average precision (mAP) of 0.579 on synthetic datasets, outperforming YOLOv3 and RetinaNet by 16.0% and 23.5%, respectively, while maintaining robust multi-object detection in complex field conditions. Full article
(This article belongs to the Special Issue Advanced Ground-Penetrating Radar (GPR) Technologies and Applications)
Show Figures

Figure 1

20 pages, 18416 KiB  
Article
Swin-FSNet: A Frequency-Aware and Spatially Enhanced Network for Unpaved Road Extraction from UAV Remote Sensing Imagery
by Jiwu Guan, Qingzhan Zhao, Wenzhong Tian, Xinxin Yao, Jingyang Li and Wei Li
Remote Sens. 2025, 17(14), 2520; https://doi.org/10.3390/rs17142520 - 20 Jul 2025
Viewed by 334
Abstract
The efficient recognition of unpaved roads from remote sensing (RS) images holds significant value for tasks such as emergency response and route planning in outdoor environments. However, unpaved roads often face challenges such as blurred boundaries, low contrast, complex shapes, and a lack [...] Read more.
The efficient recognition of unpaved roads from remote sensing (RS) images holds significant value for tasks such as emergency response and route planning in outdoor environments. However, unpaved roads often face challenges such as blurred boundaries, low contrast, complex shapes, and a lack of publicly available datasets. To address these issues, this paper proposes a novel architecture, Swin-FSNet, which combines frequency analysis and spatial enhancement techniques to optimize feature extraction. The architecture consists of two core modules: the Wavelet-Based Feature Decomposer (WBFD) module and the Hybrid Dynamic Snake Block (HyDS-B) module. The WBFD module enhances boundary detection by capturing directional gradient changes at the road edges and extracting high-frequency features, effectively addressing boundary blurring and low contrast. The HyDS-B module, by adaptively adjusting the receptive field, performs spatial modeling for complex-shaped roads, significantly improving adaptability to narrow road curvatures. In this study, the southern mountainous area of Shihezi, Xinjiang, was selected as the study area, and the unpaved road dataset was constructed using high-resolution UAV images. Experimental results on the SHZ unpaved road dataset and the widely used DeepGlobe dataset show that Swin-FSNet performs well in segmentation accuracy and road structure preservation, with an IoUroad of 81.76% and 71.97%, respectively. The experiments validate the excellent performance and robustness of Swin-FSNet in extracting unpaved roads from high-resolution RS images. Full article
Show Figures

Figure 1

21 pages, 6329 KiB  
Article
Mesoscale Analysis and Numerical Simulation of an Extreme Precipitation Event on the Northern Slope of the Middle Kunlun Mountains in Xinjiang, China
by Chenxiang Ju, Man Li, Xia Yang, Yisilamu Wulayin, Ailiyaer Aihaiti, Qian Li, Weilin Shao, Junqiang Yao and Zonghui Liu
Remote Sens. 2025, 17(14), 2519; https://doi.org/10.3390/rs17142519 - 19 Jul 2025
Viewed by 254
Abstract
Under accelerating global warming, the northern slope of the Middle Kunlun Mountains in Xinjiang, China, has seen a marked rise in extreme rainfall, posing increasing challenges for flood risk management and water resources. To improve our predictive capabilities and deepen our understanding of [...] Read more.
Under accelerating global warming, the northern slope of the Middle Kunlun Mountains in Xinjiang, China, has seen a marked rise in extreme rainfall, posing increasing challenges for flood risk management and water resources. To improve our predictive capabilities and deepen our understanding of the driving mechanisms, we combine the European Centre for Medium-Range Weather Forecasts Reanalysis-5 (ERA5) reanalysis, regional observations, and high-resolution Weather Research and Forecasting model (WRF) simulations to dissect the 14–17 June 2021, extreme rainfall event. A deep Siberia–Central Asia trough and nascent Central Asian vortex established a coupled upper- and low-level jet configuration that amplified large-scale ascent. Embedded shortwaves funnelled abundant moisture into the orographic basin, where strong low-level moisture convergence and vigorous warm-sector updrafts triggered and sustained deep convection. WRF reasonably replicated observed wind shear and radar echoes, revealing the descent of a mid-level jet into an ultra-low-level jet that provided a mesoscale engine for storm intensification. Momentum–budget diagnostics underscore the role of meridional momentum transport along sloping terrain in reinforcing low-level convergence and shear. Together, these synoptic-to-mesoscale interactions and moisture dynamics led to this landmark extreme-precipitation event. Full article
Show Figures

Figure 1

18 pages, 2930 KiB  
Article
Eye in the Sky for Sub-Tidal Seagrass Mapping: Leveraging Unsupervised Domain Adaptation with SegFormer for Multi-Source and Multi-Resolution Aerial Imagery
by Satish Pawar, Aris Thomasberger, Stefan Hein Bengtson, Malte Pedersen and Karen Timmermann
Remote Sens. 2025, 17(14), 2518; https://doi.org/10.3390/rs17142518 - 19 Jul 2025
Viewed by 245
Abstract
The accurate and large-scale mapping of seagrass meadows is essential, as these meadows form primary habitats for marine organisms and large sinks for blue carbon. Image data available for mapping these habitats are often scarce or are acquired through multiple surveys and instruments, [...] Read more.
The accurate and large-scale mapping of seagrass meadows is essential, as these meadows form primary habitats for marine organisms and large sinks for blue carbon. Image data available for mapping these habitats are often scarce or are acquired through multiple surveys and instruments, resulting in images of varying spatial and spectral characteristics. This study presents an unsupervised domain adaptation (UDA) strategy that combines histogram-matching with the transformer-based SegFormer model to address these challenges. Unoccupied aerial vehicle (UAV)-derived imagery (3-cm resolution) was used for training, while orthophotos from airplane surveys (12.5-cm resolution) served as the target domain. The method was evaluated across three Danish estuaries (Horsens Fjord, Skive Fjord, and Lovns Broad) using one-to-one, leave-one-out, and all-to-one histogram matching strategies. The highest performance was observed at Skive Fjord, achieving an F1-score/IoU = 0.52/0.48 for the leave-one-out test, corresponding to 68% of the benchmark model that was trained on both domains. These results demonstrate the potential of this lightweight UDA approach to generalization across spatial, temporal, and resolution domains, enabling the cost-effective and scalable mapping of submerged vegetation in data-scarce environments. This study also sheds light on contrast as a significant property of target domains that impacts image segmentation. Full article
(This article belongs to the Special Issue High-Resolution Remote Sensing Image Processing and Applications)
Show Figures

Figure 1

35 pages, 58241 KiB  
Article
DGMNet: Hyperspectral Unmixing Dual-Branch Network Integrating Adaptive Hop-Aware GCN and Neighborhood Offset Mamba
by Kewen Qu, Huiyang Wang, Mingming Ding, Xiaojuan Luo and Wenxing Bao
Remote Sens. 2025, 17(14), 2517; https://doi.org/10.3390/rs17142517 - 19 Jul 2025
Viewed by 227
Abstract
Hyperspectral sparse unmixing (SU) networks have recently received considerable attention due to their model hyperspectral images (HSIs) with a priori spectral libraries and to capture nonlinear features through deep networks. This method effectively avoids errors associated with endmember extraction, and enhances the unmixing [...] Read more.
Hyperspectral sparse unmixing (SU) networks have recently received considerable attention due to their model hyperspectral images (HSIs) with a priori spectral libraries and to capture nonlinear features through deep networks. This method effectively avoids errors associated with endmember extraction, and enhances the unmixing performance via nonlinear modeling. However, two major challenges remain: the use of large spectral libraries with high coherence leads to computational redundancy and performance degradation; moreover, certain feature extraction models, such as Transformer, while exhibiting strong representational capabilities, suffer from high computational complexity. To address these limitations, this paper proposes a hyperspectral unmixing dual-branch network integrating an adaptive hop-aware GCN and neighborhood offset Mamba that is termed DGMNet. Specifically, DGMNet consists of two parallel branches. The first branch employs the adaptive hop-neighborhood-aware GCN (AHNAGC) module to model global spatial features. The second branch utilizes the neighborhood spatial offset Mamba (NSOM) module to capture fine-grained local spatial structures. Subsequently, the designed Mamba-enhanced dual-stream feature fusion (MEDFF) module fuses the global and local spatial features extracted from the two branches and performs spectral feature learning through a spectral attention mechanism. Moreover, DGMNet innovatively incorporates a spectral-library-pruning mechanism into the SU network and designs a new pruning strategy that accounts for the contribution of small-target endmembers, thereby enabling the dynamic selection of valid endmembers and reducing the computational redundancy. Finally, an improved ESS-Loss is proposed, which combines an enhanced total variation (ETV) with an l1/2 sparsity constraint to effectively refine the model performance. The experimental results on two synthetic and five real datasets demonstrate the effectiveness and superiority of the proposed method compared with the state-of-the-art methods. Notably, experiments on the Shahu dataset from the Gaofen-5 satellite further demonstrated DGMNet’s robustness and generalization. Full article
(This article belongs to the Special Issue Artificial Intelligence in Hyperspectral Remote Sensing Data Analysis)
Show Figures

Figure 1

13 pages, 5276 KiB  
Technical Note
Regional Assessment of COCTS HY1-C/D Chlorophyll-a and Suspended Particulate Matter Standard Products over French Coastal Waters
by Corentin Subirade, Cédric Jamet and Bing Han
Remote Sens. 2025, 17(14), 2516; https://doi.org/10.3390/rs17142516 - 19 Jul 2025
Viewed by 209
Abstract
Chlorophyll-a (Chla) and suspended particulate matter (SPM) are key indicators of water quality, playing critical roles in understanding marine biogeochemical processes and ecosystem health. Although satellite data from the Chinese Ocean Color and Temperature Scanner (COCTS) onboard the Haiyang-1C/D satellites is freely available, [...] Read more.
Chlorophyll-a (Chla) and suspended particulate matter (SPM) are key indicators of water quality, playing critical roles in understanding marine biogeochemical processes and ecosystem health. Although satellite data from the Chinese Ocean Color and Temperature Scanner (COCTS) onboard the Haiyang-1C/D satellites is freely available, there has been limited validation of its standard Chla and SPM products. This study is a first step to address this gap by evaluating COCTS-derived Chla and SPM products against in situ measurements in French coastal waters. The matchup analysis showed robust performance for the Chla product, with a median symmetric accuracy (MSA) of 50.46% over a dynamic range of 0.13–4.31 mg·m−3 (n = 24, Bias = 41.11%, Slope = 0.93). In contrast, the SPM product showed significant limitations, particularly in turbid waters, despite a reasonable performance in the matchup exercise, with an MSA of 45.86% within a range of 0.18–10.52 g·m−3 (n = 23, Bias = −14.59%, Slope = 2.29). A comparison with another SPM model and Moderate Resolution Imaging Spectroradiometer (MODIS) products showed that the COCTS standard algorithm tends to overestimate SPM and suggests that the issue does not originate from the input radiometric data. This study provides the first regional assessment of COCTS Chla and SPM products in European coastal waters. The findings highlight the need for algorithm refinement to improve the reliability of COCTS SPM products, while the Chla product demonstrates suitability for water quality monitoring in low to moderate Chla concentrations. Future studies should focus on the validation of COCTS ocean color products in more diverse waters. Full article
(This article belongs to the Section Ocean Remote Sensing)
Show Figures

Figure 1

27 pages, 3406 KiB  
Article
MSJosSAR Configuration Optimization and Scattering Mechanism Classification Based on Multi-Dimensional Features of Attribute Scattering Centers
by Shuo Liu, Fubo Zhang, Longyong Chen, Minan Shi, Tao Jiang and Yuhui Lei
Remote Sens. 2025, 17(14), 2515; https://doi.org/10.3390/rs17142515 - 19 Jul 2025
Viewed by 169
Abstract
As a novel system, multi-dimensional space joint-observation SAR (MSJosSAR) can simultaneously acquire target information across multiple dimensions such as frequency, angle, and polarization. This capability facilitates a more comprehensive understanding of the target and enhances subsequent recognition applications. However, current research on the [...] Read more.
As a novel system, multi-dimensional space joint-observation SAR (MSJosSAR) can simultaneously acquire target information across multiple dimensions such as frequency, angle, and polarization. This capability facilitates a more comprehensive understanding of the target and enhances subsequent recognition applications. However, current research on the configuration optimization of multi-dimensional SAR systems is limited, particularly in balancing recognition requirements with observation costs. This limitation has become a major bottleneck restricting the development of MSJosSAR. Moreover, studies on the joint utilization of multi-dimensional information at the scattering center level remain insufficient, which constrains the effectiveness of target component recognition. To address these challenges, this paper proposes a configuration optimization method for MSJosSAR based on the separability of scattering mechanisms. The approach transforms the configuration optimization problem into a vector separability problem commonly addressed in machine learning. Experimental results demonstrate that the multi-dimensional configuration obtained by this method significantly improves the classification accuracy of scattering mechanisms. Additionally, we propose a feature extraction and classification method for scattering centers across frequency and angle-polarization dimensions, and validate its effectiveness through electromagnetic simulation experiments. This study offers valuable insights and references for MSJosSAR configuration optimization and joint feature information processing. Full article
Show Figures

Figure 1

28 pages, 43087 KiB  
Article
LWSARDet: A Lightweight SAR Small Ship Target Detection Network Based on a Position–Morphology Matching Mechanism
by Yuliang Zhao, Yang Du, Qiutong Wang, Changhe Li, Yan Miao, Tengfei Wang and Xiangyu Song
Remote Sens. 2025, 17(14), 2514; https://doi.org/10.3390/rs17142514 - 19 Jul 2025
Viewed by 337
Abstract
The all-weather imaging capability of synthetic aperture radar (SAR) confers unique advantages for maritime surveillance. However, ship detection under complex sea conditions still faces challenges, such as high-frequency noise interference and the limited computational power of edge computing platforms. To address these challenges, [...] Read more.
The all-weather imaging capability of synthetic aperture radar (SAR) confers unique advantages for maritime surveillance. However, ship detection under complex sea conditions still faces challenges, such as high-frequency noise interference and the limited computational power of edge computing platforms. To address these challenges, we propose a lightweight SAR small ship detection network, LWSARDet, which mitigates feature redundancy and reduces computational complexity in existing models. Specifically, based on the YOLOv5 framework, a dual strategy for the lightweight network is adopted as follows: On the one hand, to address the limited nonlinear representation ability of the original network, a global channel attention mechanism is embedded and a feature extraction module, GCCR-GhostNet, is constructed, which can effectively enhance the network’s feature extraction capability and high-frequency noise suppression, while reducing computational cost. On the other hand, to reduce feature dilution and computational redundancy in traditional detection heads when focusing on small targets, we replace conventional convolutions with simple linear transformations and design a lightweight detection head, LSD-Head. Furthermore, we propose a Position–Morphology Matching IoU loss function, P-MIoU, which integrates center distance constraints and morphological penalty mechanisms to more precisely capture the spatial and structural differences between predicted and ground truth bounding boxes. Extensive experiments conduct on the High-Resolution SAR Image Dataset (HRSID) and the SAR Ship Detection Dataset (SSDD) demonstrate that LWSARDet achieves superior overall performance compared to existing state-of-the-art (SOTA) methods. Full article
Show Figures

Figure 1

22 pages, 5937 KiB  
Article
CSAN: A Channel–Spatial Attention-Based Network for Meteorological Satellite Image Super-Resolution
by Weiliang Liang and Yuan Liu
Remote Sens. 2025, 17(14), 2513; https://doi.org/10.3390/rs17142513 - 19 Jul 2025
Viewed by 380
Abstract
Meteorological satellites play a critical role in weather forecasting, climate monitoring, water resource management, and more. These satellites feature an array of radiative imaging bands, capturing dozens of spectral images that span from visible to infrared. However, the spatial resolution of these bands [...] Read more.
Meteorological satellites play a critical role in weather forecasting, climate monitoring, water resource management, and more. These satellites feature an array of radiative imaging bands, capturing dozens of spectral images that span from visible to infrared. However, the spatial resolution of these bands varies, with images at longer wavelengths typically exhibiting lower spatial resolutions, which limits the accuracy and reliability of subsequent applications. To alleviate this issue, we propose a channel–spatial attention-based network, named CSAN, designed to super-resolve all low-resolution (LR) bands to the available maximal high-resolution (HR) scale. The CSAN consists of an information fusion unit, a feature extraction module, and an image restoration unit. The information fusion unit adaptively fuses LR and HR images, effectively capturing inter-band spectral relationships and spatial details to enhance the input representation. The feature extraction module integrates channel and spatial attention into the residual network, enabling the extraction of informative spectral and spatial features from the fused inputs. Using these deep features, the image restoration unit reconstructs the missing spatial details in LR images. Extensive experiments demonstrate that the proposed network outperforms other state-of-the-art approaches quantitatively and visually. Full article
Show Figures

Figure 1

20 pages, 3982 KiB  
Article
Enhanced Rapid Mangrove Habitat Mapping Approach to Setting Protected Areas Using Satellite Indices and Deep Learning: A Case Study of the Solomon Islands
by Hyeon Kwon Ahn, Soohyun Kwon, Cholho Song and Chul-Hee Lim
Remote Sens. 2025, 17(14), 2512; https://doi.org/10.3390/rs17142512 - 18 Jul 2025
Viewed by 236
Abstract
Mangroves, as a key component of the blue-carbon ecosystem, have exceptional carbon sequestration capacity and are mainly distributed in tropical coastal regions. In the Solomon Islands, ongoing degradation of mangrove forests, primarily due to land conversion and timber exploitation, highlights an urgent need [...] Read more.
Mangroves, as a key component of the blue-carbon ecosystem, have exceptional carbon sequestration capacity and are mainly distributed in tropical coastal regions. In the Solomon Islands, ongoing degradation of mangrove forests, primarily due to land conversion and timber exploitation, highlights an urgent need for high-resolution spatial data to inform effective conservation strategies. The present study introduces an efficient and accurate methodology for mapping mangrove habitats and prioritizing protection areas utilizing open-source satellite imagery and datasets available through the Google Earth Engine platform in conjunction with a U-Net deep learning algorithm. The model demonstrates high performance, achieving an F1-score of 0.834 and an overall accuracy of 0.96, in identifying mangrove distributions. The total mangrove area in the Solomon Islands is estimated to be approximately 71,348.27 hectares, accounting for about 2.47% of the national territory. Furthermore, based on the mapped mangrove habitats, an optimized hotspot analysis is performed to identify regions characterized by high-density mangrove distribution. By incorporating spatial variables such as distance from roads and urban centers, along with mangrove area, this study proposes priority mangrove protection areas. These results underscore the potential for using openly accessible satellite data to enhance the precision of mangrove conservation strategies in data-limited settings. This approach can effectively support coastal resource management and contribute to broader climate change mitigation strategies. Full article
Show Figures

Figure 1

23 pages, 21927 KiB  
Article
Assessing the Potential of PlanetScope Imagery for Iron Oxide Detection in Antimony Exploration
by Douglas Santos, Joana Cardoso-Fernandes, Alexandre Lima and Ana Claúdia Teodoro
Remote Sens. 2025, 17(14), 2511; https://doi.org/10.3390/rs17142511 - 18 Jul 2025
Viewed by 584
Abstract
The increasing demand for critical raw materials, such as antimony—a semimetal with strategic relevance in fire-retardant applications, electronic components, and national security—has made the identification of European sources essential for the European Union’s strategic autonomy. Remote sensing offers a valuable tool for detecting [...] Read more.
The increasing demand for critical raw materials, such as antimony—a semimetal with strategic relevance in fire-retardant applications, electronic components, and national security—has made the identification of European sources essential for the European Union’s strategic autonomy. Remote sensing offers a valuable tool for detecting alteration minerals associated with subsurface gold and antimony deposits that reach the surface. However, the coarse spatial resolution of the most freely available satellite data remains a limiting factor. The PlanetScope satellite constellation presents a promising low-cost alternative for the academic community, providing 3 m spatial resolution and eight spectral bands. In this study, we evaluated PlanetScope’s capacity to detect Fe3+-bearing iron oxides—key indicators of hydrothermal alteration—by applying targeted band ratios (BRs) in northern Portugal. A comparative analysis was conducted to validate its performance using established BRs from Sentinel-2, ASTER, and Landsat 9. The results were assessed through relative comparison methods, enabling both quantitative and qualitative evaluation of the spectral similarity among sensors. Spatial patterns were analyzed, and points of interest were identified and subsequently validated through fieldwork. Our findings demonstrate that PlanetScope is a viable option for mineral exploration applications, capable of detecting iron oxide anomalies associated with alteration zones while offering finer spatial detail than most freely accessible satellites. Full article
(This article belongs to the Special Issue Advances in Remote Sensing Used in Mineral Exploration)
Show Figures

Figure 1

19 pages, 3374 KiB  
Article
The Influence of Viewing Geometry on Hyperspectral-Based Soil Property Retrieval
by Yucheng Gao, Lixia Ma, Zhongqi Zhang, Xianzhang Pan, Ziran Yuan, Changkun Wang and Dongsheng Yu
Remote Sens. 2025, 17(14), 2510; https://doi.org/10.3390/rs17142510 - 18 Jul 2025
Viewed by 190
Abstract
Hyperspectral technology has been widely applied to the retrieval of soil properties, such as soil organic matter (SOM) and particle size distribution (PSD). However, most previous studies have focused on hyperspectral data acquired from the nadir direction, and the influence of viewing geometry [...] Read more.
Hyperspectral technology has been widely applied to the retrieval of soil properties, such as soil organic matter (SOM) and particle size distribution (PSD). However, most previous studies have focused on hyperspectral data acquired from the nadir direction, and the influence of viewing geometry on hyperspectral-based soil property retrieval remains unclear. In this study, bidirectional reflectance factors (BRFs) were collected at 48 different viewing angles for 154 soil samples with varying SOM contents and PSDs. SOM and PSD were then retrieved using combinations of ten spectral preprocessing methods (raw reflectance, Savitzky–Golay filter (SG), first derivative (D1), second derivative (D2), standard normal variate (SNV), multiplicative scatter correction (MSC), SG + D1, SG + D2, SG + SNV, and SG + MSC), one sensitive wavelength selection method, and three retrieval algorithms (partial least squares regression (PLSR), support vector machine (SVM), and convolutional neural networks (CNNs)). The influence of viewing geometry on the selection of spectral preprocessing methods, retrieval algorithms, sensitive wavelengths, and retrieval accuracy was systematically analyzed. The results showed that soil BRFs are influenced by both soil properties and viewing angles. The viewing geometry had limited effects on the choice of preprocessing method and retrieval algorithm. Among the preprocessing methods, D1, SG + D1, and SG + D2 outperformed the others, while PLSR achieved a higher accuracy than SVM and CNN when retrieving soil properties. The selected sensitive wavelengths for both SOM and PSD varied slightly with viewing angle and were mainly located in the near-infrared region when using BRFs from multiple viewing angles. Compared with single-angle data, multi-angle BRFs significantly improved retrieval performance, with the R2 increasing by 11% and 15%, and RMSE decreasing by 16% and 30% for SOM and PSD, respectively. The optimal viewing zenith angle ranged from 10° to 20° for SOM and around 40° for PSD. Additionally, backward viewing directions were more favorable than forward directions, with the optimal viewing azimuth angles being 0° for SOM and 90° for PSD. These findings provide useful insights for improving the accuracy of soil property retrieval using multi-angle hyperspectral observations. Full article
(This article belongs to the Section Remote Sensing in Agriculture and Vegetation)
Show Figures

Figure 1

23 pages, 2695 KiB  
Article
Estimation of Subtropical Forest Aboveground Biomass Using Active and Passive Sentinel Data with Canopy Height
by Yi Wu, Yu Chen, Chunhong Tian, Ting Yun and Mingyang Li
Remote Sens. 2025, 17(14), 2509; https://doi.org/10.3390/rs17142509 - 18 Jul 2025
Viewed by 311
Abstract
Forest biomass is closely related to carbon sequestration capacity and can reflect the level of forest management. This study utilizes four machine learning algorithms, namely Multivariate Stepwise Regression (MSR), K-Nearest Neighbors (k-NN), Artificial Neural Network (ANN), and Random Forest (RF), to estimate forest [...] Read more.
Forest biomass is closely related to carbon sequestration capacity and can reflect the level of forest management. This study utilizes four machine learning algorithms, namely Multivariate Stepwise Regression (MSR), K-Nearest Neighbors (k-NN), Artificial Neural Network (ANN), and Random Forest (RF), to estimate forest aboveground biomass (AGB) in Chenzhou City, Hunan Province, China. In addition, a canopy height model, constructed from a digital surface model (DSM) derived from Sentinel-1 Interferometric Synthetic Aperture Radar (InSAR) and an ICESat-2-corrected SRTM DEM, is incorporated to quantify its impact on the accuracy of AGB estimation. The results indicate the following: (1) The incorporation of multi-source remote sensing data significantly improves the accuracy of AGB estimation, among which the RF model performs the best (R2 = 0.69, RMSE = 24.26 t·ha−1) compared with the single-source model. (2) The canopy height model (CHM) obtained from InSAR-LiDAR effectively alleviates the signal saturation effect of optical and SAR data in high-biomass areas (>200 t·ha−1). When FCH is added to the RF model combined with multi-source remote sensing data, the R2 of the AGB estimation model is improved to 0.74. (3) In 2018, AGB in Chenzhou City shows clear spatial heterogeneity, with a mean of 51.87 t·ha−1. Biomass increases from the western hilly part (32.15–68.43 t·ha−1) to the eastern mountainous area (89.72–256.41 t·ha−1), peaking in Dongjiang Lake National Forest Park (256.41 t·ha−1). This study proposes a comprehensive feature integration framework that combines red-edge spectral indices for capturing vegetation physiological status, SAR-derived texture metrics for assessing canopy structural heterogeneity, and canopy height metrics to characterize forest three-dimensional structure. This integrated approach enables the robust and accurate monitoring of carbon storage in subtropical forests. Full article
(This article belongs to the Collection Feature Paper Special Issue on Forest Remote Sensing)
Show Figures

Figure 1

20 pages, 47683 KiB  
Article
Multi-Faceted Adaptive Token Pruning for Efficient Remote Sensing Image Segmentation
by Chuge Zhang and Jian Yao
Remote Sens. 2025, 17(14), 2508; https://doi.org/10.3390/rs17142508 - 18 Jul 2025
Viewed by 343
Abstract
Global context information is essential for semantic segmentation of remote sensing (RS) images. Due to their remarkable capability to capture global context information and model long-range dependencies, vision transformers have demonstrated great performance on semantic segmentation. However, the high computational complexity of vision [...] Read more.
Global context information is essential for semantic segmentation of remote sensing (RS) images. Due to their remarkable capability to capture global context information and model long-range dependencies, vision transformers have demonstrated great performance on semantic segmentation. However, the high computational complexity of vision transformers impedes their broad application in resource-constrained environments for RS image segmentation. To address this challenge, we propose multi-faceted adaptive token pruning (MATP) to reduce computational cost while maintaining relatively high accuracy. MATP is designed to prune well-learned tokens which do not have a close relation to other tokens. To quantify these two metrics, MATP employs multi-faceted scores: entropy, to evaluate the learning progression of tokens; and attention weight, to assess token correlations. Specially, MATP utilizes adaptive criteria for each score that are automatically adjusted based on specific input features. A token is pruned only when both criteria are satisfied. Overall, MATP facilitates the utilization of vision transformers in resource-constrained environments. Experiments conducted on three widely used datasets reveal that MATP reduces the computation cost about 67–70% with about 3–6% accuracy degradation, achieving a superior trade-off between accuracy and computational cost compared to the state of the art. Full article
Show Figures

Figure 1

21 pages, 8601 KiB  
Article
Impact of Cloud Microphysics Initialization Using Satellite and Radar Data on CMA-MESO Forecasts
by Lijuan Zhu, Yuan Jiang, Jiandong Gong and Dan Wang
Remote Sens. 2025, 17(14), 2507; https://doi.org/10.3390/rs17142507 - 18 Jul 2025
Viewed by 233
Abstract
High-resolution numerical weather prediction requires accurate cloud microphysical initial conditions to enhance forecasting capabilities for high-impact severe weather events such as convective storms. This study integrated Fengyun-2 (FY-2) geostationary satellite data (equivalent blackbody temperature and total cloud cover) and next-generation 3D weather radar [...] Read more.
High-resolution numerical weather prediction requires accurate cloud microphysical initial conditions to enhance forecasting capabilities for high-impact severe weather events such as convective storms. This study integrated Fengyun-2 (FY-2) geostationary satellite data (equivalent blackbody temperature and total cloud cover) and next-generation 3D weather radar reflectivity from the China Meteorological Administration (CMA) to construct cloud microphysical initial fields and evaluate their impact on the CMA-MESO 3 km regional model. An analysis of the catastrophic rainfall event in Henan on 20 July 2021, and a 92-day continuous experiment (May–July 2024) revealed that assimilating cloud microphysical variables significantly improved precipitation forecasting: the equitable threat scores (ETSs) for 1 h forecasts of light, moderate, and heavy rain increased from 0.083, 0.043, and 0.007 to 0.41, 0.36, and 0.217, respectively, with average hourly ETS improvements of 21–71% for 2–6 h forecasts and increases in ETSs for light, moderate, and heavy rain of 7.5%, 9.8%, and 24.9% at 7–12 h, with limited improvement beyond 12 h. Furthermore, the root mean square error (RMSE) of the 2 m temperature forecasts decreased across all 1–72 h lead times, with a 4.2% reduction during the 1–9 h period, while the geopotential height RMSE reductions reached 5.8%, 3.3%, and 2.0% at 24, 48, and 72 h, respectively. Additionally, synchronized enhancements were observed in 10 m wind prediction accuracy. These findings underscore the critical role of cloud microphysical initialization in advancing mesoscale numerical weather prediction systems. Full article
Show Figures

Figure 1

Previous Issue
Next Issue
Back to TopTop