Next Issue
Volume 9, August
Previous Issue
Volume 9, June
 
 
remotesensing-logo

Journal Browser

Journal Browser

Remote Sens., Volume 9, Issue 7 (July 2017) – 125 articles

Cover Story (view full-size image): 
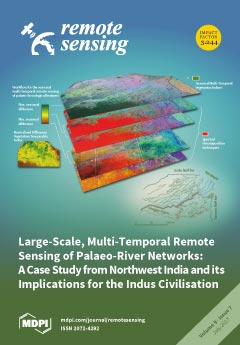
It has long been assumed that South Asia's ancient Indus Civilization was riverine, but many presumed watercourses are no longer visible. For the last 30 years, satellite imagery has been used to map the hydrology of the extensive plains that Indus populations occupied. This paper adopts a seasonal multi-temporal approach to the detection of palaeorivers over this large area (more than 80,000 km2). Twenty-eight years of Landsat 5 data—a total of 1711 multispectral images and 1254 8-day vegetation composites—have been bulk processed using Google Earth Engine© Code Editor and cloud computing infrastructure. The resulting data have allowed the mapping of 8000 km of relic water courses in the Sutlej-Yamuna interfluve, a core area for this Bronze Age civilization. The research also provided insights into the environmental conditions in which Indus urbanism developed and ultimately declined. View the paper
  • Issues are regarded as officially published after their release is announced to the table of contents alert mailing list.
  • You may sign up for e-mail alerts to receive table of contents of newly released issues.
  • PDF is the official format for papers published in both, html and pdf forms. To view the papers in pdf format, click on the "PDF Full-text" link, and use the free Adobe Reader to open them.
Order results
Result details
Section
Select all
Export citation of selected articles as:

Research

Jump to: Other

22 pages, 7799 KiB  
Article
Satellite Observations of El Niño Impacts on Eurasian Spring Vegetation Greenness during the Period 1982–2015
by Jing Li 1,2,3, Ke Fan 1,3,4,* and Liming Zhou 2
1 Nansen-Zhu International Research Centre, Institute of Atmospheric Physics, Chinese Academy of Sciences, Beijing 100029, China
2 Department of Atmospheric and Environmental Sciences, University at Albany, State University of New York (SUNY), Albany, NY 12222, USA
3 University of Chinese Academy of Sciences, Beijing 100049, China
4 Collaborative Innovation Center on Forecast and Evaluation of Meteorological Disasters, Nanjing University of Information Science & Technology, Nanjing 210044, China
Remote Sens. 2017, 9(7), 628; https://doi.org/10.3390/rs9070628 - 22 Jun 2017
Cited by 41 | Viewed by 7277
Abstract
As Earth’s most influential naturally-recurring sea and atmospheric oscillation, ENSO results in widespread changes in the climate system not only over much of the tropics and subtropics, but also in high latitudes via atmospheric teleconnections. In the present study, the linkages between springtime [...] Read more.
As Earth’s most influential naturally-recurring sea and atmospheric oscillation, ENSO results in widespread changes in the climate system not only over much of the tropics and subtropics, but also in high latitudes via atmospheric teleconnections. In the present study, the linkages between springtime vegetation greenness over Eurasia and El Niño are investigated based on two long-term normalized difference vegetation index (NDVI) datasets from 1982 to 2015, and possible physical mechanisms for the teleconnections are explored. Results from the Empirical Orthogonal Function (EOF) and Singular Value Decomposition (SVD) analyses consistently suggest that the spatial patterns of NDVI, with “negative-positive-negative” values, have closer connections to El Niño. In particular, East Russia is identified as the key region with the strongest negative influences from Eastern Pacific (EP) El Niño on spring vegetation growth. During EP El Niño years, suppressed convection over the Bay of Bengal (BoB) may excite a Rossby wave from the BoB to the Far East. East Russia is located in the west of a large cyclone anomaly accompanied by the strong North and Northwesterly wind anomalies and the transport of cold air from Siberia. As a result, surface air temperature decreases significantly over East Russia and thus inhibits the vegetation growth during spring in the EP El Niño years. Full article
(This article belongs to the Special Issue Remote Sensing of Land-Atmosphere Interactions)
Show Figures

Graphical abstract

23 pages, 5295 KiB  
Article
Accuracy Improvements in the Orientation of ALOS PRISM Images Using IOP Estimation and UCL Kepler Platform Model
by Tiago L. Rodrigues 1,*, Edson Mitishita 1, Luiz Ferreira 1 and Antonio M. G. Tommaselli 2
1 Department of Geomatics, Federal University of Paraná (UFPR), Curitiba 81531-990, Brazil
2 Department of Cartography, São Paulo State University (UNESP), Presidente Prudente 19060-900, Brazil
Remote Sens. 2017, 9(7), 634; https://doi.org/10.3390/rs9070634 - 1 Jul 2017
Cited by 2 | Viewed by 4025
Abstract
This paper presents a study that was conducted to determine the orientation of ALOS (Advanced Land Observing Satellite) PRISM (Panchromatic Remote-sensing Instrument for Stereo Mapping) triplet images, considering the estimation of interior orientation parameters (IOP) of the cameras and using the collinearity equations [...] Read more.
This paper presents a study that was conducted to determine the orientation of ALOS (Advanced Land Observing Satellite) PRISM (Panchromatic Remote-sensing Instrument for Stereo Mapping) triplet images, considering the estimation of interior orientation parameters (IOP) of the cameras and using the collinearity equations with the UCL (University College of London) Kepler platform model, which was adapted to use coordinates referenced to the Terrestrial Reference System ITRF97. The results of the experiments showed that the accuracies of 3D coordinates calculated using 3D photogrammetric intersection increased when the IOP were also estimated. The vertical accuracy was significantly better than the horizontal accuracy. The usability of the estimated IOP was tested to perform the bundle block adjustments of another neighbouring PRISM image triplet. The results in terms of 3D photogrammetric intersection were satisfactory and were close to those obtained in the IOP estimation experiment. Full article
Show Figures

Figure 1

28 pages, 7826 KiB  
Article
Landsat-Based Trend Analysis of Lake Dynamics across Northern Permafrost Regions
by Ingmar Nitze 1,2,*, Guido Grosse 1,3, Benjamin M. Jones 4, Christopher D. Arp 5, Mathias Ulrich 6, Alexander Fedorov 7,8 and Alexandra Veremeeva 9
1 Alfred Wegener Institute Helmholtz Centre for Polar and Marine Research, 14473 Potsdam, Germany
2 Institute of Geography, University of Potsdam, 14469 Potsdam, Germany
3 Institute of Earth and Environmental Sciences, University of Potsdam, 14469 Potsdam, Germany
4 U.S. Geological Survey, Alaska Science Center, Anchorage, AK 99508, USA
5 Water and Environmental Research Center, University of Alaska Fairbanks, Fairbanks, AK 99775, USA
6 Institute for Geography, Leipzig University, 04103 Leipzig, Germany
7 Melnikov Permafrost Institute, 677010 Yakutsk, Russia
8 North-Eastern Federal University, 677007 Yakutsk, Russia
9 Institute of Physicochemical and Biological Problems in Soil Science, Russian Academy of Sciences, 142290 Pushchino, Russia
Remote Sens. 2017, 9(7), 640; https://doi.org/10.3390/rs9070640 - 27 Jun 2017
Cited by 130 | Viewed by 16581
Abstract
Lakes are a ubiquitous landscape feature in northern permafrost regions. They have a strong impact on carbon, energy and water fluxes and can be quite responsive to climate change. The monitoring of lake change in northern high latitudes, at a sufficiently accurate spatial [...] Read more.
Lakes are a ubiquitous landscape feature in northern permafrost regions. They have a strong impact on carbon, energy and water fluxes and can be quite responsive to climate change. The monitoring of lake change in northern high latitudes, at a sufficiently accurate spatial and temporal resolution, is crucial for understanding the underlying processes driving lake change. To date, lake change studies in permafrost regions were based on a variety of different sources, image acquisition periods and single snapshots, and localized analysis, which hinders the comparison of different regions. Here, we present a methodology based on machine-learning based classification of robust trends of multi-spectral indices of Landsat data (TM, ETM+, OLI) and object-based lake detection, to analyze and compare the individual, local and regional lake dynamics of four different study sites (Alaska North Slope, Western Alaska, Central Yakutia, Kolyma Lowland) in the northern permafrost zone from 1999 to 2014. Regional patterns of lake area change on the Alaska North Slope (−0.69%), Western Alaska (−2.82%), and Kolyma Lowland (−0.51%) largely include increases due to thermokarst lake expansion, but more dominant lake area losses due to catastrophic lake drainage events. In contrast, Central Yakutia showed a remarkable increase in lake area of 48.48%, likely resulting from warmer and wetter climate conditions over the latter half of the study period. Within all study regions, variability in lake dynamics was associated with differences in permafrost characteristics, landscape position (i.e., upland vs. lowland), and surface geology. With the global availability of Landsat data and a consistent methodology for processing the input data derived from robust trends of multi-spectral indices, we demonstrate a transferability, scalability and consistency of lake change analysis within the northern permafrost region. Full article
(This article belongs to the Special Issue Remote Sensing of Arctic Tundra)
Show Figures

Graphical abstract

27 pages, 8790 KiB  
Article
A Satellite-Derived Climatological Analysis of Urban Heat Island over Shanghai during 2000–2013
by Weijiao Huang 1,2,3, Jun Li 4, Qiaoying Guo 3,5, Lamin R. Mansaray 2,5,6, Xinxing Li 2,3,5 and Jingfeng Huang 2,3,5,*
1 Department of Land Management, Zhejiang University, Hangzhou 310058, China
2 Key Laboratory of Agricultural Remote Sensing and Information Systems, Hangzhou 310058, China
3 Key Laboratory of Environment Remediation and Ecological Health, Ministry of Education, Zhejiang University, Hangzhou 310058, China
4 Shanghai Climate Center, Shanghai Meteorological Bureau, Shanghai 200030, China
5 Institute of Applied Remote Sensing and Information Technology, College of Environmental and Resource Sciences, Zhejiang University, Hangzhou 310058, China
6 Department of Agro-Meteorology and Geo-Informatics, Magbosi Land, Water and Environment Research Center (MLWERC), Sierra Leone Agricultural Research Institute (SLARI), Tower Hill, Freetown PMB 1313, Sierra Leone
Remote Sens. 2017, 9(7), 641; https://doi.org/10.3390/rs9070641 - 22 Jun 2017
Cited by 35 | Viewed by 6309
Abstract
The urban heat island is generally conducted based on ground observations of air temperature and remotely sensing of land surface temperature (LST). Satellite remotely sensed LST has the advantages of global coverage and consistent periodicity, which overcomes the weakness of ground observations related [...] Read more.
The urban heat island is generally conducted based on ground observations of air temperature and remotely sensing of land surface temperature (LST). Satellite remotely sensed LST has the advantages of global coverage and consistent periodicity, which overcomes the weakness of ground observations related to sparse distributions and costs. For human related studies and urban climatology, canopy layer urban heat island (CUHI) based on air temperatures is extremely important. This study has employed remote sensing methodology to produce monthly CUHI climatology maps during the period 2000–2013, revealing the spatiotemporal characteristics of daytime and nighttime CUHI during this period of rapid urbanization in Shanghai. Using stepwise linear regression, daytime and nighttime air temperatures at the four overpass times of Terra/Aqua were estimated based on time series of Terra/Aqua-MODIS LST and other auxiliary variables including enhanced vegetation index, normalized difference water index, solar zenith angle and distance to coast. The validation results indicate that the models produced an accuracy of 1.6–2.6 °C RMSE for the four overpass times of Terra/Aqua. The models based on Terra LST showed higher accuracy than those based on Aqua LST, and nighttime air temperature estimation had higher accuracy than daytime. The seasonal analysis shows daytime CUHI is strongest in summer and weakest in winter, while nighttime CUHI is weakest in summer and strongest in autumn. The annual mean daytime CUHI during 2000–2013 is 1.0 and 2.2 °C for Terra and Aqua overpass, respectively. The annual mean nighttime CUHI is about 1.0 °C for both Terra and Aqua overpass. The resultant CUHI climatology maps provide a spatiotemporal quantification of CUHI with emphasis on temperature gradients. This study has provided information of relevance to urban planners and environmental managers for assessing and monitoring urban thermal environments which are constantly being altered by natural and anthropogenic influences. Full article
Show Figures

Graphical abstract

21 pages, 8393 KiB  
Article
The DOM Generation and Precise Radiometric Calibration of a UAV-Mounted Miniature Snapshot Hyperspectral Imager
by Guijun Yang 1,2,†, Changchun Li 3,*, Yanjie Wang 1,3,*,†, Huanhuan Yuan 3, Haikuan Feng 1,2, Bo Xu 1,2 and Xiaodong Yang 1
1 Key Laboratory of Quantitative Remote Sensing in Agriculture, Ministry of Agriculture, Beijing Research Center for Information Technology in Agriculture, Beijing 100097, China
2 National Engineering Research Center for Information Technology in Agriculture, Beijing 100097, China
3 School of Surveying and Land Information Engineering, Henan Polytechnic University, Jiaozuo 454000, China
These authors contributed equally to this work and should be considered co-first authors.
Remote Sens. 2017, 9(7), 642; https://doi.org/10.3390/rs9070642 - 22 Jun 2017
Cited by 86 | Viewed by 9349
Abstract
Hyperspectral remote sensing is used in precision agriculture to remotely and quickly acquire crop phenotype information. This paper describes the generation of a digital orthophoto map (DOM) and radiometric calibration for images taken by a miniaturized snapshot hyperspectral camera mounted on a lightweight [...] Read more.
Hyperspectral remote sensing is used in precision agriculture to remotely and quickly acquire crop phenotype information. This paper describes the generation of a digital orthophoto map (DOM) and radiometric calibration for images taken by a miniaturized snapshot hyperspectral camera mounted on a lightweight unmanned aerial vehicle (UAV). The snapshot camera is a relatively new type of hyperspectral sensor that can acquire an image cube with one spectral and two spatial dimensions at one exposure. The images acquired by the hyperspectral snapshot camera need to be mosaicked together to produce a DOM and radiometrically calibrated before analysis. However, the spatial resolution of hyperspectral cubes is too low to mosaic the images together. Furthermore, there are no systematic radiometric calibration methods or procedures for snapshot hyperspectral images acquired from low-altitude carrier platforms. In this study, we obtained hyperspectral imagery using a snapshot hyperspectral sensor mounted on a UAV. We quantitatively evaluated the radiometric response linearity (RRL) and radiometric response variation (RRV) and proposed a method to correct the RRV effect. We then introduced a method to interpolate position and orientation system (POS) information and generate a DOM with low spatial resolution and a digital elevation model (DEM) using a 3D mesh model built from panchromatic images with high spatial resolution. The relative horizontal geometric precision of the DOM was validated by comparison with a DOM generated from a digital RGB camera. A surface crop model (CSM) was produced from the DEM, and crop height for 48 sampling plots was extracted and compared with the corresponding field-measured crop height to verify the relative precision of the DEM. Finally, we applied two absolute radiometric calibration methods to the generated DOM and verified their accuracy via comparison with spectra measured with an ASD Field Spec Pro spectrometer (Analytical Spectral Devices, Boulder, CO, USA). The DOM had high relative horizontal accuracy, and compared with the digital camera-derived DOM, spatial differences were below 0.05 m (RMSE = 0.035). The determination coefficient for a regression between DEM-derived and field-measured crop height was 0.680. The radiometric precision was 5% for bands between 500 and 945 nm, and the reflectance curve in the infrared spectral region did not decrease as in previous research. The pixel and data sizes for the DOM corresponding to a field area of approximately 85 m × 34 m were small (0.67 m and approximately 13.1 megabytes, respectively), which is convenient for data transmission, preprocessing and analysis. The proposed method for radiometric calibration and DOM generation from hyperspectral cubes can be used to yield hyperspectral imagery products for various applications, particularly precision agriculture. Full article
(This article belongs to the Special Issue Earth Observations for Precision Farming in China (EO4PFiC))
Show Figures

Graphical abstract

20 pages, 1506 KiB  
Article
On-Ground Retracking to Correct Distorted Waveform in Spaceborne Global Navigation Satellite System-Reflectometry
by Feng Wang 1, Dongkai Yang 1,*, Weiqiang Li 2 and Wei Yang 1
1 School of Electronic and Information Engineering, Beihang University, Beijing 100191, China
2 Earth Observation Researth Group, Institu d’Estudis Espacials de Catalunya (ICE-CSIC/IEEC), 08191 Barcelona, Spain
Remote Sens. 2017, 9(7), 643; https://doi.org/10.3390/rs9070643 - 22 Jun 2017
Cited by 7 | Viewed by 4527
Abstract
Spaceborne Global Navigation Satellite System-Reflectometry (GNSS-R) has been the research focus of Earth observation because of its unique advantages; however, there are still many challenges to be resolved. The reduction of the impact of the satellite motion on the GNSS-R waveform is the [...] Read more.
Spaceborne Global Navigation Satellite System-Reflectometry (GNSS-R) has been the research focus of Earth observation because of its unique advantages; however, there are still many challenges to be resolved. The reduction of the impact of the satellite motion on the GNSS-R waveform is the one of key technologies for spaceborne GNSS-R. The proposed delay retracking methods in existing literatures require too many instrument resources and too much priori information to refresh correlation window on each coherent integration time period. This paper aims to propose an on-ground alternative in which less frequency tracking refresh on board is needed. The model of dynamic delay waveform, which is expressed as the convolution of the pure waveform and the point spread function, are described. Based on this, the new methodology, which utilizes the least squares fitting to make the residual error between the dynamic model and measured waveform minimum, is employed to reconstruct the pure waveform. The validity of proposed method is verified using UK-DMC, UK-TDS-1 and simulated data. Moreover, the performances of sea surface height and wind speed retrieval using retracked and non-retracked waveforms are compared. The results show that (1) the MSEs between aligned and retracked waveform reduce to 0.026 and 0.044 from 0.110 and 0.156 between aligned and non-retracked waveform with the TRP of 1 s and 3 s for UK-DMC data, and for UK-TDS-1 data, the MSEs decrease from 161.02 and 227.34 to 70.10 and 61.80; (2) the standard deviation of sea surface height using retracked waveform is lower 5 times than the one using non-retracked waveform; (3) the retracked waveform could lead to a better measurement performance in wind speed retrieval. Finally, the relationship between the performance of retracking and Signal-to-Noise Ratio (SNR) is analyzed. The results show that when the SNR of the waveform is lower than 3 dB, the retrieval accuracies rapidly become worse. Full article
(This article belongs to the Section Ocean Remote Sensing)
Show Figures

Graphical abstract

18 pages, 9749 KiB  
Article
SNR (Signal-To-Noise Ratio) Impact on Water Constituent Retrieval from Simulated Images of Optically Complex Amazon Lakes
by Daniel S. F. Jorge *, Claudio C. F. Barbosa, Lino A. S. De Carvalho, Adriana G. Affonso, Felipe De L. Lobo and Evlyn M. L. De M. Novo
National Institute for Space Research, Avenida dos Astronautas, 1758, São José dos Campos, SP 12227-010, Brazil
Remote Sens. 2017, 9(7), 644; https://doi.org/10.3390/rs9070644 - 22 Jun 2017
Cited by 49 | Viewed by 11079
Abstract
Uncertainties in the estimates of water constituents are among the main issues concerning the orbital remote sensing of inland waters. Those uncertainties result from sensor design, atmosphere correction, model equations, and in situ conditions (cloud cover, lake size/shape, and adjacency effects). In the [...] Read more.
Uncertainties in the estimates of water constituents are among the main issues concerning the orbital remote sensing of inland waters. Those uncertainties result from sensor design, atmosphere correction, model equations, and in situ conditions (cloud cover, lake size/shape, and adjacency effects). In the Amazon floodplain lakes, such uncertainties are amplified due to their seasonal dynamic. Therefore, it is imperative to understand the suitability of a sensor to cope with them and assess their impact on the algorithms for the retrieval of constituents. The objective of this paper is to assess the impact of the SNR on the Chl-a and TSS algorithms in four lakes located at Mamirauá Sustainable Development Reserve (Amazonia, Brazil). Two data sets were simulated (noisy and noiseless spectra) based on in situ measurements and on sensor design (MSI/Sentinel-2, OLCI/Sentinel-3, and OLI/Landsat 8). The dataset was tested using three and four algorithms for TSS and Chl-a, respectively. The results showed that the impact of the SNR on each algorithm displayed similar patterns for both constituents. For additive and single band algorithms, the error amplitude is constant for the entire concentration range. However, for multiplicative algorithms, the error changes according to the model equation and the Rrs magnitude. Lastly, for the exponential algorithm, the retrieval amplitude is higher for a low concentration. The OLCI sensor has the best retrieval performance (error of up to 2 μg/L for Chl-a and 3 mg/L for TSS). For MSI, the error of the additive and single band algorithms for TSS and Chl-a are low (up to 5 mg/L and 1 μg/L, respectively); but for the multiplicative algorithm, the errors were above 10 μg/L. The OLI simulation resulted in errors below 3 mg/L for TSS. However, the number and position of OLI bands restrict Chl-a retrieval. Sensor and algorithm selection need a comprehensive analysis of key factors such as sensor design, in situ conditions, water brightness (Rrs), and model equations before being applied for inland water studies. Full article
(This article belongs to the Special Issue Water Optics and Water Colour Remote Sensing)
Show Figures

Graphical abstract

18 pages, 24680 KiB  
Article
Location- and Time-Specific Hydrological Simulations with Multi-Resolution Remote Sensing Data in Urban Areas
by Charlotte Wirion *,†, Willy Bauwens and Boud Verbeiren
1 Department of Hydrology and Hydraulic engineering, Vrije Universiteit Brussel (VUB), 1050 Ixelles, Belgium
Current address: Pleinlaan 2, 1050 Brussels, Belgium.
Remote Sens. 2017, 9(7), 645; https://doi.org/10.3390/rs9070645 - 22 Jun 2017
Cited by 13 | Viewed by 5490
Abstract
A major challenge in hydrologic modeling remains the mapping of vegetation dynamics in an urban landscape. The impact of vegetation on interception storage varies over time and needs to be quantified in order to enable proper management of water resources in urban areas. [...] Read more.
A major challenge in hydrologic modeling remains the mapping of vegetation dynamics in an urban landscape. The impact of vegetation on interception storage varies over time and needs to be quantified in order to enable proper management of water resources in urban areas. However, the heterogeneity and complexity of the urban landscape makes it challenging to monitor urban vegetation. A more detailed spatial and temporal scale is needed. To characterize surface cover at a high spatial resolution, a hyperspectral APEX image (2 m) is used, while a time series of Proba-V images (daily, 100 m) allows a detailed characterization of the seasonal variation of urban greenness. For this study, we use and validate the leaf area index (LAI) maps derived from APEX and Proba-V data for a selected pixel in the Watermaelbeek catchment in Brussels (Belgium). The ground-truthing of the Proba-V pixels includes a detailed mapping of land cover characteristics and more specifically vegetation cover throughout the seasons. LAI values calculated based on the APEX image agree with the LAI values measured from the ground (n = 106, R 2 = 0.68). Further, the aggregated APEX pixels correlate with the Proba-V pixels ( R 2 = 0.79), and the Proba-V data can be used to monitor vegetation dynamics. As the seasonal LAI measurements correspond with the Proba-V dynamics, we conclude that Proba-V images allow the characterization of vegetation dynamics at a high spatial resolution in heterogeneous areas. We create a time series of LAI maps at a high resolution (2 m), which allows a location- and time-specific simulation of interception storage and thus contributes to managing water resources in urban areas. Full article
Show Figures

Graphical abstract

23 pages, 3477 KiB  
Article
Good Practices for Object-Based Accuracy Assessment
by Julien Radoux *,† and Patrick Bogaert
1 Earth and Life Institute, Université catholique de Louvain, 1340 Louvain-la-Neuve, Belgium
These authors contributed equally to this work.
Remote Sens. 2017, 9(7), 646; https://doi.org/10.3390/rs9070646 - 22 Jun 2017
Cited by 78 | Viewed by 10493
Abstract
Thematic accuracy assessment of a map is a necessary condition for the comparison of research results and the appropriate use of geographic data analysis. Good practices of accuracy assessment already exist, but Geographic Object-Based Image Analysis (GEOBIA) is based on a partition of [...] Read more.
Thematic accuracy assessment of a map is a necessary condition for the comparison of research results and the appropriate use of geographic data analysis. Good practices of accuracy assessment already exist, but Geographic Object-Based Image Analysis (GEOBIA) is based on a partition of the spatial area of interest into polygons, which leads to specific issues. In this study, additional guidelines for the validation of object-based maps are provided. These guidelines include recommendations about sampling design, response design and analysis, as well as the evaluation of structural and positional quality. Different types of GEOBIA applications are considered with their specific issues. In particular, accuracy assessment could either focus on the count of spatial entities or on the area of the map that is correctly classified. Two practical examples are given at the end of the manuscript. Full article
Show Figures

Graphical abstract

17 pages, 4439 KiB  
Article
Poppy Crop Height and Capsule Volume Estimation from a Single UAS Flight
by Faheem Iqbal *, Arko Lucieer, Karen Barry and Reuben Wells
School of Land and Food, University of Tasmania, Private Bag 76, Hobart, TAS 7001, Australia
Remote Sens. 2017, 9(7), 647; https://doi.org/10.3390/rs9070647 - 22 Jun 2017
Cited by 40 | Viewed by 9294
Abstract
The objective of this study was to estimate poppy plant height and capsule volume with remote sensing using an Unmanned Aircraft System (UAS). Data were obtained from field measurements and UAS flights over two poppy crops at Cambridge and Cressy in Tasmania. Imagery [...] Read more.
The objective of this study was to estimate poppy plant height and capsule volume with remote sensing using an Unmanned Aircraft System (UAS). Data were obtained from field measurements and UAS flights over two poppy crops at Cambridge and Cressy in Tasmania. Imagery acquired from the UAS was used to produce dense point clouds using structure from motion (SfM) and multi-view stereopsis (MVS) techniques. Dense point clouds were used to generate a digital surface model (DSM) and orthophoto mosaic. An RGB index was derived from the orthophoto to extract the bare ground spaces. This bare ground space mask was used to filter the points on the ground, and a digital terrain model (DTM) was interpolated from these points. Plant height values were estimated by subtracting the DSM and DTM to generate a Crop Height Model (CHM). UAS-derived plant height (PH) and field measured PH in Cambridge were strongly correlated with R2 values ranging from 0.93 to 0.97 for Transect 1 and Transect 2, respectively, while at Cressy results from a single flight provided R2 of 0.97. Therefore, the proposed method can be considered an important step towards crop surface model (CSM) generation from a single UAS flight in situations where a bare ground DTM is unavailable. High correlations were found between UAS-derived PH and poppy capsule volume (CV) at capsule formation stage (R2 0.74), with relative error of 19.62%. Results illustrate that plant height can be reliably estimated for poppy crops based on a single UAS flight and can be used to predict opium capsule volume at capsule formation stage. Full article
Show Figures

Graphical abstract

23 pages, 4400 KiB  
Article
On the Design of Radar Corner Reflectors for Deformation Monitoring in Multi-Frequency InSAR
by Matthew C. Garthwaite
Geodesy and Seismic Monitoring Branch, Geoscience Australia, GPO Box 378, Canberra ACT 2601, Australia
Remote Sens. 2017, 9(7), 648; https://doi.org/10.3390/rs9070648 - 25 Jun 2017
Cited by 76 | Viewed by 14219 | Correction
Abstract
Trihedral corner reflectors are being increasingly used as point targets in deformation monitoring studies using interferometric synthetic aperture radar (InSAR) techniques. The frequency and size dependence of the corner reflector Radar Cross Section (RCS) means that no single design can perform equally in [...] Read more.
Trihedral corner reflectors are being increasingly used as point targets in deformation monitoring studies using interferometric synthetic aperture radar (InSAR) techniques. The frequency and size dependence of the corner reflector Radar Cross Section (RCS) means that no single design can perform equally in all the possible imaging modes and radar frequencies available on the currently orbiting Synthetic Aperture Radar (SAR) satellites. Therefore, either a corner reflector design tailored to a specific data type or a compromise design for multiple data types is required. In this paper, I outline the practical and theoretical considerations that need to be made when designing appropriate radar targets, with a focus on supporting multi-frequency SAR data. These considerations are tested by performing field experiments on targets of different size using SAR images from TerraSAR-X, COSMO-SkyMed and RADARSAT-2. Phase noise behaviour in SAR images can be estimated by measuring the Signal-to-Clutter ratio (SCR) in individual SAR images. The measured SCR of a point target is dependent on its RCS performance and the influence of clutter near to the deployed target. The SCR is used as a metric to estimate the expected InSAR displacement error incurred by the design of each target and to validate these observations against theoretical expectations. I find that triangular trihedral corner reflectors as small as 1 m in dimension can achieve a displacement error magnitude of a tenth of a millimetre or less in medium-resolution X-band data. Much larger corner reflectors (2.5 m or greater) are required to achieve the same displacement error magnitude in medium-resolution C-band data. Compromise designs should aim to satisfy the requirements of the lowest SAR frequency to be used, providing that these targets will not saturate the sensor of the highest frequency to be used. Finally, accurate boresight alignment of the corner reflector can be critical to the overall target performance. Alignment accuracies better than 4° in azimuth and elevation will incur a minimal impact on the displacement error in X and C-band data. Full article
(This article belongs to the Special Issue Advances in SAR: Sensors, Methodologies, and Applications)
Show Figures

Graphical abstract

18 pages, 8263 KiB  
Article
Fluorescence Imaging Spectrometer (FLORIS) for ESA FLEX Mission
by Peter Coppo 1, Alessio Taiti 1, Lucia Pettinato 1, Michael Francois 2,*, Matteo Taccola 2 and Matthias Drusch 2
1 Leonardo, Via A. Einstein, 35, Campi Bisenzio, 50013 Florence, Italy
2 ESA ESTEC, Keplerlaan 1, P.O. Box 299, 2200 AG Noordwijk ZH, The Netherlands
Remote Sens. 2017, 9(7), 649; https://doi.org/10.3390/rs9070649 - 23 Jun 2017
Cited by 81 | Viewed by 11118
Abstract
The Fluorescence Explorer (FLEX) mission has been selected as ESA’s 8th Earth Explorer mission. The primary objectives of the mission are to provide global estimates of vegetation fluorescence, actual photosynthetic activity, and vegetation stress. FLEX will fly in tandem formation with Sentinel-3 providing [...] Read more.
The Fluorescence Explorer (FLEX) mission has been selected as ESA’s 8th Earth Explorer mission. The primary objectives of the mission are to provide global estimates of vegetation fluorescence, actual photosynthetic activity, and vegetation stress. FLEX will fly in tandem formation with Sentinel-3 providing ancillary data for atmospheric characterization and correction, vegetation related spectral indices, and land surface temperature. The purpose of this manuscript is to present its scientific payload, FLORIS, which is a push-broom hyperspectral imager, flying on a medium size platform. FLORIS will measure the vegetation fluorescence in the spectral range between 500 nm and 780 nm at medium spatial resolution (300 m) and over a swath of 150 km. It accommodates an imaging spectrometer with a very high spectral resolution (0.3 nm), to measure the fluorescence spectrum within two oxygen absorption bands (O2A and O2B), and a second spectrometer with lower spectral resolution to derive additional atmospheric and vegetation parameters. A compact opto-mechanical solution is the current instrument baseline. A polarization scrambler is placed in front of a common dioptric telescope serving both spectrometers to minimize the polarization sensitivity. The telescope images the ground scene onto a double slit assembly. The radiation is spectrally dispersed onto the focal planes of the grating spectrometers. Special attention has been given to the mitigation of stray-light which is a key factor to reach good accuracy of the fluorescence measurement. The absolute radiometric calibration is achieved by observing a dedicated Sun illuminated Lambertian diffuser, while the spectral calibration in flight is performed by means of vicarious techniques. The thermal stabilization is achieved by using two passive radiators looking directly to the cold space, counterbalanced by heaters in a closed loop system. The focal planes are based on custom developed CCDs. The opto-mechanical design is robust, stable vs. temperature and easy to align. The optical quality is very good as recently demonstrated by the latest tests of an elegant breadboard. The scientific data products comprise the Top Of Atmosphere (TOA) radiance measurements as well as fluorescence estimates and higher-level products related to the health status of the vegetation addressing a wide range of applications from agriculture to forestry and climate. Full article
Show Figures

Graphical abstract

23 pages, 18472 KiB  
Article
Suitability Assessment of Satellite-Derived Drought Indices for Mongolian Grassland
by Sheng Chang 1, Bingfang Wu 1,*, Nana Yan 1, Bulgan Davdai 2 and Elbegjargal Nasanbat 2
1 Key Laboratory of Digital Earth Science, Institute of Remote Sensing and Digital Earth(RADI), Chinese Academy of Sciences, Olympic Village Science Park, W. Beichen Road, Beijing 100101, China
2 National Remote Sensing Center, Information and Research Institute of Meteorology, Hydrology and Environment (IRIMHE), Ulaanbaatar 15160, Mongolia
Remote Sens. 2017, 9(7), 650; https://doi.org/10.3390/rs9070650 - 26 Jun 2017
Cited by 41 | Viewed by 7901
Abstract
In Mongolia, drought is a major natural disaster that can influence and devastate large regions, reduce livestock production, cause economic damage, and accelerate desertification in association with destructive human activities. The objective of this article is to determine the optimal satellite-derived drought indices [...] Read more.
In Mongolia, drought is a major natural disaster that can influence and devastate large regions, reduce livestock production, cause economic damage, and accelerate desertification in association with destructive human activities. The objective of this article is to determine the optimal satellite-derived drought indices for accurate and real-time expression of grassland drought in Mongolia. Firstly, an adaptability analysis was performed by comparing nine remote sensing-derived drought indices with reference indicators obtained from field observations using several methods (correlation, consistency percentage (CP), and time-space analysis). The reference information included environmental data, vegetation growth status, and region drought-affected (RDA) information at diverse scales (pixel, county, and region) for three types of land cover (forest steppe, steppe, and desert steppe). Second, a meteorological index (PED), a normalized biomass (NorBio) reference indicator, and the RDA-based drought CP method were adopted for describing Mongolian drought. Our results show that in forest steppe regions the normalized difference water index (NDWI) is most sensitive to NorBio (maximum correlation coefficient (MAX_R): up to 0.92) and RDA (maximum CP is 87%), and is most consistent with RDA spatial distribution. The vegetation health index (VHI) and temperature condition index (TCI) are most correlated with the PED index (MAX_R: 0.75) and soil moisture (MAX_R: 0.58), respectively. In steppe regions, the NDWI is most closely related to soil moisture (MAX_R: 0.69) and the VHI is most related to the PED (MAX_R: 0.76), NorBio (MCC: 0.95), and RDA data (maximum CP is 89%), exhibiting the most consistency with RDA spatial distribution. In desert steppe areas, the vegetation condition index (VCI) correlates best with NorBio (MAX_R: 0.92), soil moisture (MAX_R: 0.61), and RDA spatial distribution, while TCI correlates best with the PED (MAX_R: 0.75) and the RDA data (maximum CP is 79%). The VHI is a combination of constructed VCI and TCI, and can be used instead of them. Finally, the mode method was adopted to identify appropriate drought indices. The best two indices (VHI and NDWI) can be utilized to develop a combination drought model for accurately monitoring and quantifying drought in the future. Additionally, the new framework can be adopted to investigate and analyze the suitability of satellite-derived drought indices and determine the most appropriate index/indices for other countries or areas. Full article
(This article belongs to the Special Issue Earth Observations for a Better Future Earth)
Show Figures

Graphical abstract

19 pages, 3025 KiB  
Article
Circular Regression Applied to GNSS-R Phase Altimetry
by Jean-Christophe Kucwaj *, Serge Reboul *, Georges Stienne *, Jean-Bernard Choquel and Mohammed Benjelloun
Laboratoire d’Informatique, Signal et Image de la Côte d’Opale (LISIC, EA 4491), Université du Littoral Côte d’Opale (ULCO), F-62228 Calais, France
Remote Sens. 2017, 9(7), 651; https://doi.org/10.3390/rs9070651 - 23 Jun 2017
Cited by 19 | Viewed by 6183
Abstract
This article is dedicated to the design of a linear-circular regression technique and to its application to ground-based GNSS-Reflectometry (GNSS-R) altimetry. The altimetric estimation is based on the observation of the phase delay between a GNSS signal sensed directly and after a reflection [...] Read more.
This article is dedicated to the design of a linear-circular regression technique and to its application to ground-based GNSS-Reflectometry (GNSS-R) altimetry. The altimetric estimation is based on the observation of the phase delay between a GNSS signal sensed directly and after a reflection off of the Earth’s surface. This delay evolves linearly with the sine of the emitting satellite elevation, with a slope proportional to the height between the reflecting surface and the receiving antenna. However, GNSS-R phase delay observations are angular and affected by a noise assumed to follow the von Mises distribution. In order to estimate the phase delay slope, a linear-circular regression estimator is thus defined in the maximum likelihood sense. The proposed estimator is able to fuse phase observations obtained from several satellite signals. Moreover, unlike the usual unwrapping approach, the proposed estimator allows the sea-surface height to be estimated from datasets with large data gaps. The proposed regression technique and altimeter performances are studied theoretically, with further assessment on both synthetic and real data. Full article
(This article belongs to the Section Ocean Remote Sensing)
Show Figures

Graphical abstract

18 pages, 4146 KiB  
Article
Semi-Automated Monitoring of a Mega-Scale Beach Nourishment Using High-Resolution TerraSAR-X Satellite Data
by Elena Vandebroek 1,*, Roderik Lindenbergh 2, Freek Van Leijen 2, Matthieu De Schipper 3,4, Sierd De Vries 3 and Ramon Hanssen 2
1 Department of Marine and Coastal Information Science, Deltares, 2629 HV Delft, Netherlands
2 Department of Geoscience and Remote Sensing, Delft University of Technology, 2628 CD Delft, Netherlands
3 Department of Hydraulic Engineering, Delft University of Technology, 2628 CD Delft, Netherlands
4 Shore Monitoring & Research, 2583 DW The Hague, Netherlands
Remote Sens. 2017, 9(7), 653; https://doi.org/10.3390/rs9070653 - 24 Jun 2017
Cited by 27 | Viewed by 7078
Abstract
This paper presents a semi-automated approach to detecting coastal shoreline change with high spatial- and temporal-resolution using X-band synthetic aperture radar (SAR) data. The method was applied at the Sand Motor, a “mega-scale” beach nourishment project in the Netherlands. Natural processes, like waves, [...] Read more.
This paper presents a semi-automated approach to detecting coastal shoreline change with high spatial- and temporal-resolution using X-band synthetic aperture radar (SAR) data. The method was applied at the Sand Motor, a “mega-scale” beach nourishment project in the Netherlands. Natural processes, like waves, wind, and tides, gradually distribute the highly concentrated sand to adjacent beaches. Currently, various in-situ techniques are used to monitor the Sand Motor on a monthly basis. Meanwhile, the TerraSAR-X satellite collects two high-resolution (3 × 3 m), cloud-penetrating SAR images every 11 days. This study investigates whether shorelines detected in TerraSAR-X imagery are accurate enough to monitor the shoreline dynamics of a project like the Sand Motor. The study proposes and implements a semi-automated workflow to extract shorelines from all 182 available TerraSAR-X images acquired between 2011 and 2014. The shorelines are validated using bi-monthly RTK-GPS topographic surveys and nearby wave and tide measurements. A valid shoreline could be extracted from 54% of the images. The horizontal accuracy of these shorelines is approximately 50 m, which is sufficient to assess the larger scale shoreline dynamics of the Sand Motor. The accuracy is affected strongly by sea state and partly by acquisition geometry. We conclude that using frequent, high-resolution TerraSAR-X imagery is a valid option for assessing coastal dynamics on the order of tens of meters at approximately monthly intervals. Full article
(This article belongs to the Section Remote Sensing in Geology, Geomorphology and Hydrology)
Show Figures

Graphical abstract

19 pages, 800 KiB  
Article
Identification of Hazard and Risk for Glacial Lakes in the Nepal Himalaya Using Satellite Imagery from 2000–2015
by David R. Rounce 1,*, C. Scott Watson 2 and Daene C. McKinney 1
1 Center for Research in Water Resources, University of Texas at Austin, Austin, TX 78758, USA
2 School of Geography and water@leeds, University of Leeds, Leeds LS2 9JT, UK
Remote Sens. 2017, 9(7), 654; https://doi.org/10.3390/rs9070654 - 26 Jun 2017
Cited by 117 | Viewed by 15833
Abstract
Glacial lakes in the Nepal Himalaya can threaten downstream communities and have large socio-economic consequences if an outburst flood occurs. This study identified 131 glacial lakes in Nepal in 2015 that are greater than 0.1 km2 and performed a first-pass hazard and [...] Read more.
Glacial lakes in the Nepal Himalaya can threaten downstream communities and have large socio-economic consequences if an outburst flood occurs. This study identified 131 glacial lakes in Nepal in 2015 that are greater than 0.1 km2 and performed a first-pass hazard and risk assessment for each lake. The hazard assessment included mass entering the lake, the moraine stability, and how lake expansion will alter the lake’s hazard in the next 15–30 years. A geometric flood model was used to quantify potential hydropower systems, buildings, agricultural land, and bridges that could be affected by a glacial lake outburst flood. The hazard and downstream impacts were combined to classify the risk associated with each lake. 11 lakes were classified as very high risk and 31 as high risk. The potential flood volume was also estimated and used to prioritize the glacial lakes that are the highest risk, which included Phoksundo Tal, Tsho Rolpa, Chamlang North Tsho, Chamlang South Tsho, and Lumding Tsho. These results are intended to assist stakeholders and decision makers in making well-informed decisions with respect to the glacial lakes that should be the focus of future field studies, modeling efforts, and risk-mitigation actions. Full article
(This article belongs to the Special Issue Remote Sensing of Climate Change and Water Resources)
Show Figures

Graphical abstract

18 pages, 3541 KiB  
Article
Ground Truth of Passive Microwave Radiative Transfer on Vegetated Land Surfaces
by Yohei Sawada 1,2,3,*, Hiroyuki Tsutsui 4 and Toshio Koike 1,5
1 Department of Civil Enginneering, the University of Tokyo, Tokyo 113-8656, Japan
2 Data Assimilation Research Team, RIKEN Advanced Institute for Computational Science, Kobe 650-0047, Japan
3 Meteorological Research Institute, Japan Meteorological Agency, Tsukuba 305-0052, Japan
4 Earth Observation Research Centor, Japan Aerospace Exploration Agency, Tsukuba 305-8505, Japan
5 International Centre for Water Hazard and Risk Management (ICHARM), Tsukuba 305-8516, Japan
Remote Sens. 2017, 9(7), 655; https://doi.org/10.3390/rs9070655 - 26 Jun 2017
Cited by 5 | Viewed by 4766
Abstract
In this paper, we implemented the in-situ observation of surface soil moisture (SSM), vegetation water content (VWC), and microwave brightness temperatures. By analyzing this in-situ observation dataset and the numerical simulation, we investigated the source of the uncertainty of the current [...] Read more.
In this paper, we implemented the in-situ observation of surface soil moisture (SSM), vegetation water content (VWC), and microwave brightness temperatures. By analyzing this in-situ observation dataset and the numerical simulation, we investigated the source of the uncertainty of the current algorithms for Advanced Microwave Scanning Radiometer for Earth observation system (AMSR-E) and AMSR2 to retrieve SSM and vegetation dynamics. Our findings are: (1) the microwave radiative transfer at C-band and X-band is not strongly affected by the shape of vegetation and the existing algorithm can be applied to a wide variety of plant types; (2) the diversity of surface soil roughness significantly affects the indices which are used by the current algorithms and addressing the uncertainty of surface soil roughness is necessary to improve the retrieval algorithms; (3) At C-band, SSM of the homogeneous vegetated land surfaces can be detected only when their VWC is less than approximately 0.25 (kg/m2); (4) the state-of-the-art Radiative Transfer Model (RTM) can predict our observed dataset although we have some biases in simulating brightness temperatures at a higher frequency. The new in-situ observation dataset produced by this study can be the guideline for both developers and users of passive microwave land observations to consider the uncertainties of their products. Full article
(This article belongs to the Section Remote Sensing in Geology, Geomorphology and Hydrology)
Show Figures

Graphical abstract

30 pages, 1786 KiB  
Article
Estimation of FAPAR over Croplands Using MISR Data and the Earth Observation Land Data Assimilation System (EO-LDAS)
by Maxim Chernetskiy 1,*, Jose Gómez-Dans 1,2,*, Nadine Gobron 3, Olivier Morgan 3, Philip Lewis 1,2, Sina Truckenbrodt 4 and Christiane Schmullius 4
1 Department of Geography, University College London, Gower Street, London WC1E 6BT, UK
2 National Centre for Earth Observation (NCEO), Department of Geography, University College London, Gower Street, London WC1E 6BT, UK
3 Directorate D—Sustainable Resources, Knowledge for Sustainable Development and Food Security Unit, European Commission Joint Research Centre, TP 122, Via Enrico Fermi, 2749, 21027 Ispra, Italy
4 Institute of Geography, Department for Earth Observation, Friedrich Schiller University, Grietgasse 6, 07743 Jena, Germany
Remote Sens. 2017, 9(7), 656; https://doi.org/10.3390/rs9070656 - 27 Jun 2017
Cited by 21 | Viewed by 6846
Abstract
The Fraction of Absorbed Photosynthetically-Active Radiation (FAPAR) is an important parameter in climate and carbon cycle studies. In this paper, we use the Earth Observation Land Data Assimilation System (EO-LDAS) framework to retrieve FAPAR from observations of directional surface reflectance measurements from the [...] Read more.
The Fraction of Absorbed Photosynthetically-Active Radiation (FAPAR) is an important parameter in climate and carbon cycle studies. In this paper, we use the Earth Observation Land Data Assimilation System (EO-LDAS) framework to retrieve FAPAR from observations of directional surface reflectance measurements from the Multi-angle Imaging SpectroRadiometer(MISR) instrument. The procedure works by interpreting the reflectance data via the semi-discrete Radiative Transfer (RT) model, supported by a prior parameter distribution and a dynamic regularisation model and resulting in an inference of land surface parameters, such as effective Leaf Area Index (LAI), leaf chlorophyll concentration and fraction of senescent leaves, with full uncertainty quantification. The method is demonstrated over three agricultural FLUXNET sites, and the EO-LDAS results are compared with eight years of in situ measurements of FAPAR and LAI, resulting in a total of 24 site years. We additionally compare three other widely-used EO FAPAR products, namely the MEdium Resolution Imaging Spectrometer (MERIS) Full Resolution, the MISR High Resolution (HR) Joint Research Centre Two-stream Inversion Package (JRC-TIP) and MODIS MCD15 FAPAR products. The EO-LDAS MISR FAPAR retrievals show a high correlation with the ground measurements ( r 2 > 0.8), as well as the lowest average R M S E (0.14), in line with the MODIS product. As the EO-LDAS solution is effectively interpolated, if only measurements that are coincident with MISR observations are considered, the correlation increases ( r 2 > 0.85); the R M S E is lower by 4–5%; and the bias is 2% and 7%. The EO-LDAS MISR LAI estimates show a strong correlation with ground-based LAI (average r 2 = 0.76), but an underestimate of LAI for optically-thick canopies due to saturation (average R M S E = 2.23). These results suggest that the EO-LDAS approach is successful in retrieving both FAPAR and other land surface parameters. A large part of this success is based on the use of a dynamic regularisation model that counteracts the poor temporal sampling from the MISR instrument. Full article
Show Figures

Graphical abstract

20 pages, 1812 KiB  
Article
Adaptive Unscented Kalman Filter for Target Tracking in the Presence of Nonlinear Systems Involving Model Mismatches
by Huan Zhou 1, Hanqiao Huang 1,2,*, Hui Zhao 1, Xin Zhao 1 and Xiang Yin 3
1 Aeronautics and Astronautics Engineering College, Air Force Engineering University, Xi’an 710038, China
2 Astronautics College, Northwestern Polytechnic University, Xi’an 710072, China
3 No. 203 Institute, Military Representative Office of Army Aviation , Xi’an 710038, China
Remote Sens. 2017, 9(7), 657; https://doi.org/10.3390/rs9070657 - 27 Jun 2017
Cited by 34 | Viewed by 5421
Abstract
In order to improve filtering precision and restrain divergence caused by sensor faults or model mismatches for target tracking, a new adaptive unscented Kalman filter (N-AUKF) algorithm is proposed. First of all, the unscented Kalman filter (UKF) problem to be solved for systems [...] Read more.
In order to improve filtering precision and restrain divergence caused by sensor faults or model mismatches for target tracking, a new adaptive unscented Kalman filter (N-AUKF) algorithm is proposed. First of all, the unscented Kalman filter (UKF) problem to be solved for systems involving model mismatches is described, after that, the necessary and sufficient condition with third order accuracy of the standard UKF is given and proven by using the matrix theory. In the filtering process of N-AUKF, an adaptive matrix gene is introduced to the standard UKF to adjust the covariance matrixes of the state vector and innovation vector in real time, which makes full use of normal innovations. Then, a covariance matching criterion is designed to judge the filtering divergence. On this basis, an adaptive weighted coefficient is applied to restrain the divergence. Compared with the standard UKF and existing adaptive UKF, the proposed UKF algorithm improves the filtering accuracy, rapidity and numerical stability remarkably, moreover, it has a good adaptive capability to deal with sensor faults or model mismatches. The performance and effectiveness of the proposed UKF is verified in a target tracking mission. Full article
Show Figures

Graphical abstract

18 pages, 37151 KiB  
Article
Geometric Potential Assessment for ZY3-02 Triple Linear Array Imagery
by Kai Xu 1, Yonghua Jiang 2, Guo Zhang 1,3,*, Qingjun Zhang 3,4 and Xia Wang 5
1 State Key Laboratory of Information Engineering in Surveying, Mapping and Remote Sensing, Wuhan University, Wuhan 430079, China
2 School of Remote Sensing and Information Engineering, Wuhan University, Wuhan 430079, China
3 Collaborative Innovation Center of Geospatial Technology, Wuhan University, Wuhan 430079, China
4 China Academy of Space Technology, Beijing 100094, China
5 Satellite Surveying and Mapping Application Center, NASG, Beijing 101300, China
Remote Sens. 2017, 9(7), 658; https://doi.org/10.3390/rs9070658 - 28 Jun 2017
Cited by 23 | Viewed by 6368
Abstract
ZiYuan3-02 (ZY3-02) is the first remote sensing satellite for the development of China’s civil space infrastructure (CCSI) and the second satellite in the ZiYuan3 series; it was launched successfully on 30 May 2016, aboard the CZ-4B rocket at the Taiyuan Satellite Launch Center [...] Read more.
ZiYuan3-02 (ZY3-02) is the first remote sensing satellite for the development of China’s civil space infrastructure (CCSI) and the second satellite in the ZiYuan3 series; it was launched successfully on 30 May 2016, aboard the CZ-4B rocket at the Taiyuan Satellite Launch Center (TSLC) in China. Core payloads of ZY3-02 include a triple linear array camera (TLC) and a multi-spectral camera, and this equipment will be used to acquire space geographic information with high-resolution and stereoscopic observations. Geometric quality is a key factor that affects the performance and potential of satellite imagery. For the purpose of evaluating comprehensively the geometric potential of ZY3-02, this paper introduces the method used for geometric calibration of the TLC onboard the satellite and a model for sensor corrected (SC) products that serve as basic products delivered to users. Evaluation work was conducted by making a full assessment of the geometric performance. Furthermore, images of six regions and corresponding reference data were collected to implement the geometric calibration technique and evaluate the resulting geometric accuracy. Experimental results showed that the direct location performance and internal accuracy of SC products increased remarkably after calibration, and the planimetric and vertical accuracies with relatively few ground control points (GCPs) were demonstrated to be better than 2.5 m and 2 m, respectively. Additionally, the derived digital surface model (DSM) accuracy was better than 3 m (RMSE) for flat terrain and 5 m (RMSE) for mountainous terrain. However, given that several variations such as changes in the thermal environment can alter the camera’s installation angle, geometric performance will vary with the geographical location and imaging time changes. Generally, ZY3-02 can be used for 1:50,000 stereo mapping and can produce (and update) larger-scale basic geographic information products. Full article
(This article belongs to the Section Atmospheric Remote Sensing)
Show Figures

Graphical abstract

14 pages, 795 KiB  
Article
Comparing Sentinel-2A and Landsat 7 and 8 Using Surface Reflectance over Australia
by Neil Flood
Joint Remote Sensing Research Program, School of Earth and Environmental Sciences, University of Queensland, St. Lucia, QLD 4072, Australia
Remote Sens. 2017, 9(7), 659; https://doi.org/10.3390/rs9070659 - 27 Jun 2017
Cited by 89 | Viewed by 15312
Abstract
The new Sentinel-2 Multi Spectral Imager instrument has a set of bands with very similar spectral windows to the main bands of the Landsat Thematic Mapper family of instruments. While these should, in principle, give broadly comparable measurements, any differences are a function [...] Read more.
The new Sentinel-2 Multi Spectral Imager instrument has a set of bands with very similar spectral windows to the main bands of the Landsat Thematic Mapper family of instruments. While these should, in principle, give broadly comparable measurements, any differences are a function not only of the differences in the sensor responses, but also of the spectral characteristics of the target pixels. In order to test for and quantify differences between these sensors, a large set of coincident imagery was assembled for the Australian landscape. Comparisons were carried out in terms of surface reflectance, and also in terms of biophysical quantities estimated from the reflectances. Small but consistent differences were found, and suitable adjustment equations fitted to enable transformation of Sentinel-2A reflectance values to more closely match Landsat-7 or Landsat-8 values. This is useful if trying to take models and thresholds fitted from Landsat and use them with Sentinel-2. The fitted adjustment equations were also compared against those fitted globally for NASA’s Harmonized Landsat-8 Sentinel-2 product, and found to be substantially different, raising the possibility that such adjustments need to be fitted on a regional basis. Full article
Show Figures

Graphical abstract

21 pages, 10241 KiB  
Article
PolSAR Land Cover Classification Based on Roll-Invariant and Selected Hidden Polarimetric Features in the Rotation Domain
by Chensong Tao, Siwei Chen *, Yongzhen Li and Shunping Xiao
The State Key Laboratory of Complex Electromagnetic Environment Effects on Electronics and Information System, School of Electronic Science and Engineering, National University of Defense Technology, Changsha 410073, China
Remote Sens. 2017, 9(7), 660; https://doi.org/10.3390/rs9070660 - 1 Jul 2017
Cited by 62 | Viewed by 6468
Abstract
Land cover classification is an important application for polarimetric synthetic aperture radar (PolSAR). Target polarimetric response is strongly dependent on its orientation. Backscattering responses of the same target with different orientations to the SAR flight path may be quite different. This target orientation [...] Read more.
Land cover classification is an important application for polarimetric synthetic aperture radar (PolSAR). Target polarimetric response is strongly dependent on its orientation. Backscattering responses of the same target with different orientations to the SAR flight path may be quite different. This target orientation diversity effect hinders PolSAR image understanding and interpretation. Roll-invariant polarimetric features such as entropy, anisotropy, mean alpha angle, and total scattering power are independent of the target orientation and are commonly adopted for PolSAR image classification. On the other aspect, target orientation diversity also contains rich information which may not be sensed by roll-invariant polarimetric features. In this vein, only using the roll-invariant polarimetric features may limit the final classification accuracy. To address this problem, this work uses the recently reported uniform polarimetric matrix rotation theory and a visualization and characterization tool of polarimetric coherence pattern to investigate hidden polarimetric features in the rotation domain along the radar line of sight. Then, a feature selection scheme is established and a set of hidden polarimetric features are selected in the rotation domain. Finally, a classification method is developed using the complementary information between roll-invariant and selected hidden polarimetric features with a support vector machine (SVM)/decision tree (DT) classifier. Comparison experiments are carried out with NASA/JPL AIRSAR and multi-temporal UAVSAR data. For AIRSAR data, the overall classification accuracy of the proposed classification method is 95.37% (with SVM)/96.38% (with DT), while that of the conventional classification method is 93.87% (with SVM)/94.12% (with DT), respectively. Meanwhile, for multi-temporal UAVSAR data, the mean overall classification accuracy of the proposed method is up to 97.47% (with SVM)/99.39% (with DT), which is also higher than the mean accuracy of 89.59% (with SVM)/97.55% (with DT) from the conventional method. The comparison studies clearly demonstrate the efficiency and advantage of the proposed classification methodology. In addition, the proposed classification method achieves better robustness for the multi-temporal PolSAR data. This work also further validates that added benefits can be gained for PolSAR data investigation by mining and utilization of hidden polarimetric information in the rotation domain. Full article
(This article belongs to the Special Issue Advances in SAR: Sensors, Methodologies, and Applications)
Show Figures

Graphical abstract

12 pages, 4009 KiB  
Article
Developing the Remote Sensing-Gash Analytical Model for Estimating Vegetation Rainfall Interception at Very High Resolution: A Case Study in the Heihe River Basin
by Yaokui Cui 1,2, Peng Zhao 3,4, Binyan Yan 5, Hongjie Xie 6, Pengtao Yu 7, Wei Wan 1,2, Wenjie Fan 3,4,* and Yang Hong 1,2,3,8,*
1 State Key Laboratory of Hydroscience and Engineering, Department of Hydraulic Engineering, Tsinghua University, Beijing 100084, China
2 Department of Hydraulic Engineering, Tsinghua University, Beijing 100084, China
3 Institute of RS and GIS, Peking University, Beijing 100871, China
4 Beijing Key Laboratory of Spatial Information Integration & Its Applications, Beijing 100871, China
5 Jackson School of Geosciences, University of Texas at Austin, Austin, TX 78712, USA
6 Department of Geological Sciences, University of Texas at San Antonio, San Antonio, TX 78249, USA
7 Research Institute of Forest Ecology, Environment and Protection, Chinese Academy of Forestry, Beijing 100091, China
8 Department of Civil Engineering and Environmental Science, University of Oklahoma, Norman, OK 73019, USA
Remote Sens. 2017, 9(7), 661; https://doi.org/10.3390/rs9070661 - 27 Jun 2017
Cited by 14 | Viewed by 4747
Abstract
Accurately quantifying the vegetation rainfall interception at a high resolution is critical for rainfall-runoff modeling and flood forecasting, and is also essential for understanding its further impact on local, regional, and even global water cycle dynamics. In this study, the Remote Sensing-based Gash [...] Read more.
Accurately quantifying the vegetation rainfall interception at a high resolution is critical for rainfall-runoff modeling and flood forecasting, and is also essential for understanding its further impact on local, regional, and even global water cycle dynamics. In this study, the Remote Sensing-based Gash model (RS-Gash model) is developed based on a modified Gash model for interception loss estimation using remote sensing observations at the regional scale, and has been applied and validated in the upper reach of the Heihe River Basin of China for different types of vegetation. To eliminate the scale error and the effect of mixed pixels, the RS-Gash model is applied at a fine scale of 30 m with the high resolution vegetation area index retrieved by using the unified model of bidirectional reflectance distribution function (BRDF-U) for the vegetation canopy. Field validation shows that the RMSE and R2 of the interception ratio are 3.7% and 0.9, respectively, indicating the model’s strong stability and reliability at fine scale. The temporal variation of vegetation rainfall interception and its relationship with precipitation are further investigated. In summary, the RS-Gash model has demonstrated its effectiveness and reliability in estimating vegetation rainfall interception. When compared to the coarse resolution results, the application of this model at 30-m fine resolution is necessary to resolve the scaling issues as shown in this study. Full article
(This article belongs to the Section Remote Sensing in Geology, Geomorphology and Hydrology)
Show Figures

Graphical abstract

12 pages, 2179 KiB  
Article
Nonlinear Classification of Multispectral Imagery Using Representation-Based Classifiers
by Yan Xu 1, Qian Du 1,*, Wei Li 2, Chen Chen 3 and Nicolas H. Younan 1
1 Department of Electrical and Computer Engineering, Mississippi State University, Starkville, MS 39762, USA
2 College of Information Science and Technology, Beijing University of Chemical Technology, Beijing 100029, China
3 Center for Research in Computer Vision, University of Central Florida, Orlando, FL 32816, USA
Remote Sens. 2017, 9(7), 662; https://doi.org/10.3390/rs9070662 - 28 Jun 2017
Cited by 8 | Viewed by 5449
Abstract
This paper investigates representation-based classification for multispectral imagery. Due to small spectral dimension, the performance of classification may be limited, and, in general, it is difficult to discriminate different classes with multispectral imagery. Nonlinear band generation method with explicit functions is proposed to [...] Read more.
This paper investigates representation-based classification for multispectral imagery. Due to small spectral dimension, the performance of classification may be limited, and, in general, it is difficult to discriminate different classes with multispectral imagery. Nonlinear band generation method with explicit functions is proposed to use which can provide additional spectral information for multispectral image classification. Specifically, we propose the simple band ratio function, which can yield better performance than the nonlinear kernel method with implicit mapping function. Two representation-based classifiers—i.e., sparse representation classifier (SRC) and nearest regularized subspace (NRS) method—are evaluated on the nonlinearly generated datasets. Experimental results demonstrate that this dimensionality-expansion approach can outperform the traditional kernel method in terms of high classification accuracy and low computational cost when classifying multispectral imagery. Full article
(This article belongs to the Special Issue Learning to Understand Remote Sensing Images)
Show Figures

Graphical abstract

29 pages, 6269 KiB  
Article
Urban Area Extraction by Regional and Line Segment Feature Fusion and Urban Morphology Analysis
by Qian Zhang 1, Xin Huang 2,3,* and Guixu Zhang 1,*
1 Department of Computer Science and Technology, East China Normal University, Shanghai 200241, China
2 School of Remote Sensing and Information Engineering, Wuhan University, Wuhan 430079, China
3 State Key Laboratory of Information Engineering in Surveying, Mapping and Remote Sensing, Wuhan University, Wuhan 430079, China
Remote Sens. 2017, 9(7), 663; https://doi.org/10.3390/rs9070663 - 28 Jun 2017
Cited by 21 | Viewed by 7143
Abstract
Urban areas are a complex combination of various land-cover types, and show a variety of land-use structures and spatial layouts. Furthermore, the spectral similarity between built-up areas and bare land is a great challenge when using high spatial resolution remote sensing images to [...] Read more.
Urban areas are a complex combination of various land-cover types, and show a variety of land-use structures and spatial layouts. Furthermore, the spectral similarity between built-up areas and bare land is a great challenge when using high spatial resolution remote sensing images to map urban areas, especially for images obtained in dry and cold seasons or high-latitude regions. In this study, a new procedure for urban area extraction is presented based on the high-level, regional, and line segment features of high spatial resolution satellite data. The urban morphology is also analyzed. Firstly, the primitive features—the morphological building index (MBI), the normalized difference vegetation index (NDVI), and line segments—are extracted from the original images. Chessboard segmentation is then used to segment the image into the same-size objects. In each object, advanced features are then extracted based on the MBI, the NDVI, and the line segments. Subsequently, object-oriented classification is implemented using the above features to distinguish urban areas from non-urban areas. In general, the boundaries of urban and non-urban areas are not very clear, and each urban area has its own spatial structure characteristic. Hence, in this study, an analysis of the urban morphology is carried out to obtain a clear regional structure, showing the main city, the surrounding new development zones, etc. The experimental results obtained with six WorldView-2 and Gaofen-2 images obtained from different regions and seasons demonstrate that the proposed method outperforms the current state-of-the-art methods. Full article
Show Figures

Graphical abstract

15 pages, 2325 KiB  
Article
Phenology Plays an Important Role in the Regulation of Terrestrial Ecosystem Water-Use Efficiency in the Northern Hemisphere
by Jiaxin Jin 1,*, Ying Wang 2, Zhen Zhang 3,4, Vincenzo Magliulo 5, Hong Jiang 1,* and Min Cheng 1
1 International Institute for Earth System Science, Nanjing University, Nanjing 210023, China
2 Nanjing Institute of Geography & Limnology, Chinese Academy of Sciences, Nanjing 210008, China
3 Dynamic Macroecology, Swiss Federal Research Institute WSL, Zürcherstrasse 111, 8903 Birmensdorf, Switzerland
4 Cold and Arid Regions Environmental and Engineering Research Institute, Chinese Academy of Sciences, Lanzhou 730000, China
5 CNR Institute for Agricultural and Forest Systems, Via Patacca 85, 80056 Ercolano, Italy
Remote Sens. 2017, 9(7), 664; https://doi.org/10.3390/rs9070664 - 28 Jun 2017
Cited by 45 | Viewed by 6144
Abstract
Ecosystem-scale water-use efficiency (WUE), defined as the ratio of gross primary productivity (GPP) to evapotranspiration (ET), is an important indicator of coupled carbon-water cycles. Relationships between WUE and environmental factors have been widely investigated, but the variations in WUE in response to biotic [...] Read more.
Ecosystem-scale water-use efficiency (WUE), defined as the ratio of gross primary productivity (GPP) to evapotranspiration (ET), is an important indicator of coupled carbon-water cycles. Relationships between WUE and environmental factors have been widely investigated, but the variations in WUE in response to biotic factors remain little understood. Here, we argue that phenology plays an important role in the regulation of WUE by analyzing seasonal WUE responses to variability of photosynthetic phenological factors in terrestrial ecosystems of the Northern Hemisphere using MODIS satellite observations during 2000–2014. Our results show that WUE, during spring and autumn is widely and significantly correlated to the start (SOS) and end (EOS) of growing season, respectively, after controlling for environmental factors (including temperature, precipitation, radiation and atmospheric carbon dioxide concentration). The main patterns of WUE response to phenology suggest that an increase in spring (or autumn) WUE with an earlier SOS (or later EOS) are mainly because the increase in GPP is relatively large in magnitude compared to that of ET, or due to an increase in GPP accompanied by a decrease in ET, resulting from an advanced SOS (or a delayed EOS). Our results and conclusions are helpful to complement our knowledge of the biological regulatory mechanisms underlying coupled carbon-water cycles. Full article
(This article belongs to the Section Remote Sensing in Agriculture and Vegetation)
Show Figures

Figure 1

18 pages, 6536 KiB  
Article
Regression Kriging for Improving Crop Height Models Fusing Ultra-Sonic Sensing with UAV Imagery
by Michael Schirrmann 1,*, André Hamdorf 1, Antje Giebel 1, Franziska Gleiniger 1, Michael Pflanz 1,2 and Karl-Heinz Dammer 1
1 Leibniz Institute for Agricultural Engineering and Bioeconomy, Potsdam-Bornim e.V., Max-Eyth-Allee 100, 14469 Potsdam, Germany
2 Julius Kühn-Institut, Federal Research Centre for Cultivated Plants, Institute for Plant Protection in Field Crops and Grassland, Messeweg 11-12, 38104 Braunschweig, Germany
Remote Sens. 2017, 9(7), 665; https://doi.org/10.3390/rs9070665 - 28 Jun 2017
Cited by 32 | Viewed by 7489
Abstract
A crop height model (CHM) can be an important element of the decision making process in agriculture, because it relates well with many agronomic parameters, e.g., crop height, plant biomass or crop yield. Today, CHMs can be inexpensively obtained from overlapping imagery captured [...] Read more.
A crop height model (CHM) can be an important element of the decision making process in agriculture, because it relates well with many agronomic parameters, e.g., crop height, plant biomass or crop yield. Today, CHMs can be inexpensively obtained from overlapping imagery captured from unmanned aerial vehicle (UAV) platforms or from proximal sensors attached to ground-based vehicles used for regular management. Both approaches have their limitations and combining them with a data fusion may overcome some of these limitations. Therefore, the objective of this study was to investigate if regression kriging, as a geostatistical data fusion approach, can be used to improve the interpolation of ground-based ultrasonic measurements with UAV imagery as covariate. Regression kriging might be suitable because we have a sparse data set (ultrasound) and an exhaustive data set (UAV) and both data sets have favorable properties for geostatistical analysis. To confirm this, we conducted four missions in two different fields in total, where we collected UAV imagery and ultrasonic data alongside. From the overlapping UAV images, surface models and ortho-images were generated with photogrammetric processing. The maps generated by regression kriging were of much higher detail than the smooth maps generated by ordinary kriging, because regression kriging ensures that for each prediction point information from the UAV, imagery is given. The relationship with crop height, fresh biomass and, to a lesser extent, with crop yield, was stronger using CHMs generated by regression kriging than by ordinary kriging. The use of UAV data from the prior mission was also of benefit and could improve map accuracy and quality. Thus, regression kriging is a flexible approach for the integration of UAV imagery with ground-based sensor data, with benefits for precision agriculture-oriented farmers and agricultural service providers. Full article
Show Figures

Graphical abstract

22 pages, 5985 KiB  
Article
An Efficient and Robust Integrated Geospatial Object Detection Framework for High Spatial Resolution Remote Sensing Imagery
by Xiaobing Han 1,2, Yanfei Zhong 1,2,* and Liangpei Zhang 1,2
1 State Key Laboratory of Information Engineering in Surveying, Mapping and Remote Sensing, Wuhan University, Wuhan 430079, China
2 Collaborative Innovation Center of Geospatial Technology, Wuhan University, Wuhan 430079, China
Remote Sens. 2017, 9(7), 666; https://doi.org/10.3390/rs9070666 - 28 Jun 2017
Cited by 176 | Viewed by 10762
Abstract
Geospatial object detection from high spatial resolution (HSR) remote sensing imagery is a significant and challenging problem when further analyzing object-related information for civil and engineering applications. However, the computational efficiency and the separate region generation and localization steps are two big obstacles [...] Read more.
Geospatial object detection from high spatial resolution (HSR) remote sensing imagery is a significant and challenging problem when further analyzing object-related information for civil and engineering applications. However, the computational efficiency and the separate region generation and localization steps are two big obstacles for the performance improvement of the traditional convolutional neural network (CNN)-based object detection methods. Although recent object detection methods based on CNN can extract features automatically, these methods still separate the feature extraction and detection stages, resulting in high time consumption and low efficiency. As a significant influencing factor, the acquisition of a large quantity of manually annotated samples for HSR remote sensing imagery objects requires expert experience, which is expensive and unreliable. Despite the progress made in natural image object detection fields, the complex object distribution makes it difficult to directly deal with the HSR remote sensing imagery object detection task. To solve the above problems, a highly efficient and robust integrated geospatial object detection framework based on faster region-based convolutional neural network (Faster R-CNN) is proposed in this paper. The proposed method realizes the integrated procedure by sharing features between the region proposal generation stage and the object detection stage. In addition, a pre-training mechanism is utilized to improve the efficiency of the multi-class geospatial object detection by transfer learning from the natural imagery domain to the HSR remote sensing imagery domain. Extensive experiments and comprehensive evaluations on a publicly available 10-class object detection dataset were conducted to evaluate the proposed method. Full article
(This article belongs to the Special Issue Remote Sensing Big Data: Theory, Methods and Applications)
Show Figures

Figure 1

14 pages, 5532 KiB  
Article
Study of PBLH and Its Correlation with Particulate Matter from One-Year Observation over Nanjing, Southeast China
by Yawei Qu 1, Yong Han 1,2,*, Yonghua Wu 3, Peng Gao 1 and Tijian Wang 1
1 School of Atmospheric Sciences, Nanjing University, Nanjing 210023, China
2 School of Atmospheric Sciences, Sun Yat-sen University, Guangzhou 510275, China
3 NOAA-CREST, City College of the City University of New York, New York, NY 10031, USA
Remote Sens. 2017, 9(7), 668; https://doi.org/10.3390/rs9070668 - 28 Jun 2017
Cited by 71 | Viewed by 9529
Abstract
The Planetary Boundary Layer Height (PBLH) plays an important role in the formation and development of air pollution events. Particulate Matter is one of major pollutants in China. Here, we present the characteristics of PBLH through three-methods of Lidar data inversion and show [...] Read more.
The Planetary Boundary Layer Height (PBLH) plays an important role in the formation and development of air pollution events. Particulate Matter is one of major pollutants in China. Here, we present the characteristics of PBLH through three-methods of Lidar data inversion and show the correlation between the PBLH and the PM2.5 (PM2.5 with the diameter <2.5 μm) in the period of December 2015 through November 2016, over Nanjing, in southeast China. We applied gradient method (GRA), standard deviation method (STD) and wavelet covariance transform method (WCT) to calculate the PBLH. The results show that WCT is the most stable method which is less sensitive to the signal noise. We find that the PBLH shows typical seasonal variation trend with maximum in summer and minimum in winter, respectively. The yearly averaged PBLH in the diurnal cycle show the minimum of 570 m at 08:00 and the maximum of 1089 m at 15:00 Beijing time. Furthermore, we investigate the relationship of the PBLH and PM2.5 concentration under different particulate pollution conditions. The correlation coefficient is about −0.70, which is negative correlation. The average PBLH are 718 m and 1210 m when the PM2.5 > 75 μg/m3 and the PM2.5 < 35 μg/m3 in daytime, respectively. The low PBLH often occurs with condition of the low wind speed and high relative humidity, which will lead to high PM2.5 concentration and the low visibility. On the other hand, the stability of PBL is enhanced by high PM concentration and low visibility. Full article
(This article belongs to the Special Issue Remote Sensing of Atmospheric Pollution)
Show Figures

Graphical abstract

17 pages, 1825 KiB  
Article
Evaluation of Satellite-Based Rainfall Estimates and Application to Monitor Meteorological Drought for the Upper Blue Nile Basin, Ethiopia
by Yared Bayissa 1,2,*, Tsegaye Tadesse 1, Getachew Demisse 1 and Andualem Shiferaw 1
1 National Drought Mitigation Center, University of Nebraska-Lincoln, Lincoln, CA 68583, USA
2 IHE Delft Institute for Water Education, Westvest 7, 2611 AX Delft, The Netherlands
Remote Sens. 2017, 9(7), 669; https://doi.org/10.3390/rs9070669 - 29 Jun 2017
Cited by 223 | Viewed by 13482
Abstract
Drought is a recurring phenomenon in Ethiopia that significantly impacts the socioeconomic sector and various components of the environment. The overarching goal of this study is to assess the spatial and temporal patterns of meteorological drought using a satellite-derived rainfall product for the [...] Read more.
Drought is a recurring phenomenon in Ethiopia that significantly impacts the socioeconomic sector and various components of the environment. The overarching goal of this study is to assess the spatial and temporal patterns of meteorological drought using a satellite-derived rainfall product for the Upper Blue Nile Basin (UBN). The satellite rainfall product used in this study was selected through evaluation of five high-resolution products (Climate Hazards Group InfraRed Precipitation with Stations (CHIRPS) v2.0, Precipitation Estimation from Remotely Sensed Information using Artificial Neural Networks (PERSIANN), African Rainfall Climatology and Time-series (TARCAT) v2.0, Tropical Rainfall Measuring Mission (TRMM) and Africa Rainfall Estimate Climatology version 2 [ARC 2.0]). The statistical performance measuring techniques (i.e., Pearson correlation coefficient (r), mean error (ME), root mean square error (RMSE), and Bias) were used to evaluate the satellite rainfall products with the corresponding ground observation data at ten independent weather stations. The evaluation was carried out for 1998–2015 at dekadal, monthly, and seasonal time scales. The evaluation results of these satellite-derived rainfall products show there is a good agreement (r > 0.7) of CHIRPS and TARCAT rainfall products with ground observations in majority of the weather stations for all time steps. TARCAT showed a greater correlation coefficient (r > 0.70) in seven weather stations at a dekadal time scale whereas CHIRPS showed a greater correlation coefficient (r > 0.84) in nine weather stations at a monthly time scale. An excellent score of Bias (close to one) and mean error was observed in CHIRPS at dekadal, monthly and seasonal time scales in a majority of the stations. TARCAT performed well next to CHIRPS whereas PERSSIAN presented a weak performance under all the criteria. Thus, the CHIRPS rainfall product was selected and used to assess the spatial and temporal variability of meteorological drought in this study. The 3-month Z-Score values were calculated for each grid and used to assess the spatial and temporal patterns of drought. The result shows that the known historic drought years (2014–2015, 2009–2010, 1994–1995 and 1983–1984) were successfully indicated. Moreover, severe drought conditions were observed in the drought prone parts of the basin (i.e., central, eastern and southeastern). Hence, the CHIRPS rainfall product can be used as an alternative source of information in developing the grid-based drought monitoring tools for the basin that could help in developing early warning systems. Full article
Show Figures

Graphical abstract

18 pages, 10045 KiB  
Article
Calibration of METRIC Model to Estimate Energy Balance over a Drip-Irrigated Apple Orchard
by Daniel De la Fuente-Sáiz 1, Samuel Ortega-Farías 1,*, David Fonseca 1, Samuel Ortega-Salazar 2, Ayse Kilic 2 and Richard Allen 3
1 Centro de Investigación y Transferencia en Riego y Agroclimatología (CITRA) and Research Program on Adaptation of Agriculture to Climate Change (A2C2), Universidad de Talca, Casilla 747, Talca 3460000, Chile
2 School of Natural Resources and Civil Engineering, University of Nebraska-Lincoln, 311 Hardin Hall, 3310 Holdrege Street, Lincoln, NE 68588, USA
3 Biological and Agricultural Engineering and Civil Engineering, Research and Ext. Center, University of Idaho, Kimberly, Moscow, ID 83844, USA
Remote Sens. 2017, 9(7), 670; https://doi.org/10.3390/rs9070670 - 29 Jun 2017
Cited by 35 | Viewed by 7284
Abstract
A field experiment was carried out to calibrate and evaluate the METRIC (Mapping EvapoTranspiration at high Resolution Internalized with Calibration) model for estimating the spatial and temporal variability of instantaneous net radiation (Rni), soil heat flux (Gi), sensible heat [...] Read more.
A field experiment was carried out to calibrate and evaluate the METRIC (Mapping EvapoTranspiration at high Resolution Internalized with Calibration) model for estimating the spatial and temporal variability of instantaneous net radiation (Rni), soil heat flux (Gi), sensible heat flux (Hi), and latent heat flux (LEi) over a drip-irrigated apple (Malus domestica cv. Pink Lady) orchard located in the Pelarco valley, Maule Region, Chile (35°25′20′′LS; 71°23′57′′LW; 189 m.a.s.l.). The study was conducted in a plot of 5.5 hectares using 20 satellite images (Landsat 7 ETM+) acquired on clear sky days during three growing seasons (2012/2013, 2013/2014 and 2014/2015). Specific sub-models to estimate Gi, leaf area index (LAI) and aerodynamic roughness length for momentum transfer (Zom) were calibrated for the apple orchard as an improvement to the standard METRIC model. The performance of the METRIC model was evaluated at the time of satellite overpass using measurements of Hi and LEi obtained from an eddy correlation system. In addition, estimated values of Rni, Gi and LAI were compared with ground-truth measurements from a four-way net radiometer, soil heat flux plates and plant canopy analyzer, respectively. Validation indicated that LAI, Zom and Gi were estimated using the calibrated functions with errors of +2%, +6% and +3% while those were computed using the standard functions with error of +59%, +83%, and +12%, respectively. In addition, METRIC using the calibrated functions estimated Hi and LEi with error of +5% and +16%, while using the original functions estimated Hi and LEi with error of +29% and +26%, respectively. Full article
(This article belongs to the Section Remote Sensing in Agriculture and Vegetation)
Show Figures

Figure 1

17 pages, 6642 KiB  
Article
An Improved Local Gradient Method for Sea Surface Wind Direction Retrieval from SAR Imagery
by Lizhang Zhou 1, Gang Zheng 1,*, Xiaofeng Li 2, Jingsong Yang 1, Lin Ren 1, Peng Chen 1, Huaguo Zhang 1 and Xiulin Lou 1
1 State Key Laboratory of Satellite Ocean Environment Dynamics, Second Institute of Oceanography, State Oceanic Administration, Hangzhou 310012, China
2 GST at National Oceanic and Atmospheric Administration (NOAA)-National Environmental Satellite, Data, and Information Service (NESDIS), College Park, MD 20740, USA
Remote Sens. 2017, 9(7), 671; https://doi.org/10.3390/rs9070671 - 30 Jun 2017
Cited by 47 | Viewed by 7418
Abstract
Sea surface wind affects the fluxes of energy, mass and momentum between the atmosphere and ocean, and therefore regional and global weather and climate. With various satellite microwave sensors, sea surface wind can be measured with large spatial coverage in almost all-weather conditions, [...] Read more.
Sea surface wind affects the fluxes of energy, mass and momentum between the atmosphere and ocean, and therefore regional and global weather and climate. With various satellite microwave sensors, sea surface wind can be measured with large spatial coverage in almost all-weather conditions, day or night. Like any other remote sensing measurements, sea surface wind measurement is also indirect. Therefore, it is important to develop appropriate wind speed and direction retrieval models for different types of microwave instruments. In this paper, a new sea surface wind direction retrieval method from synthetic aperture radar (SAR) imagery is developed. In the method, local gradients are computed in frequency domain by combining the operation of smoothing and computing local gradients in one step to simplify the process and avoid the difference approximation. This improved local gradients (ILG) method is compared with the traditional two-dimensional fast Fourier transform (2D FFT) method and local gradients (LG) method, using interpolating wind directions from the European Centre for Medium-Range Weather Forecast (ECMWF) reanalysis data and the Cross-Calibrated Multi-Platform (CCMP) wind vector product. The sensitivities to the salt-and-pepper noise, the additive noise and the multiplicative noise are analyzed. The ILG method shows a better performance of retrieval wind directions than the other two methods. Full article
(This article belongs to the Special Issue Ocean Remote Sensing with Synthetic Aperture Radar)
Show Figures

Graphical abstract

15 pages, 2514 KiB  
Article
Understanding the Impact of Urbanization on Surface Urban Heat Islands—A Longitudinal Analysis of the Oasis Effect in Subtropical Desert Cities
by Chao Fan 1,2,*, Soe W. Myint 1, Shai Kaplan 3, Ariane Middel 4, Baojuan Zheng 5, Atiqur Rahman 6, Huei-Ping Huang 7, Anthony Brazel 1 and Dan G. Blumberg 8
1 School of Geographical Sciences and Urban Planning, Arizona State University, Tempe, AZ 85287, USA
2 Keller Science Action Center, The Field Museum, Chicago, IL 60605, USA
3 Blaustein Institutes for Desert Research, Ben-Gurion University of the Negev, Beer Sheva 8499000, Israel
4 Department of Geography and Urban Studies, Temple University, Philadelphia, PA 19122, USA
5 Geospatial Sciences Center of Excellence, South Dakota State University, Brookings, SD 57007, USA
6 Department of Geography, Jamia Millia Islamia, New Delhi 110025, India
7 School for Engineering of Matter, Transport and Energy, Arizona State University, Tempe, AZ 85287, USA
8 Research and Development, Ben-Gurion University of the Negev, Beer Sheva 8499000, Israel
Remote Sens. 2017, 9(7), 672; https://doi.org/10.3390/rs9070672 - 30 Jun 2017
Cited by 76 | Viewed by 11583
Abstract
We quantified the spatio-temporal patterns of land cover/land use (LCLU) change to document and evaluate the daytime surface urban heat island (SUHI) for five hot subtropical desert cities (Beer Sheva, Israel; Hotan, China; Jodhpur, India; Kharga, Egypt; and Las Vegas, NV, USA). Sequential [...] Read more.
We quantified the spatio-temporal patterns of land cover/land use (LCLU) change to document and evaluate the daytime surface urban heat island (SUHI) for five hot subtropical desert cities (Beer Sheva, Israel; Hotan, China; Jodhpur, India; Kharga, Egypt; and Las Vegas, NV, USA). Sequential Landsat images were acquired and classified into the USGS 24-category Land Use Categories using object-based image analysis with an overall accuracy of 80% to 95.5%. We estimated the land surface temperature (LST) of all available Landsat data from June to August for years 1990, 2000, and 2010 and computed the urban-rural difference in the average LST and Normalized Difference Vegetation Index (NDVI) for each city. Leveraging non-parametric statistical analysis, we also investigated the impacts of city size and population on the urban-rural difference in the summer daytime LST and NDVI. Urban expansion is observed for all five cities, but the urbanization pattern varies widely from city to city. A negative SUHI effect or an oasis effect exists for all the cities across all three years, and the amplitude of the oasis effect tends to increase as the urban-rural NDVI difference increases. A strong oasis effect is observed for Hotan and Kharga with evidently larger NDVI difference than the other cities. Larger cities tend to have a weaker cooling effect while a negative association is identified between NDVI difference and population. Understanding the daytime oasis effect of desert cities is vital for sustainable urban planning and the design of adaptive management, providing valuable guidelines to foster smart desert cities in an era of climate variability, uncertainty, and change. Full article
Show Figures

Graphical abstract

20 pages, 9618 KiB  
Article
GDP Spatialization and Economic Differences in South China Based on NPP-VIIRS Nighttime Light Imagery
by Min Zhao 1,2,3, Weiming Cheng 3,4,*, Chenghu Zhou 1,2,3,4, Manchun Li 1,2, Nan Wang 3,5 and Qiangyi Liu 3,5
1 School of Geographic and Oceanographic Sciences, Nanjing University, Nanjing 210023, China
2 Collaborative Innovation Center of South China Sea Studies, Nanjing 210023, China
3 State Key Laboratory of Resources and Environmental Information Systems, Institute of Geographic Sciences and Natural Resources Research, Chinese Academy of Sciences, Beijing 100101, China
4 Jiangsu Center for Collaborative Innovation in Geographic Information Resource Development and Application, Nanjing 210023, China
5 University of Chinese Academy of Sciences, Beijing 100049, China
Remote Sens. 2017, 9(7), 673; https://doi.org/10.3390/rs9070673 - 1 Jul 2017
Cited by 111 | Viewed by 9677
Abstract
Accurate data on gross domestic product (GDP) at pixel level are needed to understand the dynamics of regional economies. GDP spatialization is the basis of quantitative analysis on economic diversities of different administrative divisions and areas with different natural or humanistic attributes. Data [...] Read more.
Accurate data on gross domestic product (GDP) at pixel level are needed to understand the dynamics of regional economies. GDP spatialization is the basis of quantitative analysis on economic diversities of different administrative divisions and areas with different natural or humanistic attributes. Data from the Visible Infrared Imaging Radiometer Suite (VIIRS), carried by the Suomi National Polar-orbiting Partnership (NPP) satellite, are capable of estimating GDP, but few studies have been conducted for mapping GDP at pixel level and further pattern analysis of economic differences in different regions using the VIIRS data. This paper produced a pixel-level (500 m × 500 m) GDP map for South China in 2014 and quantitatively analyzed economic differences among diverse geomorphological types. Based on a regression analysis, the total nighttime light (TNL) of corrected VIIRS data were found to exhibit R2 values of 0.8935 and 0.9243 for prefecture GDP and county GDP, respectively. This demonstrated that TNL showed a more significant capability in reflecting economic status (R2 > 0.88) than other nighttime light indices (R2 < 0.52), and showed quadratic polynomial relationships with GDP rather than simple linear correlations at both prefecture and county levels. The corrected NPP-VIIRS data showed a better fit than the original data, and the estimation at the county level was better than at the prefecture level. The pixel-level GDP map indicated that: (a) economic development in coastal areas was higher than that in inland areas; (b) low altitude plains were the most developed areas, followed by low altitude platforms and low altitude hills; and (c) economic development in middle altitude areas, and low altitude hills and mountains remained to be strengthened. Full article
(This article belongs to the Special Issue Societal and Economic Benefits of Earth Observation Technologies)
Show Figures

Figure 1

17 pages, 13260 KiB  
Article
Attributing Accelerated Summertime Warming in the Southeast United States to Recent Reductions in Aerosol Burden: Indications from Vertically-Resolved Observations
by Mika G. Tosca 1,2,*,†, James Campbell 3, Michael Garay 1, Simone Lolli 4, Felix C. Seidel 1, Jared Marquis 5 and Olga Kalashnikova 1
1 Jet Propulsion Laboratory and California Institute of Technology, Pasadena, CA 91109, USA
2 School of the Art Institute of Chicago (SAIC), Chicago, IL 60603, USA
3 Naval Research Laboratory, Monterey, CA 93943, USA
4 NASA-JCET, University of Maryland, Baltimore Country and NASA Goddard Space Flight Center, Greenbelt, MD 20771, USA
5 University of North Dakota, Grand Forks, ND 58202, USA
Current address: School of the Art Institute of Chicago (SAIC), Chicago, IL, USA.
Remote Sens. 2017, 9(7), 674; https://doi.org/10.3390/rs9070674 - 1 Jul 2017
Cited by 37 | Viewed by 9802
Abstract
During the twentieth century, the southeast United States cooled, in direct contrast with widespread global and hemispheric warming. While the existing literature is divided on the cause of this so-called “warming hole,” anthropogenic aerosols have been hypothesized as playing a primary role in [...] Read more.
During the twentieth century, the southeast United States cooled, in direct contrast with widespread global and hemispheric warming. While the existing literature is divided on the cause of this so-called “warming hole,” anthropogenic aerosols have been hypothesized as playing a primary role in its occurrence. In this study, unique satellite-based observations of aerosol vertical profiles are combined with a one-dimensional radiative transfer model and surface temperature observations to diagnose how major reductions in summertime aerosol burden since 2001 have impacted surface temperatures in the southeast US. We show that a significant improvement in air quality likely contributed to the elimination of the warming hole and acceleration of the positive temperature trend observed in recent years. These reductions coincide with a new EPA rule that was implemented between 2006 and 2010 that revised the fine particulate matter standard downward. Similar to the southeast US in the twentieth century, other regions of the globe may experience masking of long-term warming due to greenhouse gases, especially those with particularly poor air quality. Full article
(This article belongs to the Special Issue Remote Sensing of Atmospheric Pollution)
Show Figures

Figure 1

23 pages, 1435 KiB  
Article
Assessment of Approximations in Aerosol Optical Properties and Vertical Distribution into FLEX Atmospherically-Corrected Surface Reflectance and Retrieved Sun-Induced Fluorescence
by Jorge Vicent *, Neus Sabater, Jochem Verrelst, Luis Alonso and Jose Moreno
Image Processing Laboratory, University of Valencia, 46980 Paterna (Valencia), Spain
Remote Sens. 2017, 9(7), 675; https://doi.org/10.3390/rs9070675 - 4 Jul 2017
Cited by 13 | Viewed by 6607
Abstract
Physically-based atmospheric correction of optical Earth Observation satellite data is used to accurately derive surface biogeophysical parameters free from the atmospheric influence. While water vapor or surface pressure can be univocally characterized, the compensation of aerosol radiometric effects relies on assumptions and parametric [...] Read more.
Physically-based atmospheric correction of optical Earth Observation satellite data is used to accurately derive surface biogeophysical parameters free from the atmospheric influence. While water vapor or surface pressure can be univocally characterized, the compensation of aerosol radiometric effects relies on assumptions and parametric approximations of their properties. To determine the validity of these assumptions and approximations in the atmospheric correction of ESA’s FLEX/Sentinel-3 tandem mission, a systematic error analysis of simulated FLEX data within the O 2 absorption bands was conducted. This paper presents the impact of key aerosol parameters in atmospherically-corrected FLEX surface reflectance and the subsequent Sun-Induced Fluorescence retrieval (SIF). We observed that: (1) a parametric characterization of aerosol scattering effects increases the accuracy of the atmospheric correction with respect to the commonly implemented discretization of aerosol optical properties by aerosol types and (2) the Ångström exponent and the aerosol vertical distribution have a residual influence in the atmospherically-corrected surface reflectance. In conclusion, a multi-parametric aerosol characterization is sufficient for the atmospheric correction of FLEX data (and SIF retrieval) within the mission requirements in nearly 85% (70%) of the cases with average aerosol load conditions. The future development of the FLEX atmospheric correction algorithm would therefore gain from a multi-parametric aerosol characterization based on the synergy of FLEX and Sentinel-3 data. Full article
Show Figures

Graphical abstract

21 pages, 11374 KiB  
Article
AROSICS: An Automated and Robust Open-Source Image Co-Registration Software for Multi-Sensor Satellite Data
by Daniel Scheffler 1,2,*, André Hollstein 1, Hannes Diedrich 1, Karl Segl 1 and Patrick Hostert 2,3
1 Helmholtz Centre Potsdam GFZ German Research Centre for Geosciences, Section Remote Sensing, Telegrafenberg, 14473 Potsdam, Germany
2 Geography Department, Humboldt University Berlin, Unter den Linden 6, 10099 Berlin, Germany
3 Integrated Research Institute on Transformations of Human-Environment Systems (IRI THESys), Humboldt University Berlin, Unter den Linden 6, 10099 Berlin, Germany
Remote Sens. 2017, 9(7), 676; https://doi.org/10.3390/rs9070676 - 1 Jul 2017
Cited by 189 | Viewed by 23048
Abstract
Geospatial co-registration is a mandatory prerequisite when dealing with remote sensing data. Inter- or intra-sensoral misregistration will negatively affect any subsequent image analysis, specifically when processing multi-sensoral or multi-temporal data. In recent decades, many algorithms have been developed to enable manual, semi- or [...] Read more.
Geospatial co-registration is a mandatory prerequisite when dealing with remote sensing data. Inter- or intra-sensoral misregistration will negatively affect any subsequent image analysis, specifically when processing multi-sensoral or multi-temporal data. In recent decades, many algorithms have been developed to enable manual, semi- or fully automatic displacement correction. Especially in the context of big data processing and the development of automated processing chains that aim to be applicable to different remote sensing systems, there is a strong need for efficient, accurate and generally usable co-registration. Here, we present AROSICS (Automated and Robust Open-Source Image Co-Registration Software), a Python-based open-source software including an easy-to-use user interface for automatic detection and correction of sub-pixel misalignments between various remote sensing datasets. It is independent of spatial or spectral characteristics and robust against high degrees of cloud coverage and spectral and temporal land cover dynamics. The co-registration is based on phase correlation for sub-pixel shift estimation in the frequency domain utilizing the Fourier shift theorem in a moving-window manner. A dense grid of spatial shift vectors can be created and automatically filtered by combining various validation and quality estimation metrics. Additionally, the software supports the masking of, e.g., clouds and cloud shadows to exclude such areas from spatial shift detection. The software has been tested on more than 9000 satellite images acquired by different sensors. The results are evaluated exemplarily for two inter-sensoral and two intra-sensoral use cases and show registration results in the sub-pixel range with root mean square error fits around 0.3 pixels and better. Full article
Show Figures

Graphical abstract

22 pages, 4966 KiB  
Article
Power Sensitivity Analysis of Multi-Frequency, Multi-Polarized, Multi-Temporal SAR Data for Soil-Vegetation System Variables Characterization
by Fulvio Capodici 1,*, Antonino Maltese 1, Giuseppe Ciraolo 1, Guido D’Urso 2 and Goffredo La Loggia 1
1 Dipartimento di Ingegneria Civile, Ambientale, Aerospaziale, dei Materiali (DICAM), Università degli Studi di Palermo, Viale delle Scienze bld, 8-90128 Palermo (PA), Italy
2 Dipartimento di Agraria, Università di Napoli “Federico II”, Via Università, 100 I-80055 Portici (NA), Italy
Remote Sens. 2017, 9(7), 677; https://doi.org/10.3390/rs9070677 - 4 Jul 2017
Cited by 8 | Viewed by 5450
Abstract
The knowledge of spatial and temporal variability of soil water content and others soil-vegetation variables (leaf area index, fractional cover) assumes high importance in crop management. Where and when the cloudiness limits the use of optical and thermal remote sensing techniques, synthetic aperture [...] Read more.
The knowledge of spatial and temporal variability of soil water content and others soil-vegetation variables (leaf area index, fractional cover) assumes high importance in crop management. Where and when the cloudiness limits the use of optical and thermal remote sensing techniques, synthetic aperture radar (SAR) imagery has proven to have several advantages (cloud penetration, day/night acquisitions and high spatial resolution). However, measured backscattering is controlled by several factors including SAR configuration (acquisition geometry, frequency and polarization), and target dielectric and geometric properties. Thus, uncertainties arise about the more suitable configuration to be used. With the launch of the ALOS Palsar, Cosmo-Skymed and Sentinel 1 sensors, a dataset of multi-frequency (X, C, L) and multi-polarization (co- and cross-polarizations) images are now available from a virtual constellation; thus, significant issues concerning the retrieval of soil-vegetation variables using SAR are: (i) identifying the more suitable SAR configuration; (ii) understanding the affordability of a multi-frequency approach. In 2006, a vast dataset of both remotely sensed images (SAR and optical/thermal) and in situ data was collected in the framework of the AgriSAR 2006 project funded by ESA and DLR. Flights and sampling have taken place weekly from April to August. In situ data included soil water content, soil roughness, fractional coverage and Leaf Area Index (LAI). SAR airborne data consisted of multi-frequency and multi-polarized SAR images (X, C and L frequencies and HH, HV, VH and VV polarizations). By exploiting this very wide dataset, this paper, explores the capabilities of SAR in describing four of the main soil-vegetation variables (SVV). As a first attempt, backscattering and SVV temporal behaviors are compared (dynamic analysis) and single-channel regressions between backscattering and SVV are analyzed. Remarkably, no significant correlations were found between backscattering and soil roughness (over both bare and vegetated plots), whereas it has been noticed that the contributions of water content of soil underlying the vegetation often did not influence the backscattering (depending on canopy structure and SAR configuration). Most significant regressions were found between backscattering and SVV characterizing the vegetation biomass (fractional cover and LAI). Secondly, the effect of SVV changes on the spatial correlation among SAR channels (accounting for different polarization and/or frequencies) was explored. An inter-channel spatial/temporal correlation analysis is proposed by temporally correlating two-channel spatial correlation and SVV. This novel approach allowed a widening in the number of significant correlations and their strengths by also encompassing the use of SAR data acquired at two different frequencies. Full article
(This article belongs to the Special Issue Calibration and Validation of Synthetic Aperture Radar)
Show Figures

Figure 1

20 pages, 17462 KiB  
Article
Mass Processing of Sentinel-1 Images for Maritime Surveillance
by Carlos Santamaria 1,*, Marlene Alvarez 1, Harm Greidanus 1, Vasileios Syrris 2, Pierre Soille 2 and Pietro Argentieri 1
1 European Commission, Joint Research Centre (JRC), Directorate for Space, Security & Migration, Via E. Fermi 2749, I-21027 Ispra (VA), Italy
2 European Commission, Joint Research Centre (JRC), Directorate for Competences, Via E. Fermi 2749, I-21027 Ispra (VA), Italy
Remote Sens. 2017, 9(7), 678; https://doi.org/10.3390/rs9070678 - 2 Jul 2017
Cited by 59 | Viewed by 10157
Abstract
The free, full and open data policy of the EU’s Copernicus programme has vastly increased the amount of remotely sensed data available to both operational and research activities. However, this huge amount of data calls for new ways of accessing and processing such [...] Read more.
The free, full and open data policy of the EU’s Copernicus programme has vastly increased the amount of remotely sensed data available to both operational and research activities. However, this huge amount of data calls for new ways of accessing and processing such “big data”. This paper focuses on the use of Copernicus’s Sentinel-1 radar satellite for maritime surveillance. It presents a study in which ship positions have been automatically extracted from more than 11,500 Sentinel-1A images collected over the Mediterranean Sea, and compared with ship position reports from the Automatic Identification System (AIS). These images account for almost all the Sentinel-1A acquisitions taken over the area during the two-year period from the start of the operational phase in October 2014 until September 2016. A number of tools and platforms developed at the European Commission’s Joint Research Centre (JRC) that have been used in the study are described in the paper. They are: (1) Search for Unidentified Maritime Objects (SUMO), a tool for ship detection in Synthetic Aperture Radar (SAR) images; (2) the JRC Earth Observation Data and Processing Platform (JEODPP), a platform for efficient storage and processing of large amounts of satellite images; and (3) Blue Hub, a maritime surveillance GIS and data fusion platform. The paper presents the methodology and results of the study, giving insights into the new maritime surveillance knowledge that can be gained by analysing such a large dataset, and the lessons learnt in terms of handling and processing the big dataset. Full article
(This article belongs to the Section Ocean Remote Sensing)
Show Figures

Graphical abstract

24 pages, 17150 KiB  
Article
A Novel Building Type Classification Scheme Based on Integrated LiDAR and High-Resolution Images
by Yuhan Huang 1,2, Li Zhuo 1,3,*, Haiyan Tao 1,3, Qingli Shi 1,3 and Kai Liu 1,3
1 Guangdong Provincial Key Laboratory of Urbanization and Geo-simulation, School of Geography and Planning, Sun Yat-sen University, Guangzhou 510275, China
2 Department of Land, Air and Water Resources, University of California, Davis, CA 95616, USA
3 Center of Integrated Geographic Information Analysis, School of Geography and Planning, Sun Yat-sen University, Guangzhou 510275, China
Remote Sens. 2017, 9(7), 679; https://doi.org/10.3390/rs9070679 - 1 Jul 2017
Cited by 46 | Viewed by 8989
Abstract
Building type information is crucial to many urban studies, including fine-resolution population estimation, urban planning, and management. Although scientists have developed many methods to extract buildings via remote sensing data, only a limited number of them focus on further classification of the extracted [...] Read more.
Building type information is crucial to many urban studies, including fine-resolution population estimation, urban planning, and management. Although scientists have developed many methods to extract buildings via remote sensing data, only a limited number of them focus on further classification of the extracted results. This paper presents a novel building type classification scheme based on the integration of building height information from LiDAR, textural, spectral, and geometric information from high-resolution remote sensing images, and super-object information from the integrated dataset. Building height information is firstly extracted from LiDAR point clouds using a progressive morphological filter and then combined with high-resolution images for object-oriented segmentation. Multi-resolution segmentation of the combined image is performed to collect super-object information, which provides more information for classification in the next step. Finally, the segmentation results, as well as their super-object information, are inputted into the random forest classifier to obtain building type classification results. The classification scheme proposed in this study is tested through applications in two urban village areas, a type of slum-like land use characterized by dense buildings of different types, heights, and sizes, in Guangzhou, China. Segment level classification of the study area and validation area reached accuracies of 80.02% and 76.85%, respectively, while the building-level results reached accuracies of 98.15% and 87.50%, respectively. The results indicate that the proposed building type classification scheme has great potential for application in areas with multiple building types and complex backgrounds. This study also proves that both building height information and super-object information play important roles in building type classification. More accurate results could be obtained by incorporating building height information and super-object information and using the random forest classifier. Full article
(This article belongs to the Special Issue Remote Sensing for 3D Urban Morphology)
Show Figures

Graphical abstract

19 pages, 68400 KiB  
Article
Road Segmentation of Remotely-Sensed Images Using Deep Convolutional Neural Networks with Landscape Metrics and Conditional Random Fields
by Teerapong Panboonyuen 1, Kulsawasd Jitkajornwanich 2, Siam Lawawirojwong 3, Panu Srestasathiern 3 and Peerapon Vateekul 1,*
1 Chulalongkorn University Big Data Analytics and IoT Center (CUBIC), Department of Computer Engineering, Faculty of Engineering, Chulalongkorn University, Phayathai Rd., Pathumwan, Bangkok 10330, Thailand
2 Data Science and Computational Intelligence (DSCI) Laboratory, Department of Computer Science, Faculty of Science, King Mongkut’s Institute of Technology Ladkrabang, Chalongkrung Rd., Ladkrabang, Bangkok 10520, Thailand
3 Geo-Informatics and Space Technology Development Agency (Public Organization), 120, The Government Complex, Chaeng Wattana Rd., Lak Si, Bangkok 10210, Thailand
Remote Sens. 2017, 9(7), 680; https://doi.org/10.3390/rs9070680 - 1 Jul 2017
Cited by 118 | Viewed by 14582
Abstract
Object segmentation of remotely-sensed aerial (or very-high resolution, VHS) images and satellite (or high-resolution, HR) images, has been applied to many application domains, especially in road extraction in which the segmented objects are served as a mandatory layer in geospatial databases. Several attempts [...] Read more.
Object segmentation of remotely-sensed aerial (or very-high resolution, VHS) images and satellite (or high-resolution, HR) images, has been applied to many application domains, especially in road extraction in which the segmented objects are served as a mandatory layer in geospatial databases. Several attempts at applying the deep convolutional neural network (DCNN) to extract roads from remote sensing images have been made; however, the accuracy is still limited. In this paper, we present an enhanced DCNN framework specifically tailored for road extraction of remote sensing images by applying landscape metrics (LMs) and conditional random fields (CRFs). To improve the DCNN, a modern activation function called the exponential linear unit (ELU), is employed in our network, resulting in a higher number of, and yet more accurate, extracted roads. To further reduce falsely classified road objects, a solution based on an adoption of LMs is proposed. Finally, to sharpen the extracted roads, a CRF method is added to our framework. The experiments were conducted on Massachusetts road aerial imagery as well as the Thailand Earth Observation System (THEOS) satellite imagery data sets. The results showed that our proposed framework outperformed Segnet, a state-of-the-art object segmentation technique, on any kinds of remote sensing imagery, in most of the cases in terms of precision, recall, and F 1 . Full article
(This article belongs to the Special Issue Learning to Understand Remote Sensing Images)
Show Figures

Graphical abstract

15 pages, 4169 KiB  
Article
Predicting Vascular Plant Diversity in Anthropogenic Peatlands: Comparison of Modeling Methods with Free Satellite Data
by Ivan Castillo-Riffart 1, Mauricio Galleguillos 1,2,*, Javier Lopatin 3 and And Jorge F. Perez-Quezada 1,4
1 Department of Environmental Science and Renewable Natural Resources, University of Chile, Casilla 1004, 8820808 Santiago, Chile
2 Center for Climate Resilience Research (CR)2, University of Chile, 8370449 Santiago, Chile
3 Institute of Geography and Geoecology, Karlsruhe Institute of Technology (KIT), Kaiserstraße 12, 76131 Karlsruhe, Germany
4 Institute of Ecology and Biodiversity, Las Palmeras 3425, 7800003 Santiago, Chile
Remote Sens. 2017, 9(7), 681; https://doi.org/10.3390/rs9070681 - 2 Jul 2017
Cited by 22 | Viewed by 5922
Abstract
Peatlands are ecosystems of great relevance, because they have an important number of ecological functions that provide many services to mankind. However, studies focusing on plant diversity, addressed from the remote sensing perspective, are still scarce in these environments. In the present study, [...] Read more.
Peatlands are ecosystems of great relevance, because they have an important number of ecological functions that provide many services to mankind. However, studies focusing on plant diversity, addressed from the remote sensing perspective, are still scarce in these environments. In the present study, predictions of vascular plant richness and diversity were performed in three anthropogenic peatlands on Chiloé Island, Chile, using free satellite data from the sensors OLI, ASTER, and MSI. Also, we compared the suitability of these sensors using two modeling methods: random forest (RF) and the generalized linear model (GLM). As predictors for the empirical models, we used the spectral bands, vegetation indices and textural metrics. Variable importance was estimated using recursive feature elimination (RFE). Fourteen out of the 17 predictors chosen by RFE were textural metrics, demonstrating the importance of the spatial context to predict species richness and diversity. Non-significant differences were found between the algorithms; however, the GLM models often showed slightly better results than the RF. Predictions obtained by the different satellite sensors did not show significant differences; nevertheless, the best models were obtained with ASTER (richness: R2 = 0.62 and %RMSE = 17.2, diversity: R2 = 0.71 and %RMSE = 20.2, obtained with RF and GLM respectively), followed by OLI and MSI. Diversity obtained higher accuracies than richness; nonetheless, accurate predictions were achieved for both, demonstrating the potential of free satellite data for the prediction of relevant community characteristics in anthropogenic peatland ecosystems. Full article
Show Figures

Graphical abstract

23 pages, 8448 KiB  
Article
Reconstructing Historical Land Cover Type and Complexity by Synergistic Use of Landsat Multispectral Scanner and CORONA
by Amir Reza Shahtahmassebi 1,*, Yue Lin 1, Lin Lin 1, Peter M. Atkinson 2, Nathan Moore 3, Ke Wang 1,*, Shan He 1, Lingyan Huang 1, Jiexia Wu 4, Zhangquan Shen 1, Muye Gan 1, Xinyu Zheng 1, Yue Su 1, Hongfen Teng 1, Xiaoyan Li 5, Jinsong Deng 1, Yuanyuan Sun 1 and Mengzhu Zhao 1
1 Institute of Agricultural Remote Sensing and Information Technology, College of Environment and Natural Resource, Zhejiang University, Hangzhou 310058, China
2 Faculty of Science and Technology, Lancaster University, Bailrigg, Lancaster LA1 4YQ, UK
3 Department of Geography, Michigan State University, East Lansing, MI 48823, USA
4 Department of atmospheric oceanic and earth science, George Mason University, VA 22030, USA
5 Department of Earth Science, Jilin University, Changchun 130061, China
Remote Sens. 2017, 9(7), 682; https://doi.org/10.3390/rs9070682 - 3 Jul 2017
Cited by 22 | Viewed by 6330
Abstract
Survey data describing land cover information such as type and diversity over several decades are scarce. Therefore, our capacity to reconstruct historical land cover using field data and archived remotely sensed data over large areas and long periods of time is somewhat limited. [...] Read more.
Survey data describing land cover information such as type and diversity over several decades are scarce. Therefore, our capacity to reconstruct historical land cover using field data and archived remotely sensed data over large areas and long periods of time is somewhat limited. This study explores the relationship between CORONA texture—a surrogate for actual land cover type and complexity—with spectral vegetation indices and texture variables derived from Landsat MSS under the Spectral Variation Hypothesis (SVH) such as to reconstruct historical continuous land cover type and complexity. Image texture of CORONA was calculated using a mean occurrence measure while image textures of Landsat MSS were calculated by occurrence and co-occurrence measures. The relationship between these variables was evaluated using correlation and regression techniques. The reconstruction procedure was undertaken through regression kriging. The results showed that, as expected, texture based on the visible bands and corresponding indices indicated larger correlation with CORONA texture, a surrogate of land cover (correlation >0.65). In terms of prediction, the combination of the first-order mean of band green, second-order measure of tasseled cap brightness, second-order mean of Normalized Visible Index (NVI) and second-order entropy of NIR yielded the best model with respect to Akaike’s Information Criterion (AIC), r-square, and variance inflation factors (VIF). The regression model was then used in regression kriging to map historical continuous land cover. The resultant maps indicated the type and degree of complexity in land cover. Moreover, the proposed methodology minimized the impacts of topographic shadow in the region. The performance of this approach was compared with two conventional classification methods: hard classifiers and continuous classifiers. In contrast to conventional techniques, the technique could clearly quantify land cover complexity and type. Future applications of CORONA datasets such as this one could include: improved quality of CORONA imagery, studies of the CORONA texture measures for extracting ecological parameters (e.g., species distributions), change detection and super resolution mapping using CORONA and Landsat MSS. Full article
Show Figures

Graphical abstract

24 pages, 11401 KiB  
Article
Remote Sensing of Spatiotemporal Changes in Wetland Geomorphology Based on Type 2 Fuzzy Sets: A Case Study of Beidagang Wetland from 1975 to 2015
by Hongyuan Huo 1, Jifa Guo 2,*, Zhao-Liang Li 1,3 and Xiaoguang Jiang 4
1 Key Laboratory of Agricultural Remote Sensing, Ministry of Agriculture/Institute of Agricultural Resources and Regional Planning, Chinese Agricultural Academy of Sciences, Beijing 100081, China
2 College of Urban and Environmental Sciences, Tianjin Key Laboratory of Water Resources and Environment, Tianjin Normal University, Tianjin 300387, China
3 ICube, CNRS, Université de Strasbourg, 300 Boulevard Sébastien Brant, CS10413, 67412 Illkirch, France
4 College of Resources and Environment, University of Chinese Academy of Sciences, Beijing 100049, China
Remote Sens. 2017, 9(7), 683; https://doi.org/10.3390/rs9070683 - 4 Jul 2017
Cited by 11 | Viewed by 4926
Abstract
Few studies have considered the spatiotemporal changes in wetland land cover based on type 2 fuzzy sets using long-term series of remotely sensed data. This paper presents an improved interval type 2 fuzzy c-means (IT2FCM*) approach to analyse the spatial and temporal changes [...] Read more.
Few studies have considered the spatiotemporal changes in wetland land cover based on type 2 fuzzy sets using long-term series of remotely sensed data. This paper presents an improved interval type 2 fuzzy c-means (IT2FCM*) approach to analyse the spatial and temporal changes in the geomorphology of the Beidagang wetland in North China from 1975 to 2015 based on long-term Landsat data. Unlike traditional type 1 fuzzy c-means methods, the IT2FCM* algorithm based on interval type-2 fuzzy set has an ability to better handle the spectral uncertainty. Four indexes were adopted to validate the separability of classes with the IT2FCM* algorithm. These four validity indexes showed that IT2FCM* obtained better results than traditional methods. Additionally, the accuracy of the classification results was assessed based on the confusion matrix and kappa coefficient, which were high for the analysis of wetland landscape changes. Based on the analysis of separability of classes with the IT2FCM* algorithm using four validity indexes, the classification results, and the membership value images, the long-term series of satellite datasets were processed using the IT2FCM* method, and the study area was classified into six classes. Because water resources and vegetation are two key wetland components, the water resource dynamics and vegetation dynamics, based on the normalized difference vegetation index (NDVI), were analysed in detail according to the spatiotemporal classification results. The results show that the changes in vegetation types have historically been associated with water resource variations and that water resources play an important role in the evolution of vegetation types. Full article
Show Figures

Figure 1

23 pages, 10951 KiB  
Article
Multiple Regression Analysis for Unmixing of Surface Temperature Data in an Urban Environment
by Andreas Wicki * and Eberhard Parlow
Department of Environmental Sciences, University of Basel, CH-4056 Basel, Switzerland
Remote Sens. 2017, 9(7), 684; https://doi.org/10.3390/rs9070684 - 4 Jul 2017
Cited by 41 | Viewed by 10019
Abstract
Global climate change and increasing urbanization worldwide intensify the need for a better understanding of human heat stress dynamics in urban systems. During heat waves, which are expected to increase in number and intensity, the development of urban cool islands could be a [...] Read more.
Global climate change and increasing urbanization worldwide intensify the need for a better understanding of human heat stress dynamics in urban systems. During heat waves, which are expected to increase in number and intensity, the development of urban cool islands could be a lifesaver for many elderly and vulnerable people. The use of remote sensing data offers the unique possibility to study these dynamics with spatially distributed large datasets during all seasons of the year and including day and night-time analysis. For the city of Basel 32 high-quality Landsat 8 (L8) scenes are available since 2013, enabling comprehensive statistical analysis. Therefore, land surface temperature (LST) is calculated using L8 thermal infrared (TIR) imagery (stray light corrected) applying improved emissivity and atmospheric corrections. The data are combined with a land use/land cover (LULC) map and evaluated using administrative residential units. The observed dependence of LST on LULC is analyzed using a thermal unmixing approach based on a multiple linear regression (MLR) model, which allows for quantifying the gradual influence of different LULC types on the LST precisely. Seasonal variations due to different solar irradiance and vegetation cover indicate a higher dependence of LST on the LULC during the warmer summer months and an increasing influence of the topography and albedo during the colder seasons. Furthermore, the MLR analysis allows creating predicted LST images, which can be used to fill data gaps like in SLC-off Landsat 7 ETM+ data. Full article
Show Figures

Graphical abstract

19 pages, 5703 KiB  
Article
Detection of Tropical Overshooting Cloud Tops Using Himawari-8 Imagery
by Miae Kim 1, Jungho Im 1,*, Haemi Park 1, Seonyoung Park 1, Myong-In Lee 1 and Myoung-Hwan Ahn 2
1 School of Urban and Environmental Engineering, Ulsan National Institute of Science and Technology, Ulsan 44919, Korea
2 Department of Atmospheric Science, Ewha Woman’s University, Seoul 03760, Korea
Remote Sens. 2017, 9(7), 685; https://doi.org/10.3390/rs9070685 - 4 Jul 2017
Cited by 28 | Viewed by 8214
Abstract
Abstract: Overshooting convective cloud Top (OT)-accompanied clouds can cause severe weather conditions, such as lightning, strong winds, and heavy rainfall. The distribution and behavior of OTs can affect regional and global climate systems. In this paper, we propose a new approach for [...] Read more.
Abstract: Overshooting convective cloud Top (OT)-accompanied clouds can cause severe weather conditions, such as lightning, strong winds, and heavy rainfall. The distribution and behavior of OTs can affect regional and global climate systems. In this paper, we propose a new approach for OT detection by using machine learning methods with multiple infrared images and their derived features. Himawari-8 satellite images were used as the main input data, and binary detection (OT or nonOT) with class probability was the output of the machine learning models. Three machine learning techniques—random forest (RF), extremely randomized trees (ERT), and logistic regression (LR)—were used to develop OT classification models to distinguish OT from non-OT. The hindcast validation over the Southeast Asia and West Pacific regions showed that RF performed best, resulting in a mean probabilities of detection (POD) of 77.06% and a mean false alarm ratio (FAR) of 36.13%. Brightness temperature at 11.2 μm (Tb11) and its standard deviation (STD) in a 3 × 3 window size were identified as the most contributing variables for discriminating OT and nonOT classes. The proposed machine learning-based OT detection algorithms produced promising results comparable to or even better than the existing approaches, which are the infrared window (IRW)-texture and water vapor (WV) minus IRW brightness temperature difference (BTD) methods. Full article
(This article belongs to the Section Atmospheric Remote Sensing)
Show Figures

Graphical abstract

24 pages, 12421 KiB  
Article
Aerosol Property Retrieval Algorithm over Northeast Asia from TANSO-CAI Measurements Onboard GOSAT
by Sanghee Lee 1,2, Mijin Kim 1, Myungje Choi 1, Sujung Go 1, Jhoon Kim 1,3,*, Jung-Hyun Kim 1, Hyun-Kwang Lim 1, Ukkyo Jeong 1,4,5, Tae-Young Goo 6, Akihiko Kuze 7, Kei Shiomi 7 and Yokota Tatsuya 8
1 Department of Atmospheric Science, Yonsei University, 50 Yonsei-ro, Seodaemun-gu, Seoul 03722, Korea
2 Meteorological Observation Laboratory, Weather Information Service Engine, Hankuk University of Foreign Studies, Yongin-si, Gyeonggi-do 17035, Korea
3 Harvard Smithsonian Center for Astrophysics, Cambridge, MA 02138, USA
4 Goddard Space Flight Center, National Aeronautics and Space Administration, Greenbelt, MD 20771, USA
5 Earth System Science Interdisciplinary Center, University of Maryland, College Park, MD 20740, USA
6 Global Environment System Research Division, National Institute of Meteorological Sciences, Korea Meteorological Administration, Jeju 63568, Korea
7 Earth Observation Research Center, Japan Aerospace Exploration Agency, Tsukuba 305-8505, Japan
8 Center for Global Environmental Research, National Institute for Environmental Studies, Tsukuba 305-8505, Japan
Remote Sens. 2017, 9(7), 687; https://doi.org/10.3390/rs9070687 - 5 Jul 2017
Cited by 5 | Viewed by 4825
Abstract
The presence of aerosol has resulted in serious limitations in the data coverage and large uncertainties in retrieving carbon dioxide (CO2) amounts from satellite measurements. For this reason, an aerosol retrieval algorithm was developed for the Thermal and Near-infrared Sensor for [...] Read more.
The presence of aerosol has resulted in serious limitations in the data coverage and large uncertainties in retrieving carbon dioxide (CO2) amounts from satellite measurements. For this reason, an aerosol retrieval algorithm was developed for the Thermal and Near-infrared Sensor for carbon Observation-Cloud and Aerosol Imager (TANSO-CAI) launched in January 2009 on board the Greenhouse Gases Observing Satellite (GOSAT). The algorithm retrieves aerosol optical depth (AOD), aerosol size information, and aerosol type in 0.1° grid resolution by look-up tables constructed using inversion products from Aerosol Robotic NETwork (AERONET) sun-photometer observation over Northeast Asia as a priori information. To improve the accuracy of the TANSO-CAI aerosol algorithm, we consider both seasonal and annual estimated radiometric degradation factors of TANSO-CAI in this study. Surface reflectance is determined by the same 23-path composite method of Rayleigh and gas corrected reflectance to avoid the stripes of each band. To distinguish aerosol absorptivity, reflectance difference test between ultraviolet (band 1) and visible (band 2) wavelengths depending on AODs was used. To remove clouds in aerosol retrieval, the normalized difference vegetation index and ratio of reflectance between band 2 (0.674 μm) and band 3 (0.870 μm) threshold tests have been applied. To mask turbid water over ocean, a threshold test for the estimated surface reflectance at band 2 was also introduced. The TANSO-CAI aerosol algorithm provides aerosol properties such as AOD, size information and aerosol types from June 2009 to December 2013 in this study. Here, we focused on the algorithm improvement for AOD retrievals and their validation in this study. The retrieved AODs were compared with those from AERONET and the Aqua/MODerate resolution Imaging Sensor (MODIS) Collection 6 Level 2 dataset over land and ocean. Comparisons of AODs between AERONET and TANSO-CAI over Northeast Asia showed good agreement with correlation coefficient (R) 0.739 ± 0.046, root mean square error (RMSE) 0.232 ± 0.047, and linear regression line slope 0.960 ± 0.083 for the entire period. Over ocean, the comparisons between Aqua/MODIS and TANSO-CAI for the same period over Northeast Asia showed improved consistency, with correlation coefficient 0.830 ± 0.047, RMSE 0.140 ± 0.019, and linear regression line slope 1.226 ± 0.063 for the entire period. Over land, however, the comparisons between Aqua/MODIS and TANSO-CAI show relatively lower correlation (approximate R = 0.67, RMSE = 0.40, slope = 0.77) than those over ocean. In order to improve accuracy in retrieving CO2 amounts, the retrieved aerosol properties in this study have been provided as input for CO2 retrieval with GOSAT TANSO-Fourier Transform Spectrometer measurements. Full article
(This article belongs to the Section Atmospheric Remote Sensing)
Show Figures

Graphical abstract

24 pages, 5515 KiB  
Article
Object-Based Classification of Grasslands from High Resolution Satellite Image Time Series Using Gaussian Mean Map Kernels
by Mailys Lopes 1,*, Mathieu Fauvel 1, Stéphane Girard 2 and David Sheeren 1
1 Dynafor, University of Toulouse, INRA, INPT, INPT-EI PURPAN, 31326 Castanet Tolosan, France
2 Team Mistis, INRIA Rhône-Alpes, LJK, 38334 Montbonnot, France
Remote Sens. 2017, 9(7), 688; https://doi.org/10.3390/rs9070688 - 4 Jul 2017
Cited by 22 | Viewed by 5949
Abstract
This paper deals with the classification of grasslands using high resolution satellite image time series. Grasslands considered in this work are semi-natural elements in fragmented landscapes, i.e., they are heterogeneous and small elements. The first contribution of this study is to account for [...] Read more.
This paper deals with the classification of grasslands using high resolution satellite image time series. Grasslands considered in this work are semi-natural elements in fragmented landscapes, i.e., they are heterogeneous and small elements. The first contribution of this study is to account for grassland heterogeneity while working at the object level by modeling its pixels distributions by a Gaussian distribution. To measure the similarity between two grasslands, a new kernel is proposed as a second contribution: the α -Gaussian mean kernel. It allows one to weight the influence of the covariance matrix when comparing two Gaussian distributions. This kernel is introduced in support vector machines for the supervised classification of grasslands from southwest France. A dense intra-annual multispectral time series of the Formosat-2 satellite is used for the classification of grasslands’ management practices, while an inter-annual NDVI time series of Formosat-2 is used for old and young grasslands’ discrimination. Results are compared to other existing pixel- and object-based approaches in terms of classification accuracy and processing time. The proposed method is shown to be a good compromise between processing speed and classification accuracy. It can adapt to the classification constraints, and it encompasses several similarity measures known in the literature. It is appropriate for the classification of small and heterogeneous objects such as grasslands. Full article
(This article belongs to the Section Remote Sensing in Agriculture and Vegetation)
Show Figures

Graphical abstract

19 pages, 9337 KiB  
Article
Response of Land Surface Phenology to Variation in Tree Cover during Green-Up and Senescence Periods in the Semi-Arid Savanna of Southern Africa
by Moses A. Cho 1,2,*, Abel Ramoelo 1,3 and Luthando Dziba 1
1 Natural Resources and Environment Unit, The Council for Scientific and Industrial Research (CSIR), P.O. Box 395, Pretoria 0001, South Africa
2 Department of Plant and Soil Science, University of Pretoria, Pretoria 0002, South Africa
3 Risk and Vulnerability Assessment Centre, University of Limpopo, Sovenga 0727, South Africa
Remote Sens. 2017, 9(7), 689; https://doi.org/10.3390/rs9070689 - 4 Jul 2017
Cited by 34 | Viewed by 5296
Abstract
Understanding the spatio-temporal dynamics of land surface phenology is important to understanding changes in landscape ecological processes of semi-arid savannas in Southern Africa. The aim of the study was to determine the influence of variation in tree cover percentage on land surface [...] Read more.
Understanding the spatio-temporal dynamics of land surface phenology is important to understanding changes in landscape ecological processes of semi-arid savannas in Southern Africa. The aim of the study was to determine the influence of variation in tree cover percentage on land surface phenological response in the semi-arid savanna of Southern Africa. Various land surface phenological metrics for the green-up and senescing periods of the vegetation were retrieved from leaf index area (LAI) seasonal time series (2001 to 2015) maps for a study region in South Africa. Tree cover (%) data for 100 randomly selected polygons grouped into three tree cover classes, low (<20%, n = 44), medium (20–40%, n = 22) and high (>40%, n = 34), were used to determine the influence of varying tree cover (%) on the phenological metrics by means of the t-test. The differences in the means between tree cover classes were statistically significant (t-test p < 0.05) for the senescence period metrics but not for the green-up period metrics. The categorical data results were supported by regression results involving tree cover and the various phenological metrics, where tree cover (%) explained 40% of the variance in day of the year at end of growing season compared to 3% for the start of the growing season. An analysis of the impact of rainfall on the land surface phenological metrics showed that rainfall influences the green-up period metrics but not the senescence period metrics. Quantifying the contribution of tree cover to the day of the year at end of growing season could be important in the assessment of the spatial variability of a savanna ecological process such as the risk of fire spread with time. Full article
Show Figures

Graphical abstract

10 pages, 3702 KiB  
Article
Effect of Solar-Cloud-Satellite Geometry on Land Surface Shortwave Radiation Derived from Remotely Sensed Data
by Tianxing Wang 1,*, Jiancheng Shi 1, Letu Husi 1, Tianjie Zhao 1, Dabin Ji 1, Chuan Xiong 1 and Bo Gao 2
1 State Key Laboratory of Remote Sensing Science, Institute of Remote Sensing and Digital Earth, Chinese Academy of Sciences, Beijing 100101, China
2 Beijing Laboratory of Water Resources Security, Capital Normal University, Beijing 100048, China, gaobo@irsa.ac.cn
Remote Sens. 2017, 9(7), 690; https://doi.org/10.3390/rs9070690 - 5 Jul 2017
Cited by 32 | Viewed by 7857
Abstract
Clouds and their associated shadows are major obstacles to most land surface remote sensing applications. Meanwhile, solar-cloud-satellite geometry (SCSG) makes the effect of clouds and shadows on derived land surface biophysical parameters more complicated. However, in most existing studies, the SCSG effect has [...] Read more.
Clouds and their associated shadows are major obstacles to most land surface remote sensing applications. Meanwhile, solar-cloud-satellite geometry (SCSG) makes the effect of clouds and shadows on derived land surface biophysical parameters more complicated. However, in most existing studies, the SCSG effect has been frequently neglected although it is pointed out by many works that SCSG effect is a noticeable problem, especially in the field of land surface radiation budget. Taking shortwave downward radiation (SWDR) as a testing variable, this study quantified the SCSG effect on the derived SWDR, and proposed an operational scheme to correct the big effect. The results demonstrate that the proposed correcting scheme is very effective and works very well. It is revealed that a significant under- or overestimation is detected in retrieved SWDR if the SCSG effect is ignored. Typically, the induced error in SWDR can reach up to 80%. The scheme and findings of this study are expected to be inspirational for the land surface remote sensing community, wherein solar-cloud-satellite geometry is an unavoidable issue. Full article
(This article belongs to the Special Issue Quantitative Remote Sensing of Land Surface Variables)
Show Figures

Graphical abstract

18 pages, 2875 KiB  
Article
Parallel Seasonal Patterns of Photosynthesis, Fluorescence, and Reflectance Indices in Boreal Trees
by Kyle R. Springer 1,*, Ran Wang 2 and John A. Gamon 1,2,3,*
1 Department of Biological Sciences, University of Alberta, Edmonton, AB T6G 2E9, Canada
2 Department of Earth and Atmospheric Sciences, University of Alberta, Edmonton, AB T6G 2E3, Canada
3 School of Natural Resources, University of Nebraska, Lincoln, NE 68583, USA
Remote Sens. 2017, 9(7), 691; https://doi.org/10.3390/rs9070691 - 5 Jul 2017
Cited by 66 | Viewed by 8492
Abstract
Tree species in the boreal forest cycle between periods of active growth and dormancy alter their photosynthetic processes in response to changing environmental conditions. For deciduous species, these changes are readily visible, while evergreen species have subtler foliar changes during seasonal transitions. In [...] Read more.
Tree species in the boreal forest cycle between periods of active growth and dormancy alter their photosynthetic processes in response to changing environmental conditions. For deciduous species, these changes are readily visible, while evergreen species have subtler foliar changes during seasonal transitions. In this study, we used remotely sensed optical indices to observe seasonal changes in photosynthetic activity, or photosynthetic phenology, of six boreal tree species. We evaluated the normalized difference vegetation index (NDVI), the photochemical reflectance index (PRI), the chlorophyll/carotenoid index (CCI), and steady-state chlorophyll fluorescence (FS) as a measure of solar-induced fluorescence (SIF), and compared these optical metrics to gas exchange to determine their efficacy in detecting seasonal changes in plant photosynthetic activity. The NDVI and PRI exhibited complementary responses. The NDVI paralleled photosynthetic phenology in deciduous species, but not in evergreens. The PRI closely paralleled photosynthetic activity in evergreens, but less so in deciduous species. The CCI and FS tracked photosynthetic phenology in both deciduous and evergreen species. The seasonal patterns of optical metrics and photosynthetic activity revealed subtle differences across and within functional groups. With the CCI and fluorescence becoming available from satellite sensors, they offer new opportunities for assessing photosynthetic phenology, particularly for evergreen species, which have been difficult to assess with previous methods. Full article
Show Figures

Graphical abstract

18 pages, 2437 KiB  
Article
Assessment and Improvement of MISR Angstrom Exponent and Single-Scattering Albedo Products Using AERONET Data in China
by Yidan Si 1,2, Shenshen Li 1,*, Liangfu Chen 1, Huazhe Shang 1,*, Lei Wang 3 and Husi Letu 1
1 State Key Laboratory of Remote Sensing Science, Institute of Remote Sensing and Digital Earth, Chinese Academy of Sciences, Beijing 100101, China
2 University of the Chinese Academy of Sciences, Beijing 100049, China
3 School of Computer and Information Engineering, Henan University, Kaifeng 475004, China
Remote Sens. 2017, 9(7), 693; https://doi.org/10.3390/rs9070693 - 5 Jul 2017
Cited by 13 | Viewed by 5136
Abstract
Mapping the components, size, and absorbing/scattering properties of particle pollution is of great interest in the environmental and public health fields. Although the Multi-angle Imaging SpectroRadiometer (MISR) can detect a greater number of aerosol microphysical properties than most other spaceborne sensors, the Angstrom [...] Read more.
Mapping the components, size, and absorbing/scattering properties of particle pollution is of great interest in the environmental and public health fields. Although the Multi-angle Imaging SpectroRadiometer (MISR) can detect a greater number of aerosol microphysical properties than most other spaceborne sensors, the Angstrom exponent (AE) and single-scattering albedo (SSA) products are not widely utilized or as robust as the aerosol optical depth (AOD) product. This study focused on validating MISR AE and SSA data using AErosol RObotic NETwork (AERONET) data for China from 2004 to 2014. The national mean value of the MISR data (1.08) was 0.095 lower than that of the AERONET data. However, the MISR SSA average (0.99) was significantly higher than that of AERONET (0.89). In this study, we developed a method to improve the AE and SSA by narrowing the selection of MISR mixtures via the introduction of the following group thresholds obtained from an 11-year AERONET dataset: minimum and maximum values (for the method of MISR_Imp_All) and the top 10% and bottom 10% of the averaged values (for MISR_Imp_10%). Overall, our improved AE values were closer to the AERONET AE values, and additional samples (MISR_Imp_All: 28.04% and 64.72%, MISR_Imp_10%: 34.11% and 73.13%) had absolute differences of less than 0.1 and 0.3 (defined by the expected error tests, e.g., EE_0.1) compared with the original MISR product (18.46% and 50.23%). For the SSA product, our method also improved the mean, EE_0.05, and EE_0.1 from 0.99, 16.13%, and 56.45% (MISR original product) to 0.96, 40.32%, and 70.97% (MISR_Imp_All), and 0.94, 54.84%, and 90.32% (MISR_Imp_10%), respectively. Full article
(This article belongs to the Section Atmospheric Remote Sensing)
Show Figures

Figure 1

9 pages, 2575 KiB  
Communication
An NDVI-Based Vegetation Phenology Is Improved to be More Consistent with Photosynthesis Dynamics through Applying a Light Use Efficiency Model over Boreal High-Latitude Forests
by Siheng Wang 1,2, Lifu Zhang 1,*, Changping Huang 1,* and Na Qiao 1,2
1 The State Key Laboratory of Remote Sensing Science, Institute of Remote Sensing and Digital Earth, Chinese Academy of Sciences, Beijing 100101, China
2 University of Chinese Academy of Sciences, Beijing 100049, China
Remote Sens. 2017, 9(7), 695; https://doi.org/10.3390/rs9070695 - 6 Jul 2017
Cited by 43 | Viewed by 7355
Abstract
Remote sensing of high-latitude forests phenology is essential for understanding the global carbon cycle and the response of vegetation to climate change. The normalized difference vegetation index (NDVI) has long been used to study boreal evergreen needleleaf forests (ENF) and deciduous broadleaf forests. [...] Read more.
Remote sensing of high-latitude forests phenology is essential for understanding the global carbon cycle and the response of vegetation to climate change. The normalized difference vegetation index (NDVI) has long been used to study boreal evergreen needleleaf forests (ENF) and deciduous broadleaf forests. However, the NDVI-based growing season is generally reported to be longer than that based on gross primary production (GPP), which can be attributed to the difference between greenness and photosynthesis. Instead of introducing environmental factors such as land surface or air temperature like previous studies, this study attempts to make VI-based phenology more consistent with photosynthesis dynamics through applying a light use efficiency model. NDVI (MOD13C2) was used as a proxy for both fractional of absorbed photosynthetically active radiation (APAR) and light use efficiency at seasonal time scale. Results show that VI-based phenology is improved towards tracking seasonal GPP changes more precisely after applying the light use efficiency model compared to raw NDVI or APAR, especially over ENF. Full article
(This article belongs to the Section Forest Remote Sensing)
Show Figures

Graphical abstract

20 pages, 3664 KiB  
Article
Fusion of Multispectral Imagery and Spectrometer Data in UAV Remote Sensing
by Chuiqing Zeng 1,*, Douglas J. King 1, Murray Richardson 1 and Bo Shan 2
1 Department of Geography and Environmental Studies, Carleton University, 1125 Colonel By Dr., Ottawa, ON K1S 5B6, Canada
2 A&L Canada Laboratories, 2136 Jetstream Rd., London, ON N5V 3P5, Canada
Remote Sens. 2017, 9(7), 696; https://doi.org/10.3390/rs9070696 - 6 Jul 2017
Cited by 39 | Viewed by 12712
Abstract
Abstract: High spatial resolution hyperspectral data often used in precision farming applications are not available from current satellite sensors, and difficult or expensive to acquire from standard aircraft. Alternatively, in precision farming, unmanned aerial vehicles (UAVs) are emerging as lower cost and [...] Read more.
Abstract: High spatial resolution hyperspectral data often used in precision farming applications are not available from current satellite sensors, and difficult or expensive to acquire from standard aircraft. Alternatively, in precision farming, unmanned aerial vehicles (UAVs) are emerging as lower cost and more flexible means to acquire very high resolution imagery. Miniaturized hyperspectral sensors have been developed for UAVs, but the sensors, associated hardware, and data processing software are still cost prohibitive for use by individual farmers or small remote sensing firms. This study simulated hyperspectral image data by fusing multispectral camera imagery and spectrometer data. We mounted a multispectral camera and spectrometer, both being low cost and low weight, on a standard UAV and developed procedures for their precise data alignment, followed by fusion of the spectrometer data with the image data to produce estimated spectra for all the multispectral camera image pixels. To align the data collected from the two sensors in both the time and space domains, a post-acquisition correlation-based global optimization method was used. Data fusion, to estimate hyperspectral reflectance, was implemented using several methods for comparison. Flight data from two crop sites, one being tomatoes, and the other corn and soybeans, were used to evaluate the alignment procedure and the data fusion results. The data alignment procedure resulted in a peak R2 between the spectrometer and camera data of 0.95 and 0.72, respectively, for the two test sites. The corresponding multispectral camera data for these space and time offsets were taken as the best match to a given spectrometer reading, and used in modelling to estimate hyperspectral imagery from the multispectral camera pixel data. Of the fusion approaches evaluated, principal component analysis (PCA) based models and Bayesian imputation reached a similar accuracy, and outperformed simple spline interpolation. Mean absolute error (MAE) between predicted and observed spectra was 17% relative to the mean of the observed spectra, and root mean squared error (RMSE) was 0.028. This approach to deriving estimated hyperspectral image data can be applied in a simple fashion at very low cost for crop assessment and monitoring within individual fields. Full article
Show Figures

Graphical abstract

14 pages, 49158 KiB  
Article
Wavelet-Based Topographic Effect Compensation in Accurate Mountain Glacier Velocity Extraction: A Case Study of the Muztagh Ata Region, Eastern Pamir
by Shiyong Yan 1, Yi Li 1, Zhixing Ruan 2, Mingyang Lv 2, Guang Liu 2,* and Kazhong Deng 1
1 Jiangsu Key Laboratory of Resources and Environmental Engineering, School of Environment Science and Spatial Informatics, China University of Mining and Technology, Xuzhou 221116, China
2 Key Laboratory of Digital Earth Science, Institute of Remote Sensing and Digital Earth, Chinese Academy of Sciences, Beijing 100094, China
Remote Sens. 2017, 9(7), 697; https://doi.org/10.3390/rs9070697 - 6 Jul 2017
Cited by 2 | Viewed by 4718
Abstract
Glaciers in high mountain regions play an important role in global climate research. Glacier motion, which is the main characteristic of glacier activity, has attracted much interest and has been widely studied, because an accurate ice motion field is crucial for both glacier [...] Read more.
Glaciers in high mountain regions play an important role in global climate research. Glacier motion, which is the main characteristic of glacier activity, has attracted much interest and has been widely studied, because an accurate ice motion field is crucial for both glacier activity analysis and ice avalanche prediction. Unfortunately, the serious topographic effects associated with the complex terrain in high mountain regions can result in errors in ice movement estimation. Thus, according to the different characteristics of the results of pixel tracking in the wavelet domain after random sample consensus (RANSAC)-based global deformation removal, a wavelet-based topographic effect compensation operation is presented in this paper. The proposed method is then used for ice motion estimation in the Muztagh Ata region, without the use of synthetic-aperture radar (SAR) imaging geometry parameters. The results show that the proposed method can effectively improve the accuracy of glacier motion estimation by reducing the mean and standard deviation values from 0.32 m and 0.4 m to 0.16 m and 0.23 m, respectively, in non-glacial regions, after precisely compensating the topographic effect with Advanced Land Observing Satellite–Phased Array-type L-band Synthetic Aperture Radar (ALOS–PALSAR) imagery. Therefore, the presented wavelet-based topographic effect compensation method is also effective without requiring the SAR imaging geometry parameters and has the potential to be widely used in the accurate estimation of mountain glacier velocity. Full article
(This article belongs to the Special Issue Remote Sensing of Glaciers)
Show Figures

Graphical abstract

16 pages, 5888 KiB  
Article
Detecting Wind Farm Impacts on Local Vegetation Growth in Texas and Illinois Using MODIS Vegetation Greenness Measurements
by Geng Xia * and Liming Zhou
Department of Atmospheric and Environmental Sciences, University at Albany, State University of New York, Albany, NY 12222, USA
Remote Sens. 2017, 9(7), 698; https://doi.org/10.3390/rs9070698 - 6 Jul 2017
Cited by 24 | Viewed by 6476
Abstract
This study examines the possible impacts of real-world wind farms (WFs) on vegetation growth using two vegetation indices (VIs), the Normalized Difference Vegetation Index (NDVI) and Enhanced Vegetation Index (EVI), at a ~250 m resolution from the MODerate resolution Imaging Spectroradimeter (MODIS) for [...] Read more.
This study examines the possible impacts of real-world wind farms (WFs) on vegetation growth using two vegetation indices (VIs), the Normalized Difference Vegetation Index (NDVI) and Enhanced Vegetation Index (EVI), at a ~250 m resolution from the MODerate resolution Imaging Spectroradimeter (MODIS) for the period 2003–2014. We focus on two well-studied large WF regions, one in western Texas and the other in northern Illinois. These two regions differ distinctively in terms of land cover, topography, and background climate, allowing us to examine whether the WF impacts on vegetation, if any, vary due to the differences in atmospheric and boundary conditions. We use three methods (spatial coupling analysis, time series analysis, and seasonal cycle analysis) and consider two groups of pixels, wind farm pixels (WFPs) and non-wind-farm pixels (NWFPs), to quantify and attribute such impacts during the pre- and post-turbine periods. Our results indicate that the WFs have insignificant or no detectible impacts on local vegetation growth. At the pixel level, the VI changes demonstrate a random nature and have no spatial coupling with the WF layout. At the regional level, there is no systematic shift in vegetation greenness between the pre- and post-turbine periods. At interannual and seasonal time scales, there are no confident vegetation changes over WFPs relative to NWFPs. These results remain robust when the pre- and post-turbine periods and NWFPs are defined differently. Most importantly, the majority of the VI changes are within the MODIS data uncertainty, suggesting that the WF impacts on vegetation, if any, cannot be separated confidently from the data uncertainty and noise. Overall, there are some small decreases in vegetation greenness over WF regions, but no convincing observational evidence is found for the impacts of operating WFs on vegetation growth. Full article
(This article belongs to the Special Issue Remote Sensing of Land-Atmosphere Interactions)
Show Figures

Figure 1

23 pages, 18206 KiB  
Article
Micro-Doppler Estimation and Analysis of Slow Moving Objects in Forward Scattering Radar System
by Raja Syamsul Azmir Raja Abdullah 1,*, Ali Alnaeb 1, Asem Ahmad Salah 1, Nur Emileen Abdul Rashid 2, Aduwati Sali 1 and Idnin Pasya 2
1 Wireless and Photonic Networks Research Centre, Faculty of Engineering, Universiti Putra Malaysia (UPM), 43400 Serdang Selangor, Malaysia
2 Faculty of Electrical Engineering, Universiti Teknologi MARA (UiTM), 40450 Shah Alam, Selangor, Malaysia
Remote Sens. 2017, 9(7), 699; https://doi.org/10.3390/rs9070699 - 6 Jul 2017
Cited by 16 | Viewed by 8636
Abstract
Micro-Doppler signature can convey information of detected targets and has been used for target recognition in many Radar systems. Nevertheless, micro-Doppler for the specific Forward Scattering Radar (FSR) system has yet to be analyzed and investigated in detail; consequently, information carried by the [...] Read more.
Micro-Doppler signature can convey information of detected targets and has been used for target recognition in many Radar systems. Nevertheless, micro-Doppler for the specific Forward Scattering Radar (FSR) system has yet to be analyzed and investigated in detail; consequently, information carried by the micro-Doppler in FSR is not fully understood. This paper demonstrates the feasibility and effectiveness of FSR in detecting and extracting micro-Doppler signature generated from a target’s micro-motions. Comprehensive theoretical analyses and simulation results followed by experimental investigations into the feasibility of using the FSR for detecting micro-Doppler signatures are presented in this paper. The obtained results verified that the FSR system is capable of detecting micro-Doppler signature of a swinging pendulum placed on a moving trolley and discriminating different swinging speeds. Furthermore, human movement and micro-Doppler from hand motions can be detected and monitored by using the FSR system which resembles a potential application for human gait monitoring and classification. Full article
(This article belongs to the Special Issue Radar Systems for the Societal Challenges)
Show Figures

Graphical abstract

23 pages, 22656 KiB  
Article
Mapping Typical Urban LULC from Landsat Imagery without Training Samples or Self-Defined Parameters
by Hui Li 1, Cuizhen Wang 2, Cheng Zhong 3,*, Zhi Zhang 4,* and Qingbin Liu 3
1 State Key Laboratory of Geological Process and Mineral Resources, Planetary Science Institute, School of Earth Sciences, China University of Geosciences, Wuhan 430074, China
2 Department of Geography, University of South Carolina, 709 Bull St., Columbia, SC 29208, USA
3 Three Gorges Research Center for Geo-Hazard, Ministry of Education, China University of Geosciences, Wuhan 430074, China
4 Institute of Geophysics & Geomatics, China University of Geosciences, Wuhan 430074, China
Remote Sens. 2017, 9(7), 700; https://doi.org/10.3390/rs9070700 - 7 Jul 2017
Cited by 23 | Viewed by 7312
Abstract
Land use/land cover (LULC) change is one of the most important indicators in understanding the interactions between humans and the environment. Traditionally, when LULC maps are produced yearly, most existing remote-sensing methods have to collect ground reference data annually, as the classifiers have [...] Read more.
Land use/land cover (LULC) change is one of the most important indicators in understanding the interactions between humans and the environment. Traditionally, when LULC maps are produced yearly, most existing remote-sensing methods have to collect ground reference data annually, as the classifiers have to be trained individually in each corresponding year. This study presented a novel strategy to map LULC classes without training samples or assigning parameters. First of all, several novel indices were carefully selected from the index pool, which were able to highlight certain LULC very well. Following this, a common unsupervised classifier was employed to extract the LULC from the associated index image without assigning thresholds. Finally, a supervised classification was implemented with samples automatically collected from the unsupervised classification outputs. Results illustrated that the proposed method could achieve satisfactory performance, reaching similar accuracies to traditional approaches. Findings of this study demonstrate that the proposed strategy is a simple and effective alternative to mapping urban LULC. With the proposed strategy, the budget and time required for remote-sensing data processing could be reduced dramatically. Full article
Show Figures

Graphical abstract

22 pages, 20866 KiB  
Article
Optimal Seamline Detection for Orthoimage Mosaicking by Combining Deep Convolutional Neural Network and Graph Cuts
by Li Li 1, Jian Yao 1,*, Yahui Liu 1, Wei Yuan 1,2, Shuzhu Shi 1 and Shenggu Yuan 3
1 School of Remote Sensing and Information Engineering, Wuhan University, Wuhan 430079, Hubei, China
2 Center for Spatial Information Science, University of Tokyo, Kashiwa 277-8568, Japan
3 China Transport Telecommunications and Information Center, Beijing 100011, China
Remote Sens. 2017, 9(7), 701; https://doi.org/10.3390/rs9070701 - 7 Jul 2017
Cited by 31 | Viewed by 8502
Abstract
When mosaicking orthoimages, especially in urban areas with various obvious ground objects like buildings, roads, cars or trees, the detection of optimal seamlines is one of the key technologies for creating seamless and pleasant image mosaics. In this paper, we propose a new [...] Read more.
When mosaicking orthoimages, especially in urban areas with various obvious ground objects like buildings, roads, cars or trees, the detection of optimal seamlines is one of the key technologies for creating seamless and pleasant image mosaics. In this paper, we propose a new approach to detect optimal seamlines for orthoimage mosaicking with the use of deep convolutional neural network (CNN) and graph cuts. Deep CNNs have been widely used in many fields of computer vision and photogrammetry in recent years, and graph cuts is one of the most widely used energy optimization frameworks. We first propose a deep CNN for land cover semantic segmentation in overlap regions between two adjacent images. Then, the energy cost of each pixel in the overlap regions is defined based on the classification probabilities of belonging to each of the specified classes. To find the optimal seamlines globally, we fuse the CNN-classified energy costs of all pixels into the graph cuts energy minimization framework. The main advantage of our proposed method is that the pixel similarity energy costs between two images are defined using the classification results of the CNN based semantic segmentation instead of using the image informations of color, gradient or texture as traditional methods do. Another advantage of our proposed method is that the semantic informations are fully used to guide the process of optimal seamline detection, which is more reasonable than only using the hand designed features defined to represent the image differences. Finally, the experimental results on several groups of challenging orthoimages show that the proposed method is capable of finding high-quality seamlines among urban and non-urban orthoimages, and outperforms the state-of-the-art algorithms and the commercial software based on the visual comparison, statistical evaluation and quantitative evaluation based on the structural similarity (SSIM) index. Full article
Show Figures

Figure 1

14 pages, 10278 KiB  
Article
Estimating Mangrove Canopy Height and Above-Ground Biomass in the Everglades National Park with Airborne LiDAR and TanDEM-X Data
by Emanuelle A. Feliciano 1,2,3,*, Shimon Wdowinski 1,4, Matthew D. Potts 5, Seung-Kuk Lee 2,6 and Temilola E. Fatoyinbo 2
1 Department of Marine Geosciences, University of Miami—Rosenstiel School of Marine and Atmospheric Science, 4600 Rickenbacker Causeway, Miami, FL 33149, USA
2 NASA Goddard Space Flight Center, Biospheric Sciences Laboratory, 8800 Greenbelt Road, Greenbelt, MD 20771, USA
3 Universities Space Research Association, 7178 Columbia Gateway Dr., Columbia, MD 21046, USA
4 Department of Earth and Environment, Florida International University, 11200 SW 8th Street, AHC5-388, Miami, FL 33199, USA
5 Department of Environmental Science, Policy and Management, University of California, 130 Mulford Hall #3114 Berkeley, Berkeley, CA 94720, USA
6 Department of Geographical Sciences, University of Maryland, 2181 Samuel J. LeFrak Hall, 7251 Preinkert Dr., College Park, MD 20742, USA
Remote Sens. 2017, 9(7), 702; https://doi.org/10.3390/rs9070702 - 7 Jul 2017
Cited by 48 | Viewed by 10189
Abstract
Mangrove forests are important natural ecosystems due to their ability to capture and store large amounts of carbon. Forest structural parameters, such as canopy height and above-ground biomass (AGB), provide a good measure for monitoring temporal changes in carbon content. The protected coastal [...] Read more.
Mangrove forests are important natural ecosystems due to their ability to capture and store large amounts of carbon. Forest structural parameters, such as canopy height and above-ground biomass (AGB), provide a good measure for monitoring temporal changes in carbon content. The protected coastal mangrove forest of the Everglades National Park (ENP) provides an ideal location for studying these processes, as harmful human activities are minimal. We estimated mangrove canopy height and AGB in the ENP using Airborne LiDAR/Laser (ALS) and TanDEM-X (TDX) datasets acquired between 2011 and 2013. Analysis of both datasets revealed that mangrove canopy height can reach up to ~25 m and AGB can reach up to ~250 Mg•ha−1. In general, mangroves ranging from 9 m to 12 m in stature dominate the forest canopy. The comparison of ALS and TDX canopy height observations yielded an R2 = 0.85 and Root Mean Square Error (RMSE) = 1.96 m. Compared to a previous study based on data acquired during 2000–2004, our analysis shows an increase in mangrove stature and AGB, suggesting that ENP mangrove forests are continuing to accumulate biomass. Our results suggest that ENP mangrove forests have managed to recover from natural disturbances, such as Hurricane Wilma. Full article
(This article belongs to the Section Forest Remote Sensing)
Show Figures

Figure 1

26 pages, 1653 KiB  
Article
Multi-Channel Deconvolution for Forward-Looking Phase Array Radar Imaging
by Jie Xia, Xinfei Lu and Weidong Chen *
Key Laboratory of Electromagnetic Space Information, Chinese Academy of Sciences, University of Science and Technology of China, Hefei 230027, China
Remote Sens. 2017, 9(7), 703; https://doi.org/10.3390/rs9070703 - 7 Jul 2017
Cited by 16 | Viewed by 5461
Abstract
The cross-range resolution of forward-looking phase array radar (PAR) is limited by the effective antenna beamwidth since the azimuth echo is the convolution of antenna pattern and targets’ backscattering coefficients. Therefore, deconvolution algorithms are proposed to improve the imaging resolution under the limited [...] Read more.
The cross-range resolution of forward-looking phase array radar (PAR) is limited by the effective antenna beamwidth since the azimuth echo is the convolution of antenna pattern and targets’ backscattering coefficients. Therefore, deconvolution algorithms are proposed to improve the imaging resolution under the limited antenna beamwidth. However, as a typical inverse problem, deconvolution is essentially a highly ill-posed problem which is sensitive to noise and cannot ensure a reliable and robust estimation. In this paper, multi-channel deconvolution is proposed for improving the performance of deconvolution, which intends to considerably alleviate the ill-posed problem of single-channel deconvolution. To depict the performance improvement obtained by multi-channel more effectively, evaluation parameters are generalized to characterize the angular spectrum of antenna pattern or singular value distribution of observation matrix, which are conducted to compare different deconvolution systems. Here we present two multi-channel deconvolution algorithms which improve upon the traditional deconvolution algorithms via combining with multi-channel technique. Extensive simulations and experimental results based on real data are presented to verify the effectiveness of the proposed imaging methods. Full article
Show Figures

Graphical abstract

25 pages, 25530 KiB  
Article
MMASTER: Improved ASTER DEMs for Elevation Change Monitoring
by Luc Girod *, Christopher Nuth, Andreas Kääb, Robert McNabb and Olivier Galland
Department of Geosciences, University of Oslo, Postboks 1047, Blindern, 0316 Oslo, Norway
Remote Sens. 2017, 9(7), 704; https://doi.org/10.3390/rs9070704 - 8 Jul 2017
Cited by 86 | Viewed by 17877
Abstract
The Advanced Spaceborne Thermal Emission and Reflection Radiometer (ASTER) system on board the Terra (EOS AM-1) satellite has been a source of stereoscopic images covering the whole globe at 15-m resolution with consistent quality for over 16 years. The potential of these data [...] Read more.
The Advanced Spaceborne Thermal Emission and Reflection Radiometer (ASTER) system on board the Terra (EOS AM-1) satellite has been a source of stereoscopic images covering the whole globe at 15-m resolution with consistent quality for over 16 years. The potential of these data in terms of geomorphological analysis and change detection in three dimensions is unrivaled and should be exploited more. Due to uncorrected errors in the image geometry due to sensor motion (“jitter”), however, the quality of the DEMs and orthoimages currently available is often insufficient for a number of applications, including surface change detection. We have therefore developed a series of algorithms packaged under the name MicMac ASTER (MMASTER). It is composed of a tool to compute Rational Polynomial Coefficient (RPC) models from the ASTER metadata, a method that improves the quality of the matching by identifying and correcting jitter-induced cross-track parallax errors and a correction for along-track jitter when computing differences between DEMs (either with another MMASTER DEM or with another data source). Our method outputs more precise DEMs with less unmatched areas and reduced overall noise compared to NASA’s standard AST14DMO product. The algorithms were implemented in the open source photogrammetric library and software suite MicMac. Here, we briefly examine the potential of MMASTER-produced DEMs to investigate a variety of geomorphological changes, including river erosion, seismic deformation, changes in biomass, volcanic deformation and glacier mass balance. Full article
(This article belongs to the Section Remote Sensing in Geology, Geomorphology and Hydrology)
Show Figures

Graphical abstract

26 pages, 10846 KiB  
Article
High Resolution Orthomosaics of African Coral Reefs: A Tool for Wide-Scale Benthic Monitoring
by Marco Palma 1,†, Monica Rivas Casado 2,*, Ubaldo Pantaleo 1,3 and Carlo Cerrano 1
1 Dipartimento di Scienze della Vita e dell’Ambiente (DISVA), Via Brecce Bianche, Monte Dago, 60130 Ancona, Italy
2 Cranfield Institute for Resilient Futures, School of Water, Energy and Environment, Cranfield University, Cranfield MK430AL, UK
3 UBICA srl (Underwater BIo-CArtography), Via San Siro 6/1, 16124 Genova, Italy
Cranfield Institute for Resilient Futures, School of Water, Energy and Environment, Cranfield University, Cranfield MK430AL, UK
Remote Sens. 2017, 9(7), 705; https://doi.org/10.3390/rs9070705 - 8 Jul 2017
Cited by 29 | Viewed by 8861
Abstract
Coral reefs play a key role in coastal protection and habitat provision. They are also well known for their recreational value. Attempts to protect these ecosystems have not successfully stopped large-scale degradation. Significant efforts have been made by government and research organizations to [...] Read more.
Coral reefs play a key role in coastal protection and habitat provision. They are also well known for their recreational value. Attempts to protect these ecosystems have not successfully stopped large-scale degradation. Significant efforts have been made by government and research organizations to ensure that coral reefs are monitored systematically to gain a deeper understanding of the causes, the effects and the extent of threats affecting coral reefs. However, further research is needed to fully understand the importance that sampling design has on coral reef characterization and assessment. This study examines the effect that sampling design has on the estimation of seascape metrics when coupling semi-autonomous underwater vehicles, structure-from-motion photogrammetry techniques and high resolution (0.4 cm) underwater imagery. For this purpose, we use FRAGSTATS v4 to estimate key seascape metrics that enable quantification of the area, density, edge, shape, contagion, interspersion and diversity of sessile organisms for a range of sampling scales (0.5 m × 0.5 m, 2 m × 2 m, 5 m × 5 m, 7 m × 7 m), quadrat densities (from 1–100 quadrats) and sampling strategies (nested vs. random) within a 1655 m2 case study area in Ponta do Ouro Partial Marine Reserve (Mozambique). Results show that the benthic community is rather disaggregated within a rocky matrix; the embedded patches frequently have a small size and a regular shape; and the population is highly represented by soft corals. The genus Acropora is the more frequent and shows bigger colonies in the group of hard corals. Each of the seascape metrics has specific requirements of the sampling scale and quadrat density for robust estimation. Overall, the majority of the metrics were accurately identified by sampling scales equal to or coarser than 5 m × 5 m and quadrat densities equal to or larger than 30. The study indicates that special attention needs to be dedicated to the design of coral reef monitoring programmes, with decisions being based on the seascape metrics and statistics being determined. The results presented here are representative of the eastern South Africa coral reefs and are expected to be transferable to coral reefs with similar characteristics. The work presented here is limited to one study site and further research is required to confirm the findings. Full article
(This article belongs to the Section Ocean Remote Sensing)
Show Figures

Figure 1

20 pages, 4923 KiB  
Article
Dry Season Evapotranspiration Dynamics over Human-Impacted Landscapes in the Southern Amazon Using the Landsat-Based METRIC Model
by Kul Khand 1, Izaya Numata 2,*, Jeppe Kjaersgaard 3 and George L. Vourlitis 4
1 Biosystems and Agricultural Engineering Department, Oklahoma State University, Stillwater, OK 74078, USA
2 Geospatial Sciences Center of Excellence, South Dakota State University, Brookings, SD 57007, USA
3 South Dakota Water Resources Institute, South Dakota State University, Brookings, SD 57007, USA
4 Department of Biological Sciences, California State University San Marcos, San Marcos, CA 92096, USA
Remote Sens. 2017, 9(7), 706; https://doi.org/10.3390/rs9070706 - 9 Jul 2017
Cited by 35 | Viewed by 6273
Abstract
Although seasonal and temporal variations in evapotranspiration (ET) in Amazonia have been studied based upon flux-tower data and coarse resolution satellite-based models, ET dynamics over human-impacted landscapes are highly uncertain in this region. In this study, we estimate ET rates from critical land [...] Read more.
Although seasonal and temporal variations in evapotranspiration (ET) in Amazonia have been studied based upon flux-tower data and coarse resolution satellite-based models, ET dynamics over human-impacted landscapes are highly uncertain in this region. In this study, we estimate ET rates from critical land cover types over highly fragmented landscapes in the southern Amazon and characterize the ET dynamics during the dry season using the METRIC (Mapping Evapotranspiration at high Resolution with Internalized Calibration) model. METRIC, a Landsat-based ET model, that generates spatially continuous ET estimates at a 30 m spatial resolution widely used for agricultural applications, was adapted to the southern Amazon by using the NDVI indexed reference ET fraction (ETrF) approach. Compared to flux tower-based ET rates, this approach showed an improved performance on the forest ET estimation over the standard METRIC approach, with R2 = 0.73 from R2 = 0.70 and RMSE reduced from 0.77 mm/day to 0.35 mm/day. We used this approach integrated into the METRIC procedure to estimate ET rates from primary, regenerated, and degraded forests and pasture in Acre, Rondônia, and Mato Grosso, all located in the southern Amazon, during the dry season in 2009. The lowest ET rates occurred in Mato Grosso, the driest region. Acre and Rondônia, both located in the southwestern Amazon, had similar ET rates for all land cover types. Dry season ET rates between primary forest and regenerated forest were similar (p > 0.05) in all sites, ranging between 2.5 and 3.4 mm/day for both forest cover types in the three sites. ET rates from degraded forest in Mato Grosso were significantly lower (p < 0.05) compared to the other forest cover types, with a value of 2.03 mm/day on average. Pasture showed the lowest ET rates during the dry season at all study sites, with the dry season average ET varying from 1.7 mm/day in Mato Grosso to 2.8 mm/day in Acre. Full article
Show Figures

Graphical abstract

25 pages, 17845 KiB  
Article
Estimation of Forest Aboveground Biomass in Changbai Mountain Region Using ICESat/GLAS and Landsat/TM Data
by Hong Chi 1,2,*, Guoqing Sun 3, Jinliang Huang 1,2, Rendong Li 1,2, Xianyou Ren 1,2, Wenjian Ni 4 and Anmin Fu 5
1 Institute of Geodesy and Geophysics, Chinese Academy of Sciences, Wuhan 430077, China
2 Hubei Key Laboratory for Environment and Disaster Monitoring and Evaluation, Wuhan 430077, China
3 Department of Geographical Sciences, University of Maryland, College Park, MD 20742, USA
4 Institute of Remote Sensing and Digital Earth, Chinese Academy of Sciences, Beijing 100732, China
5 Academy of Forest Inventory and Planning, State Forestry Administration, Beijing 100714, China
Remote Sens. 2017, 9(7), 707; https://doi.org/10.3390/rs9070707 - 9 Jul 2017
Cited by 46 | Viewed by 6345
Abstract
Mapping the magnitude and spatial distribution of forest aboveground biomass (AGB, in Mg·ha−1) is crucial to improve our understanding of the terrestrial carbon cycle. Landsat/TM (Thematic Mapper) and ICESat/GLAS (Ice, Cloud, and land Elevation Satellite, Geoscience Laser Altimeter System) data were [...] Read more.
Mapping the magnitude and spatial distribution of forest aboveground biomass (AGB, in Mg·ha−1) is crucial to improve our understanding of the terrestrial carbon cycle. Landsat/TM (Thematic Mapper) and ICESat/GLAS (Ice, Cloud, and land Elevation Satellite, Geoscience Laser Altimeter System) data were integrated to estimate the AGB in the Changbai Mountain area. Firstly, four forest types were delineated according to TM data classification. Secondly, different models for prediction of the AGB at the GLAS footprint level were developed from GLAS waveform metrics and the AGB was derived from field observations using multiple stepwise regression. Lastly, GLAS-derived AGB, in combination with vegetation indices, leaf area index (LAI), canopy closure, and digital elevation model (DEM), were used to drive a data fusion model based on the random forest approach for extrapolating the GLAS footprint AGB to a continuous AGB map. The classification result showed that the Changbai Mountain region was characterized as forest-rich in altitudinal vegetation zones. The contribution of remote sensing variables in modeling the AGB was evaluated. Vegetation index metrics account for large amount of contribution in AGB ranges <150 Mg·ha−1, while canopy closure has the largest contribution in AGB ranges ≥150 Mg·ha−1. Our study revealed that spatial information from two sensors and DEM could be combined to estimate the AGB with an R2 of 0.72 and an RMSE of 25.24 Mg·ha−1 in validation at stand level (size varied from ~0.3 ha to ~3 ha). Full article
(This article belongs to the Section Forest Remote Sensing)
Show Figures

Figure 1

19 pages, 6532 KiB  
Article
Estimation of Winter Wheat Above-Ground Biomass Using Unmanned Aerial Vehicle-Based Snapshot Hyperspectral Sensor and Crop Height Improved Models
by Jibo Yue 1,2,3,†, Guijun Yang 1,4,5,*,†, Changchun Li 3, Zhenhai Li 1,4,5, Yanjie Wang 1,3,4, Haikuan Feng 1,4 and Bo Xu 1,4,5
1 Key Laboratory of Quantitative Remote Sensing in Agriculture of Ministry of Agriculture China, Beijing Research Center for Information Technology in Agriculture, Beijing 100097, China
2 International Institute for Earth System Science, Nanjing University, Nanjing 210023, China
3 School of Surveying and Land Information Engineering, Henan Polytechnic University, Jiaozuo 454000, China
4 National Engineering Research Center for Information Technology in Agriculture, Beijing 100097, China
5 Beijing Engineering Research Center for Agriculture Internet of Things, Beijing 100097, China
Both authors contributed equally to this work and should be considered co-first authors.
Remote Sens. 2017, 9(7), 708; https://doi.org/10.3390/rs9070708 - 10 Jul 2017
Cited by 350 | Viewed by 17079
Abstract
Correct estimation of above-ground biomass (AGB) is necessary for accurate crop growth monitoring and yield prediction. We estimated AGB based on images obtained with a snapshot hyperspectral sensor (UHD 185 firefly, Cubert GmbH, Ulm, Baden-Württemberg, Germany) mounted on an unmanned aerial vehicle (UAV). [...] Read more.
Correct estimation of above-ground biomass (AGB) is necessary for accurate crop growth monitoring and yield prediction. We estimated AGB based on images obtained with a snapshot hyperspectral sensor (UHD 185 firefly, Cubert GmbH, Ulm, Baden-Württemberg, Germany) mounted on an unmanned aerial vehicle (UAV). The UHD 185 images were used to calculate the crop height and hyperspectral reflectance of winter wheat canopies from hyperspectral and panchromatic images. We constructed several single-parameter models for AGB estimation based on spectral parameters, such as specific bands, spectral indices (e.g., Ratio Vegetation Index (RVI), NDVI, Greenness Index (GI) and Wide Dynamic Range VI (WDRVI)) and crop height and several models combined with spectral parameters and crop height. Comparison with experimental results indicated that incorporating crop height into the models improved the accuracy of AGB estimations (the average AGB is 6.45 t/ha). The estimation accuracy of single-parameter models was low (crop height only: R2 = 0.50, RMSE = 1.62 t/ha, MAE = 1.24 t/ha; R670 only: R2 = 0.54, RMSE = 1.55 t/ha, MAE = 1.23 t/ha; NDVI only: R2 = 0.37, RMSE = 1.81 t/ha, MAE = 1.47 t/ha; partial least squares regression R2 = 0.53, RMSE = 1.69, MAE = 1.20), but accuracy increased when crop height and spectral parameters were combined (partial least squares regression modeling: R2 = 0.78, RMSE = 1.08 t/ha, MAE = 0.83 t/ha; verification: R2 = 0.74, RMSE = 1.20 t/ha, MAE = 0.96 t/ha). Our results suggest that crop height determined from the new UAV-based snapshot hyperspectral sensor can improve AGB estimation and is advantageous for mapping applications. This new method can be used to guide agricultural management. Full article
(This article belongs to the Special Issue Earth Observations for Precision Farming in China (EO4PFiC))
Show Figures

Graphical abstract

11 pages, 2182 KiB  
Article
Learning-Based Sub-Pixel Change Detection Using Coarse Resolution Satellite Imagery
by Yong Xu 1, Lin Lin 2 and Deyu Meng 2,*
1 Institute of Future Cities, The Chinese University of Hong Kong, Hong Kong, China
2 School of Mathematics and Statistics and Ministry of Education Key Lab of Intelligent Networks and Network Security, Xi’an Jiaotong University, Xi’an 710000, China
Remote Sens. 2017, 9(7), 709; https://doi.org/10.3390/rs9070709 - 10 Jul 2017
Cited by 11 | Viewed by 7461
Abstract
Moderate Resolution Imaging Spectroradiometer (MODIS) data are effective and efficient for monitoring urban dynamics such as urban cover change and thermal anomalies, but the spatial resolution provided by MODIS data is 500 m (for most of its shorter spectral bands), which results in [...] Read more.
Moderate Resolution Imaging Spectroradiometer (MODIS) data are effective and efficient for monitoring urban dynamics such as urban cover change and thermal anomalies, but the spatial resolution provided by MODIS data is 500 m (for most of its shorter spectral bands), which results in difficulty in detecting subtle spatial variations within a coarse pixel—especially for a fast-growing city. Given that the historical land use/cover products and satellite data at finer resolution are valuable to reflect the urban dynamics with more spatial details, finer spatial resolution images, as well as land cover products at previous times, are exploited in this study to improve the change detection capability of coarse resolution satellite data. The proposed approach involves two main steps. First, pairs of coarse and finer resolution satellite data at previous times are learned and then applied to generate synthetic satellite data with finer spatial resolution from coarse resolution satellite data. Second, a land cover map was produced at a finer spatial resolution and adjusted with the obtained synthetic satellite data and prior land cover maps. The approach was tested for generating finer resolution synthetic Landsat images using MODIS data from the Guangzhou study area. The finer resolution Landsat-like data were then applied to detect land cover changes with more spatial details. Test results show that the change detection accuracy using the proposed approach with the synthetic Landsat data is much better than the results using the original MODIS data or conventional spatial and temporal fusion-based approaches. The proposed approach is beneficial for detecting subtle urban land cover changes with more spatial details when multitemporal coarse satellite data are available. Full article
(This article belongs to the Special Issue Learning to Understand Remote Sensing Images)
Show Figures

Graphical abstract

16 pages, 2059 KiB  
Article
Improved Model for Depth Bias Correction in Airborne LiDAR Bathymetry Systems
by Jianhu Zhao 1,2, Xinglei Zhao 1,2,*, Hongmei Zhang 3 and Fengnian Zhou 4
1 School of Geodesy and Geomatics, Wuhan University, 129 Luoyu Road, Wuhan 430079, China
2 Institute of Marine Science and Technology, Wuhan University, Wuhan 430079, China
3 Automation Department, School of Power and Mechanical Engineering, Wuhan University, Wuhan 430072, China
4 The Survey Bureau of Hydrology and Water Resources of Yangtze Estuary, Shanghai 200136, China
Remote Sens. 2017, 9(7), 710; https://doi.org/10.3390/rs9070710 - 10 Jul 2017
Cited by 32 | Viewed by 6111
Abstract
Airborne LiDAR bathymetry (ALB) is efficient and cost effective in obtaining shallow water topography, but often produces a low-accuracy sounding solution due to the effects of ALB measurements and ocean hydrological parameters. In bathymetry estimates, peak shifting of the green bottom return caused [...] Read more.
Airborne LiDAR bathymetry (ALB) is efficient and cost effective in obtaining shallow water topography, but often produces a low-accuracy sounding solution due to the effects of ALB measurements and ocean hydrological parameters. In bathymetry estimates, peak shifting of the green bottom return caused by pulse stretching induces depth bias, which is the largest error source in ALB depth measurements. The traditional depth bias model is often applied to reduce the depth bias, but it is insufficient when used with various ALB system parameters and ocean environments. Therefore, an accurate model that considers all of the influencing factors must be established. In this study, an improved depth bias model is developed through stepwise regression in consideration of the water depth, laser beam scanning angle, sensor height, and suspended sediment concentration. The proposed improved model and a traditional one are used in an experiment. The results show that the systematic deviation of depth bias corrected by the traditional and improved models is reduced significantly. Standard deviations of 0.086 and 0.055 m are obtained with the traditional and improved models, respectively. The accuracy of the ALB-derived depth corrected by the improved model is better than that corrected by the traditional model. Full article
(This article belongs to the Section Ocean Remote Sensing)
Show Figures

Graphical abstract

14 pages, 5775 KiB  
Article
An Empirical Algorithm for Wave Retrieval from Co-Polarization X-Band SAR Imagery
by Weizeng Shao 1, Jing Wang 1, Xiaofeng Li 1,3,* and Jian Sun 2
1 Marine Science and Technology College, Zhejiang Ocean University, Zhoushan 316000, China
2 Physical Oceanography Laboratory, Ocean University of China, Qingdao 266100, China
3 Global Science and Technology, National Oceanic and Atmospheric Administration (NOAA)-National Environmental Satellite, Data, and Information Service (NESDIS), College Park, MD 20740, USA
Remote Sens. 2017, 9(7), 711; https://doi.org/10.3390/rs9070711 - 11 Jul 2017
Cited by 16 | Viewed by 6015
Abstract
In this study, we proposed an empirical algorithm for significant wave height (SWH) retrieval from TerraSAR-X/TanDEM (TS-X/TD-X) X-band synthetic aperture radar (SAR) co-polarization (vertical-vertical (VV) and horizontal-horizontal (HH)) images. As the existing empirical algorithm at X-band, i.e., XWAVE, is applied for wave retrieval [...] Read more.
In this study, we proposed an empirical algorithm for significant wave height (SWH) retrieval from TerraSAR-X/TanDEM (TS-X/TD-X) X-band synthetic aperture radar (SAR) co-polarization (vertical-vertical (VV) and horizontal-horizontal (HH)) images. As the existing empirical algorithm at X-band, i.e., XWAVE, is applied for wave retrieval from HH-polarization TS-X/TD-X image, polarization ratio (PR) has to be used for inverting wind speed, which is treated as an input in XWAVE. Wind speed encounters saturation in tropical cyclone. In our work, wind speed is replaced by normalized radar cross section (NRCS) to avoiding using SAR-derived wind speed, which does not work in high winds, and the empirical algorithm can be conveniently implemented without converting NRCS in HH-polarization to NRCS in VV-polarization by using X-band PR. A total of 120 TS-X/TD-X images, 60 in VV-polarization and 60 in HH-polarization, with homogenous wave patterns, and the coincide significant wave height data from European Centre for Medium-Range Weather Forecasts (ECMWF) reanalysis field at a 0.125° grid were collected as a dataset for tuning the algorithm. The range of SWH is from 0 to 7 m. We then applied the algorithm to 24 VV and 21 HH additional SAR images to extract SWH at locations of 30 National Oceanic and Atmospheric Administration (NOAA) National Data Buoy Center (NDBC) buoys. It is found that the algorithm performs well with a SWH stander deviation (STD) of about 0.5 m for both VV and HH polarization TS-X/TD-X images. For large wave validation (SWH 6–7 m), we applied the empirical algorithm to a tropical cyclone Sandy TD-X image acquired in 2012, and obtained good result with a SWH STD of 0.3 m. We concluded that the proposed empirical algorithm works for wave retrieval from TS-X/TD-X image in co-polarization without external sea surface wind information. Full article
(This article belongs to the Special Issue Ocean Remote Sensing with Synthetic Aperture Radar)
Show Figures

Graphical abstract

33 pages, 15812 KiB  
Article
Assessment of Land Use-Cover Changes and Successional Stages of Vegetation in the Natural Protected Area Altas Cumbres, Northeastern Mexico, Using Landsat Satellite Imagery
by Uriel Jeshua Sánchez-Reyes 1, Santiago Niño-Maldonado 2, Ludivina Barrientos-Lozano 1,* and Jacinto Treviño-Carreón 2
1 Instituto Tecnológico de Ciudad Victoria, Boulevard Emilio Portes Gil No. 1301, C.P. 87010 Ciudad Victoria, Tamaulipas, Mexico
2 Centro Universitario Victoria, Facultad de Ingeniería y Ciencias, Universidad Autónoma de Tamaulipas, C.P. 87149 Ciudad Victoria, Tamaulipas, Mexico
Remote Sens. 2017, 9(7), 712; https://doi.org/10.3390/rs9070712 - 11 Jul 2017
Cited by 25 | Viewed by 8474
Abstract
Loss of vegetation cover is a major factor that endangers biodiversity. Therefore, the use of geographic information systems and the analysis of satellite images are important for monitoring these changes in Natural Protected Areas (NPAs). In northeastern Mexico, the Natural Protected Area Altas [...] Read more.
Loss of vegetation cover is a major factor that endangers biodiversity. Therefore, the use of geographic information systems and the analysis of satellite images are important for monitoring these changes in Natural Protected Areas (NPAs). In northeastern Mexico, the Natural Protected Area Altas Cumbres (NPAAC) represents a relevant floristic and faunistic patch on which the impact of loss of vegetation cover has not been assessed. This work aimed to analyze changes of land use and coverage (LULCC) over the last 42 years on the interior and around the exterior of the area, and also to propose the time of succession for the most important types of vegetation. For the analysis, LANDSAT satellite images from 1973, 1986, 2000, 2005 and 2015 were used, they were classified in seven categories through a segmentation and maximum likelihood analysis. A cross-tabulation analysis was performed to determine the succession gradient. Towards the interior of the area, a significant reduction of tropical vegetation and, to a lesser extent, temperate forests was found, as well as an increase in scrub cover from 1973 to 2015. In addition, urban and vegetation-free areas, as well as modified vegetation, increased to the exterior. Towards the interior of the NPA, the processes of perturbation and recovery were mostly not linear, while in the exterior adjacent area, the presence of secondary vegetation with distinct definite time of succession was evident. The analysis carried out is the first contribution that evaluates LULCC in this important NPA of northeastern Mexico. Results suggest the need to evaluate the effects of these modifications on species. Full article
(This article belongs to the Section Forest Remote Sensing)
Show Figures

Graphical abstract

23 pages, 11573 KiB  
Article
Intercalibration and Gaussian Process Modeling of Nighttime Lights Imagery for Measuring Urbanization Trends in Africa 2000–2013
by David J. Savory 1, Ricardo Andrade-Pacheco 1, Peter W. Gething 2, Alemayehu Midekisa 1, Adam Bennett 1 and Hugh J. W. Sturrock 1,*
1 Malaria Elimination Initiative, Global Health Group, UCSF, San Francisco, CA 94158, USA
2 Big Data Institute, Nuffield Department of Medicine, University of Oxford, Oxford OX3 7LF, UK
Remote Sens. 2017, 9(7), 713; https://doi.org/10.3390/rs9070713 - 11 Jul 2017
Cited by 21 | Viewed by 7350
Abstract
Sub-Saharan Africa currently has the world’s highest urban population growth rate of any continent at roughly 4.2% annually. A better understanding of the spatiotemporal dynamics of urbanization across the continent is important to a range of fields including public health, economics, and environmental [...] Read more.
Sub-Saharan Africa currently has the world’s highest urban population growth rate of any continent at roughly 4.2% annually. A better understanding of the spatiotemporal dynamics of urbanization across the continent is important to a range of fields including public health, economics, and environmental sciences. Nighttime lights imagery (NTL), maintained by the National Oceanic and Atmospheric Administration, offers a unique vantage point for studying trends in urbanization. A well-documented deficiency of this dataset is the lack of intra- and inter-annual calibration between satellites, which makes the imagery unsuitable for temporal analysis in their raw format. Here we have generated an ‘intercalibrated’ time series of annual NTL images for Africa (2000–2013) by building on the widely used invariant region and quadratic regression method (IRQR). Gaussian process methods (GP) were used to identify NTL latent functions independent from the temporal noise signals in the annual datasets. The corrected time series was used to explore the positive association of NTL with Gross Domestic Product (GDP) and urban population (UP). Additionally, the proportion of change in ‘lit area’ occurring in urban areas was measured by defining urban agglomerations as contiguously lit pixels of >250 km2, with all other pixels being rural. For validation, the IRQR and GP time series were compared as predictors of the invariant region dataset. Root mean square error values for the GP smoothed dataset were substantially lower. Correlation of NTL with GDP and UP using GP smoothing showed significant increases in R2 over the IRQR method on both continental and national scales. Urban growth results suggested that the majority of growth in lit pixels between 2000 and 2013 occurred in rural areas. With this study, we demonstrated the effectiveness of GP to improve conventional intercalibration, used NTL to describe temporal patterns of urbanization in Africa, and detected NTL responses to environmental and humanitarian crises. The smoothed datasets are freely available for further use. Full article
(This article belongs to the Special Issue Recent Advances in Remote Sensing with Nighttime Lights)
Show Figures

Graphical abstract

20 pages, 7640 KiB  
Article
First Assessment of Sentinel-1A Data for Surface Soil Moisture Estimations Using a Coupled Water Cloud Model and Advanced Integral Equation Model over the Tibetan Plateau
by Xiaojing Bai 1, Binbin He 2,3,*, Xing Li 2, Jiangyuan Zeng 4, Xin Wang 5, Zuoliang Wang 5, Yijian Zeng 6 and Zhongbo Su 6
1 College of Hydrometeorology, Nanjing University of Information Science & Technology, Nanjing 210044, China
2 School of Resources and Environment, University of Electronic Science and Technology of China, Chengdu 611731, China
3 Center for Information Geoscience, University of Electronic Science and Technology of China, Chengdu 611731, China
4 State Key Laboratory of Remote Sensing Science, Institute of Remote Sensing and Digital Earth, Chinese Academy of Sciences, Beijing 100101, China
5 Key Laboratory of Land Surface Process and Climate Change in Cold and Arid Regions, Northwest Institute of Eco-Environment and Resources, Chinese Academy of Sciences, Lanzhou 730000, China
6 Faculty of Geo-Information Science and Earth Observations (ITC), University of Twente, 7500 AE Enschede, The Netherlands
Remote Sens. 2017, 9(7), 714; https://doi.org/10.3390/rs9070714 - 12 Jul 2017
Cited by 98 | Viewed by 8948
Abstract
The spatiotemporal distribution of soil moisture over the Tibetan Plateau is important for understanding the regional water cycle and climate change. In this paper, the surface soil moisture in the northeastern Tibetan Plateau is estimated from time-series VV-polarized Sentinel-1A observations by coupling the [...] Read more.
The spatiotemporal distribution of soil moisture over the Tibetan Plateau is important for understanding the regional water cycle and climate change. In this paper, the surface soil moisture in the northeastern Tibetan Plateau is estimated from time-series VV-polarized Sentinel-1A observations by coupling the water cloud model (WCM) and the advanced integral equation model (AIEM). The vegetation indicator in the WCM is represented by the leaf area index (LAI), which is smoothed and interpolated from Terra Moderate Resolution Imaging Spectroradiometer (MODIS) LAI eight-day products. The AIEM requires accurate roughness parameters, which are parameterized by the effective roughness parameters. The first halves of the Sentinel-1A observations from October 2014 to May 2016 are adopted for the model calibration. The calibration results show that the backscattering coefficient (σ°) simulated from the coupled model are consistent with those of the Sentinel-1A with integrated Pearson’s correlation coefficients R of 0.80 and 0.92 for the ascending and descending data, respectively. The variability of soil moisture is correctly modeled by the coupled model. Based on the calibrated model, the soil moisture is retrieved using a look-up table method. The results show that the trends of the in situ soil moisture are effectively captured by the retrieved soil moisture with an integrated R of 0.60 and 0.82 for the ascending and descending data, respectively. The integrated bias, mean absolute error, and root mean square error are 0.006, 0.048, and 0.073 m3/m3 for the ascending data, and are 0.012, 0.026, and 0.055 m3/m3 for the descending data, respectively. Discussions of the effective roughness parameters and uncertainties in the LAI demonstrate the importance of accurate parameterizations of the surface roughness parameters and vegetation for the soil moisture retrieval. These results demonstrate the capability and reliability of Sentinel-1A data for estimating the soil moisture over the Tibetan Plateau. It is expected that our results can contribute to developing operational methods for soil moisture retrieval using the Sentinel-1A and Sentinel-1B satellites. Full article
(This article belongs to the Special Issue Retrieval, Validation and Application of Satellite Soil Moisture Data)
Show Figures

Graphical abstract

13 pages, 7600 KiB  
Article
Assessing the Value of UAV Photogrammetry for Characterizing Terrain in Complex Peatlands
by Julie Lovitt *, Mir Mustafizur Rahman and Gregory J. McDermid
Department of Geography, University of Calgary, Calgary, AB T2N 1N4, Canada
Remote Sens. 2017, 9(7), 715; https://doi.org/10.3390/rs9070715 - 12 Jul 2017
Cited by 42 | Viewed by 8992
Abstract
Microtopographic variability in peatlands has a strong influence on greenhouse gas fluxes, but we lack the ability to characterize terrain in these environments efficiently over large areas. To address this, we assessed the capacity of photogrammetric data acquired from an unmanned aerial vehicle [...] Read more.
Microtopographic variability in peatlands has a strong influence on greenhouse gas fluxes, but we lack the ability to characterize terrain in these environments efficiently over large areas. To address this, we assessed the capacity of photogrammetric data acquired from an unmanned aerial vehicle (UAV or drone) to reproduce ground elevations measured in the field. In particular, we set out to evaluate the role of (i) vegetation/surface complexity and (ii) supplementary LiDAR data on results. We compared remote-sensing observations to reference measurements acquired with survey grade GPS equipment at 678 sample points, distributed across a 61-hectare treed bog in northwestern Alberta, Canada. UAV photogrammetric data were found to capture elevation with accuracies, by root mean squares error, ranging from 14–42 cm, depending on the state of vegetation/surface complexity. We judge the technology to perform well under all but the most-complex conditions, where ground visibility is hindered by thick vegetation. Supplementary LiDAR data did not improve results significantly, nor did it perform well as a stand-alone technology at the low densities typically available to researchers. Full article
(This article belongs to the Section Forest Remote Sensing)
Show Figures

Graphical abstract

21 pages, 4417 KiB  
Article
Stem Measurements and Taper Modeling Using Photogrammetric Point Clouds
by Rong Fang and Bogdan M. Strimbu *
College of Forestry, Oregon State University, 3100 Jefferson Way, Corvallis, OR 97333, USA
Remote Sens. 2017, 9(7), 716; https://doi.org/10.3390/rs9070716 - 12 Jul 2017
Cited by 28 | Viewed by 7801
Abstract
The estimation of tree biomass and the products that can be obtained from a tree stem have focused forest research for more than two centuries. Traditionally, measurements of the entire tree bole were expensive or inaccurate, even when sophisticated remote sensing techniques were [...] Read more.
The estimation of tree biomass and the products that can be obtained from a tree stem have focused forest research for more than two centuries. Traditionally, measurements of the entire tree bole were expensive or inaccurate, even when sophisticated remote sensing techniques were used. We propose a fast and accurate procedure for measuring diameters along the merchantable portion of the stem at any given height. The procedure uses unreferenced photos captured with a consumer grade camera. A photogrammetric point cloud (PPC) is produced from the acquired images using structure from motion, which is a computer vision range imaging technique. A set of 18 loblolly pines (Pinus taeda Lindl.) from east Louisiana, USA, were photographed, subsequently cut, and the diameter measured every meter. The same diameters were measured on the point cloud with AutoCAD Civil3D. The ground point cloud reconstruction provided useful information for at most 13 m along the stem. The PPC measurements are biased, overestimating real diameters by 17.2 mm, but with a reduced standard deviation (8.2%). A linear equation with parameters of the error at a diameter at breast height (d1.3) and the error of photogrammetric rendering reduced the bias to 1.4 mm. The usability of the PPC measurements in taper modeling was assessed with four models: Max and Burkhart [1], Baldwin and Feduccia [2], Lenhart et al. [3], and Kozak [4]. The evaluation revealed that the data fit well with all the models (R2 ≥ 0.97), with the Kozak and the Baldwin and Feduccia performing the best. The results support the replacement of taper with PPC, as faster, and more accurate and precise product estimations are expected. Full article
(This article belongs to the Section Forest Remote Sensing)
Show Figures

Graphical abstract

14 pages, 5258 KiB  
Article
Monitoring of Subsidence along Jingjin Inter-City Railway with High-Resolution TerraSAR-X MT-InSAR Analysis
by Qingli Luo 1,2, Guoqing Zhou 2,* and Daniele Perissin 3
1 The Center for Remote Sensing, Tianjin University, No. 92, Weijin Road, Nankai District, Tianjin 300072, China
2 Guangxi Key Laboratory for Spatial Information and Geomatics, Guilin University of Technology, Guilin 541004, China
3 School of Civil Engineering, Purdue University, 550 Stadium Mall Drive, West Lafayette, IN 47907-2051, USA
Remote Sens. 2017, 9(7), 717; https://doi.org/10.3390/rs9070717 - 12 Jul 2017
Cited by 40 | Viewed by 6667
Abstract
Synthetic Aperture Radar Interferometry (InSAR), widely applied for the monitoring of land subsidence, has the advantage of high accuracy and wide coverage. High-resolution SAR data offers a chance to reveal impressive details of large-scale man-made linear features (LMLFs) with Multi-temporal InSAR (MT-InSAR) analysis. [...] Read more.
Synthetic Aperture Radar Interferometry (InSAR), widely applied for the monitoring of land subsidence, has the advantage of high accuracy and wide coverage. High-resolution SAR data offers a chance to reveal impressive details of large-scale man-made linear features (LMLFs) with Multi-temporal InSAR (MT-InSAR) analysis. Despite these advantages, research validating high-resolution MT-InSAR results along high-speed railways with high spatial and temporal density leveling data is limited. This paper explored the monitoring ability of high-resolution MT-InSAR in an experiment along Jingjin Inter-City Railway, located in Tianjin, China. Validation between these MT-InSAR results and a high spatial/temporal density leveling measurement was conducted. A total of 37 TSX images spanning half a year were processed for MT-InSAR analysis. The distance between two consecutive leveling points is 60 m along Jingjin Inter-City railway and the time interval of the study was about one month. The Root Mean Square Error (RMSE) index of average subsidence rate comparison between MT-InSAR results and leveling data was 3.28 mm/yr, with 34 points, and that of the displacement comparison was 2.90 mm with 464 valid observations. The experimental results along Jingjin Inter-City railway showed a high correlation between these two distinct measurements. These analyses show that millimeter accuracy can be achieved with MT-InSAR analysis when monitoring subsidence along a high-speed railway. We discuss the possible reason for the subsiding center, and the characteristics of both leveling and MT-InSAR results. We propose further planning for the monitoring of subsidence over LMLFs. Full article
(This article belongs to the Section Remote Sensing in Geology, Geomorphology and Hydrology)
Show Figures

Graphical abstract

16 pages, 7350 KiB  
Article
A Method to Improve High-Resolution Sea Ice Drift Retrievals in the Presence of Deformation Zones
by Jakob Griebel 1,* and Wolfgang Dierking 1,2
1 The Alfred Wegener Institute, Helmholtz Centre for Polar and Marine Research, Bussestraße 24, 27570 Bremerhaven, Germany
2 Center for Integrated Remote Sensing and Forecasting for Arctic Operations, Arctic University of Norway, Sykehusvegen 21, 9019 Tromsø, Norway
Remote Sens. 2017, 9(7), 718; https://doi.org/10.3390/rs9070718 - 12 Jul 2017
Cited by 8 | Viewed by 5000
Abstract
Retrievals of sea ice drift from synthetic aperture radar (SAR) images at high spatial resolution are valuable for understanding kinematic behavior and deformation processes of the ice at different spatial scales. Ice deformation causes temporal changes in patterns observed in sequences of SAR [...] Read more.
Retrievals of sea ice drift from synthetic aperture radar (SAR) images at high spatial resolution are valuable for understanding kinematic behavior and deformation processes of the ice at different spatial scales. Ice deformation causes temporal changes in patterns observed in sequences of SAR images; which makes it difficult to retrieve ice displacement with algorithms based on correlation and feature identification techniques. Here, we propose two extensions to a pattern matching algorithm, with the objective to improve the reliability of the retrieved sea ice drift field at spatial resolutions of a few hundred meters. Firstly, we extended a reliability assessment proposed in an earlier study, which is based on analyzing texture and correlation parameters of SAR image pairs, with the aim to reject unreliable pattern matches. The second step is specifically adapted to the presence of deformation features to avoid the erasing of discontinuities in the drift field. We suggest an adapted detection scheme that identifies linear deformation features (LDFs) in the drift vector field, and detects and replaces outliers after considering the presence of such LDFs in their neighborhood. We validate the improvement of our pattern matching algorithm by comparing the automatically retrieved drift to manually derived reference data for three SAR scenes acquired over different sea ice covered regions. Full article
(This article belongs to the Section Ocean Remote Sensing)
Show Figures

Graphical abstract

10 pages, 1699 KiB  
Article
Modelling Shadow Using 3D Tree Models in High Spatial and Temporal Resolution
by Elena Rosskopf *, Christopher Morhart and Michael Nahm
Chair of Forest Growth and Dendroecology, Albert-Ludwigs-University Freiburg, Tennenbacher Street 4, 79106 Freiburg, Germany
Remote Sens. 2017, 9(7), 719; https://doi.org/10.3390/rs9070719 - 13 Jul 2017
Cited by 21 | Viewed by 8580
Abstract
Information about the availability of solar irradiance for crops is of high importance for improving management practices of agricultural ecosystems such as agroforestry systems (AFS). Hence, the development of a high-resolution model that allows for the quantification of tree shading on a diurnal [...] Read more.
Information about the availability of solar irradiance for crops is of high importance for improving management practices of agricultural ecosystems such as agroforestry systems (AFS). Hence, the development of a high-resolution model that allows for the quantification of tree shading on a diurnal and annual time scale is highly demanded to generate realistic estimations of the shading dynamics in a given AFS. We describe an approach using 3D data derived from a terrestrial laser scanner and the steps undertaken to develop a vector-based model that quantifies and visualizes the shadow cast by single trees at daily, monthly, seasonal or annual levels with the input of cylinder-based tree models. It is able to compute the shadow of given tree models in time intervals of 10 min. To simulate seasonal growth and shedding of leaves, ellipsoids as replacement for leaves can be added to the tips of the tree model’s branches. The shadow model is flexible in its input of location (latitude, longitude), tree architecture and temporal resolution. Due to the possibility to feed this model with factual climate data such as cloud covers, it represents the first 3D tree model that enables the user to retrospectively analyze the shadow regime below a given tree, and to quantify shadow-related developments in AFS. Full article
Show Figures

Graphical abstract

16 pages, 2179 KiB  
Article
Assessment of GPM and TRMM Precipitation Products over Singapore
by Mou Leong Tan 1,2 and Zheng Duan 3,*
1 Geography Section, School of Humanities, Universiti Sains Malaysia, 11800 Penang, Malaysia
2 Department of Civil and Environmental Engineering, National University of Singapore, No. 1 Engineering Drive 2, Singapore 117576, Singapore
3 Chair of Hydrology and River Basin Management, Technical University of Munich, Arcisstrasse 21, 80333 Munich, Germany
Remote Sens. 2017, 9(7), 720; https://doi.org/10.3390/rs9070720 - 13 Jul 2017
Cited by 209 | Viewed by 12297
Abstract
The evaluation of satellite precipitation products (SPPs) at regional and local scales is essential in improving satellite-based algorithms and sensors, as well as in providing valuable guidance when choosing alternative precipitation data for the local community. The Tropical Rainfall Measuring Mission (TRMM) has [...] Read more.
The evaluation of satellite precipitation products (SPPs) at regional and local scales is essential in improving satellite-based algorithms and sensors, as well as in providing valuable guidance when choosing alternative precipitation data for the local community. The Tropical Rainfall Measuring Mission (TRMM) has made significant contributions to the development of various SPPs since its launch in 1997. The Global Precipitation Measurement (GPM) mission launched in 2014 and is expected to continue the success of TRMM. During the transition from the TRMM era to the GPM era, it is necessary to assess GPM products and make comparisons with TRMM products in different regions to achieve a global view of the performance of GPM products. To this end, this study aims to assess the capability of the latest Integrated Multi-satellite Retrievals for GPM (IMERG) and two TRMM Multisatellite Precipitation Analysis (TMPA) products (TMPA 3B42 and TMPA 3B42RT) in estimating precipitation over Singapore that represents a typical tropical region. The evaluation was conducted at daily, monthly, seasonal and annual scales from 1 April 2014 to 31 January 2016. The capability of SPPs in detecting rainy/non-rainy days and different precipitation classes was also evaluated. The findings showed that: (1) all SPPs correlated well with measurements from gauges at the monthly scale, but moderately at the daily scale; (2) SPPs performed better in the northeast monsoon season (1 December–15 March) than in the inter-monsoon 1 (16 March–31 May), southwest monsoon (1 June–30 September) and inter-monsoon 2 (1 October–30 November) seasons; (3) IMERG had better performance in the characterization of spatial precipitation variability and precipitation detection capability compared to the TMPA products; (4) for the daily precipitation estimates, IMERG had the lowest systematic bias, followed by 3B42 and 3B42RT; and (5) most of the SPPs overestimated moderate precipitation events (1–20 mm/day), while underestimating light (0.1–1 mm/day) and heavy (>20 mm/day) precipitation events. Overall, IMERG is superior but with only slight improvement compared to the TMPA products over Singapore. This study is one of the earliest assessments of IMERG and a comparison of it with TMPA products in Singapore. Our findings were compared with existing studies conducted in other regions, and some limitations of the IMERG and TMPA products in this tropical region were identified and discussed. This study provides an added value to the understanding of the global performance of the IMERG product. Full article
Show Figures

Figure 1

13 pages, 6410 KiB  
Article
Papaya Tree Detection with UAV Images Using a GPU-Accelerated Scale-Space Filtering Method
by Hao Jiang 1, Shuisen Chen 1,*, Dan Li 1, Chongyang Wang 1,2,3 and Ji Yang 1,2,3
1 Guangdong Open Laboratory of Geospatial Information Technology and Application, Key Laboratory of Guangdong for Utilization of Remote Sensing and Geographical Information System, Engineering Technology Center of Remote Sensing Big Data Application of Guangdong Province, Guangzhou Institute of Geography, Guangzhou 510070, China
2 Guangzhou Institute of Geochemistry, Guangzhou 510640, China
3 University of Chinese Academy of Sciences, Beijing 100049, China
Remote Sens. 2017, 9(7), 721; https://doi.org/10.3390/rs9070721 - 13 Jul 2017
Cited by 40 | Viewed by 6832
Abstract
The use of unmanned aerial vehicles (UAV) can allow individual tree detection for forest inventories in a cost-effective way. The scale-space filtering (SSF) algorithm is commonly used and has the capability of detecting trees of different crown sizes. In this study, we made [...] Read more.
The use of unmanned aerial vehicles (UAV) can allow individual tree detection for forest inventories in a cost-effective way. The scale-space filtering (SSF) algorithm is commonly used and has the capability of detecting trees of different crown sizes. In this study, we made two improvements with regard to the existing method and implementations. First, we incorporated SSF with a Lab color transformation to reduce over-detection problems associated with the original luminance image. Second, we ported four of the most time-consuming processes to the graphics processing unit (GPU) to improve computational efficiency. The proposed method was implemented using PyCUDA, which enabled access to NVIDIA’s compute unified device architecture (CUDA) through high-level scripting of the Python language. Our experiments were conducted using two images captured by the DJI Phantom 3 Professional and a most recent NVIDIA GPU GTX1080. The resulting accuracy was high, with an F-measure larger than 0.94. The speedup achieved by our parallel implementation was 44.77 and 28.54 for the first and second test image, respectively. For each 4000 × 3000 image, the total runtime was less than 1 s, which was sufficient for real-time performance and interactive application. Full article
Show Figures

Graphical abstract

14 pages, 7884 KiB  
Article
Estimation of SOS and EOS for Midwestern US Corn and Soybean Crops
by Jie Ren *, James B. Campbell and Yang Shao
Virginia Tech Department of Geography, 115 Major Williams Hall 220 Stanger St., Blacksburg, VA 24060, USA
Remote Sens. 2017, 9(7), 722; https://doi.org/10.3390/rs9070722 - 13 Jul 2017
Cited by 31 | Viewed by 7513
Abstract
Understanding crop phenology is fundamental to agricultural production, management, planning, and decision-making. This study used 250 m 16-day Moderate Resolution Imaging Spectroradiometer (MODIS) Enhanced Vegetation Index (EVI) time-series data to detect crop phenology across the Midwestern United States, 2007–2015. Key crop phenology metrics, [...] Read more.
Understanding crop phenology is fundamental to agricultural production, management, planning, and decision-making. This study used 250 m 16-day Moderate Resolution Imaging Spectroradiometer (MODIS) Enhanced Vegetation Index (EVI) time-series data to detect crop phenology across the Midwestern United States, 2007–2015. Key crop phenology metrics, start of season (SOS) and end of season (EOS), were estimated for corn and soybean. For such a large study region, we found that MODIS-estimated SOS and EOS values were highly dependent on the nature of input time-series data, analytical methods, and threshold values chosen for crop phenology detection. With the entire sequence of MODIS EVI time-series data as input, SOS values were inconsistent compared to crop emergent dates from the United States Department of Agriculture (USDA) Crop Progress Reports (CPR). However, when we removed winter EVI images from the time-series data to reduce impacts of snow cover, we obtained much more consistent SOS estimation. Various threshold values (10 to 50% of seasonal EVI amplitude) were applied to derive SOS values. For both corn’s and soybean’s SOS estimation, a threshold value of 25% generated the best overall agreement with the CPR crop emergent dates. Root-mean-square error (RMSE) values were 4.81 and 5.30 days for corn and soybean, respectively. For corn’s EOS estimation, a threshold value of 40% led to a high R2 value of 0.82 and RMSE value of 5.16 days. We further examined spatial patterns of SOS and EOS for both crops—SOS for corn displayed a clear south-north gradient; the southern portion of the Midwest US has earlier SOS and EOS dates. Full article
(This article belongs to the Section Remote Sensing in Agriculture and Vegetation)
Show Figures

Graphical abstract

22 pages, 5576 KiB  
Article
Evaluation of the Multi-Scale Ultra-High Resolution (MUR) Analysis of Lake Surface Temperature
by Erik Crosman 1,*, Jorge Vazquez-Cuervo 2 and Toshio Michael Chin 2
1 Department of Atmospheric Sciences, University of Utah, 135 South 1460 East, Rm 819, Salt Lake City, UT 84112, USA
2 National Aeronautics and Space Administration Jet Propulsion Laboratory, California Institute of Technology, M/S 300/323 4800 Oak Grove Dr., Pasadena, CA 91109, USA
Remote Sens. 2017, 9(7), 723; https://doi.org/10.3390/rs9070723 - 13 Jul 2017
Cited by 6 | Viewed by 6491
Abstract
Obtaining accurate and timely lake surface water temperature (LSWT) analyses from satellite remains difficult. Data gaps, cloud contamination, variations in atmospheric profiles of temperature and moisture, and a lack of in situ observations provide challenges for satellite-derived LSWT for climatological analysis or input [...] Read more.
Obtaining accurate and timely lake surface water temperature (LSWT) analyses from satellite remains difficult. Data gaps, cloud contamination, variations in atmospheric profiles of temperature and moisture, and a lack of in situ observations provide challenges for satellite-derived LSWT for climatological analysis or input into geophysical models. In this study, the Multi-scale Ultra-high Resolution (MUR) analysis of LSWT is evaluated between 2007 and 2015 over a small (Lake Oneida), medium (Lake Okeechobee), and large (Lake Michigan) lake. The advantages of the MUR LSWT analyses include daily consistency, high-resolution (~1 km), near-real time production, and multi-platform data synthesis. The MUR LSWT versus in situ measurements for Lake Michigan (Lake Okeechobee) have an overall bias (MUR LSWT-in situ) of −0.20 °C (0.31 °C) and a RMSE of 0.86 °C (0.91 °C). The MUR LSWT versus in situ measurements for Lake Oneida have overall large biases (−1.74 °C) and RMSE (3.42°C) due to a lack of available satellite imagery over the lake, but performs better during the less cloudy 15 July–30 September period. The results of this study highlight the importance of calculating validation statistics on a seasonal and annual basis for evaluating satellite-derived LSWT. Full article
(This article belongs to the Special Issue Sea Surface Temperature Retrievals from Remote Sensing)
Show Figures

Graphical abstract

23 pages, 26731 KiB  
Article
Super-Resolution Reconstruction of Remote Sensing Images Using Multiple-Point Statistics and Isometric Mapping
by Ting Zhang 1, Yi Du 2 and Fangfang Lu 1,*
1 College of Computer Science and Technology, Shanghai University of Electric Power, 2588 Changyang Road, Shanghai 200090, China
2 School of Engineering, Shanghai Polytechnic University, 2360 Jinhai Road, Shanghai 201209, China
Remote Sens. 2017, 9(7), 724; https://doi.org/10.3390/rs9070724 - 15 Jul 2017
Cited by 14 | Viewed by 5254
Abstract
When using coarse-resolution remote sensing images, super-resolution reconstruction is widely desired, and can be realized by reproducing the intrinsic features from a set of coarse-resolution fraction data to fine-resolution remote sensing images that are consistent with the coarse fraction information. Prior models of [...] Read more.
When using coarse-resolution remote sensing images, super-resolution reconstruction is widely desired, and can be realized by reproducing the intrinsic features from a set of coarse-resolution fraction data to fine-resolution remote sensing images that are consistent with the coarse fraction information. Prior models of spatial structures that encode the expected features at the fine (target) resolution are helpful to constrain the spatial patterns of remote sensing images to be generated at that resolution. These prior models can be used properly by multiple-point statistics (MPS), capable of extracting the intrinsic features of patterns from prior models such as training images, and copying them to the simulated regions using hard and soft conditional data, or even without any conditional data. However, because traditional MPS methods based on linear dimensionality reduction are not suitable to deal with nonlinear data, and isometric mapping (ISOMAP) can reduce the dimensionality of nonlinear data effectively, this paper presents a sequential simulation framework for generating super-resolution remote sensing images using ISOMAP and MPS. Using four different examples, it is demonstrated that the structural characteristics of super-resolution reconstruction of remote sensing images using this method, are similar to those of training images. Full article
(This article belongs to the Section Remote Sensing in Geology, Geomorphology and Hydrology)
Show Figures

Figure 1

24 pages, 92781 KiB  
Article
High-Resolution Remote Sensing Image Retrieval Based on CNNs from a Dimensional Perspective
by Zhifeng Xiao, Yang Long *, Deren Li, Chunshan Wei, Gefu Tang and Junyi Liu
State Key Laboratory of Information Engineering in Surveying, Mapping and Remote Sensing, Wuhan University, Wuhan 430079, China
Remote Sens. 2017, 9(7), 725; https://doi.org/10.3390/rs9070725 - 14 Jul 2017
Cited by 68 | Viewed by 8590
Abstract
Because of recent advances in Convolutional Neural Networks (CNNs), traditional CNNs have been employed to extract thousands of codes as feature representations for image retrieval. In this paper, we propose that more powerful features for high-resolution remote sensing image representations can be learned [...] Read more.
Because of recent advances in Convolutional Neural Networks (CNNs), traditional CNNs have been employed to extract thousands of codes as feature representations for image retrieval. In this paper, we propose that more powerful features for high-resolution remote sensing image representations can be learned using only several tens of codes; this approach can improve the retrieval accuracy and decrease the time and storage requirements. To accomplish this goal, we first investigate the learning of a series of features with different dimensions using a few tens to thousands of codes via our improved CNN frameworks. Then, a Principal Component Analysis (PCA) is introduced to compress the high-dimensional remote sensing image feature codes learned by traditional CNNs. Comprehensive comparisons are conducted to evaluate the retrieval performance based on feature codes of different dimensions learned by the improved CNNs as well as the PCA compression. To further demonstrate the powerful ability of the low-dimensional feature representation learned by the improved CNN frameworks, a Feature Weighted Map (FWM), which can perform feature visualization and provides a better understanding of the nature of Deep Convolutional Neural Networks (DCNNs) frameworks, is explored. All the CNN models are trained from scratch using a large-scale and high-resolution remote sensing image archive, which will be published and made available to the public. The experimental results show that our method outperforms state-of-the-art CNN frameworks in terms of accuracy and storage. Full article
Show Figures

Graphical abstract

21 pages, 7466 KiB  
Article
Retrieval of Biophysical Crop Variables from Multi-Angular Canopy Spectroscopy
by Martin Danner *, Katja Berger, Matthias Wocher, Wolfram Mauser and Tobias Hank
Department of Geography, Ludwig-Maximilians-Universität München, Luisenstraße 37, D-80333 Munich, Germany
Remote Sens. 2017, 9(7), 726; https://doi.org/10.3390/rs9070726 - 14 Jul 2017
Cited by 65 | Viewed by 7748
Abstract
The future German Environmental Mapping and Analysis Program (EnMAP) mission, due to launch in late 2019, will deliver high resolution hyperspectral data from space and will thus contribute to a better monitoring of the dynamic surface of the earth. Exploiting the satellite’s ±30° [...] Read more.
The future German Environmental Mapping and Analysis Program (EnMAP) mission, due to launch in late 2019, will deliver high resolution hyperspectral data from space and will thus contribute to a better monitoring of the dynamic surface of the earth. Exploiting the satellite’s ±30° across-track pointing capabilities will allow for the collection of hyperspectral time-series of homogeneous quality. Various studies have shown the possibility to retrieve geo-biophysical plant variables, like leaf area index (LAI) or leaf chlorophyll content (LCC), from narrowband observations with fixed viewing geometry by inversion of radiative transfer models (RTM). In this study we assess the capability of the well-known PROSPECT 5B + 4SAIL (Scattering by Arbitrarily Inclined Leaves) RTM to estimate these variables from off-nadir observations obtained during a field campaign with respect to EnMAP-like sun–target–sensor-geometries. A novel approach for multiple inquiries of a large look-up-table (LUT) in hierarchical steps is introduced that accounts for the varying instances of all variables of interest. Results show that anisotropic effects are strongest for early growth stages of the winter wheat canopy which influences also the retrieval of the variables. RTM inversions from off-nadir spectra lead to a decreased accuracy for the retrieval of LAI with a relative root mean squared error (rRMSE) of 18% at nadir vs. 25% (backscatter) and 24% (forward scatter) at off-nadir. For LCC estimations, however, off-nadir observations yield improvements, i.e., rRMSE (nadir) = 24% vs. rRMSE (forward scatter) = 20%. It follows that for a variable retrieval through RTM inversion, the final user will benefit from EnMAP time-series for biophysical studies regardless of the acquisition angle and will thus be able to exploit the maximum revisit capability of the mission. Full article
Show Figures

Graphical abstract

23 pages, 3651 KiB  
Article
100 Years of Competition between Reduction in Channel Capacity and Streamflow during Floods in the Guadalquivir River (Southern Spain)
by Patricio Bohorquez * and José David Del Moral-Erencia
Centro de Estudios Avanzados en Ciencias de la Tierra (CEACTierra), Universidad de Jaén, Campus de las Lagunillas, 23071 Jaén, Spain
Remote Sens. 2017, 9(7), 727; https://doi.org/10.3390/rs9070727 - 14 Jul 2017
Cited by 20 | Viewed by 6363
Abstract
Reduction in channel capacity can trigger an increase in flood hazard over time. It represents a geomorphic driver that competes against its hydrologic counterpart where streamflow decreases. We show that this situation arose in the Guadalquivir River (Southern Spain) after impoundment. We identify [...] Read more.
Reduction in channel capacity can trigger an increase in flood hazard over time. It represents a geomorphic driver that competes against its hydrologic counterpart where streamflow decreases. We show that this situation arose in the Guadalquivir River (Southern Spain) after impoundment. We identify the physical parameters that raised flood hazard in the period 1997–2013 with respect to past years 1910–1996 and quantify their effects by accounting for temporal trends in both streamflow and channel capacity. First, we collect historical hydrological data to lengthen records of extreme flooding events since 1910. Next, inundated areas and grade lines across a 70 km stretch of up to 2 km wide floodplain are delimited from Landsat and TerraSAR-X satellite images of the most recent floods (2009–2013). Flooded areas are also computed using standard two-dimensional Saint-Venant equations. Simulated stages are verified locally and across the whole domain with collected hydrological data and satellite images, respectively. The thoughtful analysis of flooding and geomorphic dynamics over multi-decadal timescales illustrates that non-stationary channel adaptation to river impoundment decreased channel capacity and increased flood hazard. Previous to channel squeezing and pre-vegetation encroachment, river discharges as high as 1450 m3·s−1 (the year 1924) were required to inundate the same areas as the 790 m3·s−1 streamflow for recent floods (the year 2010). We conclude that future projections of one-in-a-century river floods need to include geomorphic drivers as they compete with the reduction of peak discharges under the current climate change scenario. Full article
(This article belongs to the Special Issue Remote Sensing of Climate Change and Water Resources)
Show Figures

Graphical abstract

14 pages, 1634 KiB  
Article
Estimating Tropical Cyclone Size in the Northwestern Pacific from Geostationary Satellite Infrared Images
by Xiaoqin Lu 1, Hui Yu 1, Xiaoming Yang 2 and Xiaofeng Li 3,*
1 Shanghai Typhoon Institute, China Meteorological Administration, No. 166, Puxi Rd., Shanghai 200030, China
2 Shanghai Ocean University, No. 999, Huchenghuan Rd., Shanghai 201306, China
3 GST at National Oceanic and Atmospheric Administration (NOAA)/NESDIS, College Park, MD 20740-3818, USA
Remote Sens. 2017, 9(7), 728; https://doi.org/10.3390/rs9070728 - 14 Jul 2017
Cited by 56 | Viewed by 7472
Abstract
Thirty-year (1980–2009) tropical cyclone (TC) images from geostationary satellite (GOES, Meteosat, GMS, MTSAT and FY2) infrared sensors covering the Northwestern Pacific were used to build a TC size dataset based on objective models. The models are based on a correlation between the size [...] Read more.
Thirty-year (1980–2009) tropical cyclone (TC) images from geostationary satellite (GOES, Meteosat, GMS, MTSAT and FY2) infrared sensors covering the Northwestern Pacific were used to build a TC size dataset based on objective models. The models are based on a correlation between the size of TCs, defined as the mean azimuth radius of 34 kt surface winds (R34) and the brightness temperature radial profiles derived from satellite imagery. Using satellite images between 2001 and 2009, we obtained 16,548 matchup samples and found the correlation to be positive in the TC’s inner core region (in the annulus field 64 km from the TC center) and negative in its outer region (in the annulus field 100–250 km from the TC center). Then, we performed a stepwise regression to select the dominant variables and derived the associated coefficients for the objective models. Independent validation against best track archives shows the median estimation error to be between 27 and 65 km, which are not significantly different to other satellite series data. Finally, we applied the models to 721 TCs and made 13,726 measurements of TC size. The difference of mean TC size derived from our models, and also that from the US Joint Typhoon Warning Center (JTWC) best track archives is 19 km. The developed database is valuable in the research fields of TC structure, climatology, and the initialization of forecasting models. Full article
(This article belongs to the Section Ocean Remote Sensing)
Show Figures

Figure 1

18 pages, 5974 KiB  
Article
Urban Land-Cover Dynamics in Arid China Based on High-Resolution Urban Land Mapping Products
by Tao Pan 1,2, Dengsheng Lu 3, Chi Zhang 1,*, Xi Chen 1, Hua Shao 1, Wenhui Kuang 4, Wenfeng Chi 4,5, Zhengjia Liu 4,6, Guoming Du 7 and Liangzhong Cao 1,2
1 State Key Laboratory of Desert and Oasis Ecology, Xinjiang Institute of Ecology and Geography, Chinese Academy of Sciences, Urumqi 830011, China
2 University of Chinese Academy of Sciences, Beijing 100049, China
3 Key Laboratory of Carbon Cycling in Forest Ecosystems and Carbon Sequestration of Zhejiang Province, School of Environmental & Resource Sciences, Zhejiang Agriculture and Forestry University, Lin An 311300, China
4 Institute of Geographic Sciences and Natural Resources Research, Chinese Academy of Sciences, Beijing 100101, China
5 Inner Mongolia University of Finance and Economics, Inner Mongolia, Hohhot 010018, China
6 Institute of Remote Sensing and Digital Earth, Chinese Academy of Sciences, Beijing 100094, China
7 College of Resources and Environmental Sciences, Northeast Agricultural University, Harbin 150030, China
Remote Sens. 2017, 9(7), 730; https://doi.org/10.3390/rs9070730 - 14 Jul 2017
Cited by 21 | Viewed by 6436
Abstract
Rapid urbanization has occurred in northwestern China, threatening the sustainability of its fragile dryland ecosystems. A lack of precise urban land-cover information has limited our understanding on the urbanization in the dryland. Here, we examined urban land-cover changes from 2000 to 2014 in [...] Read more.
Rapid urbanization has occurred in northwestern China, threatening the sustainability of its fragile dryland ecosystems. A lack of precise urban land-cover information has limited our understanding on the urbanization in the dryland. Here, we examined urban land-cover changes from 2000 to 2014 in 21 major cities that comprise over 50% of the developed land in arid China, using Landsat Enhanced Thematic Mapper Plus and Operational Land Imager data, and a hybrid classification method. The 15-m resolution urban land-cover products (including impervious surfaces, vegetation, bare soil, and water bodies) had an overall accuracy of 90.37%. Based on these new land use products, we found the urbanization in arid China was characterized by the dramatic expansion of impervious surface (+13.23%) and reduction of bare soil (−13.41%), while the proportions of vegetation (+0.27%) and water (−0.10%) remained stable. The observed dynamic equilibrium of vegetated ratio implies an increasing harmonization of urbanization and greening, which was particularly important for the sustainability of fragile urban ecosystems in arid regions. From an economic perspective, gross domestic product and population were significantly correlated with impervious surfaces, and oasis cities displayed a stronger ability to attract new residents than desert cities. Full article
(This article belongs to the Special Issue Remote Sensing of Urban Ecology)
Show Figures

Graphical abstract

20 pages, 3374 KiB  
Article
Continued Reforestation and Urban Expansion in the New Century of a Tropical Island in the Caribbean
by Chao Wang, Mei Yu * and Qiong Gao
Department of Environmental Science, University of Puerto Rico-Rio Piedras, San Juan, PR 00936, USA
Remote Sens. 2017, 9(7), 731; https://doi.org/10.3390/rs9070731 - 15 Jul 2017
Cited by 17 | Viewed by 6335
Abstract
Accurate and timely monitoring of tropical land cover/use (LCLU) changes is urgent due to the rapid deforestation/reforestation and its impact on global land-atmosphere interaction. However, persistent cloud cover in the tropics imposes the greatest challenge and retards LCLU mapping in mountainous areas such [...] Read more.
Accurate and timely monitoring of tropical land cover/use (LCLU) changes is urgent due to the rapid deforestation/reforestation and its impact on global land-atmosphere interaction. However, persistent cloud cover in the tropics imposes the greatest challenge and retards LCLU mapping in mountainous areas such as the tropic island of Puerto Rico, where forest transition changed from deforestation to reforestation due to the economy shift from agriculture to industry and service after the 1940s. To improve the LCLU mapping in the tropics and to evaluate the trend of forest transition of Puerto Rico in the new century, we integrated the optical Landsat images with the L-band SAR to map LC in 2010 by taking advantage of the cloud-penetrating ability of the SAR signals. The results showed that the incorporation of SAR data with the Landsat data significantly, although not substantially, enhanced the accuracy of LCLU mapping of Puerto Rico, and the Kappa statistic reached 90.5% from 88.4% without SAR data. The enhancement of mapping by SAR is important for urban and forest, as well as locations with limited optical data caused by cloud cover. We found both forests and urban lands continued expanding in the new century despite the declining population. However, the forest cover change slowed down in 2000–2010 compared to that in 1991–2000. The deforestation rate reduced by 42.1% in 2000–2010, and the reforestation was mostly located in the east and southeast of the island where Hurricane Georges landed and caused severe vegetation damage in 1998. We also found that reforestation increased, but deforestation decreased along the topography slope. Reforestation was much higher within the protected area compared to that in the surroundings in the wet and moist forest zones. Full article
(This article belongs to the Section Forest Remote Sensing)
Show Figures

Figure 1

30 pages, 4047 KiB  
Article
New Approach for Calculating the Effective Dielectric Constant of the Moist Soil for Microwaves
by Chang-Hwan Park 1,2,*, Andreas Behrendt 1, Ellsworth LeDrew 3 and Volker Wulfmeyer 1
1 Institute of Physics and Meteorology, University of Hohenheim, Stuttgart 70599, Germany
2 Center for Applied Geoscience, University of Tübingen, Tübingen 72076, Germany
3 Geography and Environmental Management, University of Waterloo, Waterloo, ON N2L 3G1, Canada
Remote Sens. 2017, 9(7), 732; https://doi.org/10.3390/rs9070732 - 15 Jul 2017
Cited by 51 | Viewed by 11643
Abstract
Microwave remote sensing techniques are used, among others, for temporally and spatially highly-resolved observations of land-surface properties, e.g., for the management of agricultural productivity and water resource, as well as to improve the performances of numerical weather prediction and climate simulations with soil [...] Read more.
Microwave remote sensing techniques are used, among others, for temporally and spatially highly-resolved observations of land-surface properties, e.g., for the management of agricultural productivity and water resource, as well as to improve the performances of numerical weather prediction and climate simulations with soil moisture data. In this context, the effective dielectric constant of the soil is a key variable to quantify the land surface properties. We propose a new approach for the effective dielectric constant of the multiphase soil that is based on an arithmetic average of the dielectric constants of the land-surface components with damping. The results show, on average, better agreement with experimental data than previous approaches. Furthermore, the proposed new model overcomes the theoretical limitation of previous models in the incorporation of non-physical parameters to simulate measured data experimentally with satisfactory accuracy. For microwave remote sensing such as SMAP (Soil Moisture Active Passive), SMOS (Soil Moisture and Ocean Salinity) and AMSR-E (Advanced Microwave Scanning Radiometer for EOS), the physical-based model in our study showed a 23–35% RMSE (root-mean-square error) reduction compared to the most prevalent refractive mixing model in the prediction of the dielectric constant for the real and imaginary part, respectively. Furthermore, in radiowave bands used in portable soil sensors such as TDR (time-domain reflectometer) and GPR (ground-penetrating radar) the new dielectric mixing model reduced RMSE by up to 53% in the prediction of the dielectric constant. We found that the permittivity over the saturation point (porosity of dry soil) has a very different and varying pattern compared to that measured in the unsaturated condition. However, in our study, this pattern was mathematically derived from the same mixing rule applied for the unsaturated condition. It is expected that the new dielectric mixing model might help to improve the accuracy of flood monitoring by satellite. Full article
(This article belongs to the Section Remote Sensing in Geology, Geomorphology and Hydrology)
Show Figures

Graphical abstract

22 pages, 2976 KiB  
Article
Terrestrial Remote Sensing of Snowmelt in a Diverse High-Arctic Tundra Environment Using Time-Lapse Imagery
by Daniel Kępski 1,*, Bartłomiej Luks 1, Krzysztof Migała 2, Tomasz Wawrzyniak 1, Sebastian Westermann 3 and Bronisław Wojtuń 4
1 Institute of Geophysics, Polish Academy of Sciences, Księcia Janusza 64, 01-452 Warsaw, Poland
2 Department of Climatology and Atmosphere Protection, University of Wroclaw, Kosiby 8, 54-621 Wrocław, Poland
3 Department of Geosciences, University of Oslo, Postboks 1047 Blindern, 0316 Oslo, Norway
4 Department of Ecology, Biogeochemistry and Environmental Protection, University of Wroclaw, Kanonia 6/8, 50-328 Wrocław, Poland
Remote Sens. 2017, 9(7), 733; https://doi.org/10.3390/rs9070733 - 15 Jul 2017
Cited by 28 | Viewed by 9566
Abstract
Snow cover is one of the crucial factors influencing the plant distribution in harsh Arctic regions. In tundra environments, wind redistribution of snow leads to a very heterogeneous spatial distribution which influences growth conditions for plants. Therefore, relationships between snow cover and vegetation [...] Read more.
Snow cover is one of the crucial factors influencing the plant distribution in harsh Arctic regions. In tundra environments, wind redistribution of snow leads to a very heterogeneous spatial distribution which influences growth conditions for plants. Therefore, relationships between snow cover and vegetation should be analyzed spatially. In this study, we correlate spatial data sets on tundra vegetation types with snow cover information obtained from orthorectification and classification of images collected from a time-lapse camera installed on a mountain summit. The spatial analysis was performed over an area of 0.72 km2, representing a coastal tundra environment in southern Svalbard. The three-year monitoring is supplemented by manual measurements of snow depth, which show a statistically significant relationship between snow abundance and the occurrence of some of the analyzed land cover types. The longest snow cover duration was found on “rock debris” type and the shortest on “lichen-herb-heath tundra”, resulting in melt-out time-lag of almost two weeks between this two land cover types. The snow distribution proved to be consistent over the different years with a similar melt-out pattern occurring in every analyzed season, despite changing melt-out dates related to different weather conditions. The data set of 203 high resolution processed images used in this work is available for download in the supplementary materials. Full article
(This article belongs to the Special Issue Snow Remote Sensing)
Show Figures

Graphical abstract

21 pages, 2055 KiB  
Article
Considering Inter-Frequency Clock Bias for BDS Triple-Frequency Precise Point Positioning
by Lin Pan 1,2,3, Xingxing Li 1,4,*, Xiaohong Zhang 1,2,3, Xin Li 1, Cuixian Lu 4, Qile Zhao 5 and Jingnan Liu 1,5
1 School of Geodesy and Geomatics, Wuhan University, 129 Luoyu Road, Wuhan 430079, China
2 Collaborative Innovation Center for Geospatial Technology, 129 Luoyu Road, Wuhan 430079, China
3 Key Laboratory of Geospace Environment and Geodesy, Ministry of Education, Wuhan University, 129 Luoyu Road, Wuhan 430079, China
4 German Research Centre for Geosciences (GFZ), Telegrafenberg, 14473 Potsdam, Germany
5 GNSS Research Center, Wuhan University, 129 Luoyu Road, Wuhan 430079, China
Remote Sens. 2017, 9(7), 734; https://doi.org/10.3390/rs9070734 - 15 Jul 2017
Cited by 36 | Viewed by 6363
Abstract
The joint use of multi-frequency signals brings new prospects for precise positioning and has become a trend in Global Navigation Satellite System (GNSS) development. However, a new type of inter-frequency clock bias (IFCB), namely the difference between satellite clocks computed with different ionospheric-free [...] Read more.
The joint use of multi-frequency signals brings new prospects for precise positioning and has become a trend in Global Navigation Satellite System (GNSS) development. However, a new type of inter-frequency clock bias (IFCB), namely the difference between satellite clocks computed with different ionospheric-free carrier phase combinations, was noticed. Consequently, the B1/B3 precise point positioning (PPP) cannot directly use the current B1/B2 clock products. Datasets from 35 globally distributed stations are employed to investigate the IFCB. For new generation BeiDou Navigation Satellite System (BDS) satellites, namely BDS-3 satellites, the IFCB between B1/B2a and B1/B3 satellite clocks, between B1/B2b and B1/B3 satellite clocks, between B1C/B2a and B1C/B3 satellite clocks, and between B1C/B2b and B1C/B3 satellite clocks is analyzed, and no significant IFCB variations can be observed. The IFCB between B1/B2 and B1/B3 satellite clocks for BDS-2 satellites varies with time, and the IFCB variations are generally confined to peak amplitudes of about 5 cm. The IFCB of BDS-2 satellites exhibits periodic signal, and the accuracy of prediction for IFCB, namely the root mean square (RMS) statistic of the difference between predicted and estimated IFCB values, is 1.2 cm. A triple-frequency PPP model with consideration of IFCB is developed. Compared with B1/B2-based PPP, the positioning accuracy of triple-frequency PPP with BDS-2 satellites can be improved by 12%, 25% and 10% in east, north and vertical directions, respectively. Full article
Show Figures

Graphical abstract

20 pages, 9165 KiB  
Article
Large-Scale, Multi-Temporal Remote Sensing of Palaeo-River Networks: A Case Study from Northwest India and its Implications for the Indus Civilisation
by Hector A. Orengo 1,* and Cameron A. Petrie 2
1 McDonald Institute for Archaeological Research, University of Cambridge, Downing Street, Cambridge CB2 3ER, UK
2 Department of Archaeology and Anthropology, University of Cambridge, Downing Street, Cambridge CB2 3DZ, UK
Remote Sens. 2017, 9(7), 735; https://doi.org/10.3390/rs9070735 - 16 Jul 2017
Cited by 86 | Viewed by 16925
Abstract
Remote sensing has considerable potential to contribute to the identification and reconstruction of lost hydrological systems and networks. Remote sensing-based reconstructions of palaeo-river networks have commonly employed single or limited time-span imagery, which limits their capacity to identify features in complex and varied [...] Read more.
Remote sensing has considerable potential to contribute to the identification and reconstruction of lost hydrological systems and networks. Remote sensing-based reconstructions of palaeo-river networks have commonly employed single or limited time-span imagery, which limits their capacity to identify features in complex and varied landscape contexts. This paper presents a seasonal multi-temporal approach to the detection of palaeo-rivers over large areas based on long-term vegetation dynamics and spectral decomposition techniques. Twenty-eight years of Landsat 5 data, a total of 1711 multi-spectral images, have been bulk processed using Google Earth Engine© Code Editor and cloud computing infrastructure. The use of multi-temporal data has allowed us to overcome seasonal cultivation patterns and long-term visibility issues related to recent crop selection, extensive irrigation and land-use patterns. The application of this approach on the Sutlej-Yamuna interfluve (northwest India), a core area for the Bronze Age Indus Civilisation, has enabled the reconstruction of an unsuspectedly complex palaeo-river network comprising more than 8000 km of palaeo-channels. It has also enabled the definition of the morphology of these relict courses, which provides insights into the environmental conditions in which they operated. These new data will contribute to a better understanding of the settlement distribution and environmental settings in which this, often considered riverine, civilisation operated. Full article
Show Figures

Graphical abstract

17 pages, 4551 KiB  
Article
A Burned Area Mapping Algorithm for Chinese FengYun-3 MERSI Satellite Data
by Tianchan Shan 1,2, Changlin Wang 1, Fang Chen 1,2,3,*, Qinchun Wu 1,2, Bin Li 1, Bo Yu 1, Zeeshan Shirazi 1,2, Zhengyang Lin 1,2 and Wei Wu 1,2
1 Key Laboratory of Digital Earth Science, Institute of Remote Sensing and Digital Earth, Chinese Academy of Sciences, No. 9 Dengzhuang South Road, Beijing 100094, China
2 University of Chinese Academy of Sciences, Beijing 100049, China
3 Hainan Key Laboratory of Earth Observation, Institute of Remote Sensing and Digital Earth, Chinese Academy of Sciences, Sanya 572029, China
Remote Sens. 2017, 9(7), 736; https://doi.org/10.3390/rs9070736 - 16 Jul 2017
Cited by 11 | Viewed by 6643
Abstract
Biomass burning is a worldwide phenomenon, which emits large amounts of carbon into the atmosphere and strongly influences the environment. Burned area is an important parameter in modeling the impacts of biomass burning on the climate and ecosystem. The Medium Resolution Spectral Imager [...] Read more.
Biomass burning is a worldwide phenomenon, which emits large amounts of carbon into the atmosphere and strongly influences the environment. Burned area is an important parameter in modeling the impacts of biomass burning on the climate and ecosystem. The Medium Resolution Spectral Imager (MERSI) onboard FengYun-3C (FY-3C) has shown great potential for burned area mapping research, but there is still a lack of relevant studies and applications. This paper describes an automated burned area mapping algorithm that was developed using daily MERSI data. The algorithm employs time-series analysis and multi-temporal 1000-m resolution data to obtain seed pixels. To identify the burned pixels automatically, region growing and Support Vector Machine) methods have been used together with 250-m resolution data. The algorithm was tested by applying it in two experimental areas, and the accuracy of the results was evaluated by comparing them to reference burned area maps, which were interpreted manually using Landsat 8 OLI data and the MODIS MCD64A1 burned area product. The results demonstrated that the proposed algorithm was able to improve the burned area mapping accuracy at the two study sites. Full article
Show Figures

Figure 1

20 pages, 72641 KiB  
Article
Mathematical Modeling and Accuracy Testing of WorldView-2 Level-1B Stereo Pairs without Ground Control Points
by Jiang Ye 1,2,*, Xu Lin 2 and Tao Xu 2
1 Faculty of Geosciences and Environmental Engineering, Southwest Jiaotong University, Chengdu 610031, China
2 College of Earth Sciences, Chengdu University of Technology, Chengdu 610059, China
Remote Sens. 2017, 9(7), 737; https://doi.org/10.3390/rs9070737 - 17 Jul 2017
Cited by 8 | Viewed by 8612
Abstract
With very high resolution satellite (VHRS) imagery of 0.5 m, WorldView-2 (WV02) satellite images have been widely used in the field of surveying and mapping. However, for the specific WV02 satellite image geometric orientation model, there is a lack of detailed research and [...] Read more.
With very high resolution satellite (VHRS) imagery of 0.5 m, WorldView-2 (WV02) satellite images have been widely used in the field of surveying and mapping. However, for the specific WV02 satellite image geometric orientation model, there is a lack of detailed research and explanation. This paper elaborates the construction process of the WV02 satellite rigorous sensor model (RSM), which considers the velocity aberration, the optical path delay and the atmospheric refraction. We create a new physical inverse model based on a double-iterative method. Through this inverse method, we establish the virtual control grid in the object space to calculate the rational function model (RFM) coefficients. In the RFM coefficient calculation process, we apply the correcting characteristic value method (CCVM) and least squares (LS) method to compare the two experiments’ accuracies. We apply two stereo pairs of WV02 Level 1B products in Qinghai, China to verify the algorithm and test image positioning accuracy. Under the no-control conditions, the monolithic horizontal mean square error (RMSE) of the rational polynomial coefficient (RPC) is 3.8 m. This result is 13.7% higher than the original RPC positioning accuracy provided by commercial vendors. The stereo pair horizontal positioning accuracy of both the physical and RPC models is 5.0 m circular error 90% (CE90). This result is in accordance with the WV02 satellite images nominal positioning accuracy. This paper provides a new method to improve the positioning accuracy of the WV02 satellite image RPC model without GCPs. Full article
Show Figures

Graphical abstract

20 pages, 8806 KiB  
Article
Multi-Temporal X-Band Radar Interferometry Using Corner Reflectors: Application and Validation at the Corvara Landslide (Dolomites, Italy)
by Romy Schlögel 1, Benni Thiebes 1, Marco Mulas 2,*, Giovanni Cuozzo 1, Claudia Notarnicola 1, Stefan Schneiderbauer 1, Mattia Crespi 3, Augusto Mazzoni 3, Volkmar Mair 4 and Alessandro Corsini 2
1 Institute for Earth Observation, Eurac Research, Bolzano-Bozen 39100, Italy
2 Department of Chemical and Geological Sciences, University of Modena and Reggio Emilia, Modena 41121, Italy
3 Geodesy and Geomatics Division, Department of Civil, Constructional and Environmental Engineering, University of Rome “La Sapienza”, Roma 00184, Italy
4 Office for Geological Surveys and Building Material Test, Autonomous Province of Bolzano, Cardano-Kardaun 39053, Italy
Remote Sens. 2017, 9(7), 739; https://doi.org/10.3390/rs9070739 - 18 Jul 2017
Cited by 29 | Viewed by 8727
Abstract
From the wide range of methods available to landslide researchers and practitioners for monitoring ground displacements, remote sensing techniques have increased in popularity. Radar interferometry methods with their ability to record movements in the order of millimeters have been more frequently applied in [...] Read more.
From the wide range of methods available to landslide researchers and practitioners for monitoring ground displacements, remote sensing techniques have increased in popularity. Radar interferometry methods with their ability to record movements in the order of millimeters have been more frequently applied in recent years. Multi-temporal interferometry can assist in monitoring landslides on the regional and slope scale and thereby assist in assessing related hazards and risks. Our study focuses on the Corvara landslides in the Italian Alps, a complex earthflow with spatially varying displacement patterns. We used radar imagery provided by the COSMO-SkyMed constellation and carried out a validation of the derived time-series data with differential GPS data. Movement rates were assessed using the Permanent Scatterers based Multi-Temporal Interferometry applied to 16 artificial Corner Reflectors installed on the source, track and accumulation zones of the landslide. The overall movement trends were well covered by Permanent Scatterers based Multi-Temporal Interferometry, however, fast acceleration phases and movements along the satellite track could not be assessed with adequate accuracy due to intrinsic limitations of the technique. Overall, despite the intrinsic limitations, Multi-Temporal Interferometry proved to be a promising method to monitor landslides characterized by a linear and relatively slow movement rates. Full article
(This article belongs to the Special Issue Remote Sensing of Landslides)
Show Figures

Figure 1

15 pages, 1398 KiB  
Article
How Reliable Is Structure from Motion (SfM) over Time and between Observers? A Case Study Using Coral Reef Bommies
by Vincent Raoult 1,2,*, Sarah Reid-Anderson 1, Andreas Ferri 1 and Jane E. Williamson 1
1 Department of Biological Sciences, Macquarie University, Sydney 2109, Australia
2 School of Environmental and Life Sciences, University of Newcastle, Ourimbah 2258, Australia
Remote Sens. 2017, 9(7), 740; https://doi.org/10.3390/rs9070740 - 18 Jul 2017
Cited by 36 | Viewed by 8447
Abstract
Recent efforts to monitor the health of coral reefs have highlighted the benefits of using structure from motion-based assessments, and despite increasing use of this technique in ecology and geomorphology, no study has attempted to quantify the precision of this technique over time [...] Read more.
Recent efforts to monitor the health of coral reefs have highlighted the benefits of using structure from motion-based assessments, and despite increasing use of this technique in ecology and geomorphology, no study has attempted to quantify the precision of this technique over time and across different observers. This study determined whether 3D models of an ecologically relevant reef structure, the coral bommie, could be constructed using structure from motion and be reliably used to measure bommie volume and surface area between different observers and over time. We also determined whether the number of images used to construct a model had an impact on the final measurements. Three dimensional models were constructed of over twenty coral bommies from Heron Island, a coral cay at the southern end of the Great Barrier Reef. This study did not detect any significant observer effect, and there were no significant differences in measurements over four sampling days. The mean measurement error across all bommies and between observers was 15 ± 2% for volume measurements and 12 ± 1% for surface area measurements. There was no relationship between the number of pictures taken for a reconstruction and the measurements from that model, however, more photographs were necessary to be able to reconstruct complete coral bommies larger than 1 m3. These results suggest that structure from motion is a viable tool for ongoing monitoring of ecologically-significant coral reefs, especially to establish effects of disturbances, provided the measurement error is considered. Full article
(This article belongs to the Section Ocean Remote Sensing)
Show Figures

Graphical abstract

19 pages, 12616 KiB  
Article
High Precision DEM Generation Algorithm Based on InSAR Multi-Look Iteration
by Xiaoming Gao 3, Yaolin Liu 1,*, Tao Li 2 and Danqin Wu 4
1 School of Resource and Environmental Sciences, Wuhan University, No. 129, Luoyu Rd., Wuhan 430079, China
2 Satellite Surveying and Mapping Application Center, National Administration of Surveying, Mapping and Geo-Information, Haidian Dist., Beijing 100048, China
3 Jiangsu Center for Collaborative Innovation in Geographical Information Resource Development and Application, Nanjing 210046, China
4 Faculty of Geosciences and Environmental Engineering, Southwest Jiaotong University
Remote Sens. 2017, 9(7), 741; https://doi.org/10.3390/rs9070741 - 18 Jul 2017
Cited by 25 | Viewed by 7377
Abstract
Interferometric Synthetic Aperture Radar (InSAR) is one of the most sufficient technologies to provide global digital elevation modeling (DEM). It unwraps the interferometric phase to provide observations for phase-to-height conversion. However, the phase gradient has great influence on the phase unwrapping quality, thereby [...] Read more.
Interferometric Synthetic Aperture Radar (InSAR) is one of the most sufficient technologies to provide global digital elevation modeling (DEM). It unwraps the interferometric phase to provide observations for phase-to-height conversion. However, the phase gradient has great influence on the phase unwrapping quality, thereby affecting the topographic mapping accuracy. Multi-look processing can improve the reliability of phase unwrapping by reducing the noise phase gradient. Nevertheless, it reduces the spatial resolution while increasing the height phase gradient, thus lowering the reliability of height values. In this paper, we propose a multi-look iteration algorithm to suppress the noise and maintain the reliability of height values. First, we use a large number of looks (NL) to suppress the noise phase gradient and obtain a coarse DEM. Then taking this coarse DEM as a reference, we remove the topographic phase from the interferogram with a small NL, which will reduce height phase gradient and ensure the accuracy of phase unwrapping. Finally, we obtain DEM products with high precision and fine resolution. We validate the proposed algorithm using both simulated and real data, and obtain DEM products in a greatly undulated region using TanDEM-X data. Results show that the proposed method is capable of providing DEM with resolution of 4 m and accuracy of 1.73 m. Full article
(This article belongs to the Section Remote Sensing in Geology, Geomorphology and Hydrology)
Show Figures

Graphical abstract

15 pages, 2287 KiB  
Article
Feasibility of GNSS-R Ice Sheet Altimetry in Greenland Using TDS-1
by Antonio Rius 1,*, Estel Cardellach 1, Fran Fabra 1, Weiqiang Li 1, Serni Ribó 1 and Manuel Hernández-Pajares 2
1 Earth Observation Research Group, Institute of Space Sciences (CSIC/IEEC), Barcelona 08193, Spain
2 UPC-IonSAT, IEEC-CTE-CRAE, Universitat Politècnica de Catalunya, Barcelona 08034, Spain
Remote Sens. 2017, 9(7), 742; https://doi.org/10.3390/rs9070742 - 19 Jul 2017
Cited by 48 | Viewed by 7679
Abstract
Radar altimetry provides valuable measurements to characterize the state and the evolution of the ice sheet cover of Antartica and Greenland. Global Navigation Satellite System Reflectometry (GNSS-R) has the potential to complement the dedicated radar altimeters, increasing the temporal and spatial resolution of [...] Read more.
Radar altimetry provides valuable measurements to characterize the state and the evolution of the ice sheet cover of Antartica and Greenland. Global Navigation Satellite System Reflectometry (GNSS-R) has the potential to complement the dedicated radar altimeters, increasing the temporal and spatial resolution of the measurements. Here we perform a study of the Greenland ice sheet using data obtained by the GNSS-R instrument aboard the British TechDemoSat-1 (TDS-1) satellite mission. TDS-1 was primarily designed to provide sea state information such as sea surface roughness or wind, but not altimetric products. The data have been analyzed with altimetric methodologies, already tested in aircraft based experiments, to extract signal delay observables to be used to infer properties of the Greenland ice sheet cover. The penetration depth of the GNSS signals into ice has also been considered. The large scale topographic signal obtained is consistent with the one obtained with ICEsat GLAS sensor, with differences likely to be related to L-band signal penetration into the ice and the along-track variations in structure and morphology of the firn and ice volumes The main conclusion derived from this work is that GNSS-R also provides potentially valuable measurements of the ice sheet cover. Thus, this methodology has the potential to complement our understanding of the ice firn and its evolution. Full article
Show Figures

Graphical abstract

24 pages, 6528 KiB  
Article
Evaluation of the U.S. Geological Survey Landsat Burned Area Essential Climate Variable across the Conterminous U.S. Using Commercial High-Resolution Imagery
by Melanie K. Vanderhoof *, Nicole Brunner, Yen-Ju G. Beal and Todd J. Hawbaker
U.S. Geological Survey, Geosciences and Environmental Change Science Center, P.O. Box 25046, DFC, MS980, Lakewood, CO 80225, USA
Remote Sens. 2017, 9(7), 743; https://doi.org/10.3390/rs9070743 - 20 Jul 2017
Cited by 18 | Viewed by 6696
Abstract
The U.S. Geological Survey has produced the Landsat Burned Area Essential Climate Variable (BAECV) product for the conterminous United States (CONUS), which provides wall-to-wall annual maps of burned area at 30 m resolution (1984–2015). Validation is a critical component in the generation of [...] Read more.
The U.S. Geological Survey has produced the Landsat Burned Area Essential Climate Variable (BAECV) product for the conterminous United States (CONUS), which provides wall-to-wall annual maps of burned area at 30 m resolution (1984–2015). Validation is a critical component in the generation of such remotely sensed products. Previous efforts to validate the BAECV relied on a reference dataset derived from Landsat, which was effective in evaluating the product across its timespan but did not allow for consideration of inaccuracies imposed by the Landsat sensor itself. In this effort, the BAECV was validated using 286 high-resolution images, collected from GeoEye-1, QuickBird-2, Worldview-2 and RapidEye satellites. A disproportionate sampling strategy was utilized to ensure enough burned area pixels were collected. Errors of omission and commission for burned area averaged 22 ± 4% and 48 ± 3%, respectively, across CONUS. Errors were lowest across the western U.S. The elevated error of commission relative to omission was largely driven by patterns in the Great Plains which saw low errors of omission (13 ± 13%) but high errors of commission (70 ± 5%) and potentially a region-growing function included in the BAECV algorithm. While the BAECV reliably detected agricultural fires in the Great Plains, it frequently mapped tilled areas or areas with low vegetation as burned. Landscape metrics were calculated for individual fire events to assess the influence of image resolution (2 m, 30 m and 500 m) on mapping fire heterogeneity. As the spatial detail of imagery increased, fire events were mapped in a patchier manner with greater patch and edge densities, and shape complexity, which can influence estimates of total greenhouse gas emissions and rates of vegetation recovery. The increasing number of satellites collecting high-resolution imagery and rapid improvements in the frequency with which imagery is being collected means greater opportunities to utilize these sources of imagery for Landsat product validation. Full article
(This article belongs to the Special Issue Quantitative Remote Sensing of Land Surface Variables)
Show Figures

Graphical abstract

15 pages, 3771 KiB  
Article
Characterizing Regional-Scale Combustion Using Satellite Retrievals of CO, NO2 and CO2
by Sam J. Silva 1,2,* and A. F. Arellano 2
1 Department of Civil and Environmental Engineering, Massachusetts Institute of Technology, Cambridge, MA 02139, USA
2 Department of Hydrology and Atmospheric Sciences, University of Arizona, Tucson, AZ 85721, USA
Remote Sens. 2017, 9(7), 744; https://doi.org/10.3390/rs9070744 - 19 Jul 2017
Cited by 38 | Viewed by 9574
Abstract
We present joint analyses of satellite-observed combustion products to examine bulk characteristics of combustion in megacities and fire regions. We use retrievals of CO, NO2 and CO2 from NASA/Terra Measurement of Pollution In The Troposphere, NASA/Aura Ozone Monitoring Instrument, and JAXA [...] Read more.
We present joint analyses of satellite-observed combustion products to examine bulk characteristics of combustion in megacities and fire regions. We use retrievals of CO, NO2 and CO2 from NASA/Terra Measurement of Pollution In The Troposphere, NASA/Aura Ozone Monitoring Instrument, and JAXA Greenhouse Gases Observing Satellite to estimate atmospheric enhancements of these co-emitted species based on their spatiotemporal variability (spread, σ) within 14 regions dominated by combustion emissions. We find that patterns in σXCOXCO2 and σXCOXNO2 are able to distinguish between combustion types across the globe. These patterns show distinct groupings for biomass burning and the developing/developed status of a region that are not well represented in global emissions inventories. We show here that such multi-species analyses can provide constraints on emission inventories, and be useful in monitoring trends and understanding regional-scale combustion. Full article
(This article belongs to the Special Issue Remote Sensing of Greenhouse Gases)
Show Figures

Graphical abstract

23 pages, 5491 KiB  
Article
Early Detection of Plant Physiological Responses to Different Levels of Water Stress Using Reflectance Spectroscopy
by Matthew Maimaitiyiming 1,2,*, Abduwasit Ghulam 1,2,*, Arianna Bozzolo 3, Joseph L. Wilkins 2,4 and Misha T. Kwasniewski 3
1 Center for Sustainability, Saint Louis University, St. Louis, MO 63108, USA
2 Department of Earth and Atmospheric Sciences, Saint Louis University, St. Louis, MO 63108, USA
3 Grape and Wine Institute, University of Missouri, 221 Eckles Hall, Columbia, MO 65211, USA
4 Computational Exposure Division, National Exposure Research Laboratory, Office of Research and Development, U.S. Environmental Protection Agency, Durham, NC 27711, USA
Remote Sens. 2017, 9(7), 745; https://doi.org/10.3390/rs9070745 - 19 Jul 2017
Cited by 119 | Viewed by 12010
Abstract
Early detection of water stress is critical for precision farming for improving crop productivity and fruit quality. To investigate varying rootstock and irrigation interactions in an open agricultural ecosystem, different irrigation treatments were implemented in a vineyard experimental site either: (i) nonirrigated (NIR); [...] Read more.
Early detection of water stress is critical for precision farming for improving crop productivity and fruit quality. To investigate varying rootstock and irrigation interactions in an open agricultural ecosystem, different irrigation treatments were implemented in a vineyard experimental site either: (i) nonirrigated (NIR); (ii) with full replacement of evapotranspiration (FIR); or (iii) intermediate irrigation (INT, 50% replacement of evapotranspiration). In the summers 2014 and 2015, we collected leaf reflectance factor spectra of the vineyard using field spectroscopy along with grapevine physiological parameters. To comprehensively analyze the field-collected hyperspectral data, various band combinations were used to calculate the normalized difference spectral index (NDSI) along with 26 various indices from the literature. Then, the relationship between the indices and plant physiological parameters were examined and the strongest relationships were determined. We found that newly-identified NDSIs always performed better than the indices from the literature, and stomatal conductance (Gs) was the plant physiological parameter that showed the highest correlation with NDSI(R603,R558) calculated using leaf reflectance factor spectra (R2 = 0.720). Additionally, the best NDSI(R685,R415) for non-photochemical quenching (NPQ) was determined (R2 = 0.681). Gs resulted in being a proxy of water stress. Therefore, the partial least squares regression (PLSR) method was utilized to develop a predictive model for Gs. Our results showed that the PLSR model was inferior to the NDSI in Gs estimation (R2 = 0.680). The variable importance in the projection (VIP) was then employed to investigate the most important wavelengths that were most effective in determining Gs. The VIP analysis confirmed that the yellow band improves the prediction ability of hyperspectral reflectance factor data in Gs estimation. The findings of this study demonstrate the potential of hyperspectral spectroscopy data in motoring plant stress response. Full article
Show Figures

Graphical abstract

23 pages, 6847 KiB  
Article
Aerosol Optical Properties and Associated Direct Radiative Forcing over the Yangtze River Basin during 2001–2015
by Lijie He 1,†, Lunche Wang 2,*,†, Aiwen Lin 1,*, Ming Zhang 3, Muhammad Bilal 4 and Minghui Tao 5
1 School of Resource and Environmental Science, Wuhan University, Wuhan 430079, China
2 Laboratory of Critical Zone Evolution, School of Earth Sciences, China University of Geosciences, Wuhan 430074, China
3 State Key Laboratory of Information Engineering in Surveying, Mapping and Remote Sensing, Wuhan University, Wuhan 430079, China
4 Department of Land Surveying and Geo-Informatics, The Hong Kong Polytechnic University, Hung Hom, Kowloon, Hong Kong, China
5 State Key Laboratory of Remote Sensing Science, Institute of Remote Sensing and Digital Earth, Chinese Academy of Sciences, Beijing 100101, China
These authors contributed equally to this work.
Remote Sens. 2017, 9(7), 746; https://doi.org/10.3390/rs9070746 - 20 Jul 2017
Cited by 36 | Viewed by 6153
Abstract
The spatiotemporal variation of aerosol optical depth at 550 nm (AOD550), Ångström exponent at 470–660 nm (AE470–660), water vapor content (WVC), and shortwave (SW) instantaneous aerosol direct radiative effects (IADRE) at the top-of-atmosphere (TOA) in clear skies obtained from [...] Read more.
The spatiotemporal variation of aerosol optical depth at 550 nm (AOD550), Ångström exponent at 470–660 nm (AE470–660), water vapor content (WVC), and shortwave (SW) instantaneous aerosol direct radiative effects (IADRE) at the top-of-atmosphere (TOA) in clear skies obtained from the Moderate Resolution Imaging Spectroradiometer (MODIS) and Clouds and the Earth’s Radiant Energy System (CERES) are quantitatively analyzed over the Yangtze River Basin (YRB) in China during 2001–2015. The annual and seasonal frequency distributions of AE470–660 and AOD550 reveal the dominance of fine aerosol particles over YRB. The regional average AOD550 is 0.49 ± 0.31, with high value in spring (0.58 ± 0.35) and low value in winter (0.42 ± 0.29). The higher AOD550 (≥0.6) is observed in midstream and downstream regions of YRB and Sichuan Basin due to local anthropogenic emissions and long-distance transport of dust particles, while lower AOD550 (≤0.3) is in high mountains of upstream regions. The IADRE is estimated using a linear relationship between SW upward flux and coincident AOD550 from CERES and MODIS at the satellite passing time. The regional average IADRE is −35.60 ± 6.71 Wm−2, with high value (−40.71 ± 6.86 Wm−2) in summer and low value (−29.19 ± 7.04 Wm−2) in winter, suggesting a significant cooling effect at TOA. The IADRE at TOA is lower over Yangtze River Delta (YRD) (≤−30 Wm−2) and higher in midstream region of YRB, Sichuan Basin and the source area of YRB (≥−45 Wm−2). The correlation coefficient between the 15-year monthly IADRE and AOD550 values is 0.63, which confirms the consistent spatiotemporal variation patterns over most of the YRB. However, a good agreement between IADRE and AOD is not observed in YRD and the source area of YRB, which is probably due to the combined effects of aerosol and surface properties. Full article
Show Figures

Graphical abstract

14 pages, 3357 KiB  
Article
Expansion of Industrial Plantations Continues to Threaten Malayan Tiger Habitat
by Varada S. Shevade 1,*, Peter V. Potapov 1, Nancy L. Harris 2 and Tatiana V. Loboda 1
1 Department of Geographical Sciences, University of Maryland, College Park, MD 20742, USA
2 World Resources Institute, 10 G Street NE Suite 800, Washington, DC 20002, USA
Remote Sens. 2017, 9(7), 747; https://doi.org/10.3390/rs9070747 - 19 Jul 2017
Cited by 20 | Viewed by 14824
Abstract
Southeast Asia has some of the highest deforestation rates globally, with Malaysia being identified as a deforestation hotspot. The Malayan tiger, a critically endangered subspecies of the tiger endemic to Peninsular Malaysia, is threatened by habitat loss and fragmentation. In this study, we [...] Read more.
Southeast Asia has some of the highest deforestation rates globally, with Malaysia being identified as a deforestation hotspot. The Malayan tiger, a critically endangered subspecies of the tiger endemic to Peninsular Malaysia, is threatened by habitat loss and fragmentation. In this study, we estimate the natural forest loss and conversion to plantations in Peninsular Malaysia and specifically in its tiger habitat between 1988 and 2012 using the Landsat data archive. We estimate a total loss of 1.35 Mha of natural forest area within Peninsular Malaysia over the entire study period, with 0.83 Mha lost within the tiger habitat. Nearly half (48%) of the natural forest loss area represents conversion to tree plantations. The annual area of new plantation establishment from natural forest conversion increased from 20 thousand ha year−1 during 1988–2000 to 34 thousand ha year−1 during 2001–2012. Large-scale industrial plantations, primarily those of oil palm, as well as recently cleared land, constitute 80% of forest converted to plantations since 1988. We conclude that industrial plantation expansion has been a persistent threat to natural forests within the Malayan tiger habitat. Expanding oil palm plantations dominate forest conversions while those for rubber are an emerging threat. Full article
Show Figures

Graphical abstract

62 pages, 21624 KiB  
Article
Criteria Comparison for Classifying Peatland Vegetation Types Using In Situ Hyperspectral Measurements
by Thierry Erudel 1,2,3,*, Sophie Fabre 3, Thomas Houet 4, Florence Mazier 2 and Xavier Briottet 3
1 LabEx DRIIHM (Programme “Investissements D’avenir”: ANR-11-LABX-0010), INEE-CNRS 3 Rue Michel-Ange, 75016 Paris, France
2 GEODE UMR 5602 CNRS, Université Toulouse Jean Jaurès, 5 Allées Antonio Machado, 31058 Toulouse CEDEX 1, France
3 ONERA, Optics and Associated Techniques Department, 2 Avenue Edouard Belin, 31005 Toulouse CEDEX, France
4 LETG-Rennes UMR 6554 CNRS, Université Rennes 2, Place du Recteur Henri le Moal, 35043 Rennes CEDEX, France
Remote Sens. 2017, 9(7), 748; https://doi.org/10.3390/rs9070748 - 20 Jul 2017
Cited by 37 | Viewed by 8165
Abstract
This study aims to evaluate three classes of methods to discriminate between 13 peatland vegetation types using reflectance data. These vegetation types were empirically defined according to their composition, strata and biodiversity richness. On one hand, it is assumed that the same vegetation [...] Read more.
This study aims to evaluate three classes of methods to discriminate between 13 peatland vegetation types using reflectance data. These vegetation types were empirically defined according to their composition, strata and biodiversity richness. On one hand, it is assumed that the same vegetation type spectral signatures have similarities. Consequently, they can be compared to a reference spectral database. To catch those similarities, several similarities criteria (related to distances (Euclidean distance, Manhattan distance, Canberra distance) or spectral shapes (Spectral Angle Mapper) or probabilistic behaviour (Spectral Information Divergence)) and several mathematical transformations of spectral signatures enhancing absorption features (such as the first derivative or the second derivative, the normalized spectral signature, the continuum removal, the continuum removal derivative reflectance, the log transformation) were investigated. Furthermore, those similarity measures were applied on spectral ranges which characterize specific biophysical properties. On the other hand, we suppose that specific biophysical properties/components may help to discriminate between vegetation types applying supervised classification such as Random Forest (RF), Support Vector Machines (SVM), Regularized Logistic Regression (RLR), Partial Least Squares-Discriminant Analysis (PLS-DA). Biophysical components can be used in a local way considering vegetation spectral indices or in a global way considering spectral ranges and transformed spectral signatures, as explained above. RLR classifier applied on spectral vegetation indices (training size = 25%) was able to achieve 77.21% overall accuracy in discriminating peatland vegetation types. It was also able to discriminate between 83.95% vegetation types considering specific spectral range [[range-phrase = –]3501350 n m ], first derivative of spectral signatures and training size = 25%. Conversely, similarity criterion was able to achieve 81.70% overall accuracy using the Canberra distance computed on the full spectral range [[range-phrase = –]3502500 n m ]. The results of this study suggest that RLR classifier and similarity criteria are promising to map the different vegetation types with high ecological values despite vegetation heterogeneity and mixture. Full article
(This article belongs to the Special Issue Hyperspectral Imaging and Applications)
Show Figures

Graphical abstract

14 pages, 5369 KiB  
Article
Mapping of Aedes albopictus Abundance at a Local Scale in Italy
by Frédéric Baldacchino 1,*,†, Matteo Marcantonio 2, Mattia Manica 1,3, Giovanni Marini 1, Roberto Zorer 1, Luca Delucchi 1, Daniele Arnoldi 1, Fabrizio Montarsi 4, Gioia Capelli 4, Annapaola Rizzoli 1 and Roberto Rosà 1
1 Department of Biodiversity and Molecular Ecology, Research and Innovation Centre, Fondazione Edmund Mach, 38010 San Michele, Italy
2 Department of Pathology, Microbiology and Immunology, School of Veterinary Medicine, University of California, Davis, CA 89101, USA
3 Department of Public Health and Infectious Diseases, Sapienza University of Rome, Laboratory affiliated to Istituto Pasteur Italia—Fondazione Cenci Bolognetti, 00185 Rome, Italy
4 Istituto Zooprofilattico Sperimentale delle Venezie, 35020 Legnaro, Italy
Current address: 7 rue de Paris, 06000 Nice, France.
Remote Sens. 2017, 9(7), 749; https://doi.org/10.3390/rs9070749 - 21 Jul 2017
Cited by 23 | Viewed by 7625
Abstract
Given the growing risk of arbovirus outbreaks in Europe, there is a clear need to better describe the distribution of invasive mosquito species such as Aedes albopictus. Current challenges consist in simulating Ae. albopictus abundance, rather than its presence, and mapping its [...] Read more.
Given the growing risk of arbovirus outbreaks in Europe, there is a clear need to better describe the distribution of invasive mosquito species such as Aedes albopictus. Current challenges consist in simulating Ae. albopictus abundance, rather than its presence, and mapping its simulated abundance at a local scale to better assess the transmission risk of mosquito-borne pathogens and optimize mosquito control strategy. During 2014–2015, we sampled adult mosquitoes using 72 BG-Sentinel traps per year in the provinces of Belluno and Trento, Italy. We found that the sum of Ae. albopictus females collected during eight trap nights from June to September was positively related to the mean temperature of the warmest quarter and the percentage of artificial areas in a 250 m buffer around the sampling locations. Maps of Ae. albopictus abundance simulated from the most parsimonious model in the study area showed the largest populations in highly artificial areas with the highest summer temperatures, but with a high uncertainty due to the variability of the trapping collections. Vector abundance maps at a local scale should be promoted to support stakeholders and policy-makers in optimizing vector surveillance and control. Full article
Show Figures

Graphical abstract

25 pages, 5929 KiB  
Article
Bathymetry of the Coral Reefs of Weizhou Island Based on Multispectral Satellite Images
by Rongyong Huang 1,2,3, Kefu Yu 1,2,3,*, Yinghui Wang 1,2,3, Jikun Wang 1,2,3, Lin Mu 4 and Wenhuan Wang 1,2,3
1 Coral Reef Research Centre of China, Guangxi University, Nanning 530004, China
2 Guangxi Laboratory on the Study of Coral Reefs in the South China Sea, Guangxi University, Nanning 530004, China
3 School of Marine Sciences, Guangxi University, Nanning 530004, China
4 Institute of Complexity Science and Big Data Technology, Guangxi University, Nanning 530004, China
Remote Sens. 2017, 9(7), 750; https://doi.org/10.3390/rs9070750 - 21 Jul 2017
Cited by 38 | Viewed by 7750
Abstract
Shallow water depth measurements using multispectral images are crucial for marine surveying and mapping. At present, relevant studies either depend on the use of other auxiliary data (such as field water depths or water column data) or contain too many unknown variables, thus [...] Read more.
Shallow water depth measurements using multispectral images are crucial for marine surveying and mapping. At present, relevant studies either depend on the use of other auxiliary data (such as field water depths or water column data) or contain too many unknown variables, thus making these studies suitable only for images that contain enough visible wavebands. To solve this problem, a Quasi-Analytical Algorithm (QAA) approach is proposed in this paper for estimating the water depths around Weizhou Island by developing a QAA to estimate the diffuse attenuation coefficients and simplifying the parameterization of the bathymetric model. The approach contains an initialization sub-approach and a novel global adjustment sub-approach. It is not only independent of other auxiliary data but also greatly reduces the number of unknowns. Experimental results finally demonstrated that the Root Mean Square Errors (RMSEs) were 1.01 m and 0.77 m for the ZY-3 image and the WorldView-3 (WV-3) image, respectively, so the approach is competitive to other QAA bathymetric methods. Besides, the global adjustment sub-approach was also seen to be superior to common smoothing filters: if the Signal-to-Noise Ratio (SNR) is as low as 42, i.e., ZY-3, it can smooth the water depths and improve the accuracies, otherwise can avoid the over-smoothing of water depths. Full article
(This article belongs to the Section Ocean Remote Sensing)
Show Figures

Graphical abstract

17 pages, 5097 KiB  
Article
Influence of Ecological Factors on Estimation of Impervious Surface Area Using Landsat 8 Imagery
by Yuqiu Jia 1,2, Lina Tang 1,* and Lin Wang 1,2
1 Key Lab of Urban Environment and Health, Institute of Urban Environment, Chinese Academy of Sciences, Xiamen 361021, China
2 University of Chinese Academy of Sciences, Beijing 100049, China
Remote Sens. 2017, 9(7), 751; https://doi.org/10.3390/rs9070751 - 21 Jul 2017
Cited by 15 | Viewed by 6319
Abstract
Estimation of impervious surface area is important to the study of urban environments and social development, but surface characteristics, as well as the temporal, spectral, and spatial resolutions of remote sensing images, influence the estimation accuracy. To investigate the effects of regional environmental [...] Read more.
Estimation of impervious surface area is important to the study of urban environments and social development, but surface characteristics, as well as the temporal, spectral, and spatial resolutions of remote sensing images, influence the estimation accuracy. To investigate the effects of regional environmental characteristics on the estimation of impervious surface area, we divided China into seven sub-regions based on climate, soil type, feature complexity, and vegetation phenology: arid and semi-arid areas, Huang-Huai-Hai winter wheat production areas, typical temperate regions, the Pearl River Delta, the middle and lower reaches of the Yangtze River, typical tropical and subtropical regions, and the Qinghai Tibet Plateau. Impervious surface area was estimated from Landsat 8 images of five typical cities, including Yinchuan, Shijiazhuang, Shenyang, Ningbo, and Kunming. Using the linear spectral unmixing method, impervious and permeable surface areas were determined at the pixel-scale based on end-member proportions. We calculated the producer’s accuracy, user’s accuracy, and overall accuracy to assess the estimation accuracy, and compared the accuracies among images acquired from different seasons and locations. In tropical and subtropical regions, vegetation canopies can confound the identification of impervious surfaces and, thus, images acquired in winter, early spring, and autumn are most suitable; estimations in the Pearl River Delta, the middle and lower reaches of the Yangtze River are influenced by soil, vegetation phenology, vegetation canopy, and water, and images acquired in spring, summer, and autumn provide the best results; in typical temperate areas, images acquired from spring to autumn are most effective for estimations; in winter wheat-growing areas, images acquired throughout the year are suitable; and in arid and semi-arid areas, summer and early autumn, during which vegetation is abundant, are the optimal seasons for estimations. Knowledge of optimal time frames, multi-source data, and intelligent algorithms should be integrated to reduce spectral confusion and improve the estimation of impervious surface area from Landsat 8 OLI imagery. Full article
(This article belongs to the Section Remote Sensing in Geology, Geomorphology and Hydrology)
Show Figures

Graphical abstract

22 pages, 7776 KiB  
Article
Minimizing the Residual Topography Effect on Interferograms to Improve DInSAR Results: Estimating Land Subsidence in Port-Said City, Egypt
by Ahmed Gaber 1,*, Noura Darwish 1 and Magaly Koch 2
1 Geology Department, Faculty of Science, Port-Said University, Port-Said 42522, Egypt
2 Center for Remote Sensing, Boston University, Boston, MA 02215, USA
Remote Sens. 2017, 9(7), 752; https://doi.org/10.3390/rs9070752 - 21 Jul 2017
Cited by 28 | Viewed by 7854
Abstract
The accurate detection of land subsidence rates in urban areas is important to identify damage-prone areas and provide decision-makers with useful information. Meanwhile, no precise measurements of land subsidence have been undertaken within the coastal Port-Said City in Egypt to evaluate its hazard [...] Read more.
The accurate detection of land subsidence rates in urban areas is important to identify damage-prone areas and provide decision-makers with useful information. Meanwhile, no precise measurements of land subsidence have been undertaken within the coastal Port-Said City in Egypt to evaluate its hazard in relationship to sea-level rise. In order to address this shortcoming, this work introduces and evaluates a methodology that substantially improves small subsidence rate estimations in an urban setting. Eight ALOS/PALSAR-1 scenes were used to estimate the land subsidence rates in Port-Said City, using the Small BAse line Subset (SBAS) DInSAR technique. A stereo pair of ALOS/PRISM was used to generate an accurate DEM to minimize the residual topography effect on the generated interferograms. A total of 347 well distributed ground control points (GCP) were collected in Port-Said City using the leveling instrument to calibrate the generated DEM. Moreover, the eight PALSAR scenes were co-registered using 50 well-distributed GCPs and used to generate 22 interferogram pairs. These PALSAR interferograms were subsequently filtered and used together with the coherence data to calculate the phase unwrapping. The phase-unwrapped interferogram-pairs were then evaluated to discard four interferograms that were affected by phase jumps and phase ramps. Results confirmed that using an accurate DEM (ALOS/PRISM) was essential for accurately detecting small deformations. The vertical displacement rate during the investigated period (2007–2010) was estimated to be −28 mm. The results further indicate that the northern area of Port-Said City has been subjected to higher land subsidence rates compared to the southern area. Such land subsidence rates might induce significant environmental changes with respect to sea-level rise. Full article
(This article belongs to the Special Issue Remote Sensing of Arid/Semiarid Lands)
Show Figures

Graphical abstract

21 pages, 12201 KiB  
Article
A Novel Method to Reconstruct Overhead High-Voltage Power Lines Using Cable Inspection Robot LiDAR Data
by Xinyan Qin 1, Gongping Wu 1,2, Xuhui Ye 1, Le Huang 1 and Jin Lei 1,3,*
1 Department of Power and Mechanical Engineering, Wuhan University, Wuhan 430072, China
2 Guangdong Keystar Intelligent Robot Co., Ltd., Foshan 528000, China
3 Key Laboratory of Hydraulic Machinery Transients, Ministry of Education, Wuhan University, Wuhan 430072, China
Remote Sens. 2017, 9(7), 753; https://doi.org/10.3390/rs9070753 - 22 Jul 2017
Cited by 58 | Viewed by 10056
Abstract
Overhead high-voltage power lines are key components of power transmission and their monitoring has a very significant influence on security and reliability of power system. Advanced laser scanning techniques have been widely used to capture three-dimensional (3D) point clouds of power system scenes. [...] Read more.
Overhead high-voltage power lines are key components of power transmission and their monitoring has a very significant influence on security and reliability of power system. Advanced laser scanning techniques have been widely used to capture three-dimensional (3D) point clouds of power system scenes. Nevertheless, power line corridors are found in increasingly complex environments (e.g., mountains and forests), and the multi-loop structure on the same power line tower raises great challenges to process light detection and ranging (LiDAR) data. This paper addresses these challenges by constructing a new collection mode of LiDAR data for power lines using cable inspection robot (CIR). A novel method is proposed to extract and reconstruct power line using CIR LiDAR data, which has two advantages: (1) rapidly extracts power line point by position and orientation system (POS) extraction model; and (2) better solves pseudo-line during reconstruction of power line by structured partition. The proposed method mainly includes four steps: CIR LiDAR data generation, POS-based crude extraction, voxel-based accurate extraction and power line reconstruction. The feasibility and validity of the proposed method are verified by test site experiment and actual line experiment, demonstrating a fast and reliable solution to accurately reconstruct power line. Full article
Show Figures

Graphical abstract

18 pages, 22422 KiB  
Article
Landsat 15-m Panchromatic-Assisted Downscaling (LPAD) of the 30-m Reflective Wavelength Bands to Sentinel-2 20-m Resolution
by Zhongbin Li *, Hankui K. Zhang, David P. Roy, Lin Yan, Haiyan Huang and Jian Li
Geospatial Sciences Center of Excellence, South Dakota State University, Brookings, SD 57007, USA
Remote Sens. 2017, 9(7), 755; https://doi.org/10.3390/rs9070755 - 22 Jul 2017
Cited by 32 | Viewed by 11995
Abstract
The Landsat 15-m Panchromatic-Assisted Downscaling (LPAD) method to downscale Landsat-8 Operational Land Imager (OLI) 30-m data to Sentinel-2 multi-spectral instrument (MSI) 20-m resolution is presented. The method first downscales the Landsat-8 30-m OLI bands to 15-m using the spatial detail provided by the [...] Read more.
The Landsat 15-m Panchromatic-Assisted Downscaling (LPAD) method to downscale Landsat-8 Operational Land Imager (OLI) 30-m data to Sentinel-2 multi-spectral instrument (MSI) 20-m resolution is presented. The method first downscales the Landsat-8 30-m OLI bands to 15-m using the spatial detail provided by the Landsat-8 15-m panchromatic band and then reprojects and resamples the downscaled 15-m data into registration with Sentinel-2A 20-m data. The LPAD method is demonstrated using pairs of contemporaneous Landsat-8 OLI and Sentinel-2A MSI images sensed less than 19 min apart over diverse geographic environments. The LPAD method is shown to introduce less spectral and spatial distortion and to provide visually more coherent data than conventional bilinear and cubic convolution resampled 20-m Landsat OLI data. In addition, results for a pair of Landsat-8 and Sentinel-2A images sensed one day apart suggest that image fusion should be undertaken with caution when the images are acquired under different atmospheric conditions. The LPAD source code is available at GitHub for public use. Full article
Show Figures

Graphical abstract

29 pages, 15707 KiB  
Article
Passive Radar Array Processing with Non-Uniform Linear Arrays for Ground Target’s Detection and Localization
by Nerea Del-Rey-Maestre, David Mata-Moya, Maria-Pilar Jarabo-Amores *,†, Pedro-Jose Gómez-del-Hoyo, Jose-Luis Bárcena-Humanes and Javier Rosado-Sanz
1 Signal Theory and Communications Department, Superior Polytechnic School, University of Alcalá, Alcalá de Henares, 28805 Madrid, Spain
The authors contributed equally to this work.
Remote Sens. 2017, 9(7), 756; https://doi.org/10.3390/rs9070756 - 22 Jul 2017
Cited by 25 | Viewed by 10377
Abstract
The problem of ground target detection with passive radars is considered. The design of an antenna array based on commercial elements is presented, based on a non-uniform linear array optimized according to sidelobe level requirements. Array processing techniques are applied in the cross-ambiguity [...] Read more.
The problem of ground target detection with passive radars is considered. The design of an antenna array based on commercial elements is presented, based on a non-uniform linear array optimized according to sidelobe level requirements. Array processing techniques are applied in the cross-ambiguity function domain to exploit integration gain, system resolution and the sparsity of targets in this domain. A modified two-stage detection scheme is described, which is based on a previously-published one by other authors. All of these contributions are validated in a real semiurban scenario, proving the capabilities of detection, the direction of arrival estimation and the tracking of ground targets in the presence of big buildings that generate strong clutter returns. Detection performance is validated through the probability of false alarm and the probability of detection estimation with specified estimation errors. Full article
(This article belongs to the Special Issue Radar Systems for the Societal Challenges)
Show Figures

Graphical abstract

21 pages, 4597 KiB  
Article
Ku-, X- and C-Band Microwave Backscatter Indices from Saline Snow Covers on Arctic First-Year Sea Ice
by Vishnu Nandan *, Torsten Geldsetzer, Mallik Mahmud, John Yackel and Saroat Ramjan
Cryosphere Climate Research Group, Department of Geography, University of Calgary, Calgary, AB T2N 1N4, Canada
Remote Sens. 2017, 9(7), 757; https://doi.org/10.3390/rs9070757 - 23 Jul 2017
Cited by 12 | Viewed by 8060
Abstract
In this study, we inter-compared observed Ku-, X- and C-band microwave backscatter from saline 14 cm, 8 cm, and 4 cm snow covers on smooth first-year sea ice. A Ku-, X- and C-band surface-borne polarimetric microwave scatterometer system was used to measure fully-polarimetric [...] Read more.
In this study, we inter-compared observed Ku-, X- and C-band microwave backscatter from saline 14 cm, 8 cm, and 4 cm snow covers on smooth first-year sea ice. A Ku-, X- and C-band surface-borne polarimetric microwave scatterometer system was used to measure fully-polarimetric backscatter from the three snow covers, near-coincident with corresponding in situ snow thermophysical measurements. The study investigated differences in co-polarized backscatter observations from the scatterometer system for all three frequencies, modeled penetration depths, utilized co-pol ratios, and introduced dual-frequency ratios to discriminate dominant polarization-dependent frequencies from these snow covers. Results demonstrate that the measured co-polarized backscatter magnitude increased with decreasing snow thickness for all three frequencies, owing to stronger gradients in snow salinity within thinner snow covers. The innovative dual-frequency ratios suggest greater sensitivity of Ku-band microwaves to snow grain size as snow thickness increases and X-band microwaves to snow salinity changes as snow thickness decreases. C-band demonstrated minimal sensitivity to changes in snow salinities. Our results demonstrate the influence of salinity associated dielectric loss, throughout all layers of the three snow covers, as the governing factor affecting microwave backscatter and penetration from all three frequencies. Our “plot-scale” observations using co-polarized backscatter, co-pol ratios and dual-frequency ratios suggest the future potential to up-scale our multi-frequency approach to a “satellite-scale” approach, towards effective development of snow geophysical and thermodynamic retrieval algorithms on smooth first-year sea ice. Full article
Show Figures

Graphical abstract

23 pages, 22132 KiB  
Article
Two-Step Downscaling of Trmm 3b43 V7 Precipitation in Contrasting Climatic Regions With Sparse Monitoring: The Case of Ecuador in Tropical South America
by Jacinto Ulloa 1,*, Daniela Ballari 1,2,3, Lenin Campozano 1,3 and Esteban Samaniego 1,3
1 Departamento de Recursos Hídricos y Ciencias Ambientales, Universidad de Cuenca, Cuenca 010151, Ecuador
2 IERSE, Facultad de Ciencia y Tecnología, Universidad del Azuay, Cuenca 010151, Ecuador
3 Facultad de Ingeniería, Universidad de Cuenca, Cuenca 010151, Ecuador
Remote Sens. 2017, 9(7), 758; https://doi.org/10.3390/rs9070758 - 22 Jul 2017
Cited by 39 | Viewed by 7466
Abstract
Spatial prediction of precipitation with high resolution is a challenging task in regions with strong climate variability and scarce monitoring. For this purpose, the quasi-continuous supply of information from satellite imagery is commonly used to complement in situ data. However, satellite images of [...] Read more.
Spatial prediction of precipitation with high resolution is a challenging task in regions with strong climate variability and scarce monitoring. For this purpose, the quasi-continuous supply of information from satellite imagery is commonly used to complement in situ data. However, satellite images of precipitation are available at coarse resolutions, and require adequate methods for spatial downscaling and calibration. The objective of this paper is to introduce and evaluate a 2-step spatial downscaling approach for monthly precipitation applied to TRMM 3B43 (from 0 . 25 27 km to 5 km resolution), resulting in 5 downscaled products for the period 01-2001/12-2011. The methodology was evaluated in 3 contrasting climatic regions of Ecuador. In step 1, bilinear resampling was applied over TRMM, and used as a reference product. The second step introduces further variability, and consists of four alternative gauge-satellite merging methods: (1) regression with in situ stations, (2) regression kriging with in situ stations, (3) regression with in situ stations and auxiliary variables, and (4) regression kriging with in situ stations and auxiliary variables. The first 2 methods only use the resampled TRMM data set as an independent variable. The last 2 methods enrich these models with auxiliary environmental factors, incorporating atmospheric and land variables. The results showed that no product outperforms the others in every region. In general, the methods with residual kriging correction outperformed the regression models. Regression kriging with situ data provided the best representation in the Coast, while regression kriging with in situ and auxiliary data generated the best results in the Andes. In the Amazon, no product outperformed the resampled TRMM images, probably due to the low density of in situ stations. These results are relevant to enhance satellite precipitation, depending on the availability of in situ data, auxiliary satellite variables and the particularities of the climatic regions. Full article
Show Figures

Graphical abstract

14 pages, 10270 KiB  
Article
Saturation Correction for Nighttime Lights Data Based on the Relative NDVI
by Zheng Wang 1, Fei Yao 1, Weifeng Li 2,3 and And Jiansheng Wu 1,4,*
1 Key Laboratory for Urban Habitat Environmental Science and Technology, Shenzhen Graduate School, Peking University, Shenzhen 518055, China
2 Department of Urban Planning and Design, The University of Hong Kong, Hong Kong, China
3 Shenzhen Institute of Research and Innovation, The University of Hong Kong, Shenzhen 518075, China
4 Key Laboratory for Earth Surface Processes, Ministry of Education, College of Urban and Environmental Sciences, Peking University, Beijing 100871, China
Remote Sens. 2017, 9(7), 759; https://doi.org/10.3390/rs9070759 - 22 Jul 2017
Cited by 9 | Viewed by 7256
Abstract
DMSP/OLS images are widely used as data sources in various domains of study. However, these images have some deficiencies, one of which is digital number (DN) saturation in urban areas, which leads to significant underestimation of light intensity. We propose a new method [...] Read more.
DMSP/OLS images are widely used as data sources in various domains of study. However, these images have some deficiencies, one of which is digital number (DN) saturation in urban areas, which leads to significant underestimation of light intensity. We propose a new method to correct the saturation. With China as the study area, the threshold value of the saturation DN is screened out first. A series of regression analyses are then carried out for the 2006 radiance calibrated nighttime lights (RCNL) image and relative NDVI (RNDVI) to determine a formula for saturation correction. The 2006 stable nighttime lights (SNL) image (F162006) is finally corrected and evaluated. It is concluded that pixels are saturated when the DN is larger than 50, and that the saturation is more serious when the DN is larger. RNDVI, which was derived by subtracting the interpolated NDVI from the real NDVI, is significantly better than the real NDVI for reflecting the degree of human activity. Quadratic functions describe the relationship between DN and RNDVI well. The 2006 SNL image presented more variation within urban cores and stronger correlations with the 2006 RCNL image and Gross Domestic Product after correction. However, RNDVI may also suffer “saturation” when it is lower than −0.4, at which point it is no longer effective at correcting DN saturation. In general, RNDVI is effective, although far from perfect, for saturation correction of the 2006 SNL image, and could be applied to the SNL images for other years. Full article
Show Figures

Graphical abstract

14 pages, 7256 KiB  
Article
Mapping Development Pattern in Beijing-Tianjin-Hebei Urban Agglomeration Using DMSP/OLS Nighttime Light Data
by Yi’na Hu 1, Jian Peng 1,*, Yanxu Liu 1, Yueyue Du 1, Huilei Li 1 and Jiansheng Wu 2
1 Laboratory for Earth Surface Processes, Ministry of Education, College of Urban and Environmental Sciences, Peking University, Beijing 100871, China
2 Key Laboratory for Environmental and Urban Sciences, School of Urban Planning and Design, Shenzhen Graduate School, Peking University, Shenzhen 518055, China
Remote Sens. 2017, 9(7), 760; https://doi.org/10.3390/rs9070760 - 23 Jul 2017
Cited by 36 | Viewed by 8665
Abstract
Spatial inequality of urban development may cause problems like inequality of living conditions and the lack of sustainability, drawing increasing academic interests and societal concerns. Previous studies based on statistical data can hardly reveal the interior mechanism of spatial inequality due to the [...] Read more.
Spatial inequality of urban development may cause problems like inequality of living conditions and the lack of sustainability, drawing increasing academic interests and societal concerns. Previous studies based on statistical data can hardly reveal the interior mechanism of spatial inequality due to the limitation of statistical units, while the application of remote sensing data, such as nighttime light (NTL) data, provides an effective solution. In this study, based on the DMSP/OLS NTL data, the urbanization type of all towns in the Beijing-Tianjin-Hebei urban agglomeration was analyzed from the aspects of development level and speed. Meanwhile, spatial cluster analysis of development level by local Moran’s I was used to explore spatial inequality, and the trend was discussed by comparing the development characteristics on both sides of the transition line of different development levels (inequality boundary). The results showed that the development level of the whole region increased dramatically as the mean DN value increased by 65.99%, and 83.72% of the towns showed a positive development during 2000–2012. The spatial distribution of urbanization types showed that Beijing and Tianjin were at a high urbanization level with rapid speed of development, with the southern region having a medium development level and the northwestern region lagging behind. The spatial cluster analysis also revealed a gradually intensifying trend of inequality as the number of towns with balanced development reduced by 319 during 2000–2012, while the towns in the high-high areas increased by 99 and those in the low-low areas increased by 229. Moreover, the development speed inside the inequality boundary was obviously higher than that outside, indicating an increasingly serious situation for spatial inequality of urban development in the whole region. Full article
(This article belongs to the Special Issue Recent Advances in Remote Sensing with Nighttime Lights)
Show Figures

Graphical abstract

19 pages, 5510 KiB  
Article
Application of Sentinel 2 MSI Images to Retrieve Suspended Particulate Matter Concentrations in Poyang Lake
by Huizeng Liu 1,2, Qingquan Li 2, Tiezhu Shi 2,3, Shuibo Hu 2,3, Guofeng Wu 2,3,* and Qiming Zhou 1,*
1 Department of Geography, Hong Kong Baptist University, Hong Kong, China
2 Key Laboratory for Geo-Environmental Monitoring of Coastal Zone of the National Administration of Surveying, Mapping and GeoInformation & Shenzhen Key Laboratory of Spatial Smart Sensing and Services, Shenzhen University, Shenzhen 518060, China
3 College of Life Sciences and Oceanography, Shenzhen University, Shenzhen 518060, China
Remote Sens. 2017, 9(7), 761; https://doi.org/10.3390/rs9070761 - 23 Jul 2017
Cited by 127 | Viewed by 13097
Abstract
Suspended particulate matter (SPM) is one of the dominant water constituents in inland and coastal waters, and SPM concnetration (CSPM) is a key parameter describing water quality. This study, using in-situ spectral and CSPM measurements as well as Sentinel [...] Read more.
Suspended particulate matter (SPM) is one of the dominant water constituents in inland and coastal waters, and SPM concnetration (CSPM) is a key parameter describing water quality. This study, using in-situ spectral and CSPM measurements as well as Sentinel 2 Multispectral Imager (MSI) images, aimed to develop CSPM retrieval models and further to estimate the CSPM values of Poyang Lake, China. Sixty-eight in-situ hyperspectral measurements and relative spectral response function were applied to simulate Sentinel 2 MIS spectra. Thirty-four samples were used to calibrate and the left samples were used to validate CSPM retrieval models, respectively. The developed models were then applied to two Sentinel 2 MSI images captured in wet and dry seasons, and the derived CSPM values were compared with those derived from MODIS B1 (λ = 645 nm). Results showed that the Sentinel 2 MSI B4–B8b models achieved acceptable to high fitting accuracies, which explained 81–93% of the variation of CSPM. The validation results also showed the reliability of these six models, and the estimated CSPM explained 77–93% of the variation of measured CSPM with the mean absolute percentage error (MAPE) ranging from 36.87% to 21.54%. Among those, a model based on B7 (λ = 783 nm) appeared to be the most accurate one. The Sentinel 2 MSI-derived CSPM values were generally consistent in spatial distribution and magnitude with those derived from MODIS. The CSPM derived from Sentinel 2 MSI B7 showed the highest consistency with MODIS on 15 August 2016, while the Sentinel 2 MSI B4 (λ = 665 nm) produced the highest consistency with MODIS on 2 April 2017. Overall, this study demonstrated the applicability of Sentinel 2 MSI for CSPM retrieval in Poyang Lake, and the Sentinel 2 MSI B4 and B7 are recommended for low and high loadings of SPM, respectively. Full article
(This article belongs to the Special Issue Remote Sensing of Floodpath Lakes and Wetlands)
Show Figures

Graphical abstract

13 pages, 3939 KiB  
Article
Coastal Waveform Retracking for Jason-2 Altimeter Data Based on Along-Track Echograms around the Tsushima Islands in Japan
by Xifeng Wang 1,2,* and Kaoru Ichikawa 3
1 School of Marine Science and Environment Engineering, Dalian Ocean University, Dalian 116023, China
2 Interdisciplinary Graduate School of Engineering Sciences, Kyushu University, Fukuoka 8168580, Japan
3 Research Institute for Applied Mechanics, Kyushu University, Fukuoka 8168580, Japan
Remote Sens. 2017, 9(7), 762; https://doi.org/10.3390/rs9070762 - 24 Jul 2017
Cited by 27 | Viewed by 6927
Abstract
Although the Brown mathematical model is the standard model for waveform retracking over open oceans, due to heterogeneous surface reflections within altimeter footprints, coastal waveforms usually deviate from open ocean waveform shapes and thus cannot be directly interpreted by the Brown model. Generally, [...] Read more.
Although the Brown mathematical model is the standard model for waveform retracking over open oceans, due to heterogeneous surface reflections within altimeter footprints, coastal waveforms usually deviate from open ocean waveform shapes and thus cannot be directly interpreted by the Brown model. Generally, the two primary sources of heterogeneous surface reflections are land surfaces and bright targets such as calm surface water. The former reduces echo power, while the latter often produces particularly strong echoes. In previous studies, sub-waveform retrackers, which use waveform samples collected from around leading edges in order to avoid trailing edge noise, have been recommended for coastal waveform retracking. In the present study, the peaky-type noise caused by fixed-point bright targets is explicitly detected and masked using the parabolic signature in the sequential along-track waveforms (or, azimuth-range echograms). Moreover, the power deficit of waveform trailing edges caused by weak land reflections is compensated for by estimating the ratio of sea surface area within each annular footprint in order to produce pseudo-homogeneous reflected waveforms suitable for the Brown model. Using this method, altimeter waveforms measured over the Tsushima Islands in Japan by the Ocean Surface Topography Mission (OSTM)/Jason-2 satellite are retracked. Our results show that both the correlation coefficient and root mean square difference between the derived sea surface height anomalies and tide gauge records retain similar values at the open ocean (0.9 and 20 cm) level, even in areas approaching 3 km from coastlines, which is considerably improved from the 10 km correlation coefficient limit of the conventional MLE4 retracker and the 7 km sub-waveform ALES retracker limit. These values, however, depend on the topography of the study areas because the approach distance limit increases (decreases) in areas with complicated (straight) coastlines. Full article
Show Figures

Graphical abstract

Other

Jump to: Research

9 pages, 10216 KiB  
Letter
Ten-Meter Sentinel-2A Cloud-Free Composite—Southern Africa 2016
by Fabrizio Ramoino 1,*, Florin Tutunaru 2, Fabrizio Pera 1 and Olivier Arino 3
1 SERCO c/o ESA-ESRIN, Frascati 00044, Italy
2 CS-Romania c/o ESA-ESRIN, Frascati 00044, Italy
3 European Space Agency, Frascati 00044, Italy
Remote Sens. 2017, 9(7), 652; https://doi.org/10.3390/rs9070652 - 4 Jul 2017
Cited by 13 | Viewed by 6763
Abstract
The processing of cloud free geo-referenced imagery is one of the preliminary processing steps of any land application. This letter describes the methodology developed to obtain a seamless cloud free composite of Africa for 2016 using Sentinel-2A data at 10-meter resolution freely available [...] Read more.
The processing of cloud free geo-referenced imagery is one of the preliminary processing steps of any land application. This letter describes the methodology developed to obtain a seamless cloud free composite of Africa for 2016 using Sentinel-2A data at 10-meter resolution freely available from the European Space Agency. The method is based on a hybrid method resulting from the merging of the two most robust time series methods namely the “darkest pixel” and the “maximum Normalised Difference Vegetation Index (NDVI)” previously developed with the Advanced Very-High-Resolution Radiometer (AVHRR) time series. Full article
Show Figures

Graphical abstract

2 pages, 466 KiB  
Erratum
Erratum: Pauscher, L., et al. An Inter-Comparison Study of Multi- and DBS Lidar Measurements in Complex Terrain. Remote Sens. 2016, 8, 782
by Lukas Pauscher 1,2,*, Nikola Vasiljevic 3, Doron Callies 1, Guillaume Lea 3, Jakob Mann 3, Tobias Klaas 1,4, Julian Hieronimus 5, Julia Gottschall 6, Annedore Schwesig 1, Martin Kühn 5 and Michael Courtney 3
1 Fraunhofer Institute for Wind Energy and Energy System Technology (IWES), Fraunhofer IWES|Kassel, Königstor 59, 34119 Kassel, Germany
2 Department of Micrometeorology, University of Bayreuth, 95447 Bayreuth, Germany
3 DTU Wind Energy, Risø Campus, Technical University of Denmark, 4000 Roskilde, Denmark
4 Institute for Geophysics and Meteorology, University of Cologne, 50923 Köln, Germany
5 ForWind, Center for Wind Energy Research, Carl von Ossietzky Universität Oldenburg, Küpkersweg 70, 26129 Oldenburg, Germany
6 Fraunhofer Institute for Wind Energy and Energy System Technology (IWES), Fraunhofer IWES|Northwest, 27572 Bremerhaven, Germany
Remote Sens. 2017, 9(7), 667; https://doi.org/10.3390/rs9070667 - 28 Jun 2017
Cited by 3 | Viewed by 3502
Abstract
The authors would like to correct the following errors in [1]. [...]
Full article
Show Figures

Figure 1

12 pages, 32854 KiB  
Technical Note
An Advanced Rotation Invariant Descriptor for SAR Image Registration
by Yuming Xiang 1,2,*, Feng Wang 1, Ling Wan 1,2 and Hongjian You 1,2
1 Key Laboratory of Technology in Geo-spatial Information Processing and Application System, Institute of Electronics, Chinese Academy of Sciences, Beijing 100190, China
2 University of Chinese Academy of Sciences, Beijing 100000, China
Remote Sens. 2017, 9(7), 686; https://doi.org/10.3390/rs9070686 - 4 Jul 2017
Cited by 19 | Viewed by 5206
Abstract
The Scale-Invariant Feature Transform (SIFT) algorithm and its many variants have been widely used in Synthetic Aperture Radar (SAR) image registration. The SIFT-like algorithms maintain rotation invariance by assigning a dominant orientation for each keypoint, while the calculation of dominant orientation is not [...] Read more.
The Scale-Invariant Feature Transform (SIFT) algorithm and its many variants have been widely used in Synthetic Aperture Radar (SAR) image registration. The SIFT-like algorithms maintain rotation invariance by assigning a dominant orientation for each keypoint, while the calculation of dominant orientation is not robust due to the effect of speckle noise in SAR imagery. In this paper, we propose an advanced local descriptor for SAR image registration to achieve rotation invariance without assigning a dominant orientation. Based on the improved intensity orders, we first divide a circular neighborhood into several sub-regions. Second, rotation-invariant ratio orientation histograms of each sub-region are proposed by accumulating the ratio values of different directions in a rotation-invariant coordinate system. The proposed descriptor is composed of the concatenation of the histograms of each sub-region. In order to increase the distinctiveness of the proposed descriptor, multiple image neighborhoods are aggregated. Experimental results on several satellite SAR images have shown an improvement in the matching performance over other state-of-the-art algorithms. Full article
Show Figures

Graphical abstract

1 pages, 178 KiB  
Erratum
Erratum: A Machine Learning Method for Co-Registration and Individual Tree Matching of Forest Inventory and Airborne Laser Scanning Data. Remote Sens. 2017, 9, 505
by Sebastian Lamprecht 1,*, Andreas Hill 2, Johannes Stoffels 1 and Thomas Udelhoven 1
1 Remote Sensing & Geoinformatics Department, Trier University, 54286 Trier, Germany
2 Department of Environmental Systems Science, ETH Zurich, 8092 Zurich, Switzerland
Remote Sens. 2017, 9(7), 692; https://doi.org/10.3390/rs9070692 - 5 Jul 2017
Cited by 1 | Viewed by 3023
Abstract
Since Equation (2) has been rearranged incorrectly during preparation for this article [1], the authors would like to correct the relevant text of Section 3.4.3 as follows:[...] Full article
12 pages, 4370 KiB  
Letter
GF-3 SAR Ocean Wind Retrieval: The First View and Preliminary Assessment
by He Wang 1,*, Jingsong Yang 2, Alexis Mouche 3, Weizeng Shao 4, Jianhua Zhu 1, Lin Ren 2 and Chunhua Xie 5
1 National Ocean Technology Center, State Oceanic Administration, Tianjin 300112, China
2 State Key Laboratory of Satellite Ocean Environment Dynamics, Second Institute of Oceanography, State Oceanic Administration, Hangzhou 310012, China
3 Laboratoire d’Océanographie Physique et Spatiale, Institut Français de Recherche pour l’Exploitation de la Mer, Brest 29280, France
4 Marine Acoustics and Remote Sensing Laboratory, Zhejiang Ocean University, Zhoushan 316000, China
5 National Satellite Ocean Application Service, State Oceanic Administration, Beijing 100081, China
Remote Sens. 2017, 9(7), 694; https://doi.org/10.3390/rs9070694 - 5 Jul 2017
Cited by 56 | Viewed by 6998
Abstract
Gaofen-3 (GF-3) is the first Chinese civil C-band synthetic aperture radar (SAR) launched on 10 August 2016 by the China Academy of Space Technology (CAST), which operates in 12 imaging modes with a fine spatial resolution up to 1 m. As one of [...] Read more.
Gaofen-3 (GF-3) is the first Chinese civil C-band synthetic aperture radar (SAR) launched on 10 August 2016 by the China Academy of Space Technology (CAST), which operates in 12 imaging modes with a fine spatial resolution up to 1 m. As one of the primary users, the State Oceanic Administration (SOA) operationally processes GF-3 SAR Level-1 products into ocean surface wind vector and plans to officially release the near real-time SAR wind products in the near future. In this paper, the methodology of wind retrieval at C-band SAR is introduced and the first results of GF-3 SAR-derived winds are presented. In particular, the case of the coastal katabatic wind off the west coast of the U.S. captured by GF-3 is discussed. The preliminary accuracy assessment of wind speed and direction retrievals from GF-3 SAR is carried out against in situ measurements from National Data Buoy Center (NDBC) buoy measurements of National Oceanic and Atmospheric Administration (NOAA). Only the buoys located inside the GF-3 SAR wind cell (1 km) were considered as co-located in space, while the time interval between observations of SAR and buoy was limited to less the 30 min. These criteria yielded 56 co-locations during the period from January to April 2017, showing the Root Mean Square Error (RMSE) of 2.46 m/s and 22.22° for wind speed and direction, respectively. Different performances due to geophysical model function (GMF) and Polarization Ratio (PR) are discussed. The preliminary results indicate that GF-3 wind retrievals are encouraging for operational implementation. Full article
(This article belongs to the Special Issue Ocean Remote Sensing with Synthetic Aperture Radar)
Show Figures

Figure 1

12 pages, 3530 KiB  
Technical Note
Pre-Flight SAOCOM-1A SAR Performance Assessment by Outdoor Campaign
by Davide Giudici 1, Andrea Monti Guarnieri 2 and Juan Pablo Cuesta Gonzalez 3,*
1 ARESYS srl, Via Flumendosa 16, 20132 Milan, Italy
2 Politecnico di Milano, Piazza Leonardo da Vinci 32, 20133 Milan, Italy
3 CONAE, Avda. Paseo Colon 751, 1063 Buenos Aires, Argentina
Remote Sens. 2017, 9(7), 729; https://doi.org/10.3390/rs9070729 - 14 Jul 2017
Cited by 4 | Viewed by 6968
Abstract
In the present paper, we describe the design, execution, and the results of an outdoor experimental campaign involving the Engineering Model of the first of the two Argentinean L-band Synthetic Aperture Radars (SARs) of the Satélite Argentino de Observación con Microondas (SAOCOM) mission, [...] Read more.
In the present paper, we describe the design, execution, and the results of an outdoor experimental campaign involving the Engineering Model of the first of the two Argentinean L-band Synthetic Aperture Radars (SARs) of the Satélite Argentino de Observación con Microondas (SAOCOM) mission, SAOCOM-1A. The experiment’s main objectives were to test the end-to-end SAR operation and to assess the instrument amplitude and phase stability as well as the far-field antenna pattern, through the illumination of a moving target placed several kilometers away from the SAR. The campaign was carried out in Bariloche, Argentina, during June 2016. The experiment was successful, demonstrating an end-to-end readiness of the SAOCOM-SAR functionality in realistic conditions. The results showed an excellent SAR signal quality in terms of amplitude and phase stability. Full article
(This article belongs to the Special Issue Advances in SAR: Sensors, Methodologies, and Applications)
Show Figures

Figure 1

2 pages, 146 KiB  
Erratum
Erratum: Chance, E.W., et al. Identifying Irrigated Areas in the Snake River Plain, Idaho: Evaluating Performance across Compositing Algorithms, Spectral Indices, and Sensors. Remote Sens. 2017, 9, 546
by Eric W. Chance 1,*, Kelly M. Cobourn 1, Valerie A. Thomas 1, Blaine C. Dawson 2 and Alejandro N. Flores 2
1 Department of Forest Resources and Environmental Conservation, Virginia Polytechnic Institute and State University, 310 West Campus Drive, Blacksburg, VA 24061-0324, USA
2 Department of Geosciences, Boise State University, 1910 University Drive, Boise, ID 83725-1535, USA
Remote Sens. 2017, 9(7), 738; https://doi.org/10.3390/rs9070738 - 18 Jul 2017
Viewed by 3354
Abstract
In the published paper [1], the title and Appendix Tables A4, A5, A7, and A8 contain typographical errors. The correct title and table captions are as follows: [...]
Full article
26 pages, 3578 KiB  
Technical Note
LACO-Wiki: A New Online Land Cover Validation Tool Demonstrated Using GlobeLand30 for Kenya
by Linda See 1,*, Juan Carlos Laso Bayas 1, Dmitry Schepaschenko 1, Christoph Perger 1, Christopher Dresel 1, Victor Maus 1, Carl Salk 1,2, Juergen Weichselbaum 3, Myroslava Lesiv 1, Ian McCallum 1, Inian Moorthy 1 and Steffen Fritz 1
1 Ecosystems Services and Management Program, International Institute for Applied Systems Analysis (IIASA), Laxenburg, A-2361, Austria
2 Southern Swedish Forest Research Centre, Swedish University of Agricultural Sciences, Alnarp, SE-23053, Sweden
3 GeoVille Information Systems GmbH, Innsbruck, A-6020, Austria
Remote Sens. 2017, 9(7), 754; https://doi.org/10.3390/rs9070754 - 22 Jul 2017
Cited by 32 | Viewed by 9429
Abstract
Accuracy assessment, also referred to as validation, is a key process in the workflow of developing a land cover map. To make this process open and transparent, we have developed a new online tool called LACO-Wiki, which encapsulates this process into a set [...] Read more.
Accuracy assessment, also referred to as validation, is a key process in the workflow of developing a land cover map. To make this process open and transparent, we have developed a new online tool called LACO-Wiki, which encapsulates this process into a set of four simple steps including uploading a land cover map, creating a sample from the map, interpreting the sample with very high resolution satellite imagery and generating a report with accuracy measures. The aim of this paper is to present the main features of this new tool followed by an example of how it can be used for accuracy assessment of a land cover map. For the purpose of illustration, we have chosen GlobeLand30 for Kenya. Two different samples were interpreted by three individuals: one sample was provided by the GlobeLand30 team as part of their international efforts in validating GlobeLand30 with GEO (Group on Earth Observation) member states while a second sample was generated using LACO-Wiki. Using satellite imagery from Google Maps, Bing and Google Earth, the results show overall accuracies between 53% to 61%, which is lower than the global accuracy assessment of GlobeLand30 but may be reasonable given the complex landscapes found in Kenya. Statistical models were then fit to the data to determine what factors affect the agreement between the three interpreters such as the land cover class, the presence of very high resolution satellite imagery and the age of the image in relation to the baseline year for GlobeLand30 (2010). The results showed that all factors had a significant effect on the agreement. Full article
(This article belongs to the Special Issue Validation on Global Land Cover Datasets)
Show Figures

Graphical abstract

Previous Issue
Next Issue
Back to TopTop