Intercalibration and Gaussian Process Modeling of Nighttime Lights Imagery for Measuring Urbanization Trends in Africa 2000–2013

Abstract
:
1. Introduction
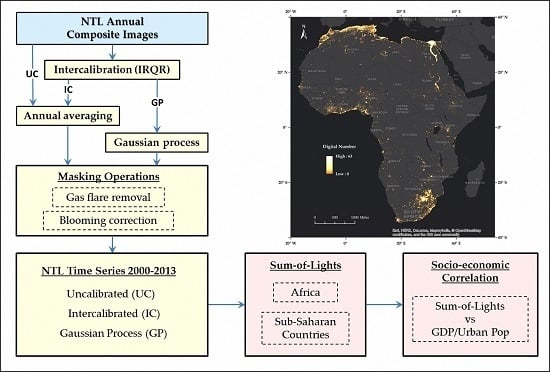
2. Materials and Methods
2.1. Data Source
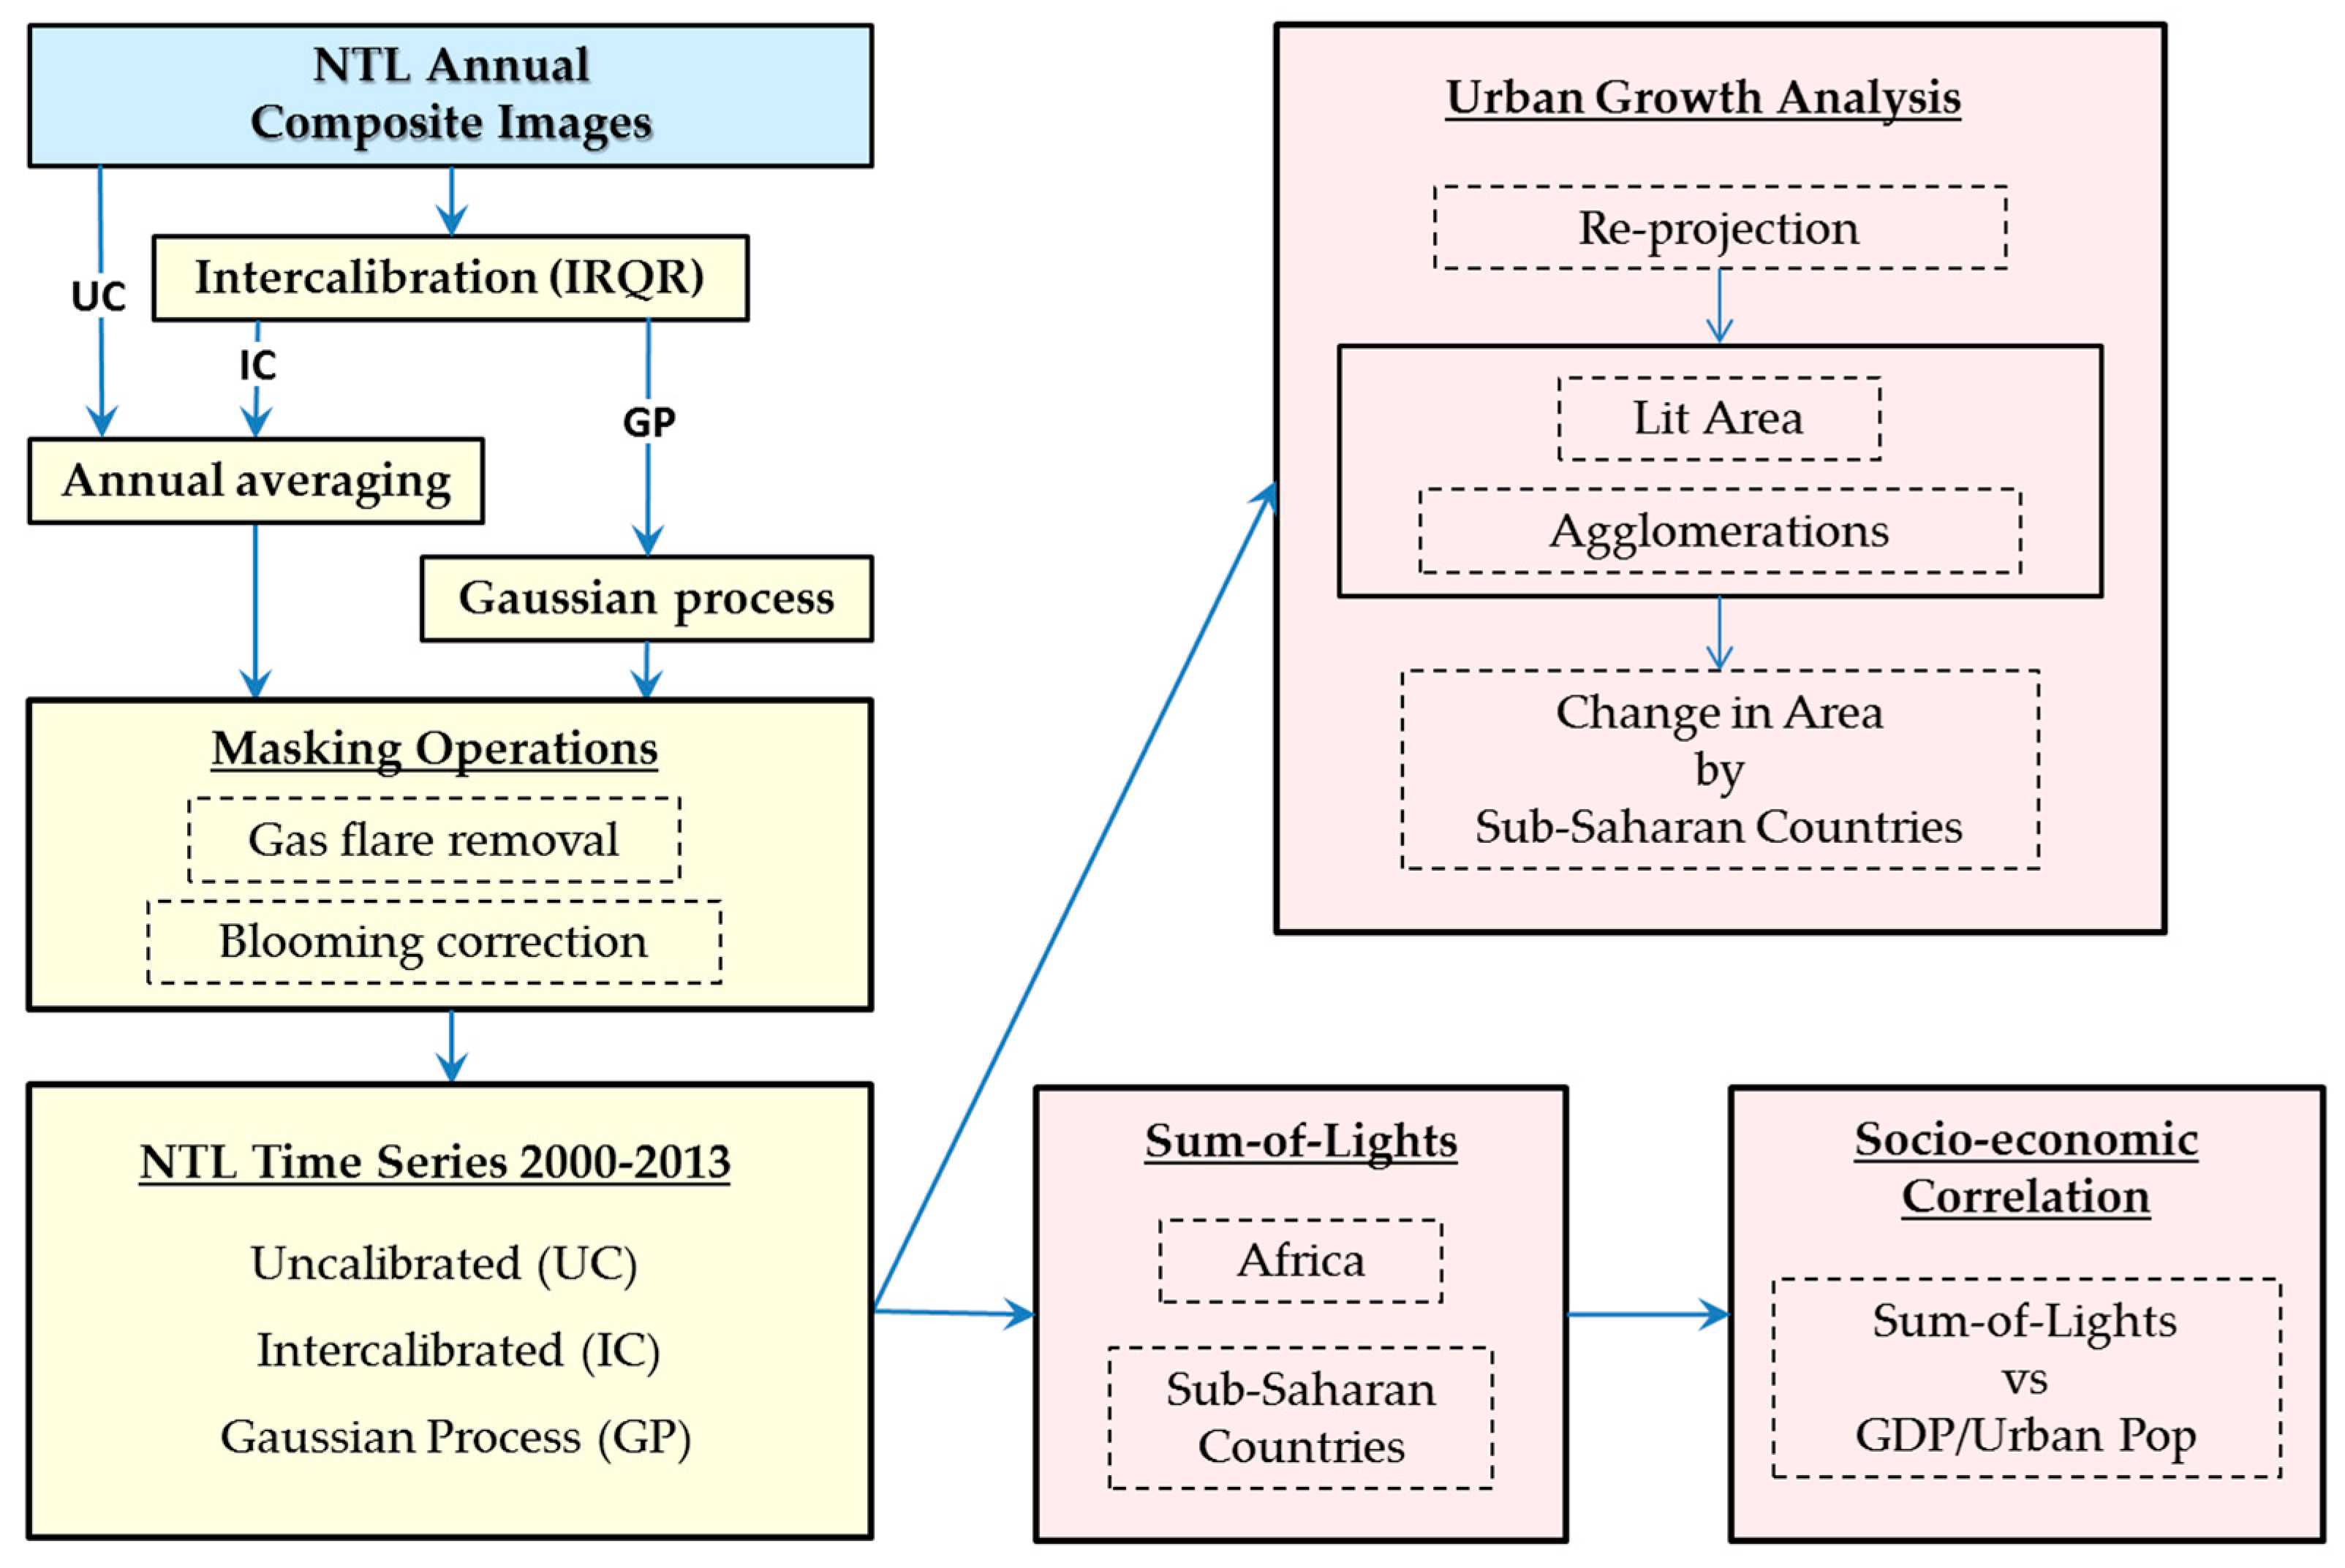
2.2. Image Processing
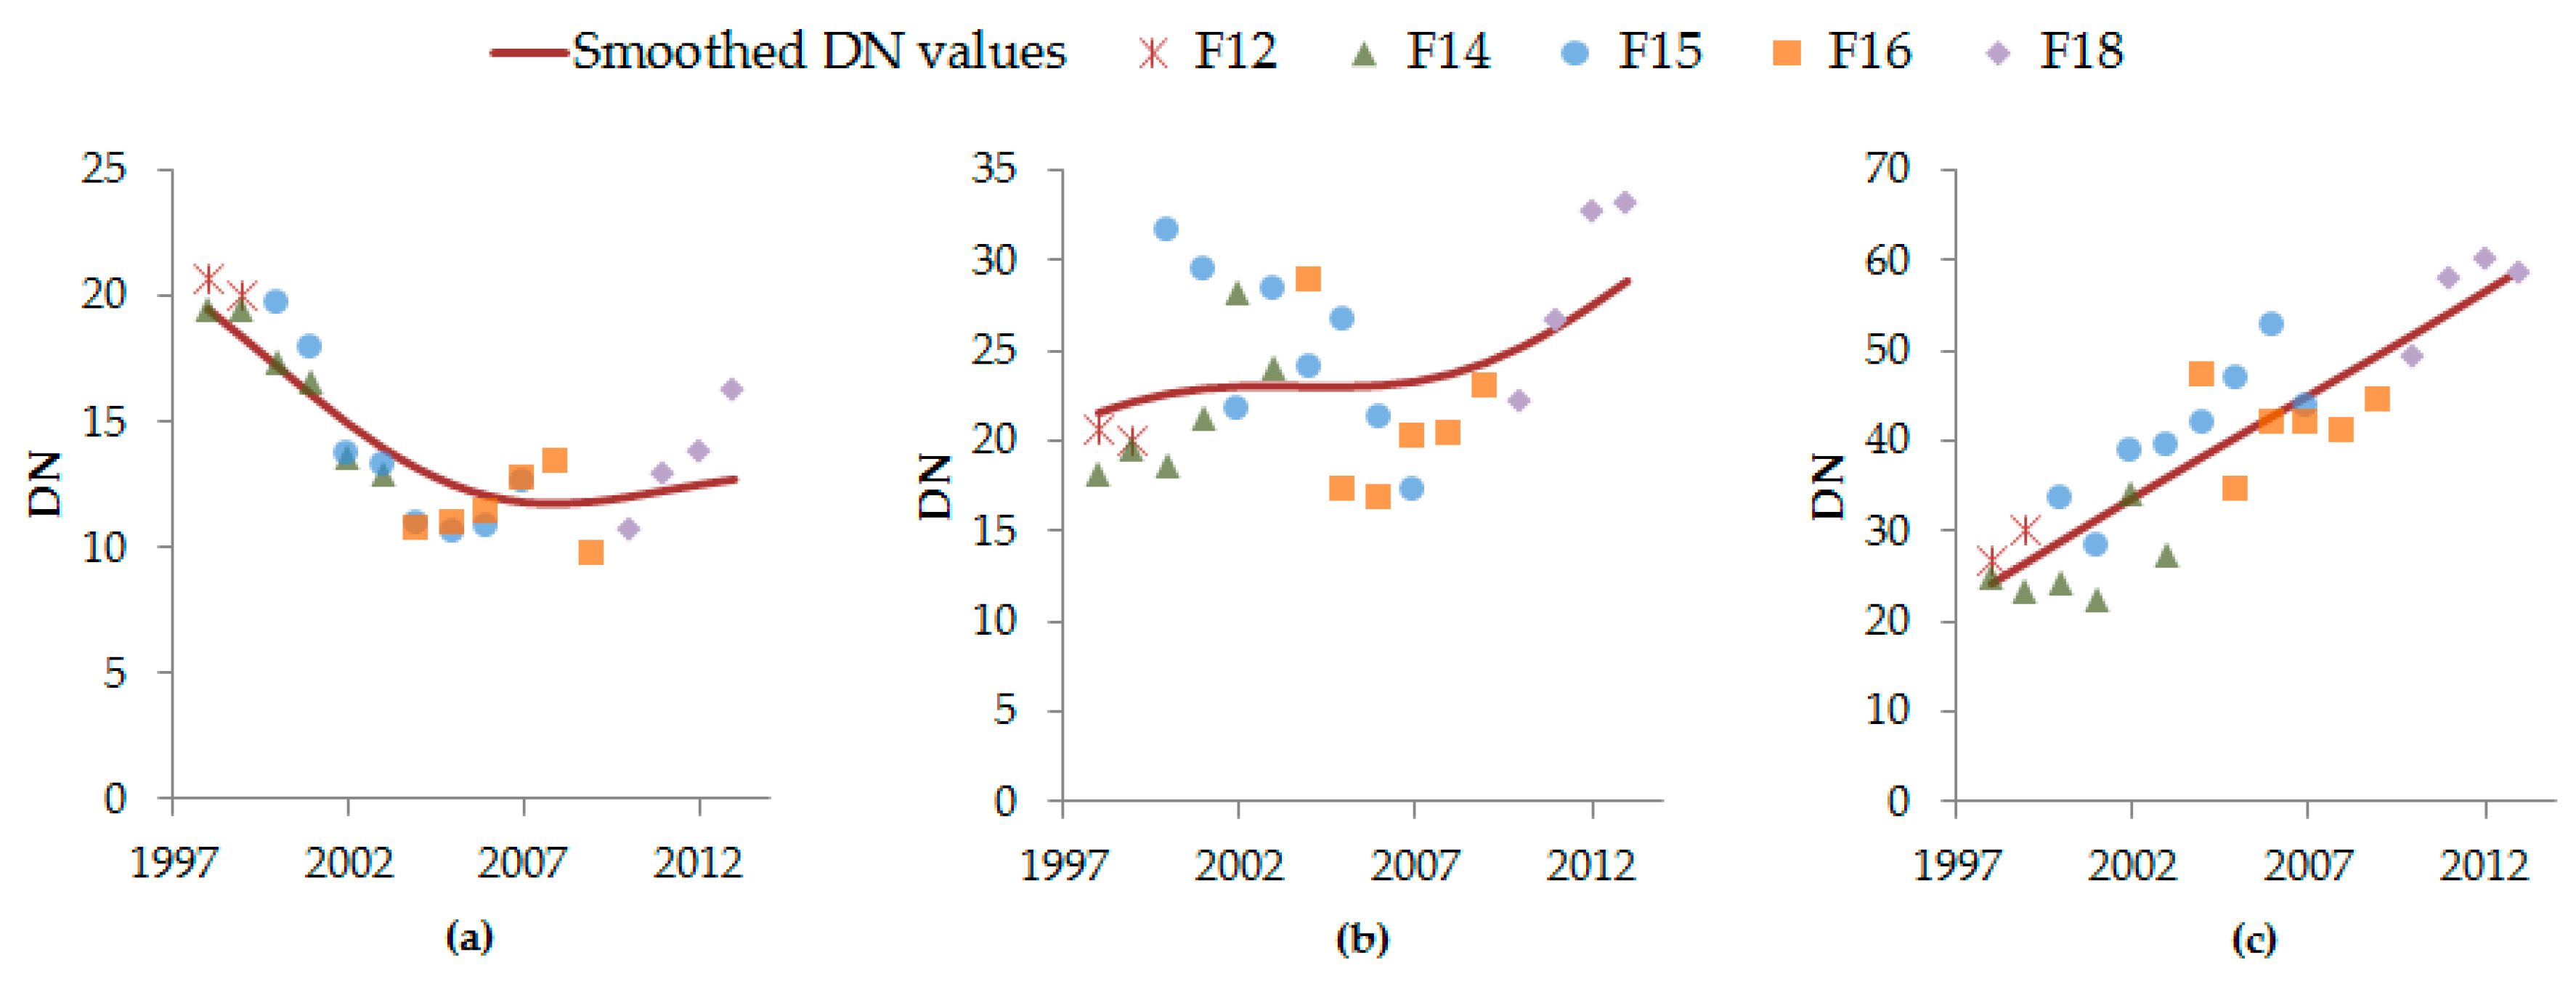
2.2.1. Intercalibration
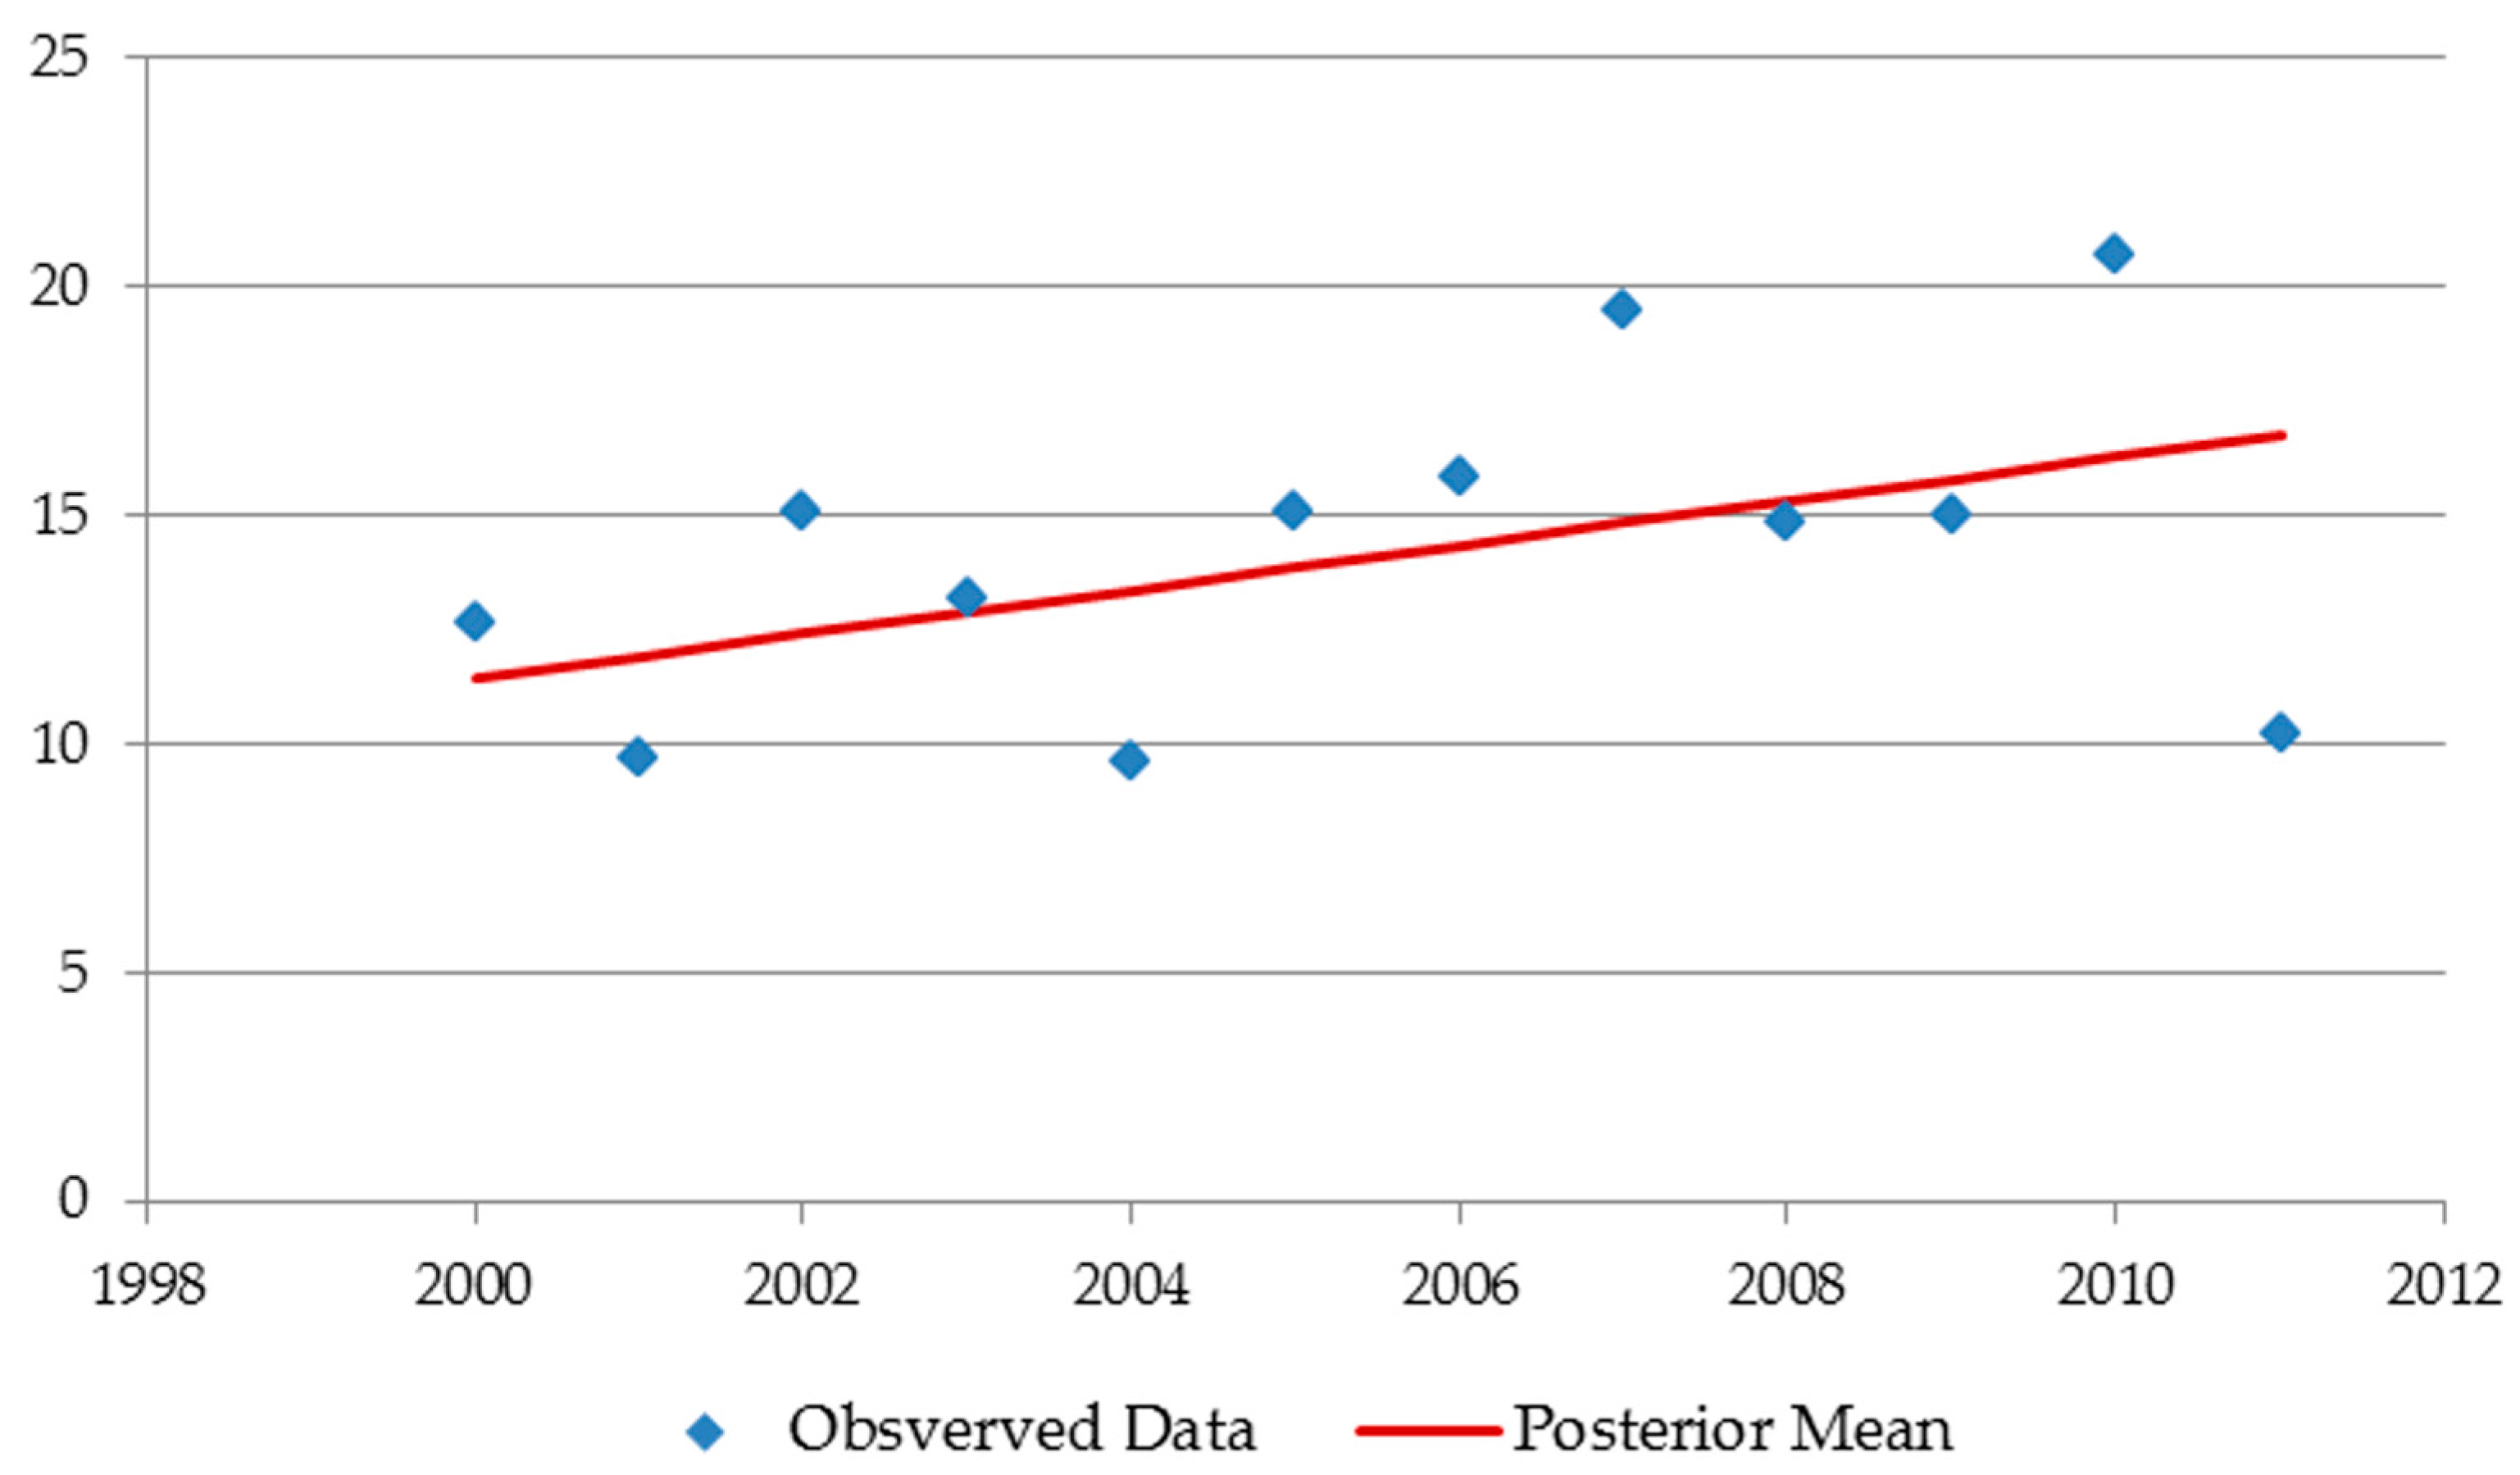
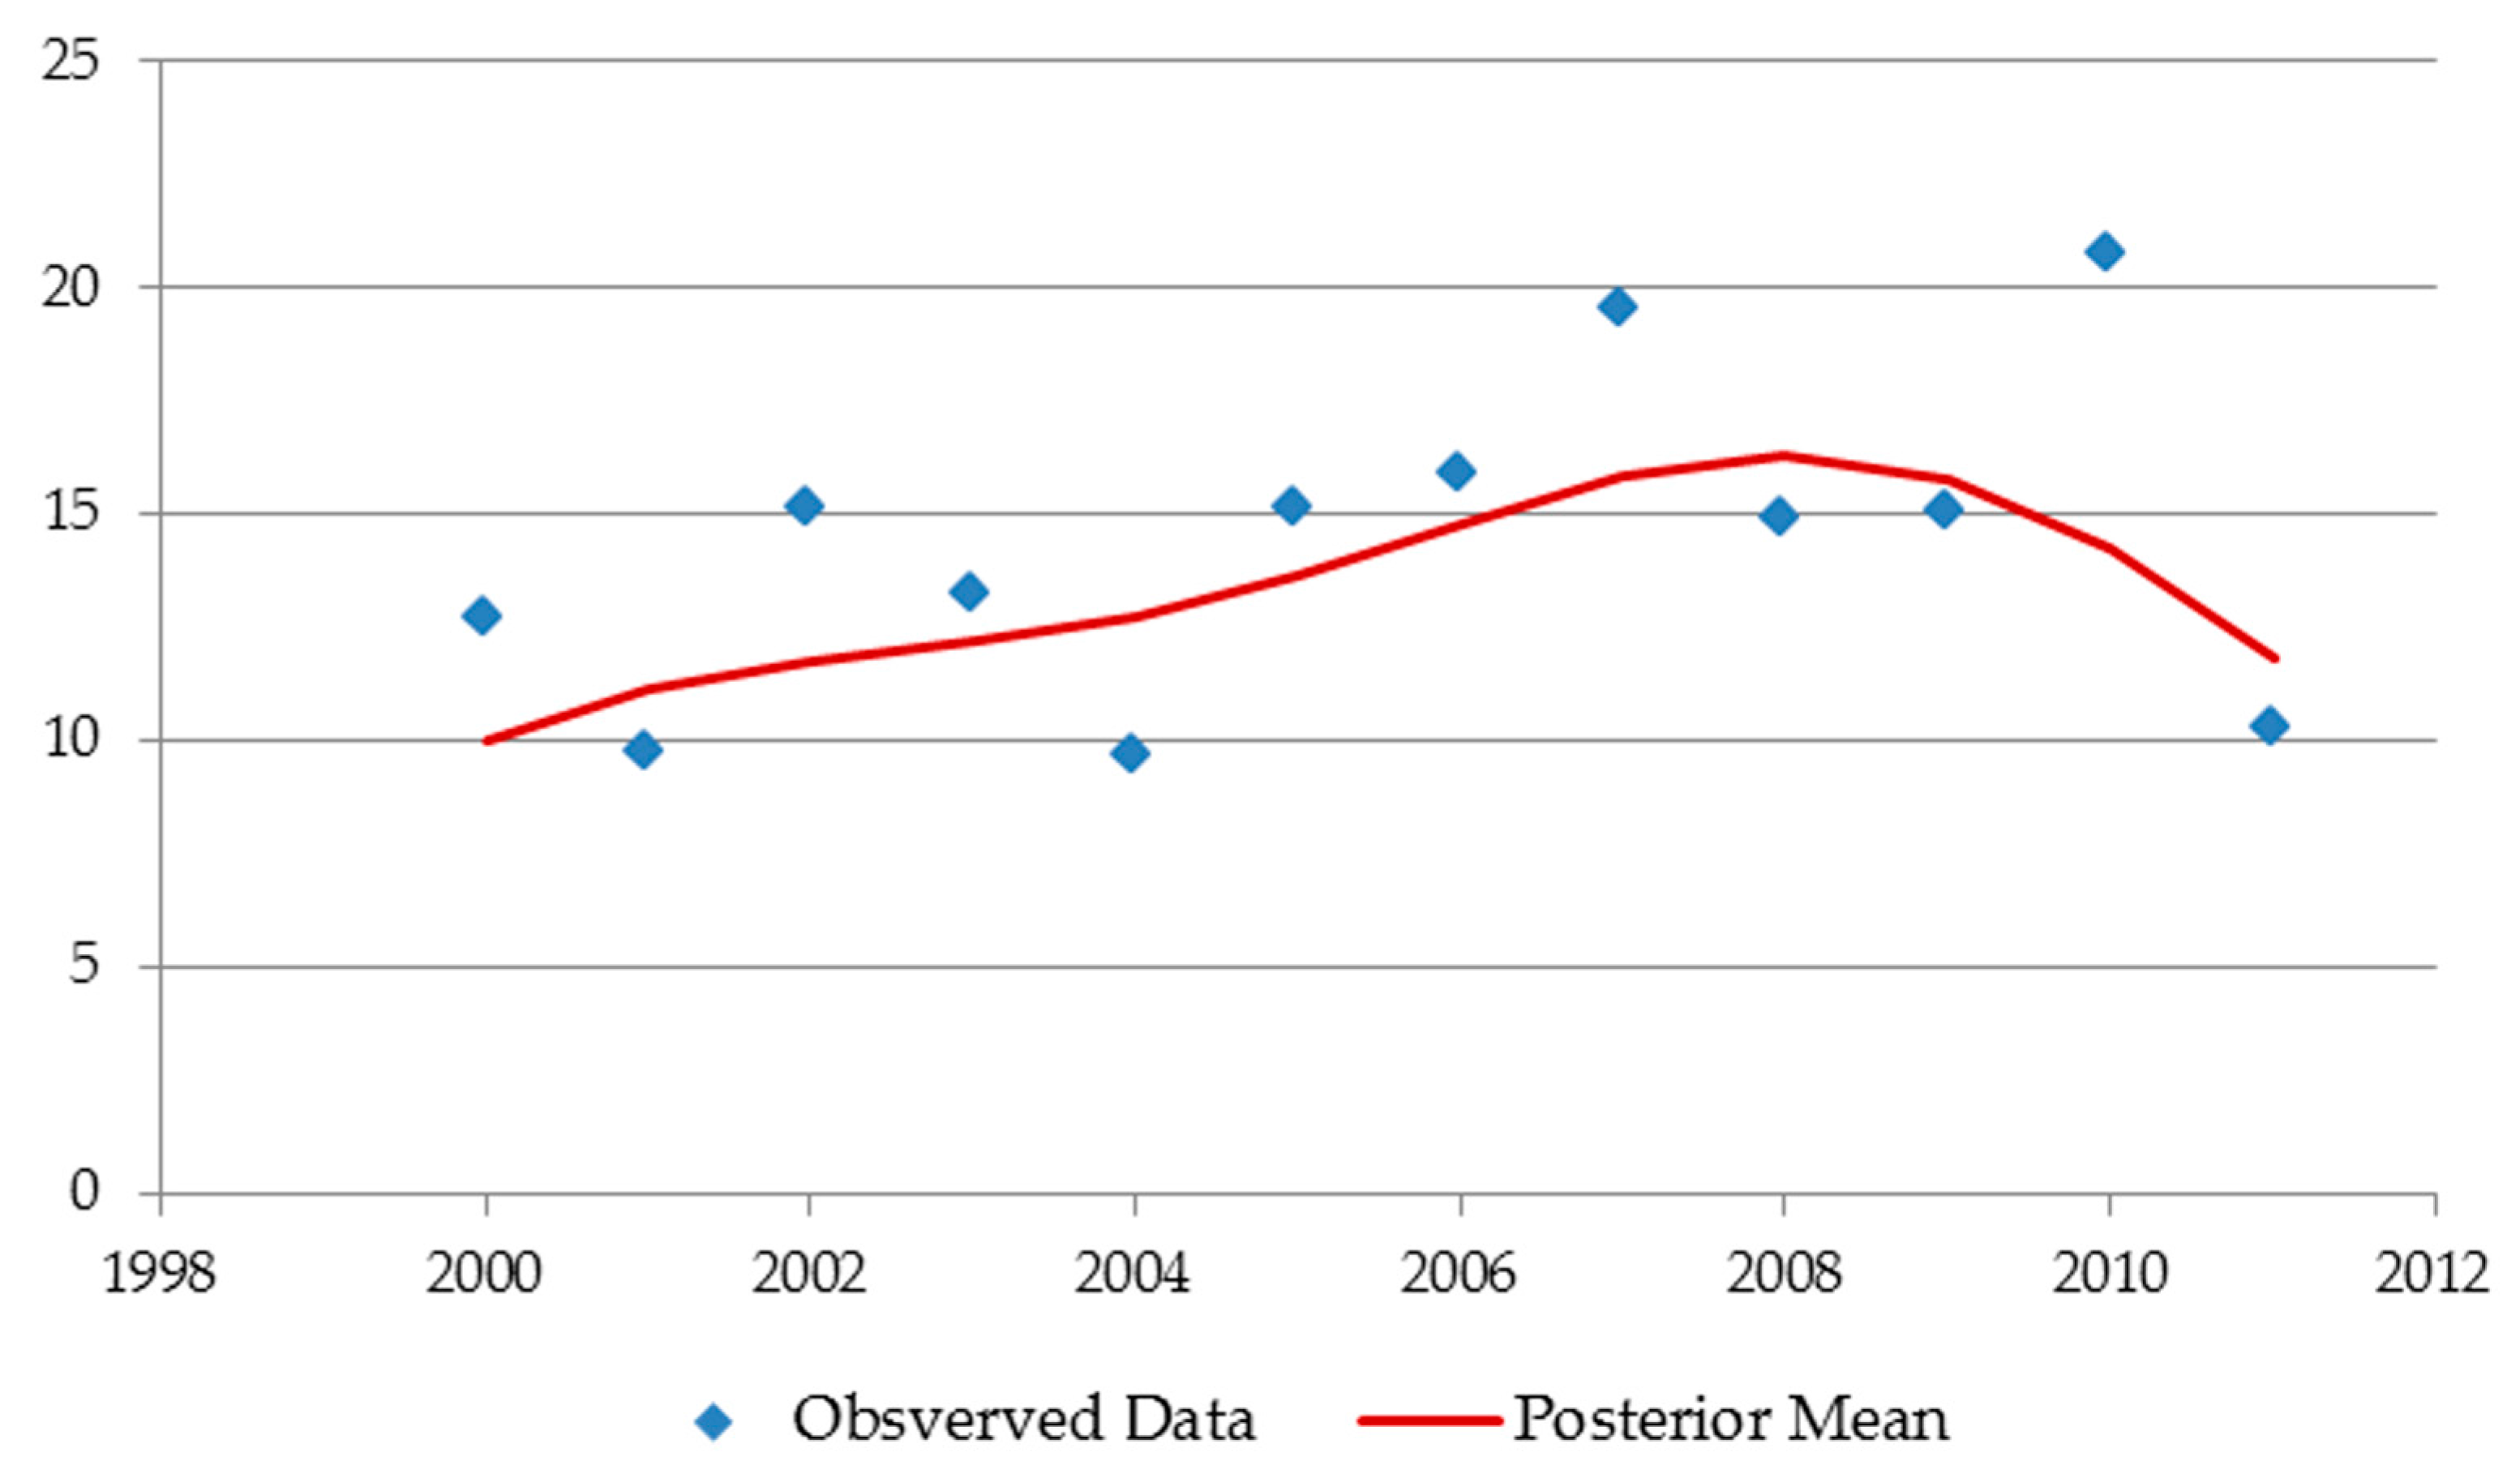
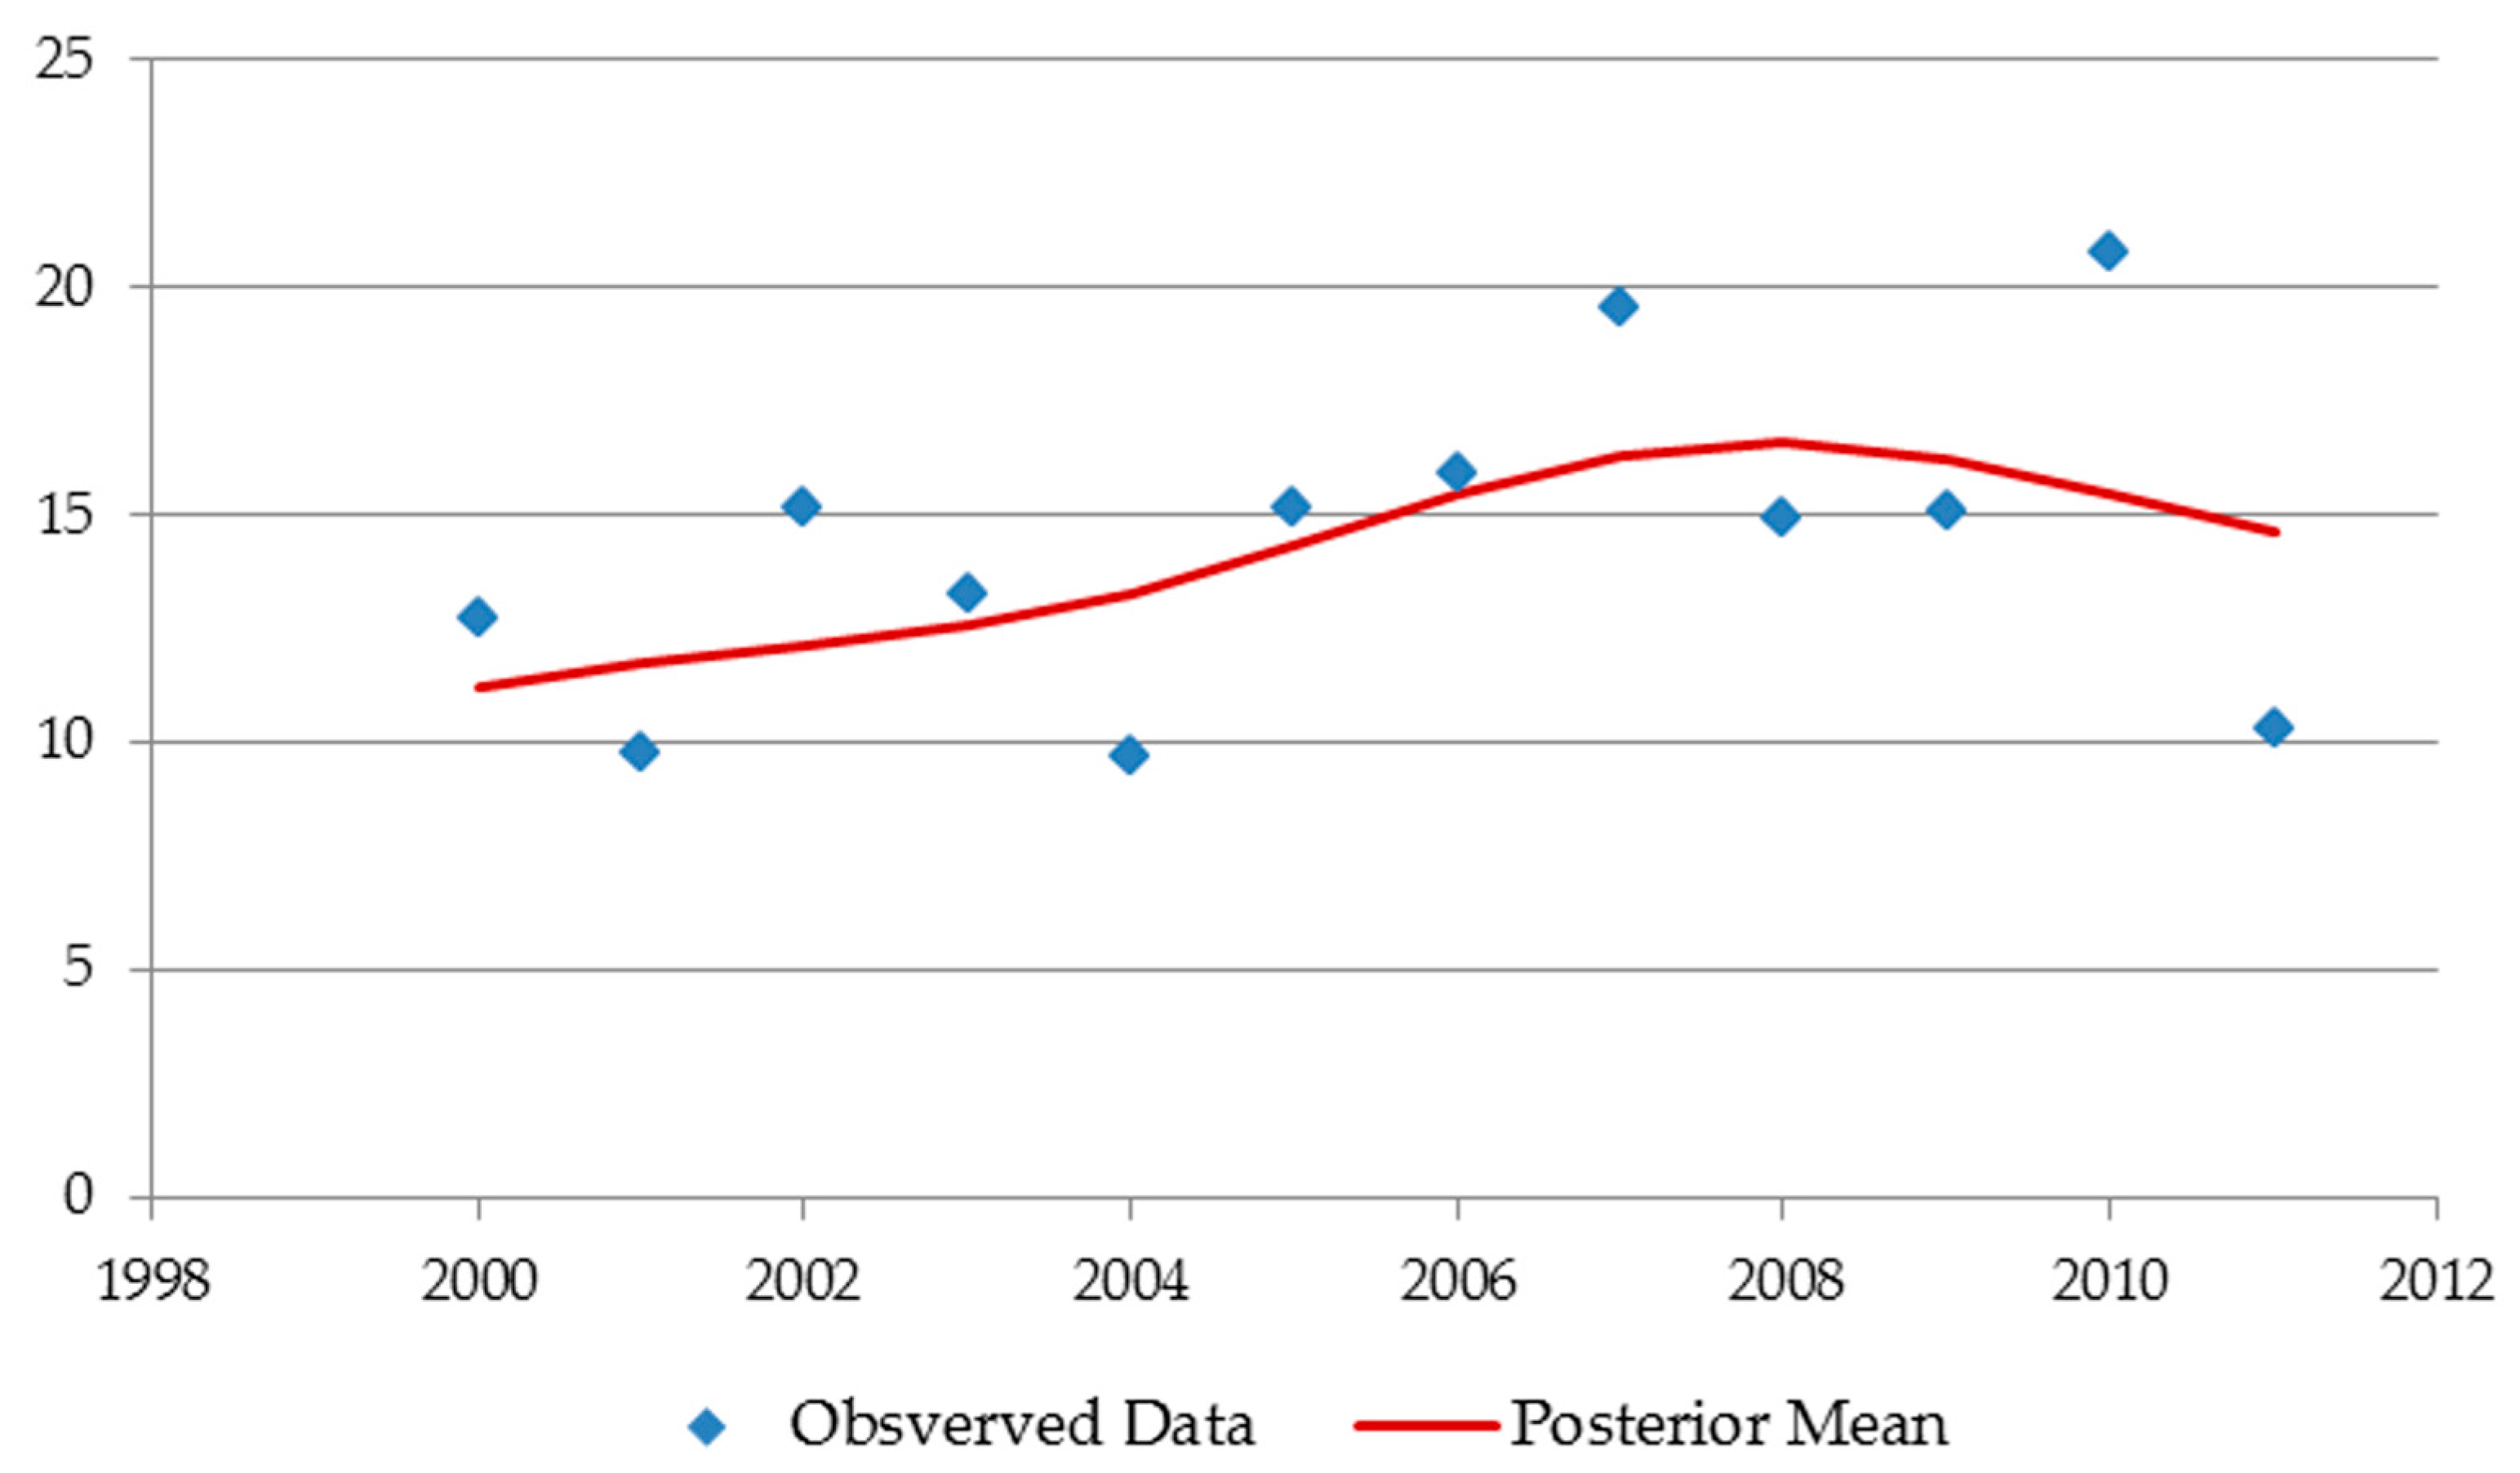
2.2.2. Gaussian Process Smoothing
2.2.3. Annual Averaging
2.2.4. Gas Flare Removal
2.2.5. Blooming Correction
2.2.6. Re-Projection
2.3. Method Validation and Urban Growth Analysis
3. Results
3.1. Method Evaluation
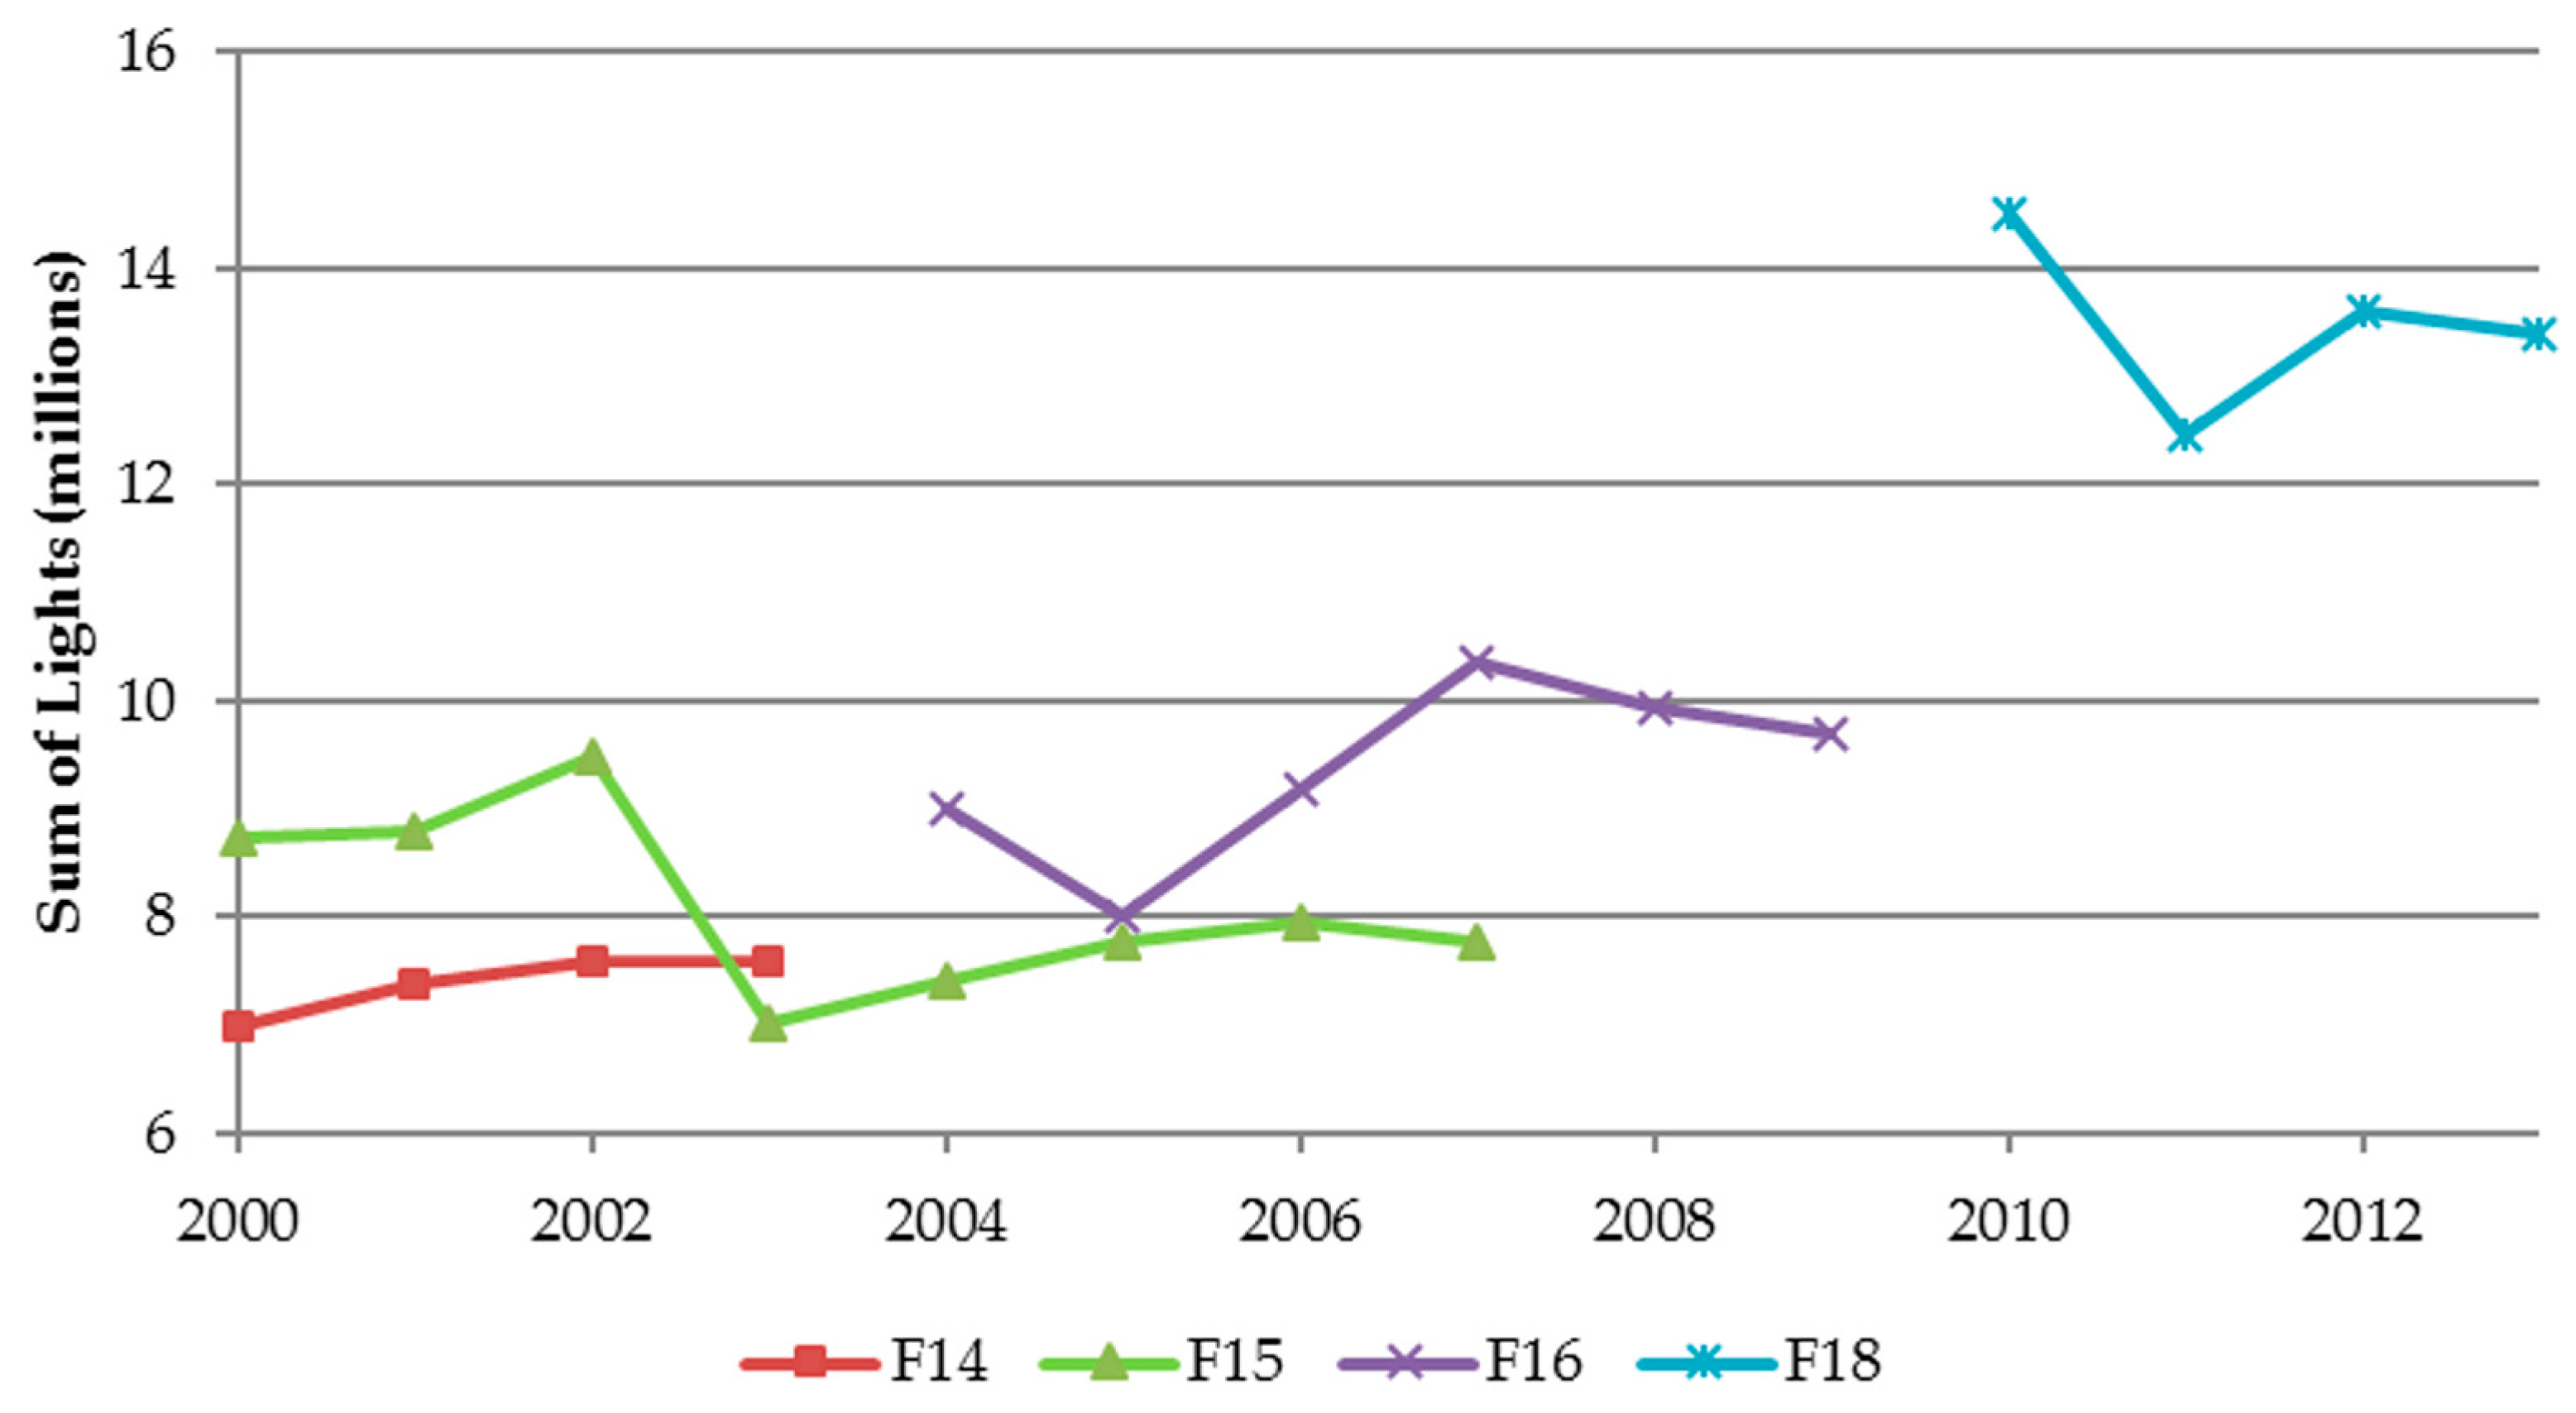
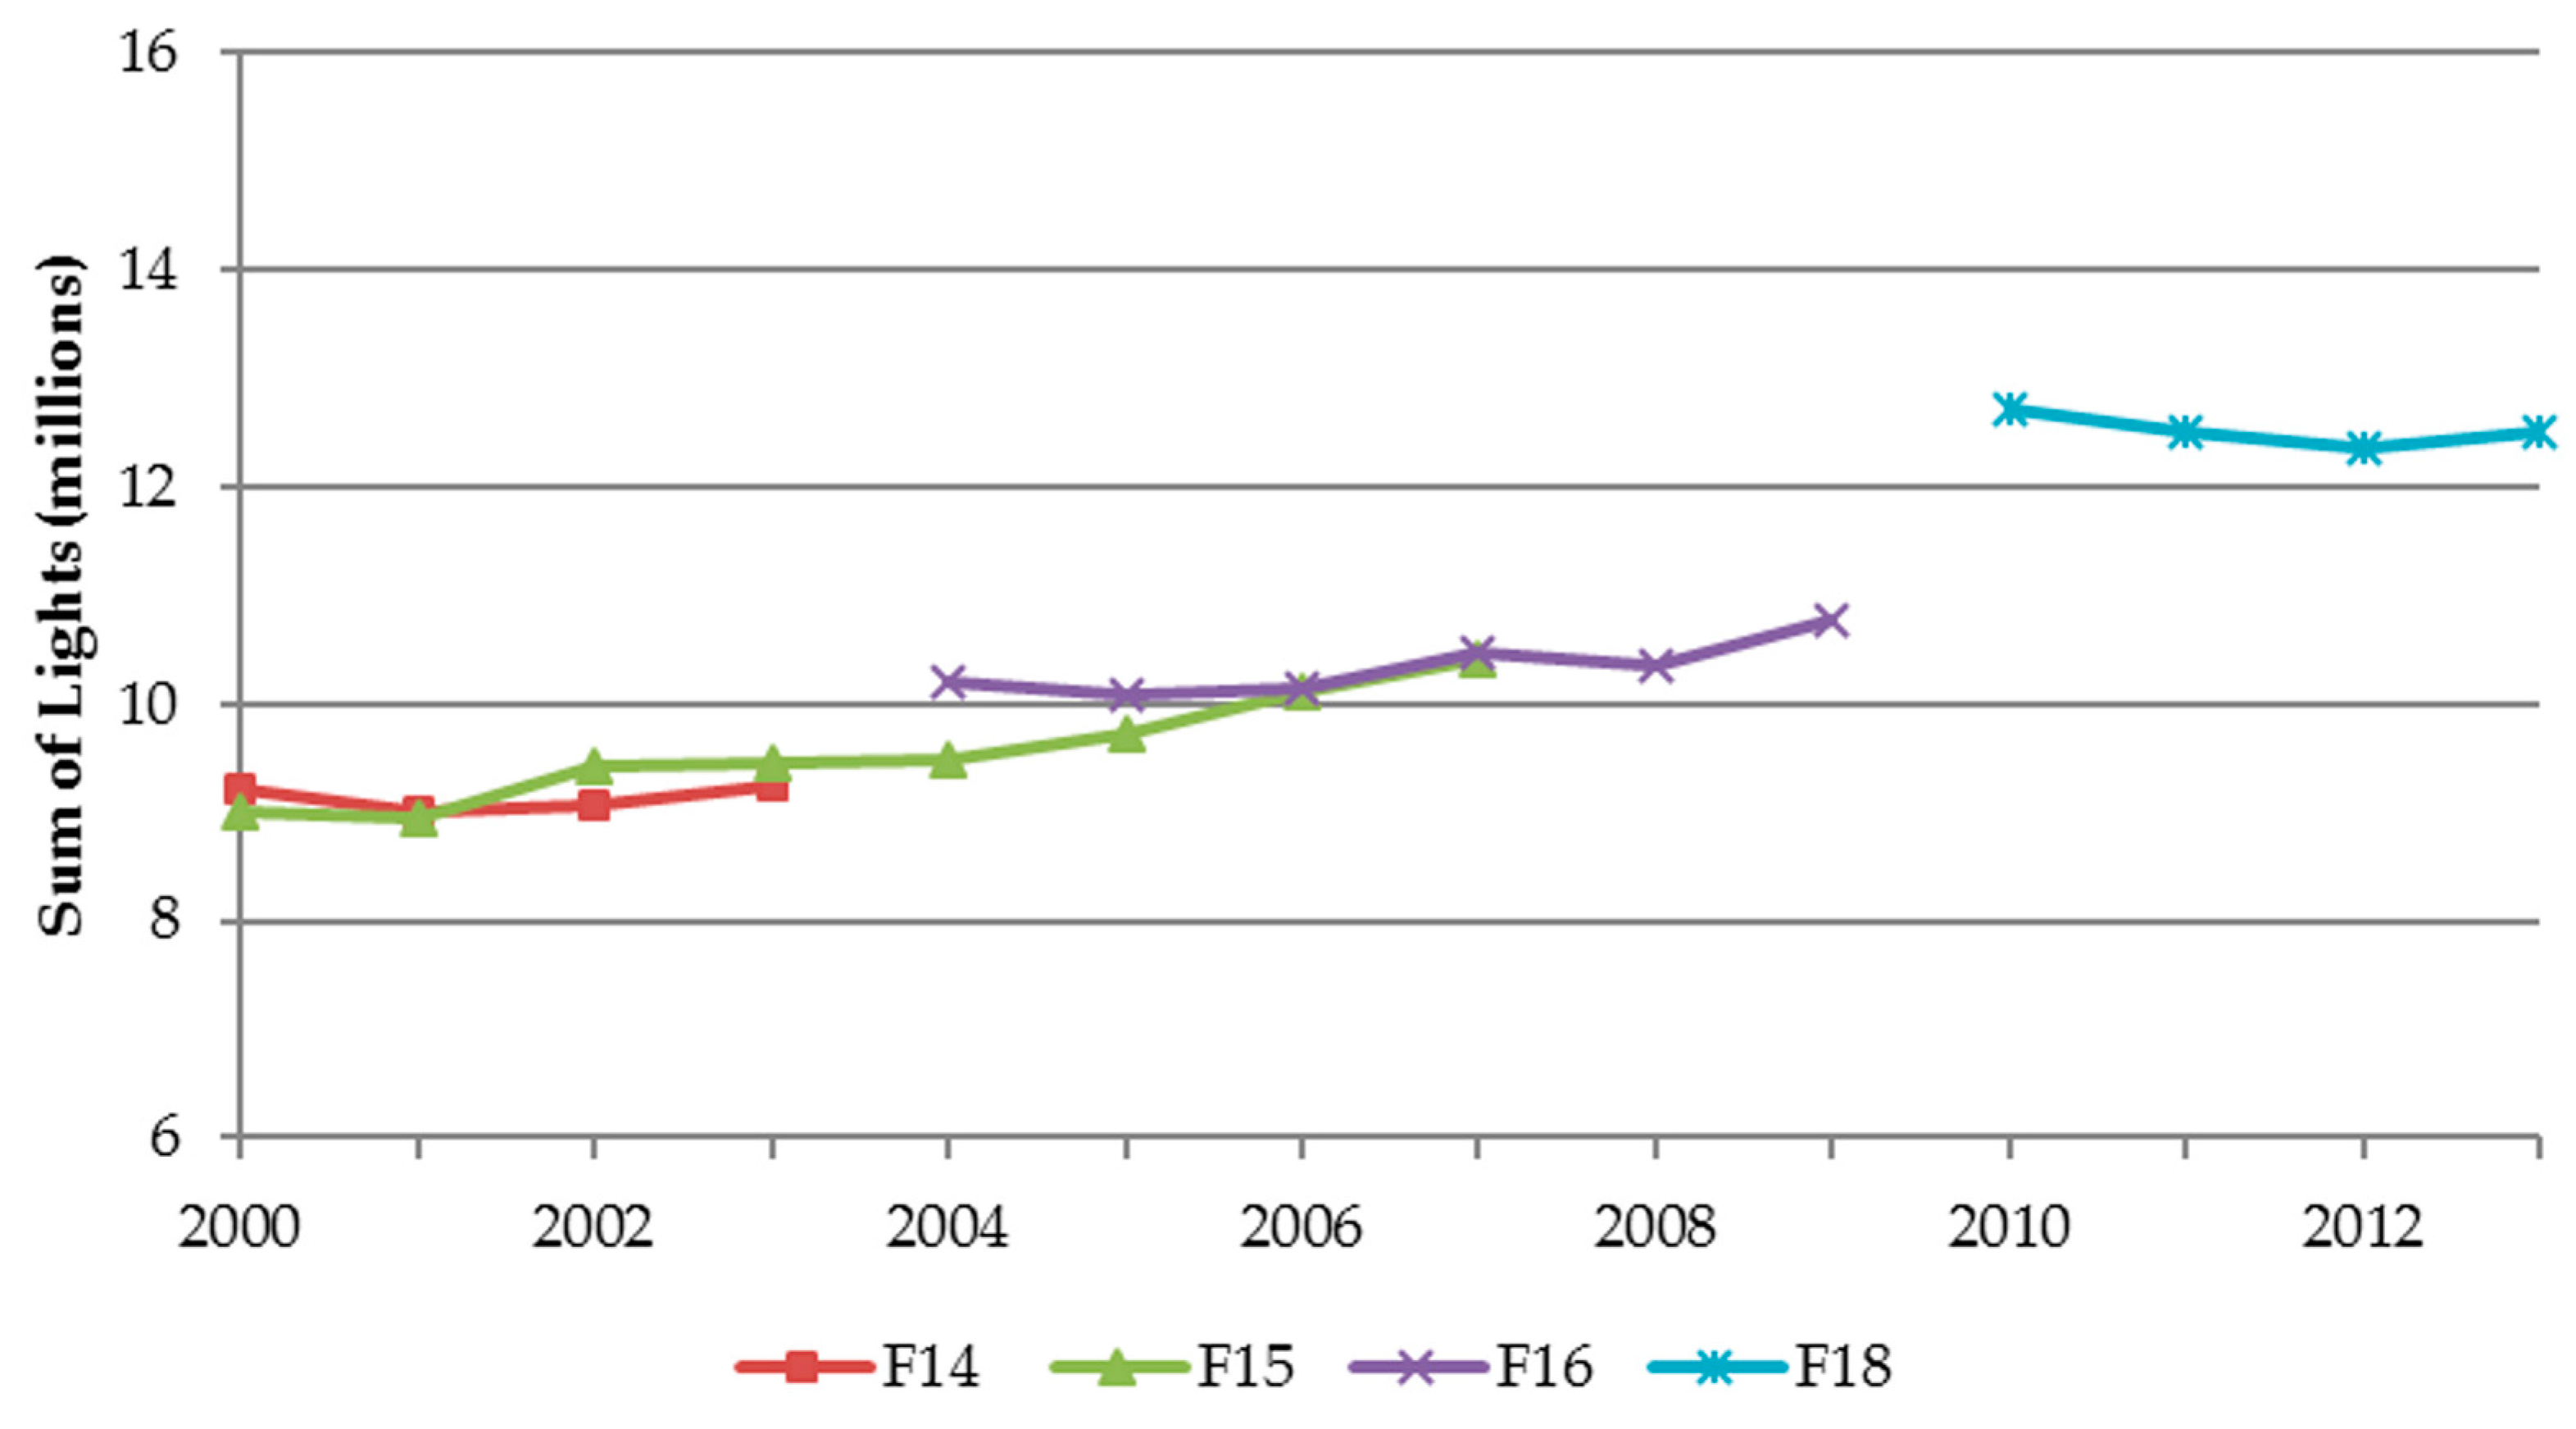
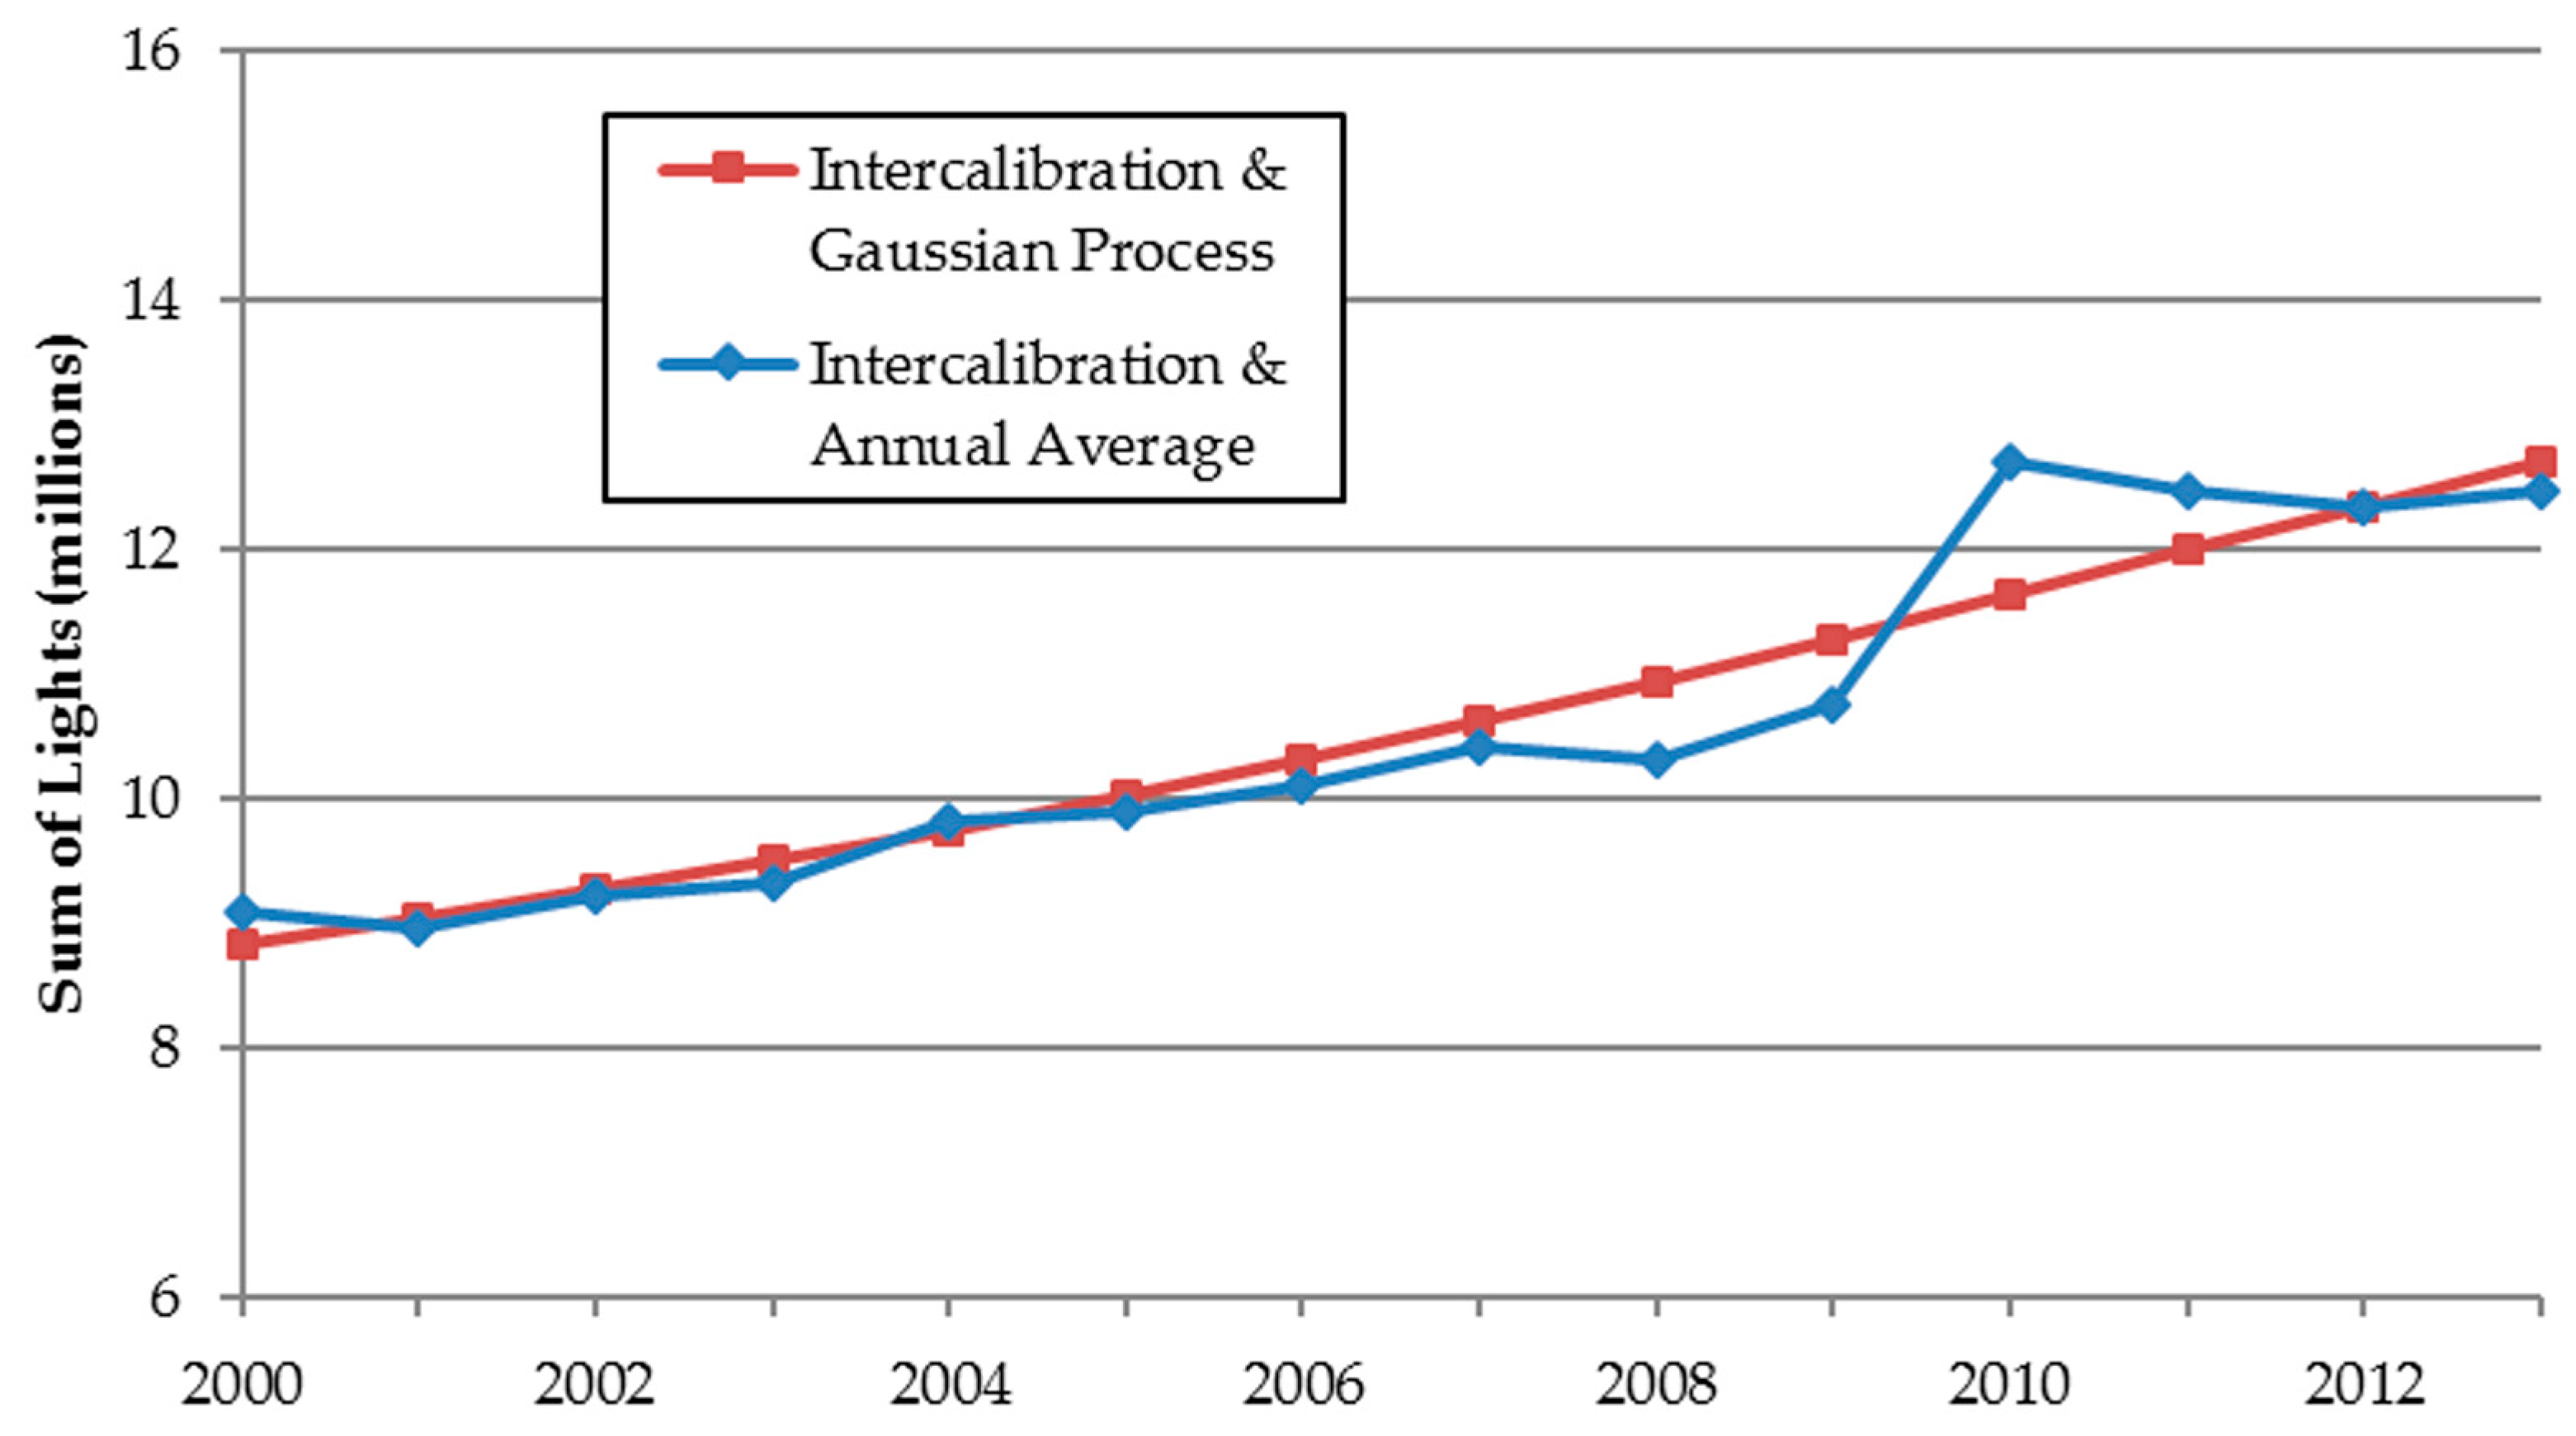
3.1.1. Sum-of-Lights Index
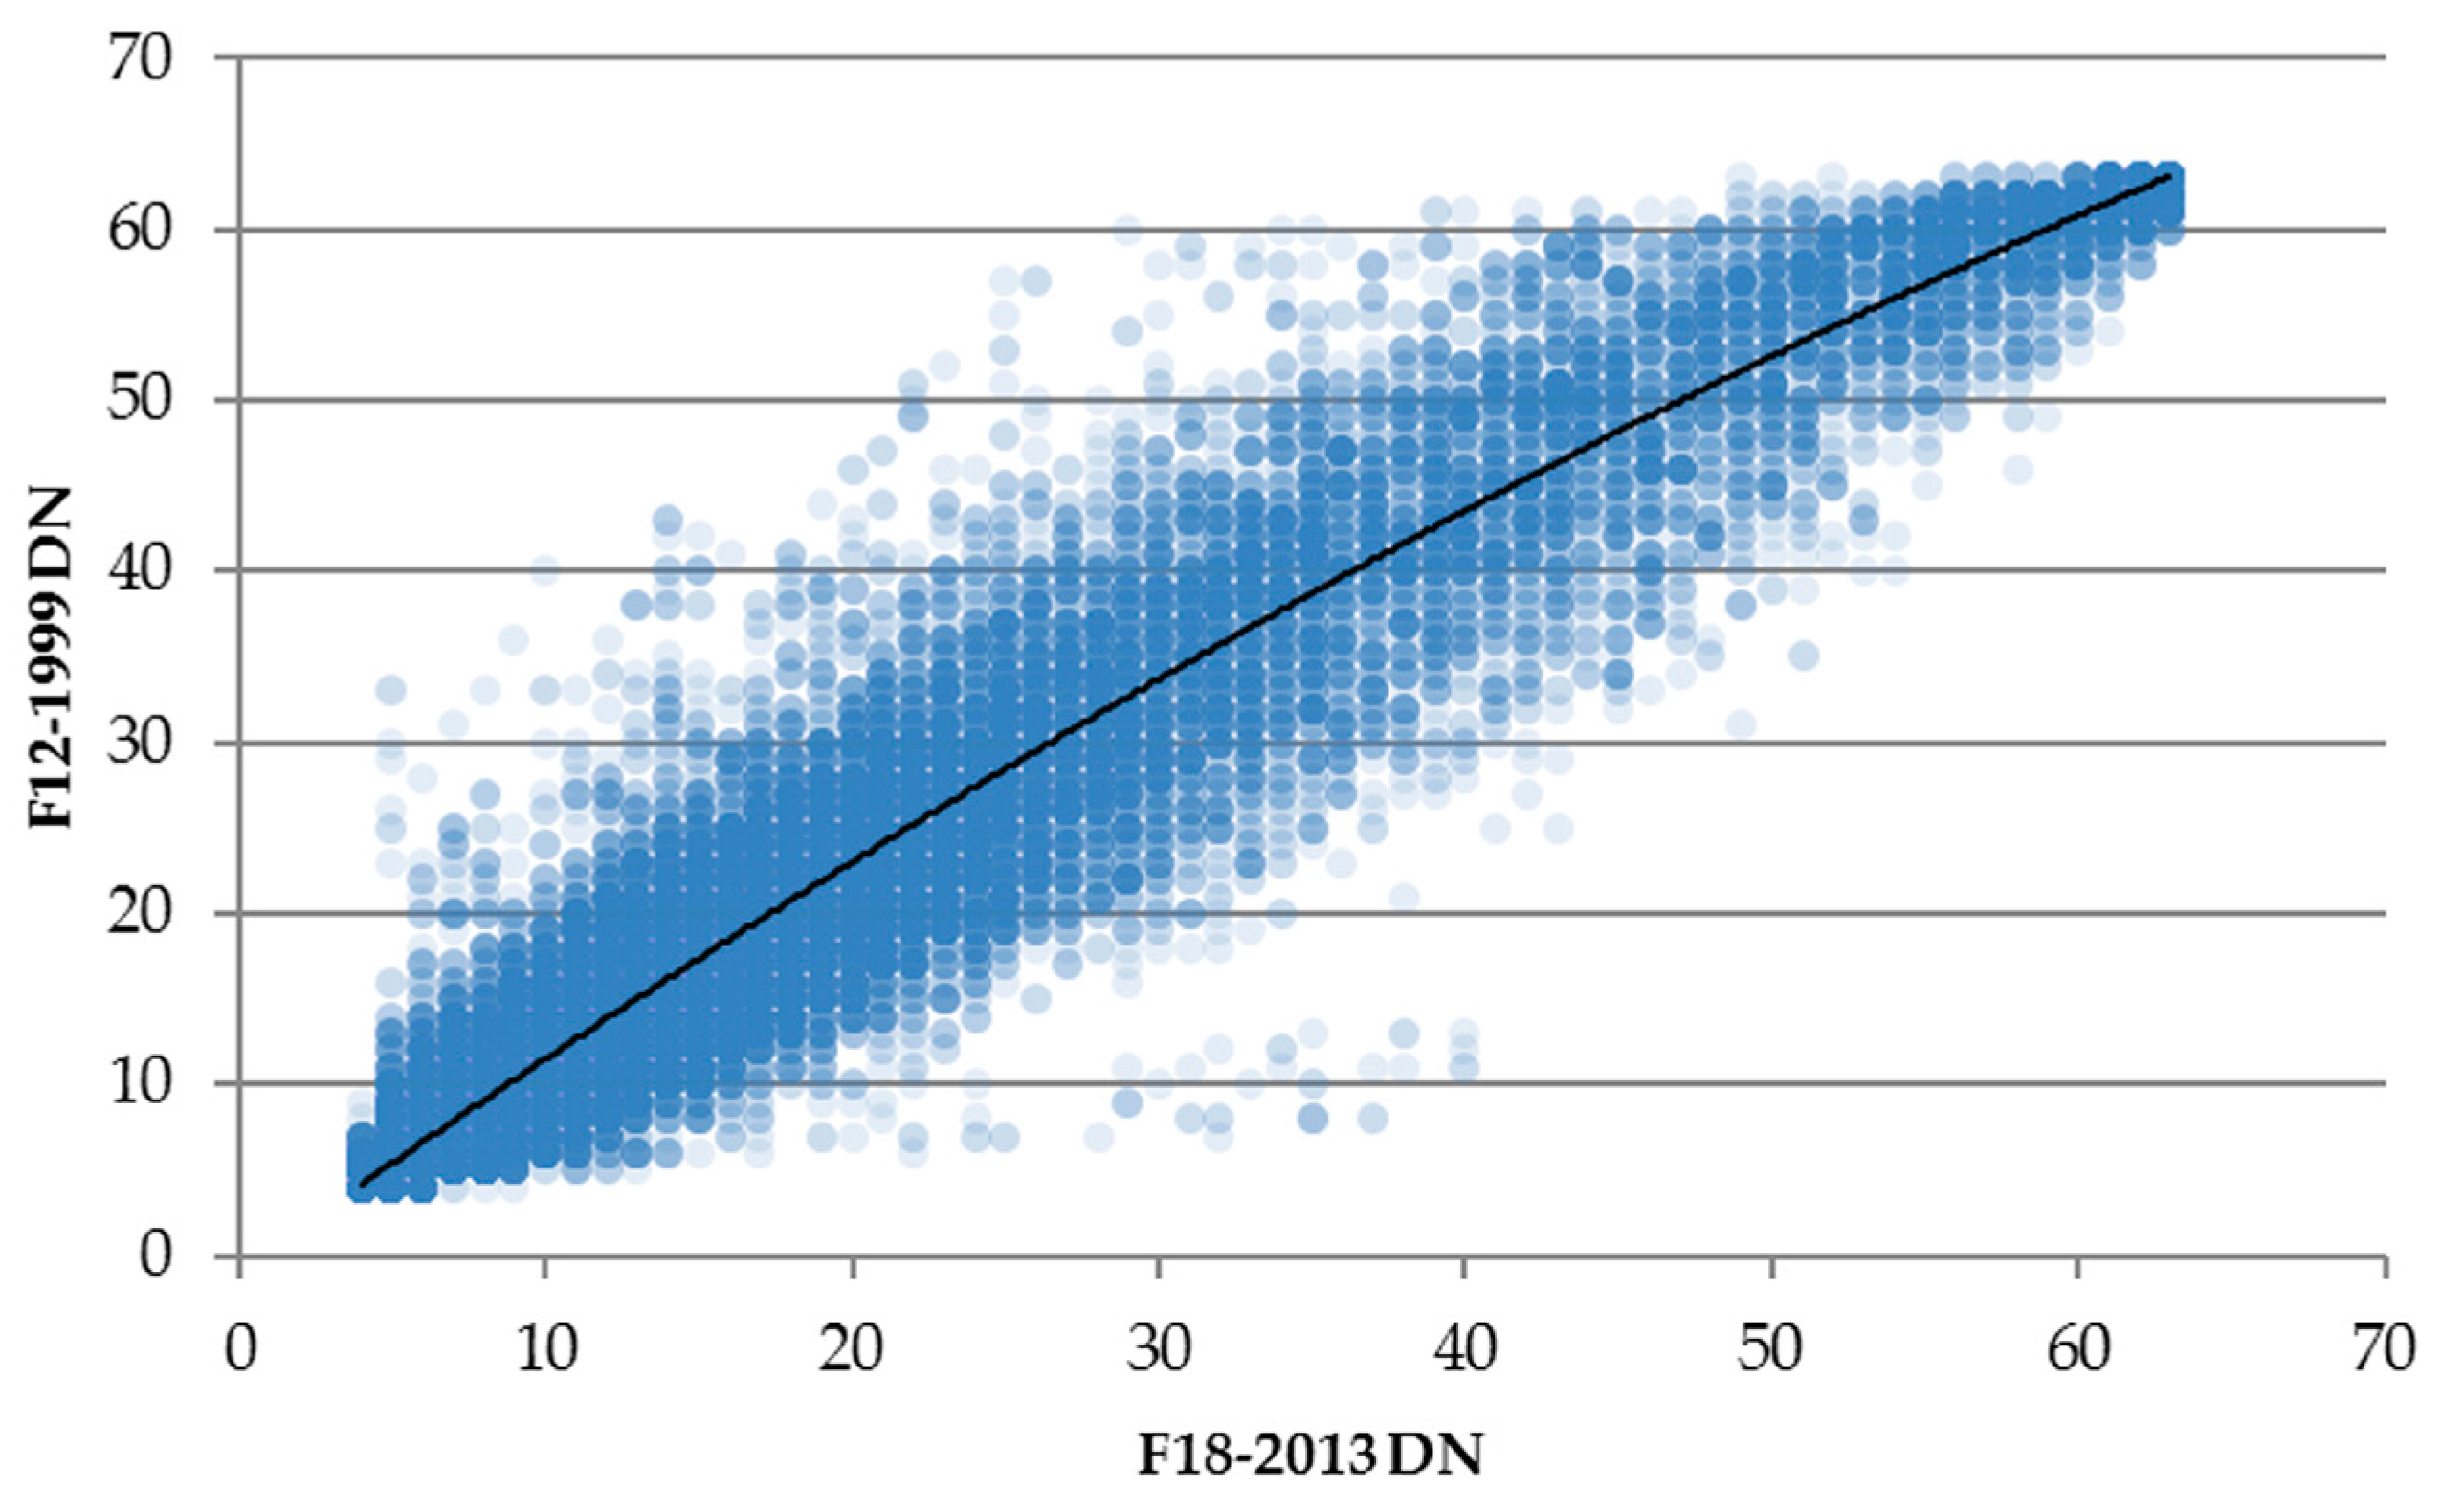
3.1.2. Validation Using the Invariant Region
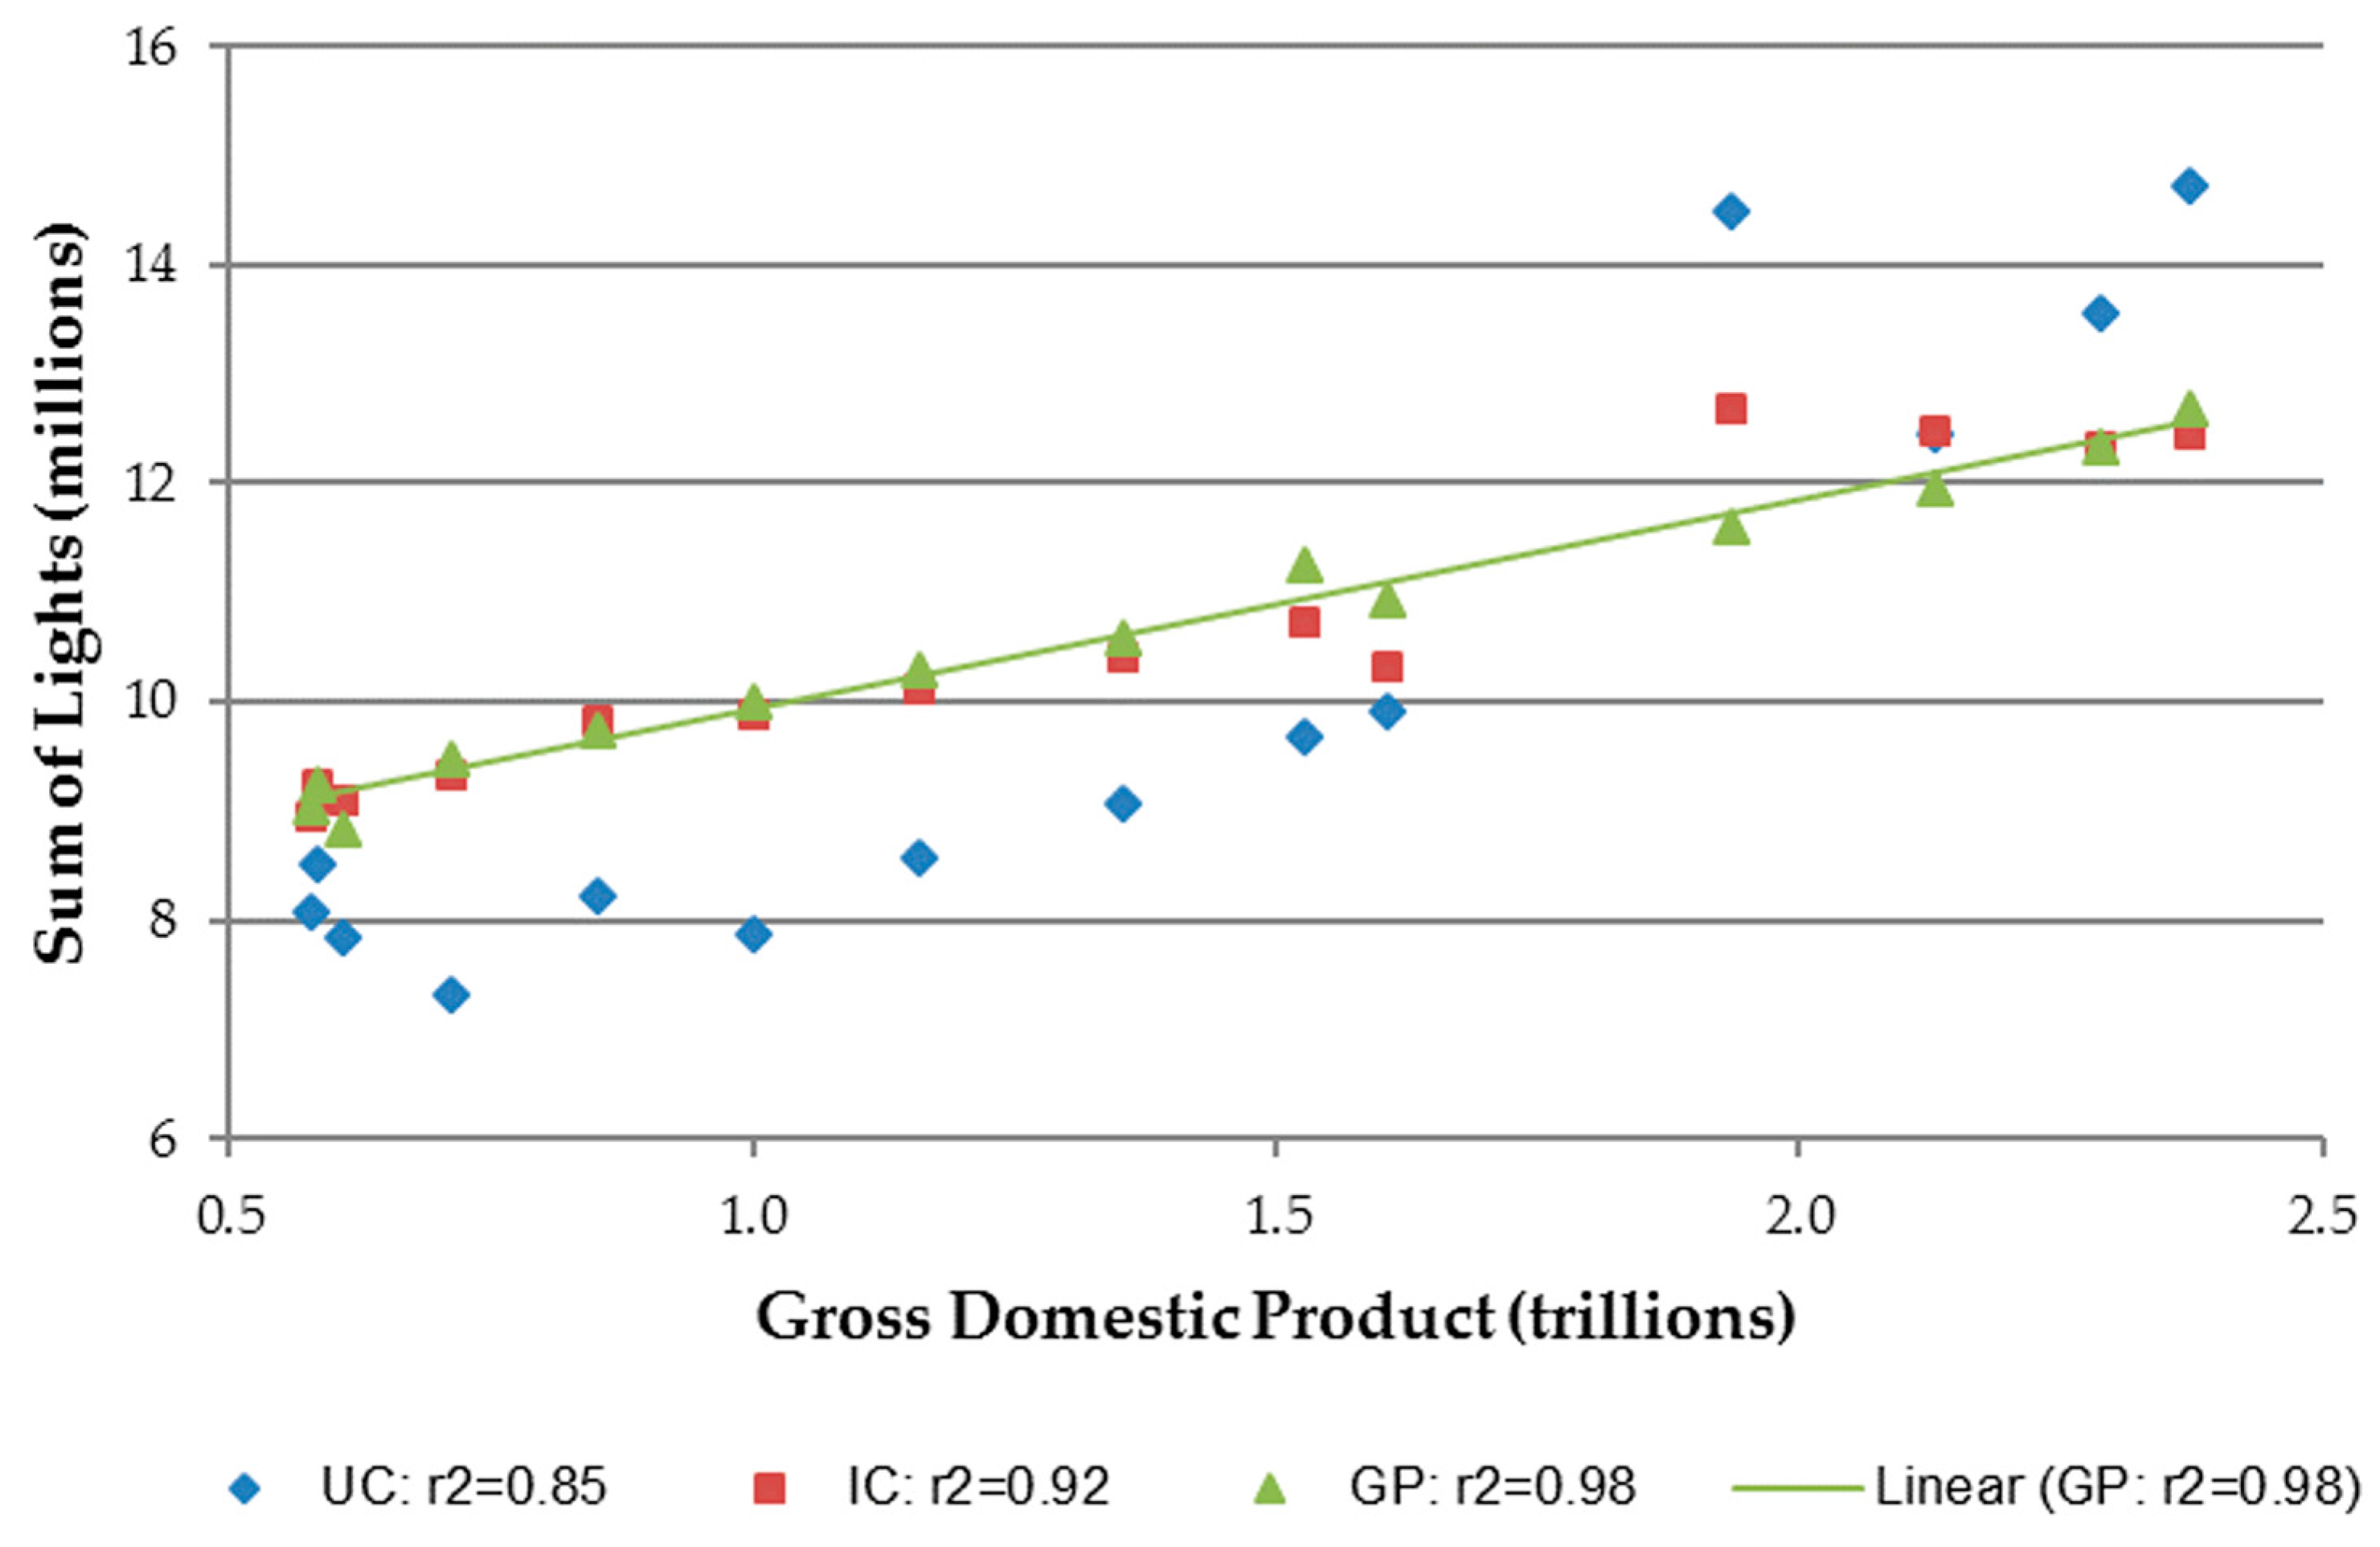
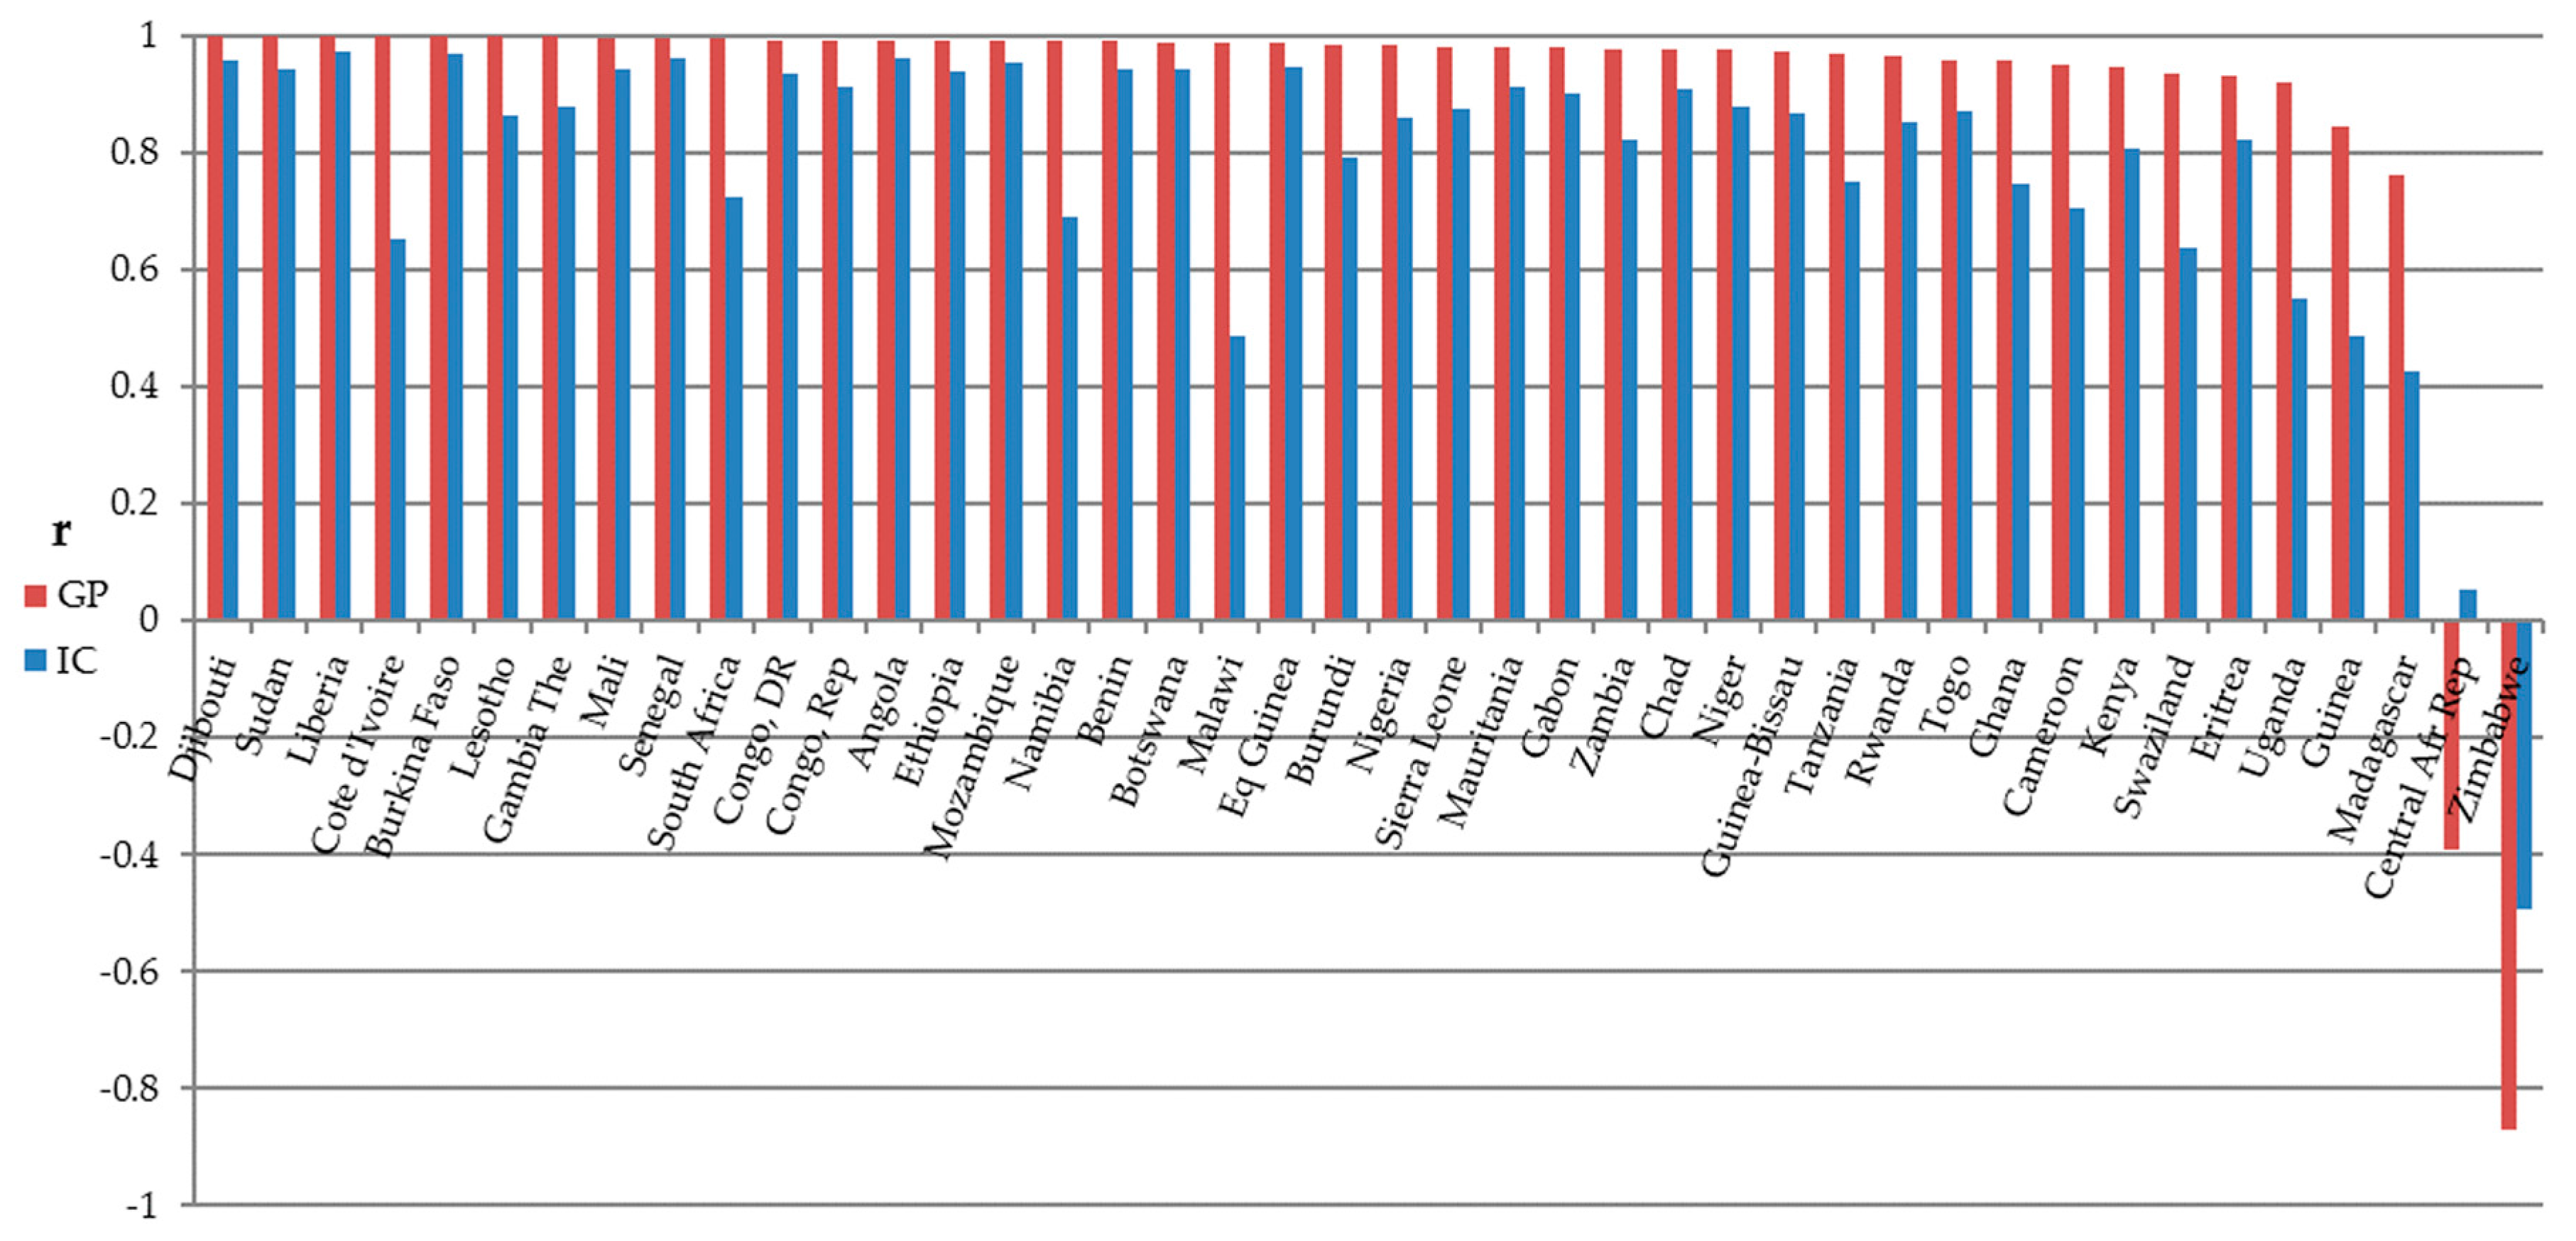
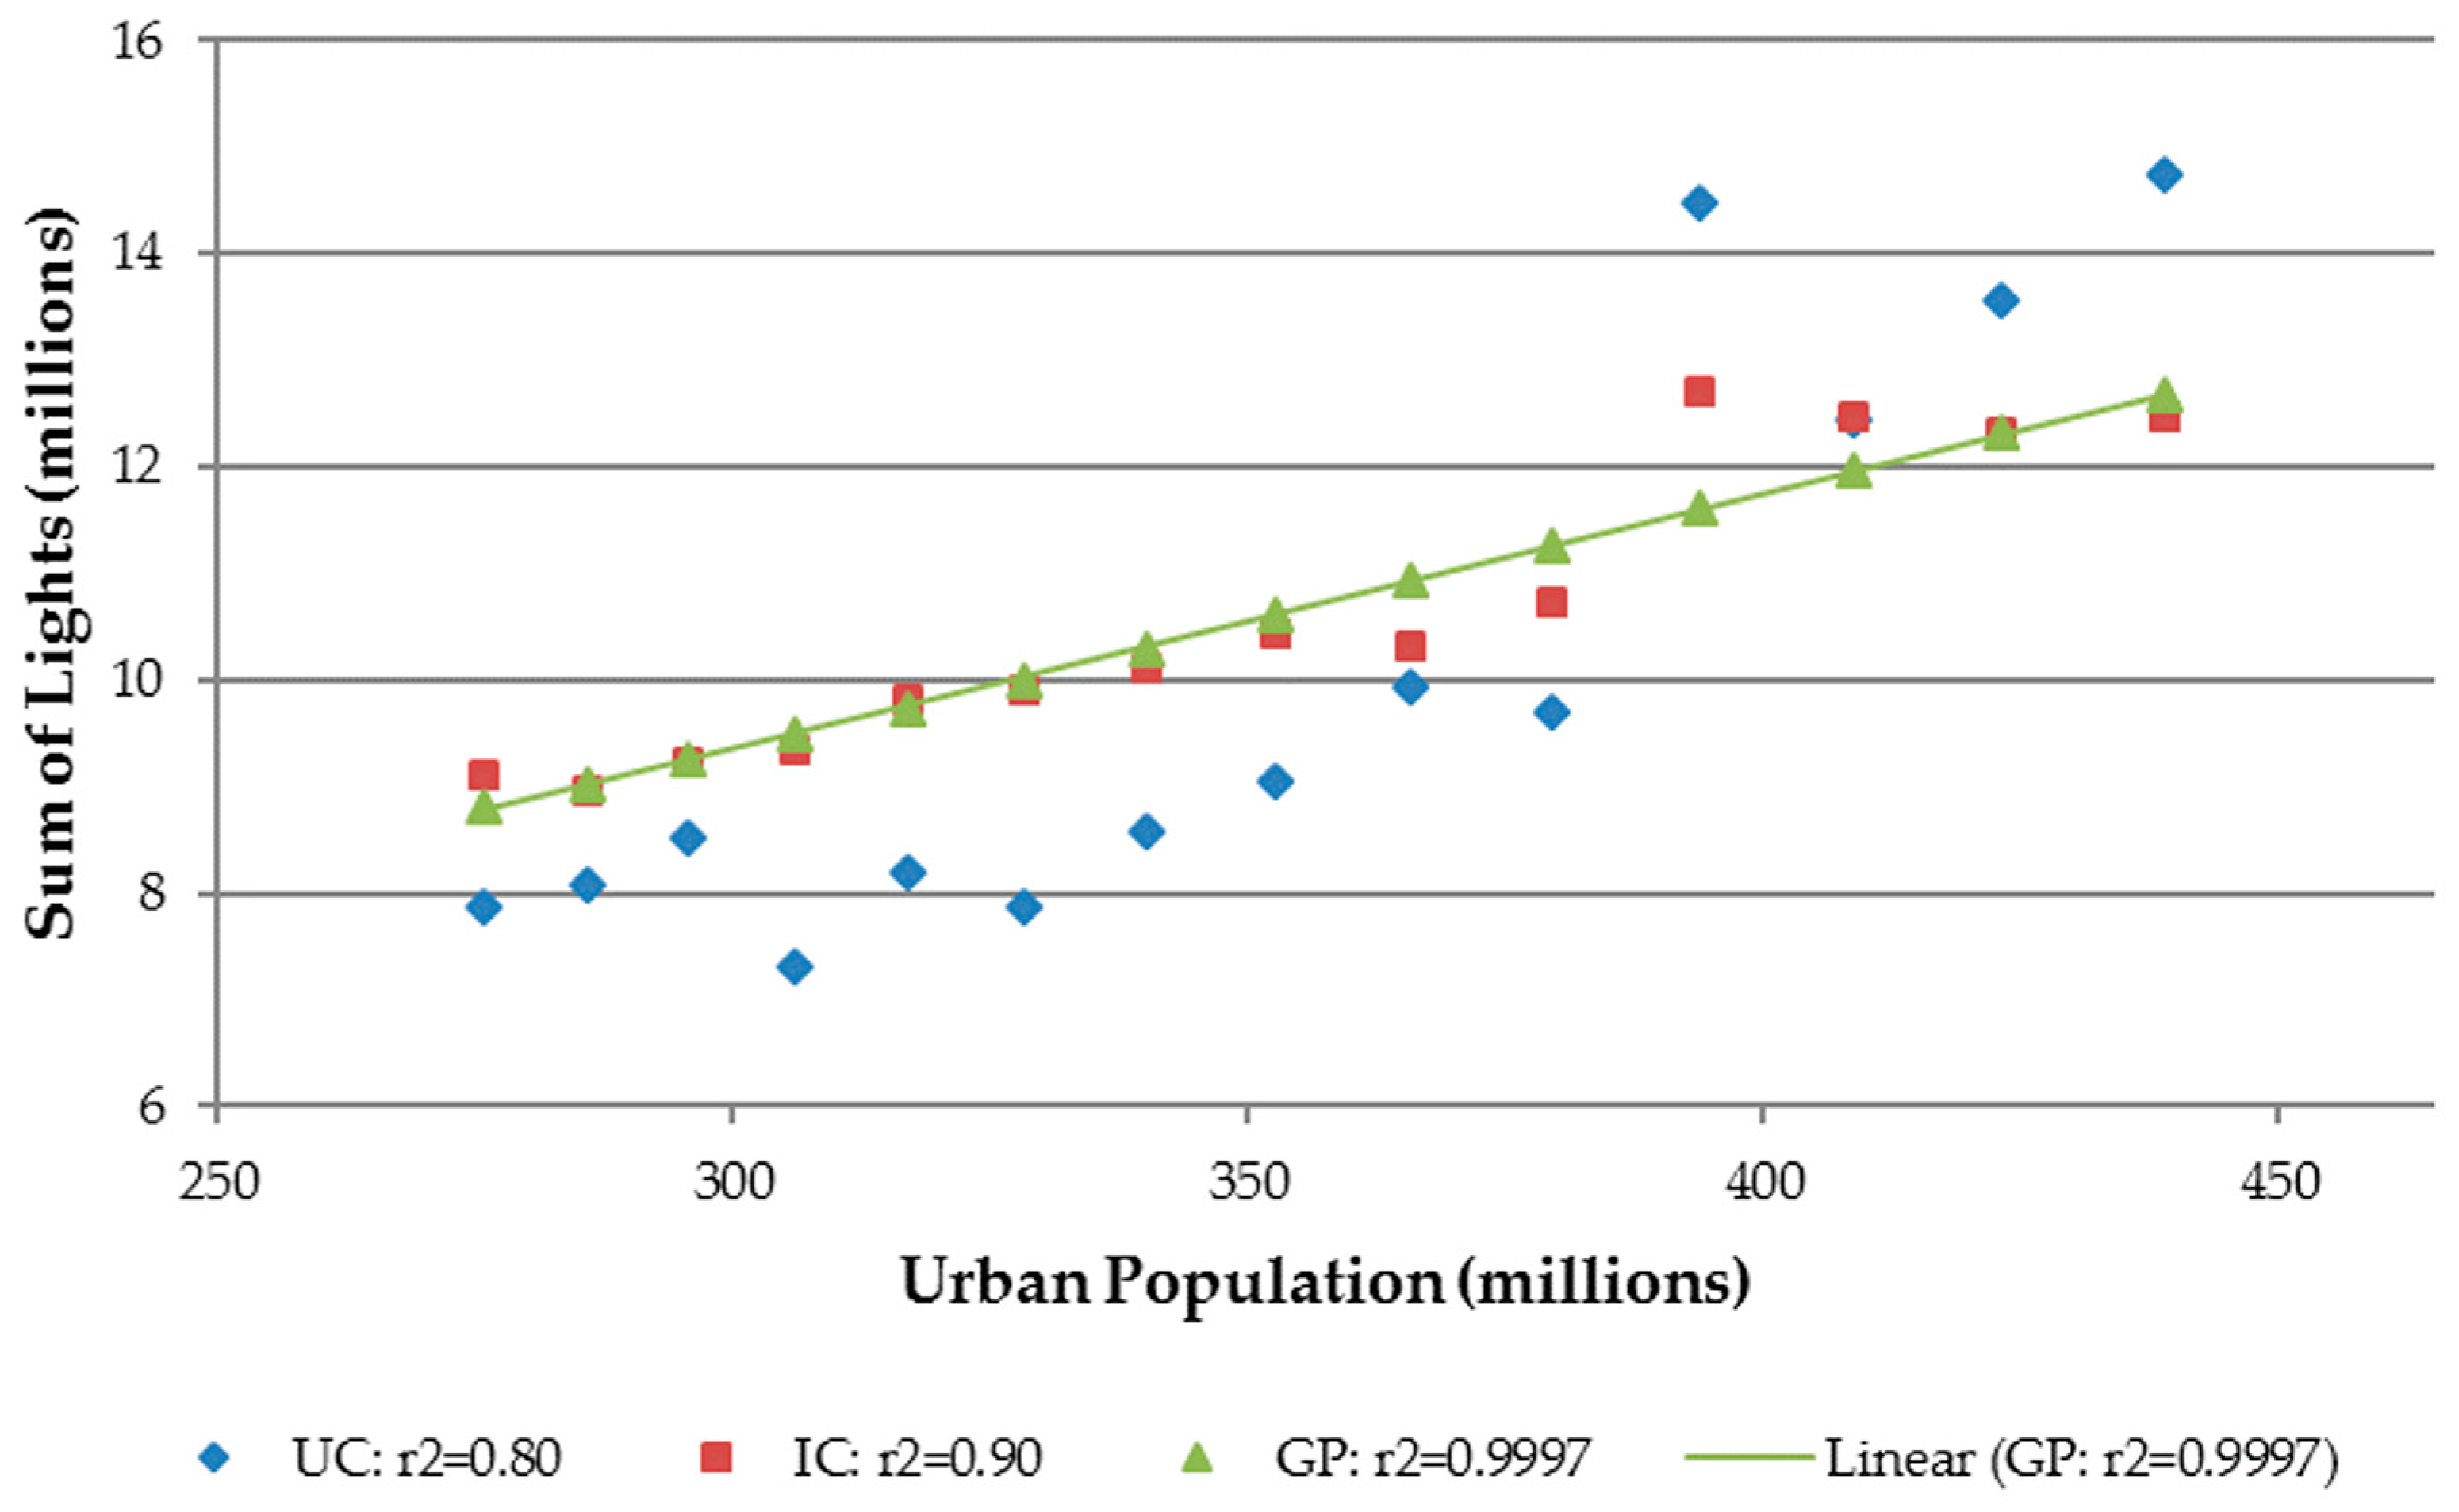
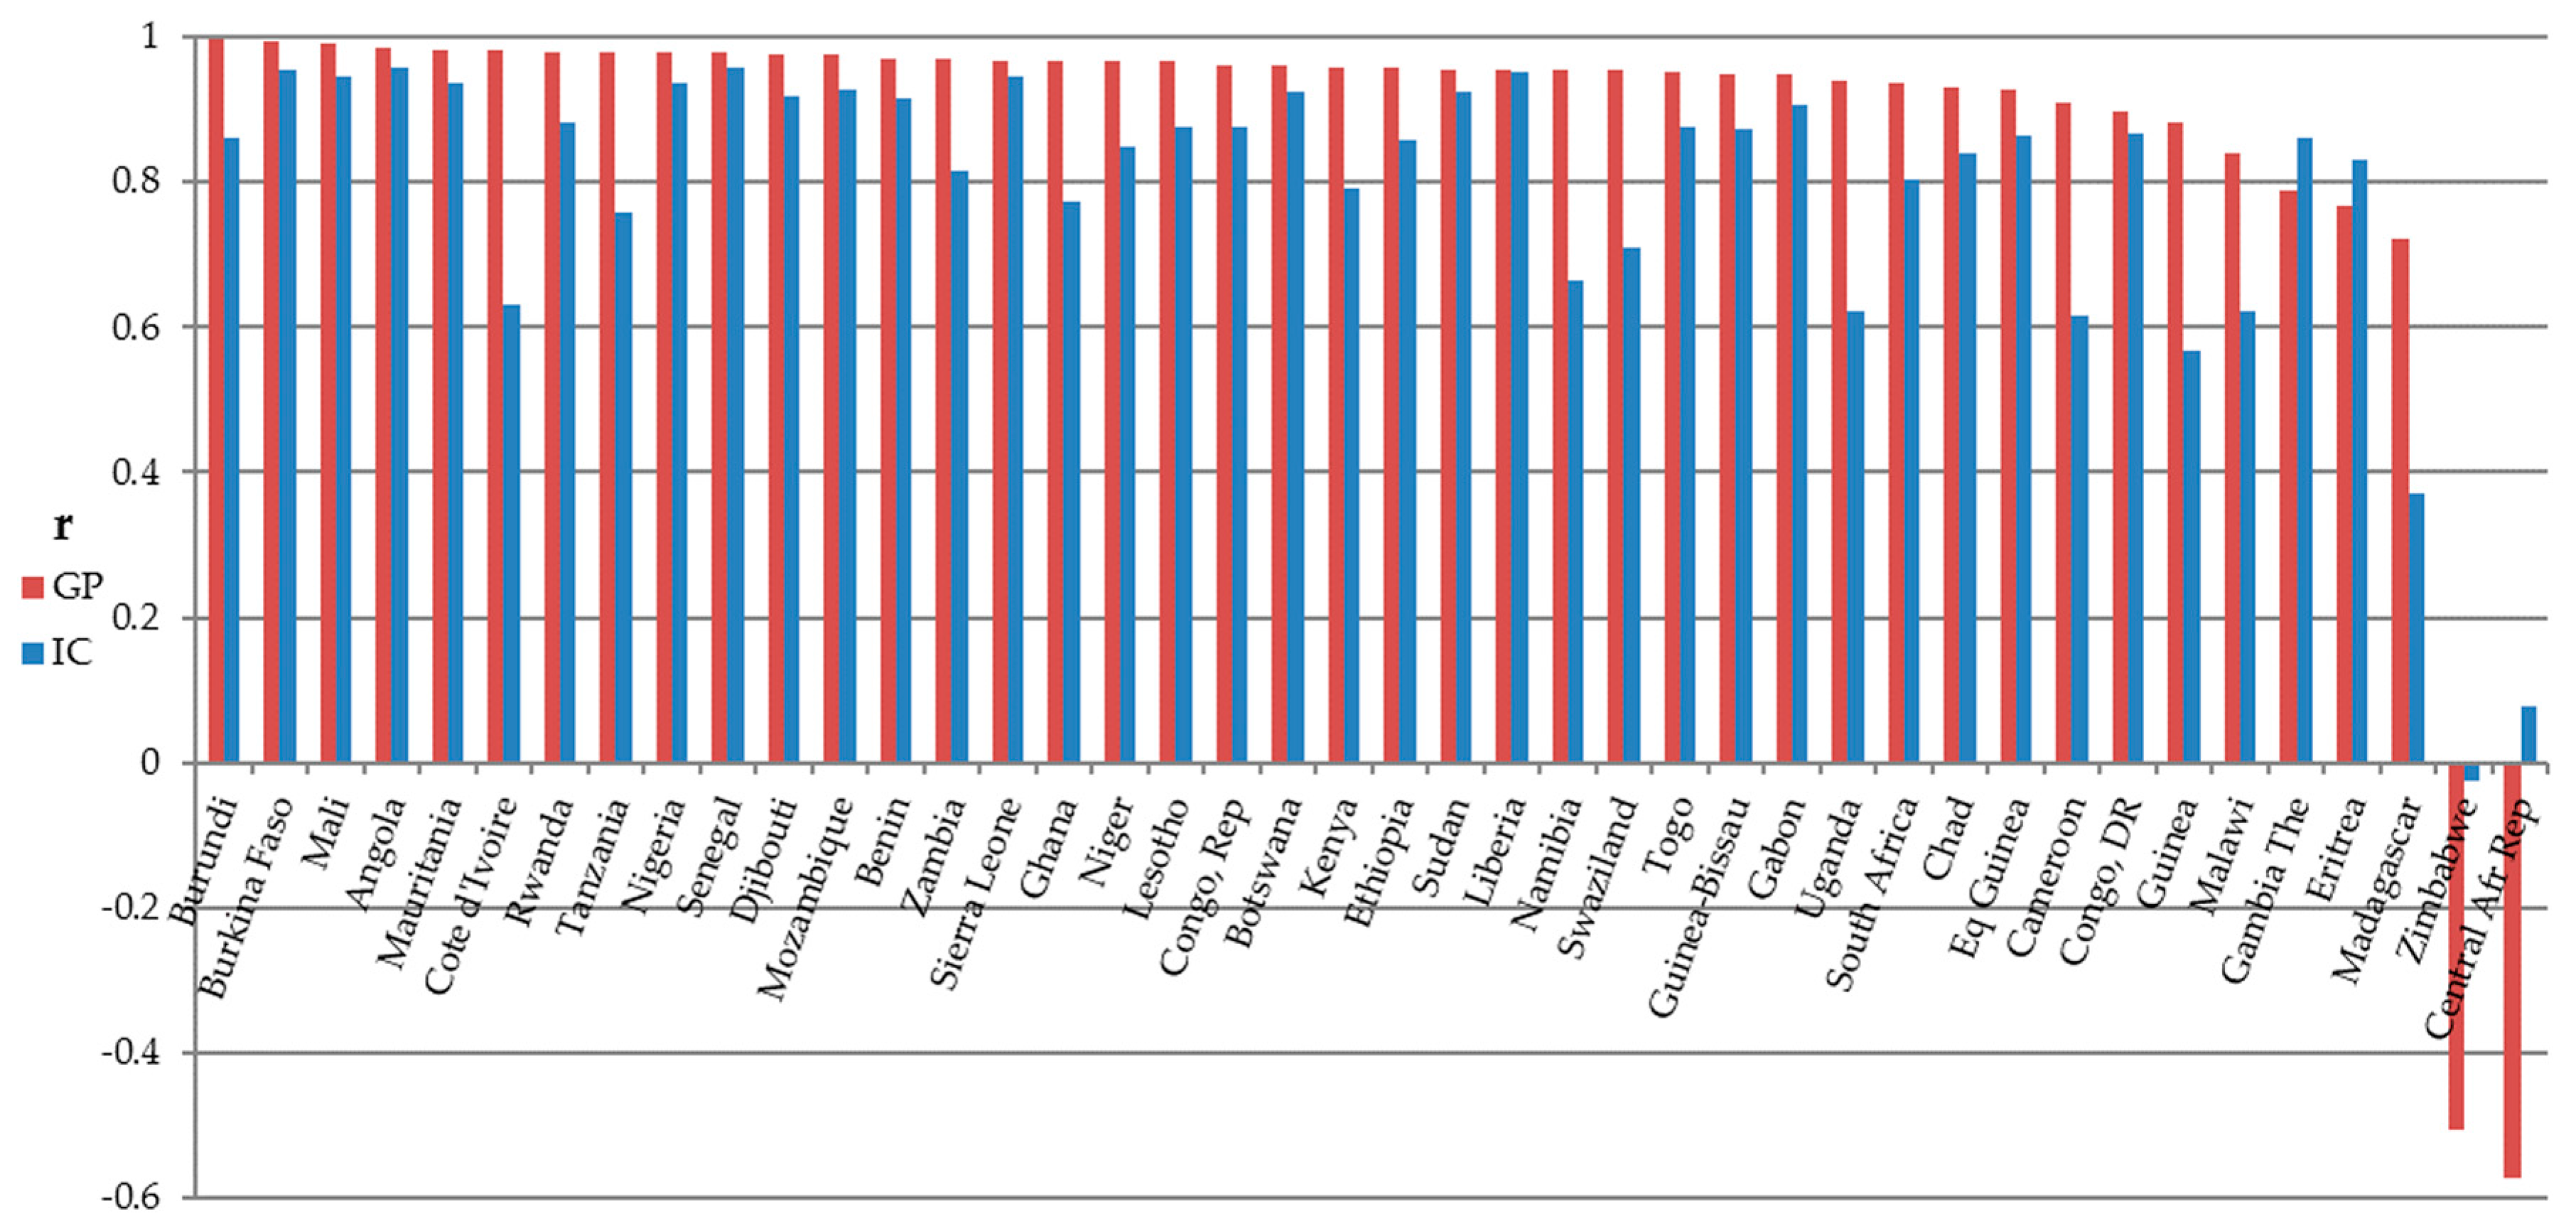
3.2. Correlation of SOL with GDP and Urban Population
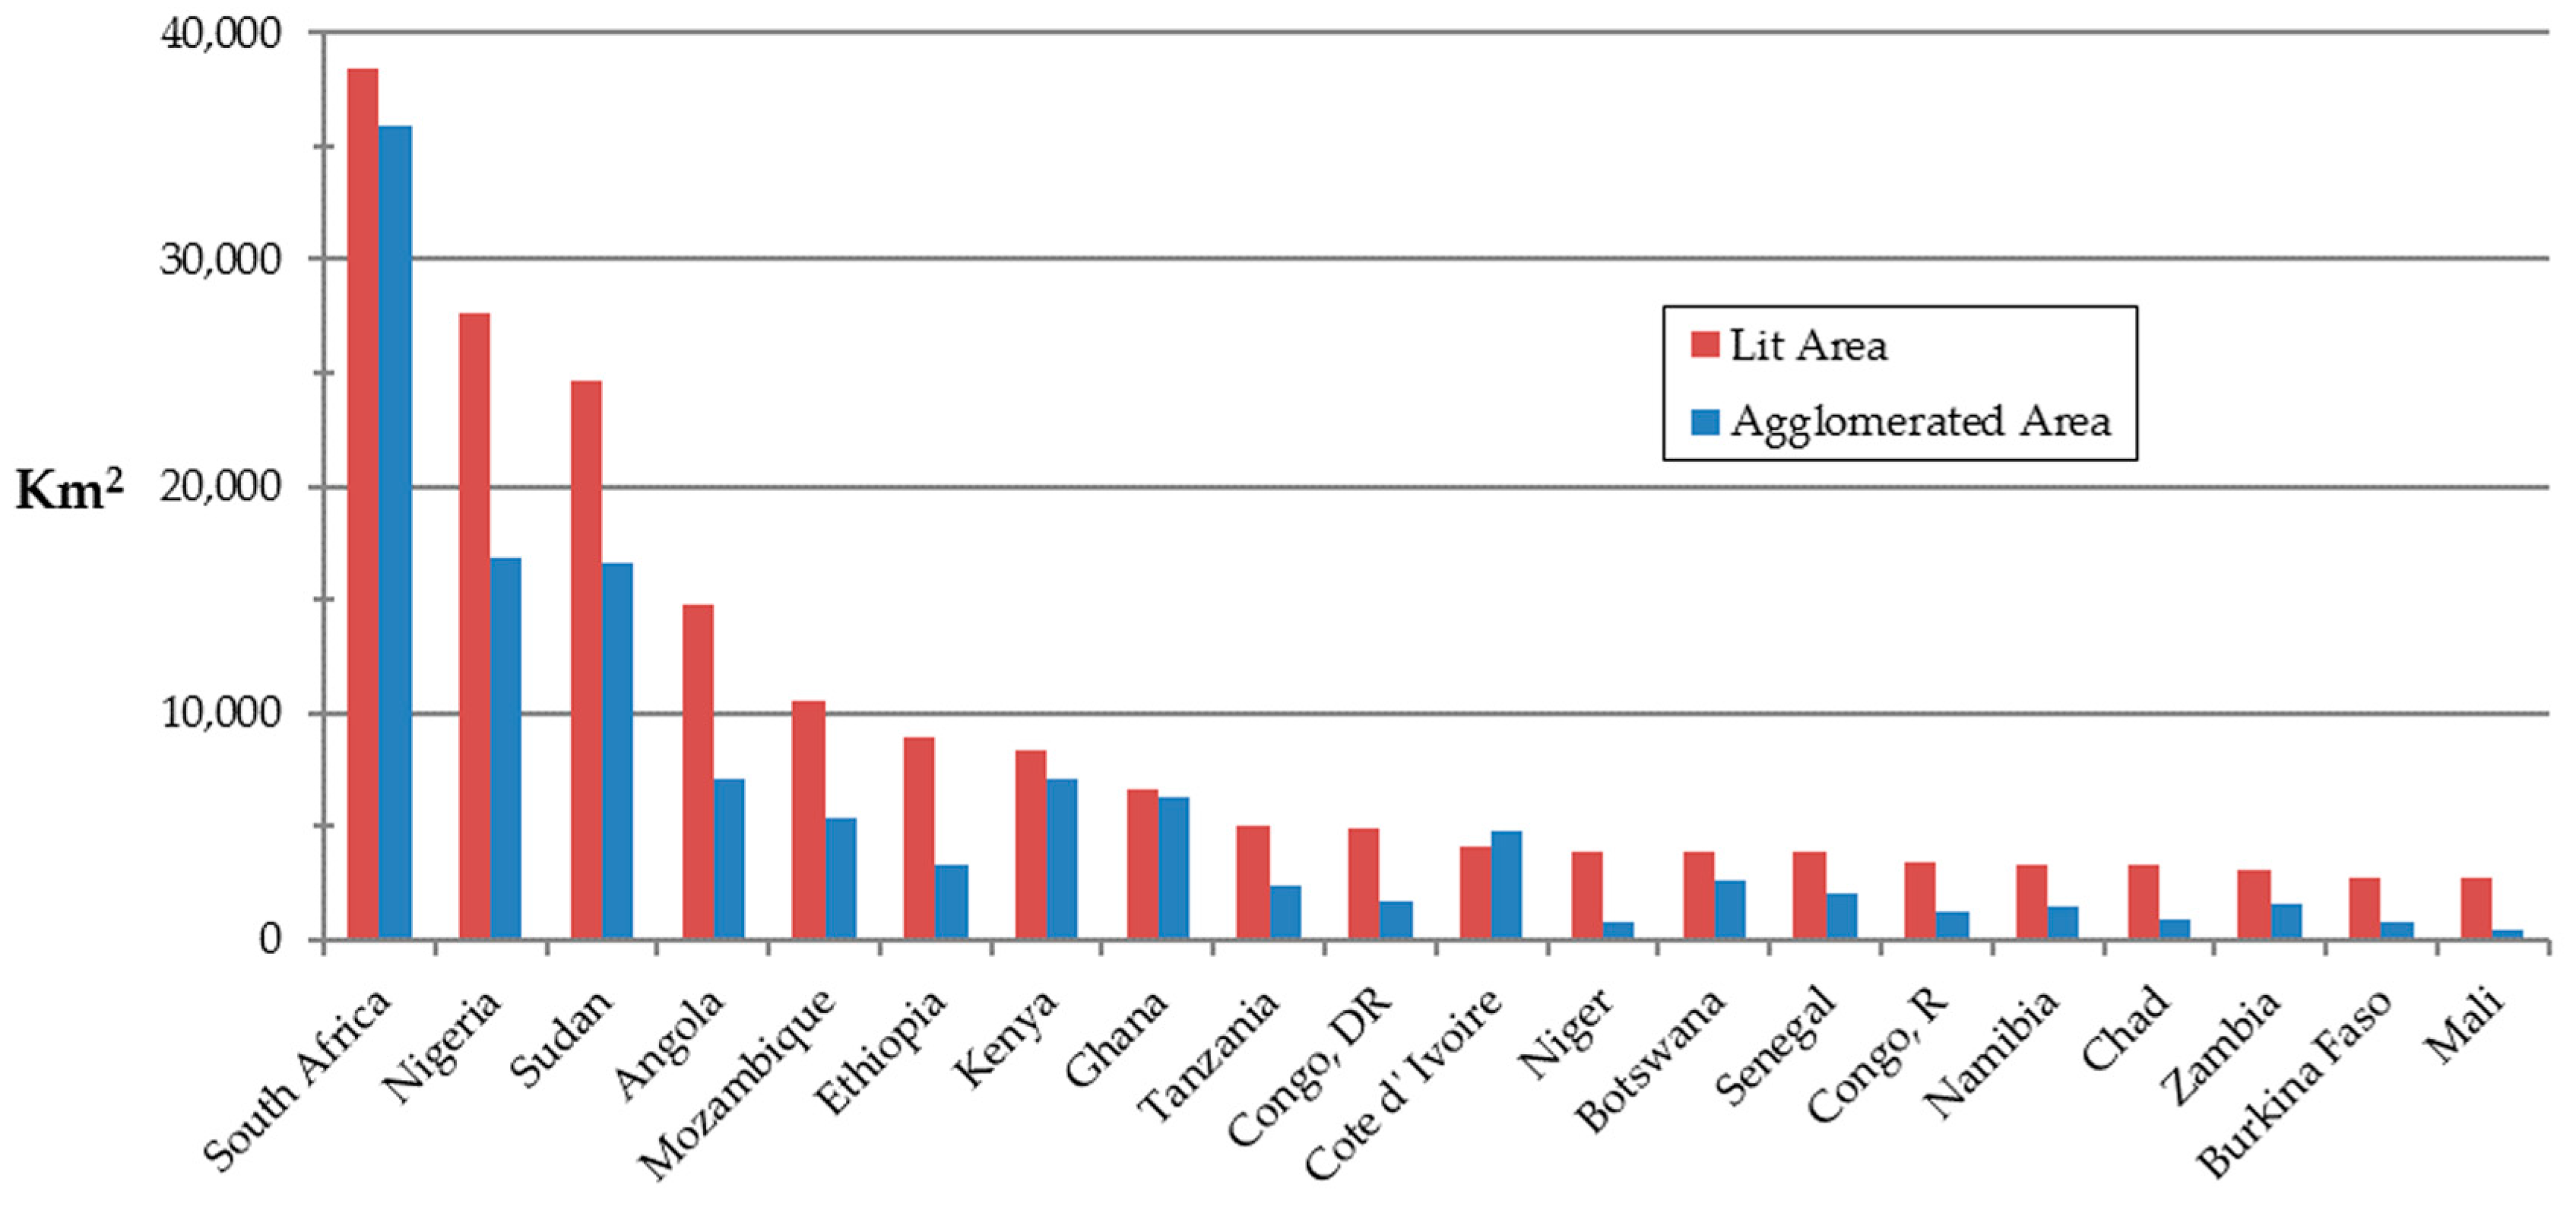
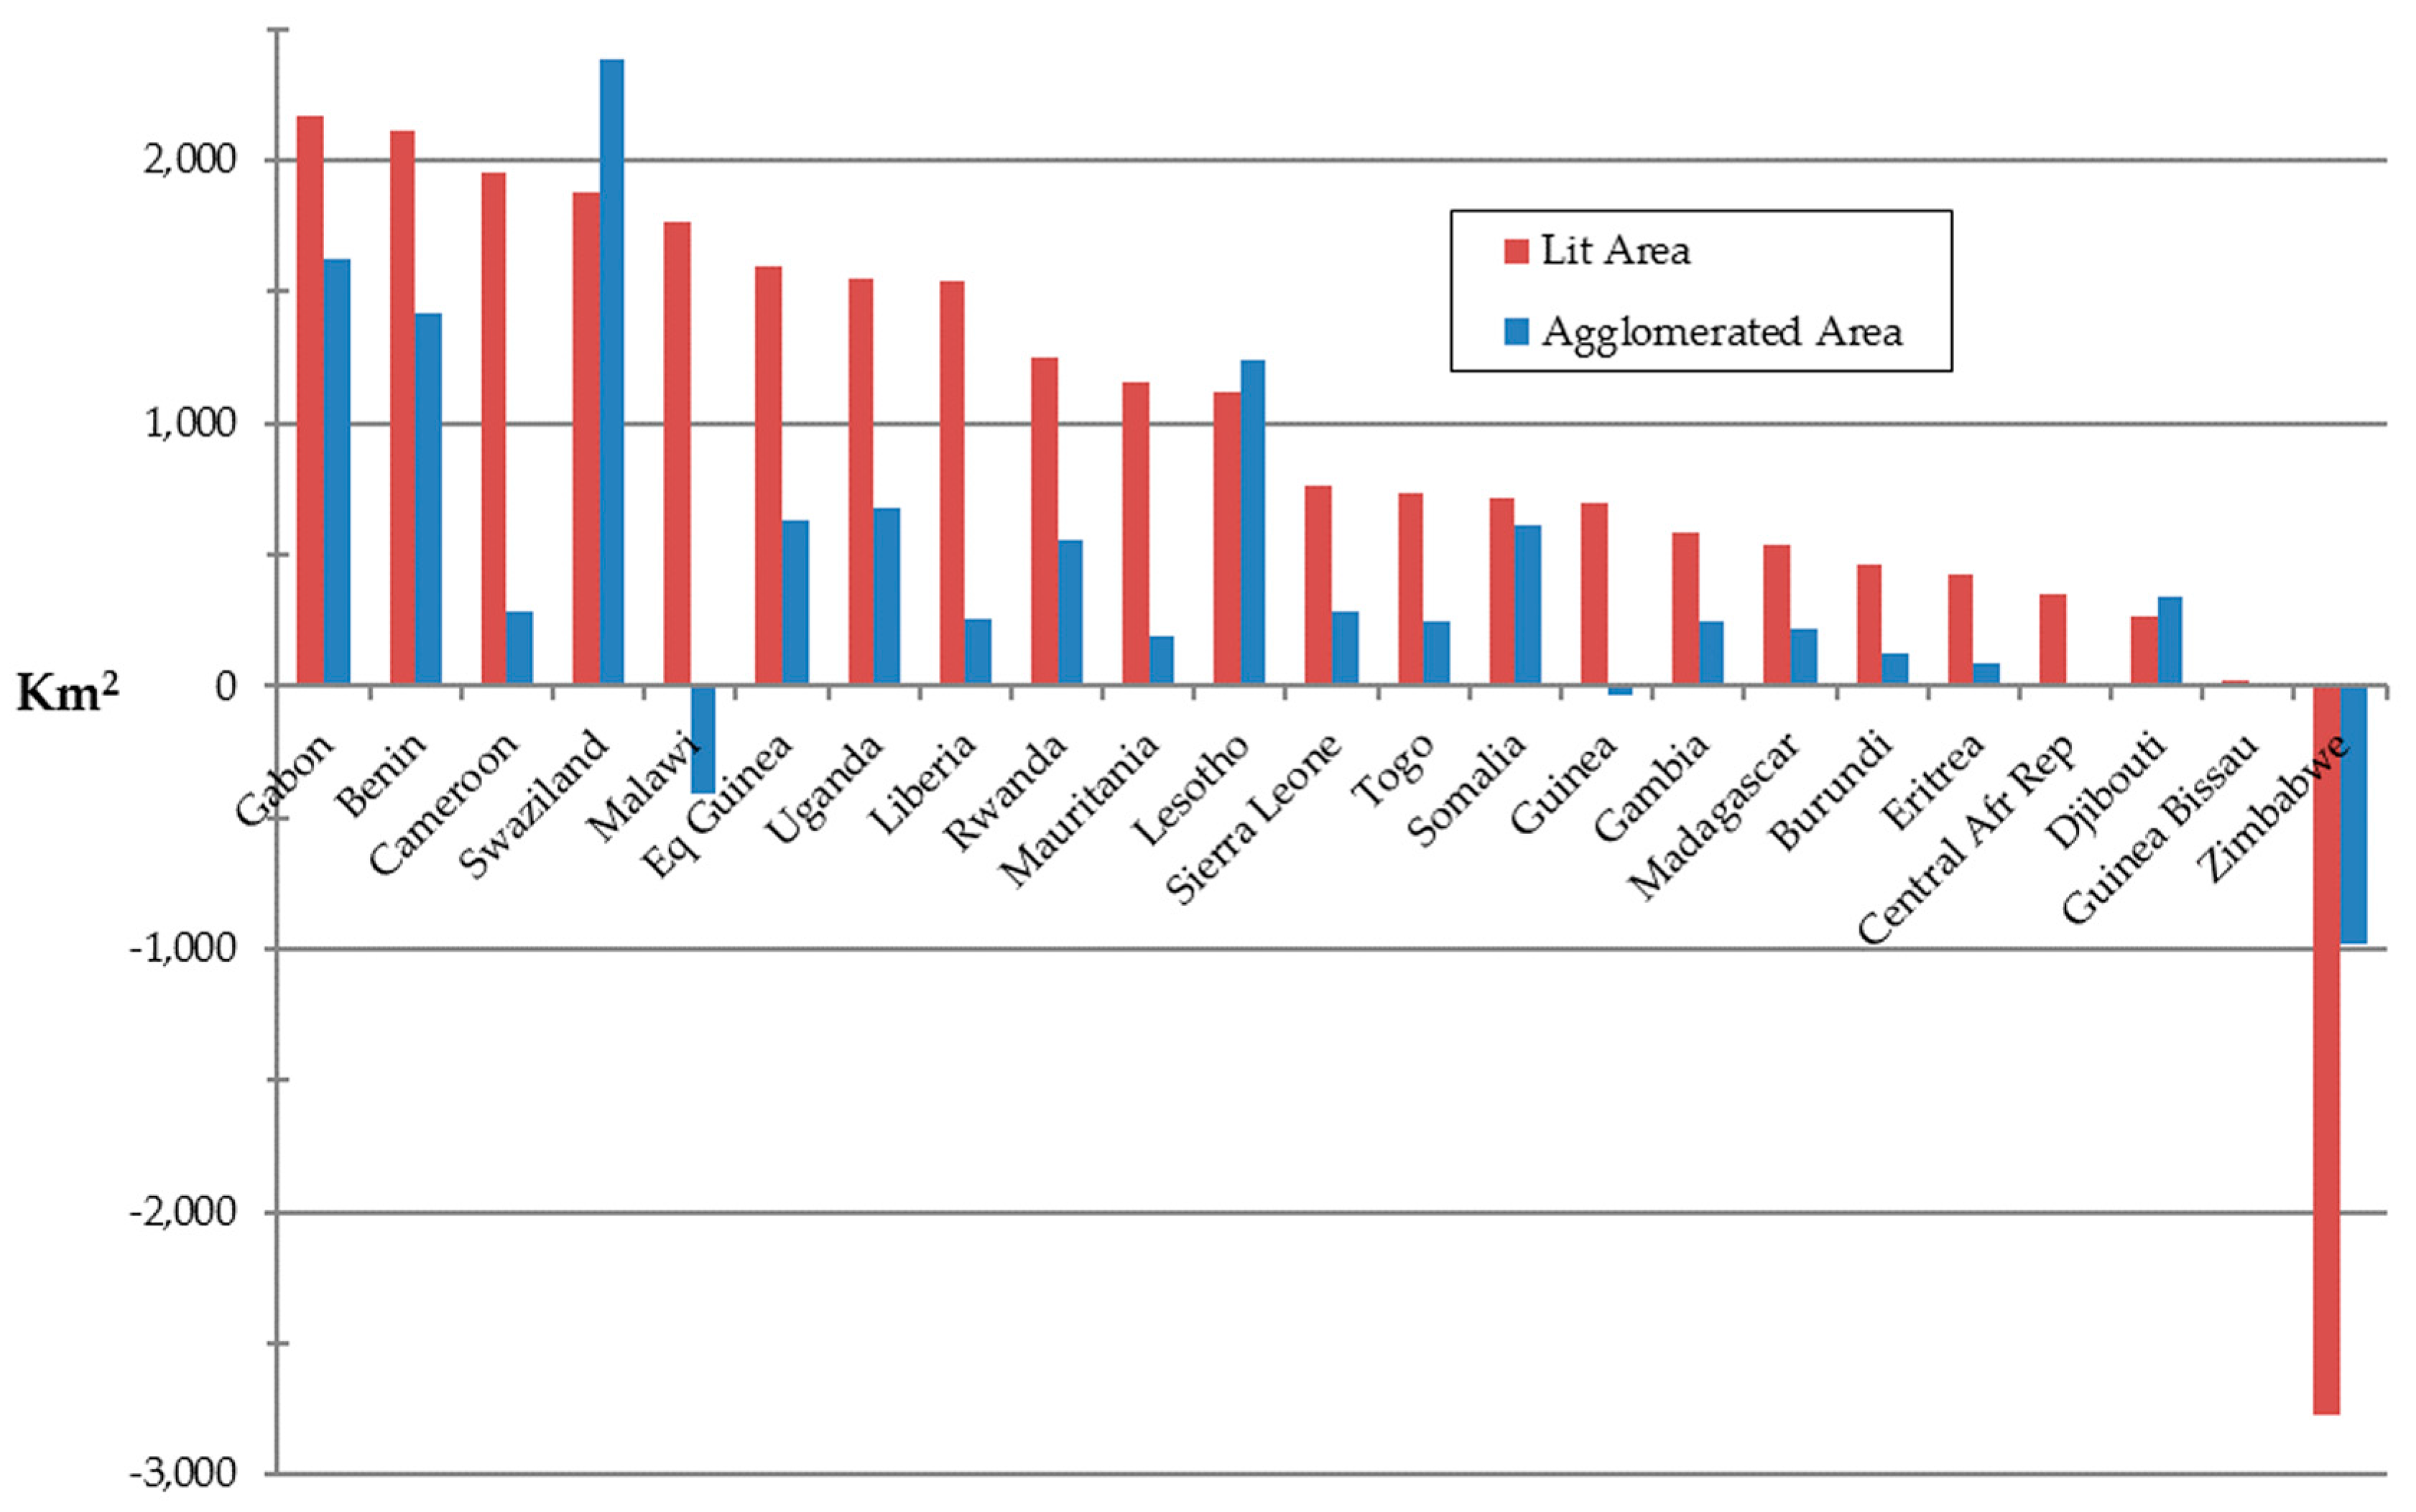
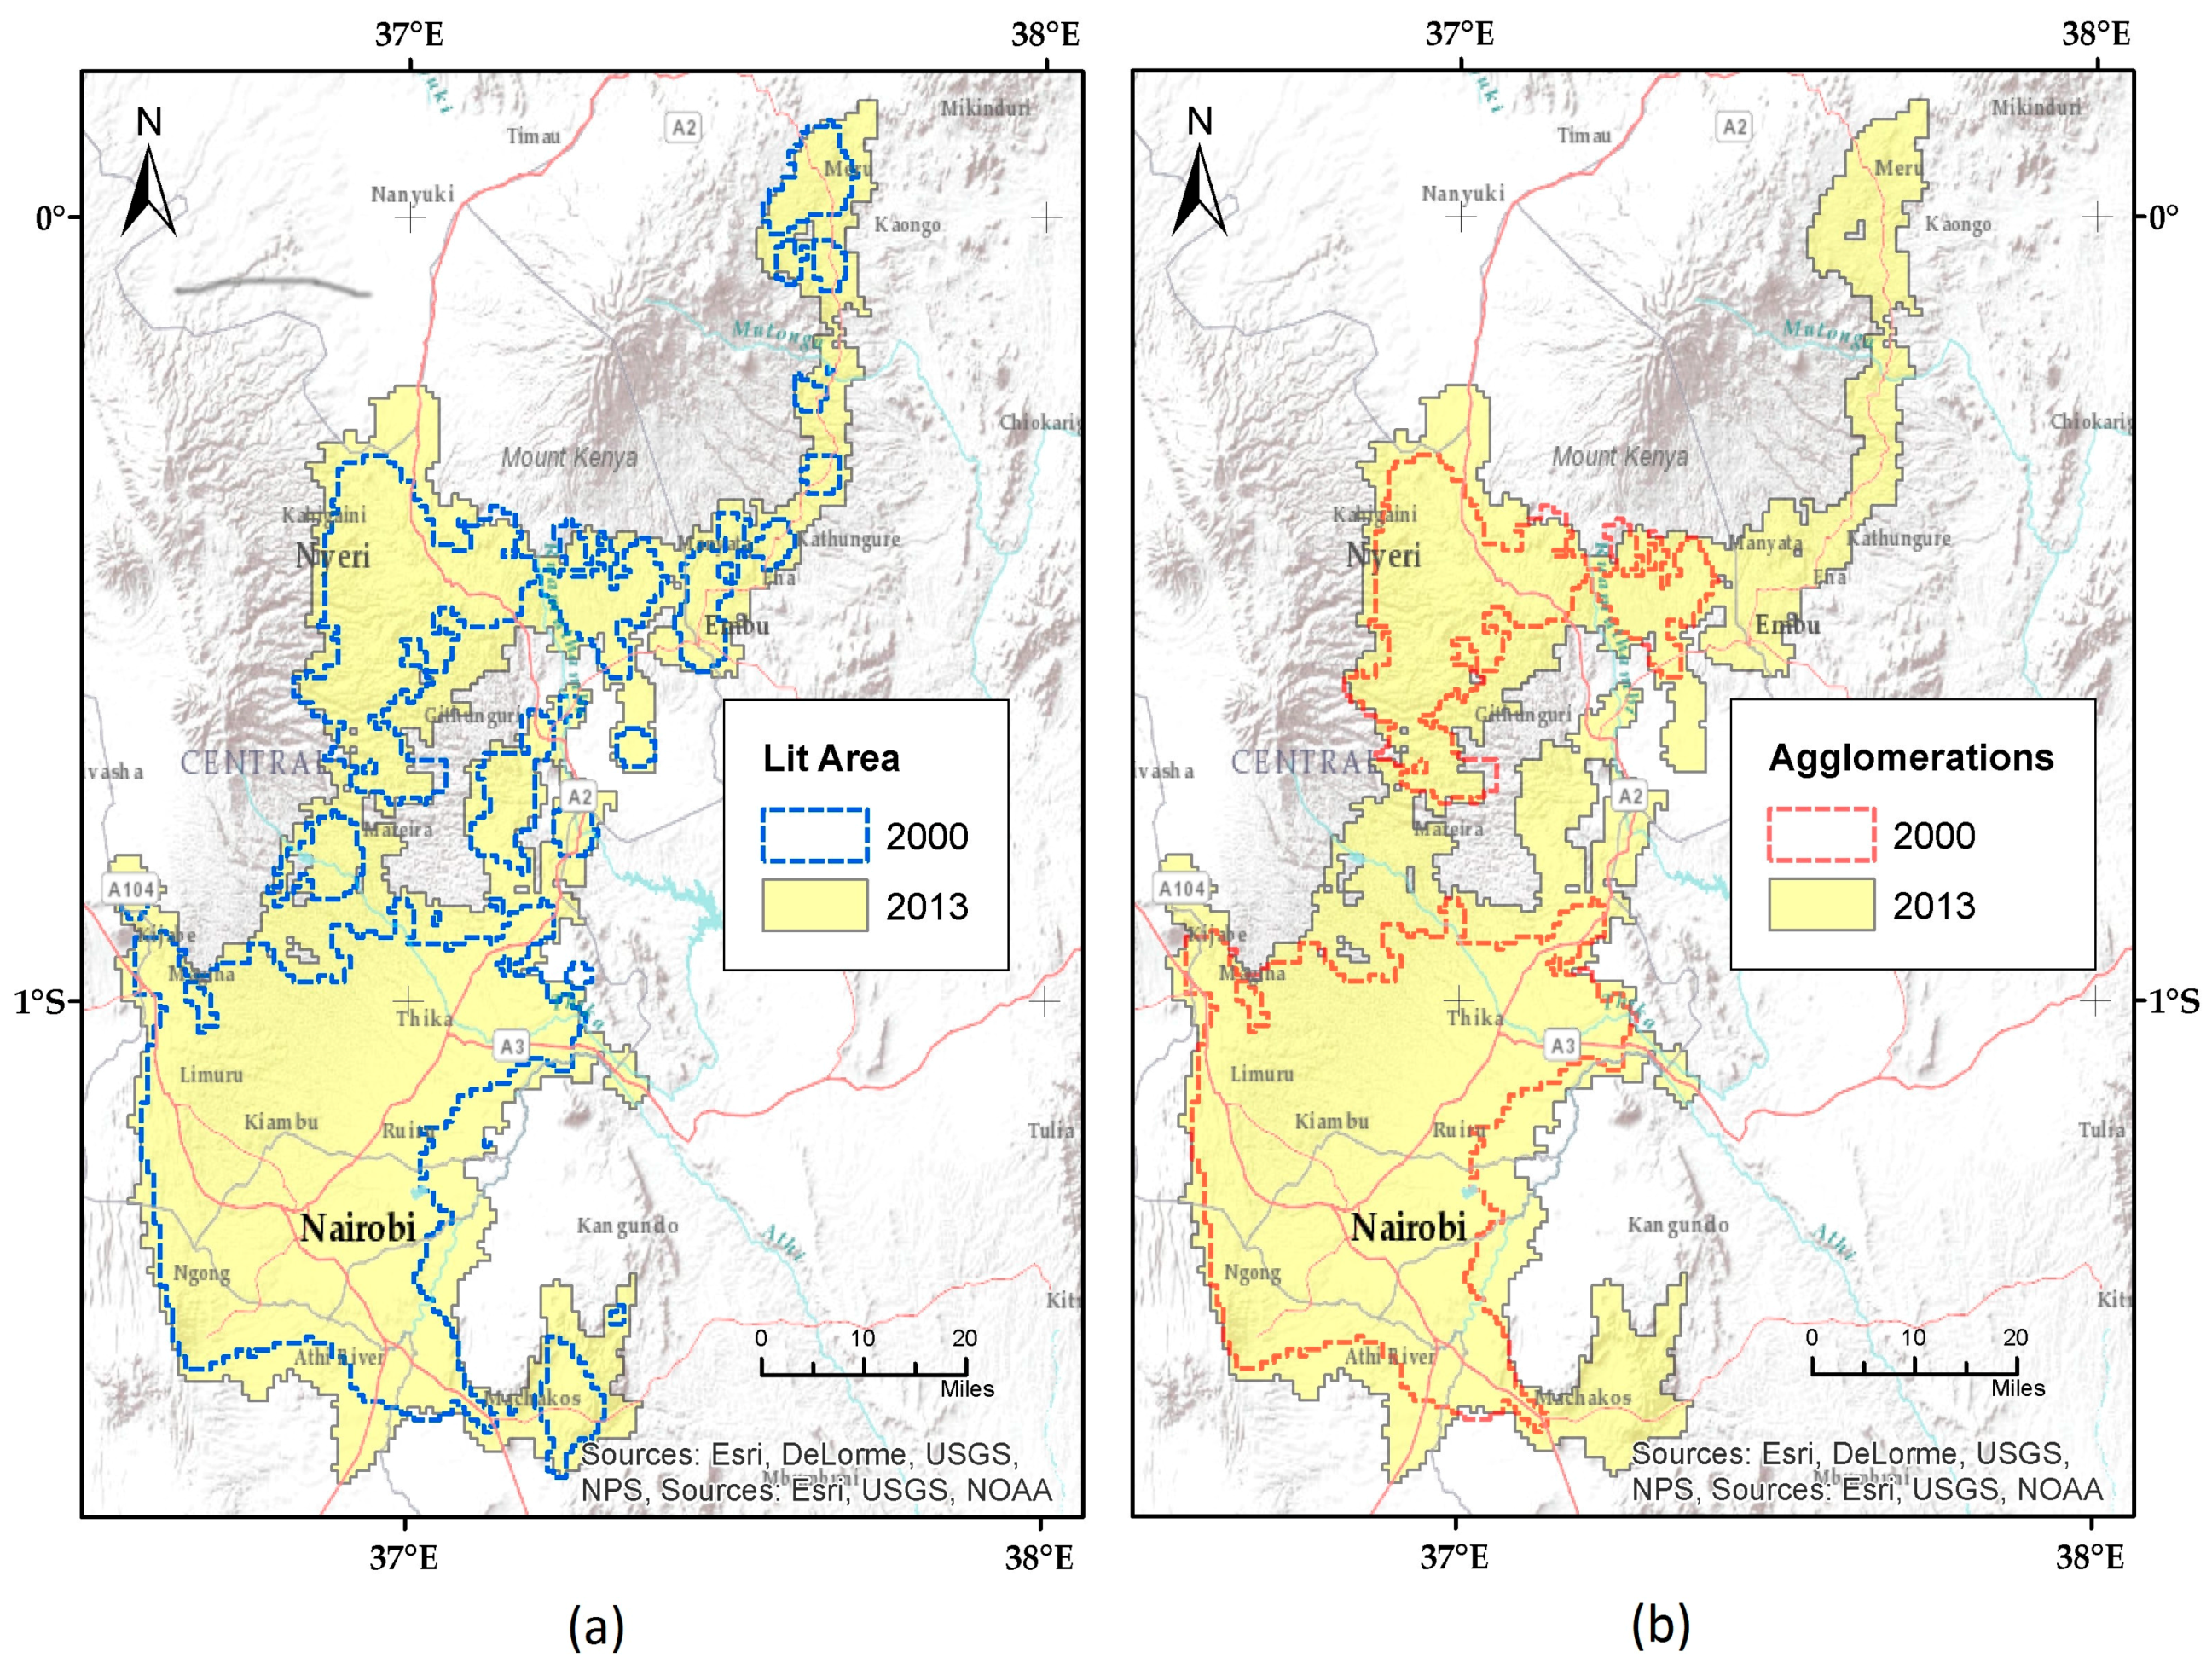
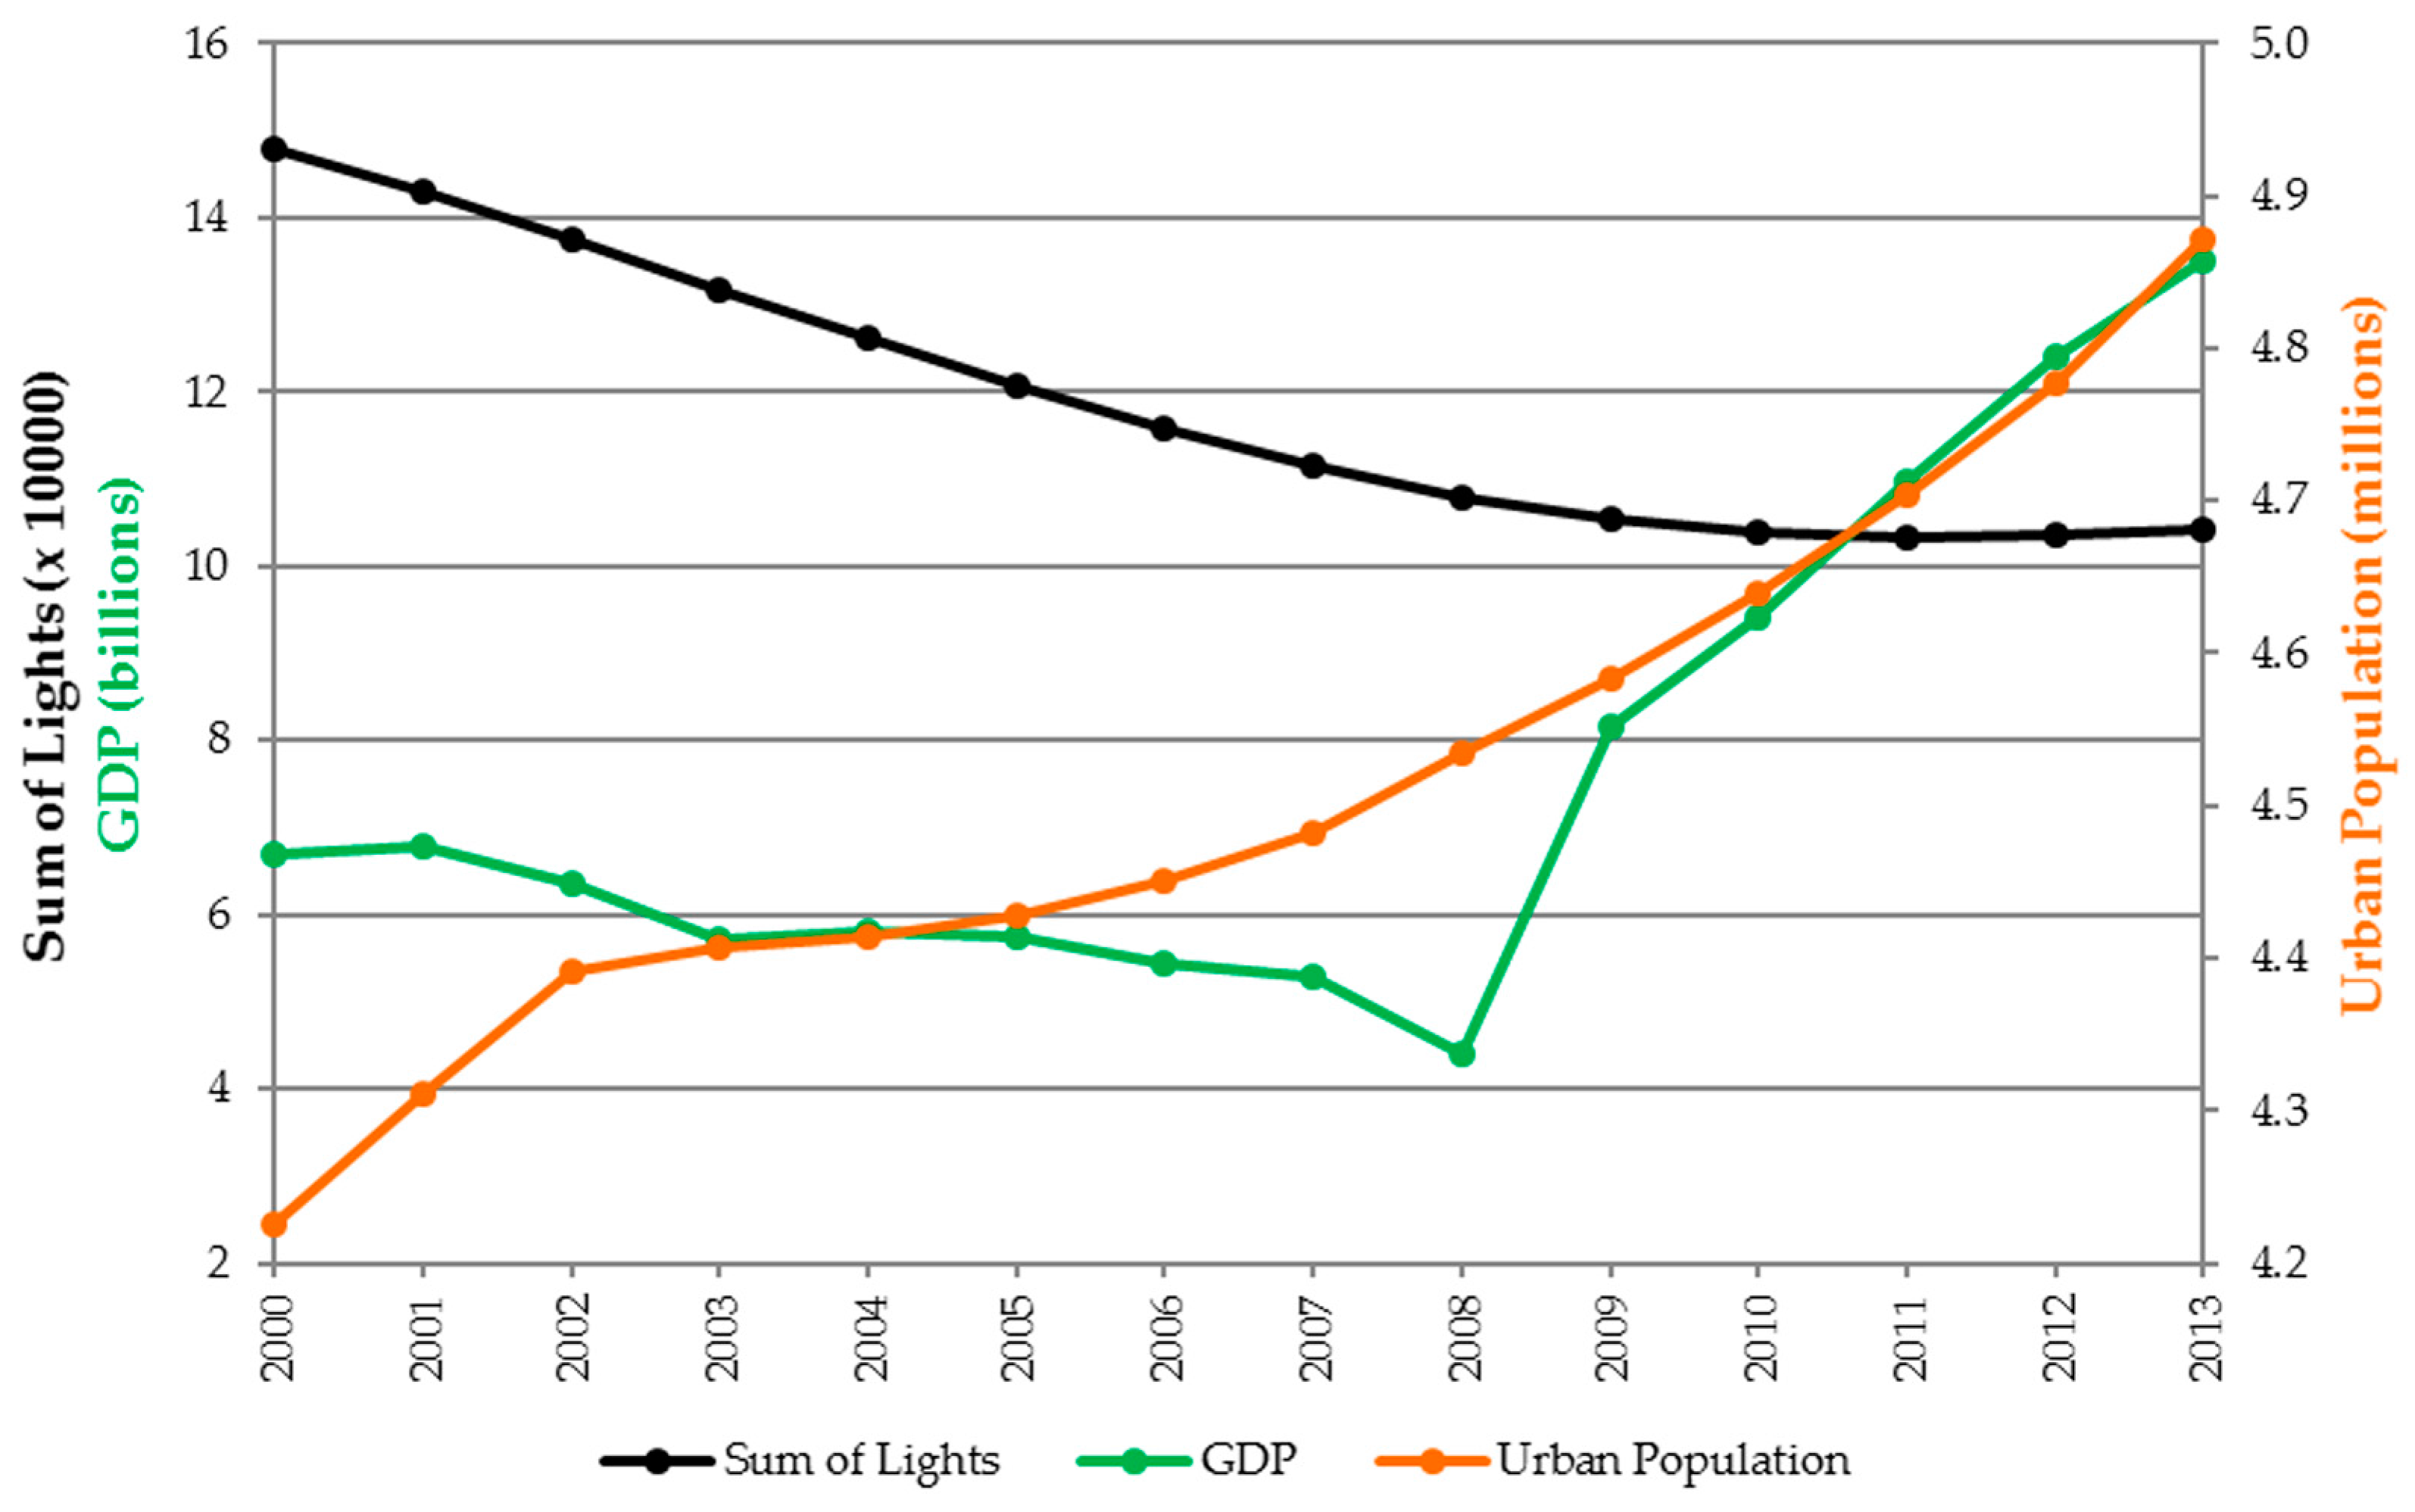
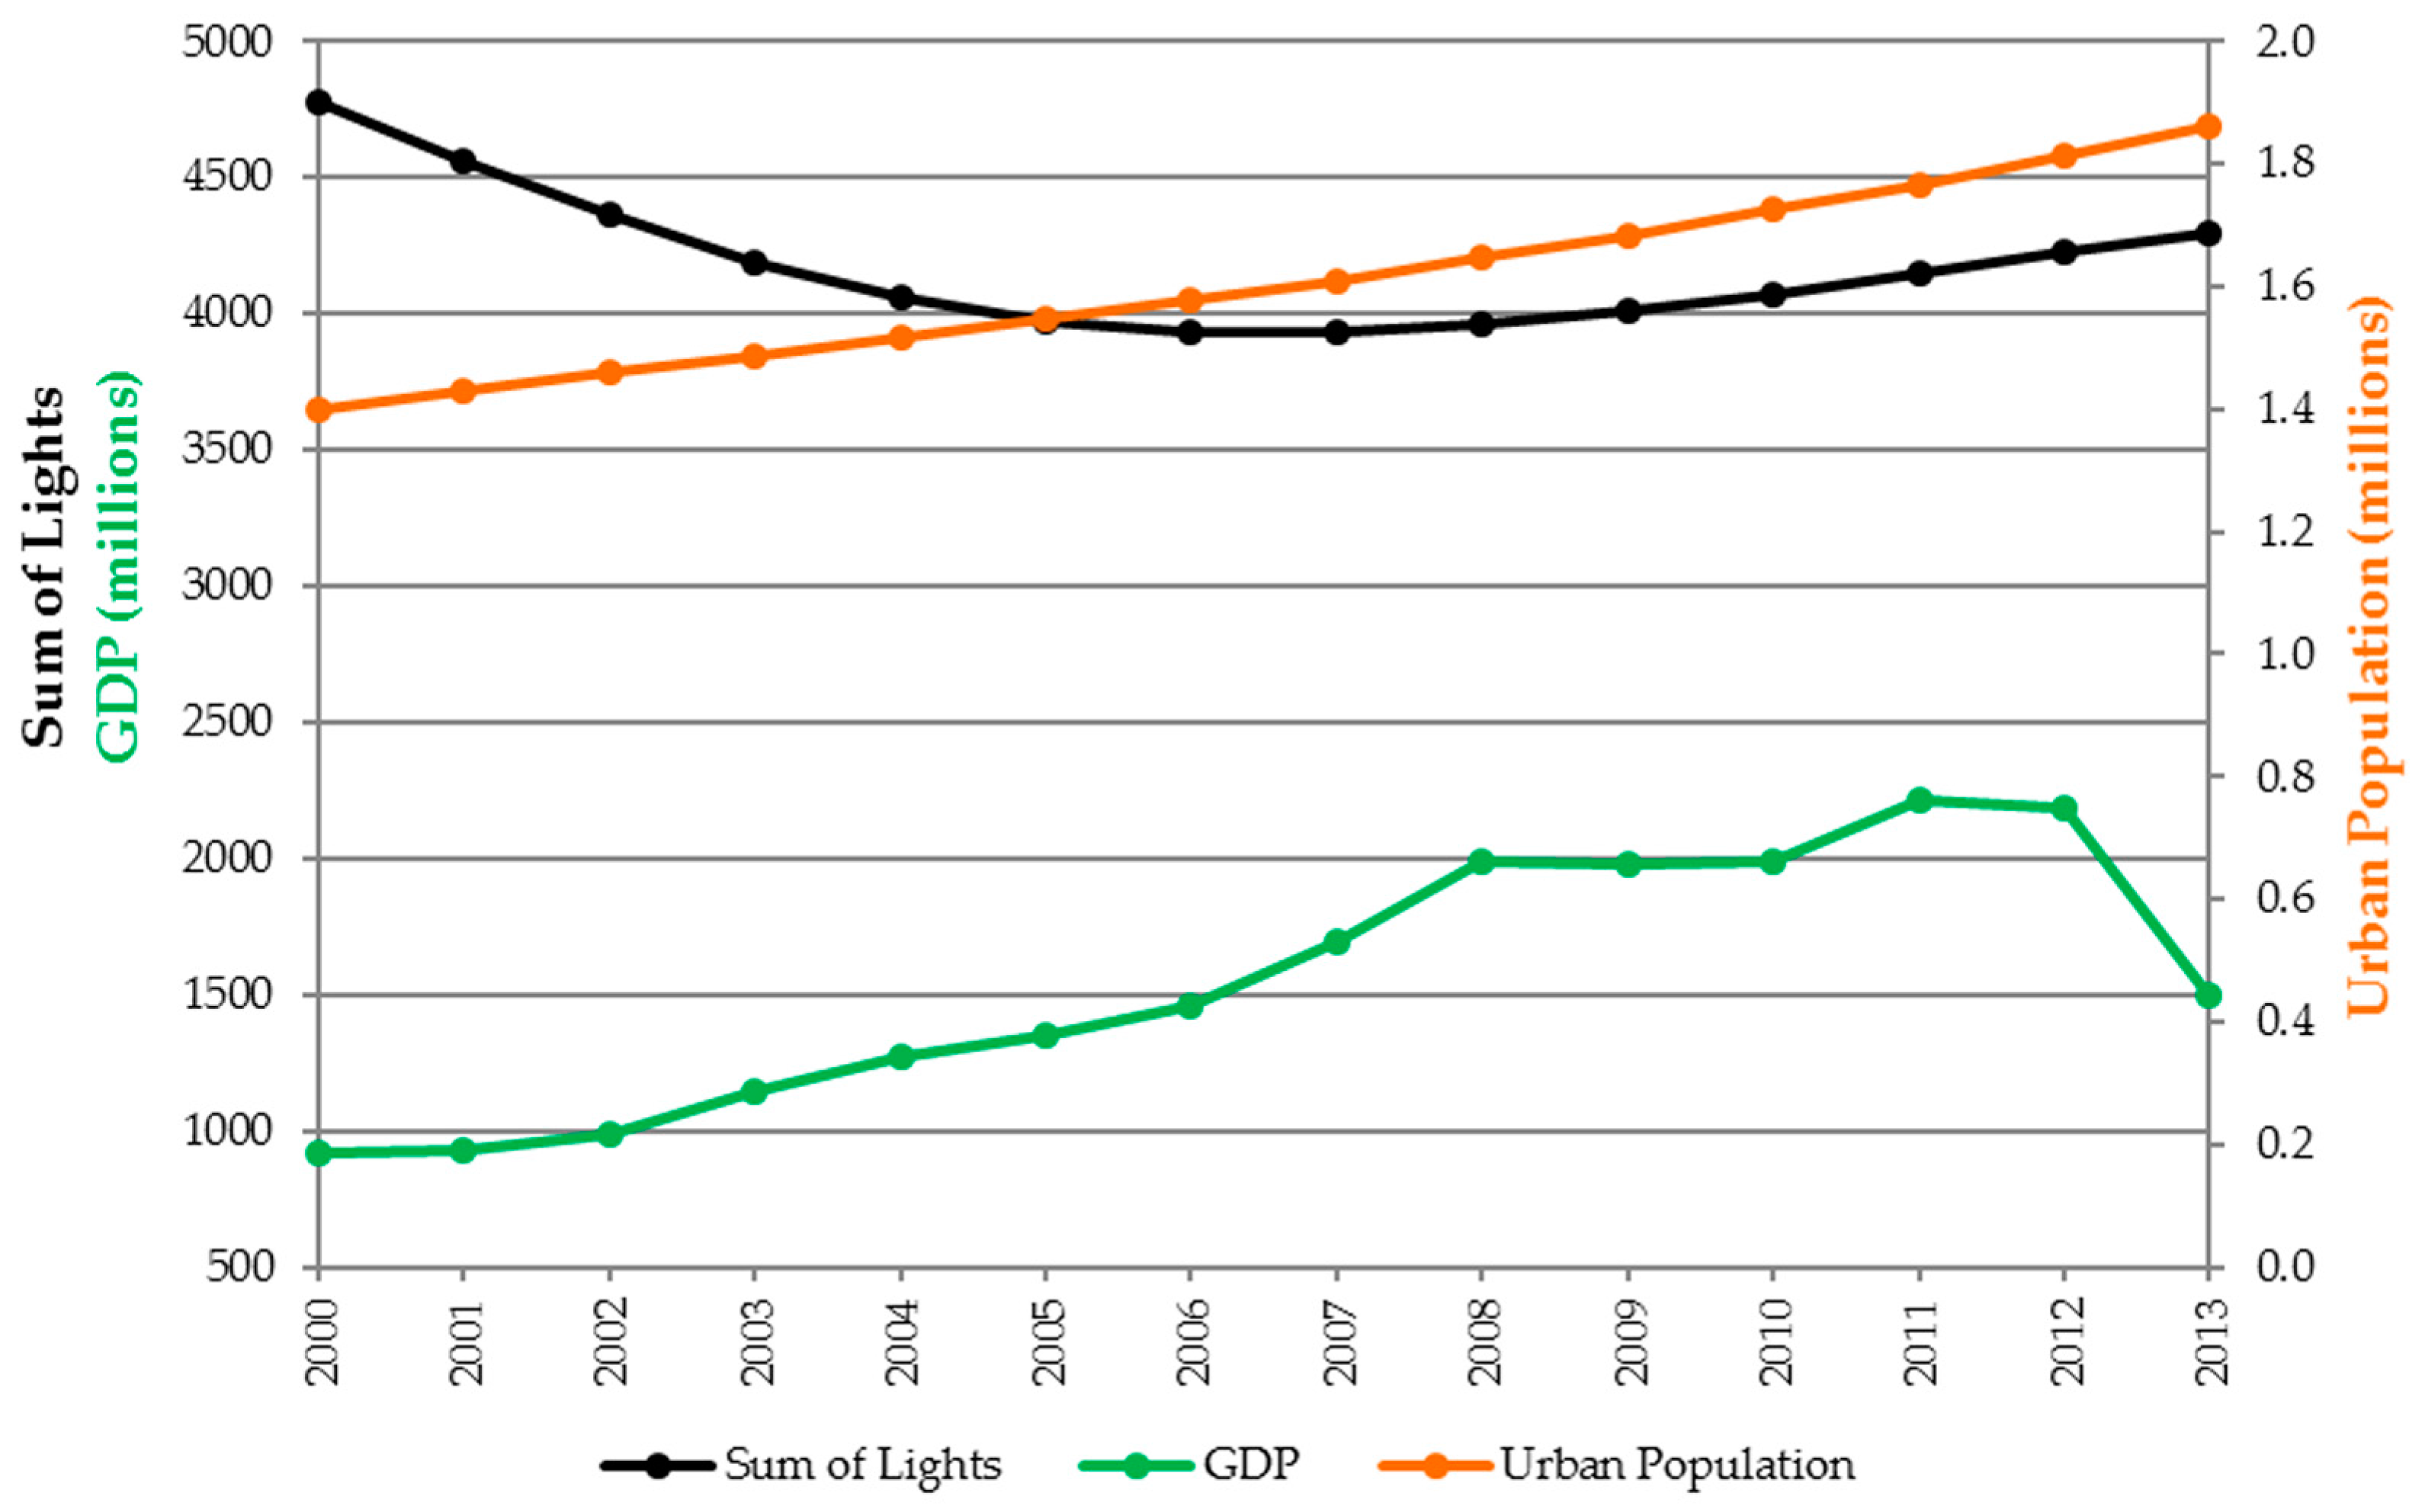
3.3. Urban Growth Analysis
4. Discussion
5. Conclusions
Supplementary Materials
Acknowledgments
Author Contributions
Conflicts of Interest
Appendix A
Appendix A.1. Gaussian Process Regression
Appendix A.2. Examples of Covariance Kernels
Appendix A.2.1. Linear Kernel
Appendix A.2.2. Exponentiated Quadratic Kernel
Appendix A.2.3. Composed Linear—Exponentiated Quadratic Kernel
References
- Nations, United. World Urbanization Prospects: The 2014 Revision, Highlights. Department of Economic and Social Affairs; Population Division: New York, NY, USA, 2014. [Google Scholar]
- The World Bank. World Development Indicators. Urban and Rural Population (% Annual Growth). Available online: http://databank.worldbank.org/data/reports.aspx?Report_Name=Urban-and-rural-growth&Id=eee35bac (accessed on 1 July 2016).
- Dociu, M.; Dunarintu, A. The socio-economic impact of urbanization. Int. J. Acad. Res. Account. Financ. Manag. Sci. 2012, 2, 47–52. [Google Scholar]
- Gething, P.W.; Smith, D.L.; Patil, A.P.; Tatem, A.J.; Snow, R.W.; Hay, S.I. Climate change and the global malaria recession. Nature 2010, 465, 342–345. [Google Scholar] [CrossRef] [PubMed]
- Gubler, D.J. Dengue, urbanization and globalization: The unholy trinity of the 21st century. Trop. Med. Health 2011, 39, 3–11. [Google Scholar] [CrossRef] [PubMed]
- NOAA’s National Geophysical Data Center. Defense Meteorological Satellite Program (DMSP). Available online: http://www.ngdc.noaa.gov/eog/dmsp.html (accessed on 1 July 2016).
- Elvidge, C.D.; Hsu, F.C.; Baugh, K.E.; Ghosh, T. National trends in satellite-observed lighting. Glob. Urban Monit. Assess. Earth Obs. 2014, 23, 97–118. [Google Scholar]
- Zhao, N.; Ghosh, T.; Samson, E.L. Mapping spatio-temporal changes of Chinese electric power consumption using night-time imagery. Int. J. Remote Sens. 2012, 33, 6304–6320. [Google Scholar] [CrossRef]
- Ma, T.; Zhou, Y.; Zhou, C.; Haynie, S.; Pei, T.; Xu, T. Night-time light derived estimation of spatio-temporal characteristics of urbanization dynamics using DMSP/OLS satellite data. Remote Sens. Environ. 2015, 158, 453–464. [Google Scholar] [CrossRef]
- Pestalozzi, N.; Niederhuber, M. Nighttime Lights as Proxy for the Spatial Growth of Dense Urbanized Areas. Master’s Thesis, Department of Management, Technology and Economics (D-MTEC) Chair of Entrepreneurial Risks, Chair of Land Use Engineering ETH Zürich 94, Zurich, Switzerland, 2012. [Google Scholar]
- Liu, Z.; He, C.; Zhang, Q.; Huang, Q.; Yang, Y. Extracting the dynamics of urban expansion in China using DMSP-OLS nighttime light data from 1992 to 2008. Landsc. Urban Plan. 2012, 106, 62–72. [Google Scholar] [CrossRef]
- Henderson, M.; Yeh, E.T.; Gong, P.; Elvidge, C.D.; Baugh, K. Validation of urban boundaries derived from global night-time satellite imagery. Int. J. Remote Sens. 2003, 24, 595–609. [Google Scholar] [CrossRef]
- Wu, J.; He, S.; Peng, J.; Li, W.; Zhong, X. Intercalibration of DMSP-OLS night-time light data by the invariant region method. Int. J. Remote Sens. 2013, 34, 7356–7368. [Google Scholar] [CrossRef]
- Li, X.; Chen, X.; Zhao, Y.; Xu, J.; Chen, F.; Li, H. Automatic intercalibration of night-time light imagery using robust regression. Remote Sens. Lett. 2013, 4, 45–54. [Google Scholar] [CrossRef]
- Zhang, Q.; Pandey, B.; Seto, K.C. A Robust Method to Generate a Consistent Time Series from DMSP/OLS Nighttime Light Data. IEEE Trans. Geosci. Remote Sens. 2016, 54, 5821–5831. [Google Scholar] [CrossRef]
- Raupach, M.R.; Rayner, P.J.; Paget, M. Regional variations in spatial structure of nightlights, population density and fossil-fuel CO2 emissions. Energy Policy 2010, 38, 4756–4764. [Google Scholar] [CrossRef]
- Doll, C.N.H.; Muller, J.-P.; Elvidge, C.D. Night-time imagery as a tool for global mapping of socioeconomic parameters and greenhouse gas emissions. AMBIO 2000, 29, 157–162. [Google Scholar] [CrossRef]
- Li, X.; Zhou, Y. Urban mapping using DMSP/OLS stable night-time light: A review. Int. J. Remote Sens. 2017, 15, 1–7. [Google Scholar] [CrossRef]
- Ju, Y.; Dronova, I.; Ma, Q.; Zhang, X. Analysis of urbanization dynamics in mainland China using pixel-based night-time light trajectories from 1992 to 2013. Int. J. Remote Sens. 2017, 19, 1–26. [Google Scholar] [CrossRef]
- Zhang, Q.; Seto, K.C. Can night-time light data identify typologies of urbanization? A global assessment of successes and failures. Remote Sens. 2013, 5, 3476–3494. [Google Scholar]
- Ma, T.; Zhou, C.; Pei, T.; Haynie, S.; Fan, J. Quantitative estimation of urbanization dynamics using time series of DMSP/OLS nighttime light data: A comparative case study from China’s cities. Remote Sens. Environ. 2012, 124, 99–107. [Google Scholar] [CrossRef]
- Cauwels, P.; Pestalozzi, N.; Sornette, D. Dynamics and spatial distribution of global nighttime lights. EPJ Data Sci. 2014, 3, 1–26. [Google Scholar] [CrossRef]
- Bhatt, S.; Weiss, D.J.; Cameron, E.; Bisanzio, D.; Mappin, B.; Dalrymplem, U.; Battle, K.; Moyes, C.; Henry, A.; Eckhoff, P.A.; et al. The effect of malaria control on Plasmodium falciparum in Africa between 2000 and 2015. Nature 2015, 526, 207–211. [Google Scholar] [CrossRef] [PubMed]
- Google Earth Engine Team. Google Earth Engine: A Planetary-Scale Geospatial Analysis Platform. 2015. Available online: https://earthengine.google.com (accessed on 1 July 2016).
- Rasmussen, C.E.; Williams, C.K.I. Gaussian Processes for Machine Learning; MIT Press (Massachusetts Institute of Technology): Cambridge, MA, USA, 2006. [Google Scholar]
- Parzen, E. Statistical Inference on Time Series by Hilbert Space Methods; Technical Report 23; Stanford University: Stanford, CA, USA, 1959. [Google Scholar]
- Parzen, E. An approach to time series analysis. Ann. Math. Stat. 1961, 32, 951–989. [Google Scholar] [CrossRef]
- Parzen, E. Statistical Inference on Time Series by RKHS Methods; Technical Report-14; Defense Technical Information Center: Fort Belvoir, VA, USA, 1970; pp. 1–37.
- Shawe-Taylor, J.; Cristianini, N. Kernel Methods for Pattern Analysis; Cambridge University Press: Cambridge, UK, 2006. [Google Scholar]
- Elvidge, C.D.; Ziskin, D.; Baugh, K.E.; Tuttle, B.T.; Ghosh, T.; Pack, D.W.; Erwin, E.H.; Zhizhin, M. A fifteen year record of global natural gas flaring derived from satellite data. Energies 2009, 2, 595–622. [Google Scholar] [CrossRef]
- Imhoff, M.L.; Lawrence, W.T.; Stutzer, D.C.; Elvidge, C.D. A technique for using composite DMSP/OLS “city lights” satellite data to map urban area. Remote Sens. Environ. 1997, 61, 361–370. [Google Scholar] [CrossRef]
- ESRI Incorporated; DeLorme Publishing Company; CIA World Factbook. World Water Bodies 2016. World Countries. Available online: http://www.arcgis.com (accessed on 1 July 2016).
- Small, C.; Elvidge, C.D.; Balk, D.; Montgomery, M. Spatial scaling of stable night lights. Remote Sens. Environ. 2011, 115, 269–280. [Google Scholar] [CrossRef]
- Zhang, Q.; Seto, K.C. Mapping urbanization dynamics at regional and global scales using multi-temporal DMSP/OLS nighttime light data. Remote Sens. Environ. 2011, 115, 2320–2329. [Google Scholar] [CrossRef]
- Zhao, N.; Currit, N.; Samson, E. Net primary production and gross domestic product in China derived from satellite imagery. Ecol. Econ. 2011, 70, 921–928. [Google Scholar] [CrossRef]
- The World Bank. World Development Indicators. GDP (Current US$). 2015. Available online: http://databank.worldbank.org/data/reports.aspx?Code=NY.GDP.MKTP.CD&id=af3ce82b&report_name=Popular_indicators&populartype=series&ispopular=y# (accessed on 1 July 2016).
- The World Bank. World Development Indicators. Urban Population (% of Total). 2015. Available online: http://databank.worldbank.org/data/reports.aspx?source=2&series=SP.URB.TOTL.IN.ZS&country=# (accessed on 1 July 2016).
- Tuttle, B.; Anderson, S.; Elvidge, C.; Ghosh, T.; Baugh, K.; Sutton, P. Aladdin’s magic lamp: Active target calibration of the DMSP-OLS. Remote Sens. 2014, 6, 12708–12722. [Google Scholar] [CrossRef]
- Bennett, M.M.; Smith, L.C. Advances in using multitemporal night-time lights satellite imagery to detect, estimate, and monitor socioeconomic dynamics. Remote Sens. Environ. 2017, 192, 176–197. [Google Scholar] [CrossRef]
- Li, X.; Zhang, R.; Huang, C.; Li, D. Detecting 2014 Northern Iraq Insurgency using night-time light imagery. Int. J. Remote Sens. 2015, 36, 3446–3458. [Google Scholar] [CrossRef]
- Gillespie, T.W.; Frankenberg, E.; Chum, K.F.; Thomas, D. Night-time lights time series of tsunami damage, recovery, and economic metrics in Sumatra, Indonesia. Remote Sens. Lett. 2014, 5, 286–294. [Google Scholar] [CrossRef] [PubMed]
- Coscieme, L.; Sutton, P.C.; Anderson, S.; Liu, Q.; Elvidge, C.D. Dark Times: Nighttime satellite imagery as a detector of regional disparity and the geography of conflict. GISci. Remote Sens. 2017, 54, 118–139. [Google Scholar] [CrossRef]
- Li, X.; Chen, F.; Chen, X. Satellite-observed nighttime light variation as evidence for global armed conflicts. IEEE J. Sel. Top. Appl. Earth Obs. Remote Sens. 2013, 6, 2302–2315. [Google Scholar] [CrossRef]
- Elvidge, C.D.; Baugh, K.E.; Zhizhin, M.; Hsu, F.C. Why VIIRS data are superior to DMSP for mapping nighttime lights. Proc. Asia-Pac. Adv. Netw. 2013, 35, 62–69. [Google Scholar] [CrossRef]
- Ou, J.; Liu, X.; Li, X.; Li, M.; Li, W. Evaluation of NPP-VIIRS nighttime light data for mapping global fossil fuel combustion CO2 emissions: A comparison with DMSP-OLS nighttime light data. PLoS ONE 2015, 10, e0138310. [Google Scholar] [CrossRef] [PubMed]
- Levin, N.; Zhang, Q. A global analysis of factors controlling VIIRS nighttime light levels from densely populated areas. Remote Sens. Environ. 2017, 190, 366–382. [Google Scholar] [CrossRef]
- Huang, Q.; Yang, X.; Gao, B.; Yang, Y.; Zhao, Y. Application of DMSP/OLS nighttime light images: A meta-analysis and a systematic literature review. Remote Sens. 2014, 6, 6844–6866. [Google Scholar] [CrossRef]


| Year | Satellites | |||
|---|---|---|---|---|
| F-14 | F-15 | F-16 | F-18 | |
| 2000 | F142000 | F152000 | ||
| 2001 | F142001 | F152001 | ||
| 2002 | F142002 | F152002 | ||
| 2003 | F142003 | F152003 | ||
| 2004 | F152004 | F162004 | ||
| 2005 | F152005 | F162005 | ||
| 2006 | F152006 | F162006 | ||
| 2007 | F152007 | F162007 | ||
| 2008 | F162008 | |||
| 2009 | F162009 | |||
| 2010 | F182010 | |||
| 2011 | F182011 | |||
| 2012 | F182012 | |||
| 2013 | F182013 | |||
| Satellite | Year | ||||
|---|---|---|---|---|---|
| F12 | 1999 | 0 | 1 | 0 | 1 |
| F14 | 2000 | 1.2445 | 1.3076 | −0.0051 | 0.9334 |
| F14 | 2001 | 0.3811 | 1.3103 | −0.0050 | 0.9461 |
| F14 | 2002 | 1.2242 | 1.1542 | −0.0030 | 0.9262 |
| F14 | 2003 | 0.8802 | 1.2381 | −0.0039 | 0.9444 |
| F15 | 2000 | 0.1832 | 1.0418 | −0.0010 | 0.9410 |
| F15 | 2001 | −0.7078 | 1.1191 | −0.0015 | 0.9617 |
| F15 | 2002 | 0.1354 | 0.9587 | 0.0008 | 0.9662 |
| F15 | 2003 | 0.3589 | 1.4992 | −0.0078 | 0.9336 |
| F15 | 2004 | 0.7187 | 1.3200 | −0.0050 | 0.9485 |
| F15 | 2005 | 0.7567 | 1.2666 | −0.0040 | 0.9377 |
| F15 | 2006 | 0.9387 | 1.2660 | −0.0040 | 0.9409 |
| F15 | 2007 | 1.6464 | 1.2480 | −0.0038 | 0.9056 |
| F16 | 2004 | 0.3607 | 1.1809 | −0.0032 | 0.9153 |
| F16 | 2005 | 0.1794 | 1.3906 | −0.0060 | 0.9402 |
| F16 | 2006 | 0.1955 | 1.1322 | −0.0017 | 0.9233 |
| F16 | 2007 | 0.9177 | 0.8841 | 0.0017 | 0.9483 |
| F16 | 2008 | 0.6750 | 0.9773 | 0.0001 | 0.9456 |
| F16 | 2009 | 1.9043 | 0.9740 | −0.0007 | 0.8381 |
| F18 | 2010 | 2.9053 | 0.4593 | 0.0070 | 0.8404 |
| F18 | 2011 | 3.1449 | 0.6453 | 0.0036 | 0.8129 |
| F18 | 2012 | 2.1239 | 0.5975 | 0.0054 | 0.9369 |
| F18 | 2013 | 2.1382 | 0.6683 | 0.0039 | 0.9372 |
| Case | UC | IC | GP |
|---|---|---|---|
| MSE a | 22.76 | 18.22 | 11.38 |
| Intercalibration Test Cases | GDP | Urban Population | ||
|---|---|---|---|---|
| RMSE a | RMSE b | |||
| Uncalibrated (UC) | 0.847 | 990,522 | 0.803 | 1,122,507 |
| Intercalibrated (IC) | 0.925 | 360,601 | 0.902 | 412,637 |
| IC + Gaussian process (GP) | 0.983 | 158,827 | 0.9997 | 22,241 |
| Country | Total Area of Lit Pixels (km2) | Area of Urban Agglomerations (km2) | ||||||
|---|---|---|---|---|---|---|---|---|
| 2000 | 2013 | Change a | % Chg | 2000 | 2013 | Change | % Chg | |
| South Africa | 202,098 | 240,581 | 38,483 | 19 | 156,608 | 192,501 | 35,893 | 23 |
| Nigeria | 68,470 | 96,054 | 27,584 | 40 | 41,870 | 58,744 | 16,874 | 40 |
| Sudan | 24,622 | 49,307 | 24,685 | 100 | 16,449 | 33,055 | 16,606 | 101 |
| Angola | 7086 | 21,845 | 14,759 | 208 | 3800 | 10,884 | 7084 | 186 |
| Mozambique | 5566 | 16,119 | 10,553 | 190 | 1439 | 6777 | 5338 | 371 |
| Ethiopia | 8888 | 17,866 | 8978 | 101 | 2129 | 5403 | 3274 | 154 |
| Kenya | 14,194 | 22,527 | 8333 | 59 | 8289 | 15,410 | 7121 | 86 |
| Ghana | 23,708 | 30,384 | 6676 | 28 | 15,134 | 21,451 | 6317 | 42 |
| Tanzania | 10,228 | 15,272 | 5044 | 49 | 3238 | 5662 | 2424 | 75 |
| Congo, DR | 6105 | 11,020 | 4915 | 81 | 2745 | 4489 | 1744 | 64 |
| Cote d’Ivoire | 39,350 | 43,443 | 4093 | 10 | 18,737 | 23,493 | 4756 | 25 |
| Niger | 3864 | 7804 | 3940 | 102 | 975 | 1710 | 735 | 75 |
| Botswana | 7946 | 11,869 | 3923 | 49 | 2134 | 4811 | 2677 | 125 |
| Senegal | 6226 | 10,083 | 3857 | 62 | 2790 | 4815 | 2025 | 73 |
| Congo, R | 2371 | 5800 | 3429 | 145 | 1622 | 2919 | 1297 | 80 |
| Namibia | 9611 | 12,960 | 3349 | 35 | 2692 | 4219 | 1527 | 57 |
| Chad | 1127 | 4393 | 3266 | 290 | 233 | 1180 | 947 | 406 |
| Zambia | 10,667 | 13,726 | 3059 | 29 | 5870 | 7455 | 1585 | 27 |
| Burkina Faso | 3086 | 5820 | 2734 | 89 | 741 | 1509 | 768 | 104 |
| Mali | 3444 | 6163 | 2719 | 79 | 803 | 1224 | 421 | 52 |
| Gabon | 3206 | 5372 | 2166 | 68 | 707 | 2335 | 1628 | 230 |
| Benin | 3354 | 5464 | 2110 | 63 | 1511 | 2930 | 1419 | 94 |
| Cameroon | 6672 | 8621 | 1949 | 29 | 2423 | 2705 | 282 | 12 |
| Swaziland | 5180 | 7060 | 1880 | 36 | 3818 | 6204 | 2386 | 62 |
| Malawi | 4819 | 6583 | 1764 | 37 | 1895 | 1482 | −413 | −22 |
| Eq Guinea | 158 | 1753 | 1595 | 1009 | 0 | 631 | 631 | - |
| Uganda | 4055 | 5604 | 1549 | 38 | 1834 | 2508 | 674 | 37 |
| Liberia | 490 | 2029 | 1539 | 314 | 252 | 510 | 258 | 102 |
| Rwanda | 694 | 1948 | 1254 | 181 | 346 | 905 | 559 | 162 |
| Mauritania | 1912 | 3070 | 1158 | 61 | 699 | 891 | 192 | 27 |
| Lesotho | 1562 | 2681 | 1119 | 72 | 344 | 1588 | 1244 | 362 |
| Sierra Leone | 371 | 1132 | 761 | 205 | 0 | 280 | 280 | - |
| Togo | 2431 | 3167 | 736 | 30 | 1164 | 1408 | 244 | 21 |
| Somalia | 1495 | 2210 | 715 | 48 | 0 | 614 | 614 | - |
| Guinea | 2275 | 2973 | 698 | 31 | 511 | 476 | −35 | −7 |
| Gambia | 445 | 1030 | 585 | 131 | 300 | 548 | 248 | 83 |
| Madagascar | 2931 | 3468 | 537 | 18 | 710 | 925 | 215 | 30 |
| Burundi | 501 | 961 | 460 | 92 | 275 | 398 | 123 | 45 |
| Eritrea | 1512 | 1938 | 426 | 28 | 417 | 506 | 89 | 21 |
| Central Afr Rep | 829 | 1175 | 346 | 42 | 266 | 266 | 0 | 0 |
| Djibouti | 408 | 677 | 269 | 66 | 0 | 340 | 340 | - |
| Guinea Bissau | 197 | 216 | 19 | 10 | 0 | 0 | 0 | - |
| Zimbabwe | 19,625 | 16,847 | −2778 | −14 | 10,270 | 9287 | −983 | −10 |
© 2017 by the authors. Licensee MDPI, Basel, Switzerland. This article is an open access article distributed under the terms and conditions of the Creative Commons Attribution (CC BY) license (http://creativecommons.org/licenses/by/4.0/).
Share and Cite
Savory, D.J.; Andrade-Pacheco, R.; Gething, P.W.; Midekisa, A.; Bennett, A.; Sturrock, H.J.W. Intercalibration and Gaussian Process Modeling of Nighttime Lights Imagery for Measuring Urbanization Trends in Africa 2000–2013. Remote Sens. 2017, 9, 713. https://doi.org/10.3390/rs9070713
Savory DJ, Andrade-Pacheco R, Gething PW, Midekisa A, Bennett A, Sturrock HJW. Intercalibration and Gaussian Process Modeling of Nighttime Lights Imagery for Measuring Urbanization Trends in Africa 2000–2013. Remote Sensing. 2017; 9(7):713. https://doi.org/10.3390/rs9070713
Chicago/Turabian StyleSavory, David J., Ricardo Andrade-Pacheco, Peter W. Gething, Alemayehu Midekisa, Adam Bennett, and Hugh J. W. Sturrock. 2017. "Intercalibration and Gaussian Process Modeling of Nighttime Lights Imagery for Measuring Urbanization Trends in Africa 2000–2013" Remote Sensing 9, no. 7: 713. https://doi.org/10.3390/rs9070713
APA StyleSavory, D. J., Andrade-Pacheco, R., Gething, P. W., Midekisa, A., Bennett, A., & Sturrock, H. J. W. (2017). Intercalibration and Gaussian Process Modeling of Nighttime Lights Imagery for Measuring Urbanization Trends in Africa 2000–2013. Remote Sensing, 9(7), 713. https://doi.org/10.3390/rs9070713