Article

Continued Reforestation and Urban Expansion in the New Century of a Tropical Island in the Caribbean

Department of Environmental Science, University of Puerto Rico-Rio Piedras, San Juan, PR 00936, USA
*
Author to whom correspondence should be addressed.
Remote Sens. 2017, 9(7), 731; https://doi.org/10.3390/rs9070731
Submission received: 22 April 2017 / Revised: 22 June 2017 / Accepted: 12 July 2017 / Published: 15 July 2017
(This article belongs to the Section Forest Remote Sensing)

Abstract

:
Accurate and timely monitoring of tropical land cover/use (LCLU) changes is urgent due to the rapid deforestation/reforestation and its impact on global land-atmosphere interaction. However, persistent cloud cover in the tropics imposes the greatest challenge and retards LCLU mapping in mountainous areas such as the tropic island of Puerto Rico, where forest transition changed from deforestation to reforestation due to the economy shift from agriculture to industry and service after the 1940s. To improve the LCLU mapping in the tropics and to evaluate the trend of forest transition of Puerto Rico in the new century, we integrated the optical Landsat images with the L-band SAR to map LC in 2010 by taking advantage of the cloud-penetrating ability of the SAR signals. The results showed that the incorporation of SAR data with the Landsat data significantly, although not substantially, enhanced the accuracy of LCLU mapping of Puerto Rico, and the Kappa statistic reached 90.5% from 88.4% without SAR data. The enhancement of mapping by SAR is important for urban and forest, as well as locations with limited optical data caused by cloud cover. We found both forests and urban lands continued expanding in the new century despite the declining population. However, the forest cover change slowed down in 2000–2010 compared to that in 1991–2000. The deforestation rate reduced by 42.1% in 2000–2010, and the reforestation was mostly located in the east and southeast of the island where Hurricane Georges landed and caused severe vegetation damage in 1998. We also found that reforestation increased, but deforestation decreased along the topography slope. Reforestation was much higher within the protected area compared to that in the surroundings in the wet and moist forest zones.

1. Introduction

Forests cover almost a third of the land surface (approximately 41 million km2) [1], host the most biodiversity, and play an important role in regulating climate and supporting human beings [2,3]. Although both deforestation and reforestation occurred in various regions, global forest cover has been declining over the past several centuries, mostly because of the continuously growing demands for food and wood products [4,5]. Tropical forests have been experiencing the most rapid rates of deforestation in Africa, South America, and Southeast Asia since the 1980s [6,7,8]. The deforestation, degradation, and fragmentation of the tropical forests have led to altered carbon and water cycles, losses of biodiversity, and soil erosions.
Monitoring forest changes at regional to global scales is the priority for ecosystem management to offset green-house-gas emissions and to conserve ecosystem and biodiversity. Various methods have been proposed and applied to provide consistent and up-to-date mappings of forests during the past decades [9,10,11], and the optical remote sensing images, such as the Landsat E/TM and the MODIS images, have been widely used from local to global scales [7,12,13,14,15,16]. However, applications of optical satellite images relying on reflection of solar radiation are challenged by the persistent cloudiness in the mountainous tropics [17] where average cloud coverage could reach as high as 55.5 ± 12.5% even during the dry season according to the data from the tropical island of Puerto Rico [18].
Unlike passive optical sensors, Synthetic Aperture Radar (SAR) sensors emit and receive microwave which could penetrate clouds and provide all-weather images in day and night [19]. The signals of SAR sensors with L-band could even penetrate vegetation canopies and provide information of not only canopy but also branches and trunks [9]. Moreover, as radar backscattered signal is sensitive to the land surface roughness and dielectric properties [20], the texture characteristics of the backscattered signal could be useful to improve LCLU mapping [21]. The synergistic use of images from both optical and SAR sensors, in general, yielded better classification results than those using either of them [15,17,19,22].
As a biodiversity hotspot in the tropical Caribbean with high endemism, Puerto Rico has experienced significant forest transition from deforestation to reforestation in the last century [23,24,25]. Historically, the island’s economy relied heavily on agriculture (e.g., sugarcane, coffee, and tobacco) during the Spain Era (1493–1898), which led to extensive forest clearing [26]. By the 1940s, the remaining forests only covered 5–6% [27]. The economic shift to industry and service initiated in the 1940s resulted in massive abandonment of croplands and rendered the space for forest regrowth [27,28,29]. The economic shift also led to urbanization followed by urban sprawl [30,31,32]. In contrast to the well-documented LCLUC during the last century with population growth, little is known for the LCLUC in the new century. The start of the new century is characterized by a population decline, which appears to be the first time in its history according to the US Census. The drop in human population might halt or reverse the trend of urbanization, and the potentially reduced human activities might in turn favor the forest regrowth.
The objectives of this study are: (1) to map the land cover of 2010 for the tropical island of Puerto Rico by integrating the optical and the SAR remotely sensed imagery; (2) to evaluate whether the reforestation and the urbanization continued in the new century in the background of the declining population; and (3) to investigate the spatial distributions of forest changes in relation with topography, disturbance, and policies in the first decade of the new century. This study will strengthen our understanding of the forest transition and inform the land use planning and the policy making for tropical forest restoration/conservation.

2. Materials and Methods
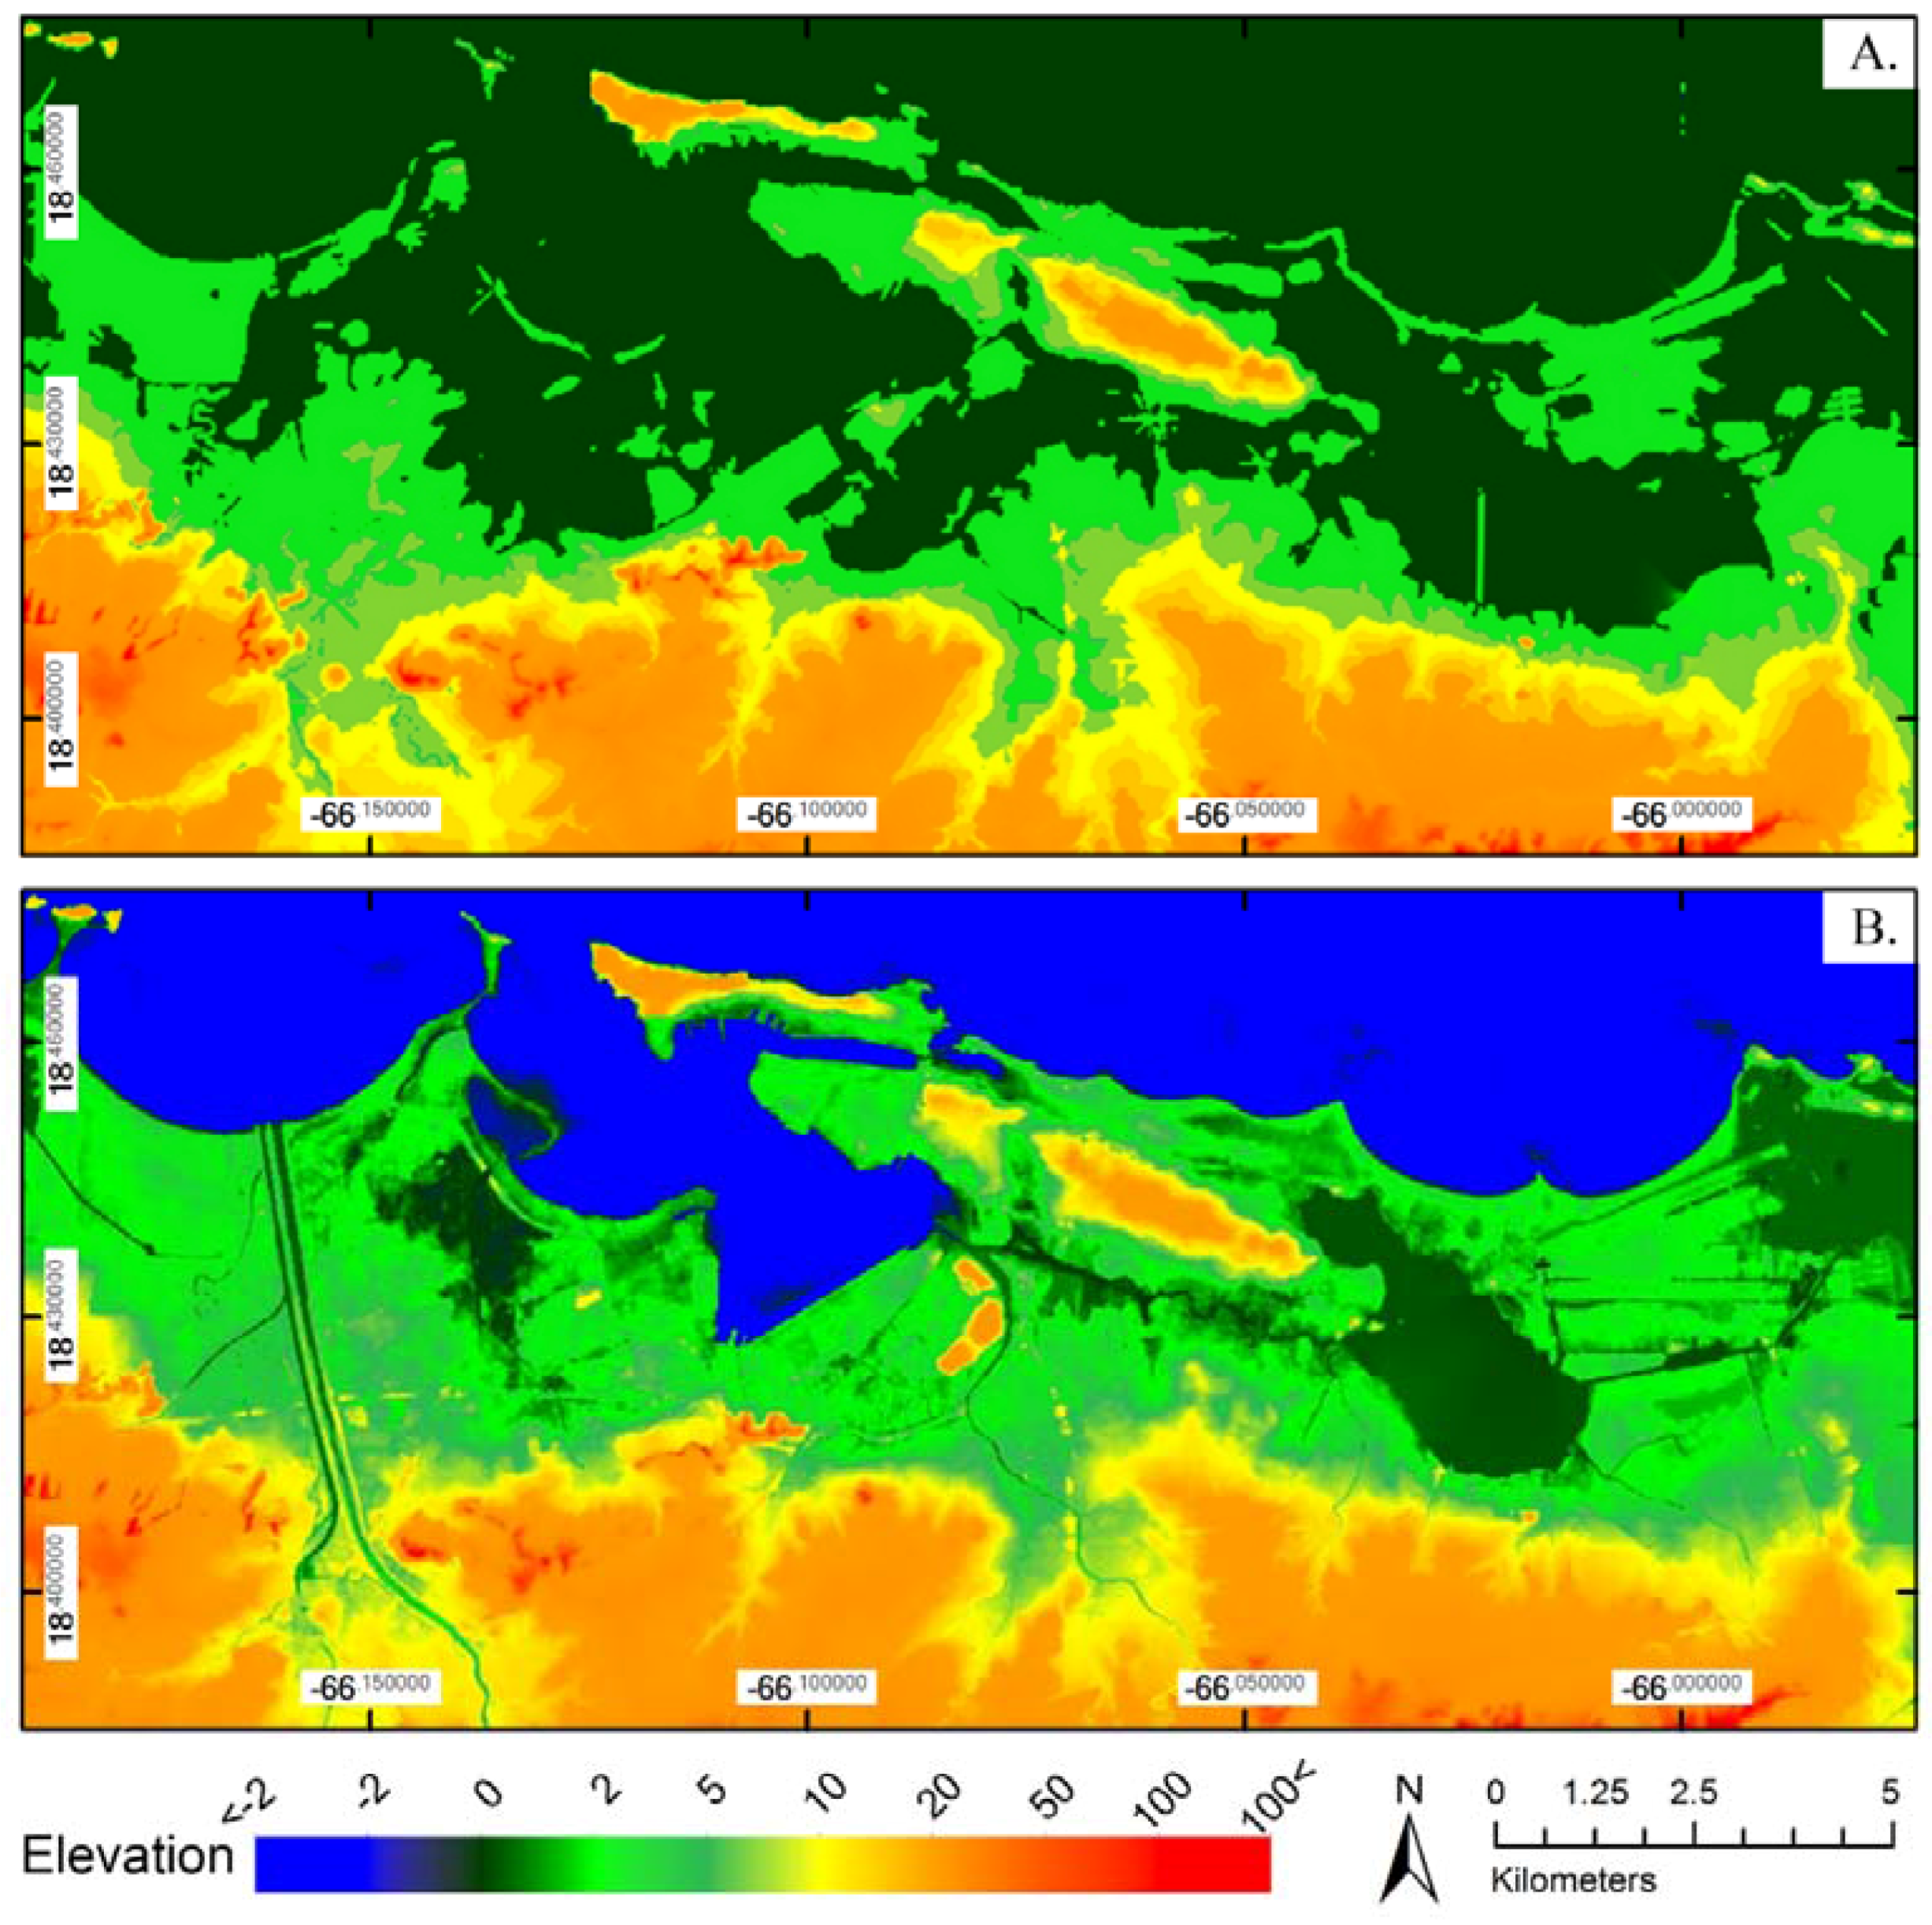
2.1. Study Area

Puerto Rico (18.22° N and 66.59° W, Figure 1) is an island of 8950 km2 in the Greater Antilles bounded by the Caribbean Sea and the Atlantic Ocean. The island has a tropical climate (i.e., wet-dry) with annual mean temperature varying from 21.1 °C to 26.7 °C and the rainy season from April to November. Northeasterly trade winds prevail year-round. The central cordillera with the highest peak of 1338 m a.s.l. blocks the passage of moisture, so that the northeastern windward receives as much as over 4000 mm of annual rainfall while the rain shadow effect leaves less than 1000 mm in the southwestern leeward [31,33]. As a result, a highly spatial-heterogeneous landscape was formed with steep changes in climate and vegetation over short geographic distances [34]. Tropical moist forests dominate the island, while wet forests are limited in the central cordillera and dry forests in the south [18,35].

2.2. Data Preprocessing

To create cloud-free Landsat-based composite images covering the study area in the years of 2000 and 2010, we obtained two Landsat TM/ETM+ products: top-of-atmosphere (TOA) reflectance with a cloud mask detected by the Fmask algorithm [36], and surface reflectance (SR) with a cloud mask detected by the Cmask, both produced by Landsat Ecosystem Disturbance Adaptive Processing System (LEDAPS). We selected the images from November to April to cover the dry seasons ranging from December to March and to account for the interannual variations. We then generated cloud-free Landsat-based composite images of both SR and TOA for each year of 2000 and 2010 as the median reflectance of 23 images for 2000 and 54 images for 2010 after elimination of cloud pixels [37]. The gaps caused by clouds and shades were filled using the median values of multiple years around the study periods (e.g., one year before and after and then three years before and after if needed).
The Advanced Land Observing Satellite (ALOS) Phased Array L-band Synthetic Aperture Radar (PALSAR) data were acquired through the Alaska Satellite Facility (ASF). High-quality terrain data is of critical importance to the radiometric correction (i.e., to eliminate the backscatter distortions caused by topography) and the terrain correction (i.e., to correct the geometric distortions) of the SAR data. Although the high-level radiometrically terrain-corrected (RTC) products were provided by the ASF, many scenes in our study area still show shifts of 1–3 pixels, which may be caused by low-resolution digital elevation model data (DEM, Figure 2A) used in the terrain correction. Thereby, we conducted radiometrically terrain correction processes using the level 1.1 Single Look Complex Fine Beam Dual (FBD, i.e., HH+HV) mode products at the resolution of 12.5 m and the corrected high-resolution DEM data (described below), with the aid of ASF MapReady toolkit. We obtained 32 PALSAR scenes of radiometrically terrain corrected gamma naught SAR data for 2010.
Terrain variables (elevation, slope, and aspect) are key auxiliary predictors in LCLU classification because of their important roles in vegetation distribution. The elevation data used in this study was integrated from two high spatial resolution DEM data: the National Elevation Dataset provided by the USGS (~10 m) [38] and the Puerto Rico coastal DEM data processed for NOAA’s tsunami project [39]. The former DEM data from USGS missed the details in the coastal plains whereas the latter covered the details but only available in the coastal regions (Figure A1). The integrated DEM data were projected and resampled to 30 m using the nearest neighbor resampling method to match the remote sensing datasets, and then used to derive the topography slope (the percentage change in its elevation per distance) and the aspect (the compass direction that the land slope faces).

2.3. Reference Data Collection

The ground reference data is used to train and to verify the classification models. To collect the ground reference data for the year of 2000, we first chose the land cover polygons greater than 2.25 hectares (5 × 5 pixels) based on the historical land cover map in 2000 (see Section 2.4) [29,40] and created a 30-m negative buffer to exclude the edges. We then randomly selected 2000 points from the centers of these polygons and manually checked the land cover of each point based on the high-resolution imagery from Google Earth. To collect the ground reference data for the year of 2010, we used the aerial photos taken in 2010 with the spatial resolution of 0.4 m [41] and checked whether the points chosen for 2000 changed their land cover types in 2010. The points without change were kept for 2010. For those points with land cover changed, we shifted their location to nearby patch center with the same land cover type. The procedure enabled us to obtain 1967 ground reference points for the year of 2000 and 1922 for the year of 2010 (Table A1), and we randomly split these into the training dataset (70% of each land cover type) and the testing dataset (the remaining 30%) for the classifiers.

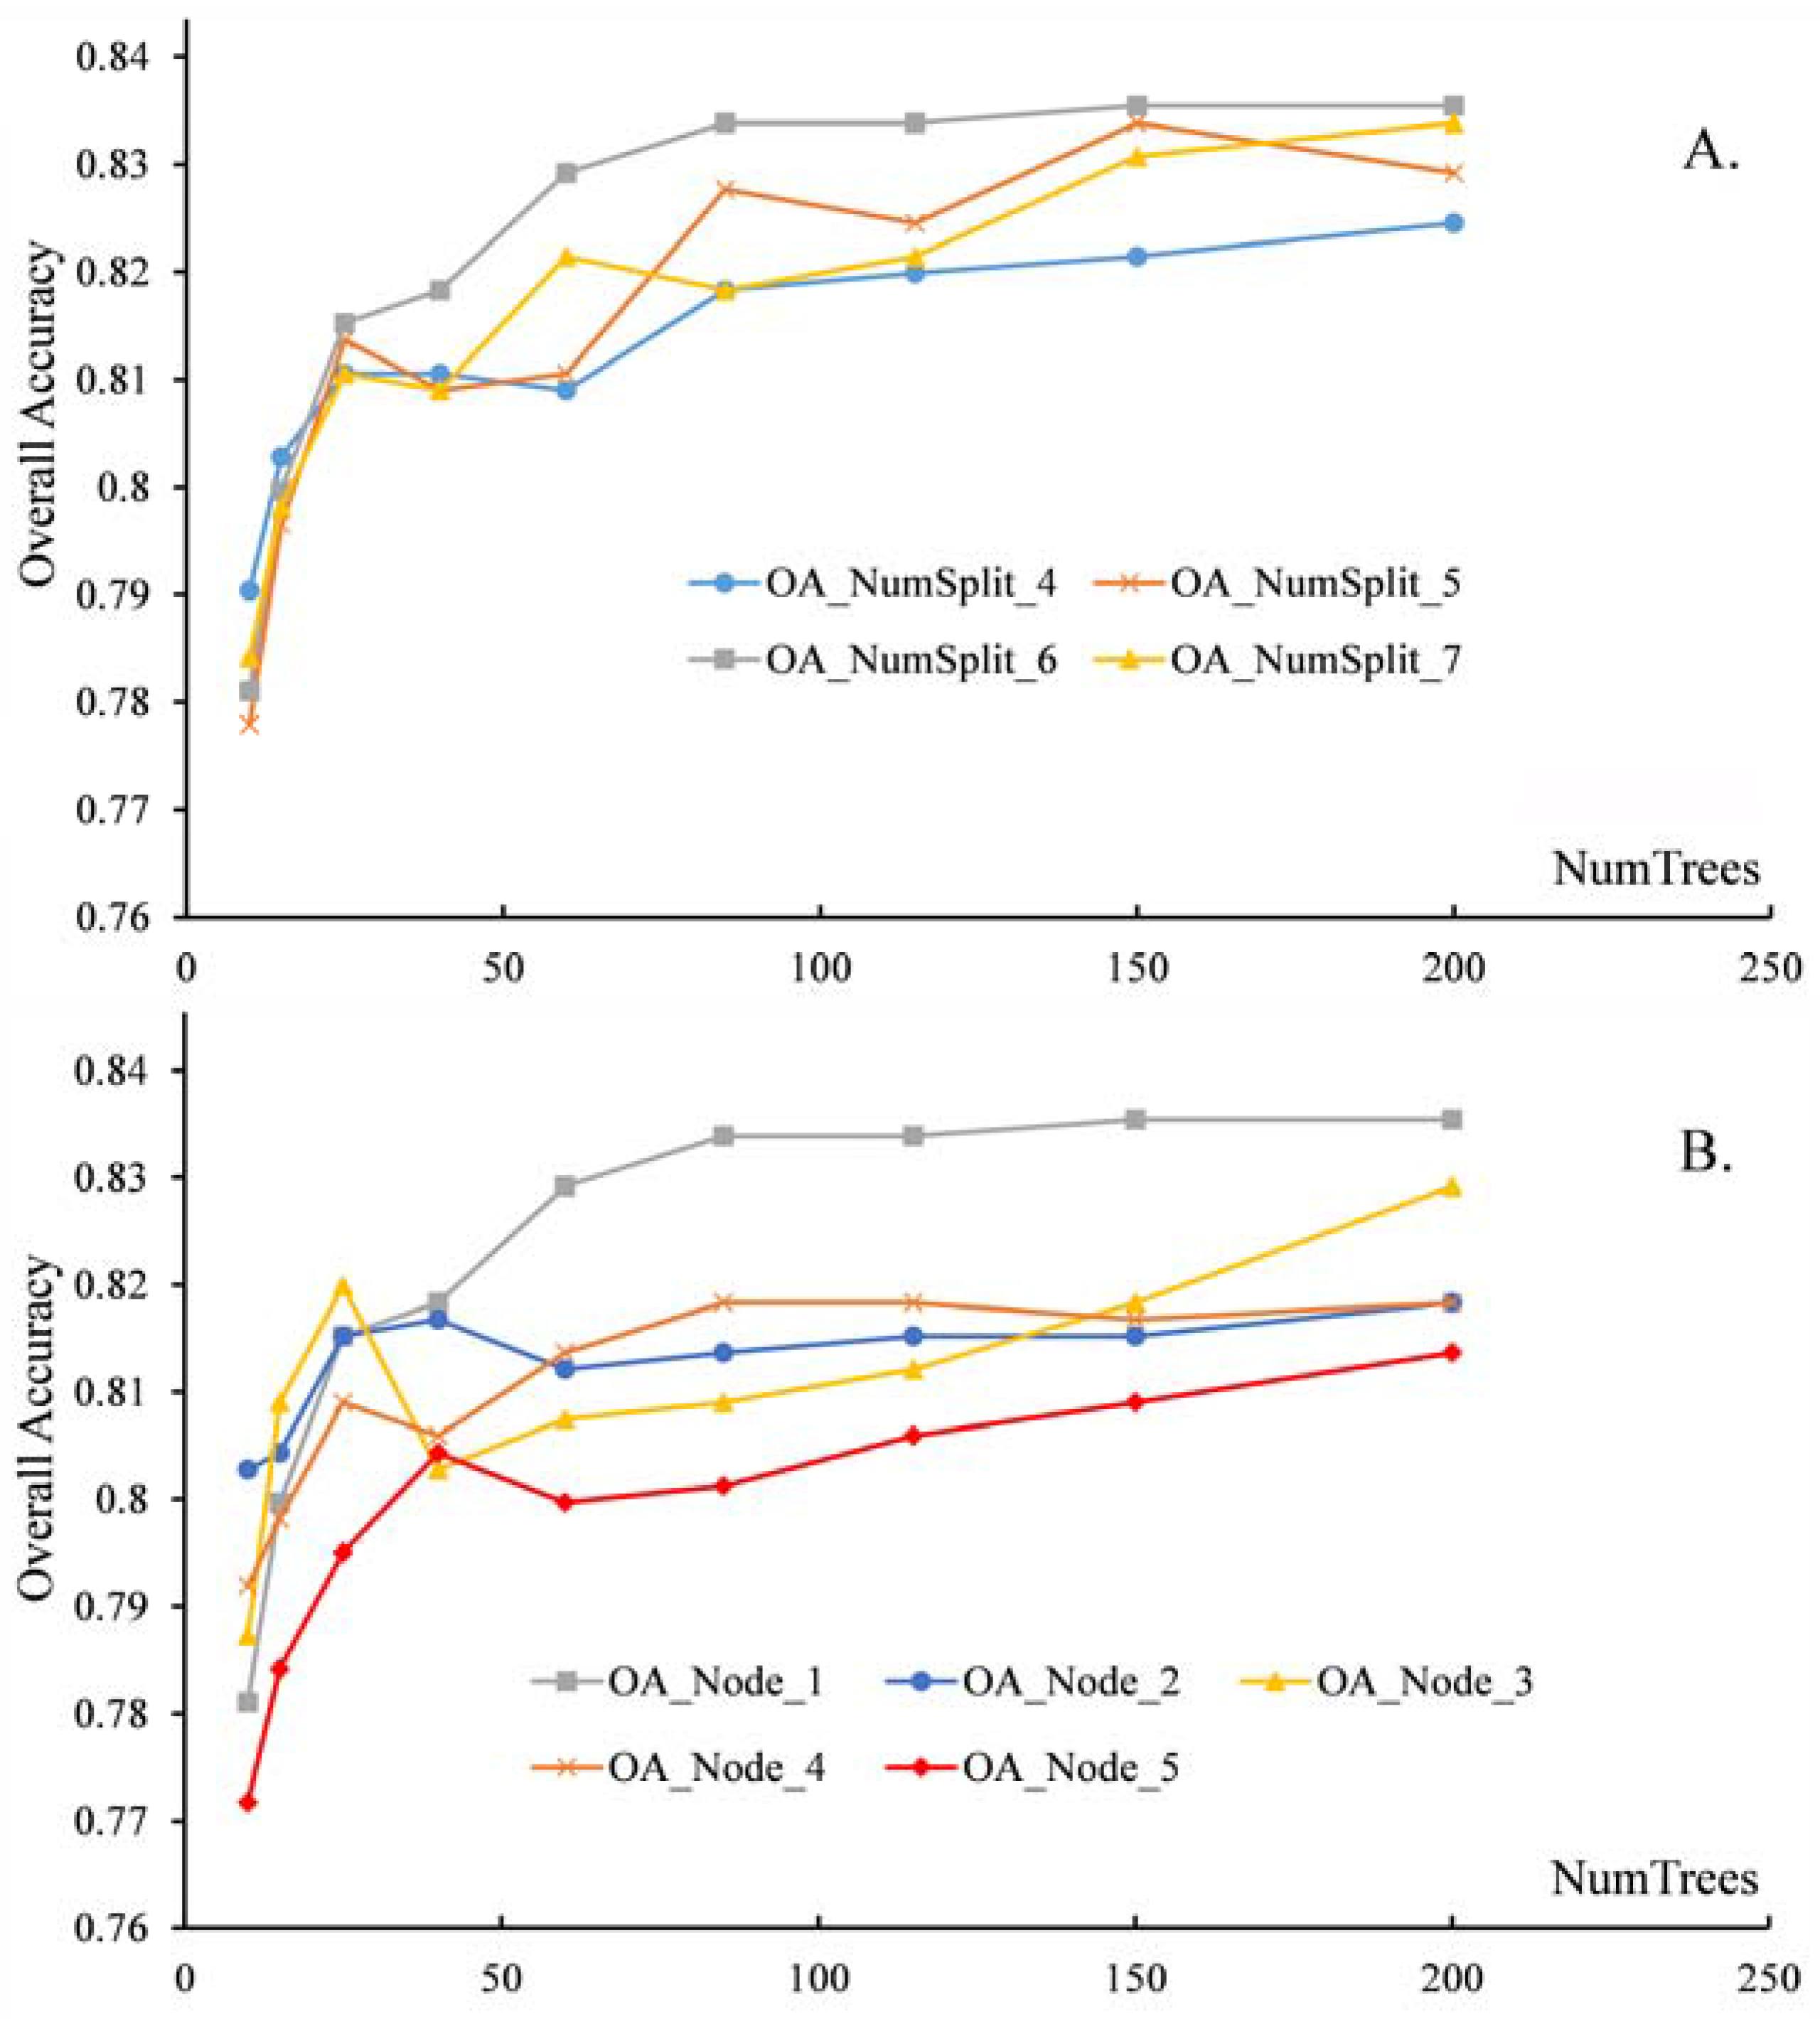
2.4. Land Cover Mapping, Post Classification, and Land Change Analyses

We applied the random forest (RF) classifier to classify the land cover in 2000 and 2010 using five combinations of the input variables [14,42,43,44]. The combinations include: C1, Landsat surface reflectance (SR) and topographic variables; C2, Landsat SR, Vegetation Indices (VI), and topographic variables; C3, Landsat Top-of-atmosphere (TOA) reflectance, VI, and topographic variables; C4, Landsat SR, VI, SAR, and topographic variables; and C5, Landsat TOA reflectance, VI, SAR, and topographic variables. Since SAR data is only available for the year of 2010, we derived 3 classification models for the year of 2000 while 5 models for 2010. We treated SAR data as input variables, combined in parallel with optical data and terrain variables, to train the random forest classifier. We then quantified classification accuracy based on the testing datasets using overall classification accuracy, producer’s accuracy, user’s accuracy, and Kappa statistics. The optimization of the parameters chosen in the RF classifier was according to the overall accuracy and the efficiency (Figure A2). In order to assess the importance of input variables in the classification, we applied the Boruta algorithm for feature selection [45] via an iteration process (R package ‘Boruta’). In the post classification, we manually filled the gaps due to residuals of cloud cover in mountain peaks by digitizing from the high-resolution aerial photos. We also checked and corrected the misclassifications among rock, sand, and impervious surface.
To investigate the decadal change in LCLU, we calculated the land change transition matrix and created the land change transition map based on the newly produced land cover maps of 2000 and 2010. To validate the decadal change, a separate independent dataset of land cover change including 607 ground truthing points was stratified-randomly collected by visually interpreting the land cover changes from 2000 to 2010 in the high-resolution images. The changes on the high-resolution images were compared to the corresponding calculated land cover changes to produce an accuracy assessment for land changes.
The spatial patterns of deforestation, i.e., the conversion from forest (including forests and forested wetlands) to non-forest, and reforestation/afforestation during 2000–2010 were analyzed. For comparison, a forest change map for the period of 1991–2000 was also created according to the historical land cover map of 1991 and 2000 derived from the Landsat TM and ETM+ using decision-tree classifier [29,40]. To quantify the rates of forest change along the gradients of forest coverage, we divided the main island of Puerto Rico into non-overlapping grid cells according to three window sizes, i.e., 25 × 25, 50 × 50, and 100 × 100 pixels, and cross-tabulated the forest/non-forest maps of the years of 2000 and 2010 at each scale. The annual rate of forest change in each grid cell was calculated as [46], R y r = ( 1 / ( t 1 t 0 ) ) ln ( F 1 / F 0 ) , where R y r is the annual rate of forest change, F 1 and F 0 denote the forest cover in 2010 ( t 1 ) and 2000 ( t 0 ), respectively. The annual rate of forest change estimated based on two dates may be biased due to the ‘noise’ from various sources. Estimating at the scales of 0.75 × 0.75, 1.5 × 1.5, and 3 × 3 km2 would partially eliminate ‘noise’ at pixel level. We calculated the forest change rates for 16,000, 4000, and 1004 grid cells with land pixels greater than 25% of the three window sizes, respectively. Relationship between forest coverage and annual forest change at each scale was explored.
Human activities and vegetation spontaneous regrowth are highly related with geomorphology. To understand how the spatial distributions of land change vary with the topography slope, we calculated the land transition matrix for each of the slope categories with the break values of 1°, 3°, 5°, 10°, 15°, 20°, 25°, 30°, and 35°, respectively. Protected areas have been established in various ecological life zones in Puerto Rico to preserve zonal forests and conserve biodiversity. To test the hypothesis that the LCLUC activities were lower inside the protected areas than those outside, we quantified and compared LCLUC within the protected areas and those within the 500-m and the 1000-m buffer zones surrounding the protected areas.

3. Results

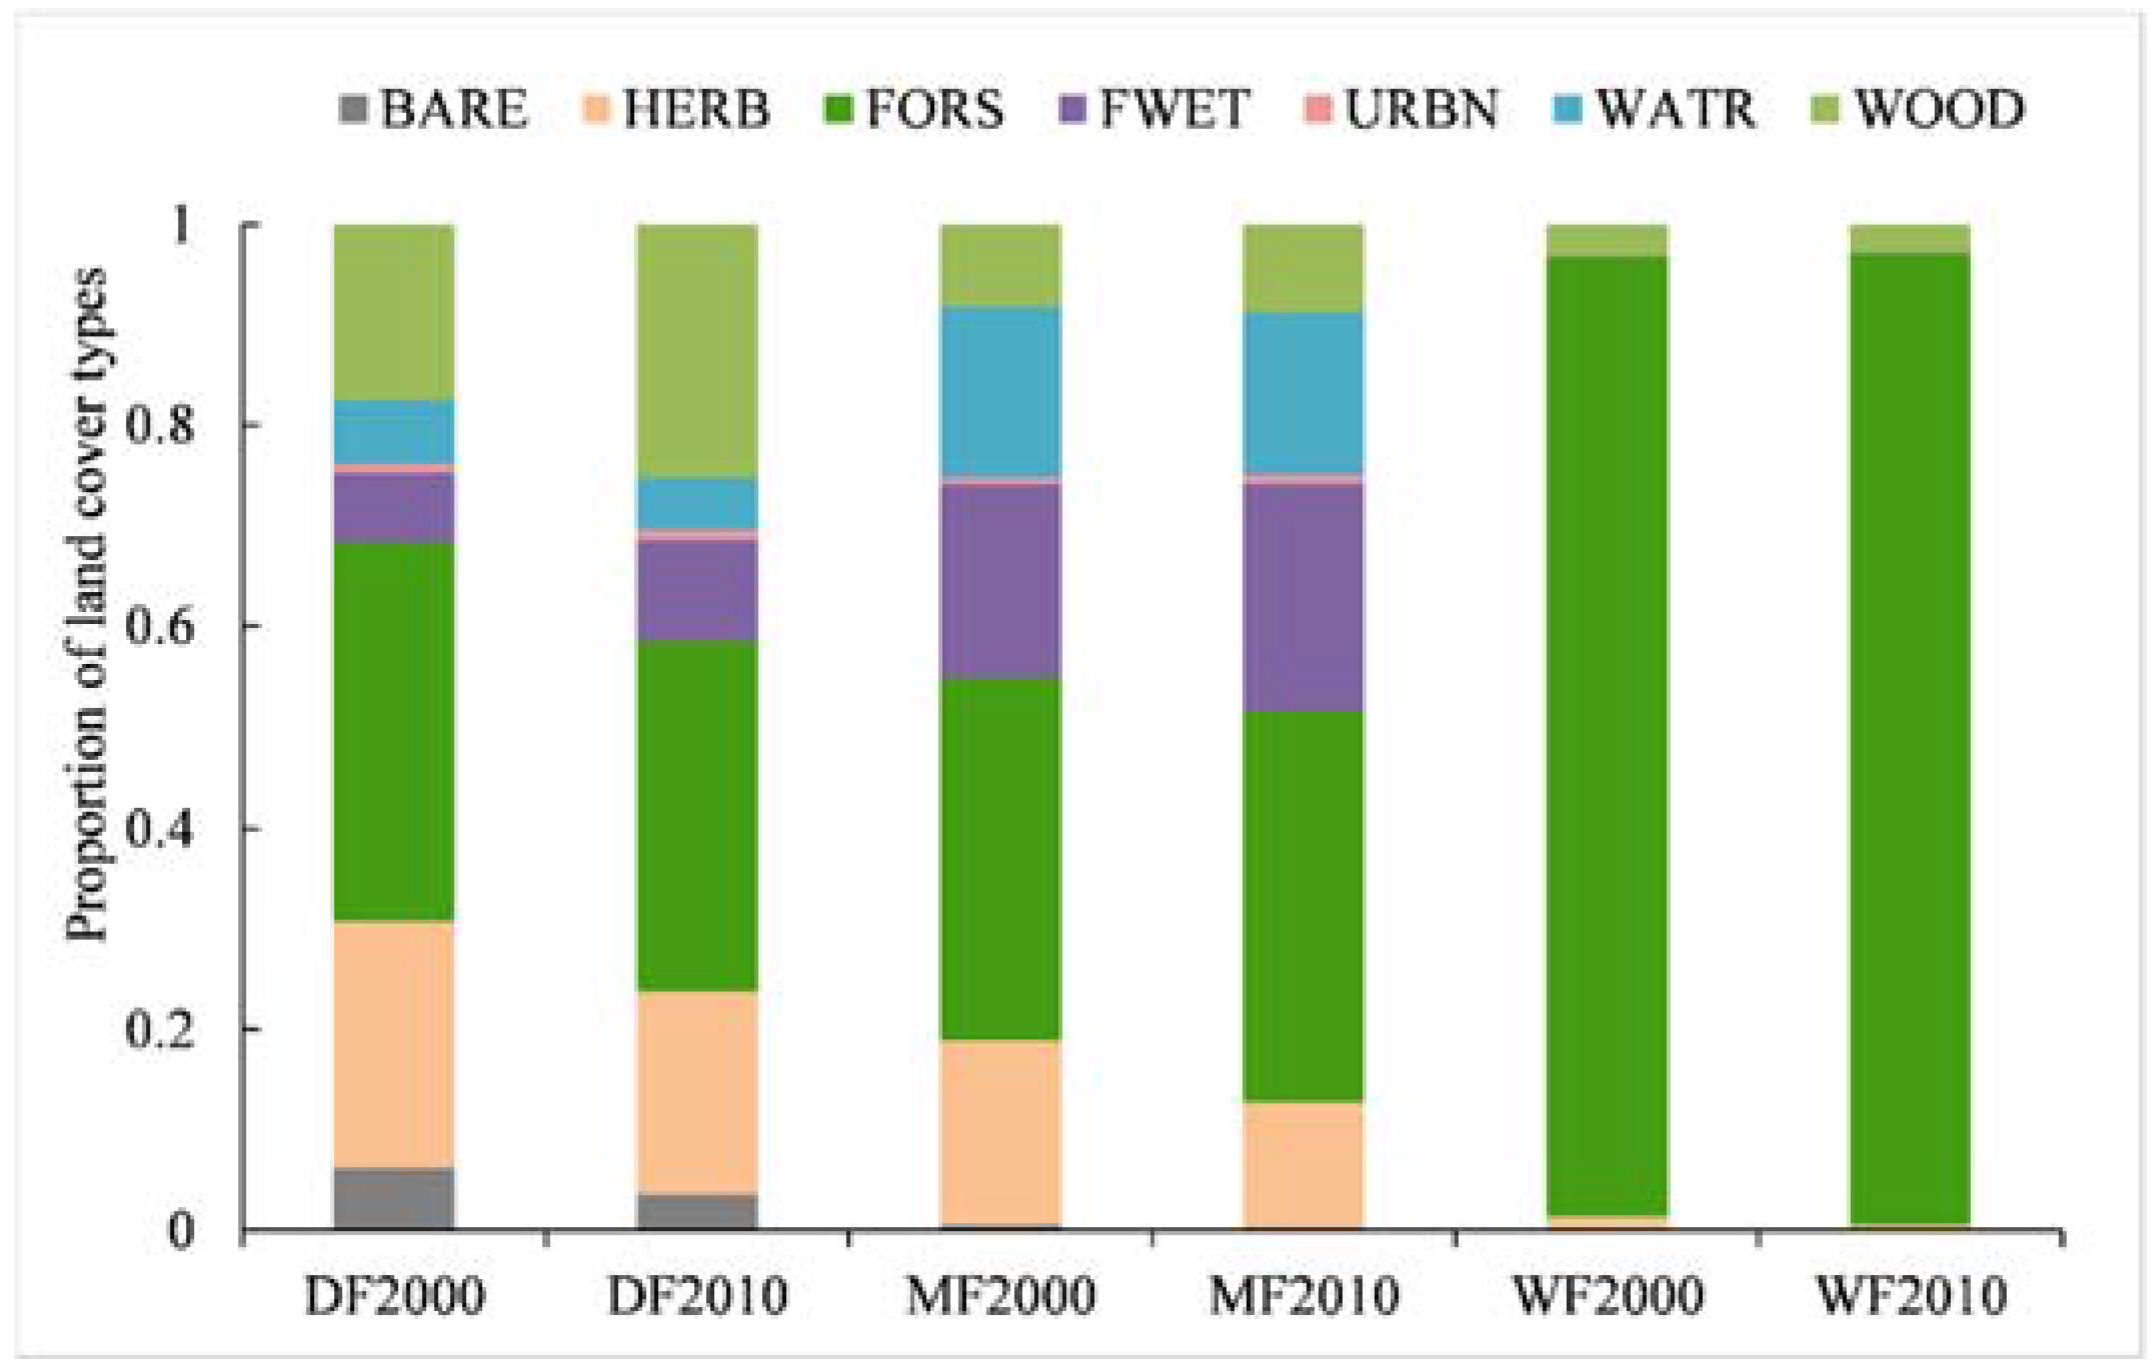
3.1. Land Cover Classifications in 2000 and 2010

The classification models achieved high overall accuracies with 92.1 ± 0.9% and 91.8 ± 0.9% for the years of 2000 and 2010, respectively (Table 1). The average producer’s and user’s accuracies of most land cover types are larger than 80%, except for the closed shrubland and the coastal woodland. For the year of 2000, the highest overall accuracy (93.0%) and Kappa statistic (90.8%) were achieved with the input dataset C3 consisted of the TOA reflectance, VI, and terrain variables. For the year of 2010, the Kappa statistic achieved 89.9% and 90.5% for C4 and C5, respectively, when the SAR data was included in the inputs. The closed shrubland of 2010 has average producer’s accuracy of 68.7 ± 3.0% and was easily misclassified as pasture or coastal woodland. The coastal woodland has the lowest producer’s accuracy of 64.2 ± 5.4% and was likely misclassified with the closed shrubland or the forest. The C3 for 2000 and C5 for 2010 with TOA reflectance had the best overall accuracy and the highest Kappa statistic, therefore they were applied to create the land cover maps of the two years, respectively. The variable importance analysis by the Boruta algorithm showed that all input variables are important in the classification and the terrain, optical spectral features, and VIs play more important roles in the classification than the SAR-related variables (Figure A3). The full confusion matrix (Table A2) showed that the addition of SAR largely enhanced the recognition of the urban area, from 33 to 39 out of 43 ground-truthing points, and although the accuracies of forest and herbaceous cover are already very high, both greater than 96%, the addition of SAR still contributed to increasing the recognition from 178 to 179 out of the 185 forest ground points and from 186 to 187 out of the 190 points for herbaceous cover.

3.2. Land Cover Changes between the Years of 2000 and 2010

The montane and coastal woodlands and closed shrubland were combined into woodlands, and the forest and forested wetland into forests in the evaluation of land conversions (Table 2). The results showed that bare ground was mainly converted to herbaceous agriculture/pasture (35.6 km2) and urban land (34 km2). Herbaceous agriculture/pasture was mainly changed into woodland (517.2 km2), forests (374.8 km2), and urban land (142.9 km2). Woodland was mainly changed into forest (352.8 km2) and herbaceous agriculture/pasture (257.8 km2). Herbaceous agriculture/pasture has a net loss (624.4 km2, 21.7%) in this period, giving rise mostly to the expansions of forests (311.5 km2, 7.8%) and woodland (197.3 km2, 18.7%). The urban land also obtained an increase of 198.8 km2 (26%) in total area. However, bare ground and water decreased by 72.9 (65.2%) and 10.3 km2 (11.4%), respectively. The analysis of forest transitions revealed that approximately 89.2% of the forests in 2000 remained in 2010 with the other 10.8% changed mostly to woodland (297 km2) and herbaceous agriculture/pasture (123.5 km2). Reforestation/afforestation also occurred with 374.8 km2 from herbaceous agriculture/pasture and 352.8 km2 from woodland in 2000. The combined outcome of deforestation (432.6 km2) and reforestation (744.1 km2) resulted in a 7.8% net increase in forests during this period.

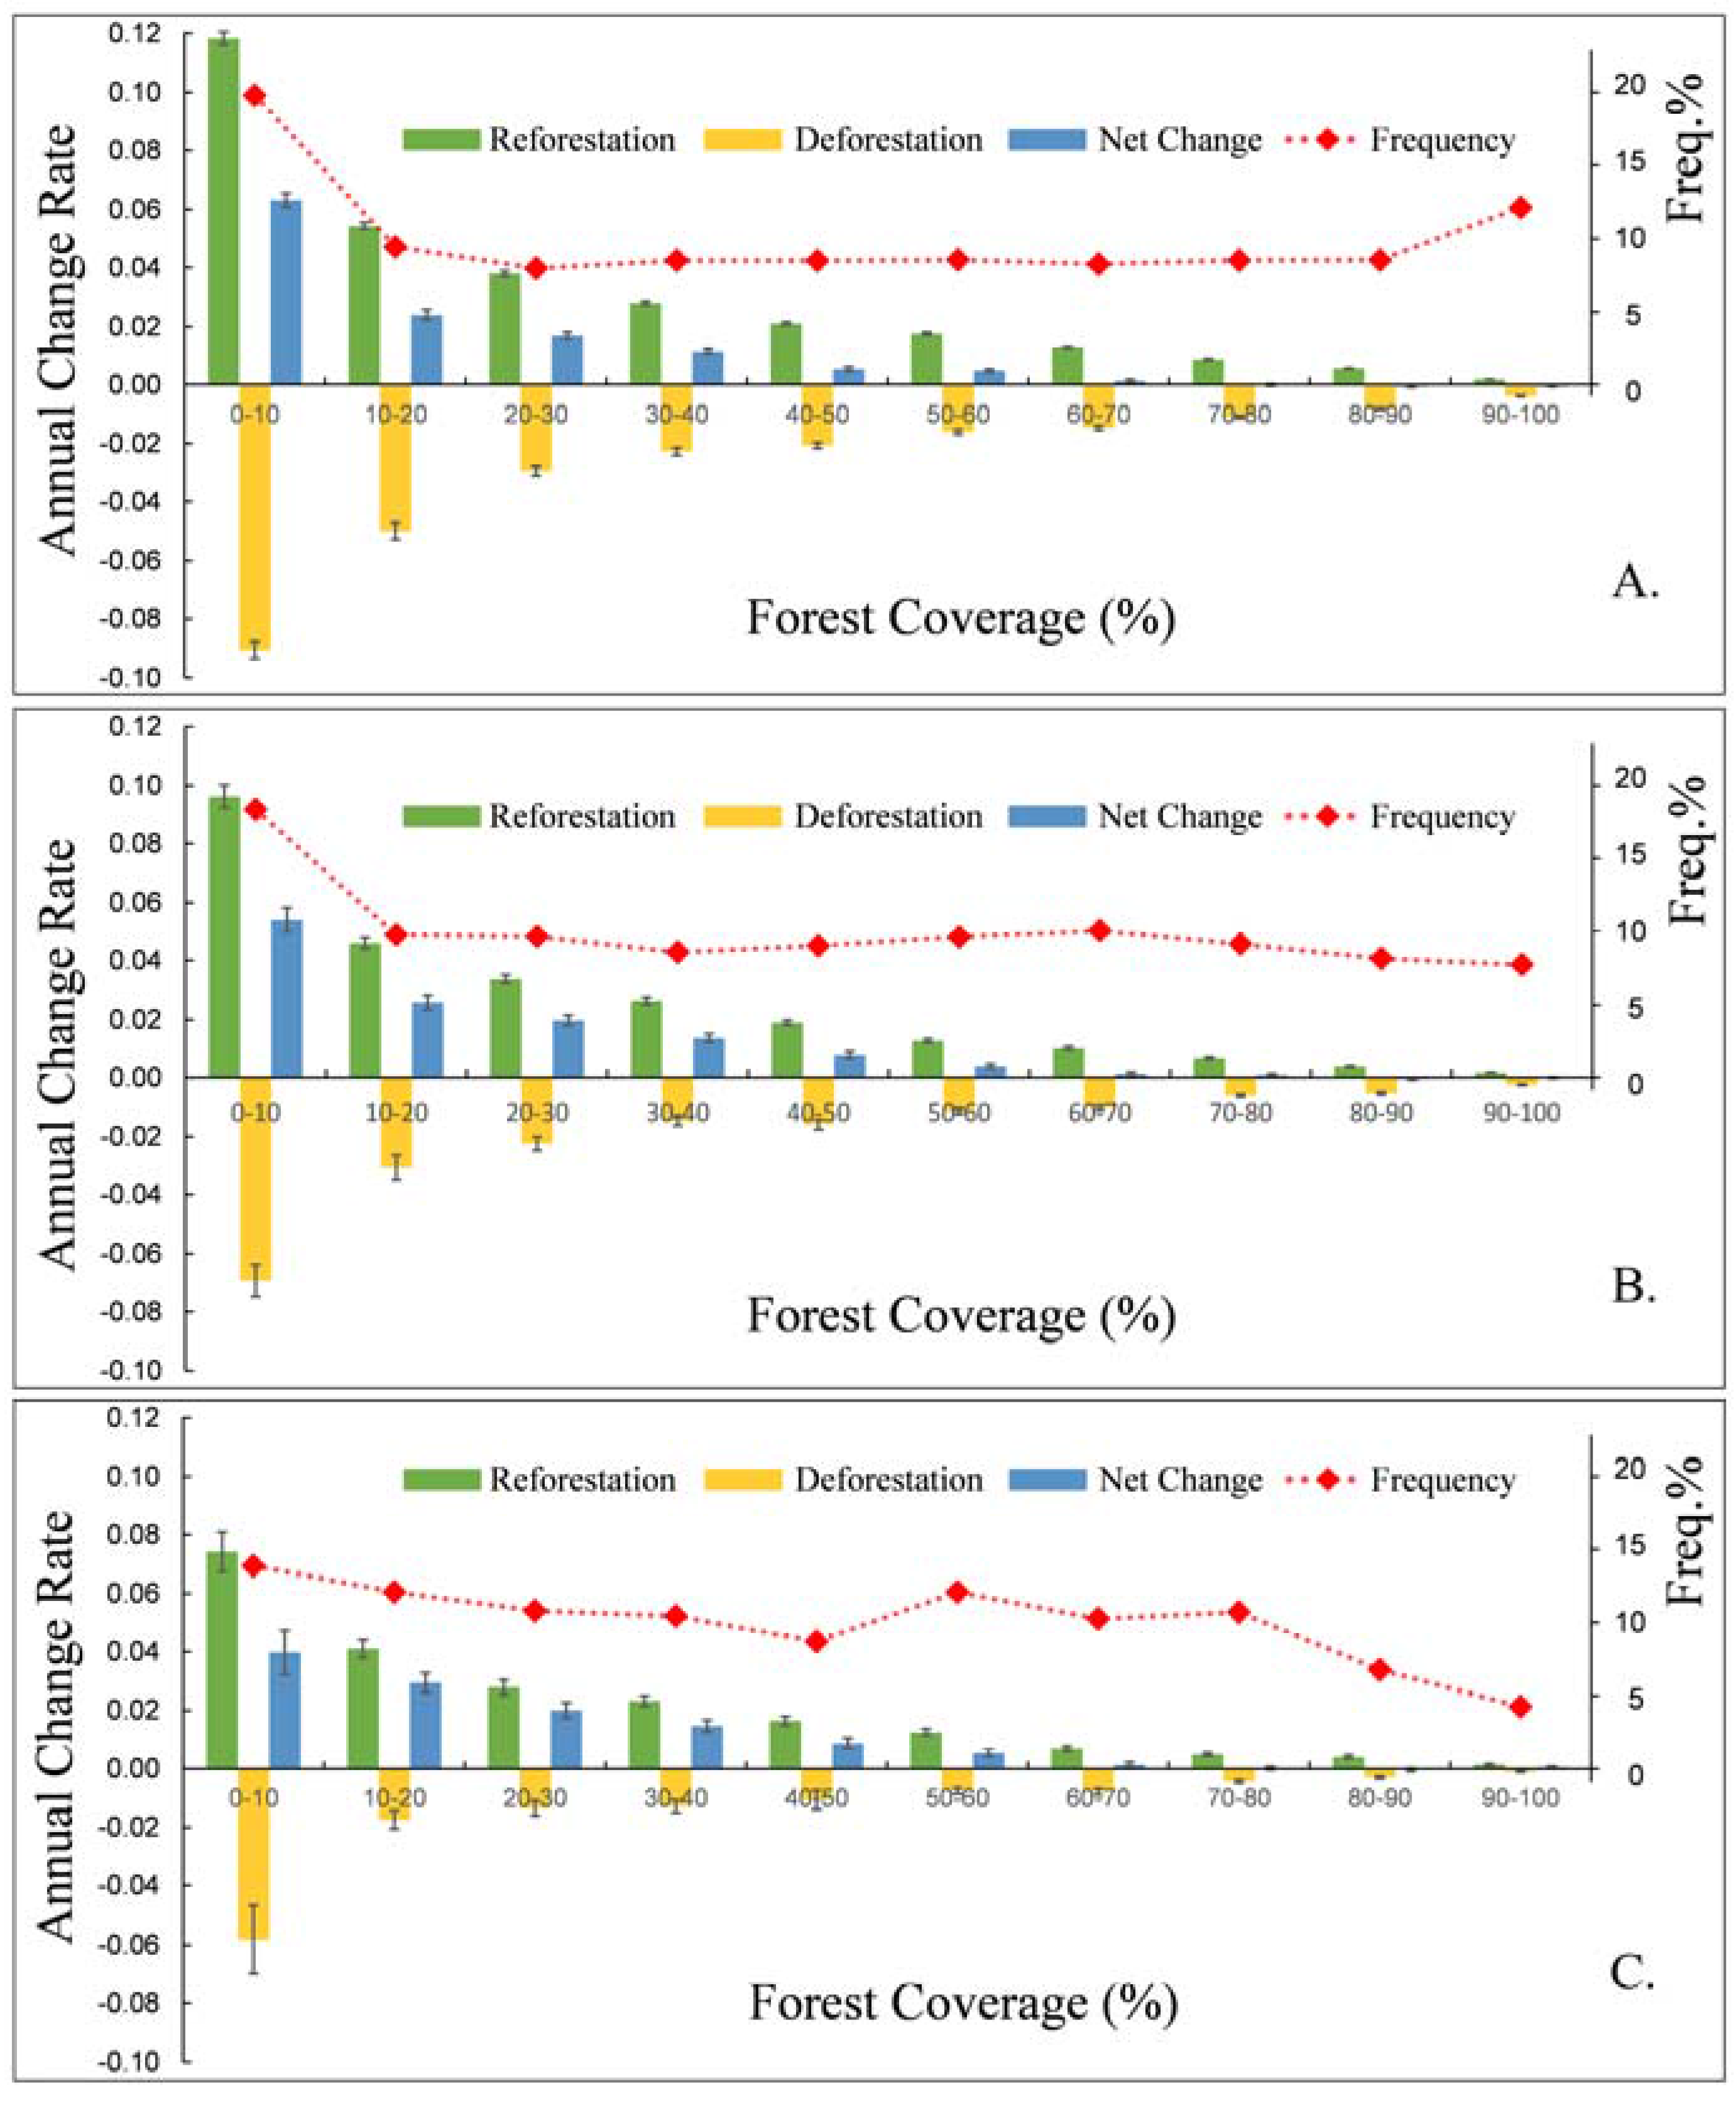
3.3. Spatial Distribution of Forest Changes from 2000 to 2010

The distribution of deforestation and reforestation in 2000–2010 were highly heterogeneous (Figure 3B). The reforestation sites were mostly clustered in the east and the deforestation sites were scattered in the central mountains and the south. The forest change activities (deforestation plus reforestation) in 2000–2010 were much lower than those in 1991–2000, i.e., 1176.6 km2 in areas in the former period versus 1529.6 km2 in the latter period. The deforestation area reduced from 746.9 km2 in 1991–2000 to 432.5 km2 in 2000–2010 (42.1%).
During 2000–2010, the annual rates of deforestation and reforestation both decreased with the increased forest coverage across the three window sizes, i.e., at the scales of 0.75, 1.5, and 3 km (Figure 4). The highest rate of deforestation, 5.8–9.1% year−1, and that of reforestation, 7.4–11.8% year−1, both occurred at the forest coverages of 0–10%. The net change rates of forest were positive and declined with increased forest coverage. The validation of the land changes using an independent dataset indicated an overall accuracy of 78.1% and a Kappa statistic of 75.7%.

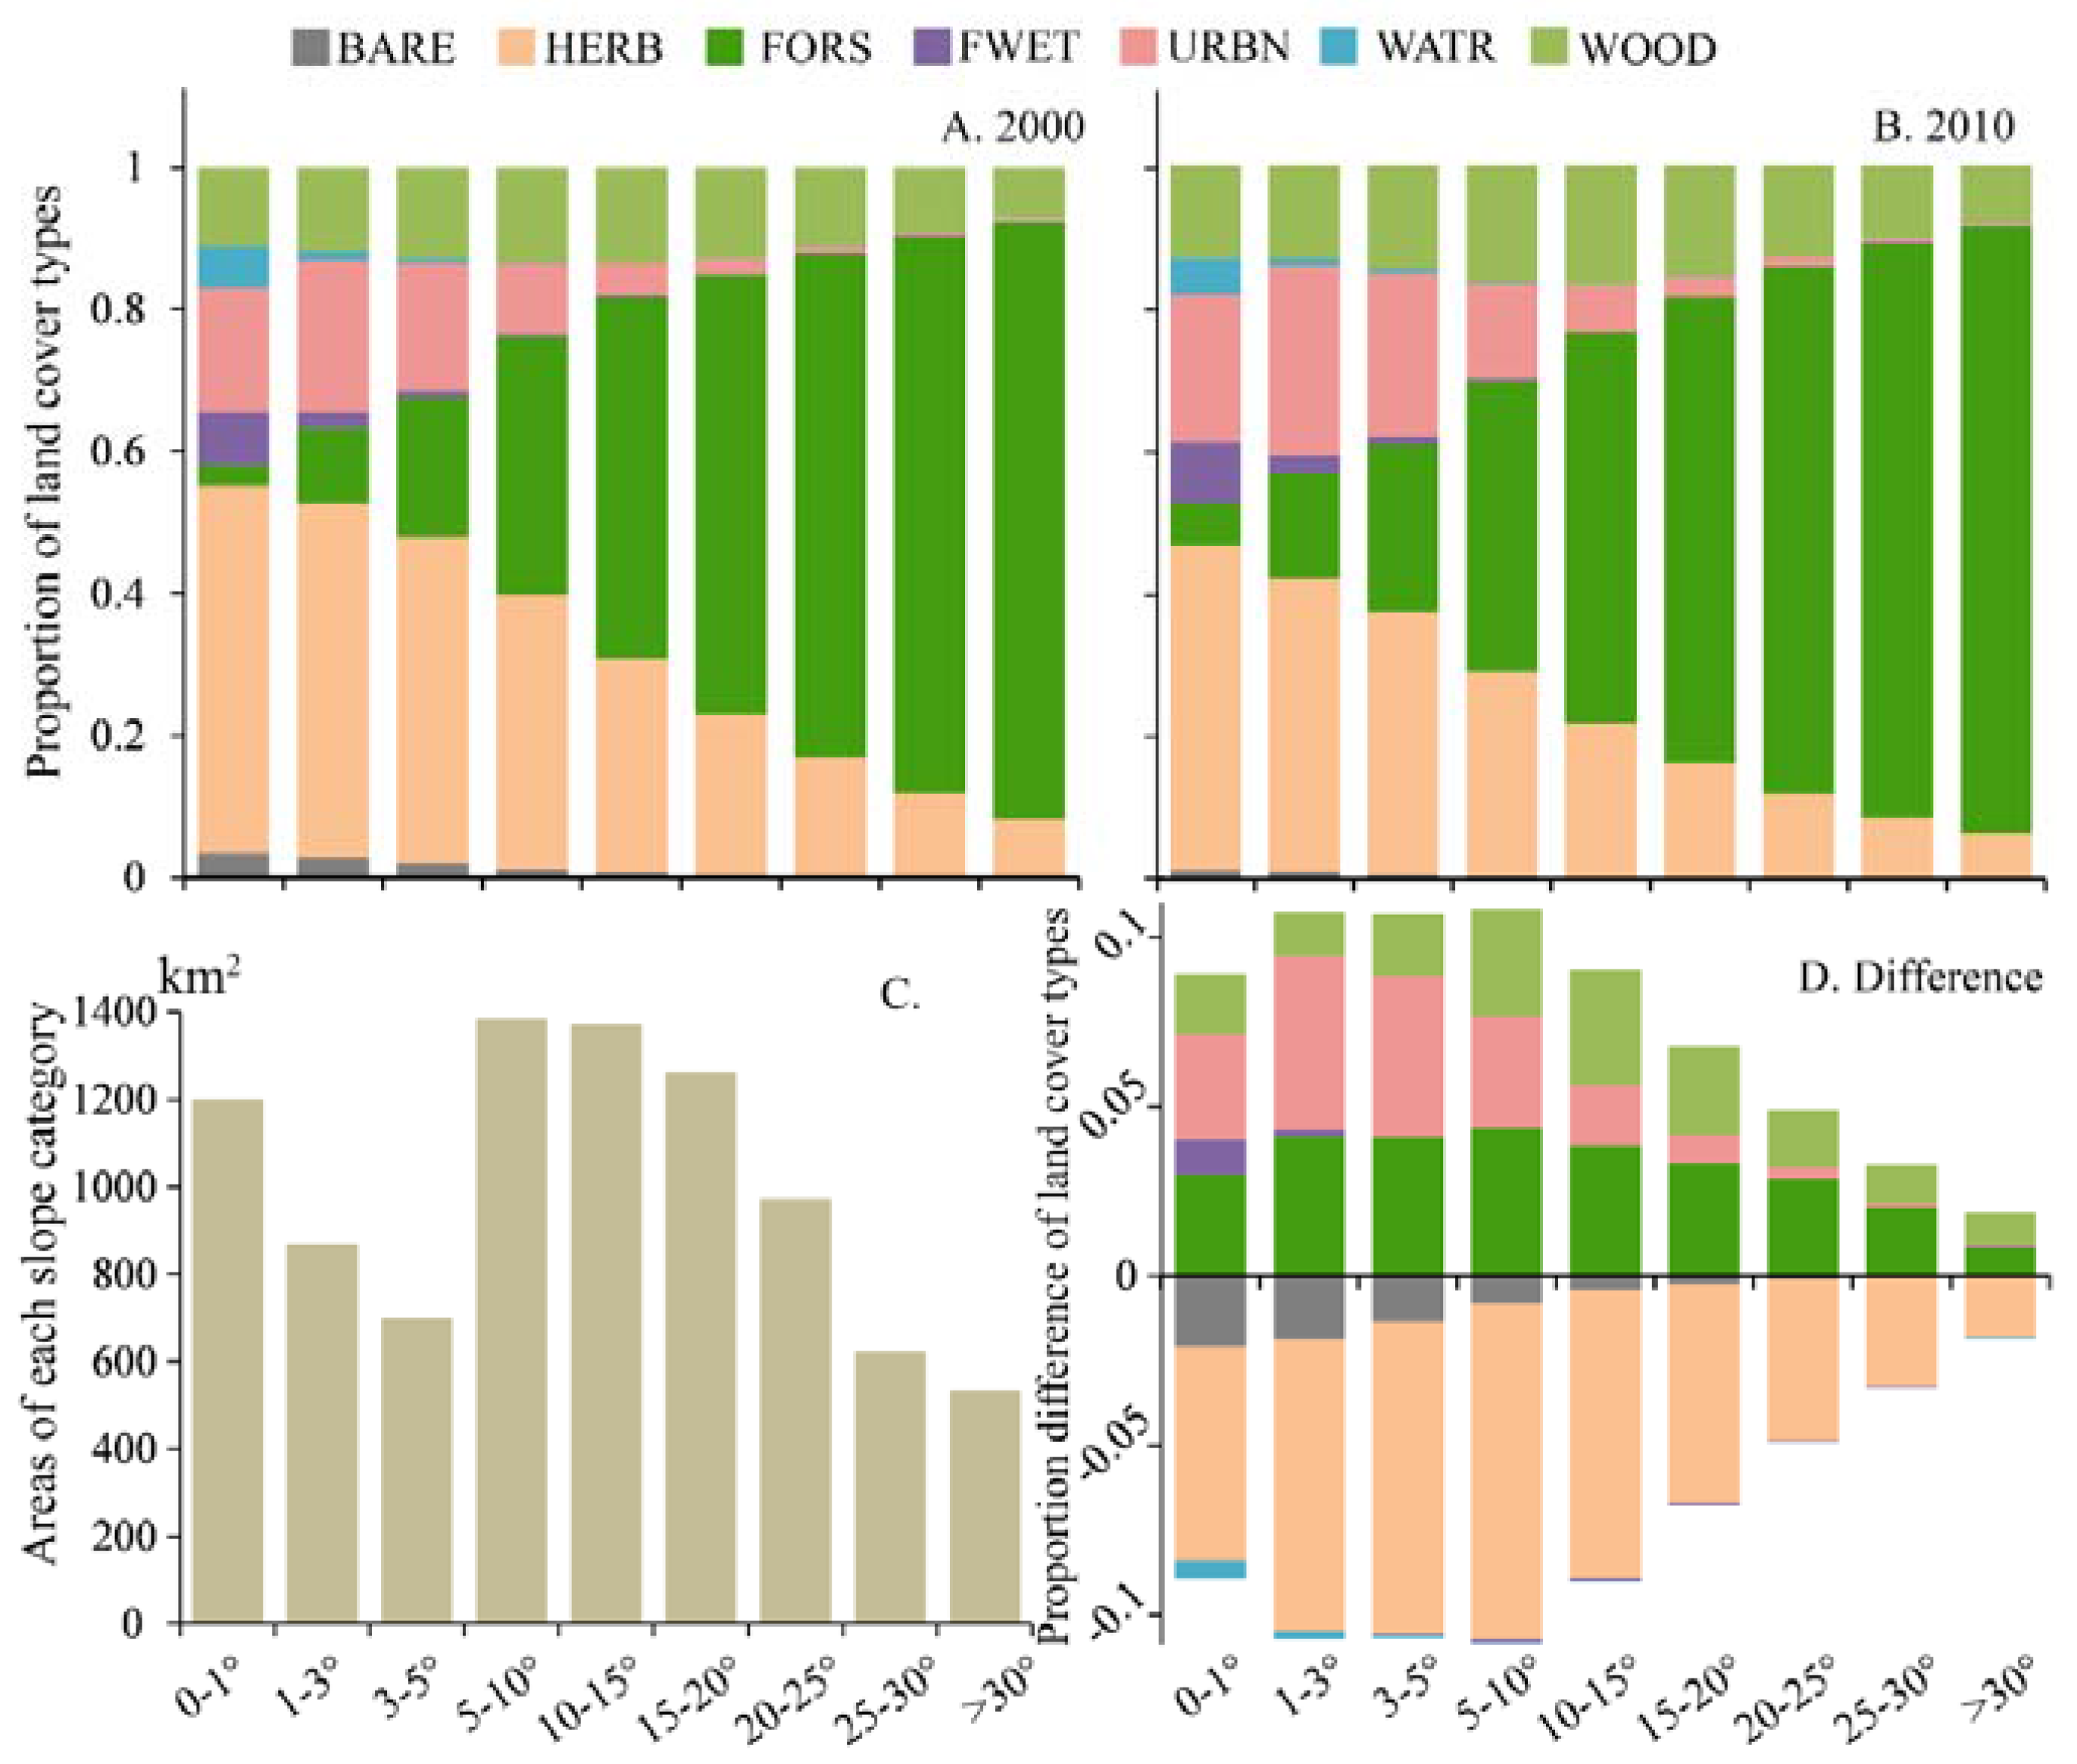
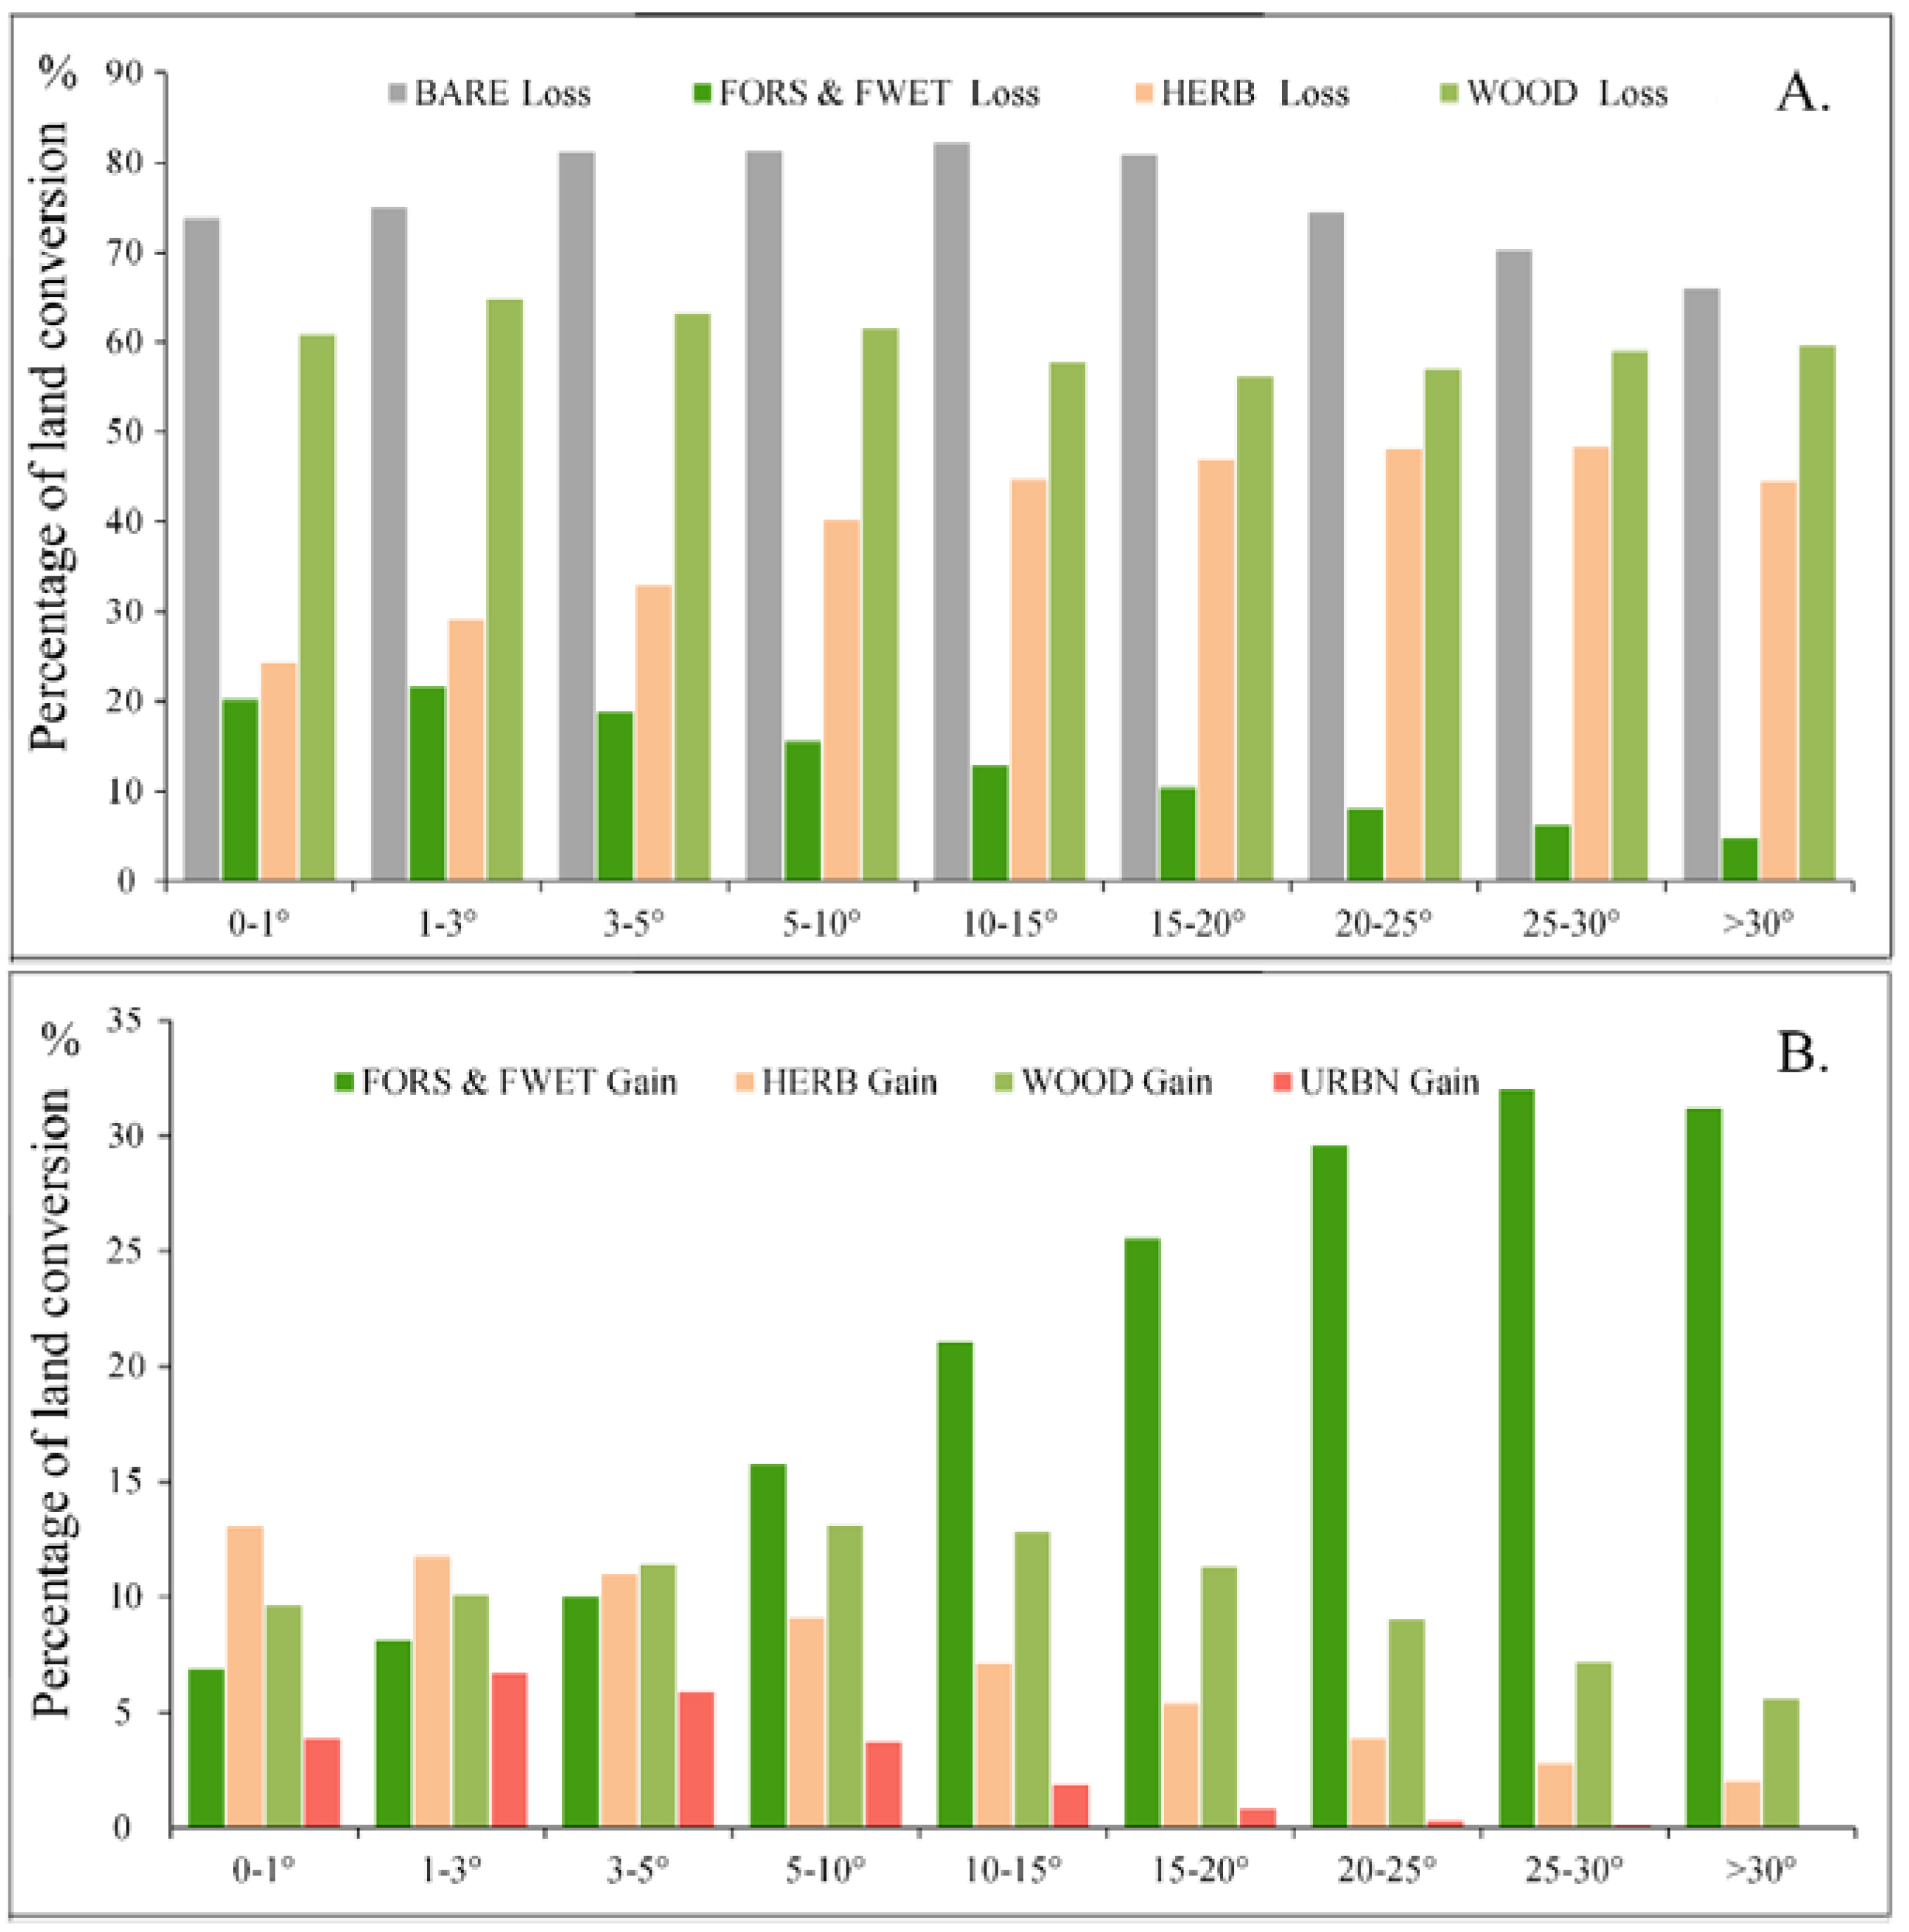
3.4. LCLUC Along the Slope Gradient

The distribution of LCLU along the slope gradient showed similar patterns in 2000 and 2010 (Figure 5A,B). Herbaceous agriculture/pasture and urban areas dominated the flat regions with the slopes lower than 5°. Forested wetlands and water were mainly at the areas with slopes lower than 3° and decreased quickly with the increase of slope. Forests started to take over herbaceous cover when slopes are moderate, i.e., 5°–15°, and increased steadily with the slope. Woodlands distributed evenly across the slope gradient. Herbaceous covers decreased but forests, urban area, and woodlands increased from 2000 to 2010 across the slope gradient (Figure 5D). Changes in land cover were prominent with the slopes of 1°–10° and then declined with the slope (Figure 5D).
Land conversions also differed along the slope (Figure 6). The loss of forest to other land cover types presented a decreasing trend with the increase in slope, while the loss of herbaceous cover showed a reversed trend (Figure 6A). Bare grounds showed the largest percentage of conversion. The conversion of woodland was steady around 60% along the slope gradient. The percentage of conversion to forests increased largely along the slope, which reached over 30% when slopes are greater than 20° (Figure 6B). In contrast, the percentage of conversion to herbaceous cover steadily declined. The gain of urban land was concentrated on relatively flat slopes (Figure 6B), indicating urban sprawl was much more intense on gentle slopes than on steep slopes.

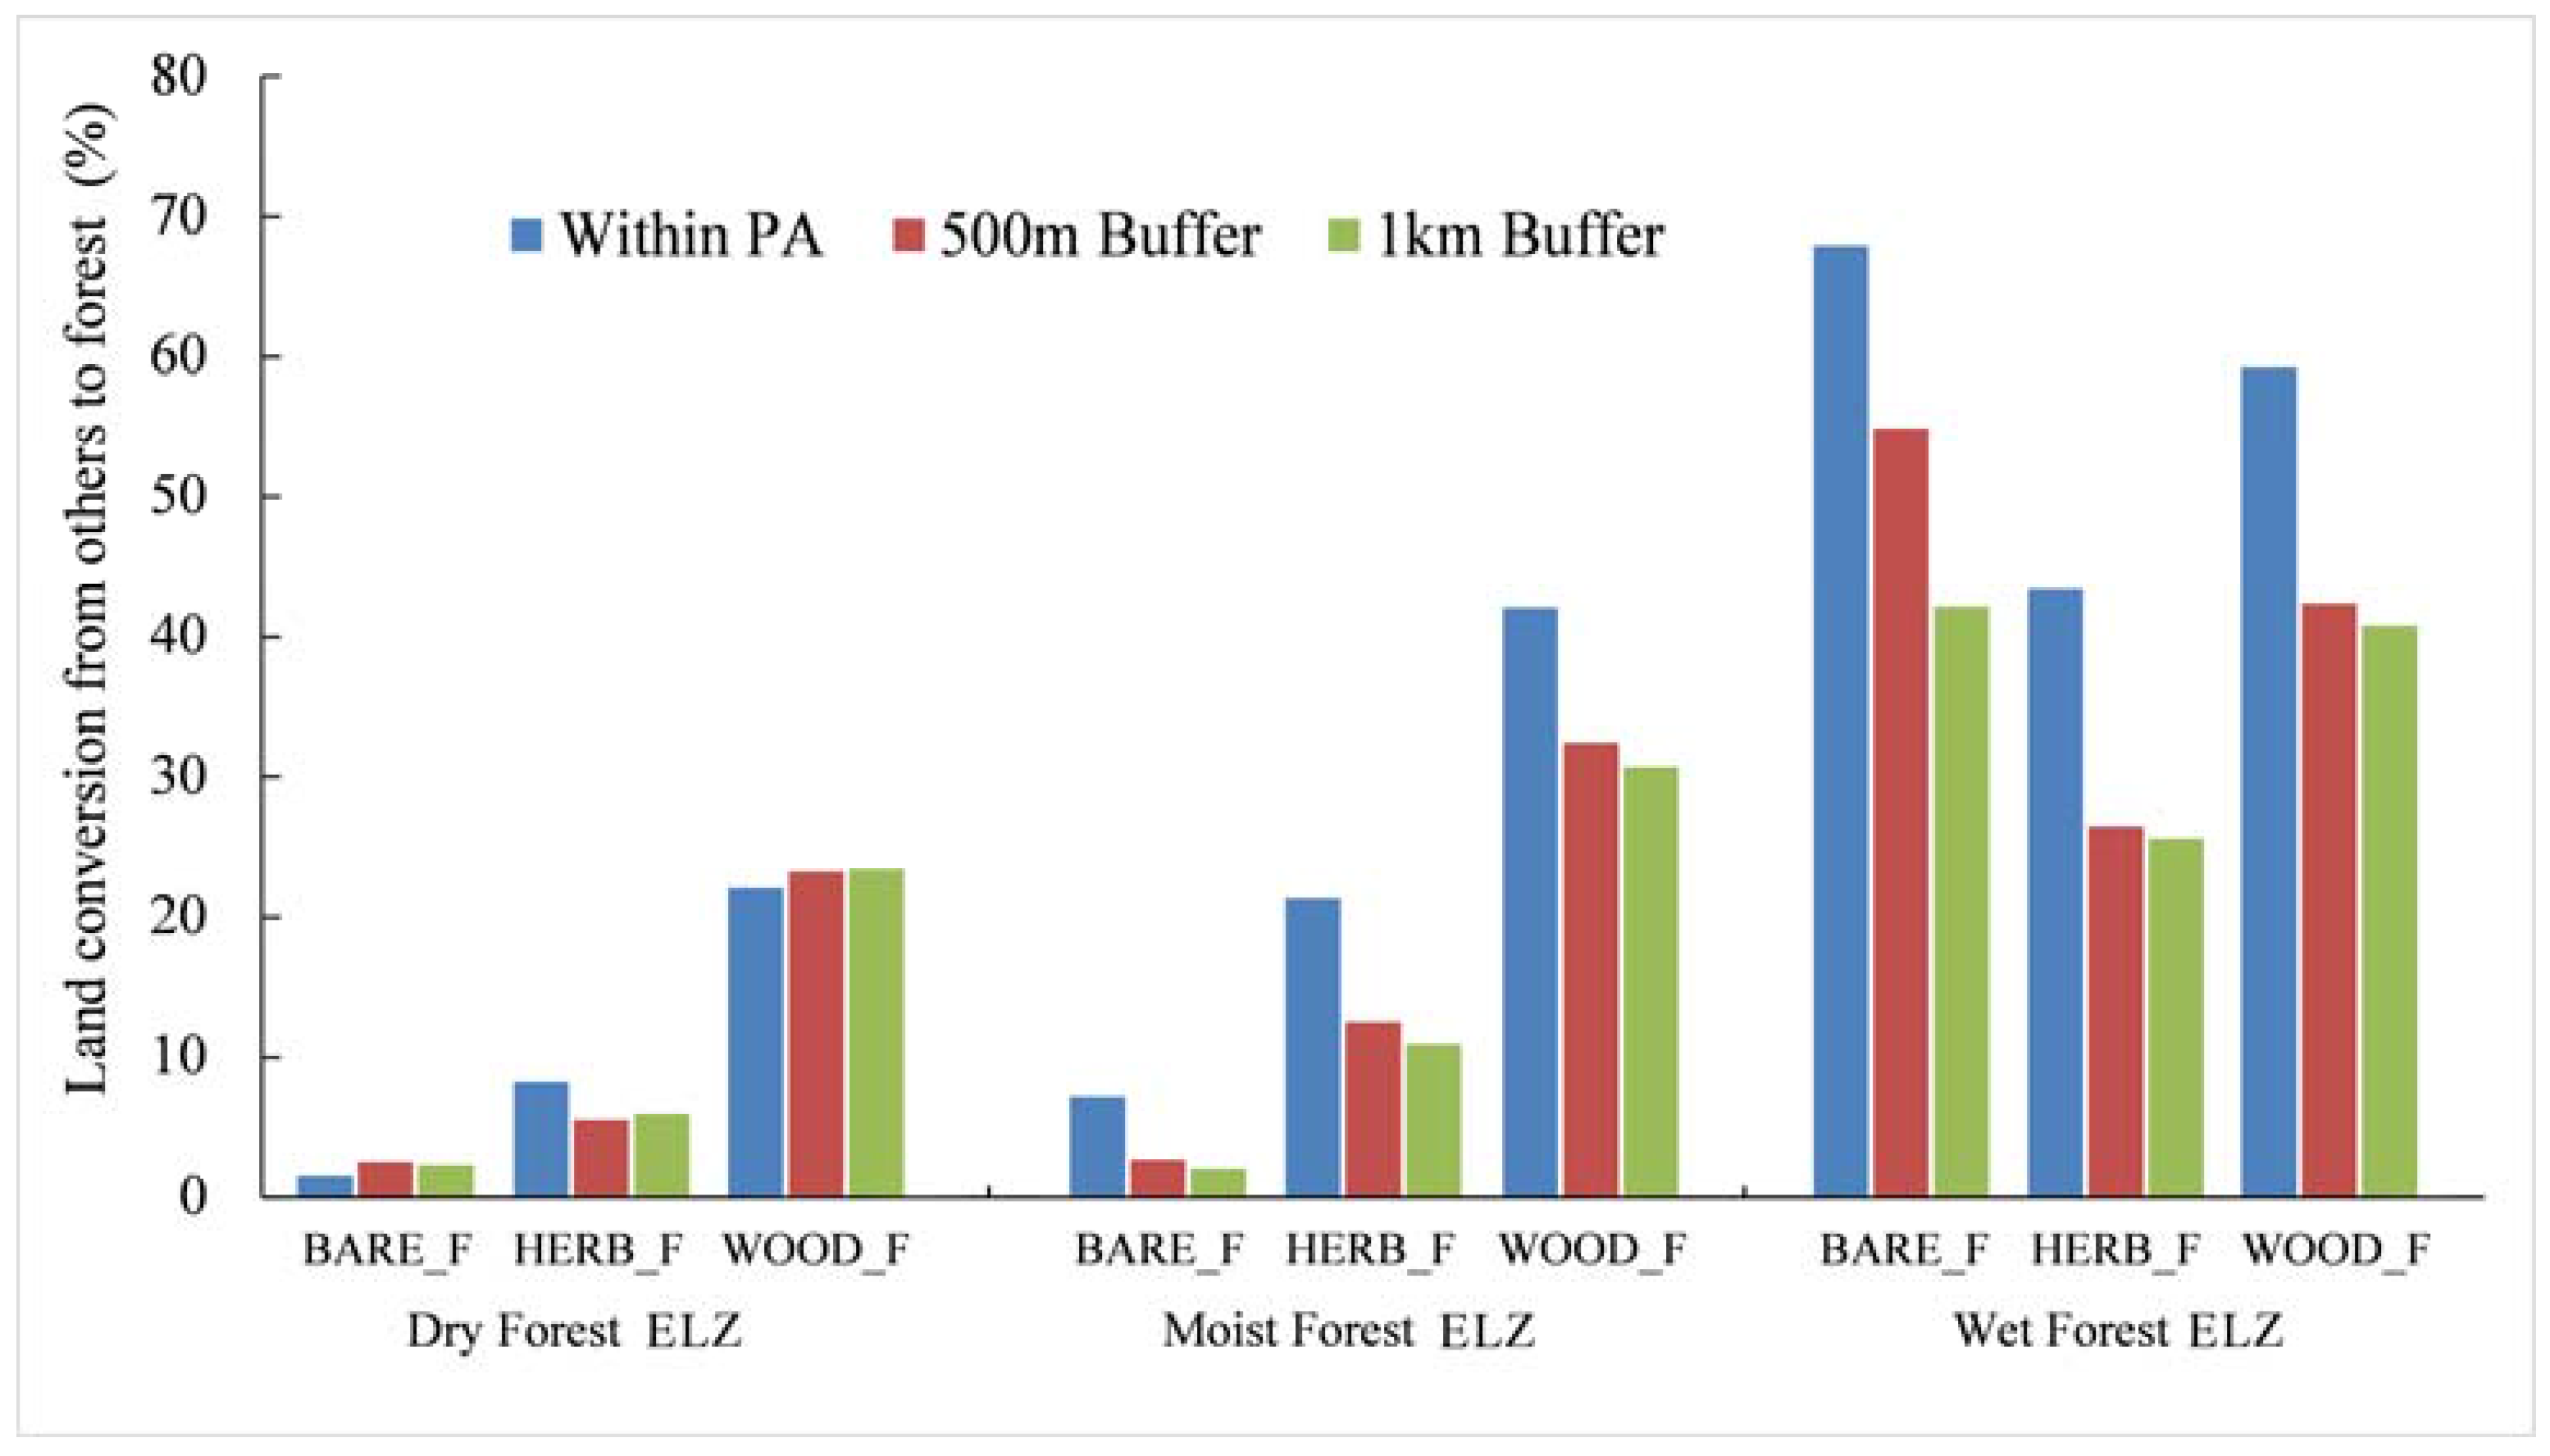
3.5. LCLUC Within and Surrounding the Protected Areas

The proportion of each LCLU type in protected areas varied among the three ecological life zones (Figure 7). In the dry forest ecological life zone (DF), forest (37.5%), herbaceous agriculture/pasture (24.5%), and woodland (17.6%) were dominant inside the protected areas in 2000. From 2000 to 2010, the land changes within the protected areas in DF mainly showed the increments of woodland (43.8%) and forested wetland (43.6%), but the decreases of bare ground (42.3%) and herbaceous agriculture/pasture (17.7%) (Figure 7 and Table 3). Forest (36%), forested wetland (19.2%), herbaceous agriculture/pasture (18.3%), and water (17%) dominated the protected areas in the moist forest ecological life zone (MF) in 2000. During the decade, forest and forested wetland expanded by 8.1% and 17%, respectively, while herbaceous agriculture/pasture declined by 31.3% in MF (Table 3). Forest accounted for 95.3% of the protected areas in the wet forest ecological life zone (WF) in 2000, and continued to expand slightly (1.3%) with the decreases in the herbaceous cover and woodland during the decade. Within the protected areas, the percentages of urban expansion in DF (11.6%) and WF (15.4%) were similar but doubled in MF (30.2%) (Table 3).
Within the protected areas, the percentages of conversion to forests, i.e., reforestation/afforestation, from bare ground, herbaceous cover, or woodland were the highest in the wet forest zone, followed by the moist forest zone (Figure 8 and Table A3). The percentages of conversion to forests were the highest within the protected area, and decreased to some extent at the 500-m and 1-km buffers outside in the wet and moist forest zones (Figure 8).

4. Discussion

4.1. Land Cover Land Use Mapping in the Tropics

Accurate and in-time monitoring of tropical land cover/use changes is urgent due to the rapid deforestation/reforestation in the tropics [7] and the essential roles of tropical ecosystems in the global carbon cycles [18,47,48]. However, persistent cloud covers, inaccessibility to tropical forest sites, and complex topography and landscapes limited the up-to-date mapping of land cover/use in Puerto Rico. To provide LCLUC information in the new century and improve the accuracy, we created cloud-free composite imageries choosing from all available Landsat images during dry seasons, integrated high-resolution DEMs from different sources, and made a comprehensive ground-truthing dataset based on the high-resolution images and orthophotos. We further integrated the optical Landsat data with the L-band SAR data for mapping the land cover in 2010 due to the cloud-penetrating ability of active long-wavelength radar [19]. We achieved very high accuracy in the mapping with the Kappa statistic of 90.8% and 90.5% for 2000 and 2010, respectively.
In this study, we applied the Median summary on the cloud/shade removed scenes to create the consistent cloud-free optical imagery composites. This method makes full use of available images and has been proved to be effective and reasonable [37]. Our results also showed that classifiers with TOA reflectance tend to concur higher accuracy than those using corresponding surface reflectance (Table 1). The limited atmospheric observations in the montane landscapes with persistent cloud cover might fail the retrieval of aerosol optical thickness, which tends to make surface reflectance products problematic [49]. The addition of L-band PALSAR significantly, but not substantially, enhanced the accuracy of LCLU mapping. However, the SAR data may be important for the high peaks in eastern and central mountains where cloud persists for most of the year to obscure the signals of optical sensors. The variable importance test using the Boruta algorithm also confirmed the important role of SAR in the classification (Figure A3). The recognition capability of SAR may overlap with that of the optical sensor in the classification. However, the active microwave of SAR can penetrate clouds and provide all-weather images in day and night. Therefore, the function of SAR is to supplement the obscured optical signals in the eastern and central mountains with persistent cloud cover. Adding SAR to the classification helped improve the accuracies of urban and forest land cover types (Table A2) with strong vertical structure, a feature found for SAR in the previous studies [50]. With the recent free-access to SAR data, such as Sentinel-1, the optical-SAR fusion for LCLU mapping of tropical regions will help improve the accurate and timely monitoring of tropical LCLUC.
Forest coverages are not always in consensus in reports or literature due to the difference in the images used, classification methods, spatial resolution, forest definition, and the scales of the studies. We reported that the forested area in 2000 is 3993.6 km2, which is very close to the 4068 km2 reported in a local scale study in 2000 by the USDA Forest Service using the same types of images [29], but lower than the 4541 km2 reported by the world bank [51]. The national scale study of land cover dataset in 2001 reported the tree cover at pixel level [52]. The forested area in 2001 is 3524 km2 when forest is defined as tree cover greater than 50%, but 4077 km2 when the criteria changed to 30%. The trend of forest expansion in 2000–2010 is in consensus with those from the World Bank and the national land cover data in 2001 and 2011. The magnitude of net forest gain in our study, i.e., 311.5 km2, is comparable to the value of 296 km2 reported by the World Bank. The combined expansion of 508.8 km2 of forests and woodlands is higher than that of 268.5 km2 reported in a coarse-scale study using MODIS images [53], largely due to the coarse resolution of the latter that limits the detection of fine-scale forest changes.

4.2. Patterns in Land Cover Land Use Changes

Our analysis revealed that in the first decade of the new century forests/woodlands recovery and urban expansion continued in the tropical island of Puerto Rico, mostly converted from herbaceous cover and bare ground (Table 2). However, compared to the previous decade, the forest changes slowed down (Figure 3) [31,54].
Existing LCLUC studies emphasized the socioeconomic drivers for forest changes, such as the economic shift and the rural-to-urban migration [25,26,30,31]. However, natural disturbances, such as hurricanes and landslides, could also substantially alter the land cover in tropical islands. Hurricane is considered the major natural disturbance in Puerto Rico. Strong wind with a hurricane landfall could sweep through the forest and cause severe defoliation, stem and branch breakage, and tree uprooting [55]. In addition, the associated heavy rainfall could trigger mudslides or landslips on steep slopes [56]. When we compared the spatial pattern of forest change in 2000–2010 (Figure 3B) with that in 1991–2000 (Figure 3A), we found that the early deforestation clusters in 1991–2000 in the eastern part of the island turned into clusters of reforestation later in 2000–2010. Coincidentally, these eastern regions (such as Humacao and Yabucoa) were the areas hit directly by the Hurricane Georges, which made a landfall here and then swept across the entire island in 21–22 September 1998 with sustained winds of 184 kph and rainfall up to 720 mm. Our analyses revealed that half of the reforestation in 2000–2010 came from the woodlands, and to some extent, the forest recovery from the damage of Hurricane Georges might contribute to this transition. Further analyses incorporating long-term ground surveys, such as the LTER Luquillo studies, would be needed to test this hypothesis.
Forest cover changes mostly occurred at the low-density secondary forests or near the forest edges. The annual rates of deforestation and reforestation in 2000–2010 reached the largest where forest coverages were less than 20% (Figure 4). Most of the large forest patches are protected by local/federal governments or non-government organizations, so that little deforestation happened. LC distributions and their conversions are strongly related to topography slope (Figure 5 and Figure 6). Forested wetlands were mainly distributed in gentle slopes, and urban and bare lands were mainly in the gentle to moderate slopes. LCLUC varied along the slope gradients in 2000–2010. The proportion of herbaceous cover decreased with the slope gradients (Figure 5A,B). The development of urban areas was dominant in the flat coastal regions to avoid high cost and risk of landslides on the steep slopes (Figure 5D and Figure 6B). Forests and woodlands took over the herbaceous cover and expanded on the steep slopes, i.e., 15–25°, mostly through secondary successions (Figure 5 and Figure 6).
Protecting ecosystems with diverse landscapes is important for biodiversity conservation and ecosystem services provision [54]. We evaluated the changes in LC within the protected area and the immediate neighborhood in the wet, moist, and dry forest life zones. Forests and woodlands increased within the protected areas in all three life zones. The proportions of conversions to forests from the bare ground, herbaceous cover, or woodlands are the highest within the protected area in the wet forest zone which has 95% forested area. These conversion proportions are also higher within the protected area than those in the immediate buffer zones of 500 m or 1 km in the wet or moist forest zones (Figure 8), indicating the effective protection and restoration of the natural resources. However, the urban expansion rates within the protected area and in the buffers of 500 m and 1 km in the moist forest zone are higher than those corresponding in either the dry or the wet forest zone (Table 3). As major cities are distributed in the coastal moist forest zone, the more interference with and exposure to urban development might render the protected areas in moist forest more vulnerable to human activities than those in wet or dry forest zone. Current protected areas only cover 8%, i.e., 445 km2, of the forests and woodlands of the island in 2010, therefore, more efforts should be done to preserve the remaining forests, especially in the moist and dry forest zones.
In the first decade of the new century, for the first time, the human population declined in Puerto Rico according to the US Census [50]. However, urban areas continued to expand mostly through the conversion of herbaceous cover (Table 2). The emigration continues and accelerates after 2010 due to the economic stagnation. The further decline in human population would slow down the urbanization and might render additional forest recovery in this tropical island.

5. Conclusions

Tropical forests play an important role in the global land-atmosphere interactions and have been experiencing rapid deforestation or reforestation. Accurate and timely monitoring of forest changes in tropics is limited by persistent cloud covers. By taking the advantages of the cloud-penetrating capability of SAR signals, we integrated the L-band PALSAR with the optical Landsat images and achieved a high-accuracy land cover mapping of the tropical island Puerto Rico. Forest recovery and urban expansion continued in the new century despite a declining population, however, forest changes (deforestation and reforestation) slowed down compared to those in the last century. The clustered reforestation in the east and southeast coincided with the areas experiencing the hurricane landfall just before the new century, suggesting forest recovery via secondary succession. Implementing forest conservation effectively promotes forest recovery within the protected areas. However, since only 8% of forests/woodlands are currently protected, more efforts are still in need, especially for the protection of the moist and dry forests.

Acknowledgments

This study was supported by the grants from the National Aeronautics and Space Administration Land Cover/Land Use Change Program (NNX12AE98G) and the Natural Science Foundation LUQ-LTER program (NSF DEB-1546686).

Author Contributions

Mei Yu and Qiong Gao conceived and designed the study; Chao Wang performed the analyses; Chao Wang, Mei Yu and Qiong Gao wrote the paper.

Conflicts of Interest

The authors declare no conflict of interest. The founding sponsors had no role in the design of the study; in the collection, analyses, or interpretation of data; in the writing of the manuscript, and in the decision to publish the results.

Appendix A

Table A1. The land cover classification scheme adopted for the reference data collection.
Land CoverAbbreviationDescription# Samples in 2000# Samples in 2010
Montane woodlandMTWDWoody (coffee) plantation, low-density woodland in mountain areas, canopy coverage below 50%65150
Bare groundBARENon-forested and non-agricultural land with less than 10% herbaceous cover, including sparsely vegetated land, bare soil, bedrock, volcanic material, coastal sand dunes10757
Closed shrublandCLSHHigh-density shrubs, scrub generally below 3 m in height, canopy coverage around 30%–50%45104
Herbaceous agriculture/pastureHERBHerbaceous vegetation such as crops, pasture, and marsh, tree and shrub coverage less than 10%560659
ForestFORSHigh-density scrub with more than 50% canopy coverage, trees with 3 m or more in height, including both deciduous and evergreen forests605621
UrbanURBNUrban development, including residential, commercial, industrial, transportation and utility infrastructure, green belt (width less than 30 m), and other developed land198191
Forested WetlandFWETForested wetland, including mangroves and Pterocarpus forest180190
WaterWATRInland water bodies (natural & artificial) including reservoirs, lakes, rivers, lagoons, and drainages.9595
Coastal woodlandFTWDCoastal low-density woodland on flat land, including fruit trees, canopy coverage below 50%112116
Table A2. Confusion matrix of the classification models for the year of 2010 with different variable combinations (C1, surface reflectance (SR) and topographic variables; C2, SR, vegetation indices (VI), and topographic variables; C3, Top-of-atmosphere (TOA) reflectance, VI, and topographic variables; C4, SR, VI, topographic variables, and SAR; C5, TOA reflectance, VI, topographic variables, and SAR. UA, user’s accuracy; PA, producer’s accuracy).
C1MTWDBARECLSHFORSHERBURBNFWETWATRFTWDUA
MTWD390031000090.7%
BARE07100100077.8%
CLSH102222100175.9%
FORS2011780020893.2%
HERB1131180300592.8%
URBN010073800082.6%
FWET0000004600100.0%
WATR0000000250100.0%
FTWD003130101970.4%
PA90.7%77.8%73.3%96.2%93.3%88.4%93.9%100.0%57.6%
C2MTWDBARECLSHFORSHERBURBNFWETWATRFTWDUA
MTWD390031000090.7%
BARE09102000075.0%
CLSH102021000180.0%
FORS2011771020693.7%
HERB1041180300592.8%
URBN000064000087.0%
FWET0000004600100.0%
WATR0000000250100.0%
FTWD004220102170.0%
PA90.7%100.0%66.7%95.7%93.3%93.0%93.9%100.0%63.6%
C3MTWDBARECLSHFORSHERBURBNFWETWATRFTWDUA
MTWD400030000093.0%
BARE09000100090.0%
CLSH002012000571.4%
FORS1001781020495.7%
HERB2041186910290.7%
URBN001033300089.2%
FWET000000460197.9%
WATR0000000250100.0%
FTWD005210002172.4%
PA93.0%100.0%66.7%96.2%96.4%76.7%93.9%100.0%63.6%
C4MTWDBARECLSHFORSHERBURBNFWETWATRFTWDUA
MTWD380021000092.7%
BARE09102000075.0%
CLSH202005100266.7%
FORS2011781020494.7%
HERB1041184210294.4%
URBN0000040000100.0%
FWET000100460195.8%
WATR0000000250100.0%
FTWD004300002477.4%
PA88.4%100.0%66.7%96.2%95.3%93.0%93.9%100.0%72.7%
C5MTWDBARECLSHFORSHERBURBNFWETWATRFTWDUA
MTWD400020000095.2%
BARE09100000090.0%
CLSH102103000570.0%
FORS1021791020494.7%
HERB1031187410294.0%
URBN0000039000100.0%
FWET000000460197.9%
WATR0000000250100.0%
FTWD003320002172.4%
PA93.0%100.0%70.0%96.8%96.9%90.7%93.9%100.0%63.6%
Table A3. Land conversion to forests within and outside the protected areas in 2000–2010. DF, MF, and WF indicate dry, moist, and wet forest ecological life zones, respectively. IPA, OPA500m, and OPA1km indicate inside, 500-m buffer outside, and 1-km buffer outside the protected areas, respectively.
From Bare GroundFrom Herbaceous CoverFrom Woodland
DFMFWFDFMFWFDFMFWF
IPA (km2)0.10.060.092.44.81.74.74.35.1
OPA500m (km2)0.10.10.12.47.96.04.66.09.8
OPA1km (km2)0.20.20.15.614.013.39.011.218.5
IPA (%)1.67.368.08.221.443.522.242.159.3
OPA500m (%)2.62.754.95.612.526.523.332.542.4
OPA1km (%)2.32.142.26.011.025.723.430.740.8
Figure A1. The two digital elevation model (DEM) data around the coastal region of San Juan, Puerto Rico. (A). DEM from the USGS National Elevation Dataset; (B). DEM from NOAA National Geophysical Dataset which provides details in the coastal region.
Remotesensing 09 00731 g009
Figure A2. The overall accuracies of a grid search over the three tuning parameters (i.e., the number of trees, NumTrees, the number of variables per split, NumSplit, and the minimum terminal node, Node) for the random forest classifier. (A) optimization for the NumTrees and the NumSplit with Node of 1; and (B) optimization for the NumTrees and the Node with NumSplit of 6 (i.e., the square root of the number of variables).
Remotesensing 09 00731 g010
Figure A3. The importance of the predictive variables assessed by Boruta feature selection algorithm. Blue boxplots (i.e., first three boxes from left) correspond to minimal, average, and maximum Z-score of shadow features, which are shuffled version of real features introduced to RF classifier and act as benchmarks to detect truly predictive variables (The variables colored in green are those detected as strongly relevant to the decision variable).
Remotesensing 09 00731 g011

References

  1. Dixon, R.K.; Brown, S.; Houghton, R.A.; Solomon, A.M.; Trexler, M.C.; Wisniewski, J. Carbon pools and flux of global forest ecosystems. Science 1994, 263, 185–190. [Google Scholar] [CrossRef] [PubMed]
  2. Bonan, G.B. Forests and climate change: Forcings, feedbacks, and the climate benefits of forests. Science 2008, 320, 1444–1449. [Google Scholar] [CrossRef] [PubMed]
  3. Foley, J.A.; DeFries, R.; Asner, G.P.; Barford, C.; Bonan, G.; Carpenter, S.R.; Chapin, F.S.; Coe, M.T.; Daily, G.C.; Gibbs, H.K.; et al. Global consequences of land use. Science 2005, 309, 570–574. [Google Scholar] [CrossRef] [PubMed]
  4. Foster, A.D.; Rosenzweig, M.R. Economic growth and the rise of forests. Q. J. Econ. 2003, 118, 601–637. [Google Scholar] [CrossRef]
  5. Chazdon, R.L. Beyond deforestation: Restoring forests and ecosystem services on degraded lands. Science 2008, 320, 1458–1460. [Google Scholar] [CrossRef] [PubMed]
  6. Gibbs, H.K.; Ruesch, A.S.; Achard, F.; Clayton, M.K.; Holmgren, P.; Ramankutty, N.; Foley, J.A. Tropical forests were the primary sources of new agricultural land in the 1980s and 1990s. Proc. Natl. Acad. Sci. USA 2010, 107, 16732–16737. [Google Scholar] [CrossRef] [PubMed]
  7. Hansen, M.C.; Potapov, P.V.; Moore, R.; Hancher, M.; Turubanova, S.A.; Tyukavina, A.; Thau, D.; Stehman, S.V.; Goetz, S.J.; Loveland, T.R.; et al. High–resolution global maps of 21st-century forest cover change. Science 2013, 342, 850–853. [Google Scholar] [CrossRef] [PubMed]
  8. Achard, F.; Beuchle, R.; Mayaux, P.; Stibig, H.J.; Bodart, C.; Brink, A.; Carboni, S.; Desclee, B.; Donnay, F.; Eva, H.D.; et al. Determination of tropical deforestation rates and related carbon losses from 1990 to 2010. Glob. Chang. Biol. 2014, 20, 2540–2554. [Google Scholar] [CrossRef] [PubMed]
  9. Shimada, M.; Itoh, T.; Motooka, T.; Watanabe, M.; Shiraishi, T.; Thapa, R.; Lucas, R. New global forest/non-forest maps from alos palsar data (2007–2010). Remote Sens. Environ. 2014, 155, 13–31. [Google Scholar] [CrossRef]
  10. Food and Agriculture Organization of the United Nations. Global Forest Resources Assessment Main Report: Fao Forestry Paper #163; FAO: Rome, Italy, 2010. [Google Scholar]
  11. Potapov, P.V.; Turubanova, S.A.; Tyukavina, A.; Krylov, A.M.; McCarty, J.L.; Radeloff, V.C.; Hansen, M.C. Eastern europe’s forest cover dynamics from 1985 to 2012 quantified from the full landsat archive. Remote Sens. Environ. 2015, 159, 28–43. [Google Scholar] [CrossRef]
  12. Gutman, G.; Huang, C.; Chander, G.; Noojipady, P.; Masek, J.G. Assessment of the nasa–usgs global land survey (gls) datasets. Remote Sens. Environ. 2013, 134, 249–265. [Google Scholar] [CrossRef]
  13. Ban, Y.; Gong, P.; Giri, C. Global land cover mapping using earth observation satellite data: Recent progresses and challenges. ISPRS J. Photogramm. Remote Sens. 2015, 103, 1–6. [Google Scholar] [CrossRef]
  14. Wang, C.; Gao, Q.; Wang, X.; Yu, M. Decadal trend in agricultural abandonment and woodland expansion in an agro-pastoral transition band in northern china. PLoS ONE 2015, 10, e0142113. [Google Scholar] [CrossRef] [PubMed]
  15. Qin, Y.; Xiao, X.; Dong, J.; Zhang, G.; Shimada, M.; Liu, J.; Li, C.; Kou, W.; Moore, B. Forest cover maps of china in 2010 from multiple approaches and data sources: Palsar, landsat, modis, fra, and nfi. ISPRS J. Photogramm. Remote Sens. 2015, 109, 1–16. [Google Scholar] [CrossRef]
  16. Wulder, M.A.; Dechka, J.A.; Gillis, M.A.; Luther, J.E.; Hall, R.J.; Beaudoin, A.; Franklin, S.E. Operational mapping of the land cover of the forested area of canada with landsat data: Eosd land cover program. For. Chron. 2003, 79, 1075–1083. [Google Scholar] [CrossRef]
  17. Dong, J.; Xiao, X.; Chen, B.; Torbick, N.; Jin, C.; Zhang, G.; Biradar, C. Mapping deciduous rubber plantations through integration of palsar and multi-temporal landsat imagery. Remote Sens. Environ. 2013, 134, 392–402. [Google Scholar] [CrossRef]
  18. Yu, M.; Gao, Q.; Gao, C.; Wang, C. Extent of night warming and spatially heterogeneous cloudiness differentiate temporal trend of greenness in mountainous tropics in the new century. Sci. Rep. 2017, 7, 41256. [Google Scholar] [CrossRef] [PubMed]
  19. Lehmann, E.A.; Caccetta, P.; Lowell, K.; Mitchell, A.; Zhou, Z.-S.; Held, A.; Milne, T.; Tapley, I. Sar and optical remote sensing: Assessment of complementarity and interoperability in the context of a large-scale operational forest monitoring system. Remote Sens. Environ. 2015, 156, 335–348. [Google Scholar] [CrossRef]
  20. Dobson, M.C.; Ulaby, F.T. Active microwave soil moisture research. IEEE Trans. Geosci. Remote Sens. 1986, 24, 23–36. [Google Scholar] [CrossRef]
  21. Motohka, T.; Shimada, M.; Uryu, Y.; Setiabudi, B. Using time series palsar gamma nought mosaics for automatic detection of tropical deforestation: A test study in riau, indonesia. Remote Sens. Environ. 2014, 155, 79–88. [Google Scholar] [CrossRef]
  22. Forkuor, G.; Conrad, C.; Thiel, M.; Ullmann, T.; Zoungrana, E. Integration of optical and synthetic aperture radar imagery for improving crop mapping in Northwestern Benin, West Africa. Remote Sens. 2014, 6, 6472–6499. [Google Scholar] [CrossRef]
  23. Myers, N.; Mittermeier, R.A.; Mittermeier, C.G.; da Fonseca, G.A.B.; Kent, J. Biodiversity hotspots for conservation priorities. Nature 2000, 403, 853–858. [Google Scholar] [CrossRef] [PubMed]
  24. Helmer, E.; Ramos, O.; del MLópez, T.; Quiñónez, M.; Diaz, W. Mapping the forest type and land cover of puerto rico, a component of the caribbean biodiversity hotspot. Caribb. J. Sci. 2002, 38, 165–183. [Google Scholar]
  25. Rudel, T.K.; Perez-Lugo, M.; Zichal, H. When fields revert to forest: Development and spontaneous reforestation in post-war puerto rico. Prof. Geogr. 2000, 52, 386–397. [Google Scholar] [CrossRef]
  26. Dietz, J.L. Economic history of puerto rico: Institutional change and capitalist development; Princeton University Press: Princeton, NJ, USA, 1986. [Google Scholar]
  27. Grau, H.R.; Aide, T.M.; Zimmerman, J.K.; Thomlinson, J.R.; Helmer, E.; Zou, X. The ecological consequences of socioeconomic and land-use changes in postagriculture puerto rico. BioScience 2003, 53, 1159–1168. [Google Scholar] [CrossRef]
  28. Lugo, A.E.; Helmer, E. Emerging forests on abandoned land: Puerto rico’s new forests. For. Ecol. Manag. 2004, 190, 145–161. [Google Scholar] [CrossRef]
  29. Kennaway, T.; Helmer, E.H. The forest types and ages cleared for land development in puerto rico. GIScience Remote Sens. 2007, 44, 356–382. [Google Scholar] [CrossRef]
  30. Pares-Ramos, I.K.; Gould, W.A.; Aide, T.M. Agricultural abandonment, suburban growth, and forest expansion in puerto rico between 1991 and 2000. Ecol. Soc. 2008, 13, 288–297. [Google Scholar] [CrossRef]
  31. Gao, Q.; Yu, M. Discerning fragmentation dynamics of tropical forest and wetland during reforestation, urban sprawl, and policy shifts. PLoS ONE 2014, 9, e113140. [Google Scholar] [CrossRef] [PubMed]
  32. Martinuzzi, S.; Gould, W.A.; Gonzalez, O.M.R. Land development, land use, and urban sprawl in puerto rico integrating remote sensing and population census data. Landsc. Urban Plan. 2007, 79, 288–297. [Google Scholar] [CrossRef]
  33. Daly, C.; Helmer, E.H.; Quiñones, M. Mapping the climate of puerto rico, vieques and culebra. Int. J. Climatol. 2003, 23, 1359–1381. [Google Scholar] [CrossRef]
  34. Gould, W.A.; Alarcón, C.; Fevold, B.; Jiménez, M.E.; Martinuzzi, S.; Potts, G.; Quiñones, M.; Solórzano, M.; Ventosa, E. The puerto rico gap analysis project. In International Institute of Tropical Forestry General Technical Report IITF-GTR-39; USDA Forest Service: San Juan, Puerto Rico, 2008. [Google Scholar]
  35. Olson, D.M.; Dinerstein, E.; Wikramanayake, E.D.; Burgess, N.D.; Powell, G.V.N.; Underwood, E.C.; D’Amico, J.A.; Itoua, I.; Strand, H.E.; Morrison, J.C.; et al. Terrestrial ecoregions of the world: A new map of life on earth. Bioscience 2001, 51, 933–938. [Google Scholar] [CrossRef]
  36. Zhu, Z.; Woodcock, C.E. Object-based cloud and cloud shadow detection in landsat imagery. Remote Sens. Environ. 2012, 118, 83–94. [Google Scholar] [CrossRef]
  37. Housman, I.; Tanpipat, V.; Biswas, T.; Clark, A.; Stephen, P.; Maus, P.; Megown, K. Monitoring forest change in southeast asia: Case studies for usaid lowering emissions in asia’s forests; U.S. Department of Agriculture, Forest Service, Remote Sensing Applications Center: Salt Lake City, Utah, 2015; pp. 1–16.
  38. Gesch, D. The national elevation dataset. In digital elevation model technologies and applications: The DEM users manual 2nd ed.; American Society for Photogrammetry and Remote Sensing: Bethesda, MD, USA, 2007; pp. 99–918. [Google Scholar]
  39. Taylor, L.; Eakins, B.; Carignan, K.; Warnken, R.; Sazonova, T.; Schoolcraft, D. Digital elevation models of puerto rico: Procedures, data sources and analysis; NOAA Technical Memorandum NESDIS NGDC-13; National Geophysical Data Center: Boulder, Colorado, USA, 2008.
  40. Helmer, E.H.; Ruefenacht, B. Cloud-free satellite image mosaics with regression trees and histogram matching. Photogramm. Eng. Remote Sens. 2005, 71, 1079–1089. [Google Scholar] [CrossRef]
  41. Puerto Rico Government. Portal of government Geographic Data. Available online: www.gis.pr.gov (accessed on 22 April 2017).
  42. Cutler, D.R.; Edwards Jr, T.C.; Beard, K.H.; Cutler, A.; Hess, K.T.; Gibson, J.; Lawler, J.J. Random forests for classification in ecology. Ecology 2007, 88, 2783–2792. [Google Scholar] [CrossRef] [PubMed]
  43. Zhu, Z.; Woodcock, C.E.; Rogan, J.; Kellndorfer, J. Assessment of spectral, polarimetric, temporal, and spatial dimensions for urban and peri-urban land cover classification using landsat and sar data. Remote Sens. Environ. 2012, 117, 72–82. [Google Scholar] [CrossRef]
  44. Bourgeau-Chavez, L.; Endres, S.; Battaglia, M.; Miller, M.; Banda, E.; Laubach, Z.; Higman, P.; Chow-Fraser, P.; Marcaccio, J. Development of a bi-national great lakes coastal wetland and land use map using three-season palsar and landsat imagery. Remote Sens. 2015, 7, 8655–8682. [Google Scholar] [CrossRef]
  45. Kursa, M.B.; Rudnicki, W.R. Feature selection with the boruta package. J. Stat. Softw. 2010, 36, 1–13. [Google Scholar]
  46. Puyravaud, J.-P. Standardizing the calculation of the annual rate of deforestation. For. Ecol. Manag. 2003, 177, 593–596. [Google Scholar]
  47. Anderegg, W.R.L.; Ballantyne, A.P.; Smith, W.K.; Majkut, J.; Rabin, S.; Beaulieu, C.; Birdsey, R.; Dunne, J.P.; Houghton, R.A.; Myneni, R.B.; et al. Tropical nighttime warming as a dominant driver of variability in the terrestrial carbon sink. Proc. Natl. Acad. Sci. USA 2015, 112, 15591–15596. [Google Scholar] [CrossRef] [PubMed]
  48. Chen, D.; Yu, M.; González, G.; Zou, X.; Gao, Q. Climate impacts on soil carbon processes along an elevation gradient in the tropical luquillo experimental forest. Forests 2017, 8, 90. [Google Scholar] [CrossRef]
  49. Masek, J.G.; Vermote, E.F.; Saleous, N.E.; Wolfe, R.; Hall, F.G.; Huemmrich, K.F.; Feng, G.; Kutler, J.; Teng-Kui, L. A landsat surface reflectance dataset for north america, 1990-2000. IEEE Geosci. Remote Sens. Lett. 2006, 3, 68–72. [Google Scholar] [CrossRef]
  50. U.S. Census Bureau. U.S. Census bureau Censtats Databases. Available online: http://www.Census.Gov/ (accessed on 22 April 2017).
  51. The World Bank—World Development Indicators. Forest Area as a Percentage of land Area, Source from Food and Agriculture Organization. Available online: http://data.worldbank.org/indicator/AG.LND.FRST.ZS?locations=PR (accessed on 22 April 2017).
  52. Homer, C.; Dewitz, J.; Yang, L.; Jin, S.; Danielson, P.; Xian, G.; Coulston, J.; Herold, N.; Wickham, J.; Megown, K. Completion of the 2011 national land cover database for the conterminous united states—Representing a decade of land cover change information. Photogramm. Eng. Remote Sens. 2015, 81, 345–354. [Google Scholar]
  53. Álvarez-Berríos, N.; Redo, D.; Aide, T.; Clark, M.; Grau, R. Land change in the greater antilles between 2001 and 2010. Land 2013, 2, 81–107. [Google Scholar] [CrossRef]
  54. Gao, Q.; Yu, M. Reforestation-induced changes of landscape composition and configuration modulate freshwater supply and flooding risk of tropical watersheds. PLoS ONE 2017, 12, e0181315. [Google Scholar] [CrossRef]
  55. Brokaw, N.V.L.; Walker, L.R. Summary of the effects of caribbean hurricanes on vegetation. Biotropica 1991, 23, 442–447. [Google Scholar] [CrossRef]
  56. Comita, L.S.; Uriarte, M.; Thompson, J.; Jonckheere, I.; Canham, C.D.; Zimmerman, J.K. Abiotic and biotic drivers of seedling survival in a hurricane-impacted tropical forest. J. Ecol. 2009, 97, 1346–1359. [Google Scholar] [CrossRef]
Figure 1. Location and geomorphology of Puerto Rico (ELZ stands for ecological life zone).
Remotesensing 09 00731 g001
Figure 2. Land cover/use map of Puerto Rico in 2010. MTWD, montane woodland; HERB: herbaceous agriculture/pasture; FORS, forest; FWET: forested wetland; FTWD, coastal woodland; BARE, bare ground; CLSH, closed shrubland; URBN, urban developed land; and WATR, water body.
Remotesensing 09 00731 g002
Figure 3. Spatial distributions of forest cover and forest change in Puerto Rico for the periods of 1991–2000 ((A), data source from Kennaway and Helmer, 2007) and 2000–2010 (B).
Remotesensing 09 00731 g003
Figure 4. Annual change rates of deforestation and reforestation with standard error in 2000–2010 against forest coverage at the scales of 0.75 km (A), 1.5 km (B), and 3 km (C). Freq. indicates the land proportion of each category of forest coverage.
Remotesensing 09 00731 g004
Figure 5. The proportions and changes in proportions of land cover types along the slope in 2000–2010. (A) proportions in 2000; (B) proportions in 2010; (C) areas in each slope category (km2); and (D) changes in proportions from 2000 to 2010.
Remotesensing 09 00731 g005
Figure 6. Percentage of land conversion along the slope. (A) Percentage of loss of major land cover types to others; and (B) Percentage of gain of major land cover types from others.
Remotesensing 09 00731 g006
Figure 7. Proportion of land cover types within protected areas in the ecological life zones of dry forest (DF), moist forest (MF), and wet forest (WF) in the years of 2000 and 2010. BARE, bare ground; HERB, herbaceous agriculture/pasture; FORS, forest; FWET, forested wetland; URBN, urban area; WATR, water; WOOD, woodland.
Remotesensing 09 00731 g007
Figure 8. Land conversion to forests within and outside the protected areas in 2000–2010. BARE_F, HERB_F, and WOOD_F indicate conversions to forests from bare ground, herbaceous cover, and woodland, respectively. Within PA, 500 m buffer, and 1 km buffer indicate inside, 500 m buffer outside, and 1 km buffer outside the protected areas, respectively.
Remotesensing 09 00731 g008
Table 1. Accuracies of the land cover classification for the years of 2000 and 2010. The input variable combinations are: C1, surface reflectance (SR) and topographic variables; C2, SR, vegetation indices (VI), and topographic variables; C3, Top-of-atmosphere (TOA) reflectance, VI, and topographic variables; C4, SR, VI, topographic variables, and SAR; C5, TOA reflectance, VI, topographic variables, and SAR. MTWD, montane woodland; BARE, bare ground; CLSH, closed shrubland; FORS, forests; HERB: herbaceous agriculture/pasture; URBN, urban developed land; FWET: forested wetland; WATR, water body; FTWD, coastal woodland. OA, overall accuracy.
Producer’s Accuracy (%)User’s Accuracy (%)
2000C1C2C3 C1C2C3
MTWD85.085.085.0 89.594.485.0
BARE90.096.793.3 100.093.596.6
CLSH60.080.066.7 69.292.383.3
FORS91.491.491.9 95.094.494.5
HERB95.795.197.5 93.493.391.9
URBN98.396.694.8 93.496.698.2
FWET96.496.498.2 89.889.893.1
WATR100.0100.0100.0 100.0100.0100.0
FTWD62.965.777.1 59.562.281.8
OA (%)91.392.093.0
Kappa (%)88.489.490.8
2010C1C2C3C4C5C1C2C3C4C5
MTWD90.790.793.088.493.090.790.793.092.795.2
BARE77.8100.0100.0100.0100.077.875.090.075.090.0
CLSH73.366.766.766.770.075.980.071.466.770.0
FORS96.295.796.296.296.893.293.795.794.794.7
HERB93.393.396.495.396.992.892.890.794.494.0
URBN88.493.076.793.090.782.687.089.2100.0100.0
FWET93.993.993.993.993.9100.0100.097.995.897.9
WATR100.0100.0100.0100.0100.0100.0100.0100.0100.0100.0
FTWD57.663.663.672.763.670.470.072.477.472.4
OA (%)90.891.391.592.593.0
Kappa (%)87.588.288.489.990.5
Table 2. Land conversion between 2000 and 2010 (km2). BARE, bare ground; HERB, herbaceous agriculture/pasture; FORE, forests including forested wetland; URBN, urban area; WATR, water; and WOOD, woodland.
2010
2000BAREHERBFOREURBNWATRWOOD
BARE26.335.62.934.05.67.4
HERB7.51835.5374.8142.94.2517.2
FORE1.6123.53561.17.03.4297.0
URBN0.22.00.02760.401.2
WATR1.73.413.50.566.05.6
WOOD1.5257.8352.817.81.2425.7
Table 3. Changes of land cover (LC) types inside and outside the protected areas (km2). PA, protected areas. DF, MF, and WF indicate dry, moist, and wet forest ecological life zones, respectively.
LC TypeOverallDFMFWF
Inside PA
BARE−3.7(−44.4%)−3.2(−42.3%)−0.4(−56.3%)−0.1(−98.6%)
HERB−14.4(−25.8%)−5.2(−17.7%)−7.0(−31.3%)−2.1(−56.1%)
FORS3.6(1.0%)−3.4(−7.4%)3.6(8.1%)3.4(1.3%)
FWET7.7(23.8%)3.7(43.6%)4.0(17.0%)−0.04(−35.7%)
URBN0.4(19.4%)0.1(11.6%)0.3(30.2%)0.04(15.4%)
WATR−2.4(−8.4%)−1.3(−17.3%)−1.1(−5.1%)−0.02(−45.2%)
WOOD8.8(22.1%)9.3(43.8%)0.7(6.8%)−1.2(−13.4%)
500 m buffer outside PA
BARE−5.1(−60.5%)−2.4(−59.0%)−2.5(−60.5%)−0.2(−96.1%)
HERB30.0(−23.3%)−6.8(−16.0%)−14.4(−22.7%)−8.8(−38.6%)
FORS15.2(6.4%)1.8(9.3%)6.0(9.4%)7.5(4.8%)
FWET2.3(14.7%)1.5(25.3%)1.1(11.6%)−0.3(−65.6%)
URBN7.2(23.8%)1.8(19.7%)5.1(26.3%)0.4(18.4%)
WATR−0.8(−7.7%)−0.7(−15.2%)0.0(<0.1%)−0.04(−4.9%)
WOOD11.1(18.1%)5.0(25.3%)4.7(25.4%)1.4(6.1%)
1 km buffer outside PA
BARE−9.2(−60.9%)−4.5(−61.5%)−4.4(−59.2%)−0.3(−87.6%)
HERB−62.4(−23.0%)−15.7(−17.0%)−28.1(−22.0%)−18.7(−35.9%)
FORS30.0(7.0%)5.0(14.3%)10.4(8.5%)14.5(5.3%)
FWET3.0(13.3%)2.4(29.5%)1.1(7.9%)−0.5(−60.2%)
URBN16.1(24.7%)4.1(22.8%)11.2(25.9%)0.8(20.7%)
WATR−1.2(−9.0%)−0.9(−14.3%)−0.2(−3.8%)−0.1(−6.7%)
WOOD23.6(19.7%)9.6(24.9%)9.9(27.2%)4.2(9.2%)

