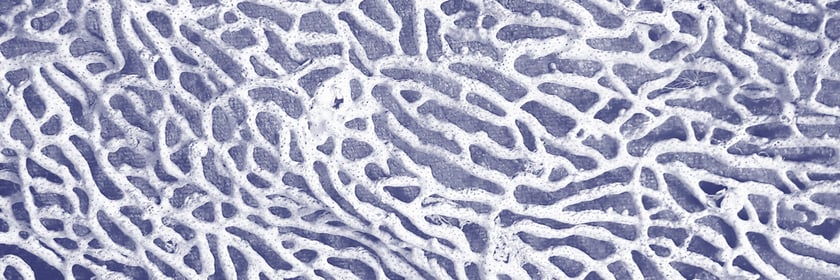
The proposed cover represents the essential elements of the study by means of four graphical elements: incoming wave profile (blue), C2s hull bow flare impact image, added resistance time series (orange), and an adimensional spectrum of both incoming wave and added resistance on top.
The bow flare impact of the planing hull represents the added resistance in waves, the main topic of the paper. The two timeseries represent the added resistance phase analysis results. The frequency-domain analysis used in the study and the presence of nonlinear effects such as the added resistance second harmonic content are shown in the spectra on top.
An image of regular waves generated in the Naples towing tank during the experiments fills the background. View this paper