Article

Development of Electromagnetic Current Meter for Marine Environment

1
Institute of Oceanographic Instrumentation, Qilu University of Technology (Shandong Academy of Sciences), Qingdao 266001, China
2
School of Ocean Technology Sciences, Qilu University of Technology (Shandong Academy of Sciences), Qingdao 266001, China
3
National Marine Monitoring Equipment Engineering Technology Research Center, Qingdao 266001, China
*
Authors to whom correspondence should be addressed.
J. Mar. Sci. Eng. 2023, 11(1), 206; https://doi.org/10.3390/jmse11010206
Submission received: 7 December 2022 / Revised: 3 January 2023 / Accepted: 9 January 2023 / Published: 12 January 2023
(This article belongs to the Special Issue Advances in Sensor Technology in Smart Ships and Offshore Facilities)

Abstract

:
Ocean current is one of the most important parameters in ocean observation, and ocean current measurement based on electromagnetic induction is becoming more and more important because of its advantages such as simple structure and high measurement accuracy. However, it is difficult to detect weak current signals in a complex marine environment. In this paper, an electromagnetic induction current measurement scheme based on lock-in amplification technology is proposed. Key technologies such as the evaluation of induced current intensity, overall design, circuit design, and orientation design of the current meter were studied. The prototype of the electromagnetic current meter was developed and tested in the laboratory and at sea. The repeatability of current velocity and current direction was higher than 1.5 cm/s and 1.5°, respectively. A comparison test between the electromagnetic current meter prototype and Nortek ADCP (Acoustic Doppler Current Profiler) installed on a buoy at sea was carried out, and the correlation coefficients of the current velocity and current direction datum were 0.90 and 0.96, respectively. Through continuous on-site and fault-free operations at sea, the experimental data show that the electromagnetic current meter has good adaptability at sea, which provides feasible technical and equipment support for ocean current observation.

1. Introduction

Ocean current is one of the most important parameters in ocean observation, and it is of great significance to marine environment observation and forecasting, disaster prevention and mitigation, marine development, and marine science research [1,2]. At present, ocean current observation methods can be roughly divided into mechanical current meters, electromagnetic current meters, acoustic doppler current meters, and acoustic time difference current meters [3,4,5]. ADCP (Acoustic Doppler Current Profiler) uses the principle of acoustic doppler to measure the velocity and direction of seawater profile, which has high measurement accuracy, but its structure is complex and expensive [6]. Electromagnetic current meters have become the main type of single-point current measurement, because of their simple structure, high measurement accuracy, convenient use, and low price. In 1947, R.W. Guelke first systematically described the method of measuring seawater velocity using an electromagnetic induction principle [7]. After years of research, many commercial products have appeared, such as the S4 electromagnetic current meter developed by InterOcean Systems LCC (United States) and the AEM series of electromagnetic current meters developed by the ALEC corporation (Japan) [8,9].
Research on electromagnetic current meters in China started with the National Ocean Instrument Development Events in the 1960s and 1970s, which mainly focused on geomagnetic current meters towed by ships. The Changchun Institute of Meteorological Instruments and the National Ocean Technology Center have developed and improved geomagnetic electromagnetic current meters for ship towing [10]. The equipment is large and needs a special towing structure, while its measurement accuracy is (10% ± 10) cm/s. In 2010, the National Ocean Technology Center carried out preliminary research on disposable electromagnetic current meters [11,12], the results showed that the electromotive force signal between electrodes was generally at the level of μV or nV, which was difficult to detect in a complex marine environment. So there are still no reliable portable commercial products in China [13,14]. The development of new technology provides a new method for the development of electromagnetic current meter.

2. Measurement Principle

2.1. Measuring Principle of Electromagnetic Current Meters

According to Faraday’s electromagnetic induction theorem, currents can be measured using the induced electromotive force generated by the seawater flowing through a magnetic field. In Figure 1, the magnetic field is generated by the current flowing through the ring coil. When the flowing seawater cuts the magnetic line of force of the magnetic field as a moving conductor, the dynamic electromotive force can be expressed as:
E = BLVsinα
where: V is the current velocity (m/s); B is the magnetic induction intensity (T); L is the length of the moving conductor (m), which is the equivalent distance between each pair of receiving electrodes in the electromagnetic velocity sensor; α is the angle between the moving direction of the conductor and the direction of the magnetic line of force, and the maximum induced electromotive force is generated when the magnetic line is cut vertically; and E is the induced electromotive force (V).
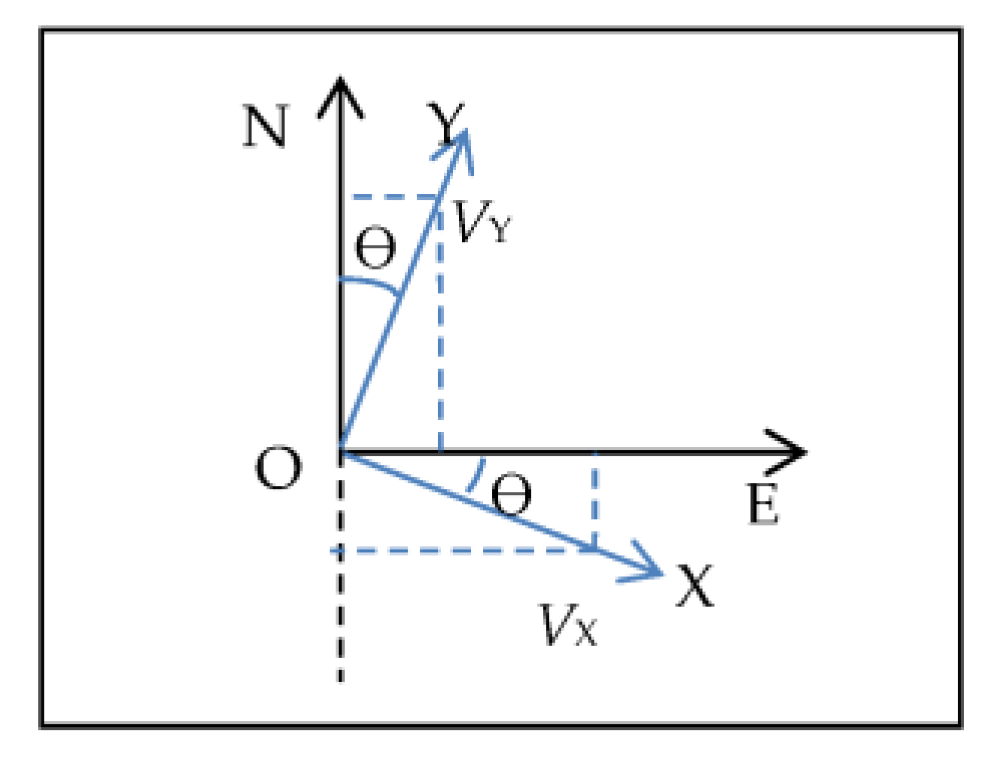
The dynamic electromotive force generated on the receiving electrode of the electromagnetic current sensor is directly proportional to the speed of the current. Two pairs of receiving electrodes are installed perpendicular to each other on a horizontal plane of the sensor, which can simultaneously measure the velocity components V x and V y in two mutually perpendicular XY directions under the instrument coordinate system XOY. These two velocity components are the velocity components relative to the sensor’s own coordinate system. According to the compass azimuth angle installed on the sensor, it is converted into the north and east components V E and V N in the geocoordinate system. The transformation between the measuring coordinate system of the electromagnetic current meter and the world coordinate system is shown in Figure 2.
The real current velocity and current direction are synthesized. V E and V N can be expressed as:
V N = V y cos θ V x sin θ V E = V y sin θ + V x cos θ

2.2. Main Parameter Preset

Generally, geomagnetic induction intensity is about 0.5 Gauss, which is very weak. To improve the sensitivity of ocean current measurement, an artificial magnetic field is used. Assuming that the current direction is perpendicular to the magnetic line of the artificial magnetic field, the induced electromotive force generated by the current cutting the magnetic line is E = BLV, the probe diameter should not be too large, and the preset L = 0.035 m. Considering the requirement of low power consumption, the magnetic induction intensity B of the artificial magnetic field generated by the coil is set to be 10 Gauss (10−3 T). The circuit can detect the voltage at the level of 0.1 μV, so the accuracy of theoretical current velocity is about V = E/BL = 0.1 μV/(10−3 T × 0.035 m) = 0.28 cm/s, which meets the requirement of current velocity measurements. Therefore, the main indicators of the sensor refer to the above design.

3. Development of the Electromagnetic Current Meters

3.1. System Design

In Figure 3, the electromagnetic current meters (ECM) mainly consist of the following parts: current sensor probe, signal acquisition and processing circuits, microprocessor, and communication module. The ocean current sensor probe works by having its coil form a stable and evenly distributed magnetic field through the excitation circuit. When the ocean current passes through, an induced electromotive force is generated between a pair of electrodes. The function of the signal acquisition and processing circuit is to extract the induced electromotive force through the analog circuit and amplify it through the lock-in amplifier circuit. The compass provides real-time azimuth data, and the induced EMF and compass data are collected by a microprocessor. After data processing and calculation, the current velocity data is synthesized and output through an RS232 serial communication interface. The microprocessor is mainly used for data sampling, data processing, providing excitation and reference signals, response interruption, data transmission, communication, and other functions of the whole measurement system.

3.2. Lock-In Amplifier

The current is measured by measuring the induced electromotive force on two pairs of electrodes to calculate the velocity of the measuring point. Therefore, accurately measuring the electromotive force on the electrode is the key point. The magnitude of the electromotive force generated by the current is generally μV, which represents a weak signal and is greatly affected by the environment. It is difficult to detect the voltage signal accurately only by amplification, so the lock-in amplification method is used to detect the weak current signal, which is one of the most effective methods to extract the known signal from the noise.
Lock-in amplification technology is a weak signal measurement technology based on a cross-correlation principle [15]. This measurement technique requires reference signals that are modulated at the same frequencies as their signals of interest to use phase-sensitive measurement. The information carried by the periodic signal in the noise can be detected because the reference signal is not correlated with the noise. The lock-in amplifier plays a dual role as a detector and narrow-band filter.
Phase-sensitive measurement circuits are the core components of lock-in amplifiers and have been widely used in the field of automatic control. The output of the phase-sensitive measurement circuit depends not only on the amplitude of the input signal but also on the phase difference between the input and reference signals. The commonly used phase-sensitive measurement circuits are analog multipliers and electronic switches. In fact, electronic switches are equivalent to analog multipliers when the reference signal is a square wave. In this paper, in Figure 4, the electronic switch-type phase-sensitive measurement circuit is used. The excitation and reference signals are square waves. The excitation circuit uses a chopper to modulate the slowly varying measured signal into a certain carrier signal frequency, which can obtain a square wave signal proportional to the measured signal. The carrier signal and the reference square wave signal are multiplied, and the output signal of phase-sensitive measurement is obtained through low-pass filtering.
When the amplitude of the square wave of the measured signal is ± V S and the fundamental frequency is w o , the Fourier series expression of the measured signal is:
x ( t ) = 4 V S π n = 1 ( 1 ) n + 1 2 n 1 cos [ ( 2 n 1 ) w o t + θ ]
The amplitude of the reference square wave signal is ± V r , and its Fourier series can be expressed as:
r ( t ) = 4 V r π n = 1 ( 1 ) n + 1 2 n 1 cos ( 2 n 1 ) w o t
Figure 5 shows the waveform of phase-sensitive measurement. It can be seen from it that the duty cycle of waveform u p ( t ) changes linearly with θ , and its average value is proportional to its duty cycle. When θ = 0 , the output value of phase-sensitive measurement is the maximum C, and the output value of the phase-sensitive measurement is proportional to the measured signal.

3.3. Design of Azimuth Compass

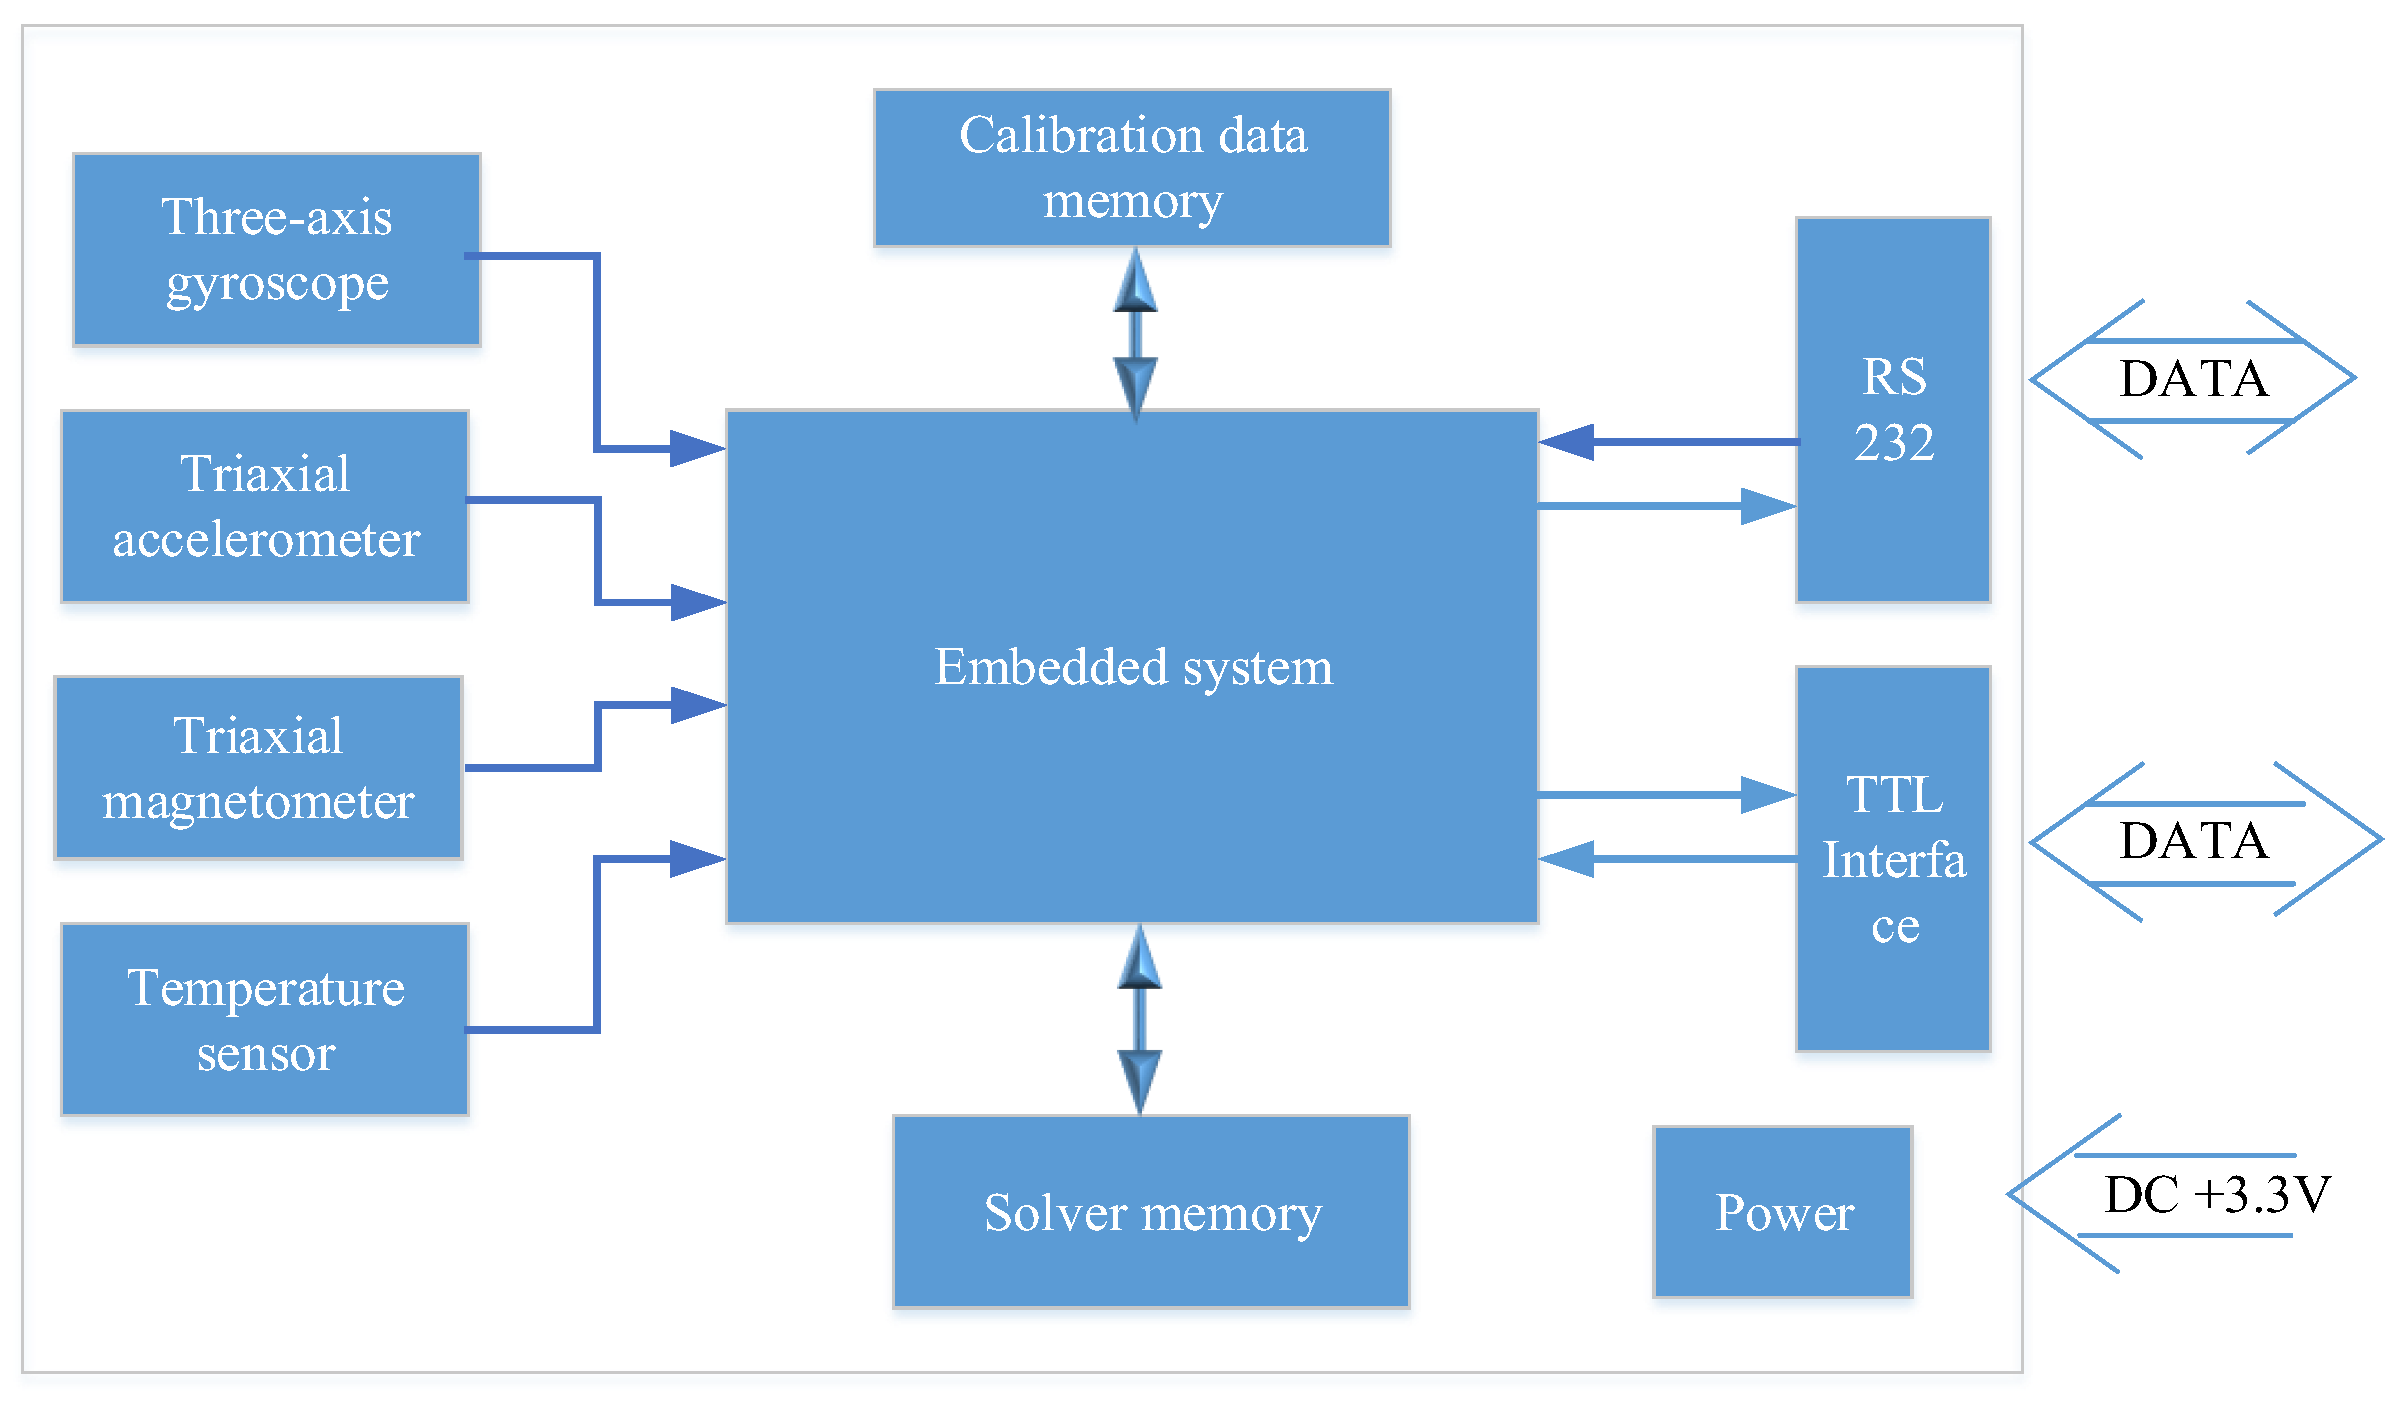
The compass in the electromagnetic current meter is used to provide its true position in the Earth’s coordinate system. The azimuth sensor is a miniature sensor device for all attitude measurements. Figure 6 consists of three types of sensors: a three-axis gyroscope, a three-axis accelerometer, and a three-axis fluxgate magnetometer. The three-axis gyroscope is used to measure the absolute angular rate of the carrier in three directions, the three-axis accelerometer is used to measure the acceleration of the carrier in three directions, and the three-axis fluxgate magnetometer is used to measure the three-dimensional geomagnetic intensity. The azimuth sensor provides accurate raw data, attitude compensation data, and azimuth data output using accurate acquisition and data fusion, which has the advantages of a high update rate, small size, light weight, low power consumption, real-time attitude compensation, stable data, and anti-alternating magnetic field.

3.4. Current Measurement Process

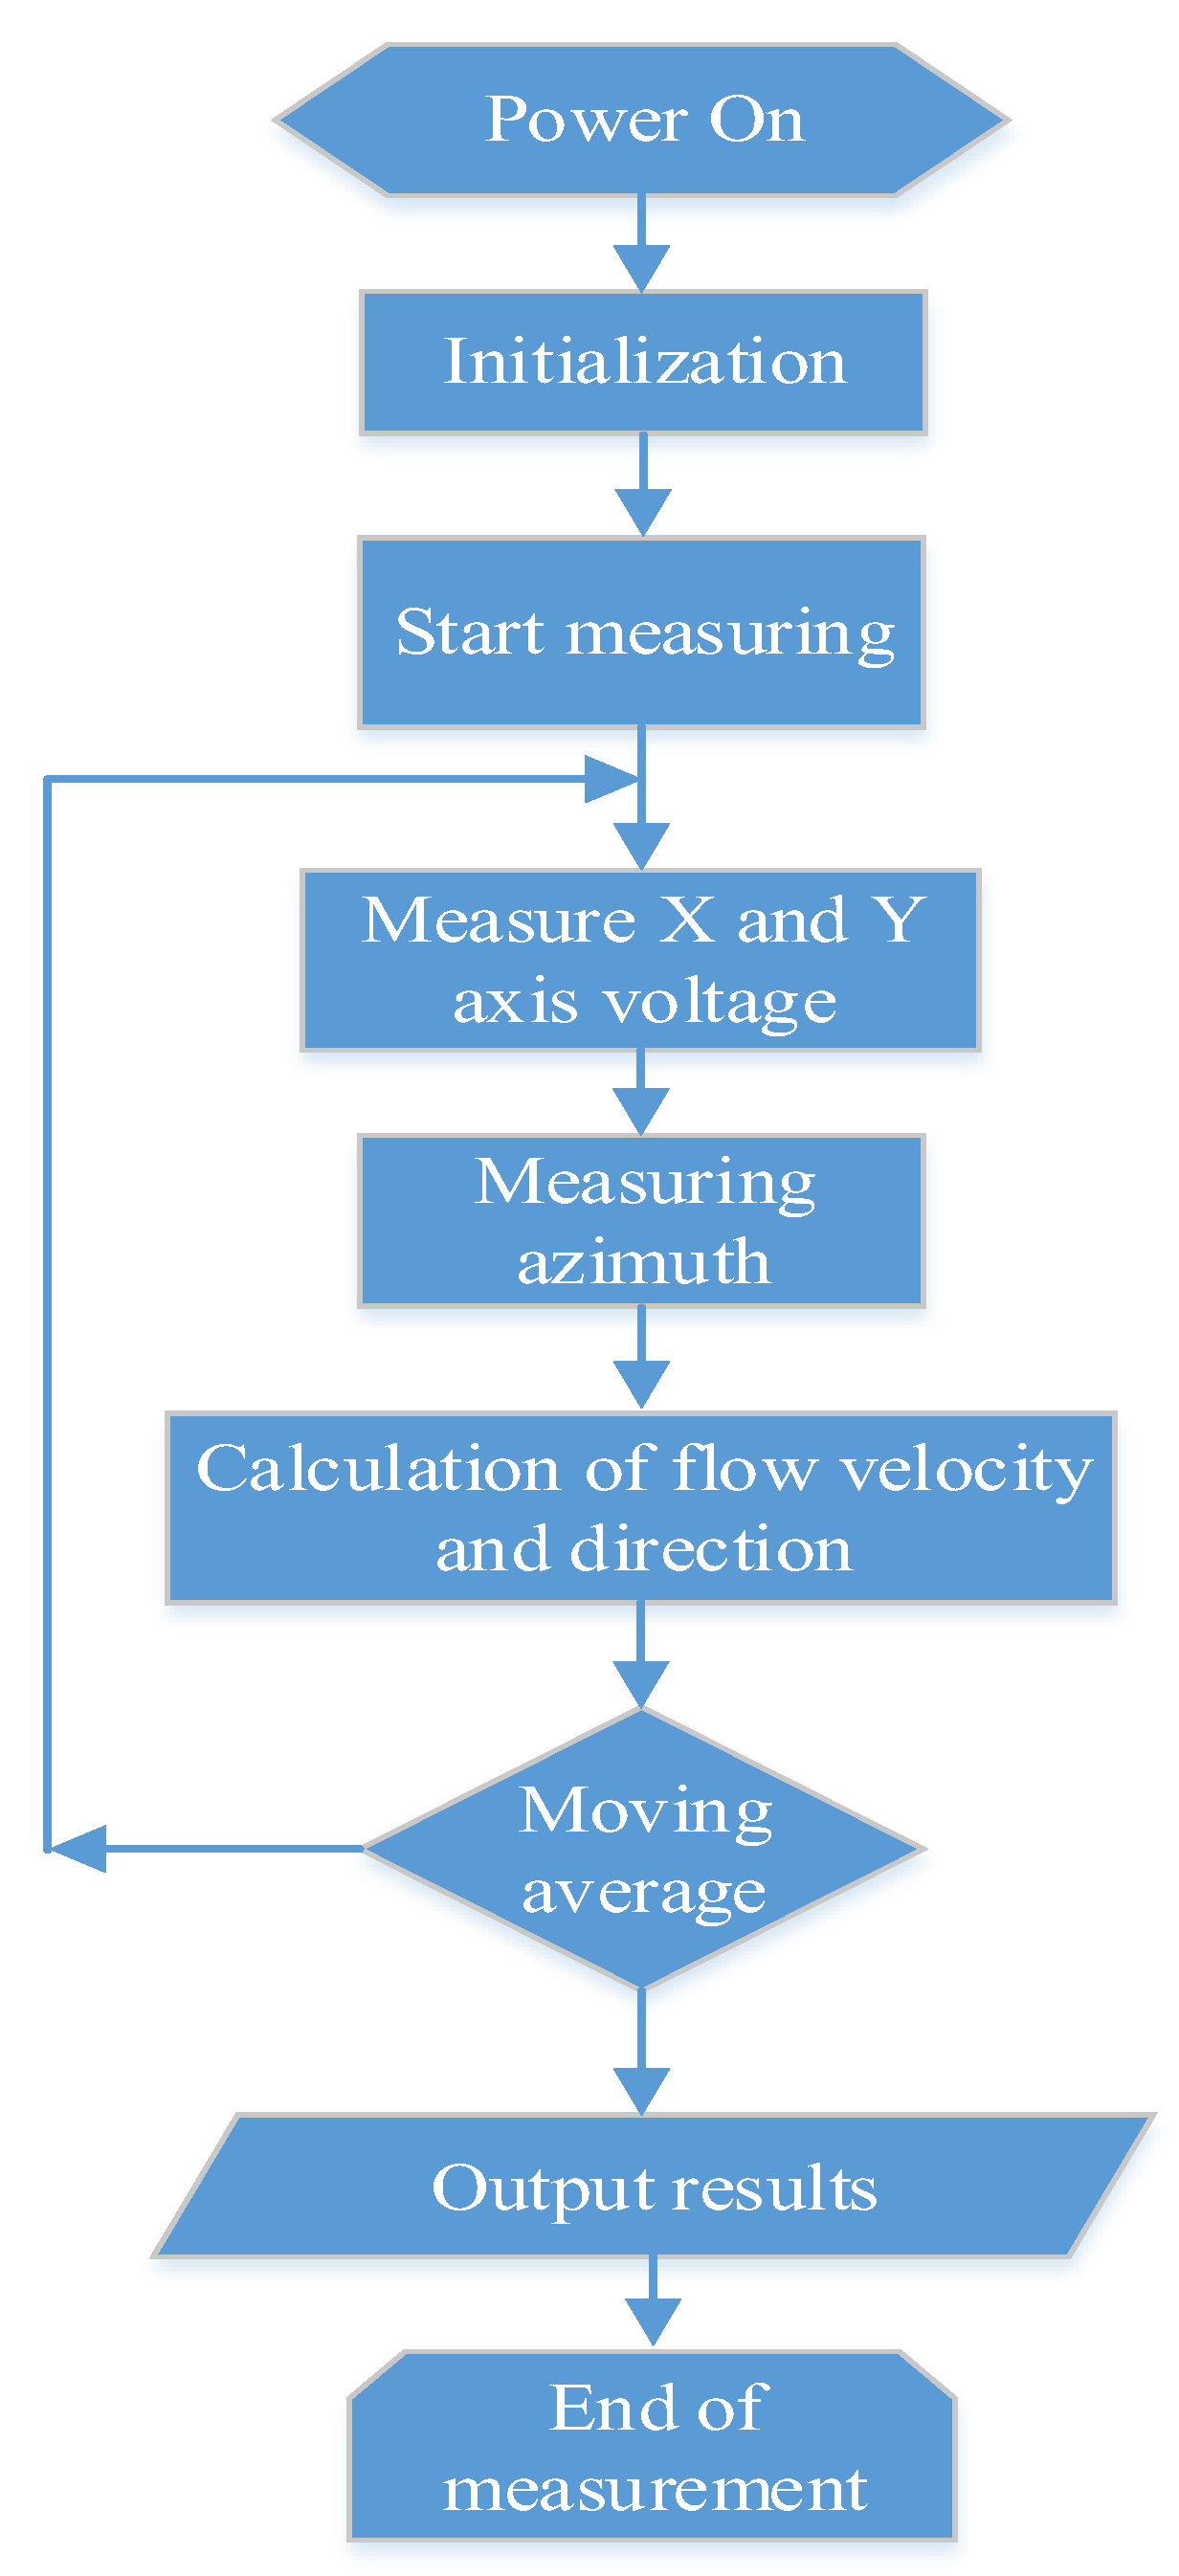
The data acquisition and test process of the electromagnetic current meter are shown in Figure 7. When the device is powered on and initialized, the sensor starts to measure the voltage on the X and Y axes of the electromagnetic probe, as well as the azimuth data at the same time and calculates the current velocity and current direction value. To improve the accuracy of measurement, multiple measurement results are filtered and moving averaged.

3.5. Development of the Electromagnetic Current Meter

The three-dimensional design diagram is shown in Figure 8. The electromagnetic current meter is mainly composed of an electromagnetic sensor probe, analog signal processing board, digital signal processing board, compass, mechanical shell, and water-tight cable. The analog signal processing board, digital signal processing board (in Figure 9), and compass are set in the mechanical shell which provides protection against deep water pressure. The photo of the assembled electromagnetic current meter is shown in Figure 10.

4. Results and Analysis of Ocean Experiments

After the development of the electromagnetic current meter, the static water repeatability, laboratory pool, and sea comparison tests were completed. Offshore operations have been carried out for over one year to test the accuracy of measurements and the adaptability and reliability of long-term offshore applications.

4.1. Static Water Repeatability Test

In the case of still water, external water current fluctuations and electromagnetic interferences are eliminated as far as possible. The electromagnetic current meter measures the velocity in still water, in Figure 11, the standard deviation is calculated using the multiple measurement data, and the repeatability is calculated according to the 2σ principle. Test data are shown in Table 1. The maximum standard error of multiple measurement velocity is 0.116 cm/s, and the repeatability calculated according to the principle of 2σ is better than 0.25 cm/s.

4.2. Indoor Driving Comparison Test

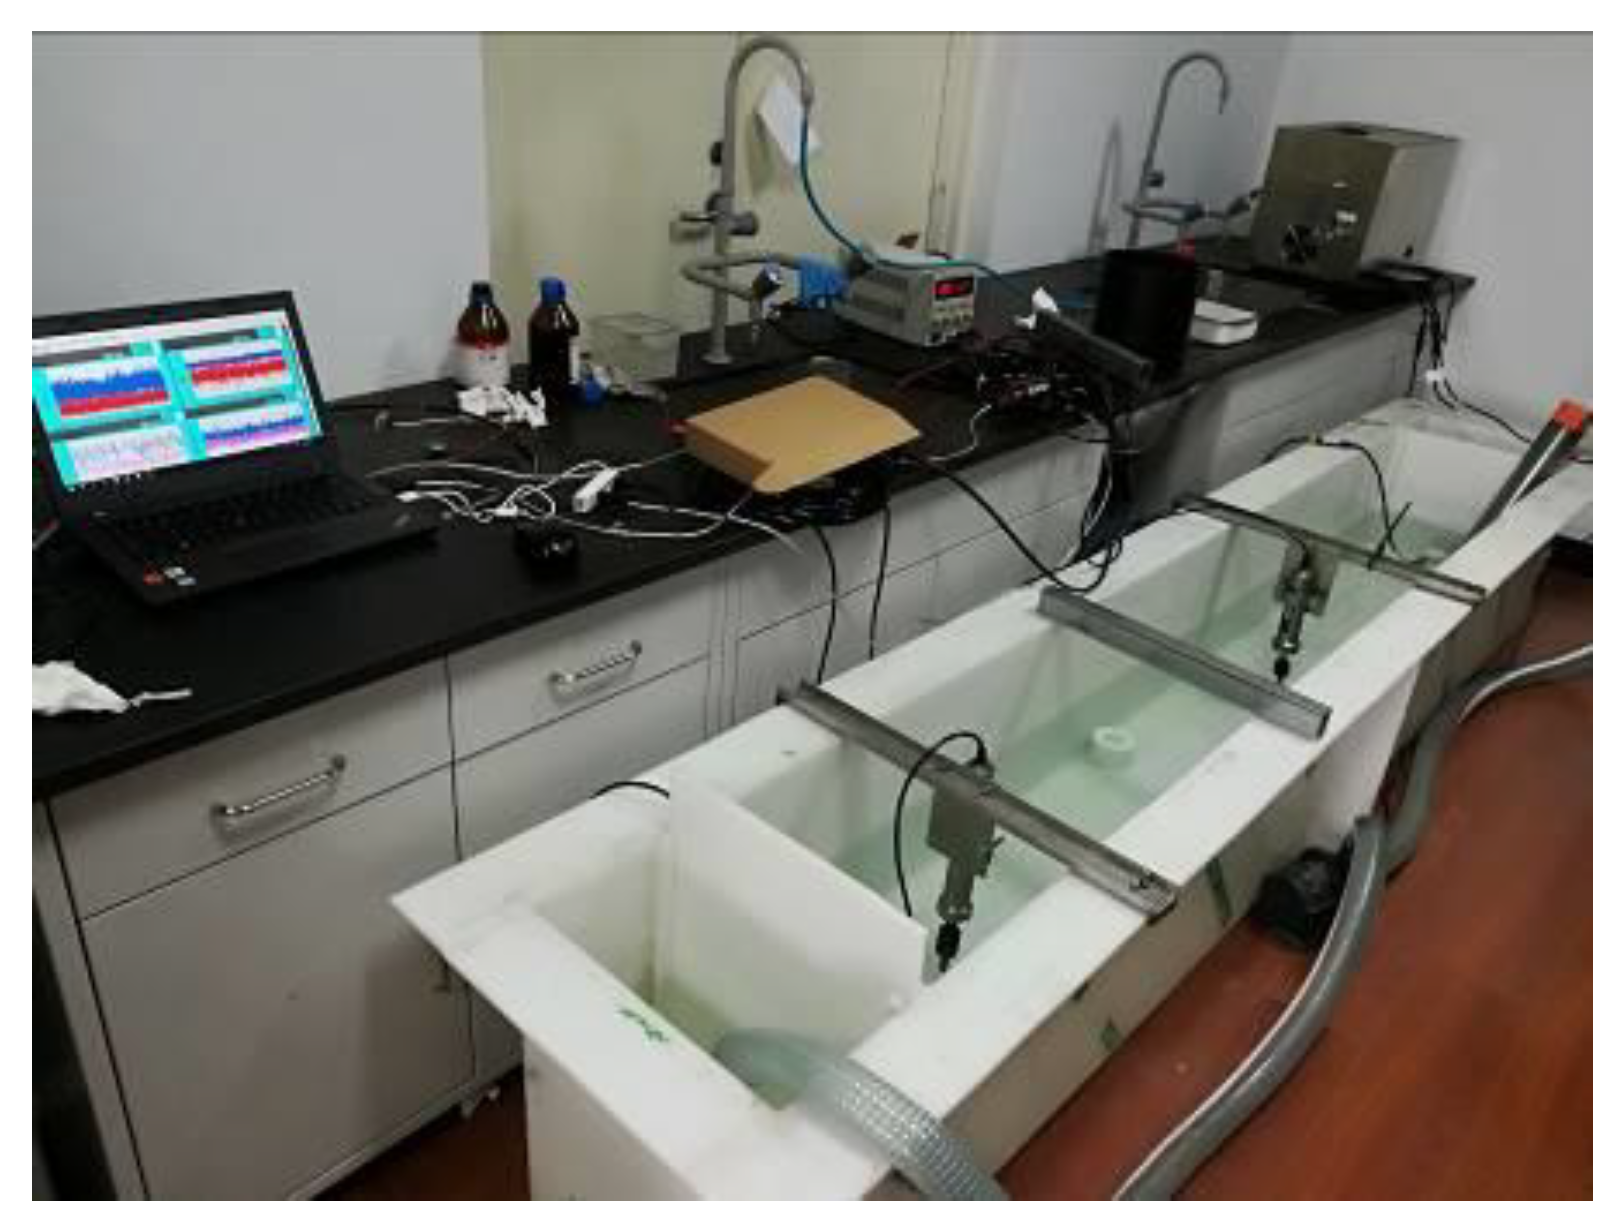
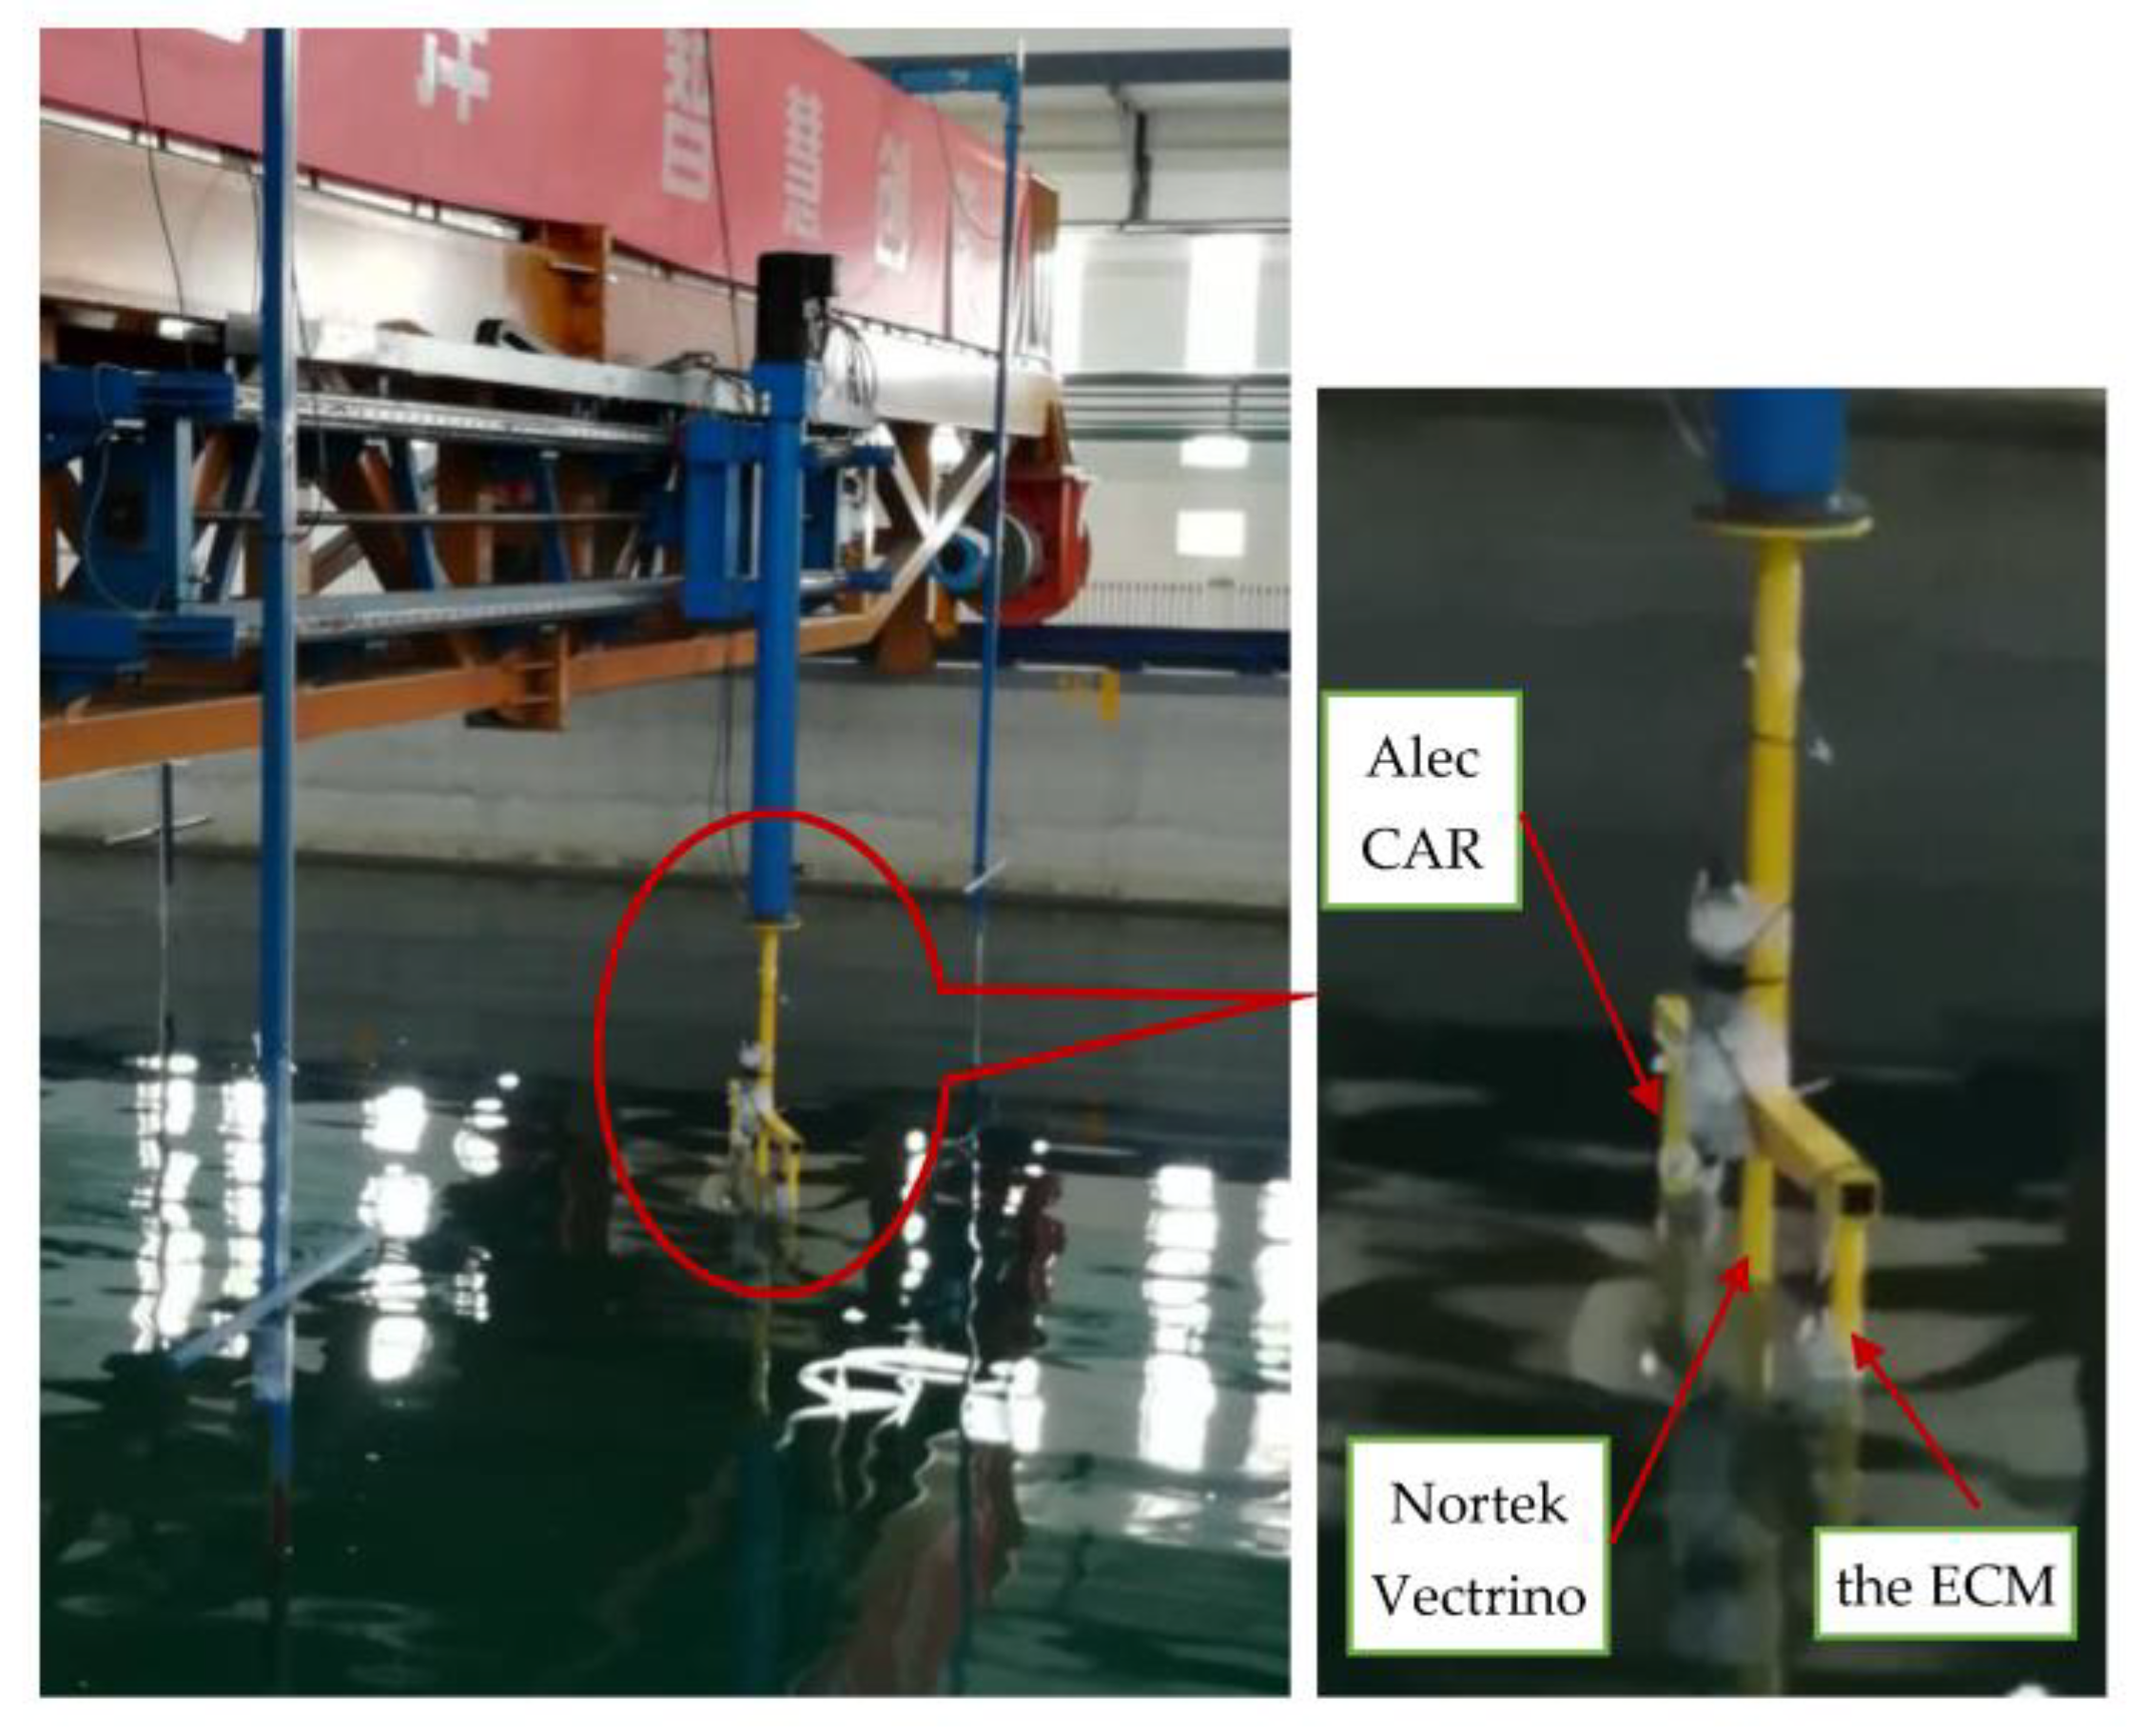
The comparison test of electromagnetic current meters was carried out in the pool of the National Ocean Technology Center in Figure 12. A Nortek Vectrino Profiler (current velocity 0~4 m/s, accuracy ± 0.5% v ± 1 mm/s) and Alec CAR electromagnetic current meter (current velocity 0~5 m/s, accuracy ± 2% v, current direction 0~360°, accuracy ± 2°) were used as comparison equipment. The experimental pool was 100 m long, 10 m wide, and 5 m deep, and the driving speed ranged from 0 to 4 m/s.
To verify the measurement accuracy of the self-developed instrument, comparative experiments were carried out at the current velocities of 30 cm/s, 50 cm/s, 100 cm/s, and 150 cm/s, and the repeatability was calculated at different current velocities. Results are shown in Table 2. When the velocity is less than 1 m/s, the velocity repeatability is better than 1.5 cm/s, and the current direction is better than 1.5°. When the velocity is higher than 1 m/s, the velocity repeatability is better than 6.5 cm/s, and the current direction is better than 2°. The consistency of data between self-developed equipment and comparison equipment is very good, and the error is mainly caused by driving vibration and environmental electromagnetic interference.

4.3. Marine Experiment

Comparison test between the ECM and Nortek ADCP installed on buoy at the same time.
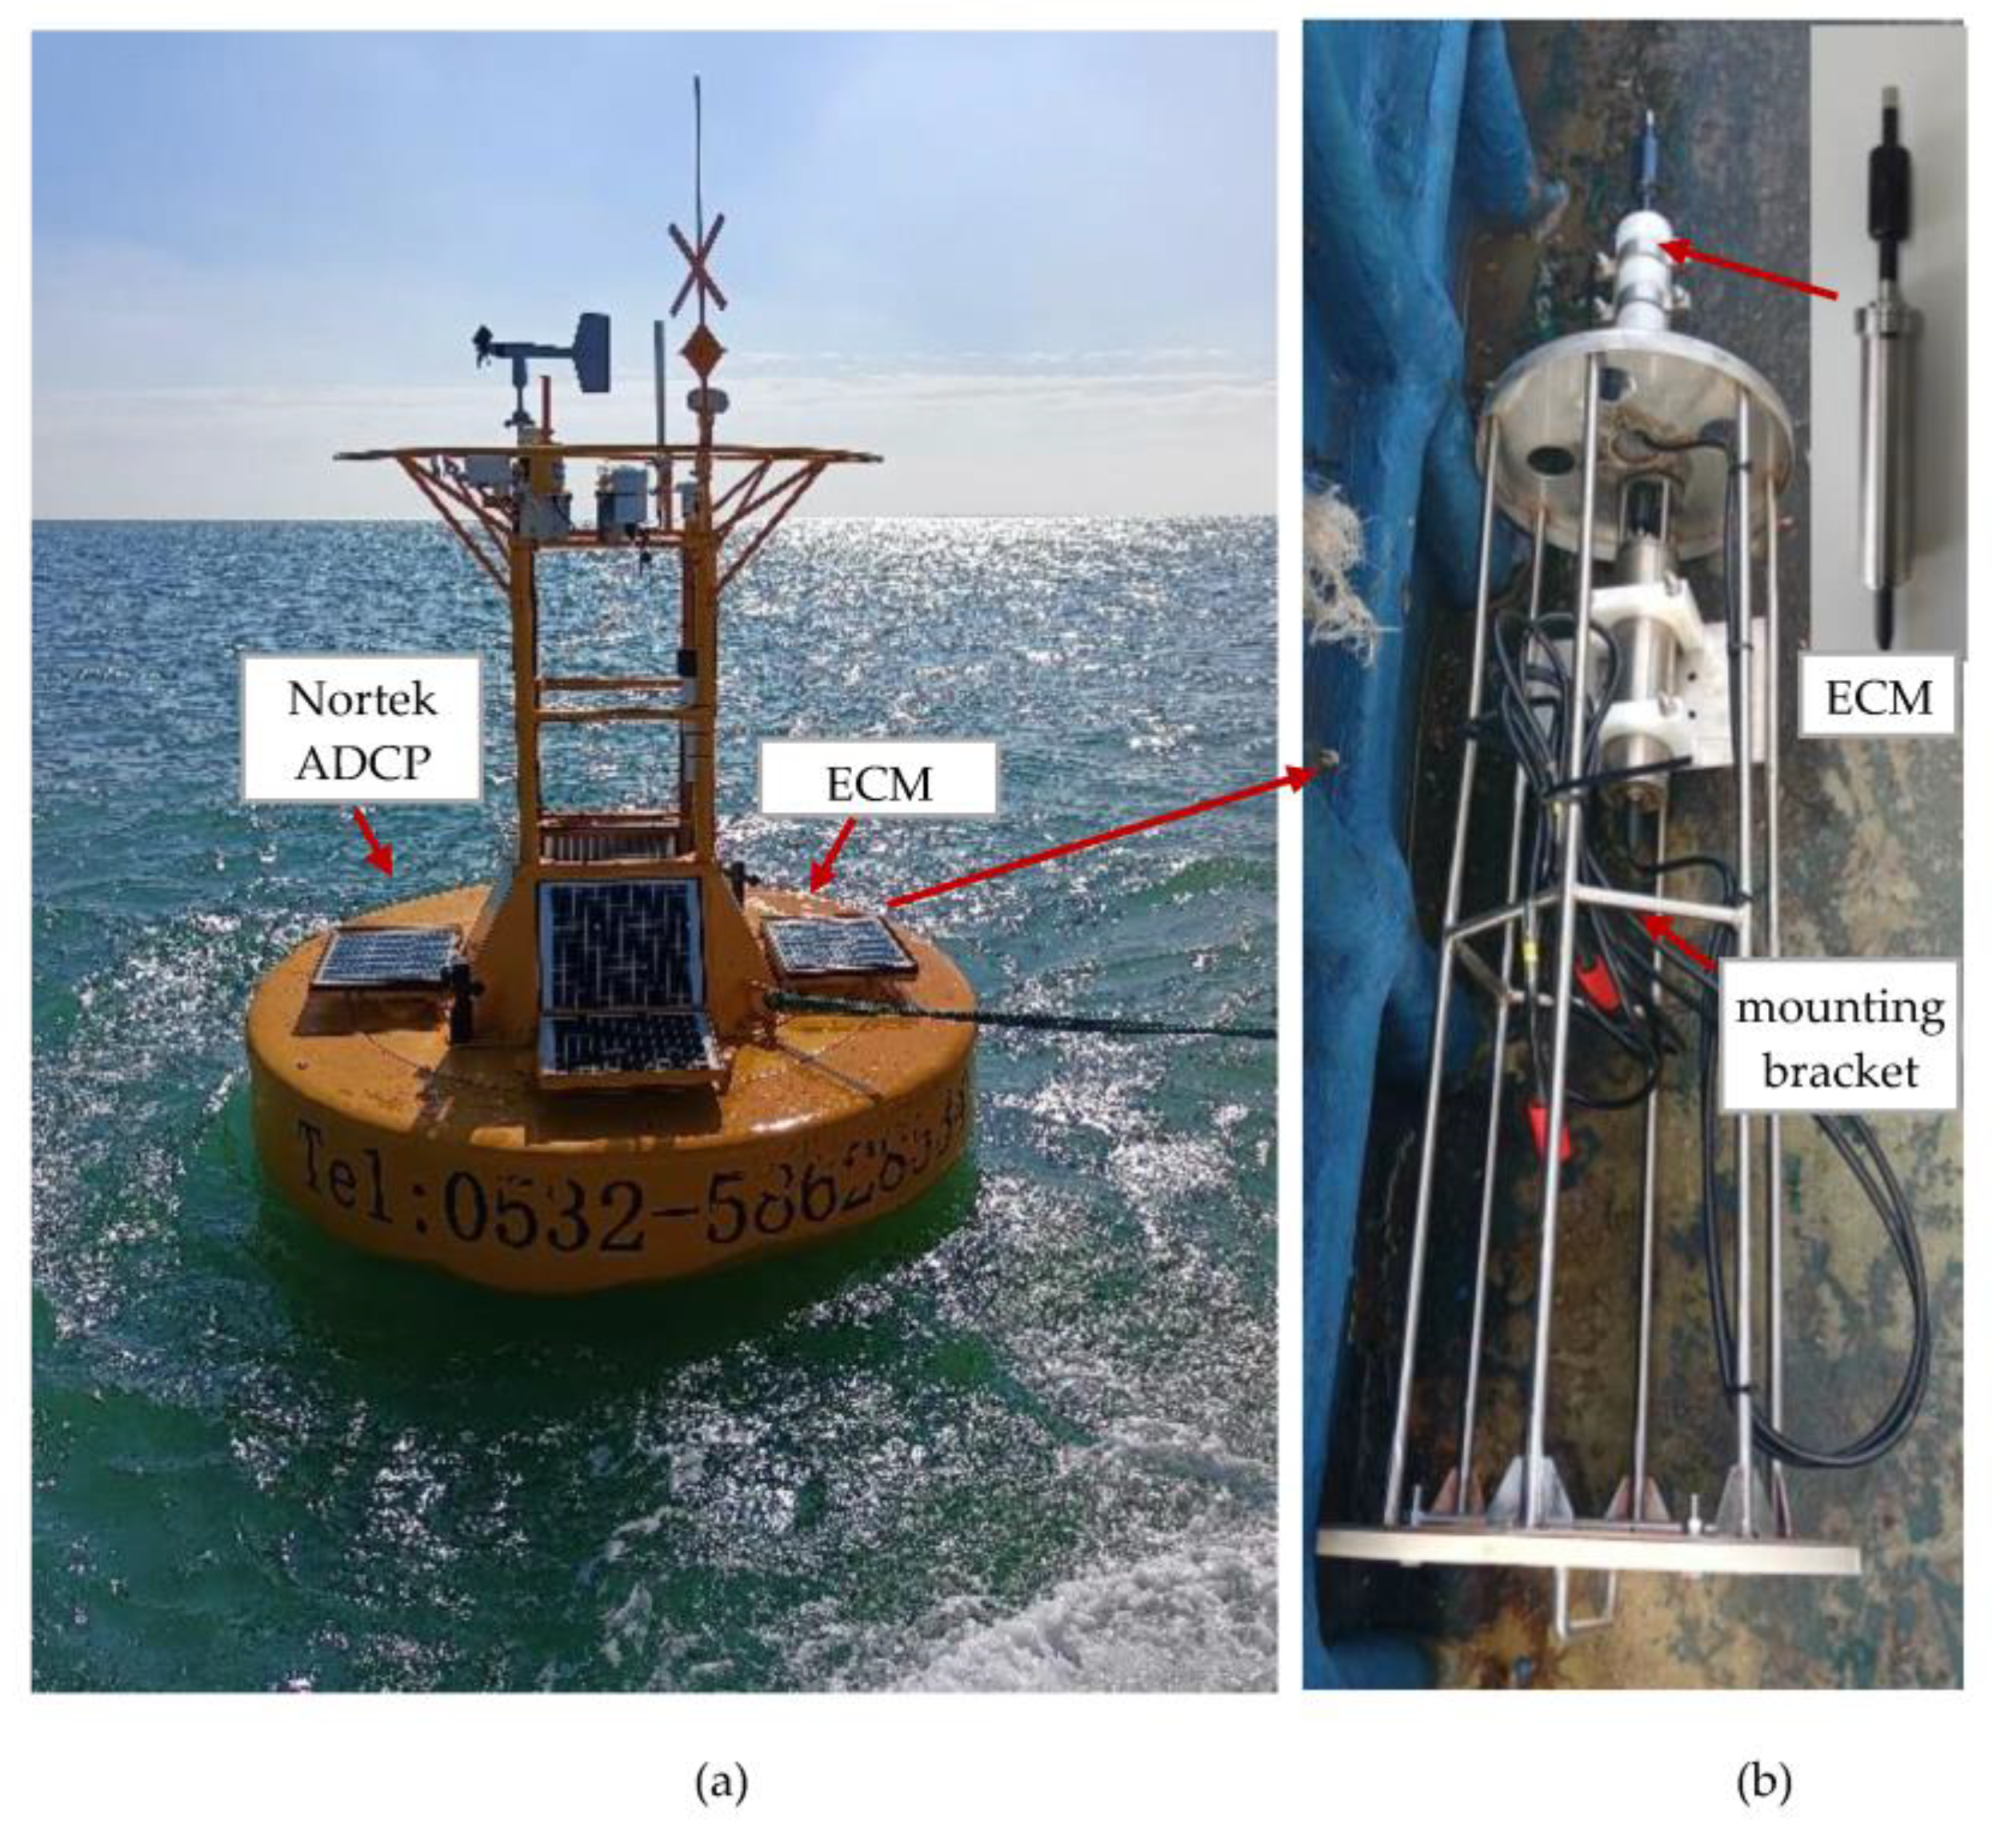
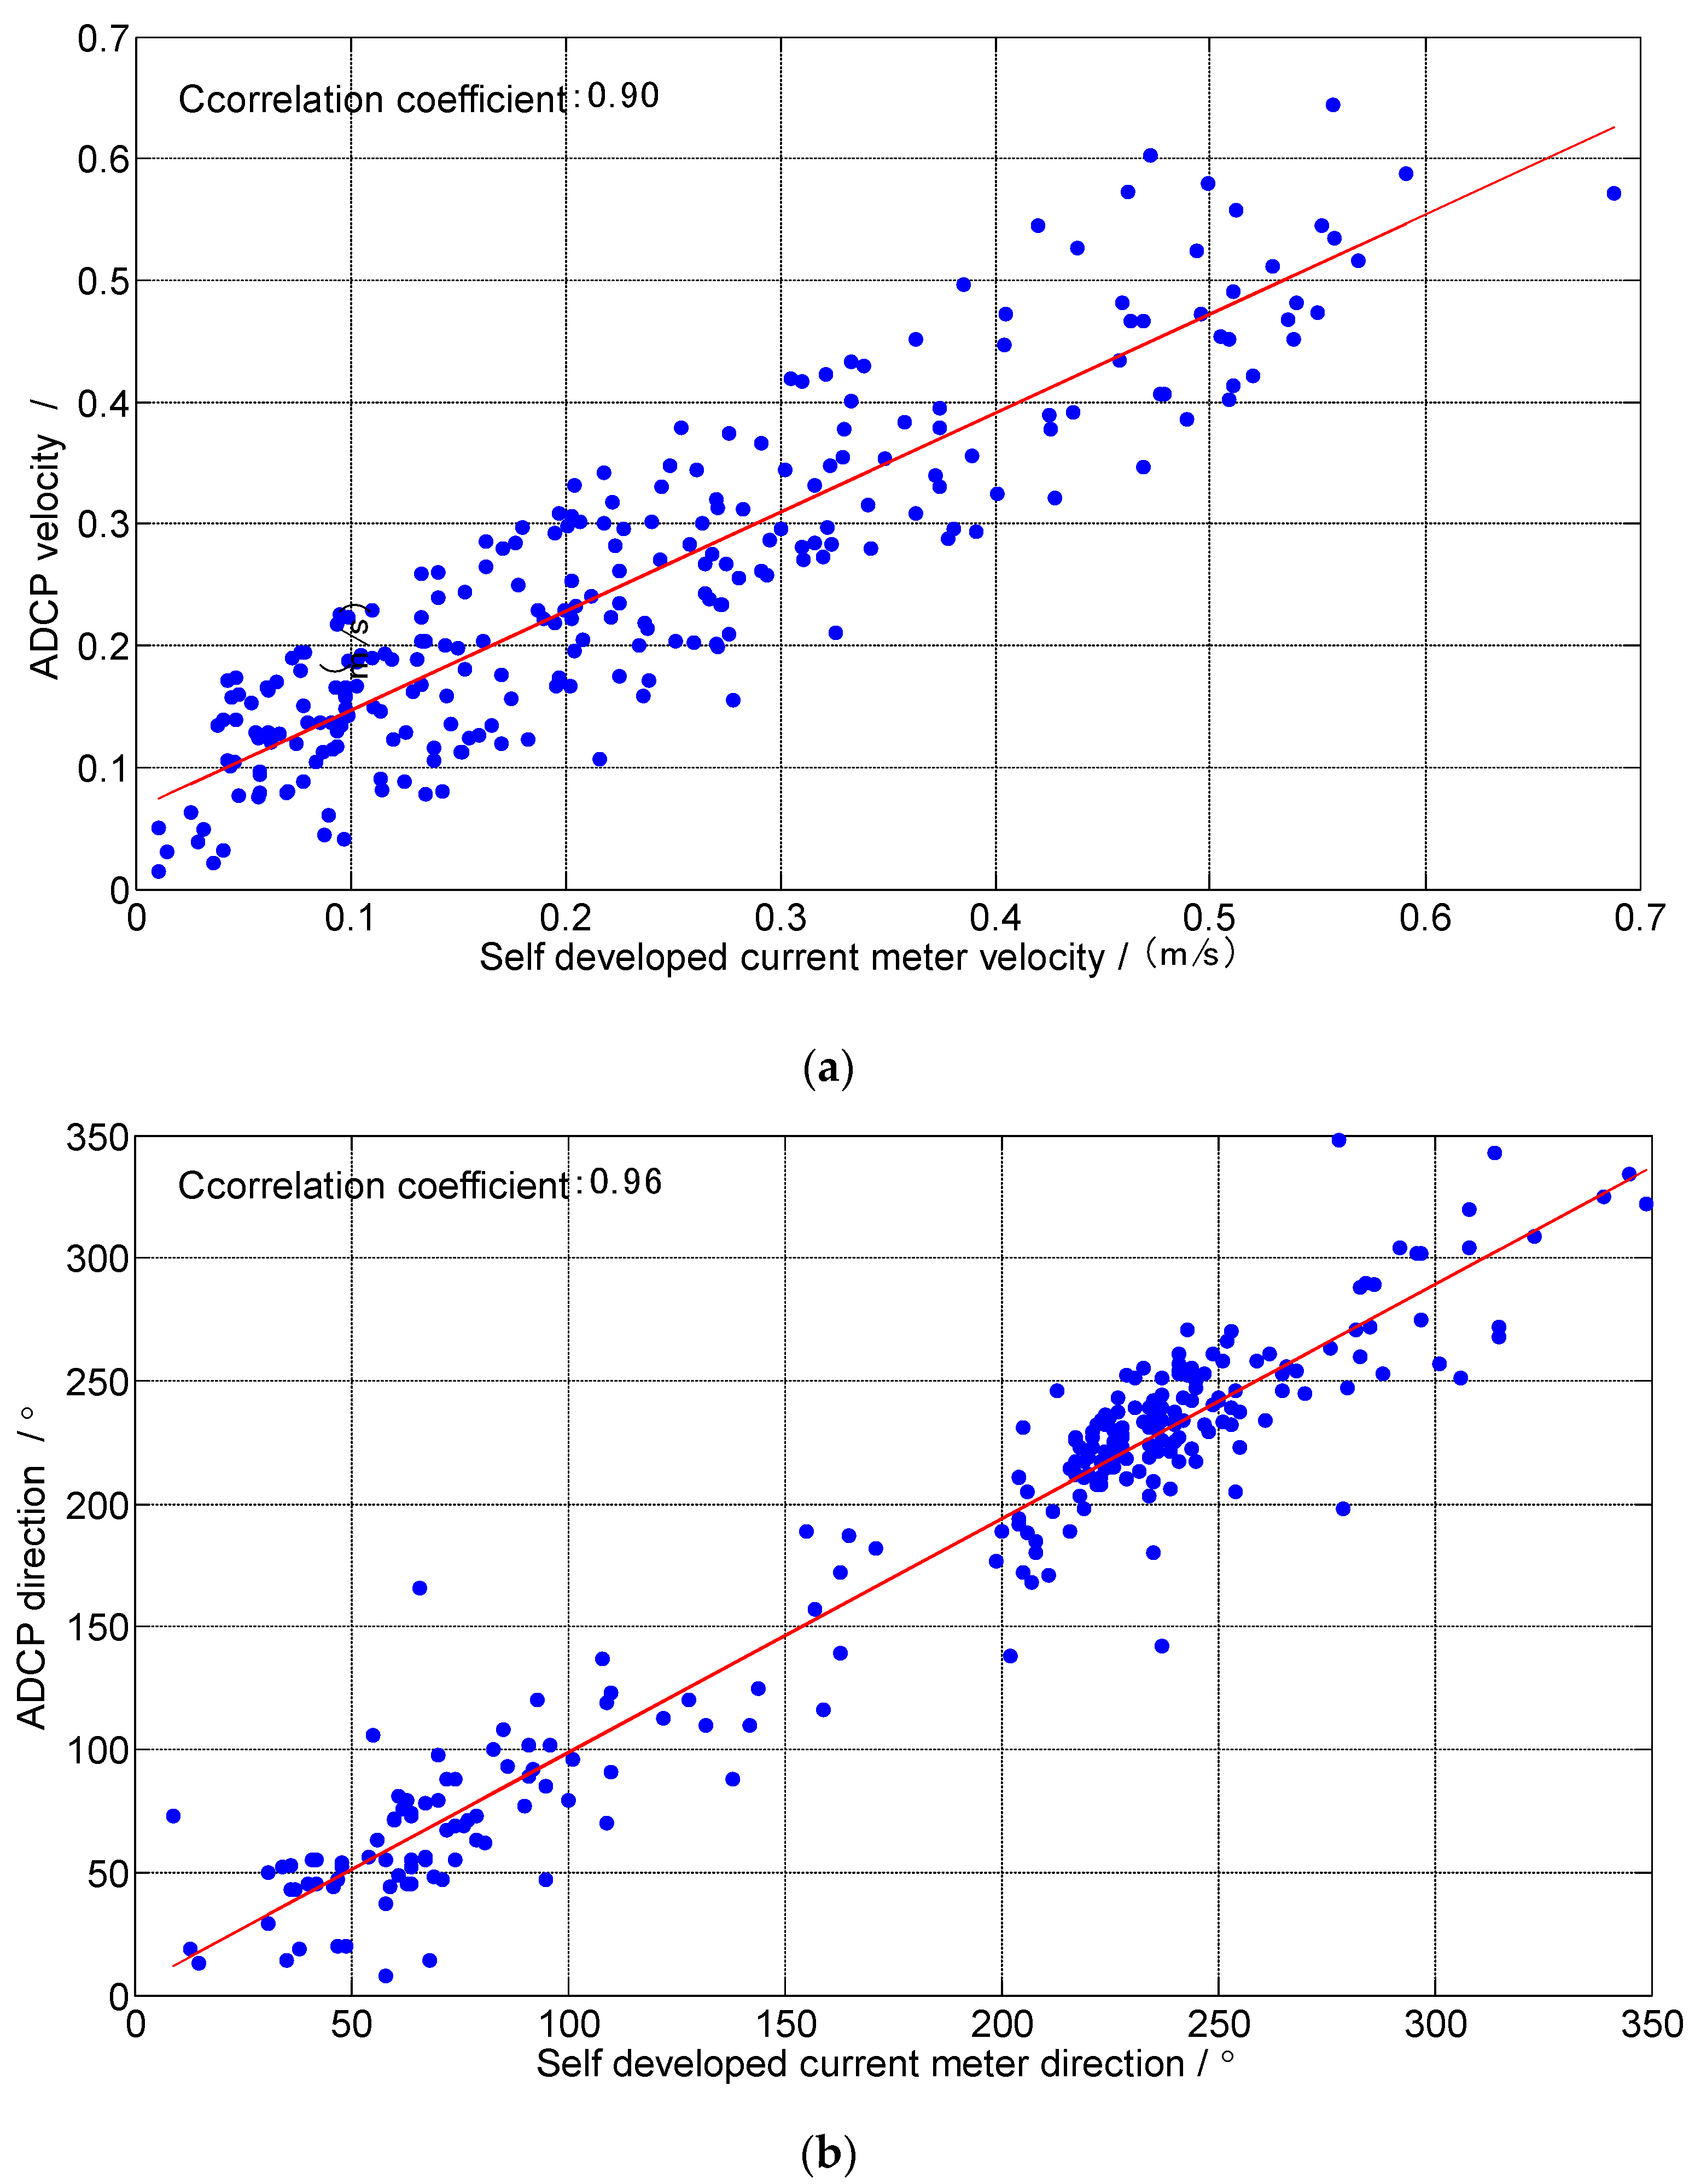
In order to further test the performance of the electromagnetic current meter (ECM), the ECM and the ADCP of Nortek company in Norway (current velocity ± 10 m/s, accuracy ± 0.5 cm/s, current direction 0~360°, accuracy ± 2°) were installed in two underwater mounting brackets of the same 3 m buoy. The buoys were deployed in the sea with a depth of nearly 20 m off the coast of Qingdao in October 2021, as shown in Figure 13. The comparison test was carried out with a sampling interval of 1 h. The correlation between the measured datum of the two devices was calculated. As shown in Figure 14 and Figure 15, the ten days observation datum from October 1st to October 10th shows that the trends of the current velocity and current direction of the two devices are consistent. The correlation coefficients of the current velocity and current direction datum are 0.90 and 0.96, respectively, indicating that the datum measured by the ECM are effective.
The main reason for the difference in comparison data may be that the two sensors are installed at different positions on the buoy and the buoy sway. The horizontal distance between the ECM and the Nortek ADCP is about 2 m, which is basically the shortest distance to install two current meters on the buoy. In the actual ocean, there will be a certain difference in the current velocity and current direction of these two positions. In addition, the buoy will inevitably sway in the ocean, which further expands the difference between them. There is a certain difference between the electromagnetic current meter and Nortek ADCP, which cannot fully be considered as the error of the electromagnetic current meter. So we can only compare their relevance. The good correlation between the two sensors indicates that the performance of the electromagnetic current meter and ADCP is almost equivalent.

5. Conclusions

Faced with the difficulty to detect weak current signals in a complex marine environment, an electromagnetic induction current measurement scheme based on lock-in amplifier technology is proposed, and its key technologies, such as induced current intensity evaluation, overall design, circuit design, and orientation design are studied. An electromagnetic current meter prototype is developed, and laboratory and sea tests are carried out. A comparison test between the electromagnetic current meter prototype and Nortek ADCP installed on a buoy at sea were carried out, and the correlation coefficients of the current velocity and current direction datum were 0.90 and 0.96, respectively. The performance of the electromagnetic current meter reaches the international advanced level. It has good adaptability at sea, which provides feasible technical and equipment support for ocean current observation. Based on the advantages of small size and low price, the electromagnetic current meter can be widely used in ocean observation buoys, ships, ocean observation stations, and other fields, with a very broad application prospect.

Author Contributions

Conceptualization, S.C., Y.W., S.L. and X.W.; methodology, Y.W., Y.Y. and X.W.; software, Y.W. and X.Y. (Xianglong Yang); validation, B.W. and X.Y. (Xingkui Yan); formal analysis, S.C., Y.W.; data curation, B.W. and X.Y. (Xingkui Yan); writing—original draft, S.C., Y.W. and K.Z.; writing-review and editing, Chen, S.C., Y.W. and K.Z.; supervision, S.L.; project administration, S.L.; funding acquisition, S.L. All authors have read and agreed to the published version of the manuscript.

Funding

This work is supported by the National Natural Science Foundation of China (41976179), National Key Research and Development Program of China (2017YFC1403303).

Institutional Review Board Statement

Not applicable.

Informed Consent Statement

Not applicable.

Data Availability Statement

The data supporting this study have been provided within this paper.

Acknowledgments

We would like to especially thank all teams involved in the research and development for their help.

Conflicts of Interest

The authors declare that the research was conducted in the absence of any commercial or financial relationships that could be construed as a potential conflict of interest.

References

  1. Zhang, Z.H.T.; Yang, S.H.L.; Gu, G.C.H. Development and Present Situation of Marine Current Meter in China. Ocean Techn. 1999, 18, 17–21. [Google Scholar]
  2. Poulain, P.-M.; Centurioni, L.; Özgökmen, T. Comparing the Currents Measured by CARTHE, CODE and SVP Drifters as a Function of Wind and Wave Conditions in the Southwestern Mediterranean Sea. Sensors 2022, 22, 353. [Google Scholar] [CrossRef] [PubMed]
  3. Song, D.L.; Zhou, X.J.; Chen, Z.H.; Zhou, L.Q.; Zheng, J.M. On Development Course and Trend of the Current Meter. Ship Ocean Eng. 2017, 46, 93–100. [Google Scholar] [CrossRef]
  4. Qiao, Z.M.; Chen, C.; Wu, Y.Z.; Zhu, J. Development Status and Application of Current Meters. Ocean Dev. Manag. 2021, 12, 85–92. [Google Scholar] [CrossRef]
  5. Wullenweber, N.; Hole, L.R.; Ghaffari, P.; Graves, I.; Tholo, H.; Camus, L. SailBuoy Ocean Currents: Low-Cost Upper-Layer Ocean Current Measurements. Sensors 2022, 22, 5553. [Google Scholar] [CrossRef] [PubMed]
  6. Le Menn, M.; Morvan, S. Velocity Calibration of Doppler Current Profiler Transducers. J. Mar. Sci. Eng. 2020, 8, 847. [Google Scholar] [CrossRef]
  7. Guelke, R.W.; Schoute-Vanneck, C.A. The measurement of sea-water velocities by electromagnetic induction. J. Power Eng. 1947, 94, 71–74. [Google Scholar]
  8. Beardsley, R.; Briscoe, M.; Signell, R.; Longworth, S. A VMCM S4 current meter intercomparison on a surface mooring in shallow water. In Proceedings of the 1986 IEEE Third Working Conference on Current Measurement, St. Petersburg, FL, USA, January 1986; pp. 7–12. [Google Scholar]
  9. Macvicar, B.; Beaulieu, E.; Champagne, V.; Roy, A.G. Measuring water velocity in highly turbulent flows: Field tests of an electromagnetic current meter (ECM) and an acoustic Doppler velocimeter (ADV). Earth Surf. Process. Landf. 2007, 32, 1412–1432. [Google Scholar] [CrossRef]
  10. Group 205, Institute of Marine Instruments. Type HLL2-A electromagnetic current meter and its application. Mar. Technol. 1980, 205, 1–13. [Google Scholar]
  11. Liu, N.; He, H.K. Study on the theory of expendable current profile measurement. Ocean Techn. 2010, 29, 8–11. [Google Scholar]
  12. Zhang, Q.S.H.; Deng, M.; Liu, N.; Kong, Y.G.; Guan, S.H.L. Development of the expendable current profiler. Chin. J. Geophys. 2013, 56, 3699–3707. [Google Scholar] [CrossRef]
  13. Zhou, Q.W.; Bai, Y.; Feng, Z.H.; Wang, X.Y.; Wang, Y.W. Reviews and Application of Ocean Current Measurement. Hydrograph. Surv. Chart. 2018, 38, 73–77. [Google Scholar] [CrossRef]
  14. Wang, B.Q.; Liu, J.; Zhou, F. Development and trends of excitation technology of electromagnetic flowmeter. Heilongjiang Sci. 2019, 10, 46–47. [Google Scholar]
  15. Bakharev, P.V.; McIlroy, D.N. Signal-to-Noise Enhancement of a Nanospring Redox-Based Sensor by Lock-in Amplification. Sensors 2015, 15, 13110–13120. [Google Scholar] [CrossRef] [PubMed] [Green Version]
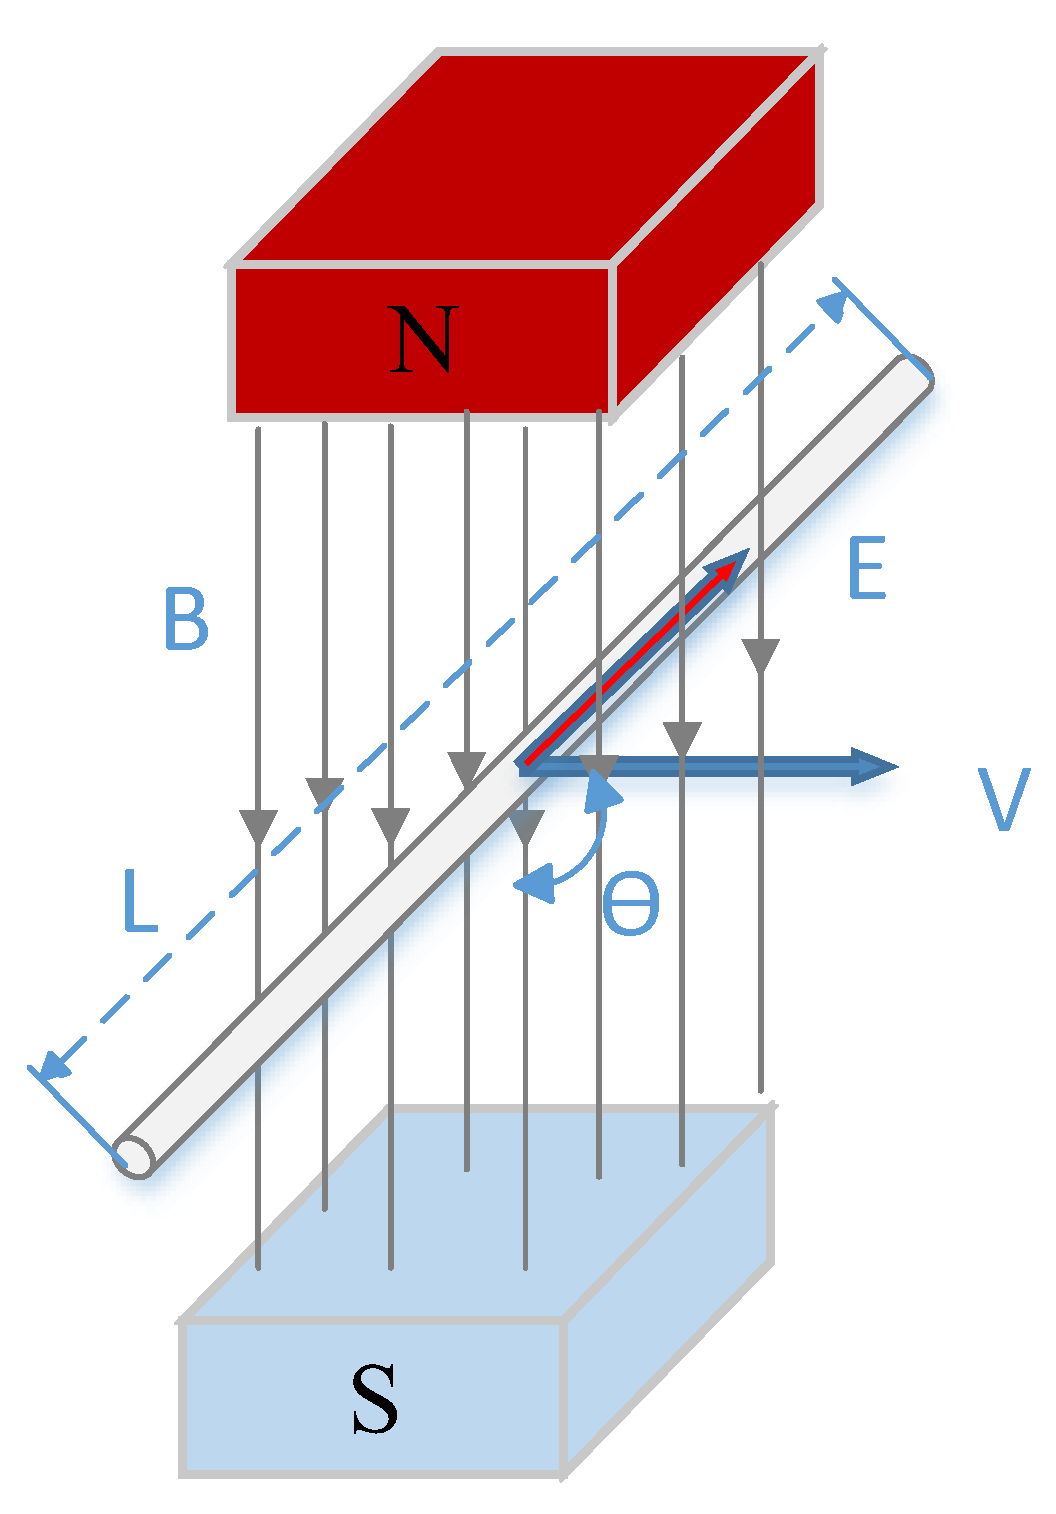
Figure 1. Measuring principle diagram of electromagnetic current meters.
Jmse 11 00206 g001
Figure 2. Diagram of coordinate system transformation.
Jmse 11 00206 g002
Figure 3. Schematic diagram of electromagnetic current meters.
Jmse 11 00206 g003
Figure 4. Structure diagram of a lock-in amplifier.
Jmse 11 00206 g004
Figure 5. Phase-sensitive measurement waveform.
Jmse 11 00206 g005
Figure 6. Azimuth sensor block diagram.
Jmse 11 00206 g006
Figure 7. Flow chart of electromagnetic current measurement.
Jmse 11 00206 g007
Figure 8. Electromagnetic current meter shape.
Jmse 11 00206 g008
Figure 9. Analog & Digital signal processing board.
Jmse 11 00206 g009
Figure 10. Electromagnetic current meter picture.
Jmse 11 00206 g010
Figure 11. Repeatability test in still water.
Jmse 11 00206 g011
Figure 12. Indoor driving comparison test.
Jmse 11 00206 g012
Figure 13. The test 3 m buoy and the ECM. (a) The test 3 m buoy. (b) the ECM and underwater mounting bracket.
Jmse 11 00206 g013
Figure 14. Comparison of the velocity and direction curves between ECM and Nortek ADCP. (a) Current velocity. (b) Current direction.
Jmse 11 00206 g014aJmse 11 00206 g014b
Figure 15. Correlation of the velocity and direction datum between ECM and Nortek ADCP. (a) Current velocity. (b) Current direction.
Jmse 11 00206 g015
Table 1. Hydrostatic velocity repeatability test (cm/s).
No.Group 1Group 2Group 3Group 4Group 5
10.48 0.45 0.40 0.31 0.22
20.43 0.38 0.33 0.53 0.19
30.56 0.44 0.34 0.37 0.10
40.31 0.56 0.37 0.38 0.39
50.58 0.38 0.31 0.27 0.27
60.36 0.18 0.49 0.27 0.23
70.34 0.40 0.32 0.38 0.20
80.56 0.29 0.52 0.13 0.28
90.57 0.61 0.29 0.33 0.35
100.31 0.38 0.31 0.39 0.48
Standard deviation0.108 0.116 0.075 0.099 0.104
Table 2. Repeatability test of indoor running velocity (cm/s).
No.Current Velocity 30 cm/sCurrent Velocity 50 cm/s
Current VelocityCurrent DirectionCurrent VelocityCurrent Direction
131.58243.2848.69244.42
231.91242.7649.16244.13
331.93243.0849.97243.19
431.27243.7848.67244.89
530.87243.4548.19244.87
631.09243.0851.12243.96
730.78244.2448.57245.45
831.08243.3249.15244.81
930.80242.9948.99244.82
1029.61244.6649.21245.02
average value31.09243.4649.17244.55
standard deviation0.6390.5670.7920.616
No.Current Velocity 100 cm/sCurrent Velocity 150 cm/s
Current VelocityCurrent DirectionCurrent VelocityCurrent Direction
199.37243.51160.11243.49
299.94242.29169.50242.08
396.86242.85166.86242.76
499.85242.96163.76242.96
597.85244.16163.24243.70
697.09243.68163.27244.20
796.52242.71165.48243.60
896.83242.10161.77244.50
998.53242.78164.97244.16
1095.86243.85161.90243.51
average value97.87243.09164.08243.50
standard deviation1.3950.6492.5930.695
Disclaimer/Publisher’s Note: The statements, opinions and data contained in all publications are solely those of the individual author(s) and contributor(s) and not of MDPI and/or the editor(s). MDPI and/or the editor(s) disclaim responsibility for any injury to people or property resulting from any ideas, methods, instructions or products referred to in the content.