Abstract
An ultra-deep L-shape foundation pit in a coastal area has recently been constructed and monitored. The project overview, geological conditions, excavation sequence and monitoring scheme are introduced in detail. The deformation of the retaining structure and surrounding strata are analyzed in detail through the measured data and 3D numerical simulation. The results show that the exceptional performance of the current project is due to the combination of under-excavation and over-excavation during construction. The under-excavation procedure restrained the wall deflections at the middle part of the diaphragm wall, making the corner effects at the corresponding side inapparent. Both the under-excavation and over-excavation procedure can only influence the performance of the excavation in close proximity, while having negligible impacts on the normally excavated areas. Based on the results of this study, practical suggestions are given to improve the performance of similar excavations in the future.
1. Introduction
Shanghai is a role model city in developing underground space in China, in which the available underground space has been extensively exploited. Thus, new underground projects are inevitably surrounded by numerous other projects. In addition, Shanghai is located on the east coast of China and the most covered soils in the area are mainly composed of marine sediments and are characterized by a high water content, high compressibility, low shear strength, and low bearing capacity, which are very unfavorable to underground constructions [1,2,3,4,5]. Therefore, it is a great challenge to construct new underground projects in the area. Due to the complexity of deep excavations, it is impossible to consider every site scenario during the design process. Therefore, field monitoring is the most intuitive method to guarantee project safety. Field monitoring can provide immediate feedback to engineers, so that appropriate countermeasures can be timely adopted [6,7,8,9,10]. In addition, well-documented field data provide high-quality information for researchers to calibrate and validate theoretical and numerical methods, and thus improve their ability to predict the behaviors of future projects [11,12,13,14]. Moreover, currently, excavation design relies mainly on empirical or semi-empirical approaches established from field data [15,16,17,18]. Meanwhile, numerical simulation is also widely used in the analysis of foundation pit excavation and construction technology optimization [19,20,21]. Various scholars have also used the centrifugal model test to study the deformation characteristics of foundation pit excavation [22,23,24,25,26].
The basement excavation described in this paper was constructed with the bottom-up method for an underground substation in Shanghai (i.e., the Shanghai Jimo Substation project). The project is of particular interest because both over-excavation and under-excavation occurred during the construction, making its excavation-induced performance somewhat abnormal. Over-excavation refers to an excavation depth that exceeds the planned excavation depth, while under-excavation refers to an excavation depth that does not reach the planned excavation depth. In order to evaluate the performance of the excavation, as well as to investigate the influence of the under-excavation and over-excavation procedure, a case study based on this project was carried out. The subsurface conditions, earth-retaining system, and construction procedures of the project are introduced in detail. Furthermore, the field measurements of the diaphragm wall deflections, the ground settlements, the axial forces of struts, the vertical movements of the interior columns and wall tops, and the groundwater levels outside the excavation are reported, analyzed, and discussed. Finally, a series of three-dimensional analyses were carried out to quantify the impact of different construction procedures.
In contrast to the previous work, which generally focuses on the structural aspects of deep excavations and the corresponding interaction with the adjacent properties, this paper investigates the influence of different construction procedures on the performance of deep excavations. The reported project and the relevant data facilitate a thorough understanding of the general performance of deep excavations constructed by the bottom-up method in soft clays. In addition, the numerical study based on this project provides valuable references and practical suggestions for future projects.
2. Project Information
2.1. Site and Structure Description
The investigated pit was excavated for a 220 kV underground substation in the Pudong District of Shanghai. The site plan of the project and the instrumentation layout for field measurement are presented in Figure 1. As shown in the figure, the site of the project was a triangular area surrounded by Yincheng Road, Rizhao Road, and Changyi Road. There was a two-story masonry building on Changyi Road, with a distance of 17.3 m to the excavation. On Rizhao Road, there was an eleven-story steel-reinforced residential building, a three-story masonry building, and an eighteen-story steel-reinforced building with distances of 34 m, 47 m, and 55 m, respectively, to the pit. In addition to these buildings, the excavation was also surrounded by numerous utility pipelines buried at depths of 1–2.5 m below the ground surface (BGS).
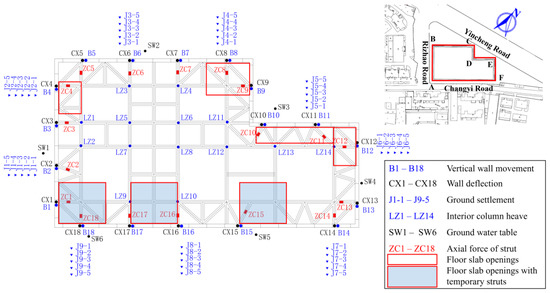
Figure 1.
Site plane and instrumentation layout of the project.
The excavated pit was 4569 m2 in length and with an excavation depth of 22 m. The excavation was constructed using the bottom-up method and supported by a braced concrete diaphragm wall. The 1.2 m thick diaphragm wall reached a depth of 53 m BGS and was supported by five levels of reinforced concrete struts installed separately at 0.9 m, 6.4 m, 10.4 m, 13.7 m, and 18 m BGS. A typical cross-section of the retaining system is presented in Figure 2. In order to ensure the stability of the slurry trenches during walling, subsoils around the diaphragm wall were strengthened by three-axis stirring piles with a diameter of 850 mm before the diaphragm wall installation. These stirring piles also formed a barrier for cutting off groundwater.
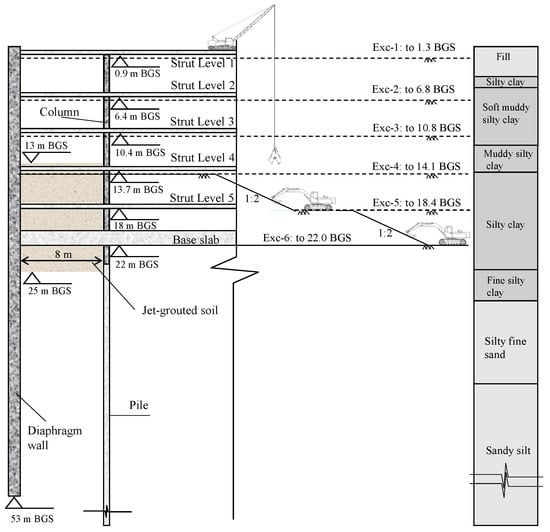
Figure 2.
A typical cross section of the Jimo project.
The site work began with the construction of the diaphragm wall, the vertical column piles, and the engineering piles. At the same time, the soils inside the excavation (with a width of 8 m and within the vertical range of 6 m above and 3 m below the final excavation level, as specified in Figure 2) were reinforced by jet-grouting. These activities were finished before 8 February 2013. The compaction grouting was conducted to prevent horizontal wall movements and basal heave. The measured unconfined compression strength of the reinforced soil 28 days after the completion of grouting was required to be more than 0.8 MPa by design. Nevertheless, in excavation practice within the Shanghai area, the quality of compaction grouting is difficult to control because of the complex subsoil condition. In most projects, according to Tan and Wei [27], the reinforcement layers below the bottom of the excavation simply functioned as barriers for cutting off the water flow, while failing to prevent the lateral movements of the diaphragm walls. After this, the main excavation process was initiated. During the process, the removal of the subsoils and the installation of the strutting components were conducted alternatively.
In principle, the groundwater level inside the pit should always be reduced to 1 m below the excavation bottom before each excavation stage. However, the contractor reported that the process had drained minimal water during the excavation of the clayey soil layers. In addition, the confined water level was also lowered when the excavation depth was increased to prevent potential upheaval failure. The excavation process ended with the completion of the base slab on 21 July 2013. It should be noted that parts of the monitoring system were not initiated until the completion of the ground layer struts. Hence, some displacements (e.g., wall deflections, struts forces, and vertical structural movements) developed that were not recorded.
The approximate schedule of the construction procedure is shown in Figure 3. According to the figure, the actual scheme adopted by the contractor was quite fuzzy (i.e., overlapping between adjacent stages always occurred), which indicates that both over-excavation and zone excavation occurred during the construction.
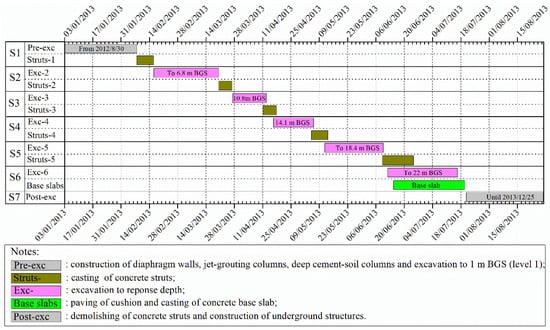
Figure 3.
Main construction sequences of the project.
2.2. Subsurface Conditions
Prior to construction, the subsurface conditions and soil properties at the site were extensively explored by a series of in situ tests and laboratory tests. Figure 4 summarizes the soil profiles and part of the measured soil properties, along with the depth of the soil. The soil properties presented in the figure are generally derived from the results of a series of in situ tests and laboratory tests, while the stratigraphy is an average value of the site. These test results indicate that the soft soils in the upper layers (i.e., the upper 25 m) in this site feature a high water content, high void ratio, high compressibility, and low strength.
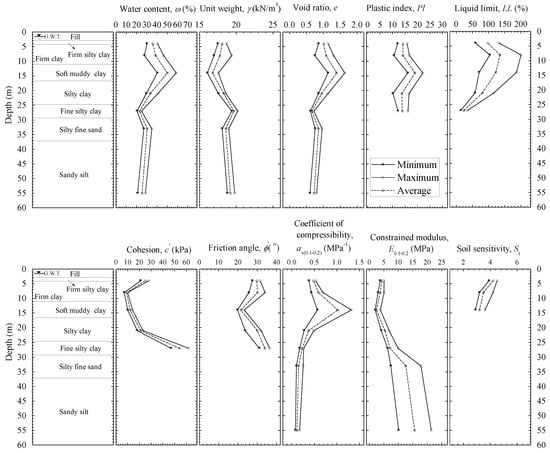
Figure 4.
Soil profiles and material properties at the site.
2.3. Instrumentation
In order to ensure the safety of the project, a long-term comprehensive field instrumentation program was conducted. The monitored items include the lateral wall deflections, the horizontal and vertical movements at the top of the wall, the ground settlements outside the excavation, the vertical movements of the columns, the strut forces, and the groundwater tables outside the excavation. The monitoring scheme was formulated according to the specification for engineering measurement (GB50026-2007), specification for first- and second-order leveling (GB12897-2006), building foundation pit monitoring technical specifications (GB50497-2009) and monitoring rules for the construction of foundation pit engineering in Shanghai (DG/TJ08-2001-2006). The detailed instrumentation layout of the project is shown in Figure 1.
The wall deflections were measured by 18 inclinometer tubes (i.e., CX1~CX18) affixed to the steel reinforcement cages before concrete casting. Unfortunately, these inclinometer tubes generally had lengths of approximately 25~30 m and they failed to reach the toe of the diaphragm wall, leaving the displacements at the wall toe unknown. In addition, nine typical sections (i.e., J 1-1 to J 1-5 through J 9-1 to J 9-5) were instrumented with level instruments to monitor the ground settlements behind the diaphragm wall. These monitored points ranged from 5 m to 25 m away from the diaphragm wall and were spaced 5 m apart. The monitored points of the wall top, namely B1~B18, were equipped at the top of each inclinometer tube. In terms of the vertical movements of the columns, only 14 typical locations (i.e., LZ1~LZ14) were monitored. The strut forces were measured by vibrating wire stress meters (i.e., ZC 1~ZC 18), and the groundwater tables outside the excavation were monitored by six standpipe piezometers (SW1~SW6).
In addition to the performance of the excavation itself, the properties (e.g., buildings, roads, and utility pipelines) adjacent to the pit were also surveyed during the construction. However, since the primary concern of this study is the performance of the excavation, only typical field measurements that can reflect the excavation-induced displacement field are presented and discussed in this paper.
3. Field Measurements
3.1. Lateral Diaphragm Wall Deflections
Figure 5 presents the typical profiles of the lateral wall deflections at different construction stages. In general, the diaphragm wall at different monitoring points demonstrated deep inward movements toward the excavation zone, and the magnitudes of the deflections increased as the excavation depth increased. The displacement patterns generally followed the typical wall behavior of multi-propped excavations in Shanghai [3,4,14,26]. Despite the similar deformation pattern, the development patterns were different among different survey points. For example, at least four typical development patterns can be observed from the figure. The wall deflections at CX2 developed in a relatively uniform manner among the different excavation stages. The wall deflections at CX5 and CX10 increased dramatically from Ex2 to Ex4 and then remained stable until the completion of the base slab. The wall panel at CX13 demonstrated great inward movement at Ex2, Ex3, and Ex5, but was negligibly deformed at Ex4 and Ex6. On the other hand, the wall panels at CX16 and CX18 demonstrated significant deflections from Ex2 to Ex5, but remained stable during the last excavation stage.
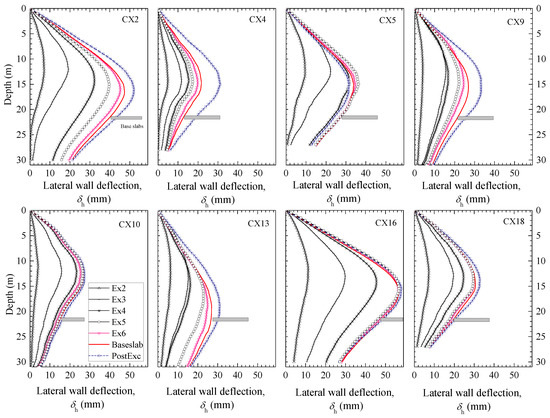
Figure 5.
Lateral deflections of diaphragm wall.
The differences among the different locations can be explained by the different construction sequences (e.g., over-excavation, zone excavation, and under-excavation) at different areas. For example, the Ex4 curves in the figure refer to the measured wall deflections on 4 May 2013, at which the excavation bottom was recorded as 13.7 m BGS. In the meantime, with regard to excavation, the contractor reached 19 m BGS in certain areas (e.g., near the monitoring point CX16), while the excavation bottoms of some areas were kept at 9.7 m BGS (e.g., near CX6). All these records suggest that the construction of the project was not organized well, and both under-excavation and over-excavation occurred. Evidently, these construction sequences significantly impacted the wall deflections at different locations.
Due to the relatively chaotic organization of the construction, the separations between different construction stages were very uncertain. Therefore, compared to the stage-based wall deflection profiles, the development of the maximum wall deflections, , over time can provide a more intuitive means to understand the deformation process of the diaphragm wall. Figure 6a describes the development patterns of the maximum wall deflections at several typical locations (i.e., CX2, CX4, CX5, CX9, CX16, and CX18). According to the figure, the values of at all the monitoring points showed clear ladder-type growth at the early stages (i.e., until 14 May 2013), in which the growth stages and the stagnation stages generally corresponded to the excavation and the installation of the struts in practice, respectively. However, as the excavation depth increased, the values for most of the monitoring points increased gradually and linearly, until they became stable. According to the construction report provided by the contractor, the stagnation stages were absent during these later stages because the excavation proceeded before the corresponding concrete struts were fully cured.
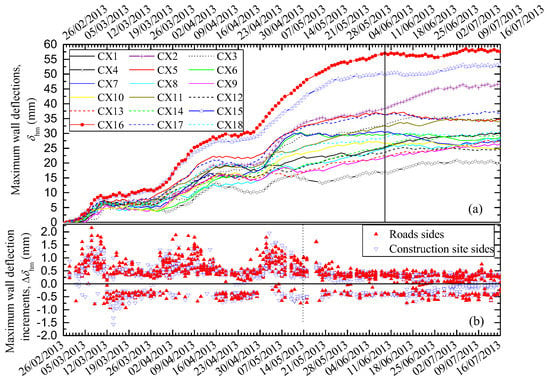
Figure 6.
Wall performance over time: (a) maximum wall deflections; (b) maximum wall deflection increments.
The curves in Figure 6a also suggest that the maximum wall deflections did not always increase over time. In other words, decreases in the maximum wall deflections sometimes occurred. In order to show this tendency more clearly, Figure 6b summarizes the daily variations in the measured maximum wall deflections, . In this figure, the positive values represent the increase in the maximum wall deflections, and the negative values represent the decrease. It should be noted that the road sides in the figure refer to the A– and A–F sides, and the construction site sides refer to the B–C–D–E–F sides in Figure 1. The figure shows that negative values of existed throughout the excavation of the project. At the same time, the construction site sides presented more negative values than the road sides. These negative values somewhat reflect the significant influence of workmanship because it is the only factor that is expected to be able to reduce the maximum wall deflections. Considering that these decreases in the maximum wall deflections cannot be predicted from analytical or numerical methods, and accumulated daily outward movements may lead to structural instability, the effects of workmanship should be taken seriously in practice.
Among the monitored elements during the construction of a deep excavation, the maximum wall deflection at the final stage is the most representative element to evaluate the quality of the project because most of the other excavation-induced responses are somewhat related to the maximum wall deflection. Figure 7 summarizes the maximum wall deflections upon the completion of the base slab and upon the completion of the underground structures.
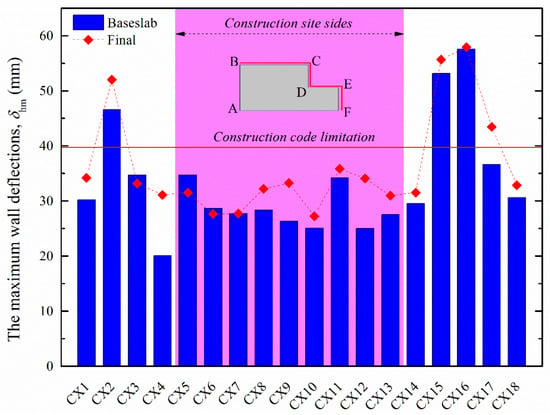
Figure 7.
Summary of the maximum wall deflections. (ABCDEF represents the corner of the foundation pit.)
The Technical Code for Excavation Engineering in Shanghai (Shanghai Urban and Rural Construction and Transportation Committee 2010) classifies excavation projects in Shanghai into three grades (i.e., Grade-I, Grade-II, and Grade-III) according to the structural importance and the surrounding conditions, requiring the accumulated maximum wall deflections to be limited to , and (i.e., He refers to the excavation depth), respectively. According to the code, the current excavation was classified as a Grade-I project, which means that the deformation control of the diaphragm wall should be (i.e., 39.6 mm). However, as shown in Figure 7, the wall deflections at CX2, CX15, and CX16 far exceeded this limit, and warnings were provided by the monitoring system during the construction. On the other hand, despite the similarly large magnitudes at the three locations, these were caused by different factors. The considerable wall deflections at CX15 and CX16 should be attributed to the over-excavation at the segments. In particular, according to the construction report, the over-excavation occurred during the excavation of the deep layers (e.g., Exc-5 and Exc-6, as defined in Figure 2). Since the earth pressures increase with depth, the removal of deeper soils inevitably leads to greater reductions in the lateral earth pressures against the retaining structures inside the excavation; thus, significant deformations occur. Therefore, over-excavation, especially at deep layers, should always be avoided in deep excavation practices.
In contrast to CX15 and CX16, the large lateral deformations at CX2 arise from factors other than excavation activities. The reason is that the wall deflections at CX2 developed during the excavation stage were not as large as CX15 and CX16, while an additional increase at the location was reported after casting the base slab. In fact, the CX2 was located at the main gate of the construction site, which means that factors other than the excavation activities (e.g., vertical loading from the heavily loaded trucks and the braking or accelerating of the trucks) also may have occurred at the location. This confirms the vulnerability of the wall deflections of deep excavations to workmanship. Unfortunately, the influences of construction activities cannot be predicted by design, and the only method to avoid the excessive deformations caused by these activities is to conduct the excavations more carefully.
Because the current project was carried out using the bottom-up method, the construction of the underground part was not finished after the construction of the base slab, but after the completion of all the underground structures. The period between the completion of the base slab and underground structures is named “PostExc” in this study (as described in Figure 3), in which the construction activities generally included the demolishing of the temporary struts and the construction of the underground structures. Both Figure 5 and Figure 7 suggest that wall deflections developed during the “PostExc” stage. However, such deformations (developed after the completion of the base slab) of a deep excavation have been seldom discussed in previous studies.
The columns in Figure 8 represent the variations in the maximum wall deflections developed during the “PostExc” stage of the current project. The dotted line represents extreme value of variations. In general, the maximum wall deflections at most of the monitoring points increased during this stage, which possibly arose from the combined effects of creeping and the demolishing of the temporary struts. At the same time, differences between different locations are also apparent. For example, wall deflections at several survey points (i.e., CX4, CX9, CX12, and CX17) increased dramatically; deformations at some locations (e.g., CX7 and CX16) remained stable; while at some locations (i.e., CX3, CX5, and CX6), they even decreased during this period. This can probably be explained by the openings left on the floor slabs and the different strut conditions of the openings during construction, because these survey points demonstrated relatively large increments that generally coincided with the openings without temporary struts (as detailed in Figure 1).
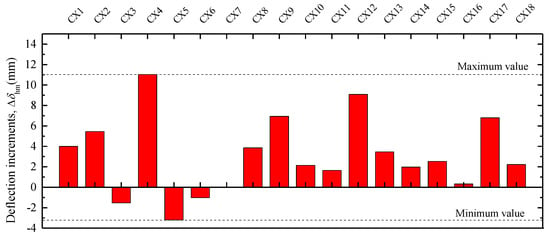
Figure 8.
Maximum wall defection increments after the completion of base slabs.
Deformations near the corners of deep excavations are generally much smaller than deformations at the middle of the sides due to the spatial effects. However, the wall deflections at the middle of the BC side (specified in Figure 1) are surprisingly small, which seems to counteract the spatial effects of deep excavations. At the same time, a further examination of Figure 7 suggests that the wall deflections, along with the AB and AF sides, still show apparent spatial effects. To better investigate the spatial performance of the current project, Figure 9 presents the normalized maximum wall deflections, , at different excavation levels against the relative locations of the corresponding survey points to the corners, . In accordance with Figure 6b, the “road sides” in Figure 9 refer to the sides AB and AF in Figure 1, and the “construction site sides” stand for the B–C–D–E–F sides specified in Figure 1. In addition, the envelopes of large basement excavations and metro excavations in Shanghai summarized by Tan et al. [27] are also included in the figure for comparison. According to Figure 9, the distributions of with at the “road sides” (i.e., dark grey shading in the figure) are generally symmetric around the central line of the figure (i.e., ). In contrast, for the survey points at the “construction site sides” (i.e., the red polygon), is uniformly distributed with .
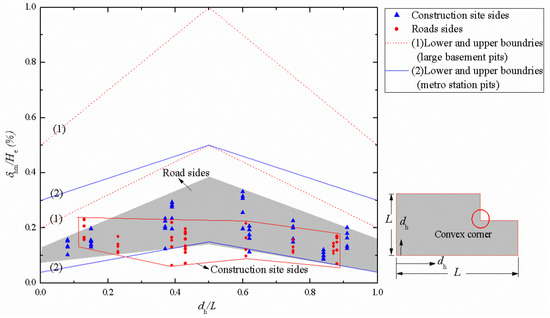
Figure 9.
Distribution of normalized maximum lateral wall displacements along the sides.
The corner effects at the “road sides” are not surprising, yet the uniform distributions of at the “construction site sides” are unusual. Considering no special treatment was reported for the “construction site sides”, the abnormal performance of these sections must be attributed to the under-excavation procedure in the area. According to the contractor, the soils near CX6, CX7, and CX8 were under-excavated approximately from the third excavation stage (i.e., Exc-3 in Figure 3) because the area was under the trestles. Unfortunately, a more detailed under-excavation scheme (i.e., specific area and duration) was not available to quantify the effect of the procedure.
It should be noted that there was a positive corner (circled in red in Figure 9) in the basement of the project. Several studies [11,27] have reported that wall deflections at positive corners are usually larger than their counterparts at standard segments. However, in this case, the maximum wall deflection at the positive corner (i.e., CX10, with a magnitude of 27.24 mm) was the second smallest among all the survey points. This well-constrained wall deflection may be due to the special supports at the location (according to Figure 1, the wall at the convex corner is heavily supported), or because of other unrecorded treatments or excavation procedures that occurred during construction. Unfortunately, specific reasons for the performance of the wall at the positive corner cannot be determined.
When compared with the general bounds of deep excavations in Shanghai developed by Tan et al. [13], the data of the current project generally fall within the bounds of metro excavations, which are much smaller than the lower bounds of large basement excavations. In other words, the wall deflections in this project are much smaller than other basement projects with similar conditions. This enhanced performance can be attributed to its more robust enclosure structure required by the aforementioned Technical Code (due to its Grade-I classification).
Comparison with Empirical Methods
Based on case histories worldwide, some empirical relationships between and have been developed [28,29]. Figure 10 compares the data of the current project with these empirical relationships. In general, in this case lies between and . As expected, the magnitudes of for this case were much smaller than those reported by Clough and O’Rourke [28] for excavations in stiff clay and by Peck [29] for excavations in soft clay. The much smaller at this pit generally results from the use of the more rigid concrete diaphragm wall because the early excavations used to develop the empirical relationships were generally supported by flexible retaining structures, such as sheet piles and soldier piles with lagging.
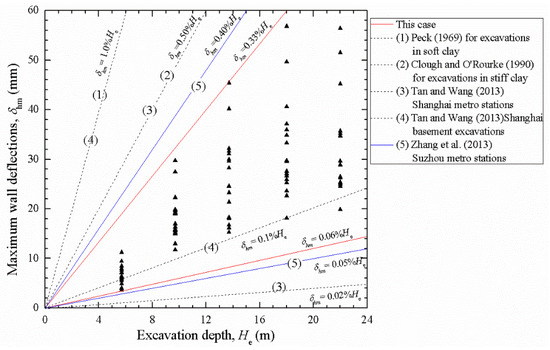
Figure 10.
Relationships between excavation depth and maximum wall deflections.
The comparison with some more recent projects with similar conditions (e.g., geological condition, size and construction method) suggests that the performance of this case was close to the upper boundaries of metro excavations in Shanghai and Suzhou reported by Tan and Wang [4] and Zhang et al. [30], but much smaller than the upper boundary of basement excavations in Shanghai [4]. This comparison agrees with the conclusion of Figure 9.
Figure 11 plots the normalized maximum wall deflections, , and the supporting system stiffness in this project. The concept of supporting system stiffness was defined by Clough et al. [31]. The stiffness of the supporting system is an important factor that governs the performance of an excavation. The stiffness of a supporting system relates to many factors, including the bending stiffness of the retaining wall, the axial stiffness of the struts, the location of the struts, and the vertical spacing between the struts [2,3,4]. Several metro-station excavations and basement excavations in Shanghai reported by Tan and Wang [2,3,4], as well as the design curves in terms of the safety factors associated with basal heave, are also included in the figure for comparison. It should be noted that the values of FOS in the chart are used to roughly discuss the trends and are not the exact values of the current project. The figure shows that the values of deep excavations in Shanghai generally lie between the design curves of FOS =1.1 and FOS = 3.0. At the same time, the relationship between the system stiffness and the values of these excavations is not apparent, which agrees with the conclusion drawn from other worldwide cases [6,7,15,25]. The system stiffness of the current project is higher than most basement excavations, while it is lower than most metro excavations in Shanghai. Overall, all the values of this project fell below the curve of FOS = 2.0, suggesting that the stability problem was not a concern for this project.
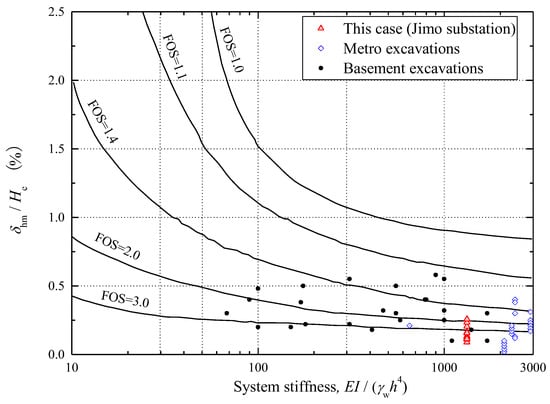
Figure 11.
Normalized maximum wall deflections versus system stiffness.
3.2. Ground Settlements behind the Diaphragm Wall
According to the Technical Code for Excavation Engineering in Shanghai (Shanghai Urban and Rural Construction and Transportation Committee 2010), the ground settlements behind the wall should be strictly limited. Similar to wall deflections, the limitations of ground settlements of different projects are different; the limitations of Grade-I projects, Grade-II projects, and Grade-III projects are , and , respectively. As mentioned previously in this chapter, the current project was a Grade-I project, which means that the limitation of ground surface settlements behind the wall for this project was 33 mm. The maximum ground settlements were about 25 mm, indicating that the performance of this case fully met the requirements of the code.
According to the monitoring report, the monitored settlements at different survey points generally shared a similar development pattern with time. To investigate the pattern further, the developments of the ground settlements over time at two typical locations (i.e., J3-1 to J3-5 at the “construction site sides” and J8-1 to J8-5 at the “road sides”) are presented in Figure 12. In general, the measured ground settlements increased almost linearly with time, until the completion of the base slab. After this, the ground at most monitoring points stopped settling. The measured maximum ground settlements were approximately 12–24 mm at J3 and 18–25 mm at J8, which means that slightly larger settlements were developed at J8 than at J3. In fact, the larger displacements at J8 were in accordance with the more significant wall deformations at the following segments: CX6, which was in front of J3, developed much smaller lateral wall deflections than CX16 in front of J8. This tendency suggests that the lateral wall deformations dramatically impact the ground settlements.
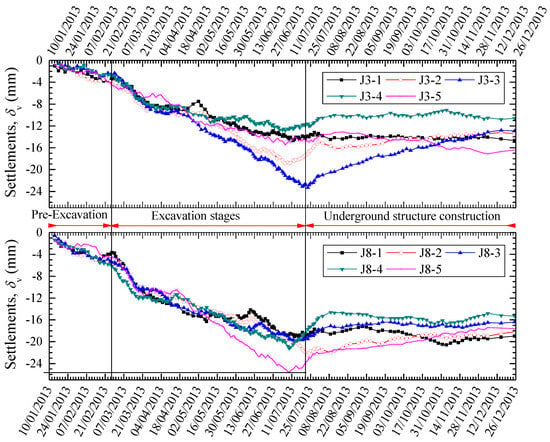
Figure 12.
Developments of the ground settlements at J3-1 to J3-5, and J8-1 to J8-5.
It should be noted that the ground had already settled before the excavation was initiated. This period generally covered the construction of the diaphragm wall and the piles. Therefore, the settlements should arise from the construction of the diaphragm wall. In fact, ground settlements during the construction of diaphragm walls have been reported worldwide. For example, Xu [32] analyzed hundreds of case histories in Shanghai and found that ground surface settlements during the construction of diaphragm wall panels and piles accounted for up to 40% of the total ground settlements, while Tedd et al. [33] reported a percentage of approximately 30% for deep excavations in London.
Peck [29] summarized ground settlement data from excavations propped by sheet piles or soldier piles and proposed the first empirical approach for estimating excavation-induced ground settlements. As shown in Figure 13, the approach considers different soil types and workmanship by dividing the construction conditions into three zones. Theoretically, deep excavations in Shanghai should be classified as Zone-II and Zone-III because of the soft soils in the area. However, the current case data generally lie in Zone-I, which echoes the conclusion of the method’s conservativeness in evaluating ground settlements of the current deep excavations.
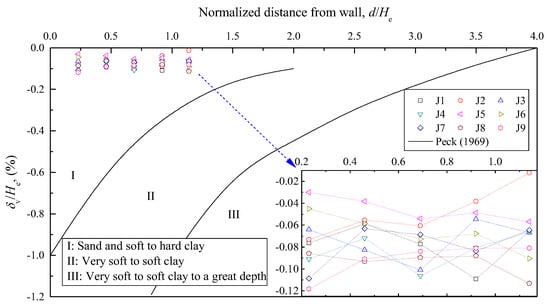
Figure 13.
Normalized settlement profiles behind the wall.
The inserted graph in Figure 13 describes the settlement profiles of the ground settlements. However, the monitored range (i.e., 5–25 m from the pit) was too small to find a regular settlement trough.
The ground settlements of deep excavations have a certain relationship with the lateral deflections at the corresponding locations. Mana and Clough [34] quantified this relationship by relating the maximum ground settlements, , with the maximum wall deflections, , and developed a design chart based on the data of various excavations in the US and Norway. The chart, as shown in Figure 14, is also used to evaluate the performance of the current case. In addition, the data available from other case histories in Shanghai [35,36] are included for comparison. It should be noted that both the maximum ground settlements and the maximum wall deflections were normalized by the excavation depths in the chart.
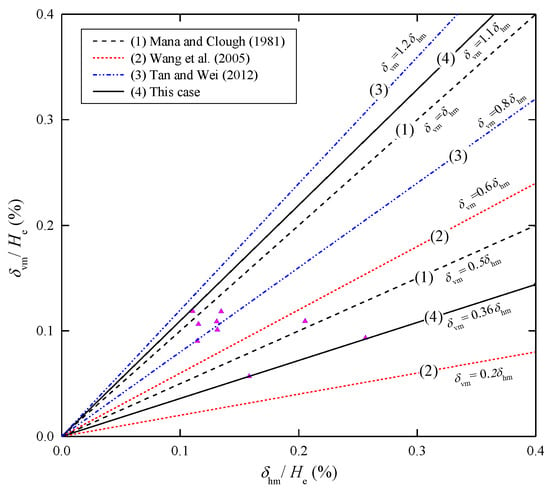
Figure 14.
Normalized maximum wall deflections versus normalized maximum ground settlements.
As shown in Figure 5, Figure 6, Figure 7, Figure 8, Figure 9, Figure 10, Figure 11, Figure 12, Figure 13 and Figure 14, the boundaries developed by Mana and Clough [34] were and . The six metro stations in Shanghai reported by Wang et al. [36] fell between and . Data from some more recent excavations constructed by the cut-and-cover technique in Shanghai reported by Tan and Wei [35] demonstrated the following boundaries: and . In contrast, the data from the current case demonstrated the boundaries and , indicating that the data from this case fell between a greater interval than other case histories. In other words, the maximum ground settlements of this case varied dramatically among different locations. Considering that the monitored ground surface settlements are vulnerable to many factors (e.g., wall deflections, construction activities, and other unrecorded disturbances to the monitoring system), the difference in the current case is not surprising. Despite this difference, these ground settlements were generally small, indicating that the ground settlements of the project were well-controlled.
3.3. Vertical Structural Movements
The columns in Figure 8 represent the measured uplifts of the diaphragm wall and the interior columns upon the completion of the underground structures. It can be observed that the interior columns demonstrated much larger vertical movements than the diaphragm wall. In addition, differences among the wall panels and among the columns were also observed. To better describe the distribution of the vertical structural movements, Figure 15 was created. The colors and numbers in Figure 16 represent different settlement values and settlement areas. Evidently, the vertical movements at the center of the excavation site were generally larger than those at the marginal areas.
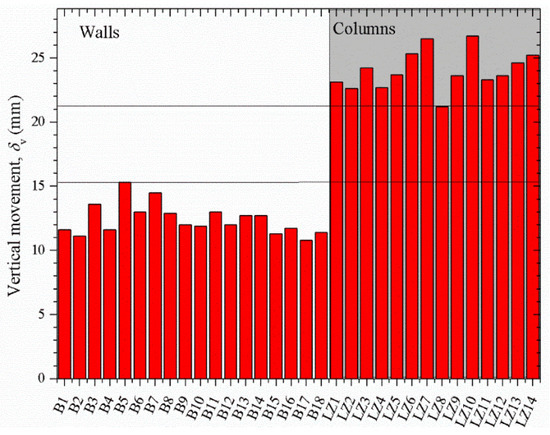
Figure 15.
Vertical movements of the walls and columns at the final stage.
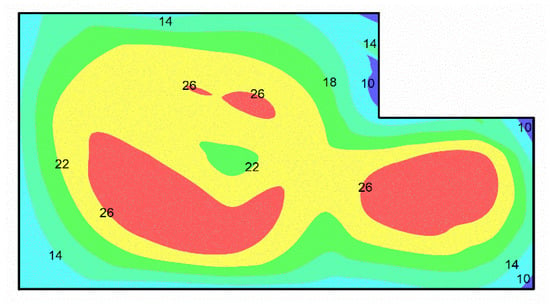
Figure 16.
Contour maps of the vertical movements of the structures.
Figure 15 and Figure 16 show that the retaining structure experienced uneven vertical movements. Large differential vertical movements between different structural components may lead to excessive bending moments in the lateral structures, and sometimes even lead to structural instability. For this case, the following three types of differential vertical movements occurred: the differential movements among the wall panels at different locations, the differential movements among different columns, and the differential movements between the walls and columns. The former two, for this case, were small enough to be neglected. For example, the wall panels’ maximum and minimum upward movements were 15 mm (at B15) and 11 mm (at B2 and B17), respectively, leaving a differential of just 4 mm. Compared with the long distances between the monitoring points, the differential movements were negligible. Similarly, the maximum upheaval of the columns was approximately 27 mm (at LZ10), while the minimum value was 21 mm (at LZ8), leaving the maximum differential movement to be only 6 mm. Such a small differential movement resulted in minimal additional bending moments for the lateral supports; therefore, the effect can generally be neglected.
In contrast, the differential vertical movements between the diaphragm wall and the columns should be carefully considered because they are usually large enough to threaten structural stability. For the current case, the maximum differential vertical movement was around 16 mm, 2.7-times higher than the value between different columns and 4-times higher than the value among different wall panels. In fact, a safe limit of differential vertical movements is generally required by the design criteria of deep excavations. For projects in Shanghai, the most applied safe limit requires the following:
This equation was proposed by Bjerrum [37] based on self-weight settlement, in which is the differential vertical movement, and stands for the distance between the two adjacent components. The maximum value of of this project was 1/542, which met the requirement.
Figure 17a presents the typical vertical movements of the interior columns (i.e., LZ3 and LZ10) and wall panels (i.e., B6 and B16) during construction. In general, the wall panels and the interior columns shared a similar movement pattern. Following the soil removal, the structures rapidly moved upwards. With the casting of the heavy base slab, the upward movements were suppressed quickly. It was noticed that both the wall panels and the columns experienced abrupt upward movements from 10 July 2013 to 30 July 2013 (as shown in the shaded part of the Figure 17). According to Figure 3, the removal of the last layer of soil was completed on 16 July 2013, and the base slab was finished on 20 July 2013, indicating that the construction conditions during the period were very complicated. These construction conditions included unloading (soil removal), loading (casting the heavy base slab), and other disturbances in the contractor’s operation, of which any impact on the vertical movements of the structures was not unusual. However, they cannot explain the general upward movements of the wall panels and columns. In fact, the abrupt upheavals of the structures were more likely to be related to the fluctuation of the groundwater level during this period.
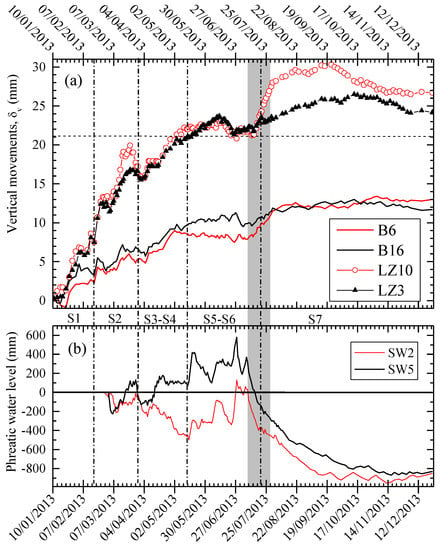
Figure 17.
Developments of the monitored features against time: (a) vertical movements of the structures; (b) phreatic water level outside the pit.
To correlate the developments of the groundwater level outside the pit and the developments of the vertical structural movements, Figure 17b is presented below Figure 17a. The comparison clearly shows that the groundwater levels and the vertical structural movements underwent significant changes during this period (i.e., the structures moved upward abruptly, while the groundwater levels dropped dramatically).
As mentioned previously, the confined aquifer was dewatered when the excavation depth increased. When the excavation reached its final depth, which is the shaded period in Figure 17, the dewatering process was stopped so that the recovering pressure water could lead to the upward movements of the structures. The dewatering of confined water may cause the subsidence of the surroundings. Therefore, a waterproof curtain is commonly used. However, for geological conditions such as those in the Shanghai area, where the thickness of the aquifer is high, a curtain that can fully cut off the aquifer is restrictive. Therefore, many projects choose to apply a suspended water curtain combined with the groundwater recharge method to control groundwater levels, which was the case for the current project. As the dewatering process was stopped, the recharging outside the pit was stopped simultaneously, and thus explains the drawdown of the groundwater levels outside the excavation in Figure 17b.
It should be noted that according to Figure 6, the wall deflections generally remained stable during this period, indicating that the dewatering process did not significantly influence the horizontal movements of the excavation. Therefore, numerical approaches sometimes can neglect the dewatering process if the lateral wall deflections are the main concerns.
3.4. Axial Strut Forces
Figure 18 presents the typical axial force developments in the concrete struts at levels 1–5 during construction. Since the axial forces in the struts were measured immediately after their installation, the initial values of most of the axial strut forces were close to zero. As shown in the figure, the axial forces in the struts increased immediately after their installation. As the axial forces of the struts at the next level reached certain values, they generally stabilized quickly. This tendency was in accordance with the monitored axial strut forces in other case histories in Shanghai [2,13].
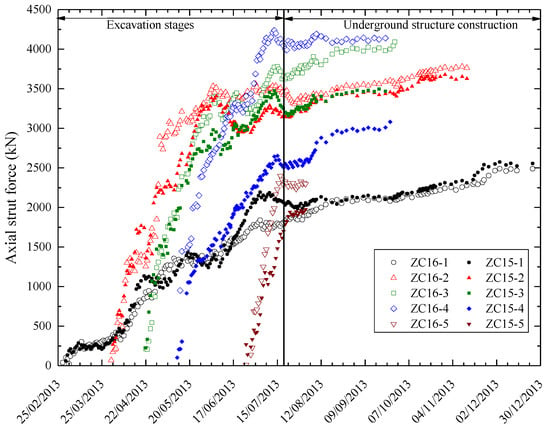
Figure 18.
Developments of axial strut force at ZC15 and ZC16.
By further examination, it can be observed that the struts at ZC7 and ZC16 carried similar axial forces at the early stage. This is because the contractor generally followed the construction management design at the first several excavation stages, during which neither over-excavation nor under-excavation occurred. The orderly excavation procedure guaranteed a similar condition between ZC7 and ZC16, so that the struts at the corresponding locations carried similar axial forces. However, as the excavation depth increased, differences between ZC7 and ZC16 were observed. For example, the axial strut forces at ZC7 generally stabilized much earlier than at ZC16, and the forces at ZC16 were generally larger than at ZC7. The differences were generally because of the different construction procedures at the two locations. As mentioned previously, the area near ZC7 underwent under-excavation following the removal of the third layer of soils, while the area near ZC16 underwent over-excavation at the deep layers. Typically, the axial forces at ZC16-4 and ZC16-5 were much larger than their counterparts (i.e., ZC7-4 and ZC7-4) as soon as they were cast, demonstrating the significant impact of the over-excavation procedure. In practical projects, it is dangerous for a reinforced concrete structure to carry a load that is too large before it is cured. Therefore, over-excavation should be avoided as much as possible.
Figure 19 summarizes the final axial forces at different monitoring points. The comparison between the differences of different monitoring points at the same levels suggests that the struts near the wall panels experienced great deflections (e.g., CX2, CX15, CX16, and CX17) and generally had significant axial forces. Additionally, corner effects were also observed at the road sides regarding the distributions of the axial strut forces. This tendency is in agreement with the distribution of the maximum wall deflection presented in Figure 8, suggesting that the braced struts primarily carried the load, due to the soil removal in close proximity, and the axial forces were closely correlated with the lateral wall deflections near them.
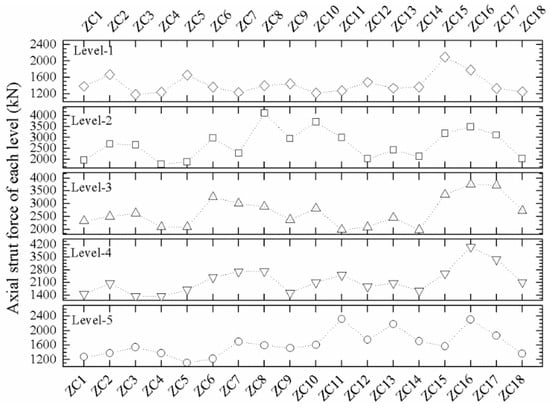
Figure 19.
Axial strut forces upon the completion of excavation.
Figure 19 also reveals that Level-1 and Level-5 struts generally carried much smaller axial forces than the other three levels. Despite the axial strut forces at Level-1 and Level-5 being similarly small, they arose for different reasons. As mentioned previously, earth pressures increase with depth, which means that the removal of upper soils leads to less reduction in the lateral earth pressures against the retaining structures. Therefore, the load carried by the braced struts at upper levels is generally small. In contrast, the small axial forces of the Level-5 struts should be associated with the timely construction of the heavy base slab. As shown in Figure 3, the removal of the last layer of soil and the installation of the base slab were conducted almost simultaneously, suggesting that the casting of the base slab was well-timed. This approach compensated for the unloading caused by the soil removal and provided timely lateral supports to the diaphragm wall, which should have shared much of the lateral pressure with the Level-5 struts.
4. Numerical Investigation
Prior to the construction of an underground project, a design of the construction management is made. In the design of construction management, all construction details (e.g., construction sequence, construction method, timeline, and the excavation depth for each stage) are specified. In principle, the contractor should always follow the construction management design. Nevertheless, some contractors do not follow the designed excavation depth, and under-excavation or over-excavation may happen (according to the practical situation of the project or for their own benefit or convenience). Such situations should be avoided because they are dangerous. For example, over-excavation will produce large amounts of unpredicted deformations of the retaining structure and, under worse situations, may cause the collapse of the excavations.
The excavation for the Shanghai Jimo Substation project has undergone both under-excavation and over-excavation during construction, meaning that the wall deflections are extraordinarily distributed along different sides of the pit. This makes the project an ideal case history to investigate the influence of under-excavation and over-excavation. Therefore, a series of three-dimensional numerical tests are conducted in this section to discuss the issue. Three scenarios are discussed in this study. More excavation-induced characteristics (e.g., lateral wall deflections, ground settlements behind the wall, vertical structural movements, and axial strut forces) are discussed and compared in this study to evaluate the influence of different construction procedures.
4.1. Description of the FE Model
Although the supervising unit reported under-excavation and over-excavation during construction, they failed to provide many details about these activities. The areas and periods in which over-excavation and under-excavation occurred can only be determined according to the contractor’s descriptions. In the numerical models, these construction procedures are further simplified. For example, both the under-excavated area and the over-excavated area are assumed to be rectangular areas, as shown in Figure 20.
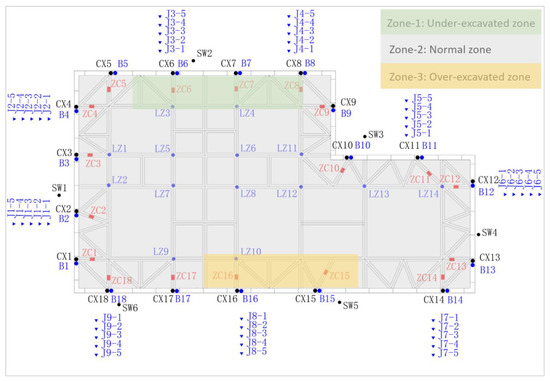
Figure 20.
Developments of axial strut force at ZC15 and ZC16.
In addition, according to the contractor, under-excavation occurred approximately from the removal of the third layer of soil, while over-excavation generally occurred during the removal of the last two layers of soil. To simplify the calculations, the under-excavation was assumed to have occurred from the beginning of the removal of the third layer of soil to the completion of the base slab, while the over-excavation was assumed to have occurred from the removal of the fourth layer of soil to the completion of the base slab. Detailed modeled construction sequences will be described in Figure 3.
The irregular geometry and complex construction sequence of the project require a three-dimensional model that includes the whole pit to be generated to investigate the spatial behavior of the excavation more accurately. The mesh of the whole model and the mesh of the retaining structures developed using ABAQUS are shown in Figure 21. In order to show the details of the lateral supports more clearly, parts of the diaphragm wall are not displayed in Figure 21b. As described in Figure 21a, the model size is 320 m × 275 m × 130 m, with boundaries far enough away from the pit to eliminate the influence of boundary conditions on the calculated results. The four vertical sides in the model have roller boundary conditions, and the bottom of the model is fixed.
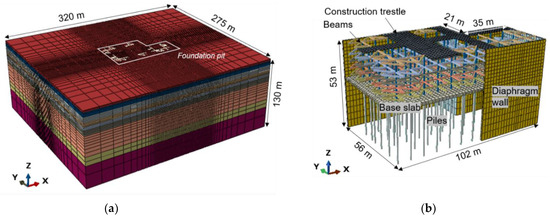
Figure 21.
Developments of the axial strut force at ZC15 and ZC16. (a) Geometry and mesh of the whole model. (b) Geometry and mesh of the retaining structures.
One can notice that there is a construction trestle at the top of the retaining system because the excavation was conducted using the bottom-up method. The trestle was installed to work as a construction platform during the excavation. According to the contractor, the trestle was a 250 mm thick concrete slab that was cast in situ. In the numerical models, the trestle is modeled using four-noded quadrilateral shell elements with reduced integration (S4R). In terms of the interactions, the trestle is assumed to be firmly connected with the first layer of struts (Strut-1).
The clayey soil layers are represented by the modified cam-clay (MCC) model, while the sandy soil layers and the fill are modeled using the Mohr–Coulomb (MC) model. The MCC model is one of the most commonly used constitutive models for normally consolidated (NC) to lightly over-consolidated (OC) clays. The model can effectively describe the non-linear behavior of cohesive soil before failure and the deformation behavior depending on the stress level or stress path. The model can also effectively illustrate the elastic–plastic deformation characteristics of soil both theoretically and experimentally, so it can better predict the deformation characteristics of a foundation pit and the surrounding soil when applied to the excavation of a foundation pit [38,39,40,41,42,43]. The input parameters of the soils, as shown in Table 1, are determined from the geological exploration reports provided by the contractor. The concrete beams, trestles, piles, and columns are modeled as linear elastic material with reduced concrete properties (E = 24 GPa, ν = 0.2). Interaction between the diaphragm wall and surrounding soil was modeled by the surface-to-surface contact provided in ABAQUS, and the piles were assumed to be embedded in the soils. The tangential behavior of the soil–wall interaction was assumed to be Coulomb friction (μ = 0.3, τmax = 30 kPa), and the normal behavior was hard contact with no normal relative displacement between the wall and surrounding ground.

Table 1.
Input parameters of the layered soils.
4.2. Strategies of the Analyses
As specified in Table 2, three scenarios, namely “Normal”, “Under-Exc”, and “Under+Over-Exc”, were analyzed in this study. In the “Normal” scenario, the removal of soils and the installation of lateral supports were conducted alternatively in a traditional way. In the “Under-Exc” scenario, the under-excavation at Zone-1 (specified in Figure 20) was considered by setting the soils at Zone-1 to be removed one step behind Zone-2 and Zone-3 from Step-7 (refers to Table 2). The “Under+Over-Exc’’ scenario, which is the closest to the practical condition of the project, further considers the over-excavation at Zone-3. The construction sequences of different scenarios are detailed in Table 2. It should be noted that the removal of soils in all the steps was modeled by removing all the corresponding meshes at once for simplicity. All the analysis steps in the FE model were static.

Table 2.
Strategy of analyses and construction sequence.
4.3. Interpretation of the Results
Due to the lack of critical information and the simplifications made in the numerical models, it is difficult to replicate the displacement field of the project entirely. Therefore, the numerical analyses in this section are expected to capture the general trend of the displacements and explore the impact of under-excavation and over-excavation. The calculated results of the numerical tests are analyzed below.
Figure 22 summarizes the maximum wall deflections of different models and the field data. In general, the maximum wall deflections at normally excavated areas (i.e., Zone-2 in Figure 20) calculated from all three models match the field data. At the same time, the deformations at Zone-1 and Zone-3 show great differences. The “Normal” scenario underestimates the wall deflections at the over-excavated zone (i.e., CX15 and CX16), while overestimating those at the under-excavated zone (i.e., CX6, CX7, and CX8). When the under-excavation is considered (i.e., the “Under-Exc” scenario), the overestimations at CX6, CX7, and CX8 are mitigated, but the deformations at CX15 and CX16 are still largely underestimated.
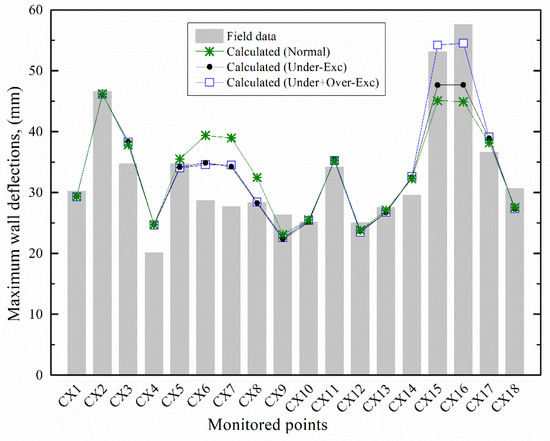
Figure 22.
Summary of the observed and calculated maximum wall deflections.
Although the “Under-Exc” model cannot fully capture the lateral deflections at CX6, CX7, and CX8, it shows a positive trend compared with the “Normal” scenario. The trend suggests that the small wall deflections at CX6, CX7, and CX8 may arise from the under-excavation procedure at the area. Unfortunately, under-excavation in practice (the area and the duration) cannot be fully captured, which explains the discrepancy between the results of the “Under-Exc” model and the field data. In fact, under-excavation at critical segments of a deep excavation can help to restrain wall deflections and, thus, improve the excavation performance. This is the reason for the broad application of zone excavation and earth berms in practical deep excavation projects.
The comparison between the results of the “Normal” and the “Under-Exc” models suggests that the large wall deflections at CX15 and CX16 were unlikely to be caused by the under-excavation at Zone-1. Therefore, the “Under+Over-Exc” scenario is further calculated. When the soils at Zone-3 were over-excavated, the maximum wall deflections in the area increased dramatically. The calculated results from this model are very close to the field data, suggesting that this model best reflects the actual performance of the excavation. At the same time, the significant increase in the wall deflections at the over-excavated area confirms the danger of over-excavation in deep excavations.
A preliminary investigation of the maximum wall deflections suggests that the abnormal spatial distribution of the wall deflections of the current projects was caused by the combination of under-excavation and over-excavation procedures during construction. However, the maximum wall deflections cannot reflect the influence of different construction procedures on the detailed structural reactions. Therefore, performances at several typical locations (e.g., a normally excavated area, under-excavated area, and over-excavated area) are further evaluated and compared with the field data.
The lateral wall deflection profiles at three typical locations (i.e., CX2 at the normally excavated area, CX6 at the under-excavated area, and CX16 at the over-excavated area) are presented in Figure 23. In addition, the field data are also included for comparison. The figure shows that the wall deflections at CX2 calculated from the three models are almost identical, and all of them match the field data, suggesting that both under-excavation and over-excavation have negligible impacts on the normally excavated area. This indicates that both under-excavation and over-excavation can only influence wall deflections at the corresponding locations, while having negligible influence on the normally excavated areas.
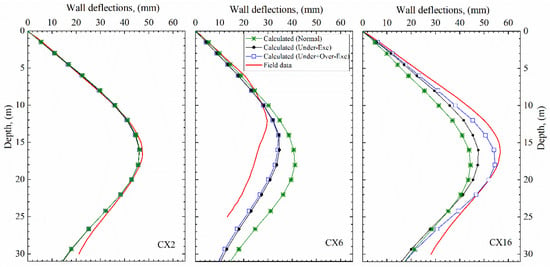
Figure 23.
Wall deflection profiles at CX2, CX6, and CX16.
The comparison between the field data at CX6 and the other two locations shows that CX6 not only has smaller wall deflections, but the depth of the maximum wall deflection at the location is smaller than the other two. The shallower maximum wall deflection location at CX6 can also be attributed to the under-excavation procedure because the locations of the maximum wall deflection calculated from both the “Under-Exc” model and the “Under+Over-Exc” model are above the “Normal” model. In contrast, compared with the under-excavation procedure, over-excavation seems only to increase the magnitudes of the lateral deformations.
The ground settlement troughs calculated from different models are compared with the field data in Figure 24. The dotted line in Figure 24 represents the ground surface. In general, the numerical models underestimate the ground settlements behind the diaphragm wall. Typically, the numerical models underestimate the displacements more significantly at the points near the diaphragm wall, compared to the points far from the pit. This underestimation may arise for several reasons, such as the inability of the constitutive model used in the study to consider the low strain stiffness of the soils, the failure to dewater the confined aquifer in the numerical models, and the inability of the current model to take into account the settlements induced by the installation of the diaphragm wall.
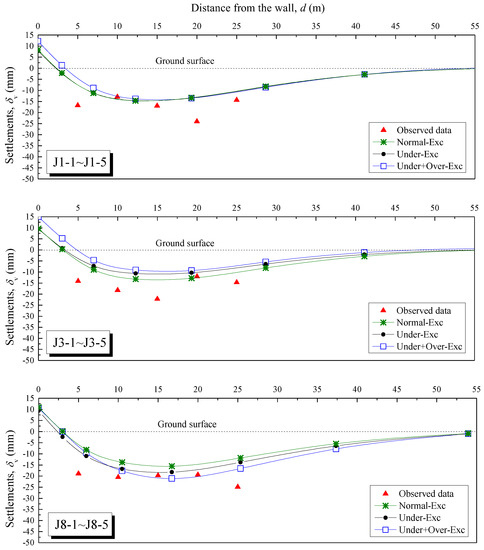
Figure 24.
Ground settlement troughs at J1, J3, and J8.
Although the numerical models in this study underestimate the ground settlements outside the pit, the differences between different models have reference values. For example, the “Under+Over-Exc” model yields smaller settlements than the “Under-Exc” model at J3, but an opposite tendency is observed at J8. This is because the displacements of the ground outside an excavation are the combined results of the deformations caused by the excavation-induced unloading and the volume loss caused by the inward movements of the diaphragm wall. As shown in Figure 23, the wall deflections at J3 (i.e., CX6) calculated from the two scenarios are almost identical. At the same time, the over-excavation in the “Under+Over-Exc” scenario increases the general unloading of the excavation. As a result, the general settlements at J3 are increased. In contrast, the additional settlements at J8 caused by the increased wall deflections outweigh the upheavals caused by the additional unloading, which caused the larger settlements in the “Under+Over-Exc” scenario.
In contrast to the vertical movements of the ground, the vertical structural movements were mainly caused by excavation-induced unloading. As described in Figure 25, the numerical models generally overestimated the upheavals of the diaphragm wall and the columns, compared to the monitored results. This overestimation can largely be attributed to the neglection of the numerical models’ to dewater the confined water. Compared with the diaphragm wall, the upheavals of the columns were overestimated more dramatically. Moreover, compared with the field data, the calculated differential vertical movements of different columns are more dramatic, indicating that the numerical models overestimate the vertical movements at the center of the pit more significantly than the peripheral areas.
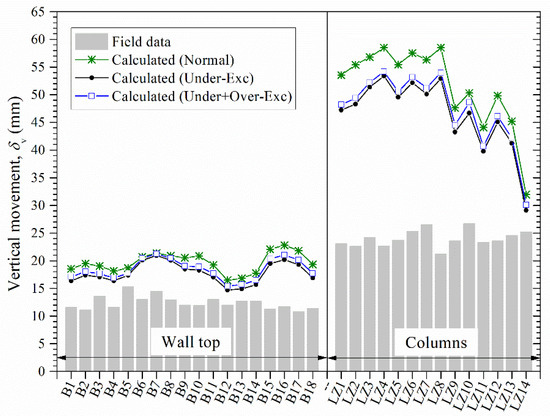
Figure 25.
Vertical movements of diaphragm wall and piles.
Although the numerical models overestimate the vertical structural movements, they can still, to some extent, reflect the influence of different construction procedures by comparing the results of different models. For example, the difference between the results from the “Normal” scenario and the other two models demonstrates that under-excavation dramatically reduces the structural upheaval. At the same time, the comparison between the “Under-Exc” model and the “Under+Over-Exc” model shows that the negative effect of over-excavation of the vertical structural movements is not apparent. One may notice that the calculated vertical movement at LZ14 is much smaller than the other monitoring points, but the field data did not show the same tendency. The small value of the numerical results is because the column is the closest to a corner of the pit. The failure of the field data to show the same tendency to the numerical results may arise from some unrecorded construction activities in practice.
Figure 26 compares the calculated axial forces of different models with the field data. According to the figure, all the models can generally yield the same distribution pattern among different layers of supports with the field data; the axial forces of the Level-1 and Level-5 struts are much smaller than the other three in the middle. On the other hand, the numerical models perform differently at different locations. For example, all the models dramatically underestimate the struts at ZC2, while yielding relatively accurate results at ZC6 and ZC16. Considering that all three models show the same tendency at ZC2, the possible influence of different construction procedures can be excluded. By further examination, it can be observed that the struts at ZC2 are diagonal struts, which could be the reason for the underestimated displacements.
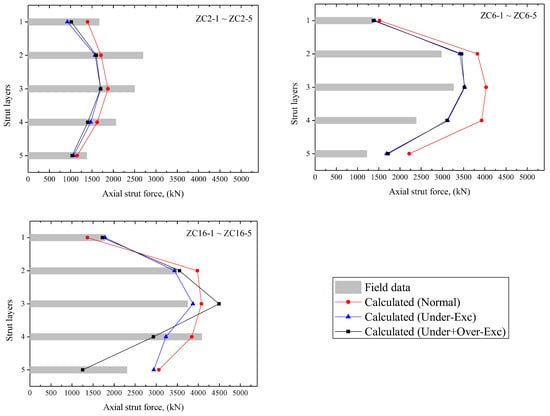
Figure 26.
Axial forces at the monitored points ZC2, ZC6, and ZC16.
The differences in the calculated strut forces at ZC2 among the three models are not apparent, suggesting that the under-excavation at Zone-1 and the over-excavation at Zone-3 can only influence the structural performance of the excavation in close proximity, while nobility influencing the structures at the normally excavated areas. Compared with the “Normal” scenario, the “Under-Exc” model and the “Under+Over-Exc” model produced smaller axial forces at ZC6, indicating the positive effect of the under-excavation procedure. In terms of the axial forces at ZC16, the figure suggests that both the under-excavation at Zone-1 and the over-excavation at Zone-3 have certain impacts on the forces, in which the under-excavation tends to restrain the axial forces, while over-excavation can increase the maximum axial forces.
5. Conclusions
Through an extensive field instrumentation program, in combination with three-dimensional numerical analyses, this paper investigates both the performance of a deep excavation in Shanghai soft soils and the corresponding influence of under-excavation and over-excavation. Through the analyses of the field data and the calculated results of different numerical models, the following conclusions, recommendations, and precautions can be drawn:
- The lateral wall deflections showed a typical spatial distribution. The under-excavation procedure restrained the wall deflections at the middle part of the diaphragm wall, making the corner effects at the corresponding side inapparent.
- Although dewatering the confined aquifer had negligible impacts on the lateral wall deflections, the process dramatically influenced the vertical structural movements. The recovery of the confined water after the dewatering process was stopped and caused abrupt upheavals to the interior columns and the diaphragm wall, which exaggerated the differential vertical movements of the retaining structures.
- The distribution of the axial strut forces around the pit were closely related to the distribution of the wall deflections. Therefore, both under-excavation and over-excavation dramatically influenced the axial strut forces of the project.
- The numerical models effectively reflect the displacement trends and the influences of different construction procedures. The “Under+Over-Exc” model produces the most conforming results with the field measurement, suggesting that the atypical spatial performance of the project was caused by the combination of the under-excavation and the over-excavation during construction. Both the under-excavation and over-excavation procedure can only influence the performance of the excavation in close proximity, while having negligible impacts on the normally excavated areas.
Author Contributions
Conceptualization, J.C. and R.A.; methodology, Z.Y.; software, Z.Y.; formal analysis, Z.Y.; investigation, J.C.; resources, Z.Y.; data curation, J.C.; writing—original draft preparation, Z.Y. and J.C.; writing—review and editing, R.A. All authors have read and agreed to the published version of the manuscript.
Funding
This research received no external funding.
Institutional Review Board Statement
Not applicable.
Informed Consent Statement
Not applicable.
Data Availability Statement
The data are contained within the article.
Acknowledgments
The authors wish to express their gratitude to the anonymous reviewers whose constructive comments helped to improve the overall quality of this paper.
Conflicts of Interest
The authors declare no conflict of interest.
References
- Ng, C.W.W.; Hong, Y.; Liu, G.B.; Liu, T. Ground deformation and soil–structure interaction of a multi-propped excavation in Shanghai soft clays. Géotechnique 2012, 62, 907–921. [Google Scholar] [CrossRef]
- Tan, Y.; Li, M.W. Measured performance of a 26 m deep top-down excavation in downtown Shanghai. Can. Geotech. J. 2011, 48, 704–719. [Google Scholar] [CrossRef]
- Tan, Y.; Wang, D. Characteristics of a large-scale deep foundation pit excavated by the central-island technique in shanghai soft clay. I: Bottom-up construction of the central cylindrical shaft. J. Geotech. Geoenvironmental Eng. 2013, 139, 1875–1893. [Google Scholar] [CrossRef]
- Tan, Y.; Wang, D. Characteristics of a large-scale deep foundation pit excavated by the central-island technique in shanghai soft clay. II: Top-down construction of the peripheral rectangular pit. J. Geotech. Geoenvironmental Eng. 2013, 139, 1894–1910. [Google Scholar] [CrossRef]
- Shao, W.; Sun, Q.; Xu, X.; Yue, W.; Shi, D. Durability life prediction and horizontal bearing characteristics of CFRP composite piles in marine environments. Constr. Build. Mater. 2023, 367, 130116. [Google Scholar] [CrossRef]
- Finno, R.J.; Arboleda-Monsalve, L.G.; Sarabia, F. Observed Performance of the One Museum Park West Excavation. J. Geotech. Geoenviron. Eng. 2015, 141, 04014078. [Google Scholar] [CrossRef]
- Finno, R.J.; Blackburn, J.T.; Roboski, J.F. Three dimensional effects for supported excavations in clay. J. Geotech. Geoenviron. Eng. 2007, 133, 30–36. [Google Scholar] [CrossRef]
- Chen, H.H.; Li, J.P.; Li, L. Performance of a zoned excavation by bottom-up technique in Shanghai soft soils. J. Geotech. Geoenvironmental Eng. 2018, 144, 05018003. [Google Scholar] [CrossRef]
- Liu, G.B.; Jiang, R.J.; Ng, C.W.W.; Hong, Y. Deformation characteristics of a 38 m deep excavation in soft clay. Can. Geotech. J. 2011, 48, 1817–1828. [Google Scholar] [CrossRef]
- Long, M. Database for retaining wall and ground movements due to deep excavations. J. Geotech. Geoenviron. Eng. 2001, 127, 203–224. [Google Scholar] [CrossRef]
- Liu, Y.; Xiang, B.; Fu, M. Observed Performance of a Large-Scale Deep Triangular Excavation in Shanghai Soft Clays. Geotech. Geol. Eng. 2019, 4, 37:2791–2809. [Google Scholar] [CrossRef]
- Chen, S.; Cui, J.; Liang, F. Case study on the deformation coupling effect of a deep foundation pit group in a coastal soft soil area. Appl. Sci. 2022, 12, 6205. [Google Scholar] [CrossRef]
- Tan, Y.; Wang, D. Structural behaviors of large underground earth-retaining systems in Shanghai. II: Multipropped rectangular diaphragm wall. J. Perform. Constr. Facil. Am. Soc. Civ. Eng. 2015, 29, 4014059. [Google Scholar] [CrossRef]
- Shi, J.; Liu, G.B.; Huang, P.; Ng, C.W.W. Interaction between a large-scale triangular excavation and adjacent structures in Shanghai soft clay. Tunn. Undergr. Space Technol. 2015, 50, 282–295. [Google Scholar] [CrossRef]
- Bolton, M.D.; Lam, S.-Y.; Vardanega, P.J.; Ng, C.W.W.; Ma, X. Ground Movements Due to Deep Excavations in Shanghai: Design Charts. Frontiers of Structural and Civil Engineering; Springer: Berlin/Heidelberg, Germany, 2014; Volume 8, pp. 201–236. [Google Scholar]
- Li, M.G.; Zhang, Z.J.; Chen, J.J.; Wang, J.H.; Xu, A.J. Zoned and staged construction of an underground complex in Shanghai soft clay. Tunn. Undergr. Space Technol. 2017, 67, 187–200. [Google Scholar] [CrossRef]
- Zeng, F.Y.; Zhang, Z.J.; Wang, J.H.; Li, M.G. Observed performance of two adjacent and concurrently excavated deep foundation pits in soft clay. J. Perform. Constr. Facil. 2018, 32, 04018040. [Google Scholar] [CrossRef]
- Tan, Y.; Li, X.; Kang, Z.J.; Liu, J.X. Zoned excavation of an oversized pit close to an existing metro line in stiff clay: Case study. J. Perform. Constr. Facil. 2015, 29, 04014158. [Google Scholar] [CrossRef]
- Wong, K.S.; Broms B, B. Lateral wall deflections of braced excavations in clay. J. Geotech. Eng. Div. ASCE 1989, 115, 853–870. [Google Scholar] [CrossRef]
- Ou, C.Y.; Lai, C.H. Finite-element analysis of deep excavation in layered sandy and clayey. Can. Geotech. J. 1994, 31, 204–214. [Google Scholar] [CrossRef]
- Li, M.G. Deformation Behavior of Adjacent Retaining Walls in Group Excavation. Ph.D. Thesis, Shanghai Jiao Tong University, Shanghai, China, 2016. [Google Scholar]
- Yan, G.; Wu, W.; Zhang, G. Centrifuge model test study of behavior of foundation pit. Geo-Shanghai 2014, 622–632. [Google Scholar]
- Powrie, W.; Daly, M.P. Centrifuge modelling of embedded retaining walls with stabilising bases. Géotechnique 2007, 57, 485–497. [Google Scholar] [CrossRef]
- Chen, S.; Cui, J.; Liang, F. Centrifuge model investigation of interaction between successively constructed foundation pits. Appl. Sci. 2022, 12, 7975. [Google Scholar] [CrossRef]
- Kunasegaram, V.; Takemura, J. Deflection and failure of high-stiffness cantilever retaining wall embedded in soft rock. Int. J. Phys. Model. Geotech. 2020, 21, 114–134. [Google Scholar] [CrossRef]
- Li, L.X.; Huang, J.J.; Han, B. Centrifugal investigation of excavation adjacent to existing composite foundation. J. Perform. Constr. Facil. 2018, 32, 04018044. [Google Scholar] [CrossRef]
- Tan, Y.; Wei, B.; Diao, Y.; Zhou, X. Spatial corner effects of long and narrow multipropped deep excavations in Shanghai soft clay. J. Perform. Constr. Facil. 2014, 28, 4014015. [Google Scholar] [CrossRef]
- Clough, G.W.; O’Rourke, T.D. Construction Induced Movements of In-Situ Walls. Conference on Design and Performance of Earth Retaining Structures. Geotechnical Special Publication No. 25; ASCE: New York, NY, USA, 1990; pp. 439–470. [Google Scholar]
- Peck R, B. Advantages and limitations of the observational method in applied soil mechanics. Géotechnique 1969, 19, 171–187. [Google Scholar] [CrossRef]
- Zhang, D.F.; Tong, L.Y.; Liu, S.Y.; Gao, X.N.; Lou, C.B. Deformation behavior of supporting structures of deep excavations in Suzhou subway line 1. Chin. J. Undergr. Space Eng. 2013, 9 (Suppl. S2), 1961–1965. [Google Scholar]
- Clough, G.W.; Smith, E.M.; Sweeney, B.P. Movement Control of Excavation Support Systems by Iterative Design. Proc. ASCE Foundation Engineering: Current Principles and Practice; ASCE: New York, NY, USA, 1989; Volume 2, pp. 869–884. [Google Scholar]
- Xu, Z.H. Deformation Behavior of Deep Excavations Supported by Permanent Structures in Shanghai Soft Deposit. Ph.D. Thesis, Shanghai Jiao Tong University, Shanghai, China, 2007. [Google Scholar]
- Tedd, P.; Chard, B.M.; Charles, J.A.; Symons, I.F. Behaviour of a propped embedded retaining wall in stiff clay at Bell Common Tunnel. Géotechnique 1984, 34, 513–532. [Google Scholar] [CrossRef]
- Mana, A.I.; Clough, G.W. Prediction of movements for braced cuts in clay. J. Geotech. Geoenvironmental Eng. 1981, 107, 759–777, (ASCE 16312 Proceeding). [Google Scholar] [CrossRef]
- Tan, Y.; Wei, B. Performance of an Overexcavated Metro Station and Facilities Nearby. J. Perform. Constr. Facil. Am. Soc. Civ. Eng. 2012, 26, 241–254. [Google Scholar] [CrossRef]
- Wang, Z.W.; Ng, C.W.; Liu, G.B. Characteristics of wall deflections and ground surface settlements in Shanghai. Can. Geotech. J. NRC Res. Press 2005, 42, 1243–1254. [Google Scholar] [CrossRef]
- Bjerrum, L. Allowable settlement of structures. In Proceedings of the 3rd European Conference on Soil Mechanics and Foundation Engineering, Wiesbaden, Germany, 18 October 1963; pp. 135–137. [Google Scholar]
- Yang, Z.K.; Chen, Y.L.; Azzam, R.; Yan, C. Performance of a top-down excavation in shanghai: Case study and numerical exploration. Eur. J. Environ. Civ. Eng. 2021, 26, 7932–7957. [Google Scholar] [CrossRef]
- Yang, Z.K.; Chen, Y.L.; Yan, C.; Azzam, R. Numerical Evaluation of Isolation Walls in Modifying Excavation-Induced Displacement Field. Arab. J. Sci. Eng. 2022. [Google Scholar] [CrossRef]
- Wang, H.; Li, L.; Li, J.P.; Sun, D.A. Drained expansion responses of a cylindrical cavity under biaxial in-situ stresses: Numerical investigation with implementation of anisotropic S-CLAY1 model. Can. Geotech. J. 2022. [Google Scholar] [CrossRef]
- Liu, C.; Zhang, Z.X.; Regueiro, R.A. Pile and pile group response to tunnelling using a large diameter slurry shield—Case study in shanghai. Comput. Geotech. 2014, 59, 21–43. [Google Scholar] [CrossRef]
- Rouainia, M.; Elia, G.; Panayides, S.; Peter Scott, M.A. Non-linear finite element prediction of the performance of a deep excavation in Boston Blue Clay. J. Geotech. Geoenviron. Eng. 2017, 143, 04017005. [Google Scholar] [CrossRef]
- Tan, Y.; Zhu, H.; Peng, F.; Karlsrud, K.; Wei, B. Characterization of semi-top-down excavation for subway station in shanghai soft ground. Tunn. Undergr. Space Technol. 2017, 68, 244–261. [Google Scholar] [CrossRef]
Disclaimer/Publisher’s Note: The statements, opinions and data contained in all publications are solely those of the individual author(s) and contributor(s) and not of MDPI and/or the editor(s). MDPI and/or the editor(s) disclaim responsibility for any injury to people or property resulting from any ideas, methods, instructions or products referred to in the content. |
© 2023 by the authors. Licensee MDPI, Basel, Switzerland. This article is an open access article distributed under the terms and conditions of the Creative Commons Attribution (CC BY) license (https://creativecommons.org/licenses/by/4.0/).