Article

Dynamic Responses of the Cylindrical Floating Drilling Production Storage and Offloading System with Annular Anti-Motion Structures under the Survival Sea Scenario

1
State Key Laboratory of Hydraulic Engineering Simulation and Safety, Tianjin University, Tianjin 300354, China
2
Tianjin Key Laboratory of Port and Ocean Engineering, Tianjin University, Tianjin 300354, China
3
School of Civil Engineering, Tianjin University, Tianjin 300354, China
*
Author to whom correspondence should be addressed.
J. Mar. Sci. Eng. 2023, 11(1), 218; https://doi.org/10.3390/jmse11010218
Submission received: 9 December 2022 / Revised: 6 January 2023 / Accepted: 12 January 2023 / Published: 14 January 2023
(This article belongs to the Special Issue Offshore Structures and Hydrodynamic Modeling)

Abstract

:
At present, dry wellheads are usually adopted on small-storage TLP and SPAR platforms to develop offshore oil and gas because of the robust hydrodynamic performance under severe-wind seas. On the other hand, FPSO and FDPSO platforms that have a larger storage capacity can hardly use this cost-saving facility due to their relatively poor vertical motion performance. Cylindrical FPSOs are proposed to improve the heave performance of ship-type FPSOs, but their behaviors are still too large to adopt the dry wellheads. In the present work, a cylindrical FDPSO platform is proposed based on the FWPSO platform, adding an extension cylinder and a new damping structure at the bottom. Their hydrodynamic performances are calculated by the potential theory and compared in the frequency domain. Taking two particular mooring systems, including both catenary and ‘chain-polyester-chain’ types, and the survival sea scenario in the South China Sea into account, a time-domain coupling analysis was adopted to simulate the dynamic performance of the platform-mooring system. The feasibility of dry wellhead adoption on the FDPSO is discussed by investigating the platform motion and the mooring tension. The results show that the FCDS platform with the ‘chain-polyester-chain’-type mooring system can meet the motion response requirements, and the mooring system can also meet the requirements of the specification.

1. Introduction

Offshore oil has reached about 30% of the whole production in 2019, and it will be undoubtedly increasing and will become the major contributor in the following years [1,2]. Floating production storage and offloading systems (FPSOs) are one of the most prevailing structures for deep-water oil field development due to their large storage capacity when compared with other floating platforms such as semisubmersibles, TLPs, and SPARs [3]. First-generation FPSOs are modified from oil tankers, so most of the in-operation FPSOs are ship-type ones. Although their storage capacity meets the requirement of offshore oil and gas development, the ship-type FPSOs also have several disadvantages which challenge their safe and efficient operation. For example, due to their single-axis symmetrical structure, the environmental loads on the ship are different under various incident wave directions. To be specific, the beam wave will induce larger wave loads than the longitudinal wave. In order to reduce the resulting loading on the whole system, the single-point mooring (SPM) system is usually adopted [4]. Although safety is ensured, the SPM system is much more expensive than the multipoint mooring system.
On the other hand, ship-type FPSOs usually have relatively poor hydrodynamic features, especially the large heave motion. Because of this reason, subsea and flexible risers are chosen in most of deep-water oilfield developments, which means higher costs than adopting steel catenary risers (SCRs) or steel lazy-wave risers (SLWRs). Towards this end, many attempts have been performed to improve the motion response of FPSOs, and it has become one of the hottest topics in offshore engineering.
The most common approach is to optimize the hull shape or add several damping structures on the FPSO in order to improve its hydrodynamic performance. Lee et al. [3] optimized the main dimensions of a Brazil-field FPSO, and they found that the breadth and draft were increased for a longer heave natural period. Guan and Yang [5] explored an integrated optimization platform for the size optimization of the internal turret area of an FPSO. According to their simulations, the feasibility and reliability of the modeling method were validated, and the weight of FPSO was reduced by 13%. In the past decade, optimization work has greatly improved by the development of artificial neural networks (ANN) due to their outstanding performance in robust and nonlinear mapping features [6]. With the help of ANNs, many optimization works were finished more efficiently. The hull dimensions are also one of the significant targets optimized by ANNs. For example, Wu et al. [7] adopted the improved fruit fly optimization algorithm and back-propagation neural network to optimize FPSO design parameters.
Another possible solution to improve hydrodynamic performance is to design new-type floating structures. There are different kinds of non-ship-type FPSOs proposed, such as cylindrical bodies [8,9], multicylinder bodies [10], sandglass-type bodies [11,12], deep-draft multicolumn bodies [13,14], fillet inverted quadrangular frustum pyramid bodies [15,16], and so on. According to both numerical and experimental tests, their robust hydrodynamic performance is shown, especially the feature of insensitivity to the incident wave direction. However, their heave motions are still too large to use SCRs.
Many accessory bodies have been proposed to add to the structure so that they could help to solve the problem of large heave motion. The most successive innovation is the heave plate which is usually adopted on SPAR platforms. Its basic algorithm is to increase the heave damping by exciting the vortex shedding. Various numerical simulations and model tests have been carried out and validate its effectiveness on improving the heave performance of offshore platforms [17,18,19]. It hereby provides a possible solution for cylindrical FPSOs.
In previous works, we proposed a cylindrical FDPSO with an archetypical anti-motion structure which changes the damping skirt into an extended cylinder and an anti-motion structure (AMS). According to CFD-based simulations and model tests, the damping and natural periods of heave and pitch were investigated. Particularly, the influence of different anti-motion structures on its hydrodynamic performance was further studied [20]. In those CFD-based works, we conducted free-decay tests and forced-oscillation simulations on both the heave and pitch motions. In other words, there was no incident wave in the numerical wave basin except the radiation wave caused by the buoy motion. The results showed that the AMS significantly improved the heave damping of the cylindrical FDPSO. Based on this conceptual design and its outstanding damping performance, it is feasible to add dry-well facilities on the FDPSO. However, in that work, the mooring system was neglected, so the dynamic oscillations and the mooring tensions under the survival sea state were not simulated in the time domain. To more accurately assess whether AMS is effective in improving the hydrodynamic performance of cylindrical FPSOs, we adopted two different mooring lines to position the FDPSO, and its dynamic performance is simulated under extreme sea scenarios in the South China Sea by a time-domain coupled dynamic algorithm in the present work. Firstly, the hydrodynamic parameters of the different floating platforms are calculated in the frequency domain. Then, both the catenary mooring system and the ‘chain-poly-chain’ complicated mooring system are respectively adopted to position the floater. Based on the time-domain simulations, the ‘chain-poly-chain’ mooring system is determined. Finally, the time-domain analysis is taken out between different floaters moored by the same mooring system to show the robust hydrodynamic performance, and the feasibility of the dry-well facility installation is discussed.
In the following section, the system is briefly described. This is followed by numerical methodologies, including the hydrodynamics, other external environmental loads, the mooring tensions, and the governing equations. Afterwards, the results are reported and discussed. Finally, conclusions are drawn.

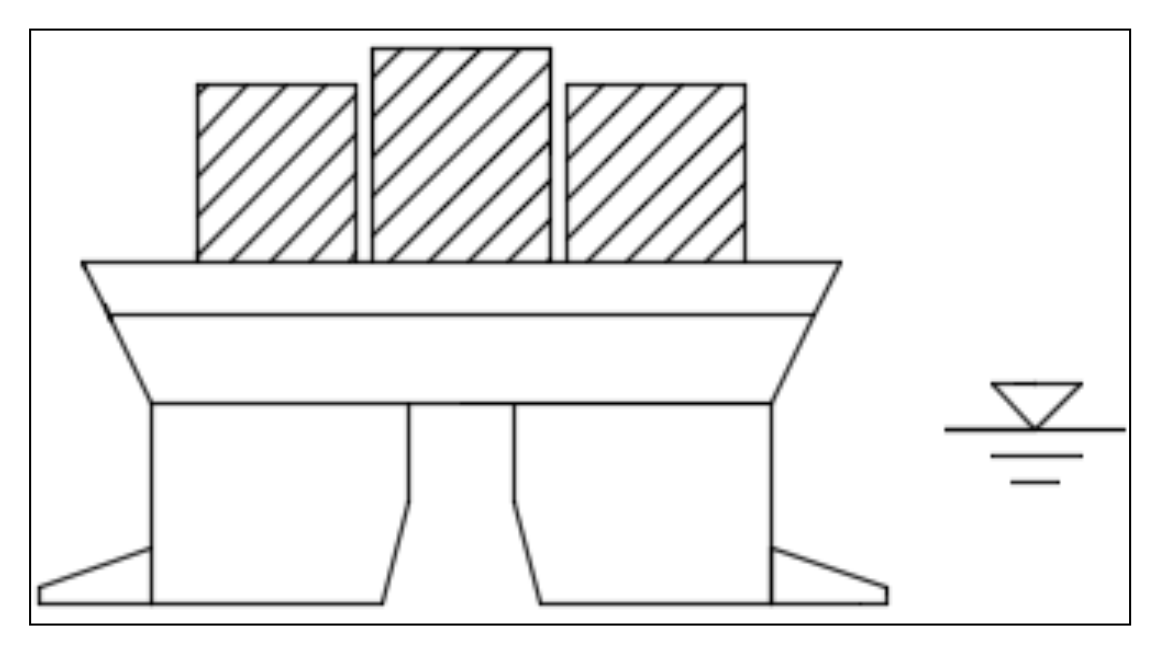
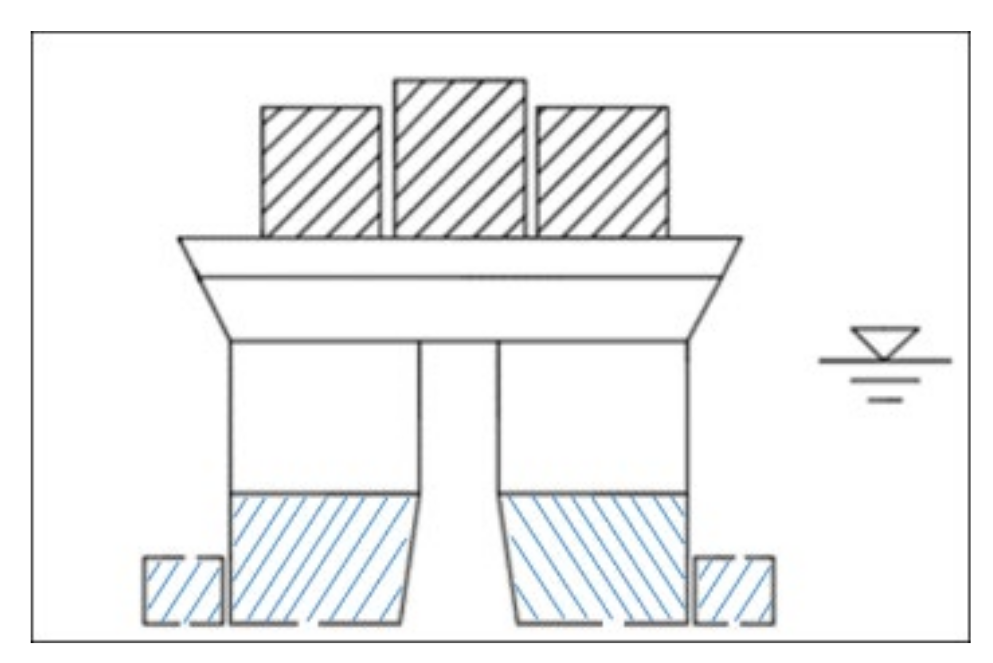
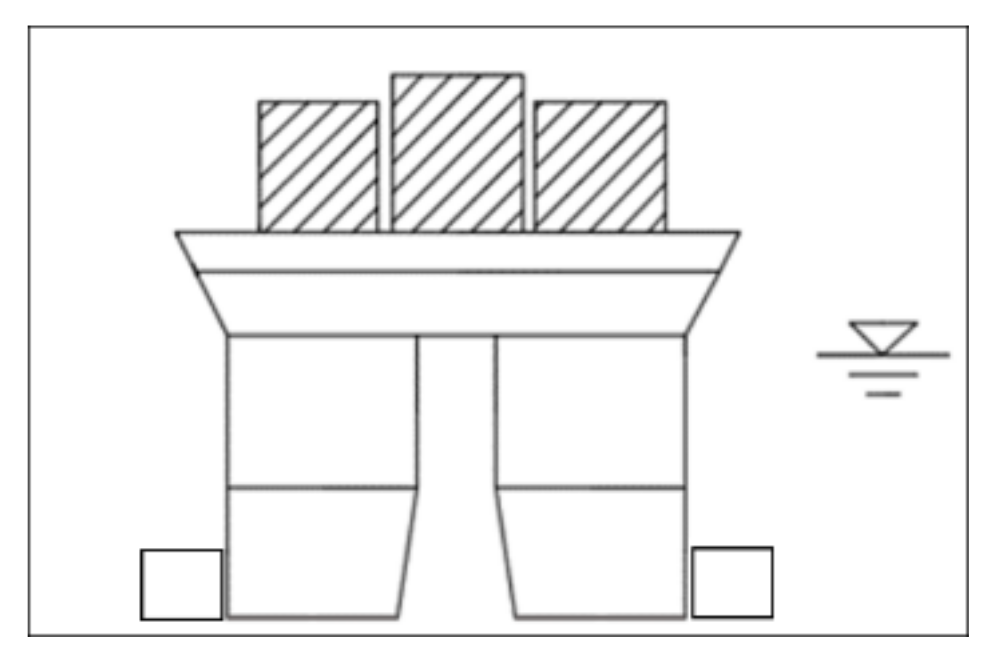
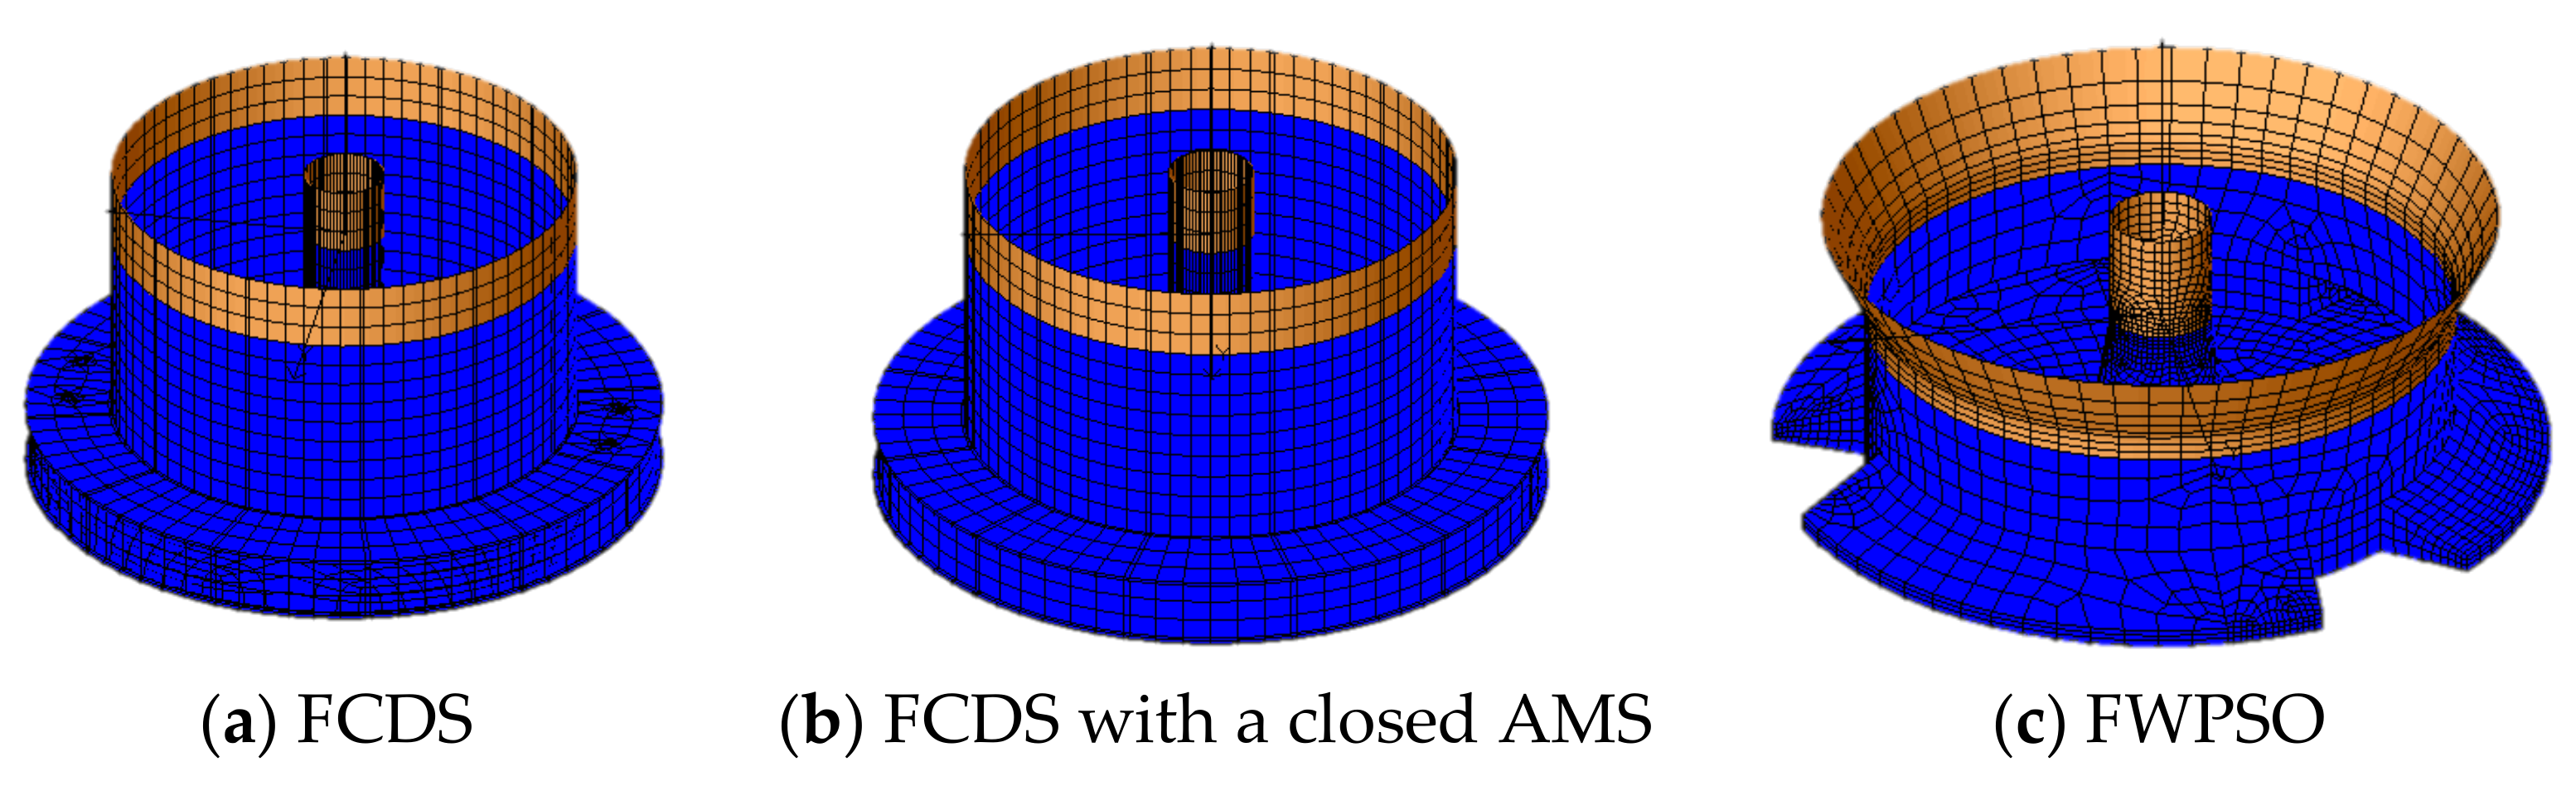
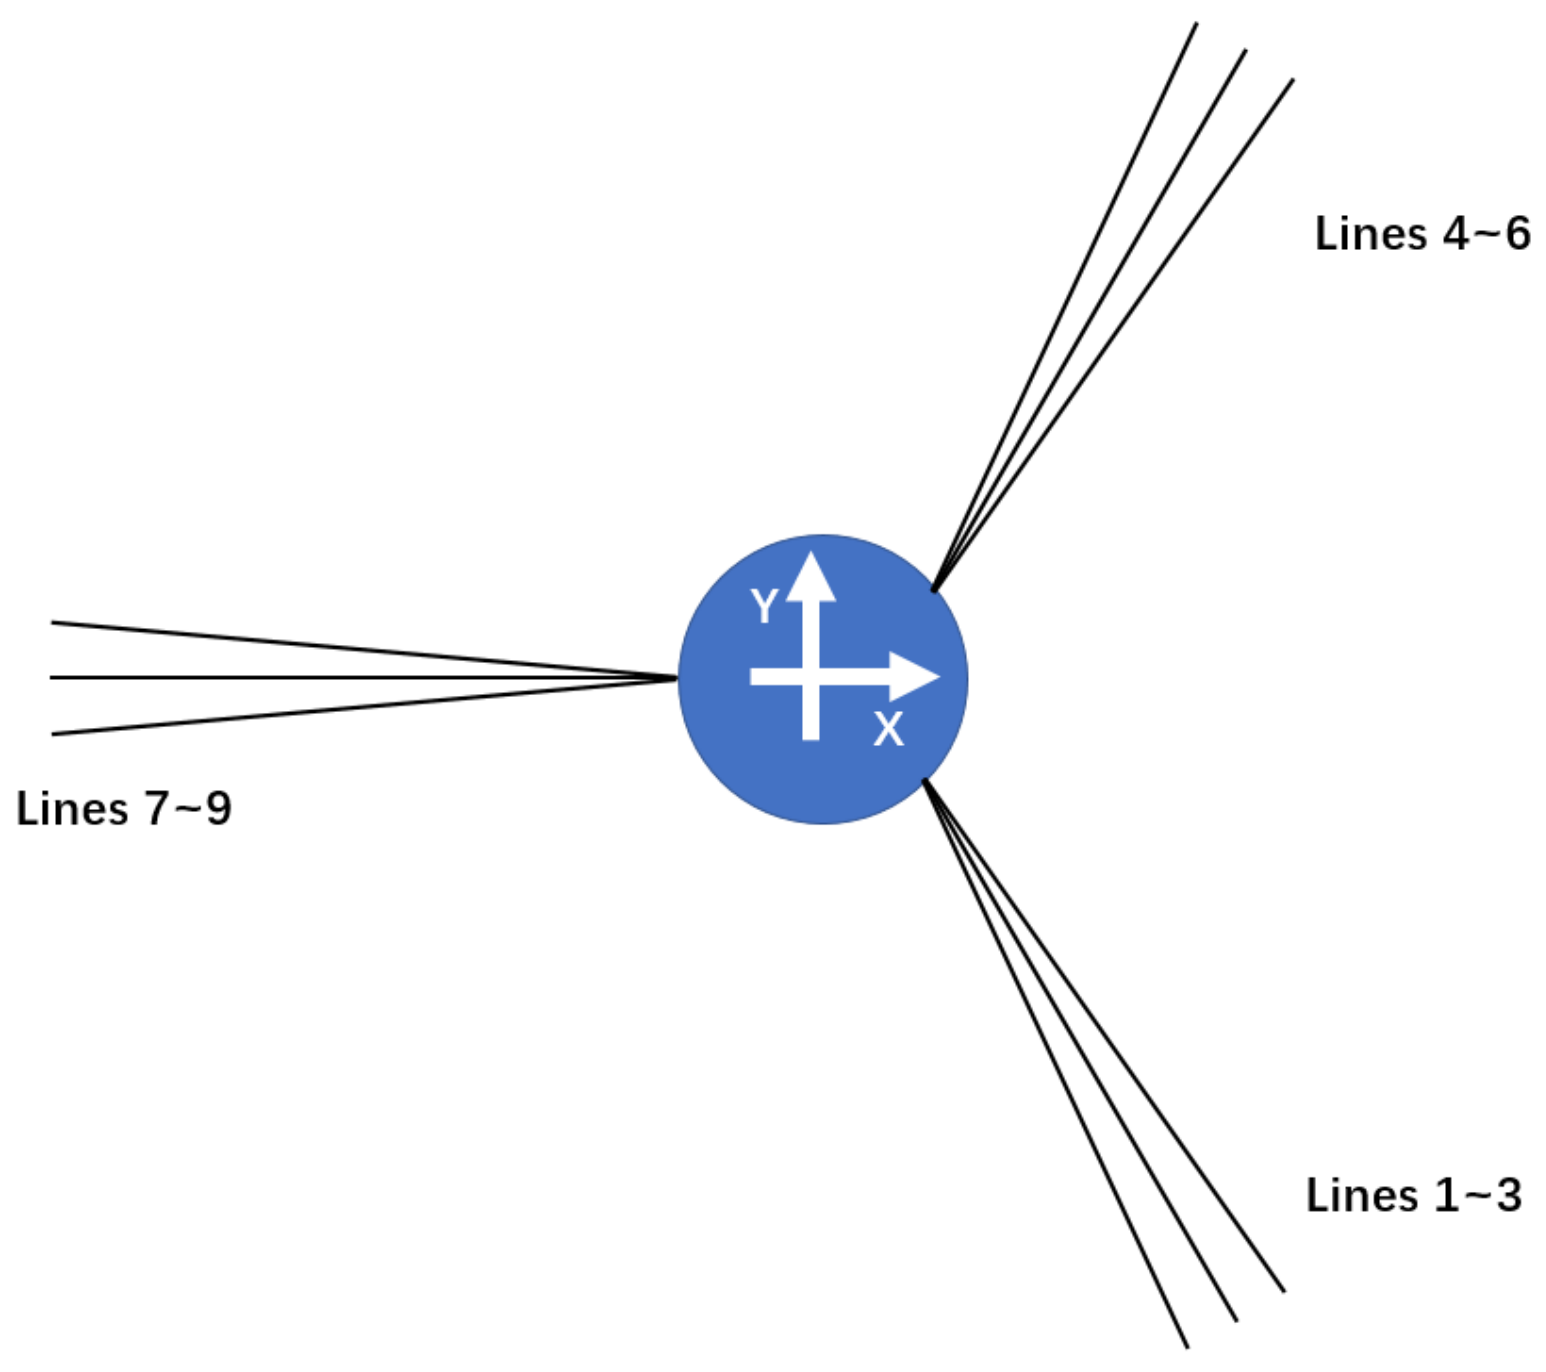
2. Physical Model Description

On the basis of a cylindrical FWPSO (floating workover production storage and offloading system), which is shown in Figure 1, a floating column with a dry-well and storage platform (FCDS, see Figure 2) is proposed in order to install the dry-well facilities on the floating platform. To be specific, the main body is improved by the following approaches.
On one hand, the main body length is doubled to add separate tanks under the main body. The cone-shaped damping structure on the FWPSO is removed and replaced by an annular anti-motion structure (AMS), whose cross section is rectangular, but there are several holes opening on both of their surfaces. With these holes, the bodies can be filled with seawater and the additional buoyancy provided by this accessory is neutralized by the internal fluid. In other words, the displacement of the floater remains almost the same after adding the AMS. According to the displacement in Table 1, we see that the displacement of FWPSOs is slightly larger than that of FCDSs with an AMS. This is caused by the cone-shaped damping plates around the main body. The original heave plates are fluid-tight so that they enlarge the displacement at the same draft. According to the pervious AMS, the added mass of the whole floating system is supposed to be amplified, and the natural period of the heave and pitch can be also increased to avoid significant wave period ranges. Since the main dimensions of the unopened bodies of FCDSs and FWPSOs are almost same, the displacements are similar between these two platforms. In addition, in order to compare the effectiveness of the holes and the internal sea water, another FCDS with a closed AMS (Figure 3) is established, and its hydrodynamic performance is also predicted in the following simulations.
On the other hand, as the seawater can freely flow into or across the AMS via the holes, the fluid viscosity can further increase the floater viscous damping in order to reduce heave and pitch motions. In other words, the mass of this sea water (which is connected to the outer sea water and can freely flow inside and outside of the body) is not included in the displacement, and the wet surface is also defined in the inner cover of the extensional body. Particularly, the external edge is added on the corner of the AMS (which can be more clearly observed in the hydrodynamic panel model in Figure 4a). Based on our previous work [20], it showed that this design can significantly improve both heave and pitch damping so that the buoy oscillations could be reduced under extreme sea states, especially when the wave period approaches the natural period of the buoy’s motion.
In the following sections, the FWPSO and FCDS are chosen to perform the hydrodynamic simulations in both the frequency and time domain. The main dimensions are displayed in Table 1. To be specific, the main dimensions were chosen and modified from the conceptual design of Yuan’s work [21].

3. Methodology

As permanent moored offshore floating platforms, cylindrical FPSOs usually operate under different kinds of sea states. Therefore, there are various environmental loads applying on their structure. Among them, waves, wind, currents, and mooring loads are the major ones which have significant influences on the dynamic performance of the floating buoy. Hereby, it is important to accurately calculate these loads during the numerical simulation.

3.1. Wave Loads

Wave loads are one of the dominant excitations on floating platforms. In practical oceans, actual waves are usually time-varying and stochastic, so irregular waves are usually adopted to perform the dynamic response prediction. Irregular waves can be recognized as the summation of various regular wave components with different frequencies and phases. Due to the stochastic feature, the wave spectrum is usually adopted to define irregular waves. In this study, we used the JONSWAP spectrum to simulate the wave elevation under the severe sea state.
For the wave–body interaction, the three-dimensional potential theory was adopted to calculate the wave loads. Assuming the flow is uniform, non-viscous, and incompressible, the fluid can be recognized as non-rotational. Based on the linear theory, the velocity potential can be divided into three parts, which include the incident wave, diffraction wave, and radiation wave, as the following equation shows [22]:
Φ x , y , z , t = Φ I x , y , z , t + Φ D x , y , z , t + Φ R ( x , y , z , t )
All terms should meet the Laplace equation and should be combined with the four types of boundary conditions of free surfaces, the seabed, wetted surfaces, and radiation. Their corresponding expression can be observed in Ref. [23]. These potential terms can be solved, and the flow velocities can be obtained by their partial derivatives. According to the Bernoulli equation, we can reach the wave dynamic loads by integrating the wave pressure on every wet-surface panel. According to this approach, we can easily obtain the frequency-dependent hydrodynamic parameters, including first-order wave loads, second-order, or even higher-order wave loads, added mass, and the potential damping in all six degrees of freedom (DOFs). However, in this preliminary simulation, we calculated the mean drift terms by the far-field algorithm and adopted the Newman approximation approach to simulate the second-order wave excitation in the time domain because the full quadratic transfer function (QTF) approach usually costs too much CPU time to obtain second-order wave load transfer functions [23,24,25]. To make the prediction more reasonable, a linear restoring matrix was added to represent the equivalent mooring stiffness on the horizontal degrees of freedom of the floater. It can make the second-order wave load term, which is based on the first-order motion, better fit the actual case. In addition, the viscous effect was not included in the potential theory; it was found that 4~7% of the critical damping is usually added as the linear term to represent the viscosity of cylindrical FPSOs [6,26,27,28]. According to our previous experimental free-decay tests [21], 0.092 and 0.084 were adopted as the dimensionless damping factors of the heave and pitch, respectively.

3.2. Wind Pressure Loads

Due to the turbulent wind velocity and the large upper deck, the wind pressure load on FPSOs is usually collinear with the incident wind direction, similar to the wave load. It is usual to use the average wind speed in a certain period and height to describe the wind, and the wind loads on offshore floating platforms can be calculated by the following equation [29]:
F w i = C w i α V 2
where C w i is the wind coefficient of every structure, α is the relative wind direction, and V is the relative wind speed corresponding to the platform’s motion.

3.3. Current Loads

Apart from waves, the current is another significant flow in the seas. For submerged floaters, the hydrodynamic loads applied on them include both wave loads and current loads. In common approaches, the current load can be simulated by the drag term formula as follows [29]:
F c u = 1 2 C d c ρ c A c V c 2
where C d c is the drag coefficient, ρ c is the seawater density, A c is the projection area, and V c is the relative current speed corresponding to the platform’s motion.

3.4. Mooring Loads

The mooring load, which helps the platform to keep its position against environmental loads, is another significant external load on floaters. There are two major approaches to calculate the mooring tension. One is the catenary model, which is a quasi-static algorithm to perform simulations. When the positions of the fairlead and anchor are achieved, the tension in the mooring line can be rapidly calculated from the catenary equation. The other approach is to use dynamic algorithms, such as the lumped-mass model, beam model, bar model, etc., to establish the numerical dynamic equation of the mooring lines. The dynamic features of the slender elements, including inertia and damping, can be taken into consideration based on this algorithm. More details about these numerical models on the mooring lines can be easily reached in our previous publications on FOWTs [24,25].

3.5. Governing Equations of Buoy Motion

In this work, the FPSO’s motions are predicted in both the frequency domain and the time domain. The governing equation in the frequency domain can be written as follows [4,23]:
M + A ω x ¨ ω + C ω x ˙ ω + K x x ω = F ω
where M represents the mass, A ( ω ) and C ω denote the added mass and potential damping corresponding to the incident wave frequency, K(x) is the restoring matrix, which includes both hydrostatic stiffness terms provided by the floater and the equivalent linear mooring stiffness in this frequency-domain simulation, F represents the external wave loads, and x ¨ , x ˙ , x represent the acceleration, velocity, and displacement of the FPSO stable oscillations in the frequency domain.
On the other hand, the time-domain governing equations of the floating system can be established by the Cummins equation in order to catch the complicated dynamic behaviors under the stochastic wind seas. The governing equation is shown as follows [22,23,24]:
M + A x ¨ t + 0 t h t τ x ˙ τ d τ + D f x ˙ + K x x = q t , x , x ˙
where A denotes the added mass for infinite frequency, D is the additional damping matrix, except the potential damping terms, f( x ˙ ) is the function of the floater velocity which corresponds to the damping matrix, and K(x) is the restoring matrix, which only contains the hydrostatic term of the floater. The mooring stiffness is not included in this term because the mooring tensions are directly calculated based on the algorithm described in Section 3.4, and its effect is included in the right term of Equation (5). Therefore, q represents the external loads, which include the environmental loads and mooring loads, which can be reached by the algorithms mentioned above. h ( t τ ) denotes the retardation function as the following convolutional equation shows [22,23,24]:
h τ = 1 π 0 u ω cos ω τ ω λ ω sin ω τ d ω A = u ω + 1 ω 0 h τ sin ω τ d τ
where μ(ω) and λ(ω) are the frequency-dependent added mass and potential damping. In Equations (4) to (6), the mass term can be reached in Table 1. For the other hydrodynamic parameters in both the frequency and time domain equations, they are calculated by ANSYS-AQWA in the following work.

4. Results and Discussions

We validated the damping performances of the anti-motion structures in previous publications [9,20]. However, in those works, due to the limitations of the CFD-based model in Fluent, only free-decay tests and force-oscillation tests were finished, and the viscous damping term and the vortex shedding performance were only discussed. Because the mooring system and the wave loads were not included in that work, we did not fully apprehend the dynamic features of FCDSs, and we hardly knew whether TTRs could be safely adopted on floaters. To achieve this goal, we first adopted the three-dimensional potential theory to calculate its hydrodynamic performance in the frequency domain. Then, two different kinds of mooring systems were adopted to moor FCDSs, and the time-domain simulations were performed to show the feasibility and advantages of the ‘chain-polyester-chain’ mooring lines. This is followed by the time-domain simulations via different floaters, with both an intact mooring system and a one-line-failure system. The results of the FCDSs are compared with those of the FWPSOs to study the viability of whether TTRs can be adopted on cylindrical FPSOs. In addition, another FCDS with a closed AMS was established to further demonstrate the effect of the holes on AMSs. In the following simulations, both the hydrodynamic coefficient calculation and the time-domain simulations were conducted in ANSYS-AQWA, which is a widely used and recognized commercial code, and its feasibility and accuracy of the hydrodynamic performance and wave load predictions have been validated in previous publications [30,31].

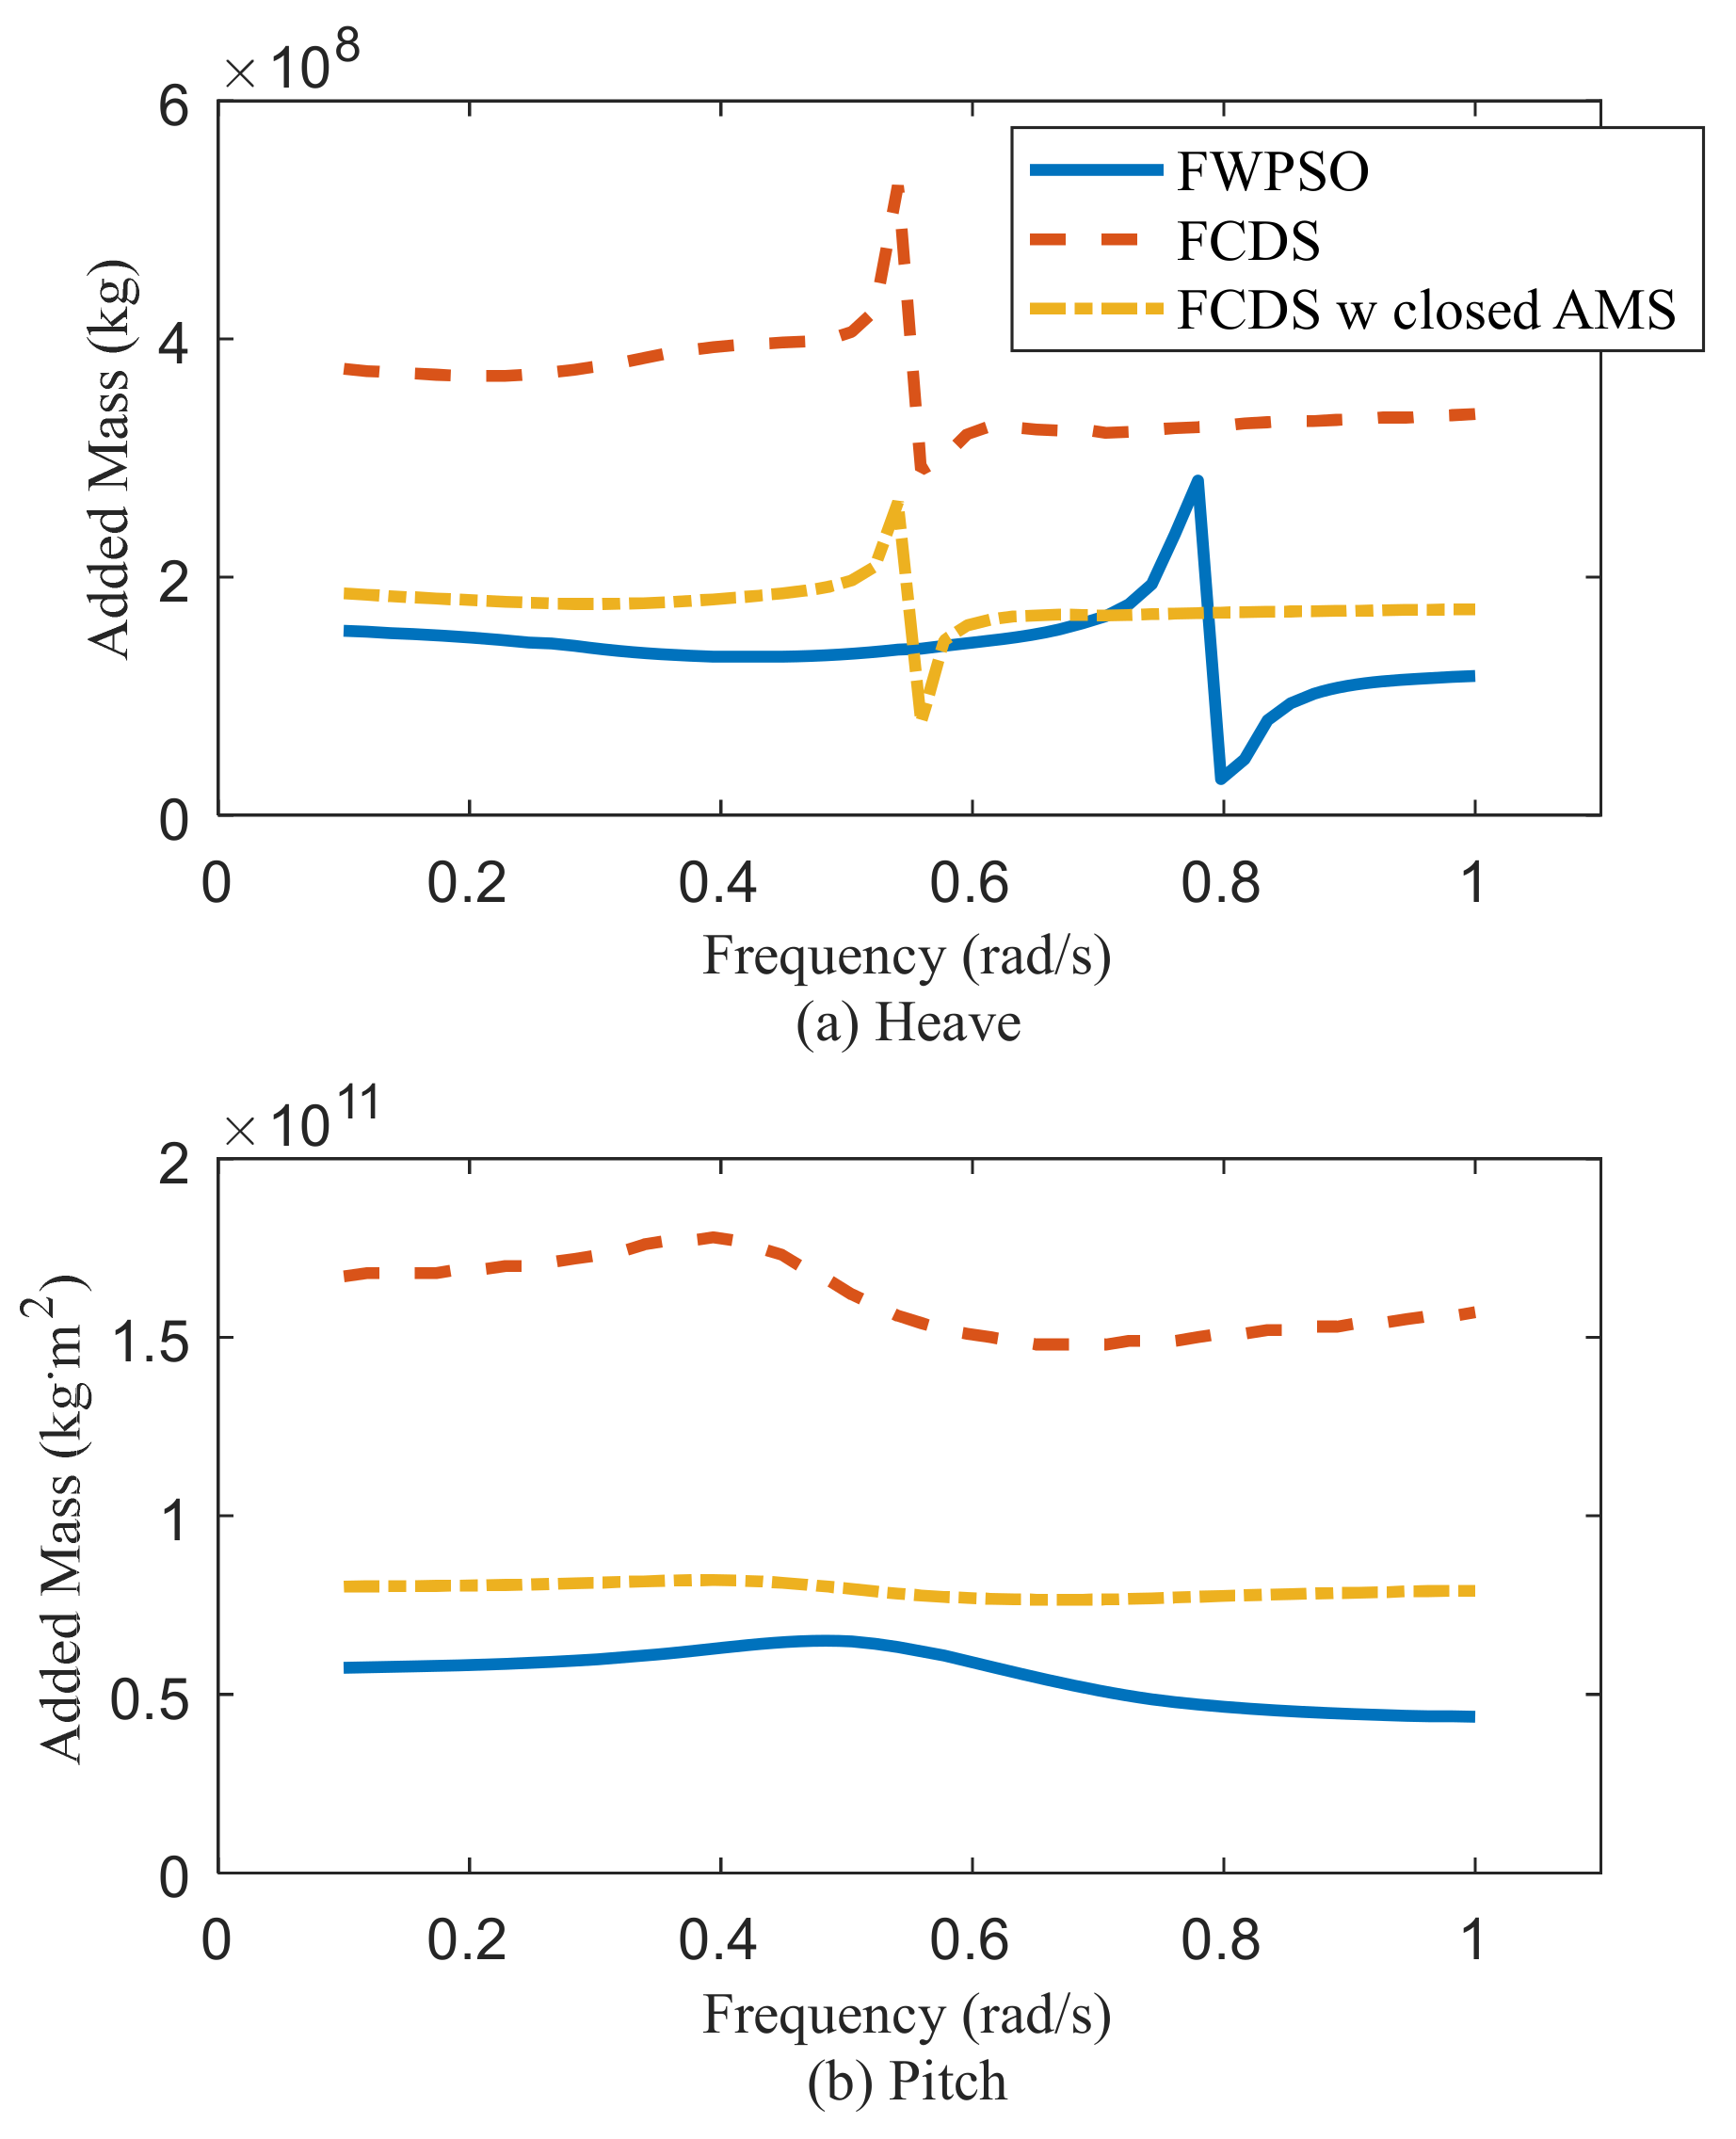
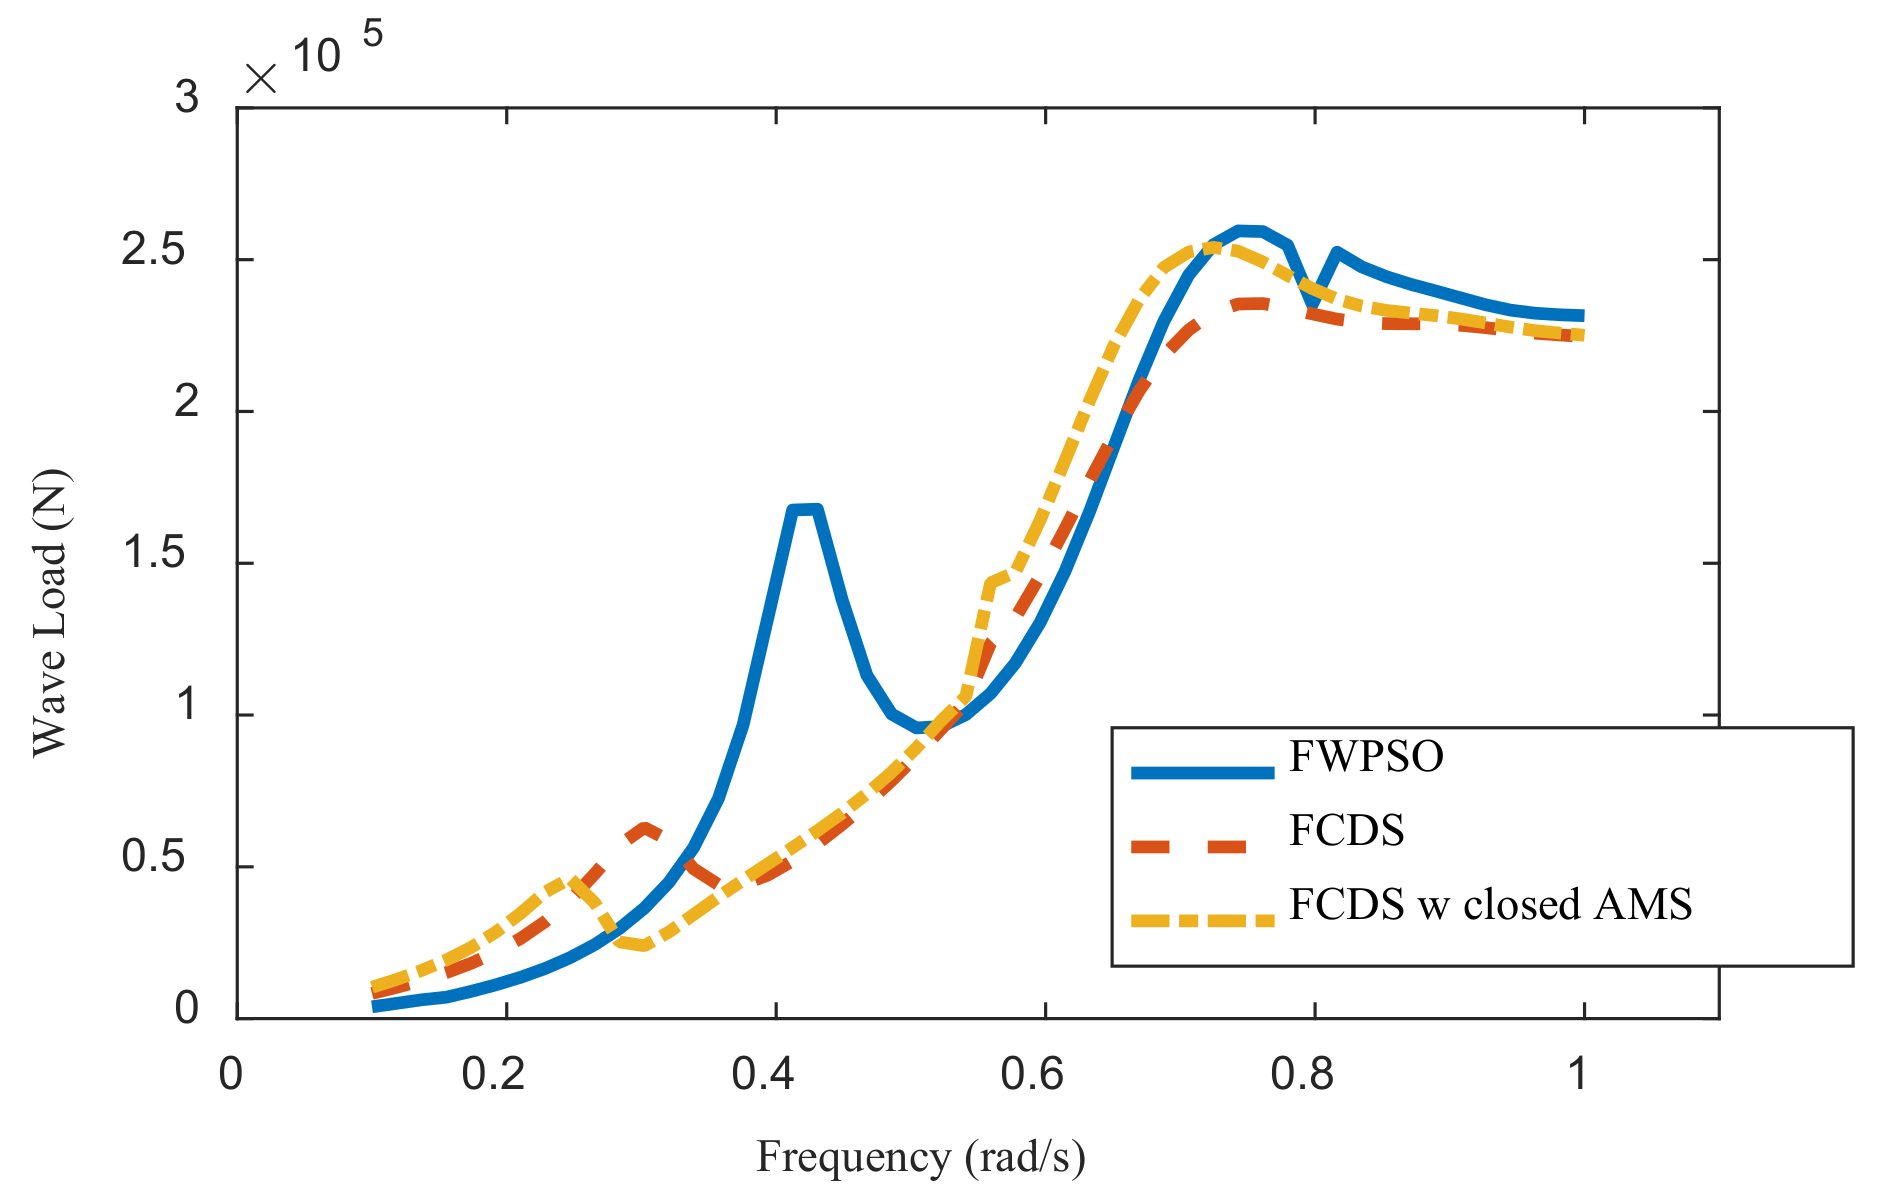
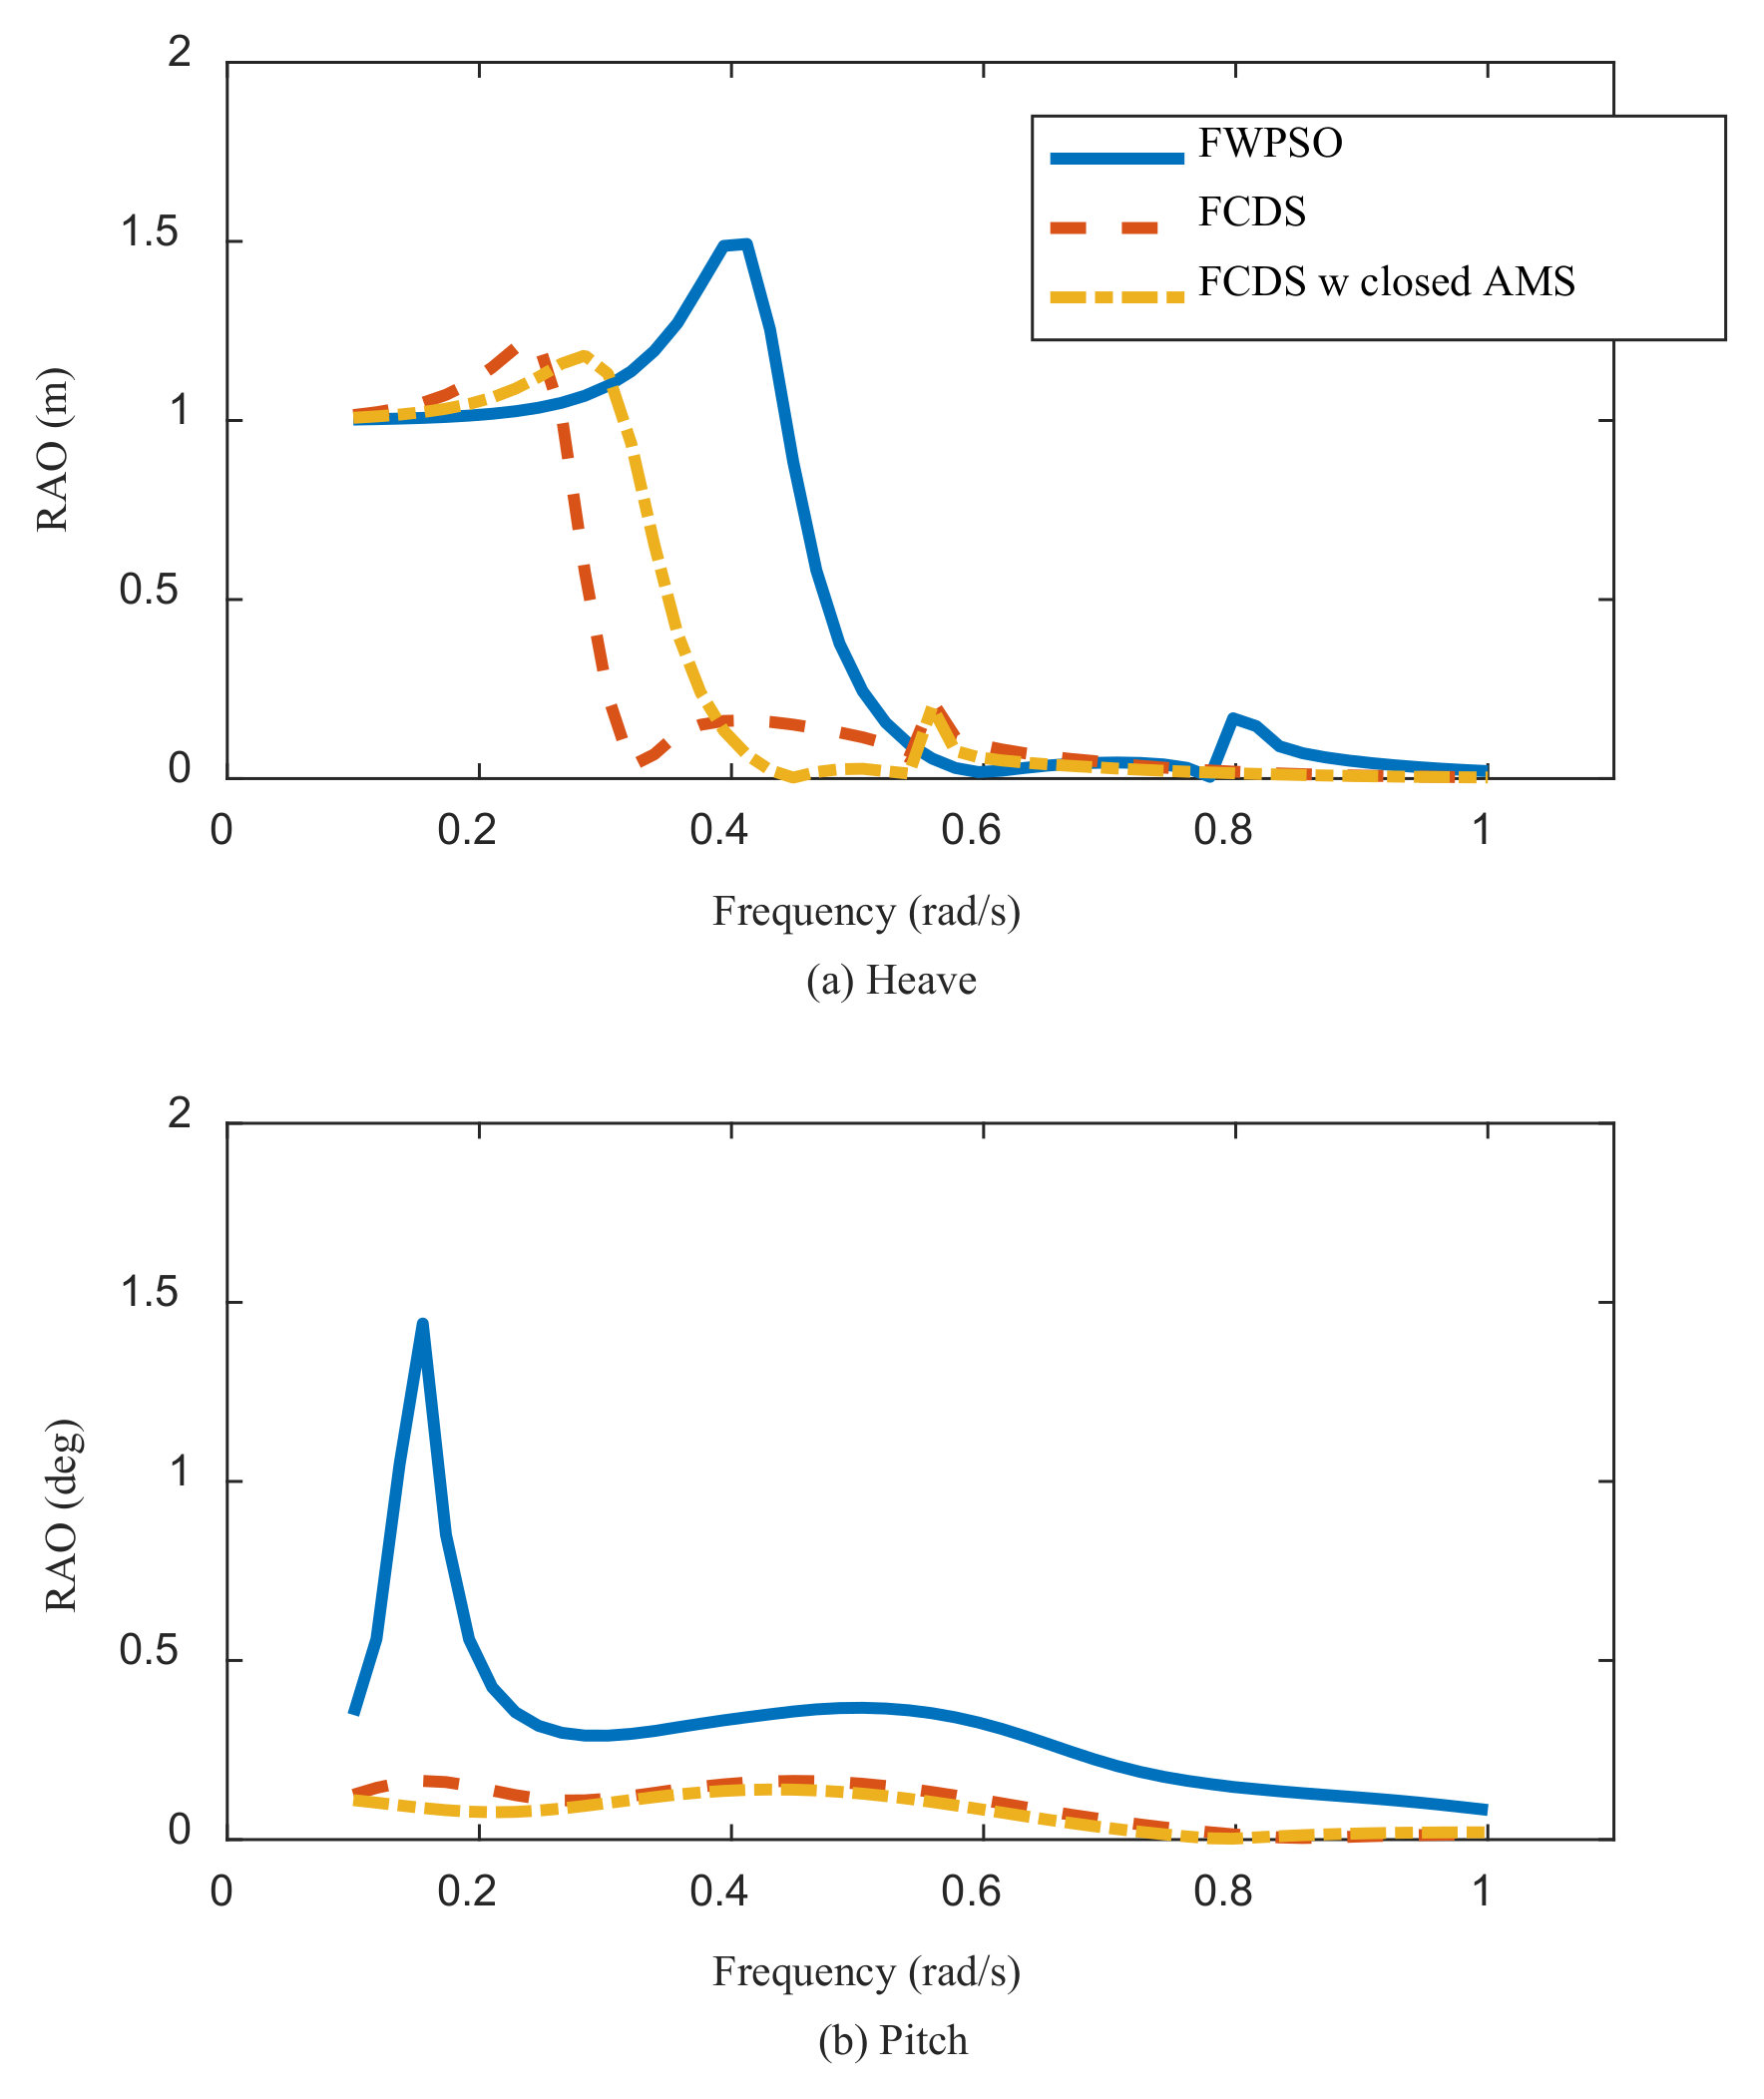
4.1. Hydrodynamic Response in the Frequency Domain

In this section, we establish the panel model of the FCDS and calculate its hydrodynamic coefficients in the frequency domain based on the 3D potential theory. Figure 4 shows the panel model of the FCDS. Since the upper deck is above the free surface, it is not included in the panel model. In addition, the FCDS with a closed AMS and the FWPSO are also established for comparison as Figure 4b,c show. As the mooring lines are not included in the frequency-domain calculations, the hydrodynamic coefficients of the heave and pitch motion are discussed in the following paragraphs. It should be pointed out that the mooring system is not established in the frequency-domain hydrodynamic calculation by this method. However, we have added a linear restoring matrix in the equation of motion to represent the equivalent mooring stiffness on surge, sway, and yaw. In fact, the mooring system is mainly to position the FPSO in case of a large drift motion in the horizontal plane, but its contribution on the heave, roll, and pitch motions, whose restoring stiffness is provided by the floater itself and the influence of the mooring lines, are always to be neglected, except if the taut mooring system is adopted. Due to this factor, more attention is paid to heave and pitch hydrodynamic performances in this subsection. The calculation wave frequency range we chose is from 0.1 rad/s to 1 rad/s, which corresponds to the wave period from 3.14 s to 31.4 s. This range can cover most of the significant offshore waves in the working area.
The results of the added mass are displayed in Figure 5. Compared with the FWPSO, both the heave and pitch added masses of the FCDS are significantly increased. The heave added masses of the FWPSO and FCDS are 1.5 × 10⁸ kg and 3.8 × 10⁸ kg, respectively, while the pitch added masses are 6.0 × 10¹⁰ kg.m2 and 1.6 × 10¹¹ kg.m2. From this aspect, we conclude that AMSs have positive effects on the radiation responses compared with the original cone damping structures. On the other hand, by comparing with the added mass of the FCDS with a closed AMS, we see that the corresponding added mass for the heave and pitch are 1.8 × 10⁸ kg and 8.0 × 10¹⁰ kg.m2. It shows that the pervious AMS can significantly increase the added mass. Another interesting phenomenon that can be observed is that the peak of the FWPSO curve in Figure 5 shifted. As the items in Table 1 show, the total draft length of the FWPSO is nearly half of that of the FCDS due to the different AMSs. Hereby, because the main diameters of the FWPSO and FCDS are same, we believe this frequency shift might be caused by the different wet-surface draft.
However, it should be admitted that the frequency-domain results are displayed in the dimensional graphs because we hope to show the intuitive results in this initial work. In the following works, once we obtain more results according to different main dimensions, such as diameters, drafts, and the anti-motion wave height, we will conclude these results in the dimensionless graph to show the trend. On the other hand, we also discovered an interesting phenomenon that the zig-zag shape appears in the added mass of the heave. Actually, we believe that the jumps in both the added mass curves may be caused by the moonpool in the center of the buoy, similar to what Chu and Zhang predicted in their publication [32].
The most critical issue of traditional cylindrical FPSOs is that the heave oscillation amplitudes are too large to safely install TTRs. Because the diameters of the main dimensions of the buoyancy part are the same, the key factor to improve the heave motion is to add the inertia term of the structure which includes the body mass and added mass. According to the results, we can see that the heave added mass can be doubled after adding the AMS. In other words, it shows that this accessory may create the opportunity to effectively improve the heave motion response of FCDSs so that it is initially feasible to use dry-well facilities on their platforms.
The first-order wave load transfer functions are displayed in Figure 6. According to the results, after adding the anti-motion structure, the heave wave load of FCDSs in the frequency range from 0.2 to 0.4 rad/s is lower than that of FWPSOs. However, in a more common wave frequency range (0.4 to 0.6 rad/s), both the pitch and heave wave loads are increased. This is caused by the longer and deeper structure, which will significantly enlarge the projection areas facing the waves. On the other hand, when comparing the wave loads on the FCDS with a closed AMS, we see that the extreme loads on the FCDS is obviously amplified by the opened AMS. It should be admitted that this will have a negative influence on the buoy heave motion. However, if a closed AMS is adopted, the pitch load will be weakened.
Apart from the first-order wave load, the second-order wave loads may amplify the horizontal drift motions and the mooring tensions. Therefore, the second-order mean drift forces were calculated based on the far-field method. Although it is believed to be a more accurate prediction algorithm than the near-field one, only the force/moments in the horizontal plane can be calculated from this method. Therefore, the load transfer functions in surge are displayed in Figure 7. According to the curves, the peaks were observed in the high-frequency area around 0.75 rad/s. The corresponding extreme amplitudes are almost the same among the three cases. In addition, smaller peaks were also observed from the lower frequency area. To be specific, the peak of the FWPSO was located around 0.45 rad/s, while those of the FCDS were in the range from 0.25 rad/s to 0.3 rad/s. As the most energy is distributed in the range from 0.4 rad/s to 0.6 rad/s in the common wave spectrum, it can be derived that the wave frequency component of the mean drift force on the FCDS can be reduced by the AMS.
The response amplitude operators (RAOs) are shown in Figure 8, and the natural frequencies are listed in Table 2. According to the results, we see that the natural frequencies of the pitch motion are in the range from 0.1 to 0.2 rad/s, which are much lower than the dominant wave frequencies from 0.4 rad/s to 1 rad/s. In addition, the peak response of the FCDS is also less than the FWPSO. It can be derived that the improvements can enhance the pitch responses under the most common sea scenarios. On the other hand, the heave natural frequency of the FWPSO is about 0.4 rad/s, which is similar to the survival sea state in most areas. This means that resonance may occur in these dangerous cases. Thanks to the increased added mass, which we discussed above, the natural frequency of the FCDS can be further reduced to 0.27 rad/s, which could avoid the resonance in most cases. In other words, the heave motion can be controlled in extreme statuses, such as in 50 yr or even 100 yr wave conditions. On the other hand, the natural frequency of the heave motion of the FCDS with a closed AMS is 0.31 rad/s, slightly larger than the FCDS with a pervious AMS. From this aspect, the larger heave motion will be easily excited by the wave under the survival sea state. The resonant pitch frequency of the FCDS is the largest one, but all of the three floaters are much lower than the significant wave frequency. In order words, the resonant pitch oscillation can be hardly excited by the extreme waves in the corresponding area.
From these results, we can derive that AMSs can effectively solve the large-heave problem of cylindrical FPSOs. In addition, according to our previous CFD-based simulations on anti-motion structures, we found that this unique structure can also increase the viscous damping, and the motion can be further reduced.

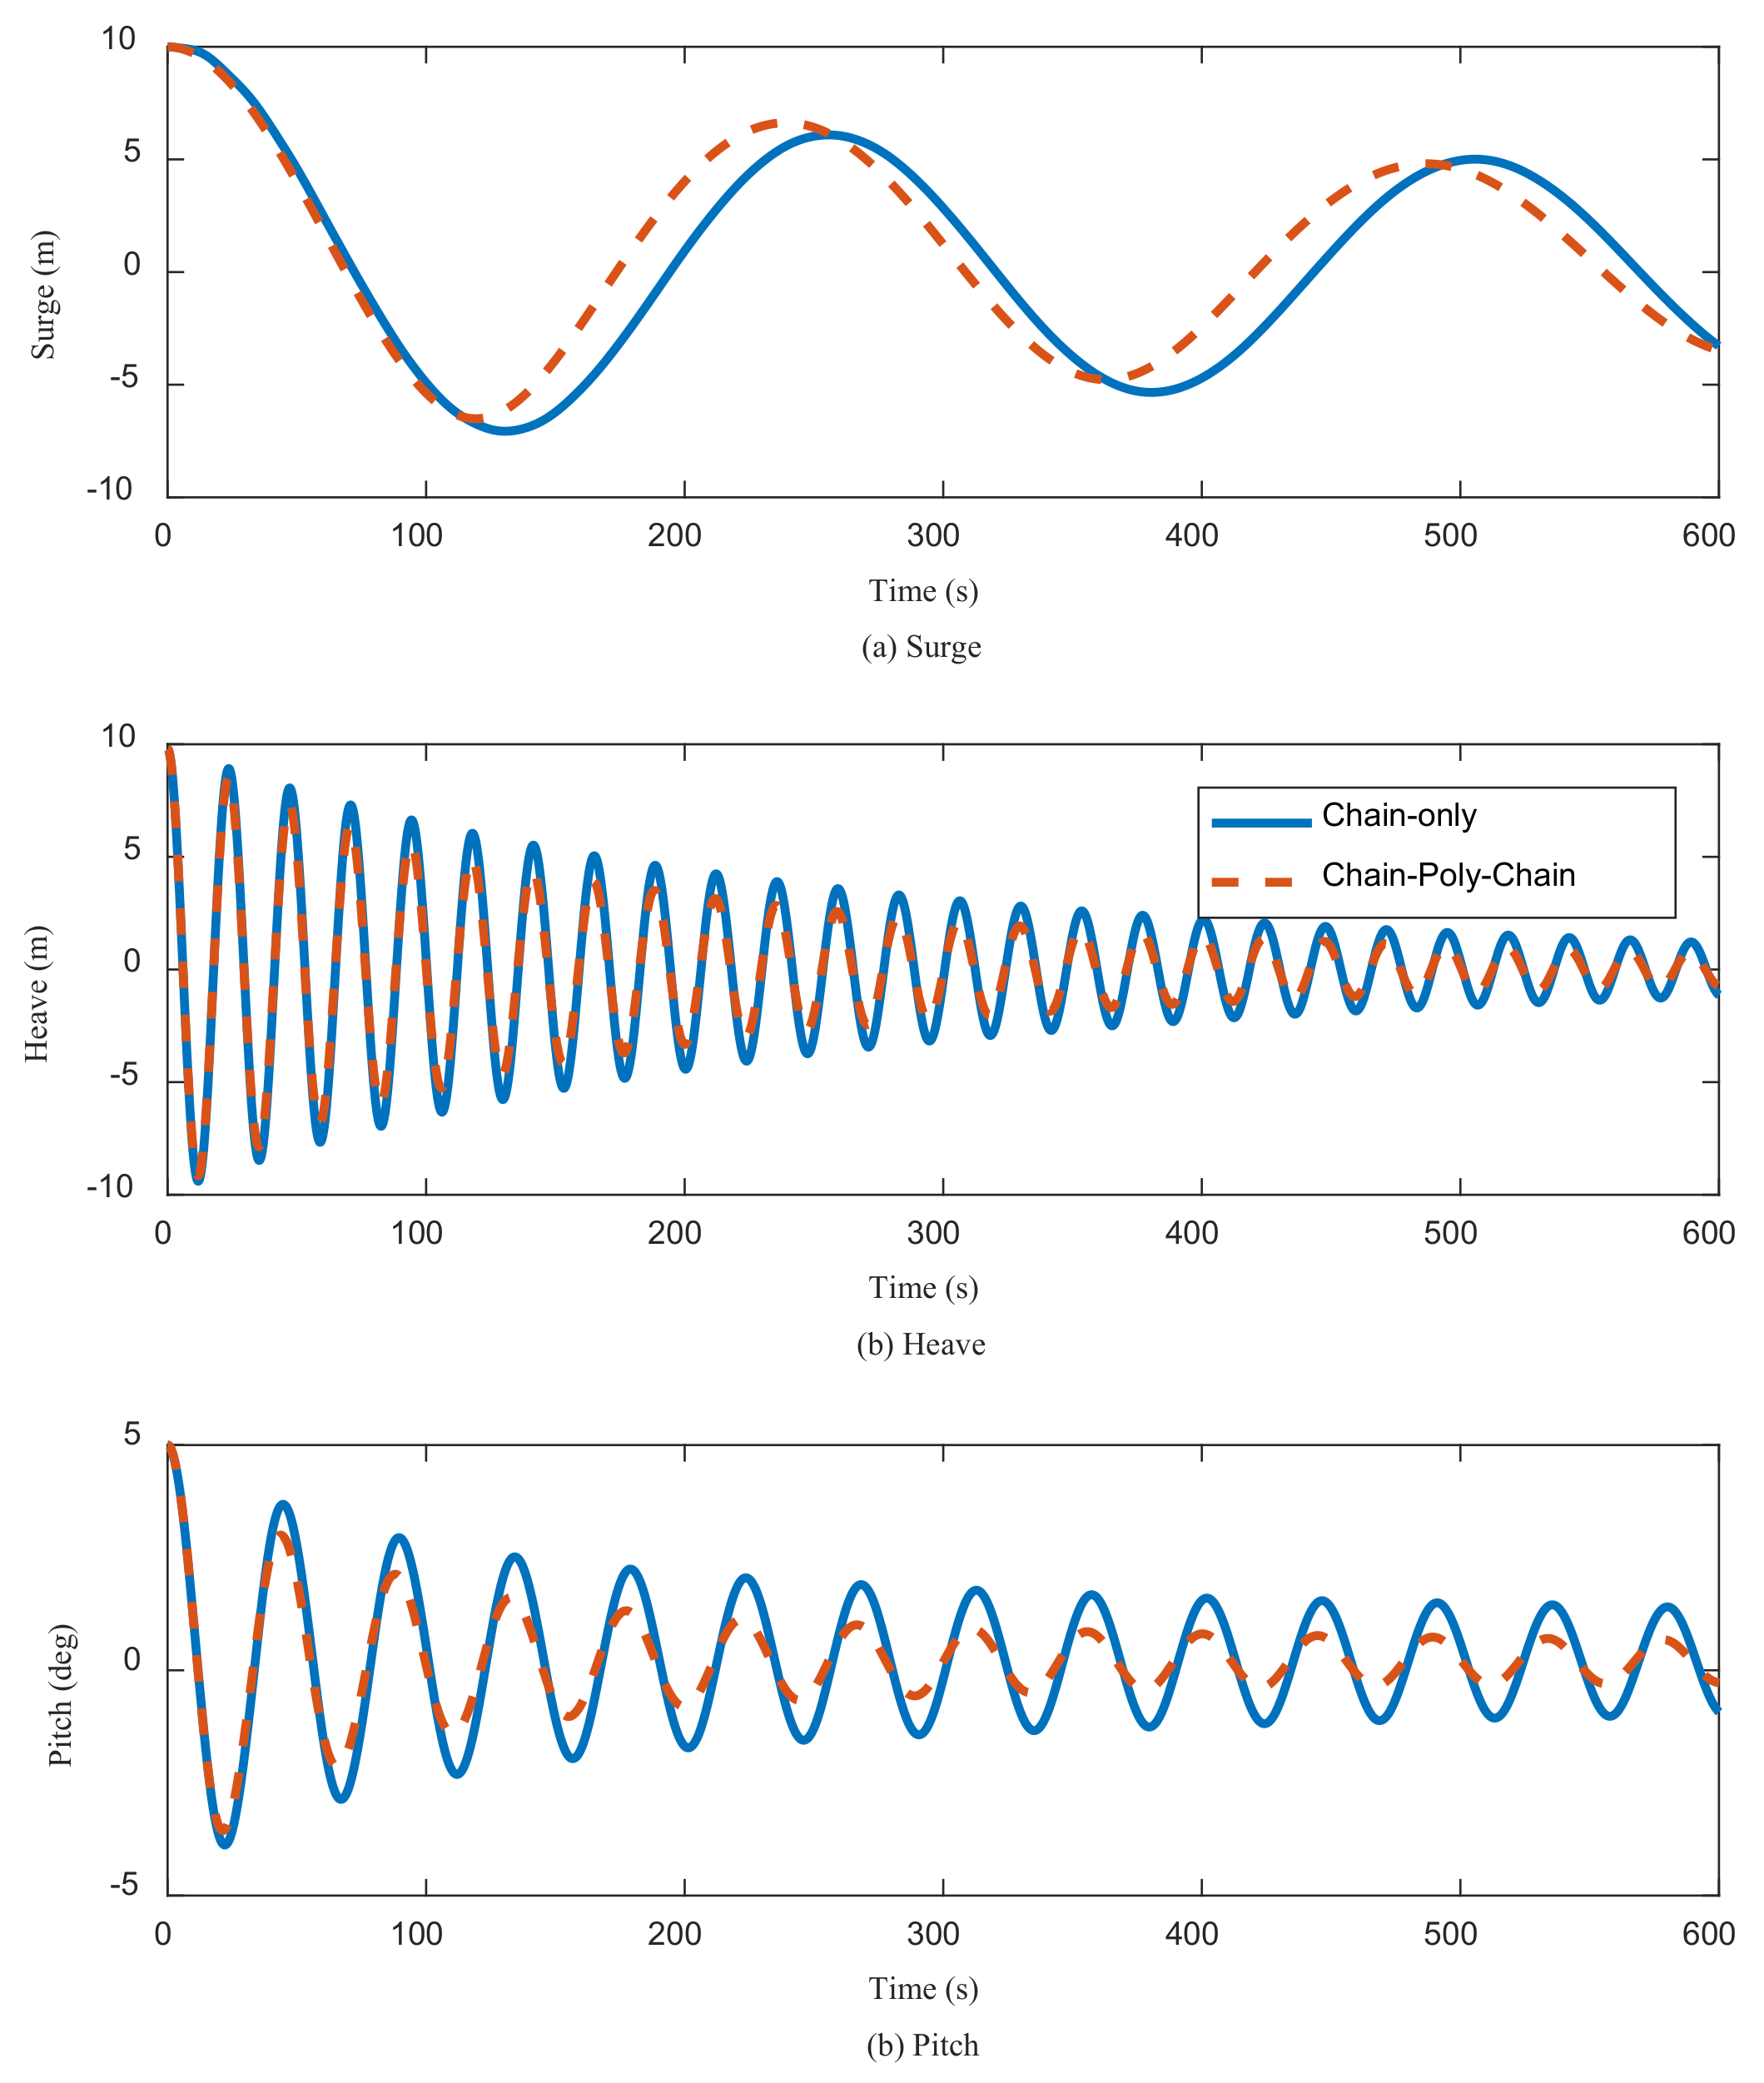
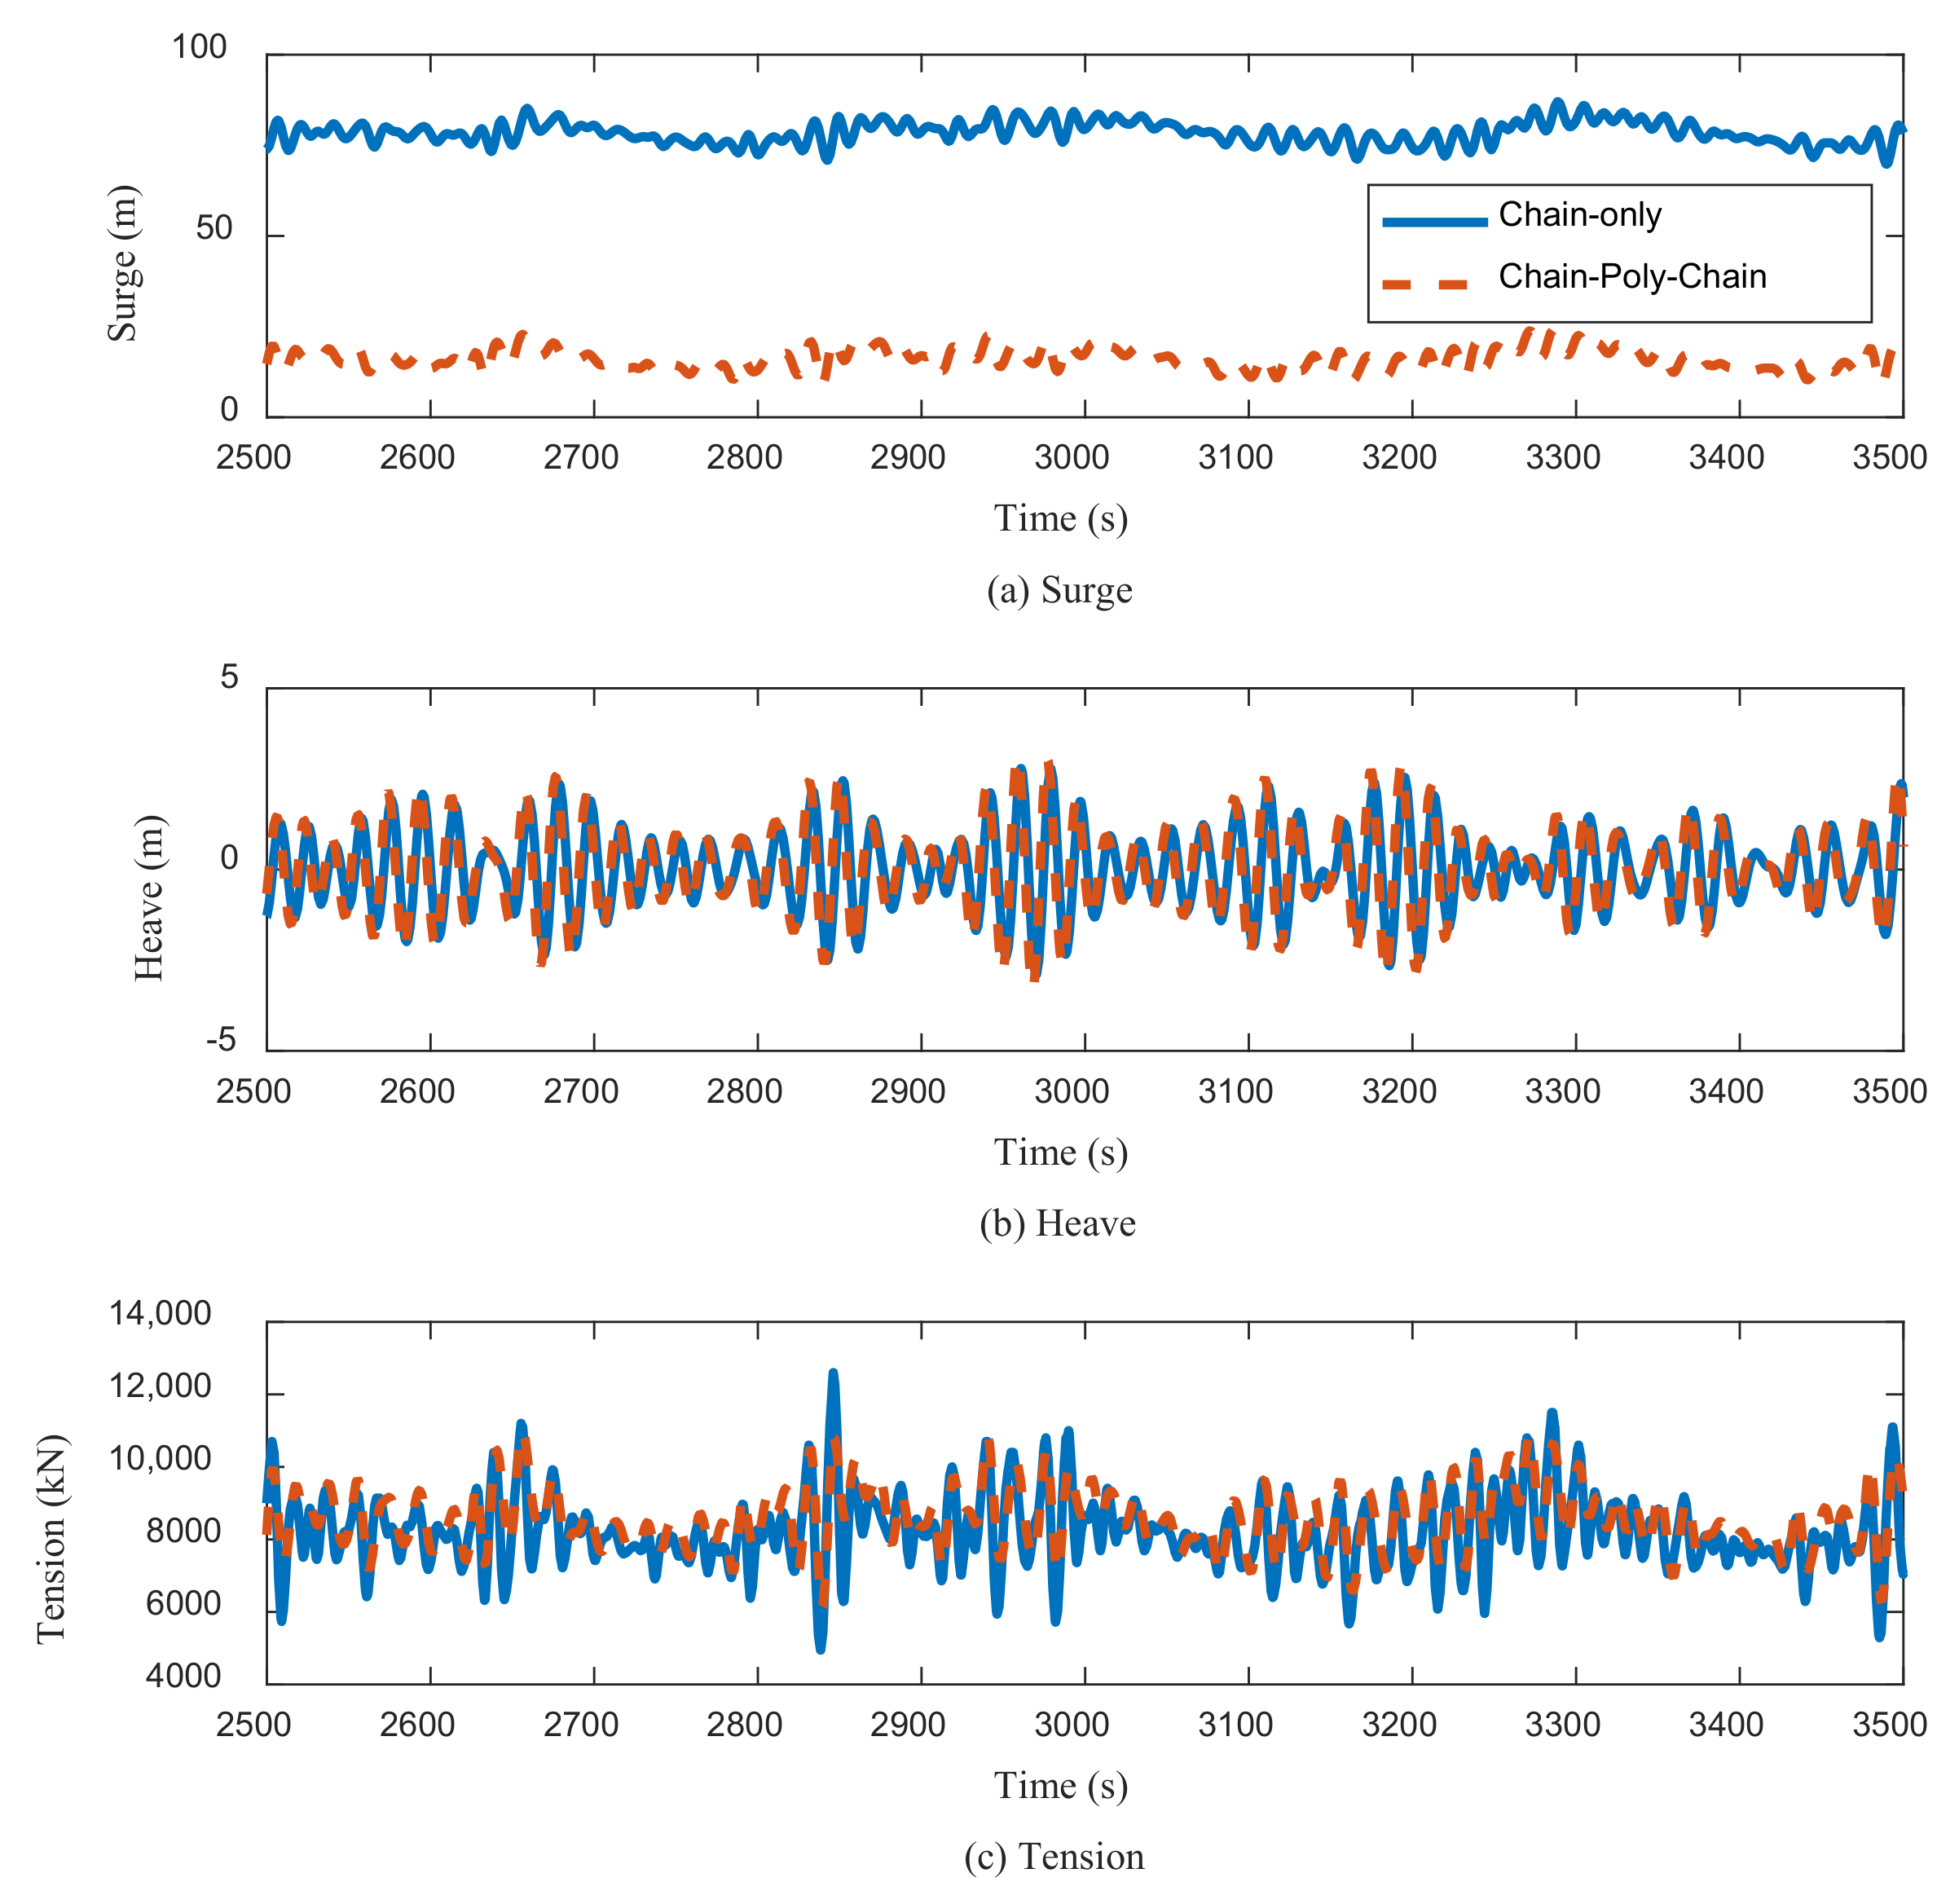
4.2. Mooring Configuration

To fully perform the time-domain coupled simulations, the mooring system is further necessary. Most of the mooring systems are designed based on previous project experiences and the corresponding standards or rules. However, there is little public information about the mooring system of the cylindrical FPSOs. Among different kinds of mooring configurations, the taut mooring system is widely adopted in recent cylindrical FPSO projects [33]. Unlike the catenary mooring lines in the shallow-water areas, where depths are less than 100 m, the taut mooring lines used in the deep-water areas usually consist of multiple segments, including chains, wires, polyesters, and other materials. For example, in the barge-type FPSO in the West African Usan oilfield, 12 chain-polyester-chain taut mooring lines are used for positioning in the 746 m water-depth area. They are divided into four groups in order to show the best mooring stiffness. Similarly, the Aasta Hansteen SPAR in the North Sea, which first had the storage function among SPAR platforms, used 17 groups of chain-polyester-chain taut mooring lines. In order to moor the SPAR in the 1270 m depth area; the length of the mooring line is 2500 m, and the length of the polyester segment is 2000 m. According to these practical engineering projects, the feasibility of the multi-segment taut mooring line is validated.
Based on the FCDS’s geometry as well as on the property of being insensitive to the environmental load direction, a multipoint mooring system is proposed for a 25-year lifetime, while the water depth of the target oil field is 282 m. Taking the geometrical symmetry of the buoy into consideration, nine mooring lines are divided into three groups, as Figure 9 shows, and the angle between the adjacent mooring groups is 120 degrees. The pretension in each line is 3000 kN. Specifically, two different kinds of mooring lines are adopted, respectively. One is the chain-only catenary mooring line, and the other mooring line consists of chains and polyester. Since the chain weight is much larger than the polyester, the overall length of a single mooring line is different in order to maintain the same pretension. More parameters can be found in Table 3.
The fully coupled time-domain analysis method was formed by establishing a dynamical algorithm for the mooring system with coupled calculations of the floating body motion and iterative solutions at each time step. To begin with the time-domain analysis, the free decay tests were adopted to obtain the natural frequencies of the moored floating system. An initial displacement on surge, heave, and pitch were adopted, respectively, and the time histories are documented in Figure 10. By adopting the fast Fourier transformation (FFT), the decay curves were transformed into amplitude spectra in the frequency domain, and the natural frequencies can be observed and are listed in Table 4.
According to the results, it can be seen that the natural frequencies of the surge motion are 0.0246 rad/s and 0.0263 rad/s, corresponding to the chain-only and chain-polyester-chain mooring systems, respectively. Based on these prediction results, it can be derived that the horizontal stiffness provided by the composite mooring system is larger than the single-segment mooring chains. In fact, the total length of the chain-only mooring line is less than that of the chain-poly-chain line according to Table 3, but the axial stiffness of the polyester is much larger than that of the chain. On the other hand, the chain-type mooring segment provides the mooring stiffness by the suspending mass in the water, but the polyester segments provide the stiffness by elongation. Because of the limited water depth and chain length, the suspending chain mass is relatively less so the mooring stiffness is smaller than the chain-poly-chain-type line. From these aspects, the surge natural frequency of the FCDS moored by chain-poly-chain lines will be larger relatively. On the other hand, both the heave and pitch natural frequencies are almost same between the mooring configurations, and the results are also similar to the frequency-domain results in Table 2.
After calculation of the resonance frequency of both mooring systems, we performed time-domain simulations to further compare the hydrodynamic performance under the 100 yr sea scenario. The environmental parameters can be found in Table 5. The 3 h simulations were conducted for the FCDS moored by both mooring systems. In the following paragraphs, the horizontal motions, heave motions, and mooring tensions are discussed. Moreover, according to the survey across the facility manufacturers, we found that the requirements of the buoy motions, considering the safety of the dry-well header, can be concluded as the following: the heave motion amplitude should be less than 3.5 m. On the other hand, the horizontal motion, including both surge and sway, should be less than 10% of the water depth. Specifically, when the mooring lines are adopted in the time-domain simulations, the draft will be slightly increased, and the buoy will freely float on the water due to the pretension or the weight of the mooring lines where the segments are not laying on the seafloor. In the following simulation, the corresponding draft in Table 1 means the actual draft when the mooring system is adopted. In the hydrodynamic parameter calculation, this effect is included as a vertical specified force on the floater, and the final draft of the floating platform can be kept at the target value.
Figure 11 shows the time histories of the heave and horizontal motions under intact mooring systems. In addition, the mooring tensions are documented in Figure 11c. According to the histories of surge motion in Figure 11a, it can be observed that the horizontal drift of the FCDS with a chain-only mooring system was much larger than that of the chain-polyester-chain mooring system; even the pretensions of both mooring systems are similar. In this study, the water depth of the target oilfield is about 300 m, so the maximum surge motion of the FCDS with a chain-only mooring system is about 80 m, over 25% of the water depth. This horizontal motion extremely exceeds the limitation value required by TTRs. It is mainly caused by the relatively small mooring stiffness of the chain-only mooring line when the pretension is insufficient.
Based on the results of heave motion in Figure 11b, it can be found that the heave motions are almost same among the FCDSs with different mooring systems. In other words, the heave motion is mainly determined by the hydrodynamic performance of the floater itself, rather than the mooring system. In addition, from the tension results in Figure 11c, we can observe that the oscillations in the chain-only lines are much larger than in the other composed mooring line systems. Another interesting phenomenon that can be observed in Figure 11b,c is the beat phenomenon during the oscillations. In fact, it usually occurs because the motion of the structure includes the frequency of the external excitation and its own natural frequency. In other words, the beat frequency phenomenon is caused by the superposition of two frequency vibration waveforms, which form a new vibration period and amplitude. On the other hand, the beat phenomenon causes extreme tension, especially in the chain-only mooring case, as Figure 11c shows. Otherwise, this issue is released by adopting the chain-poly-chain mooring line. This also illustrates the feasibility of the combined segment mooring system.
Therefore, it is safer to choose the chain-polyester-chain mooring line to position the novel FCDS. From this aspect, the feasibility of the chain-only mooring line is denied, and in the following simulations, the chain-polyester-chain mooring system is further adopted to perform the hydrodynamic response simulations between the FCDS and FWPSOs.

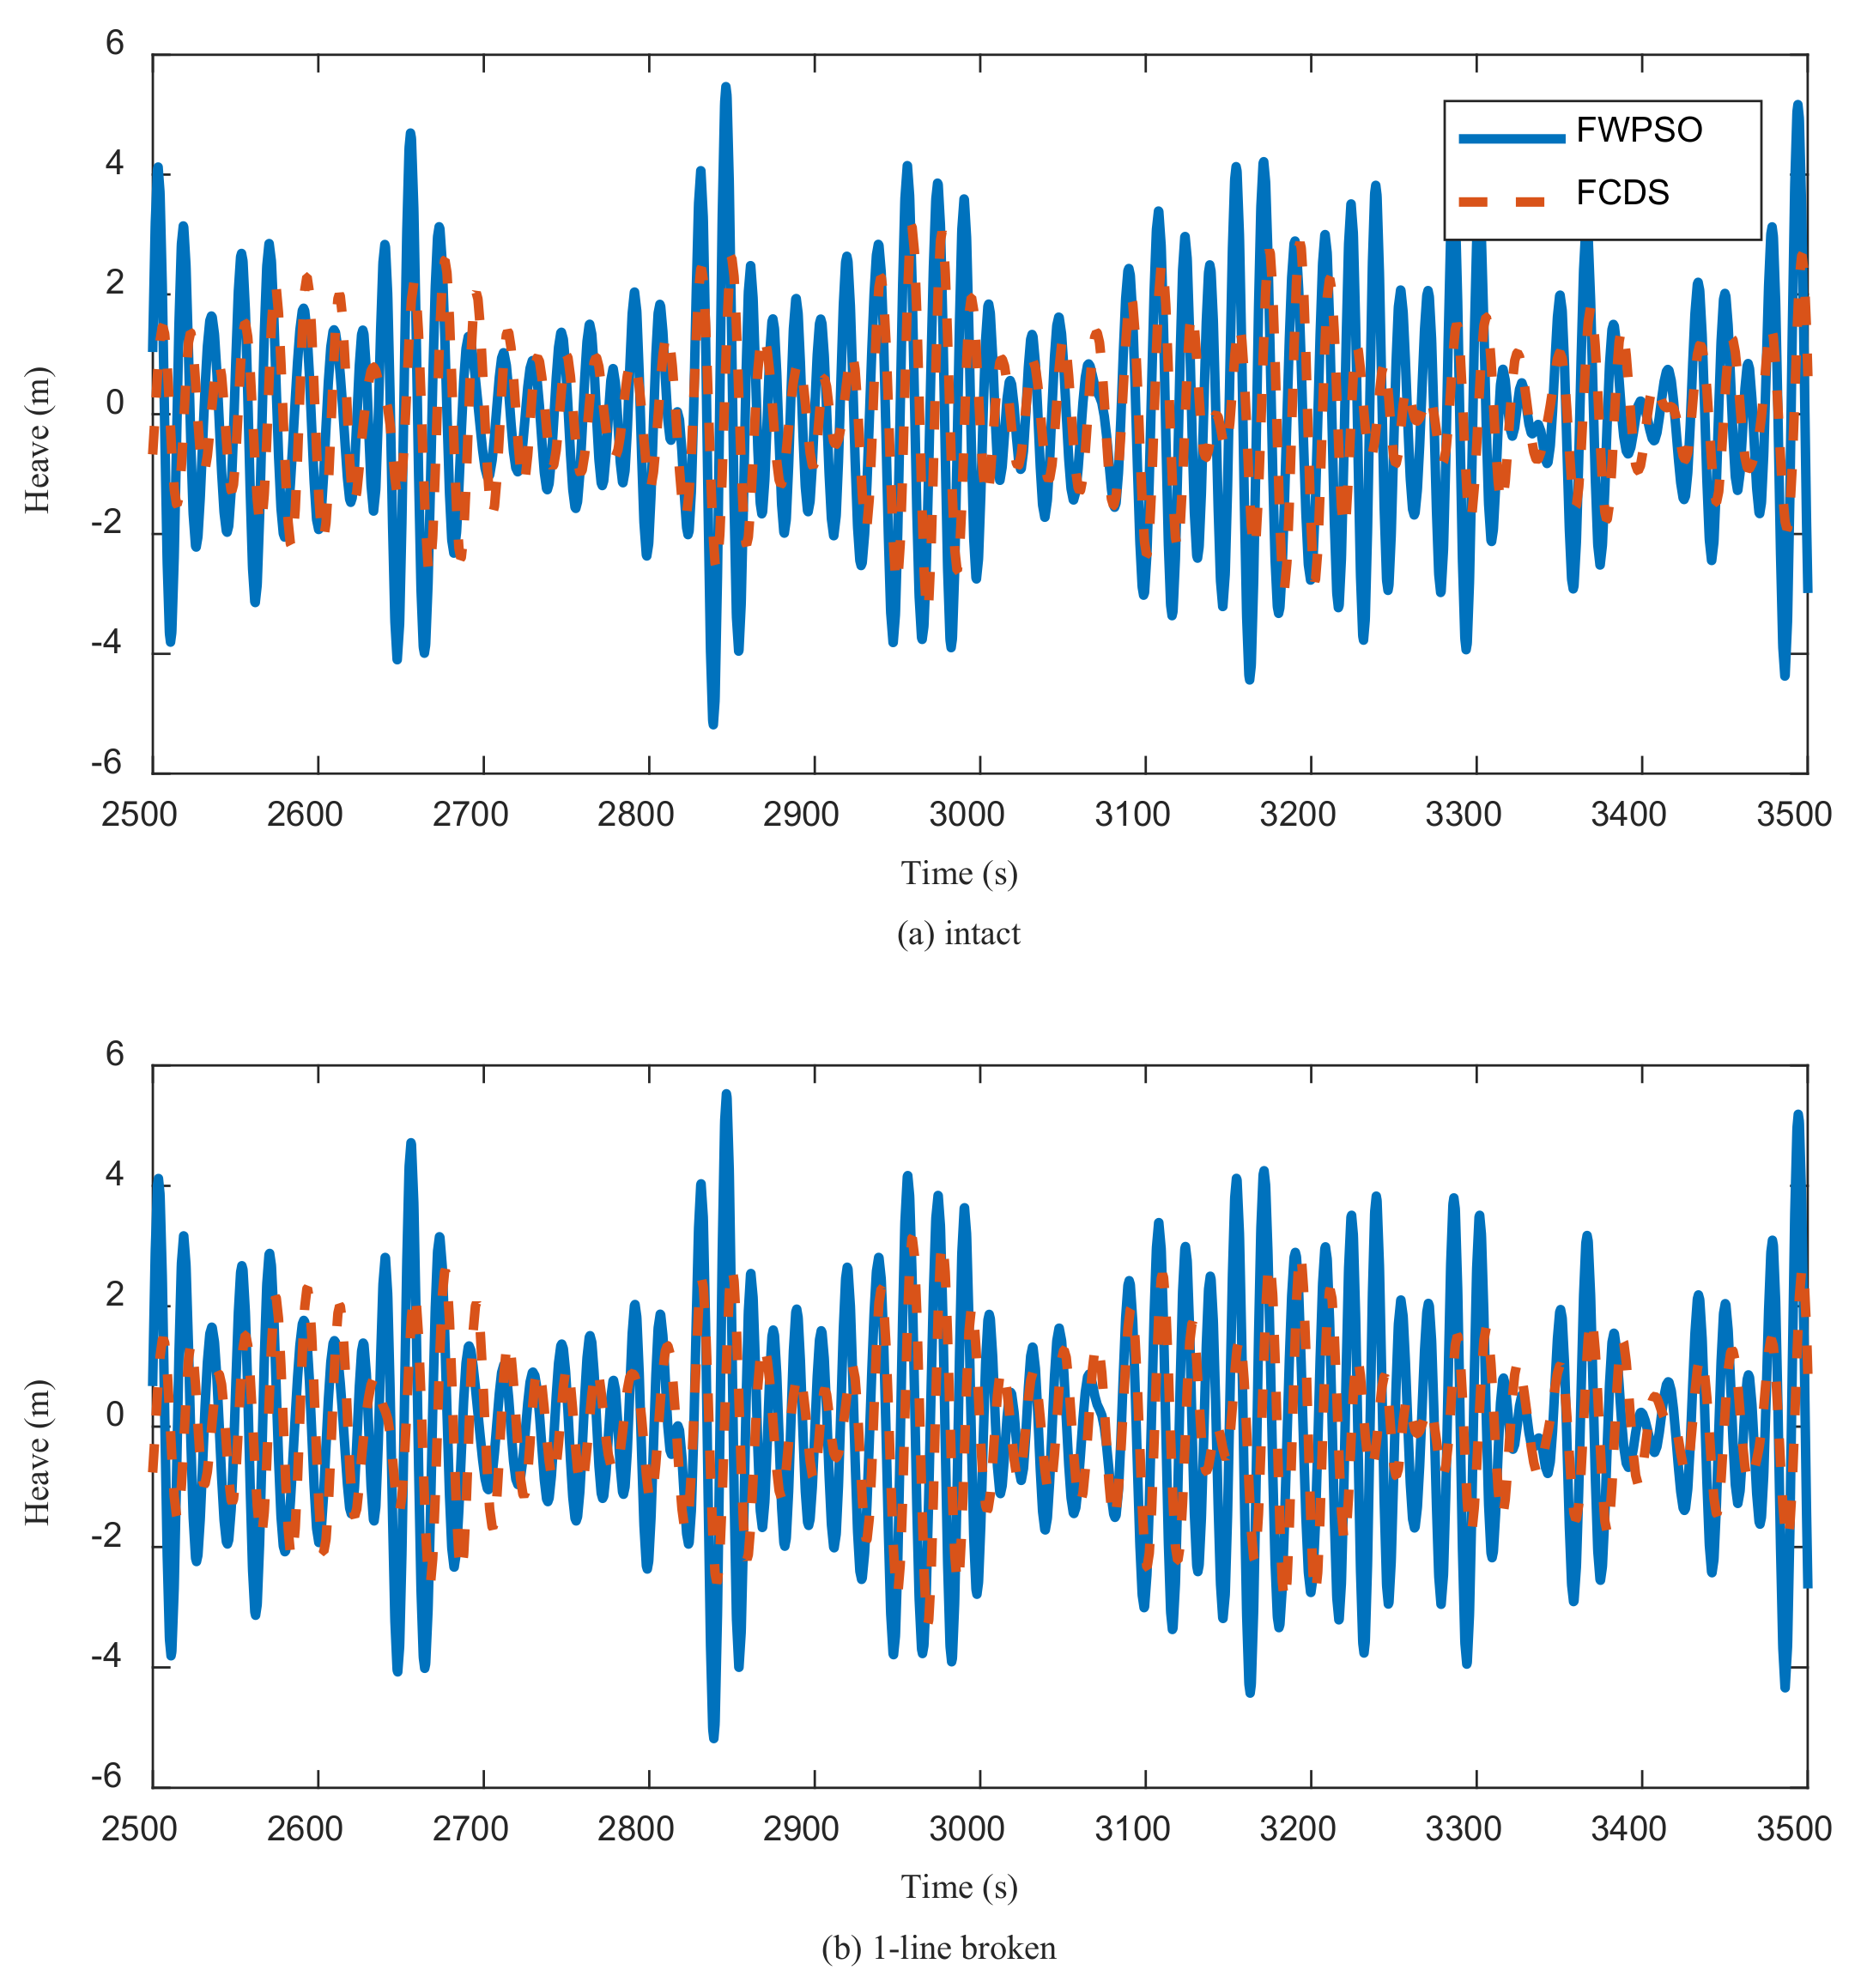
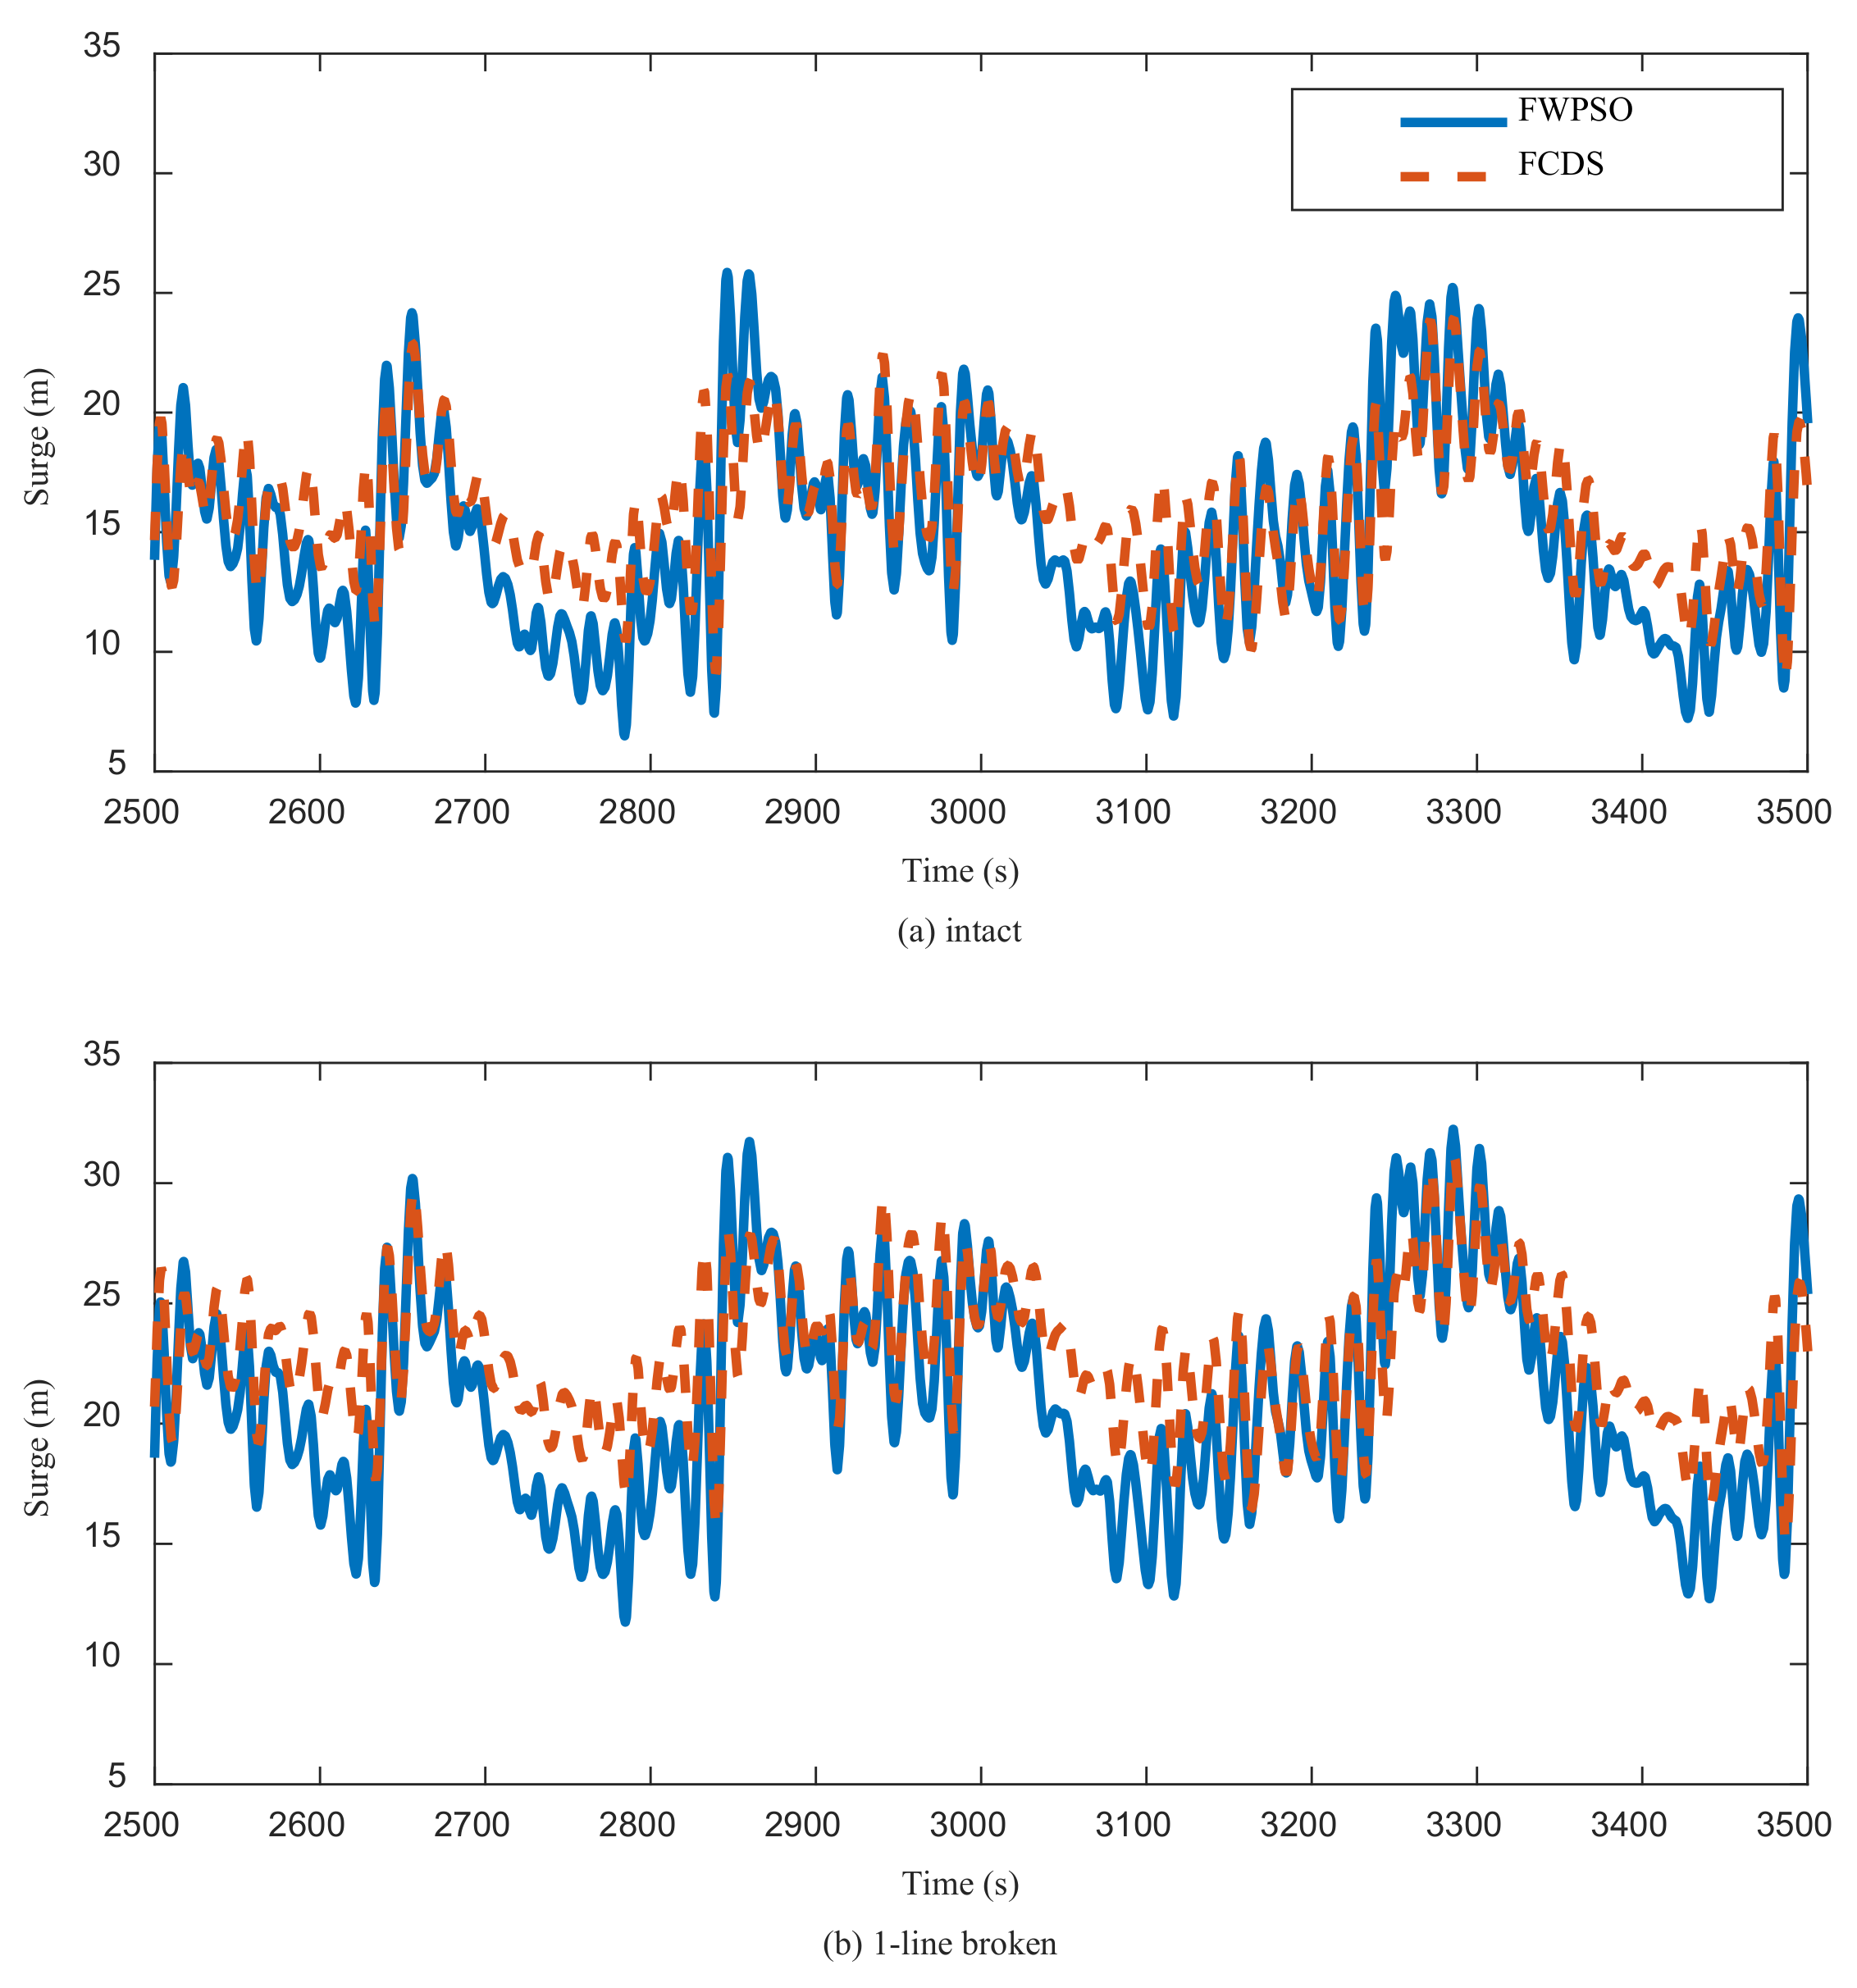
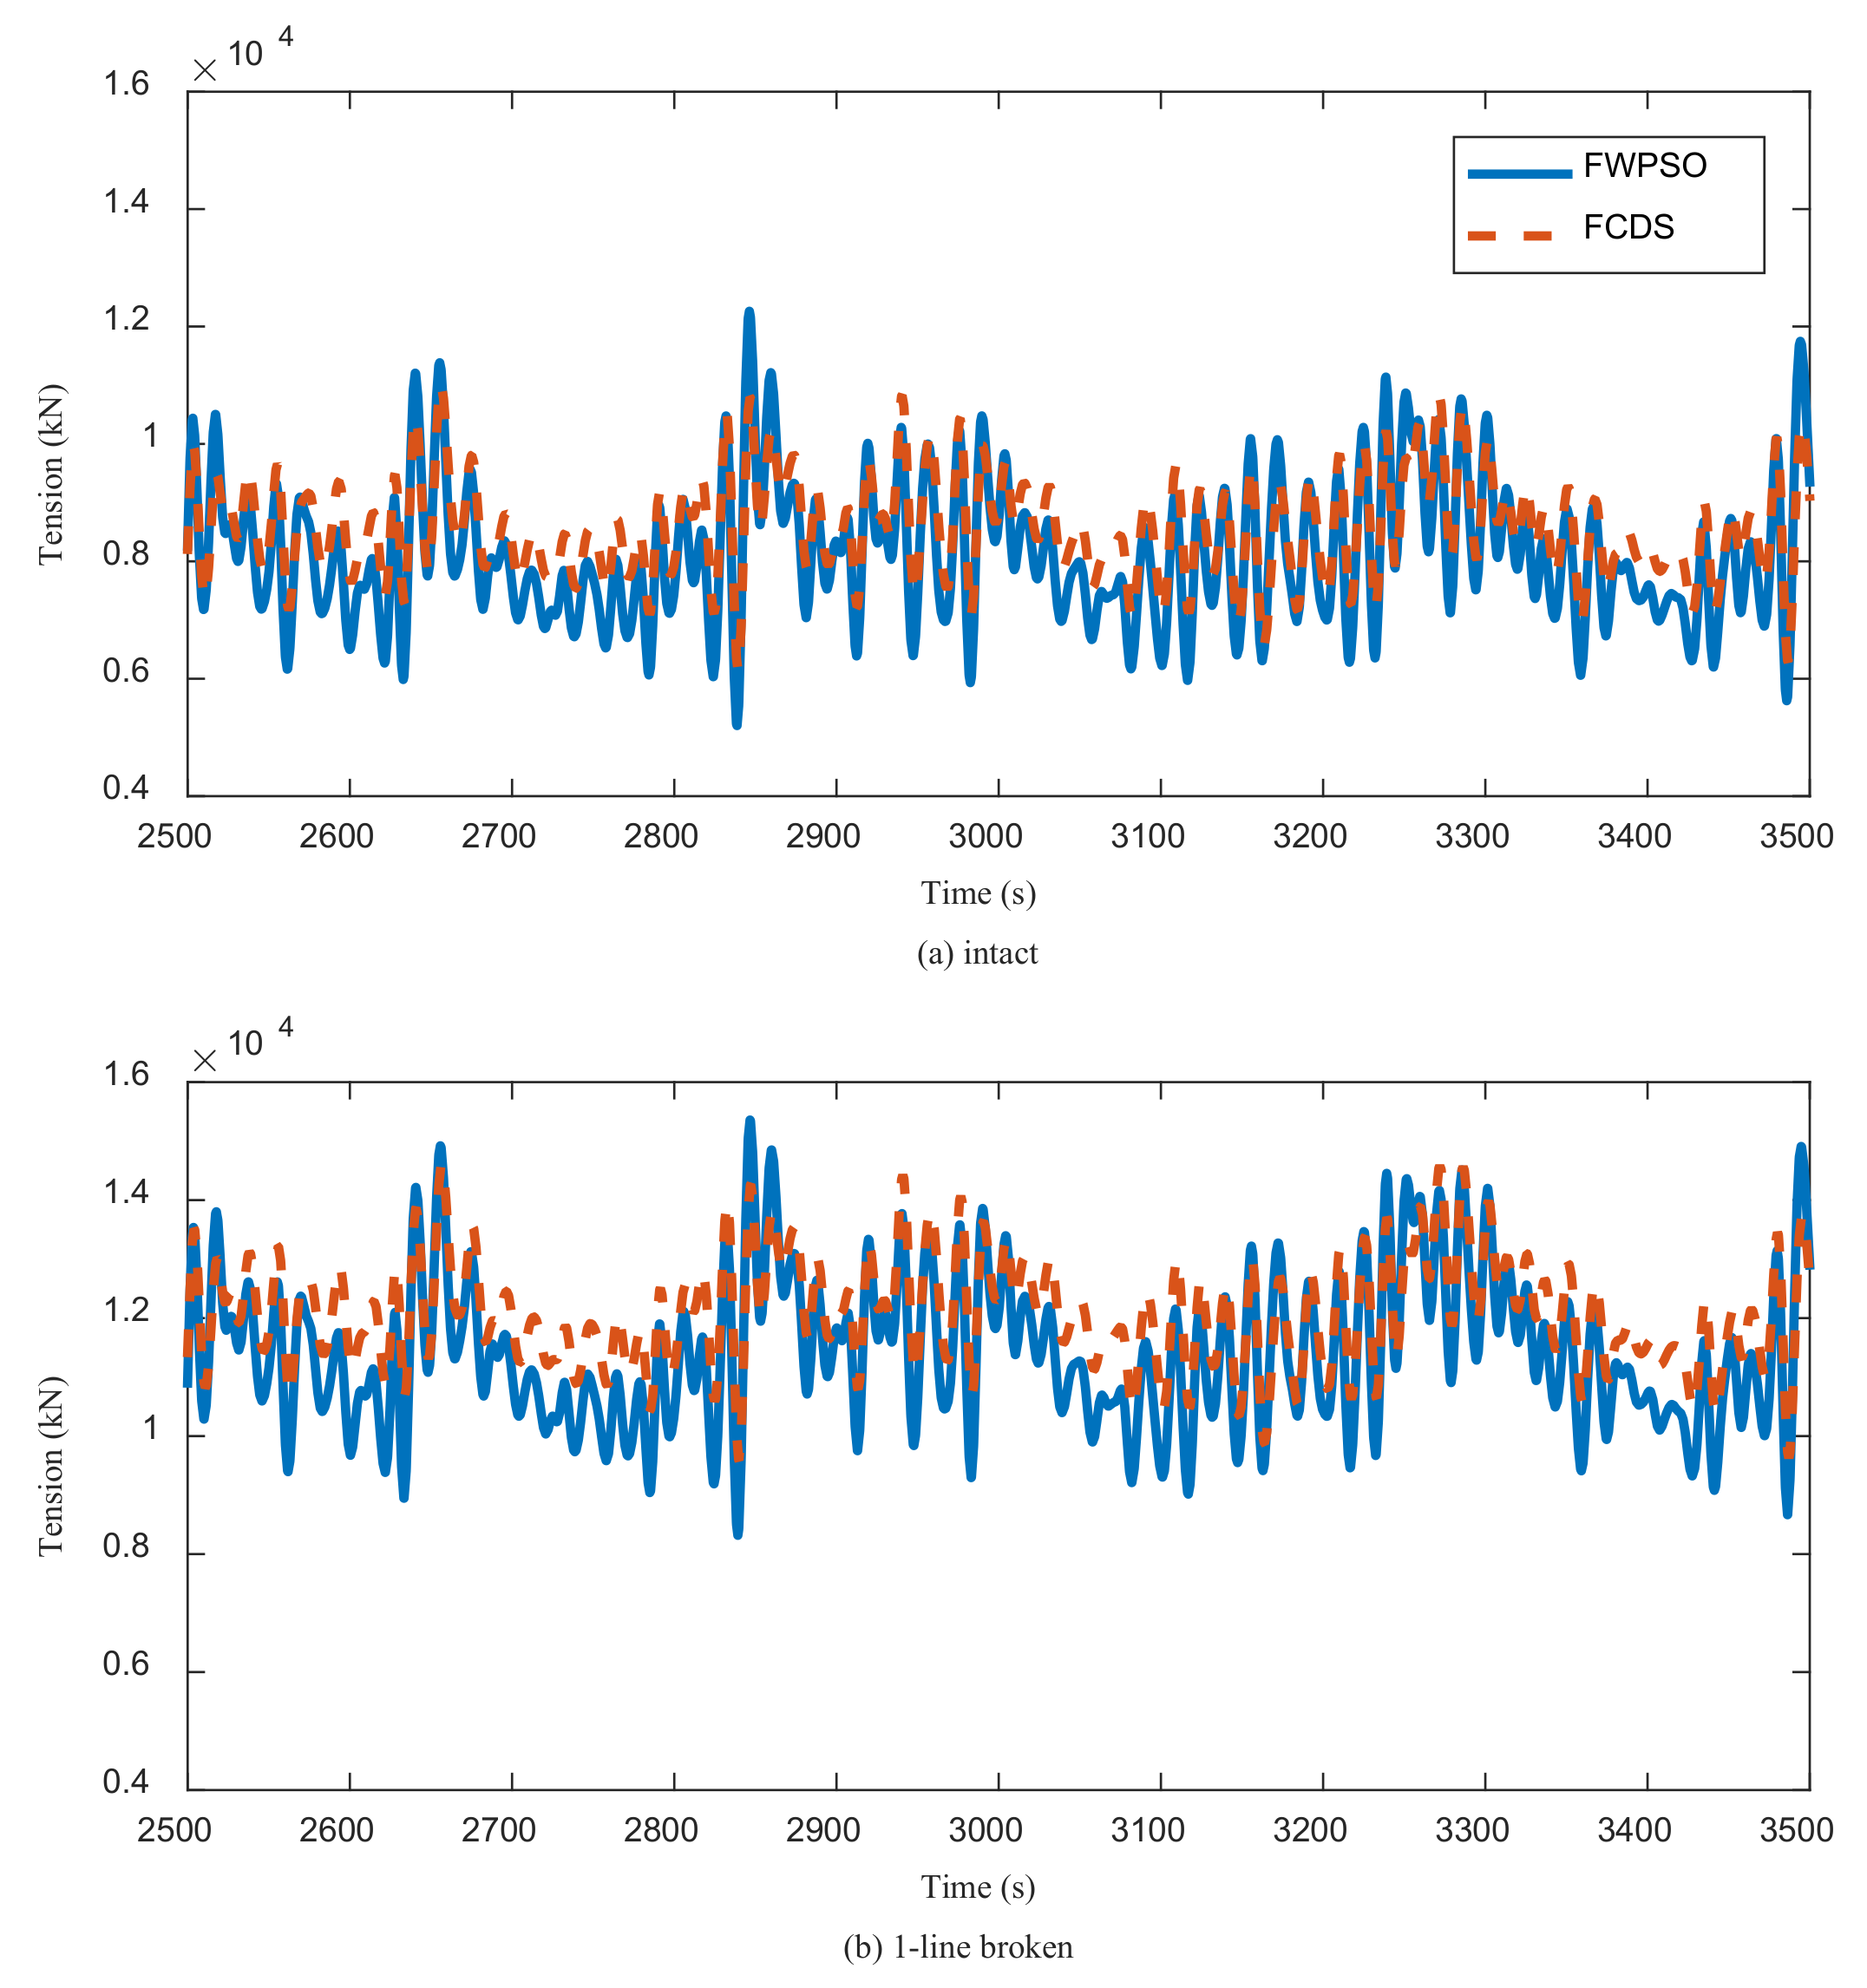
4.3. Dynamic Response between the FCDS and FWPSOs

Similarly, the 3 h simulations under the 100 yr sea scenario were conducted on both an FWPSO and an FCDS with chain-polyester-chain mooring systems. Particularly, both intact and one-line broken cases were chosen to be calculated. For the safety factor, Line #8 was fractured to perform the simulations of the one-line fracture case because it is along the incident wind and wave direction, and its failure will induce the largest drift motion. The statistic results are summarized in Table 6 after the start-up effect faded.
Figure 12 shows the time histories of the heave motion under both the intact mooring system and the one-line broken case. After comparing the heave amplitudes of the FWPSO and FCDS, we can see that the heave motion can be diminished by 49.2% after adding the AMS. This outstanding heave performance provides a strong potential to install the dry-well facility. On the other hand, after comparing the time histories among the results in Figure 12a,b, we see that the mooring failure has little influence on the heave motion. According to the statistic results in Table 5, both the average and maximum heave motion are almost the same between the intact case and the one-line failure case. It can be inferred that this fact is contributed to by the redundant mooring lines.
On the other hand, according to the statistic results in Table 6, we also found that both the average and max surge motion of the FCDS is lower than those of the FWPSO. These results show the good hydrodynamic performance of the FCDS. This phenomenon can also be found in the time histories in Figure 13a. Due to the AMS contribution, the motion was reduced. The results of the one-line broken case are displayed in Figure 13b. Unlike the heave motion, the surge motion obviously drifted far away from the original equilibrium position because of the mooring loss.
The mooring tensions under the intact system are displayed in Figure 14a and those under the broken system are displayed in Figure 14b. The maximum mooring tensions are concluded in Table 5. It can be found that the maximum mooring tensions of the FCDS are 1.13 × 10⁴ kN (intact case) and 1.49 × 10⁴ kN (broken case). Based on this result, we see that the mooring systems of both platforms meet the safety requirements, but the FCDS has lower maximum tensions than the FWPSO. In other words, although the large dimension of the FCDS increases the environmental loads, the mooring tension is still much lower than the similar dimensional cylindrical FPSO due to less horizontal motion.

5. Conclusions and Discussion

Because of the resource shortage, it is necessary to optimize present offshore platforms or propose new structures to develop offshore oil and gas, especially in the marginal oil fields. Until now, the most critical issue with using dry-well facilities on cylindrical FPSOs was to reduce the maximum horizontal and heave motions. In this work, we proposed a new-type FCDS platform by adding an AMS on it based on the original design of FWPSOs.
According to the hydrodynamic analysis, we can see that the additional AMS can effectively improve the FCDS motion, especially the heave motion. The added mass is increased by the novel structure, and the natural period of the heave motion is about eight seconds longer than the significant wave period in the South China Sea. Based on the 100 yr sea scenario, the catenary mooring system and the ‘chain-polyester-chain’ mooring system were adopted to position the FCDS, and time-domain platform-mooring coupled analysis was conducted under the survival sea state. According to the results, however, the horizontal motion could hardly meet the requirements of TTRs and dry-well facilities when the catenary mooring system was adopted. On the other hand, the results of the ‘chain-polyester-chain’ mooring system showed that the max heave was about 3 m, and the farthest drift motion was 21.75 m. This makes the dry well available on cylindrical floating storage platforms.
Fortunately, with the help of longer natural periods, the increased damping, and the ‘chain-polyester-chain’ mooring system, the extreme heave amplitude and horizontal drift motion meet the requirements of the TTR compensator, which means that oil field development costs can be decreased. We hereby believe that the novel AMSs can be a possible solution to improve the poor heave motion performance of cylindrical FPSOs. Although this is an initial investigation on the offshore O&G development platform, it may have a boarder usage for other floaters. Specifically, most buoy motion controllers are based on the active controlling strategy, such as ballast water-tuned dampers on floating offshore wind turbines [34] or fin stabilizers on vessels [35], etc. Their effectiveness is validated, but the costs are relatively higher, and energy must be provided in order to keep the controlling system working. The corresponding mechanisms are usually much more complex, and the systems are sometimes difficult to design. As AMSs are proven to be able to improve the hydrodynamic performance of cylindrical FPSOs, we suppose this passive motion stabilizer would be a possible solution to keep other types of floating foundations robust and stabile.
To sum up, the method adopted in this study can be used to estimate whether AMSs could effectively improve the hydrodynamic performance of cylindrical FPSOs, and the dynamic response under a 100 yr sea scenario could be calculated through three-dimensional potential theory. However, it must be admitted that the numerical analysis was performed based on the potential theory. Therefore, the viscosity was not included in this work. In our following study, we will conduct model tests and CFD-based simulations to take this effect into account for further investigations. On the other hand, we will adopt the QTF approach to fully investigate the different frequency term of the second-order wave load and especially study its influence on the mooring tension as well as the horizontal motion. Another potential issue is that the quadratic damping performance is also another observation in our previous study based on the CFD model [20] and other publications based on the model tests [36]. It can be derived that this nonlinear term can more significantly improve the hydrodynamic performance of the FCDS. However, this quadratic term of the FCDS model was not validated by the model test. In the following work, we will take this effect into consideration.
Moreover, the study of the FCDS is in progress, and we have formed a cooperative group to further investigate this floating platform. In the following work, an institute in the group will further conduct the 1/60-scaled model test to further validate our numerical prediction and study the FCDS hydrodynamic performance. Once we obtain the experimental results, we will calibrate our numerical models, such as the hydrodynamic performance, nonlinear damping term, etc., with the experiments and make some additional investigations based on the observed phenomena in the wave basin.

Author Contributions

Conceptualization, Y.L. (Yan Li) and Y.T.; methodology, Y.T.; software, Z.Z.; validation, Y.L. (Yaolong Li) and Z.Z.; formal analysis, Y.L. (Yaolong Li) and Z.Z.; investigation, H.L.; resources, Y.L. (Yan Li) and Y.T.; data curation, Y.Z. and Y.H.; writing—original draft preparation, Y.L. (Yan Li), Y.L. (Yaolong Li) and Z.Z.; writing—review and editing, Y.L. (Yan Li); visualization, Y.L. (Yan Li); supervision, Y.T.; project administration, Y.L. (Yan Li); funding acquisition, Y.L. (Yan Li). All authors have read and agreed to the published version of the manuscript.

Funding

This study was supported by the Ministry of Industry and Information Technology of China, the Project funded by National Science Foundation of China (No.52001230), State Key Laboratory of Ocean Engineering of Shanghai Jiaotong University (No. GKZD010081), Natural Science Foundation of Tianjin (No. 21JCQNJC00330). Their support is greatly appreciated.

Institutional Review Board Statement

Not applicable.

Informed Consent Statement

Not applicable.

Data Availability Statement

The data presented in this study are available in this article (tables and figures).

Acknowledgments

The authors would also like to give their sincere acknowledgements to Zhirong Wu for his guidance of this study.

Conflicts of Interest

The authors declare no conflict of interest.

References

  1. Yacovitch, T.I.; Daube, C.; Herndon, S.C. Methane emissions from offshore oil and gas platforms in the Gulf of Mexico. Environ. Sci. Technol. 2020, 54, 3530–3538. [Google Scholar] [CrossRef] [PubMed]
  2. Kaiser, M.J. Offshore oil and gas records circa 2020. Ships Offshore Struct. 2020, 17, 205–241. [Google Scholar] [CrossRef]
  3. Lee, J.; Kim, B.C.; Ruy, W.S.; Han, I.S. Parametric optimization of FPSO hull dimensions for Brazil field using sophisticated stability and hydrodynamic calculations. Int. J. Nav. Archit. Ocean. Eng. 2021, 13, 478–492. [Google Scholar] [CrossRef]
  4. Dong, Q.; Guo, X.; Li, X.; Lu, W.; Yang, J. Coupled dynamics between a turret-moored FPSO and a semi-submersible accommodation platform. Ocean. Eng. 2021, 229, 108764. [Google Scholar] [CrossRef]
  5. Guan, G.; Yang, Q. Automatic size optimization of FPSO turret area with application of point set based outer shell FE modeling. Ocean. Eng. 2021, 234, 108761. [Google Scholar] [CrossRef]
  6. Yu, F.; Xu, X. A short-term load forecasting model of natural gas based on optimized genetic algorithm and improved BP neural network. Appl. Energy 2014, 134, 102–113. [Google Scholar] [CrossRef]
  7. Wu, L.; Yang, Y.; Maheshwari, M.; Li, N. Parameter optimization for FPSO design using an improved FOA and IFOA-BP neural network. Ocean. Eng. 2019, 175, 50–61. [Google Scholar] [CrossRef]
  8. Amin, I.; Dai, D.; Day, S.; Oterkus, S.; Oterkus, E. Experimental investigation on the influence of interceptor plate on the motion performance of a cylindrical FPSO. Ocean. Eng. 2021, 243, 110339. [Google Scholar] [CrossRef]
  9. Ji, X.; Li, Y.; Tang, Y.; Tong, B. Viscous damping effect and vortex shedding performance of the novel anti-motion structures on a cylindrical FPSO. Ocean. Eng. 2019, 190, 106430. [Google Scholar] [CrossRef]
  10. Zhao, Z.; Li, Y.; Tang, Y.; Ji, X. Conceptual design and numerical analysis of a novel platform for marginal oilfields development. Ocean. Eng. 2019, 187, 106145. [Google Scholar] [CrossRef]
  11. Wang, W.H.; Wang, L.L.; Du, Y.Z.; Yao, Y.X.; Huang, Y. Numerical and experimental analysis on motion performance of new sandglass-type floating body in waves. Mar. Struct. 2016, 46, 56–77. [Google Scholar] [CrossRef]
  12. Wang, T.Y.; Zhang, J.; Liu, J.K. Concept design of a new Non-Ship-Shaped FPSO. In Applied Mechanics and Materials; Trans Tech Publications Ltd.: Wollerau, Switzerland, 2012; Volume 170, pp. 2222–2227. [Google Scholar]
  13. Gu, J.Y.; Xie, Y.L.; Zhang, P.; Chen, Y.; Huang, X.H.; Tao, Y.W. Experimental study on hydrodynamic performance of a new type of deep draft multi-column FDPSO. J. Mar. Sci. Technol. 2017, 25, 329–342. [Google Scholar]
  14. Gu, J.Y.; Xie, Y.L.; Zhao, Y.; Li, W.J.; Tao, Y.W.; Huang, X.H. Study on vortex-induced motions of a new type of deep draft multi-columns FDPSO. China Ocean. Eng. 2018, 32, 1–13. [Google Scholar] [CrossRef]
  15. Wang, W.H.; Ran, X.M.; Zhao, Z.H.; Huang, Y. Comparative analysis on various components of heave damping for sandglass-type floating body. Ocean. Eng. 2021, 221, 108555. [Google Scholar] [CrossRef]
  16. Wang, T.Y.; Yang, L.J.; Xu, Z.G.; Liu, J.K. Design and comparison of catenary and taut mooring systems for new concept FPSO IQFP in shallow waters. In Applied Mechanics and Materials; Trans Tech Publications Ltd.: Wollerau, Switzerland, 2013; Volume 353, pp. 2670–2675. [Google Scholar]
  17. Li, J.; Liu, S.; Zhao, M.; Teng, B. Experimental investigation of the hydrodynamic characteristics of heave plates using forced oscillation. Ocean. Eng. 2013, 66, 82–91. [Google Scholar] [CrossRef]
  18. Yu, C.; Hu, Z.; Wang, S. Investigation of heave response of the deep water octagonal FDPSO using various heave plate configurations. J. Mar. Sci. Appl. 2017, 16, 446–457. [Google Scholar] [CrossRef] [Green Version]
  19. Pinguet, R.; Benoit, M.; Molin, B.; Rezende, F. CFD analysis of added mass, damping and induced flow of isolated and cylinder-mounted heave plates at various submergence depths using an overset mesh method. J. Fluids Struct. 2022, 109, 103442. [Google Scholar] [CrossRef]
  20. Ji, X.; Li, Y.; Tang, Y.; Zhu, Q.; Hu, Z. Damping performance of annular anti-motion structures on a cylindrical floating drilling production storage and offloading system. Ocean. Eng. 2019, 192, 106590. [Google Scholar] [CrossRef]
  21. Yuan, H.; Tang, Y.; Li, Y.; Qu, Z. Experimental study on the damping performance of a new-type FDPSO with anti-motion structure. Ship Sci. Technol. 2023, in press. [Google Scholar]
  22. Zhang, J.; Li, Y.; Tang, Y.; Qu, X.; Huang, J. Analysis on dynamic response of new type reduced draft floating foundation wind turbine. Acta Energ. Sol. Sin. 2021, 42, 378–383. (In Chinese) [Google Scholar]
  23. Journée, J.M.J.; Massie, W.W. Offshore Hydromechanics; Delft University of Technology: Delft, The Netherlands, 2001. [Google Scholar]
  24. Li, Y.; Zhu, Q.; Liu, L.; Tang, Y. Transient response of a SPAR-type floating offshore wind turbine with fractured mooring lines. Renew. Energy 2018, 122, 576–588. [Google Scholar] [CrossRef]
  25. Qu, X.; Li, Y.; Tang, Y.; Hu, Z.; Zhang, P.; Yin, T. Dynamic response of spar-type floating offshore wind turbine in freak wave considering the wave-current interaction effect. Appl. Ocean. Res. 2020, 100, 102178. [Google Scholar] [CrossRef]
  26. Tong, B.; Ji, X.; Wang, H.; Tang, Y. Study on damping performances of damping structure of cylindrical FPSO. Ocean. Eng. 2018, 36, 22–29. (In Chinese) [Google Scholar]
  27. Liu, B. Adaptability analysis of cylindrical FWPSO under environmental conditions in the South China Sea. China Offshore Oil Gas 2019, 31, 154–158. (In Chinese) [Google Scholar]
  28. Li, G.; Li, D.; Wang, C.; Yi, C.; Jia, L. Research on Motion Response Characteristics of Cylindrical FPSO in Waves. Ship Boat 2022, 30, 22–28. (In Chinese) [Google Scholar]
  29. Det Norske Veritas. Environmental Conditions and Environmental Loads; Det Norske Veritas: Bærum, Norway, 2017. [Google Scholar]
  30. Bosma, B.; Lewis, T.; Brekken, T.; Von Jouanne, A. Wave Tank Testing and Model Validation of an Autonomous Wave Energy Converter. Energies 2015, 8, 8857–8872. [Google Scholar] [CrossRef]
  31. Ji, R.; Sheng, Q.; Wang, S.; Zhang, Y.; Zhang, X.; Zhang, L. Array Characteristics of Oscillating-Buoy Two-Floating-Body Wave-Energy Converter. J. Mar. Sci. Appl. 2019, 18, 325–333. [Google Scholar] [CrossRef]
  32. Chu, B.; Zhang, X. On the natural frequencies and modal shapes in two-dimensional moonpools with recesses in finite water depth. Appl. Ocean. Res. 2021, 115, 102787. [Google Scholar] [CrossRef]
  33. Feng, L. Usage of Polyester Rope in Deep water Mooring System. Ocean. Eng. Equip. Technol. 2016, 3, 315–319. (In Chinese) [Google Scholar]
  34. Xue, M.A.; Dou, P.; Zheng, J.; Lin, P.; Yuan, X. Pitch motion reduction of semisubmersible floating offshore wind turbine substructure using a tuned liquid multicolumn damper. Mar. Struct. 2022, 84, 103237. [Google Scholar] [CrossRef]
  35. Liang, L.; Cheng, Q.; Cai, P. Design of fin stabilizer controller during ship zig-zag motion. Ocean. Eng. 2022, 252, 111049. [Google Scholar] [CrossRef]
  36. Bai, X.; Song, C.; Zhang, J.; Lu, W.; Li, X. Effect of Damping Characteristics of Floating Platform on Motion response. Ship Eng. 2022, 44, 597–602. (In Chinese) [Google Scholar]
Figure 1. FWPSO.
Figure 1. FWPSO.
Jmse 11 00218 g001
Figure 2. FCDS with an AMS.
Jmse 11 00218 g002
Figure 3. FCDS with a closed AMS.
Jmse 11 00218 g003
Figure 4. Panel models of the FCDS and FWPSO.
Jmse 11 00218 g004
Figure 5. Added mass of the heave and pitch.
Jmse 11 00218 g005
Figure 6. First-order wave load transfer functions of the heave and pitch.
Jmse 11 00218 g006
Figure 7. Second-order wave load transfer functions of surge.
Jmse 11 00218 g007
Figure 8. RAOs of the heave and pitch.
Jmse 11 00218 g008
Figure 9. Configuration of the mooring system.
Jmse 11 00218 g009
Figure 10. Time histories of the free-decay simulations.
Jmse 11 00218 g010
Figure 11. Time histories of FCDS motion and mooring tension with different mooring systems.
Jmse 11 00218 g011
Figure 12. Time histories of the FCDS and FWPSO heave motion under both mooring line statuses.
Jmse 11 00218 g012
Figure 13. Time histories of the FCDS and FWPSO surge motion under both mooring line statuses.
Jmse 11 00218 g013
Figure 14. Time histories of the FCDS and FWPSO mooring tension under both mooring line statuses.
Jmse 11 00218 g014
Table 1. Main dimensions of the FWPSO and FCDS.
ParametersFWPSOFCDS FCDS with a Closed AMS
Diameter/m70.070.070.0
Moonpool diameter/m12–1812–1812–18
Moonpool height/m335353
Displacement/kg8.62 × 1078.17 × 1071.93 × 108
Oil Storage (Full Case)/kg4.2 × 1074.2 × 1074.2 × 107
Total draft (Buoyancy Providing)/m19.0 (19.0)40.0 (19.0)40.0 (40.0)
Outer diameter of anti-motion structure/m96.096.096.0
Height of extensional body/m-21.021.0
Height of damping structure/m6.5/2.510.010.0
Diameter of hole/m-1.0-
Gap between damping structure
and main body/m
01.01.0
Height of COG from baseline/m22.022.022.0
Radius of inertia roll/m27.627.627.6
Radius of inertia pitch/m27.627.627.6
Radius of inertia yaw/m30.430.430.4
Metacentric height3.424.274.25
Table 2. Natural frequencies based on the RAOs (rad/s).
FWPSOFCDSFCDS with a Closed AMS
Heave0.40.270.31
Pitch0.150.180.11
Table 3. Parameters of the mooring line [29].
Chain-OnlyChain-Polyester-Chain
SegmentChainLower ChainPolyesterUpper Chain
Diameter/mm172172286172
Mass in air/kg•m−158958957.4589
Mass in water/kg•m−151251214.7512
MBL/kN24,51324,51323,54424,513
EA/kN2.53 × 1062.53 × 1066.43 × 1052.53 × 106
Length/m963100165075
Clump/kg16 × 5000---
Table 4. Natural frequencies based on the free-decay simulations (rad/s).
Mooring TypeChain OnlyChain-Poly-Chain
Surge0.02460.0263
Heave0.270.27
Pitch0.180.18
Table 5. Environmental parameters of 100 yr sea scenario [29].
ParameterValue
Wave SpectrumJONSWAP
Significant wave height13.7 m
Peakedness period15.5 s
Peakedness factor3.3
Wind speed42.9 m/s
Current Speed2.12 m/s
Table 6. Statistic results of buoy motion and mooring tension.
Surge Max/mSurge Mean/mHeave Max/mHeave Mean/mTension Max/kNTension Mean/kN
FCDS
intact
21.7516.253.010.001.13 × 1048.54 × 103
FWPSO
intact
29.2615.556.090.001.26 × 1048.20 × 103
FCDS
1line broken
28.5723.003.010.011.49 × 1041.11 × 104
FWPSO
1line broken
36.2721.976.110.011.61 × 1041.06 × 104
Disclaimer/Publisher’s Note: The statements, opinions and data contained in all publications are solely those of the individual author(s) and contributor(s) and not of MDPI and/or the editor(s). MDPI and/or the editor(s) disclaim responsibility for any injury to people or property resulting from any ideas, methods, instructions or products referred to in the content.

