Article

Analysis of the Sabellaria spinulosa Bioconstruction Growth in a Laboratory

1
Department of Earth and Geoenvironmental Sciences, Campus Universitario, University of Bari Aldo Moro, 70125 Bari, Italy
2
Department of Biosciences, Biotechnologies and Environment, University of Bari Aldo Moro, 70125 Bari, Italy
*
Author to whom correspondence should be addressed.
J. Mar. Sci. Eng. 2023, 11(1), 204; https://doi.org/10.3390/jmse11010204
Submission received: 13 December 2022 / Revised: 22 December 2022 / Accepted: 9 January 2023 / Published: 12 January 2023
(This article belongs to the Section Marine Environmental Science)

Abstract

:
Sabellaria spinulosa (Leukhart, 1849) is a suspension feeding polychaeta that lives in tubes consisting of terrigenous particles captured by the worm itself. They form impressive reefs containing millions of worm tubes. In temperate marine areas, under optimal environmental conditions, these structures can become natural breakwaters and can play an active role in sandy beaches’ defense. In this work, we report procedures aimed to analyze the growth of S. spinulosa bioconstructions in laboratory. By collecting biological replicas from a wild reef, this study aimed to identify sedimentological characteristics of sands that induce faster tube growth. During the tank experiments, the grain size and mineralogy of the sand were modified. By employing thin sections and X-ray microtomography analyses, the structures observed and measured during and after the tests were analogous to those naturally formed. The fastest growth was recorded in the presence of bioclastic sands with a grain size between 125 and 350 μm. Defining the physical conditions that induce faster growth is fundamental for the defense of these vulnerable habitats but also the surrounding marine environment. This study also lays the foundations for coastal protection interventions in which bioconstructions grown in the tank could be directly implanted on submerged natural and artificial substrates that are already present in situ.

1. Introduction

Sabellaridae (Annelida, Polychaeta) is a group of sedentary marine worms that includes several genera able to realize large reefs in shallow waters [1]. The genus Sabellaria, for example, includes the species S. alveolata, S. spinulosa, and S. alcocki, which form large and extensive reefs in the Mediterranean Sea. Sabellaria reefs can be usually found in coastal areas from 0 to 20 m of depth in intertidal or subtidal zones, depending on the species [2]. These reefs, monospecific in their structural component, result from the aggregation of tubes made by polychaetes by cementing sand grains and shell fragments through a self-produced polysaccharide bioadhesive [1]. The tube can reach a maximum length of 8 cm and a diameter of 7 mm [3], and the selection of sand grains used for their construction is done on a dimensional, morphological, and mineralogical basis. The sizes of grains seem related to the ages of the polychaetes, and usually, the diameters of the sand increases with the worm’s age [4]. The preferred shape of the grains is elongated and flat [5,6,7,8], while the mineralogical nature of the grains seems irrelevant since Sabellaria spp. can use indifferently siliciclastic or carbonate sands to realize the tubes [8,9,10].
The wide scientific interest in Sabellaria reefs is explained by many biological, ecological, and morpho-sedimentary implications that their occurrence induces in the adjacent shallow-sea environments. Sabellaria reefs significantly increase the biodiversity of shallow-sea environments by providing protection and food for many species and individuals [11]. S. spinulosa reefs are protected by Habitats Directive, and although they do not seem directly threatened by large-scale climate changes, they still are affected [12]. Indeed, they are subjected to numerous physical, anthropogenic, and ecological impacts. The worm reefs form irregular and articulate sea bottom morphologies in areas that otherwise would show flat and monotonous sandy or rocky substrates with low biodiversity [13]. Sabellaria reefs carry out multiple ecosystem services that affect human well-being [14]. The occurrence of worm reefs is linked to the availability of sediments, and if the availability of sediments decreases, the reefs cannot grow. Many anthropogenic causes can lead to the loss of large volumes of bioconstruction, such as fishing, trampling [15], or the presence of anthropic works that modify the dynamics of coastal sediments. In addition, the growth of bioconstructions may be stopped or modified due to competition with other taxa [16].
The worm reef can play a crucial role in protecting the coast from erosion by acting as a physical barrier against storm waves [5]; unlike barriers made by other bioconstructors (which secrete calcium carbonate), these barriers are formed by sediments present in the sedimentary environment. Recent models of the growth of Sabellaria bioconstructions show that the structure develops with the alternation of two phases, one of growth and one of decline [16]. These phases can occur at different times of the year but are always closely related to spawning. During the growth phase, bioconstruction traps the sand present in the marine environment, playing a role of temporary storage of sediments. During the decline phase, natural or anthropogenic external agents (e.g., storm waves or trampling) remove fragments of well-cemented and cohesive sands and accumulate them in the adjacent sandy beaches. Therefore, they preserve sand stock availability by providing seasonal sand supply (sands and gravels consisting of reef fragments) for the sedimentary coastal balance [16]. Sabellaria reefs show effective protection of coasts from erosion both growing on natural substrates (rocks and sands, such as Torre Mileto, Adriatic Sea [10]) and artificial substrates (submerged piers, Ostia, Tyrrhenian Sea [17]).
In the Mediterranean Sea, Sabellaria reefs realized by S. alveolata (Linnaeus, 1767), S. spinulosa (Leukhart, 1849), and S. alcocki (Gravier, 1906) show seasonal stages of growth, decline, or stasis that are induced by the interplay of various physical and biological processes [2,14,18]. In the Mediterranean Sea, the occurrence of S. spinulosa was reported for the first time at Torre Mileto in southern Italy [10]; later, numerous reefs were reported [19]. Detailed monitoring programs carried out on the Torre Mileto reef indicated high growth rates; indeed, between two successive decline periods (winter/winter), the mean growth can reach locally 20 cm/y, and values of 15 cm/y seem to be very common [10]. Despite recent scientific interest in this type of bioconstruction, there are no data about the measurements of individual tubes directly in the field, while the rapid and unusual growth of worm reefs has been analyzed by different authors in the laboratory using test tanks to evaluate the role of physical and biological parameters in the development of worm tubes. The metamorphosis from the larval to the juvenile stage of S. vulgaris has been reproduced by [20]; some individuals built isolated tubes using actual sands. More recently, [21] accurately traced the growth of worm tubes of S. spinulosa employing a vortex resuspension tank that continuously mobilized sands, thus inducing a permanent helicoidal flow of air/water and sediment during the experiments (duration 15 days). This model demonstrated how the sedimentation rate deeply influences the growth of worm tubes. Nevertheless, flow velocities (0.007 to 0.07 m/s) were much lower than in situ (0.5 to 1 m/s [22,23]), and the spatial variability of the vortex current was generally high [21]. Similar laboratory procedures were used by [24] to test the persistence of S. spinulosa in water with a high chlorine content (to simulate the pollution of sea water). This paper describes the laboratory procedures and the results of a sequence of modelling test experiments carried out on S. spinulosa reef samples using an analogous approach with a 1:1 scale. This work investigated the growth, for the first time, of Sabellaria tubes by varying sedimentological features of the sands. Under laboratory conditions, the use of natural sands made the tests reproduced in the tank as similar as possible to the natural environment. The test tank model was designed to do the following:
  • reproduce reliable sedimentation mechanism and worm reef growth in the laboratory;
  • directly observe and video-record long-term tests (1 month);
  • overcome the experimental limitations of previous laboratory procedures;
  • evaluate the reef growth rates;
  • establish the relative role of mineralogy, grain size, and particle sand shape for growth/stasis stages of the worm reefs;
  • understand how different types of sand can influence the choices of polychaetes.
The meso- and micro-structures of natural and analogue worm reefs were described and compared using images from HD camera, direct measurements on biological replicas, thin section observation, and X-ray microtomography analysis.
Finally, this analogous model aims to define the best conditions for the growth of sampled small fragments of a worm reef in the laboratory; this will allow future replanting practices in localized sectors where bioconstructions are in a phase of stasis/decline or in new areas where Sabellaria is not present, including artificial breakwater barriers. This possibility would open new horizons to the protection of beaches; the excellent growth rates of Sabellaria worm reefs would allow the complete reconstruction of physical barriers after each winter season using only the sediments present in the adjacent beach environments while also providing part of the sediments to the beach and increasing biodiversity of the considered coastal sector.

2. Materials and Methods

2.1. Sampling Procedures

Fragments of S. spinulosa reef were collected at Torre Mileto (northern Gargano coastal area, southern Italy) in the southern Adriatic Sea (Figure 1). At this site, a stable reef has been monitored since 2012 to observe its evolution, verify its persistence, and define textural characteristics of the trapped sand and the list of associated fauna [10,16,25,26].
The sampling was carried out underwater by collecting portions of the reef with live polychaetes. The samples were collected during seasonal bioconstruction monitoring [16] in areas where the growth was highest, using the same procedures proposed by [10,26]. Samples were transported to the laboratory in containers containing seawater and equipped with battery aerators. In the laboratory, 54 fragments of similar dimensions (approximately 10 cm × 10 cm × 5 cm) were selected and inserted into the breeding chambers. All operations were carried out without exposing the polychaetes to the air to minimize alterations due to manipulation.
In the laboratory experiments, beach sand was collected at three different sites. At each site, approximately 300 g of beach sands was collected at the water/sediment or air/sediment interface in an area of approximately 4 m × 4 m, following standard procedures for present-day marine sediments [27]. At one of the sites, Torre Mileto, sands were sampled in the upper shoreface (at a depth of approximately 2 m) in the soft substrate surrounding the reef. Due to the same composition and similar D50, these sands were used to draw a comparison between growth under natural and laboratory conditions. Other sands were sampled (Figure 1) in the nearshore of Porto Cesareo (Ionian Sea) and Margherita di Savoia (Adriatic Sea) to cover a wide range of composition, color, density, and shape of sand particles. Moreover, these sites are representative of the Apulian coast [28,29] sand variability.

2.2. Laboratory Procedures

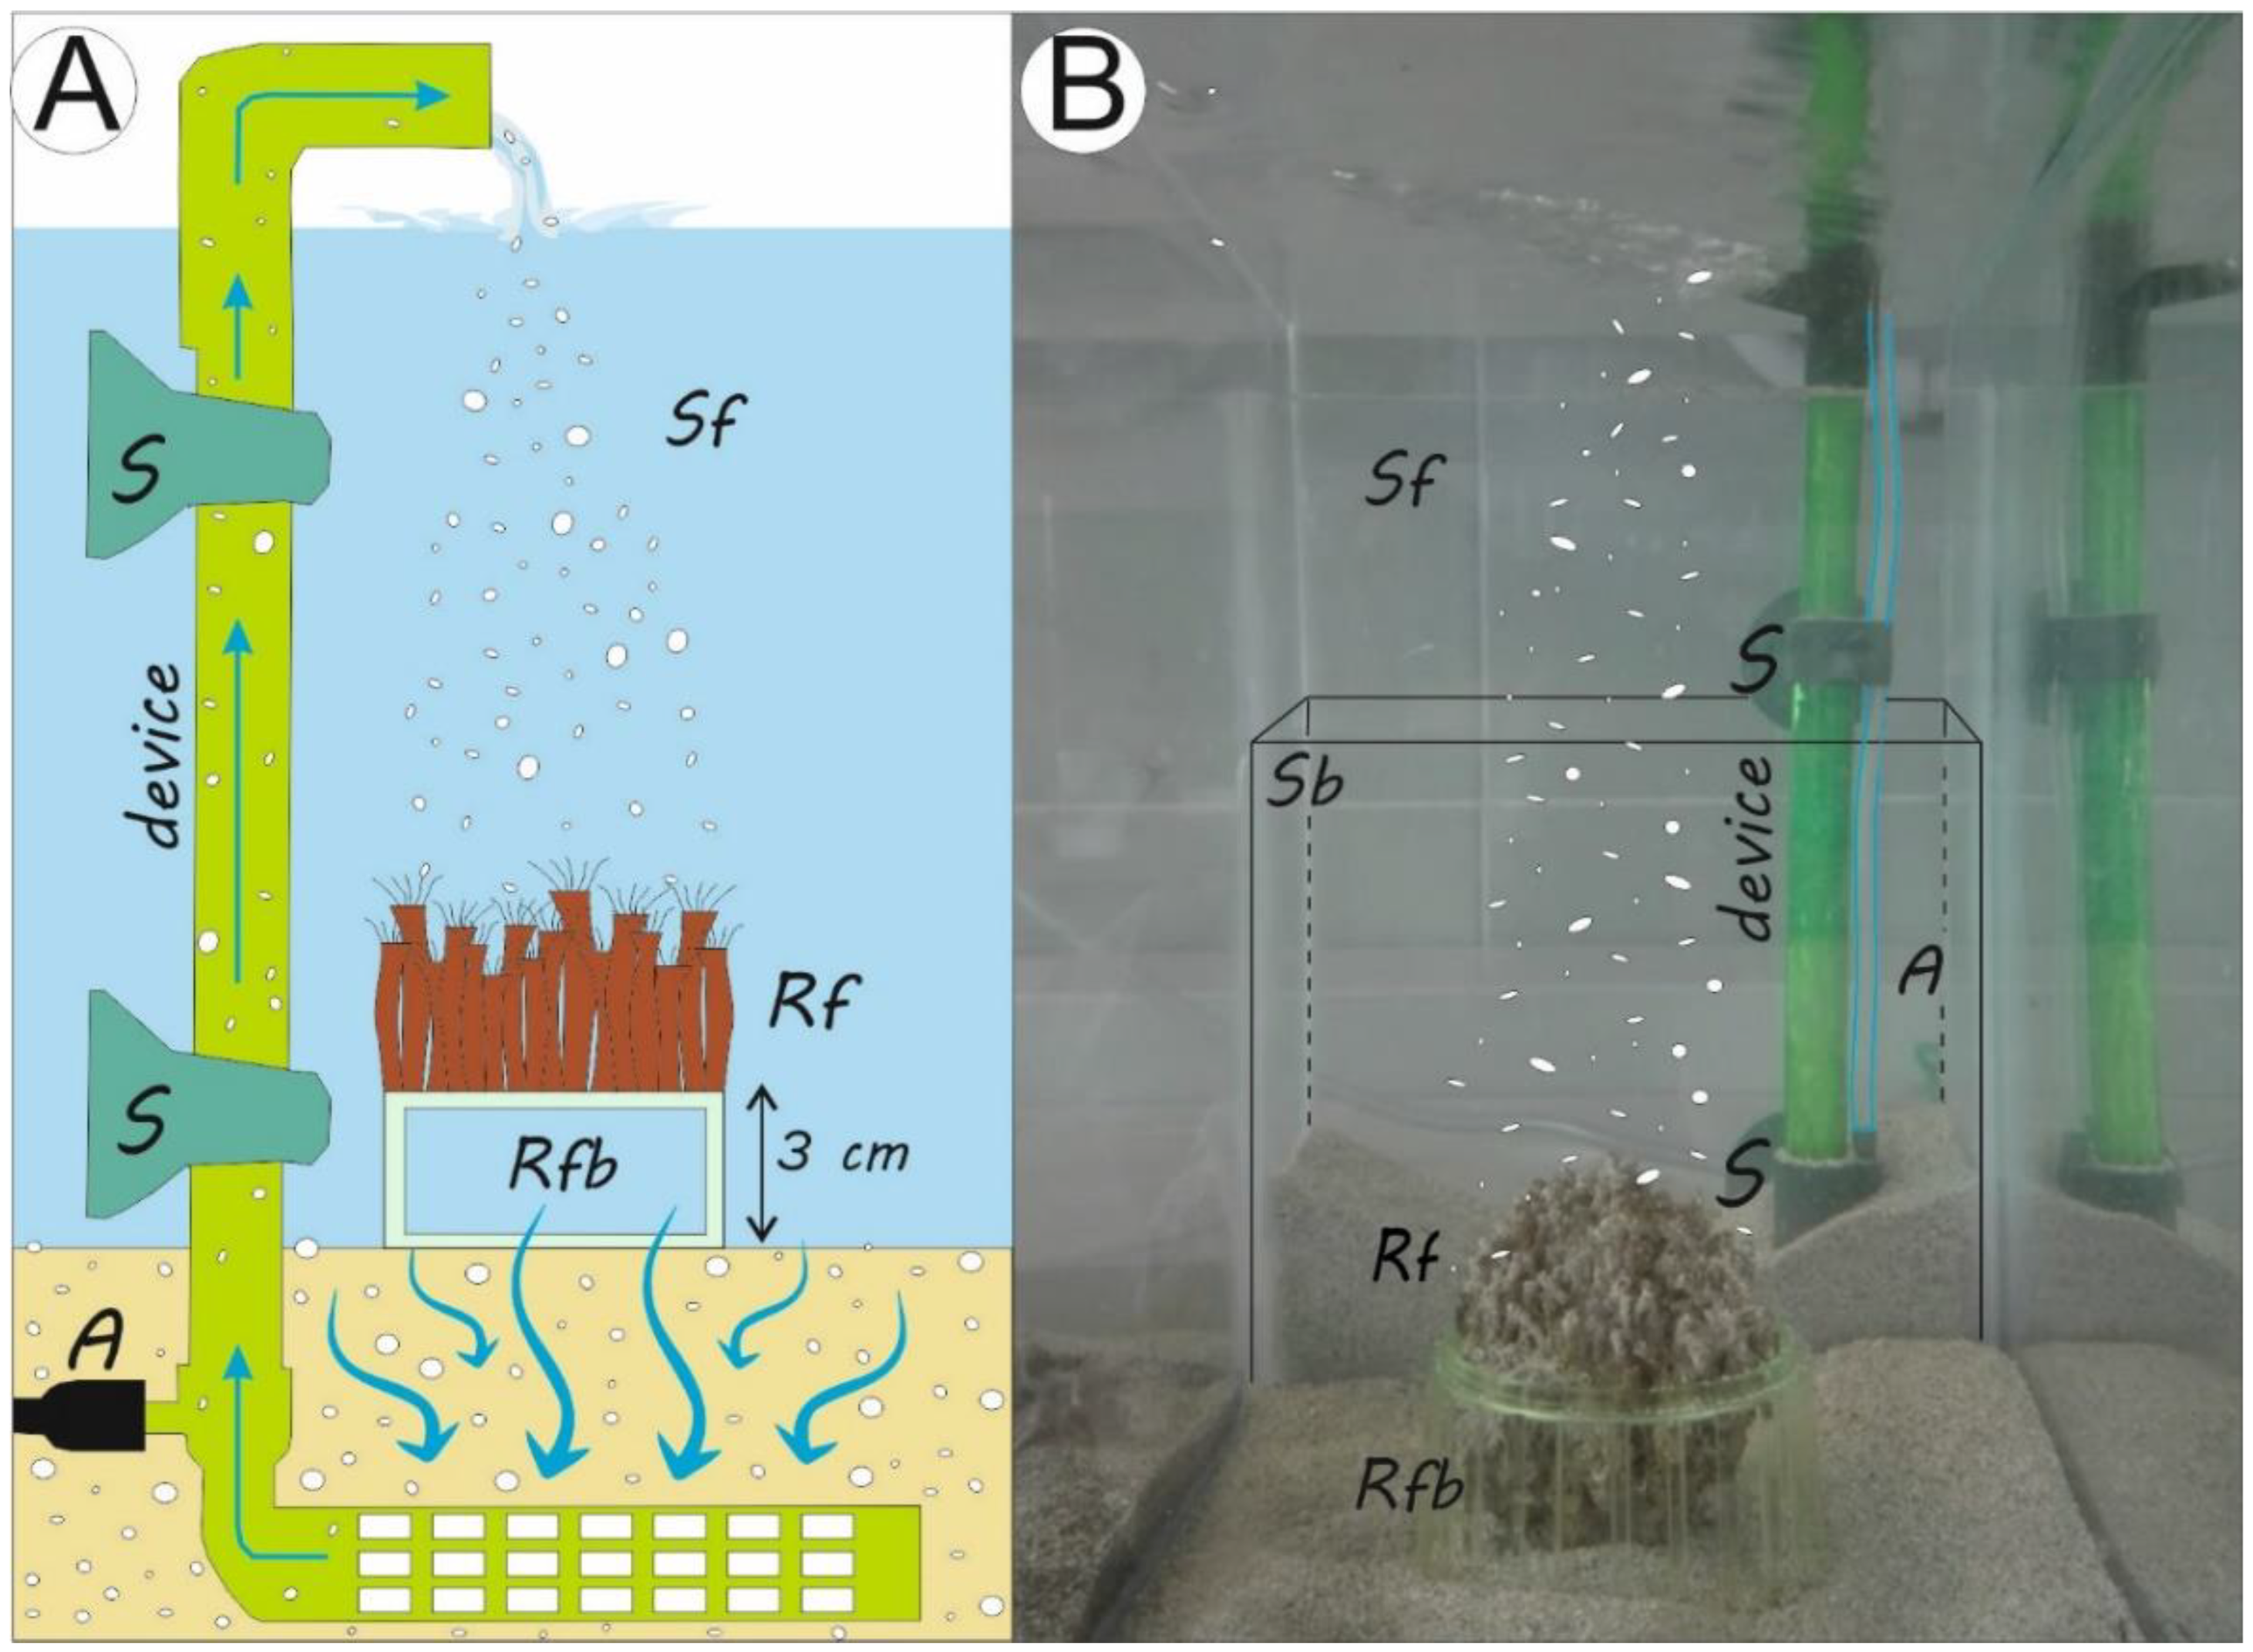
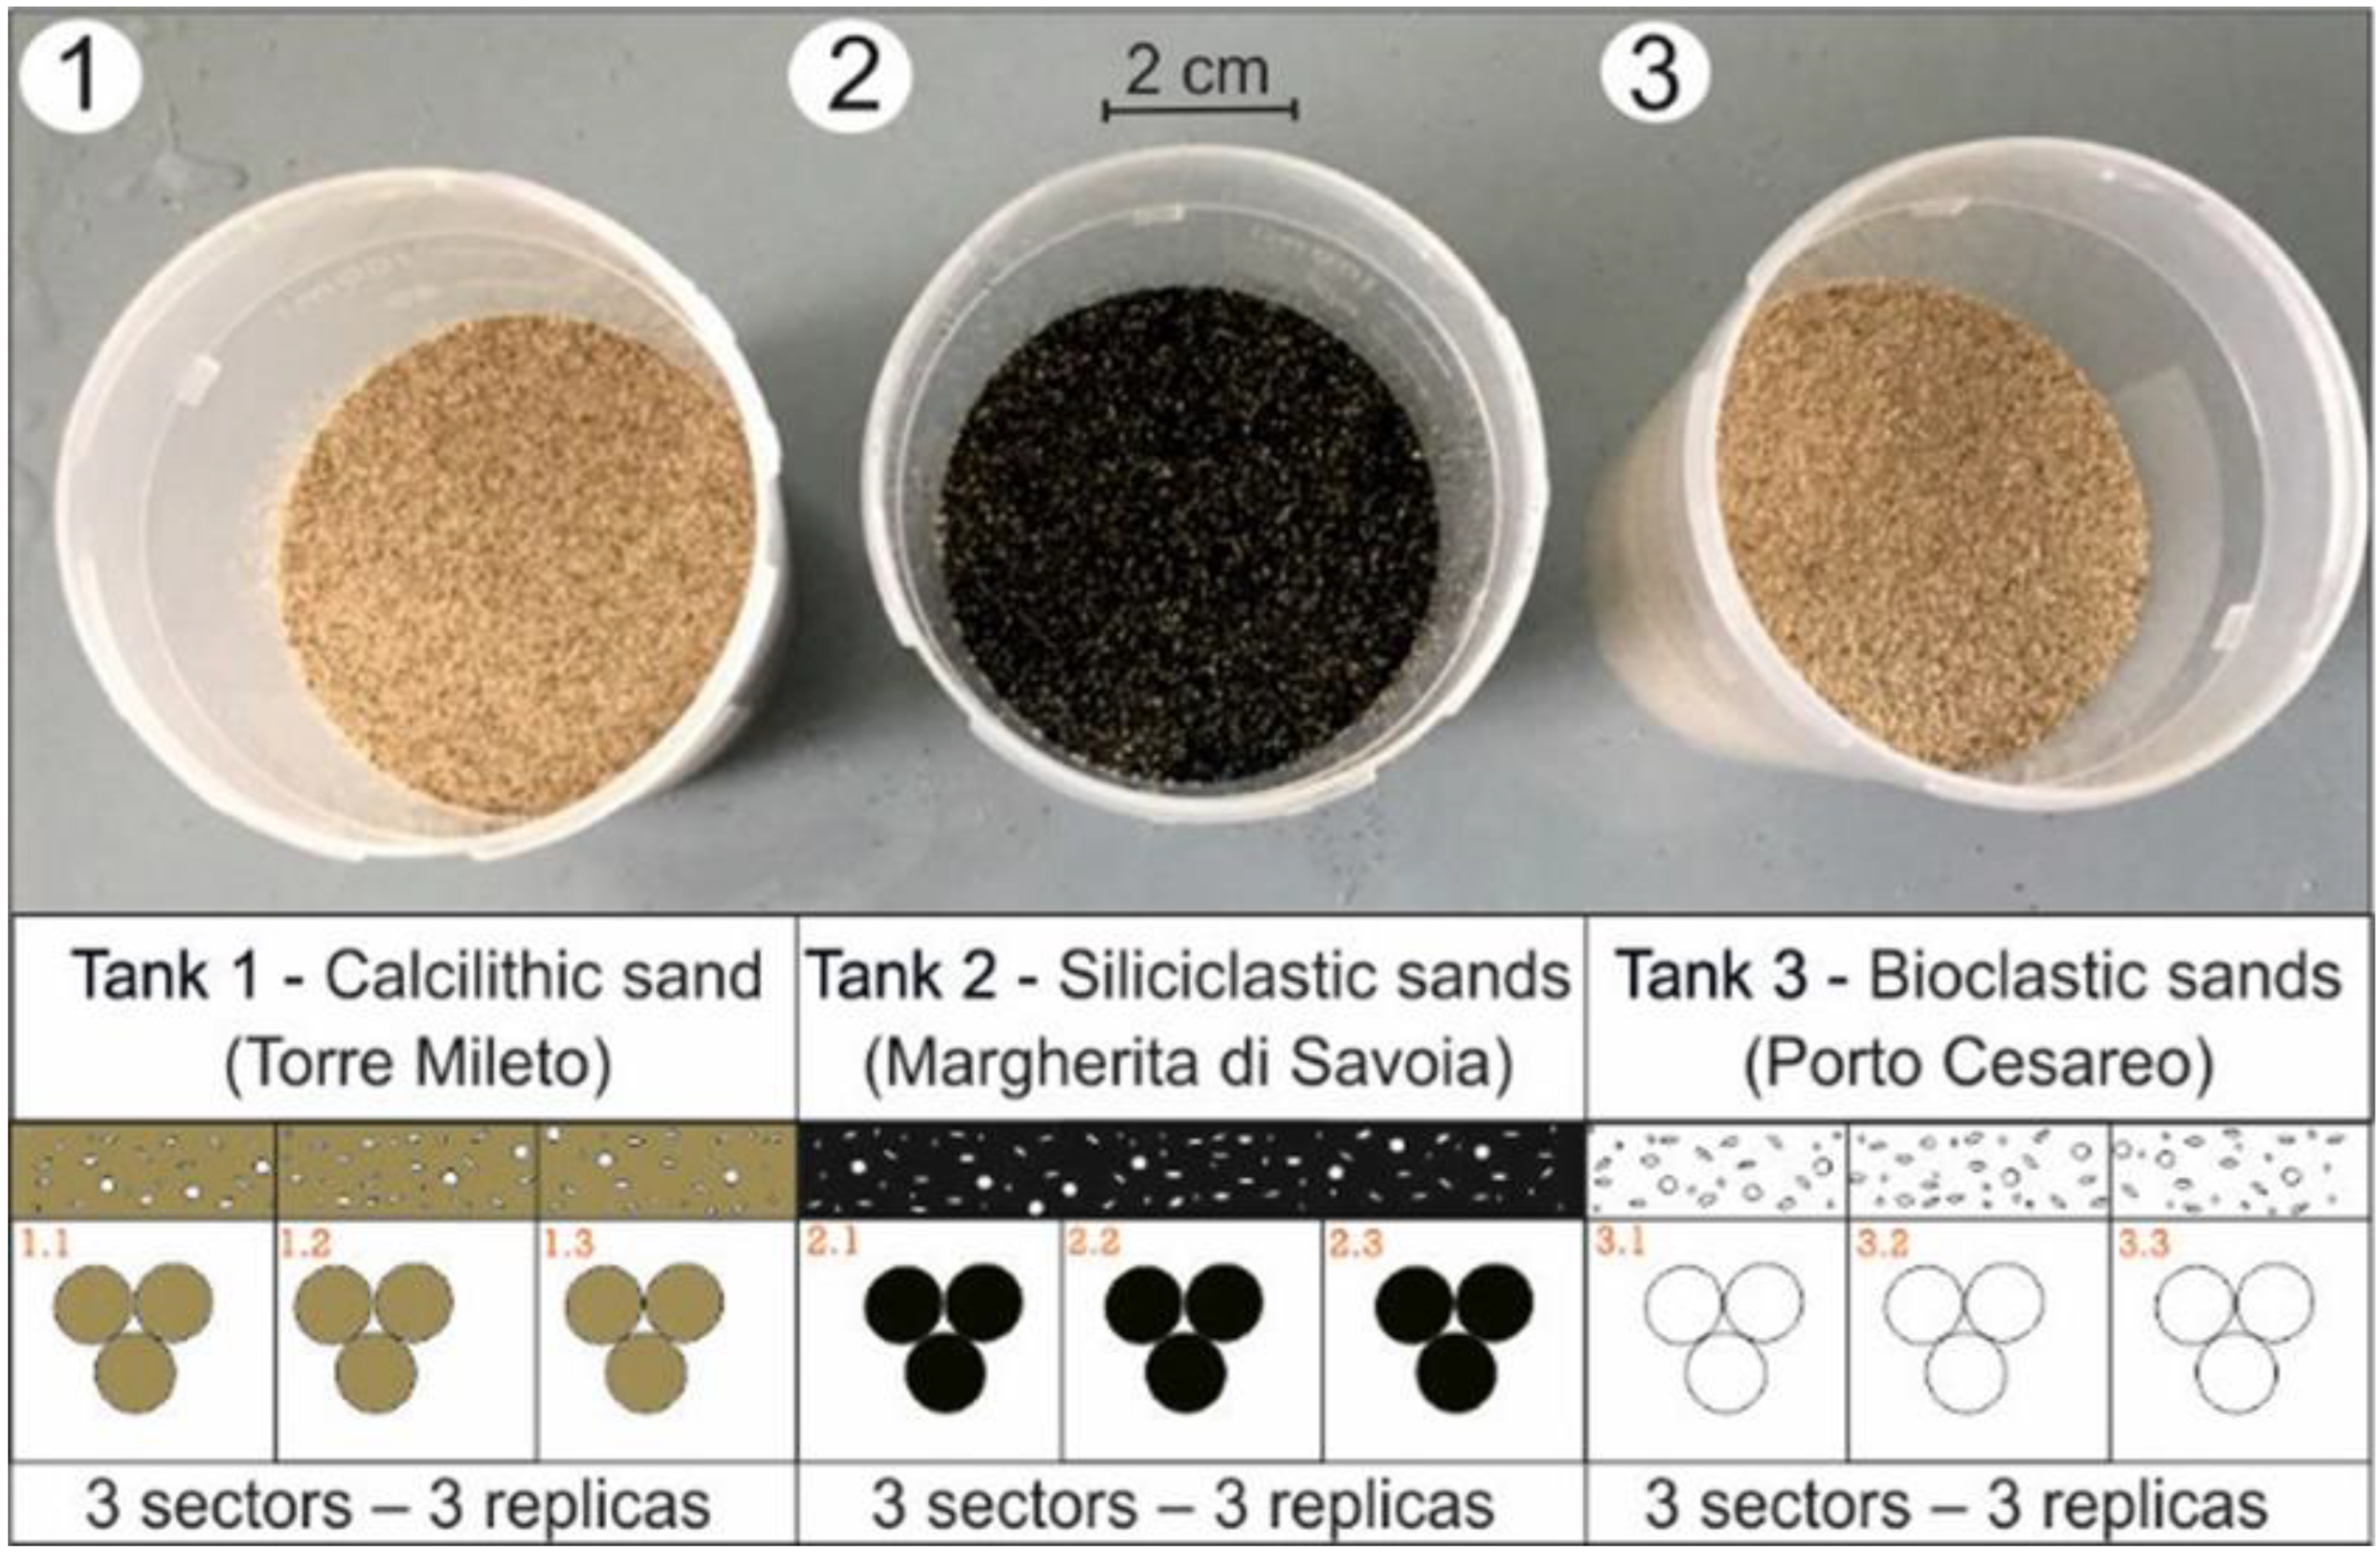
Three aquarium tanks were designed and built (60 cm × 40 cm × 40 cm; 96 L). Each tank was divided into three equal sectors (technical replicas; 32 L); the rear part of each sector contained a sub-compartment filled with sands. Three reef fragments (biological replicas; 10 cm × 5 cm× 5 cm) were placed in each sector’s center using plastic support, thus permitting the rise of samples from the tank bottom to avoid both basal interactions with sands and lateral displacements of the samples. Following this configuration (Figure 2), nine biological replicas were inserted in each tank.
The seawater temperature inside the aquaria was maintained at 21.5 ± 0.5 °C, the salinity was maintained at 35.5 ± 0.5, the pH was maintained at 8.0–8.4, and the photoperiod was adapted to the natural day cycle. Reef fragments were fed simultaneously on two prey species (Nannochloropsis sp. and Artemia salina nauplii) added daily (at 09:00 a.m.) at a single dose (1.8 mL/L).
Starting from the literature-known procedures, the final setup of test procedures and materials was achieved after an eight-month period of attempts to improve the model representativeness. A summary of these attempts is contained in the Supplementary Material.

2.2.1. The Simulation of Sedimentation during Storm Wave Events

S. spinulosa builds reefs in shallow wave-dominated marine environments. To simulate the sedimentation process related to storm wave events, we designed a system that allowed sand suspension; such a system permitted controlled and reproducible suspension in tank sectors. Each sub-compartment containing sands was equipped with a sponge-free aerator filter attached to the glass tank wall. A continuous sand supply was obtained by placing the end of the tube that conveyed the water just above the water level; the lack of an actual physical filter (a sponge) allowed the sand passage. The aerator pressure was increased to exceed the minimum fluidization velocity of the sediments used in the experiment; this velocity varied with grain size and sand density [30]. The duration of flow was fixed at three hours. The flow intensity decreased over time due to the progressive filter occlusion, with the complete occlusion occurring in approximately five hours.

2.2.2. Sand Grain Size and Composition

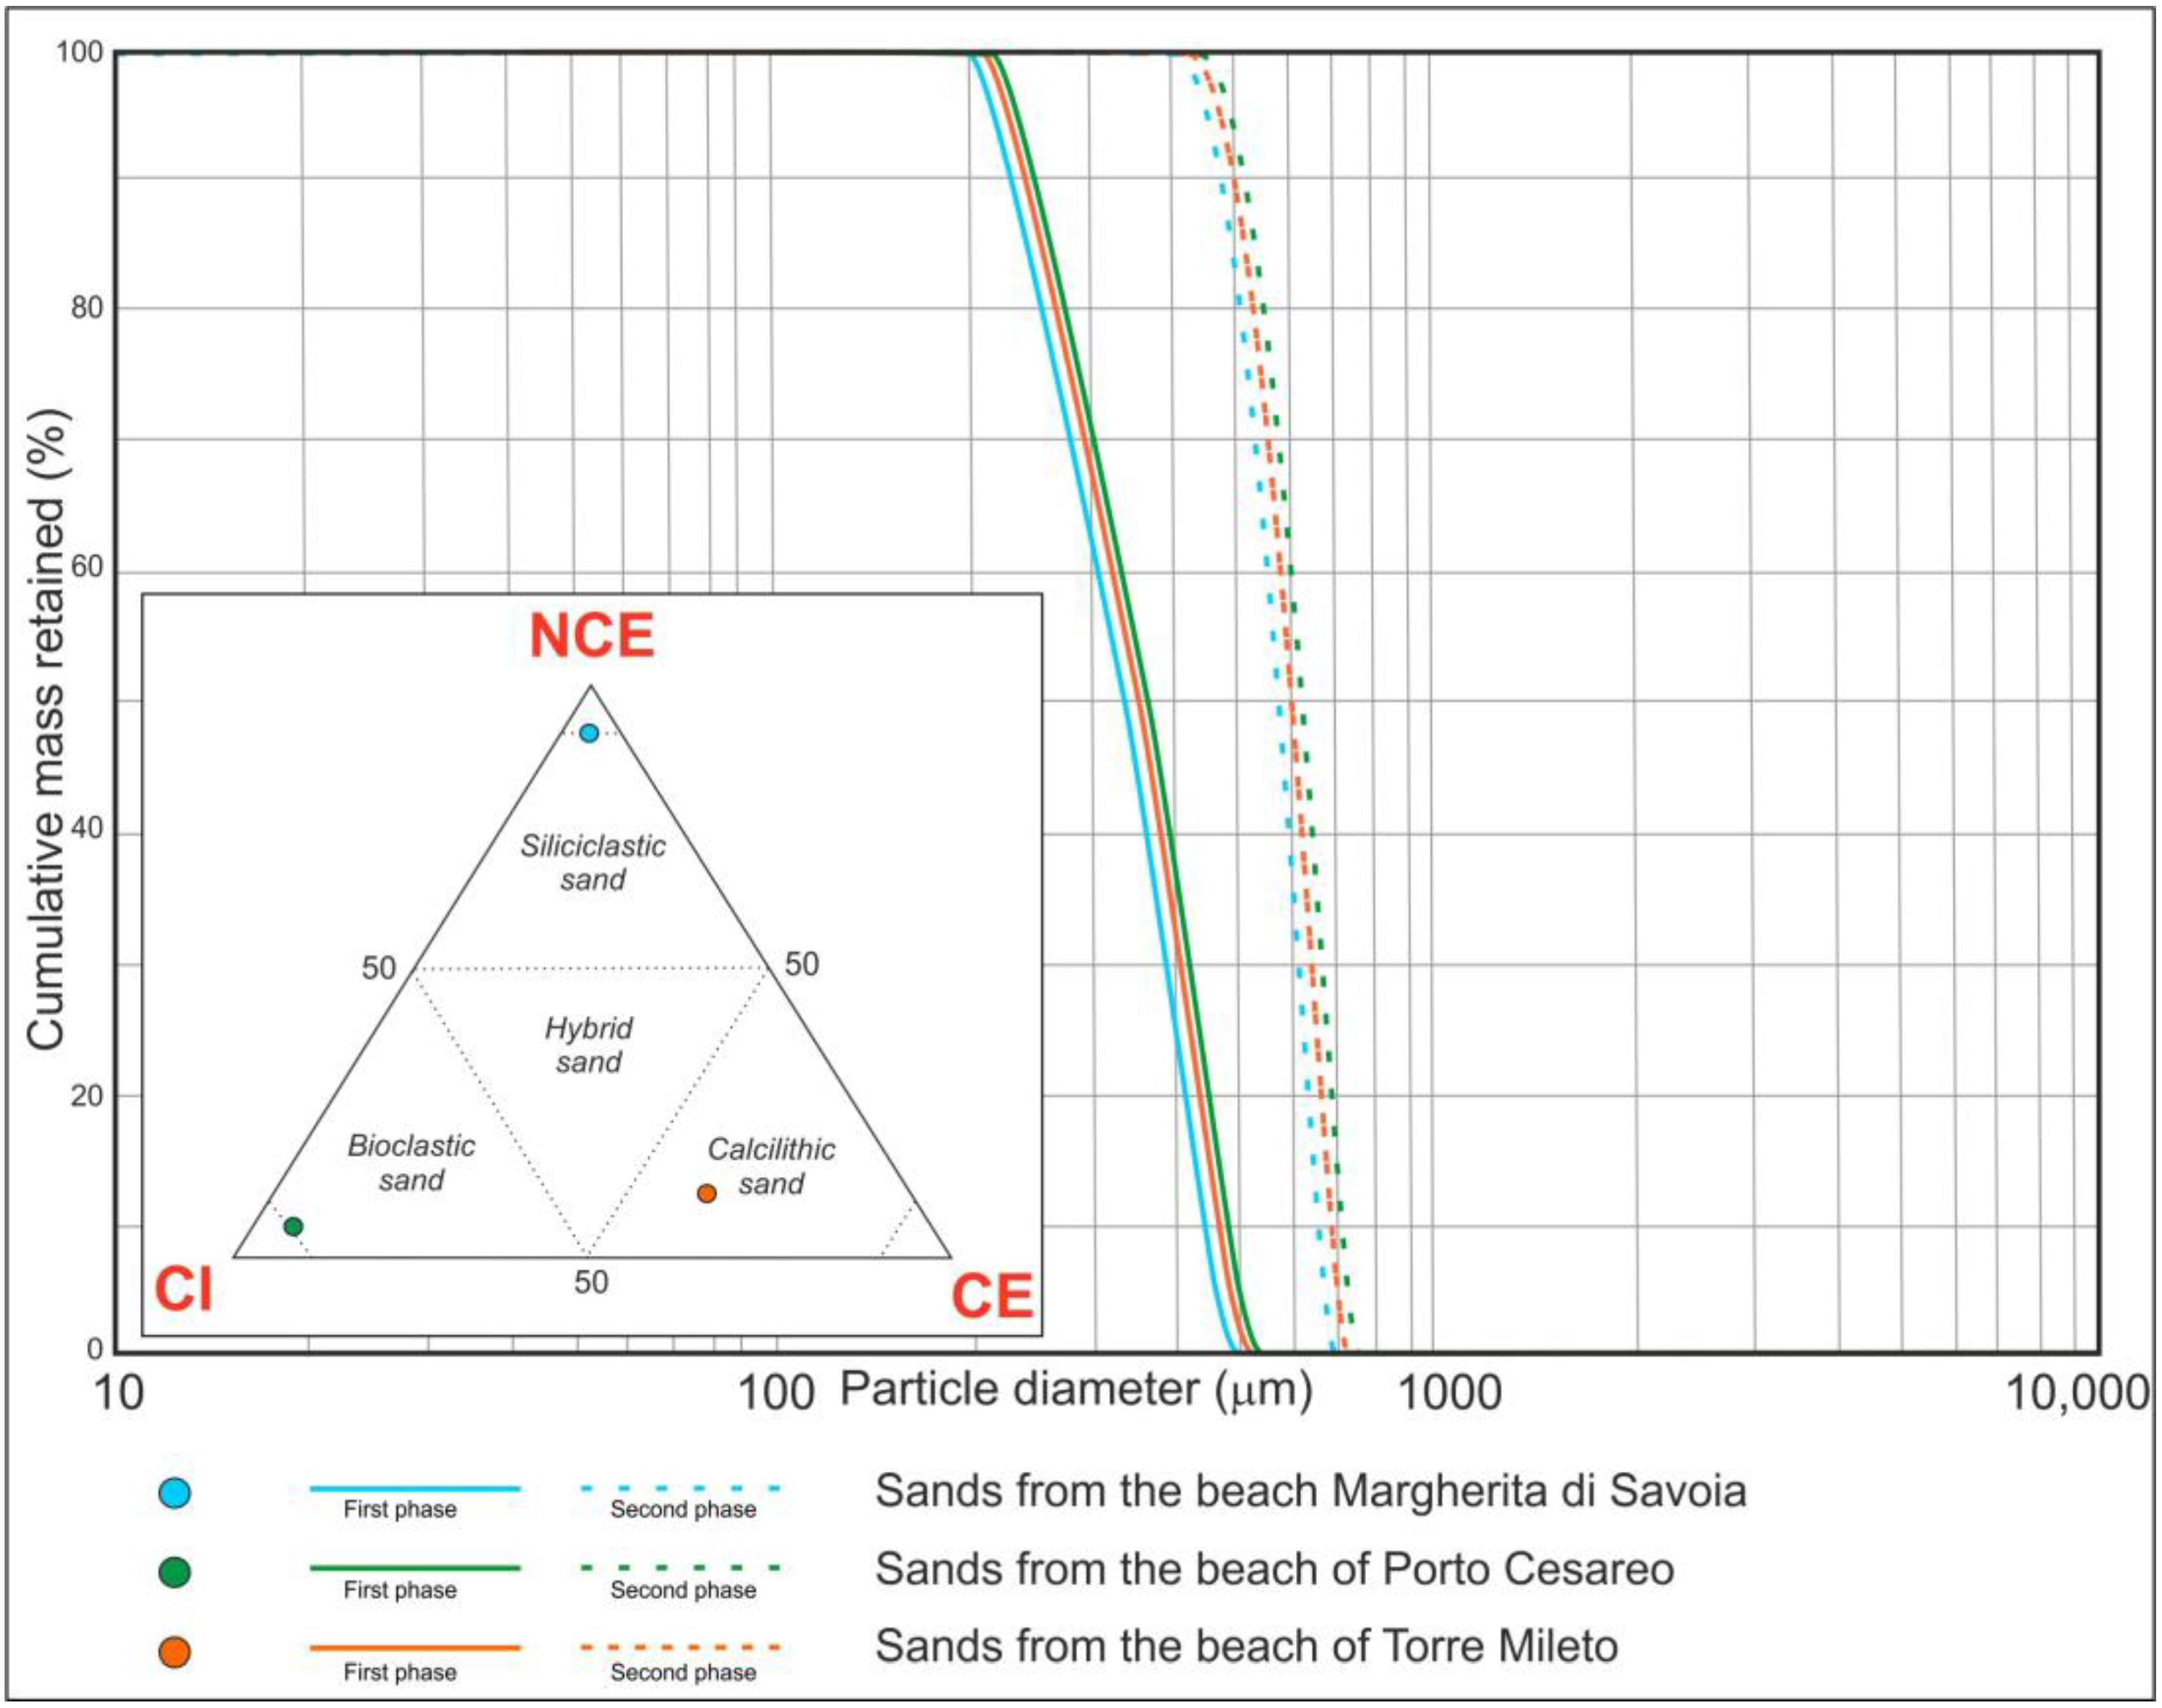
Sands were sieved to separate grain size classes (Figure 3) at ½ ϕ (ϕ = −log2 (d), where d is the particle size in mm). Two granulometric ranges have been chosen: between 125 and 350 μm and a slightly larger grain size, between 350 and 500 μm. The first interval included sediments coinciding with the average particle size captured by Sabellaria spinulosa under natural conditions (as reported in [10]). The second range was selected in analogy with the experiments of [22], which used a slightly coarser grain size (mean diameter of 328 μm) compared with that naturally captured along the Atlantic coast of Scotland. Furthermore, these dimensions are indicated as the range of sediments selected by S. spinulosa in other areas of the Adriatic Sea (up to 600 μm [31]).
The mineralogical characteristics of selected sands were different among aquaria. A modal petrographic analysis was performed to quantitatively evaluate the composition of these sands (Figure 3). They fell in fields far from each other and represented compositional end-members of the sands in shallow marine environments. The sediments of Torre Mileto were calcilithic sands (sensu [32,33]) and represented the sediment that S. spinulosa captures to build the reef under natural conditions. These sands were composed of carbonate lithoclasts, bioclastic carbonate, quartz, and other components with negligible percentages (feldspar, pyroxene, amphibole, opaque mineral, etc.). The black sands of Margherita di Savoia were siliciclastic sands, formed by magnetite and silicate minerals (pyroxenes, garnets, amphiboles, and quartz). The clear sands of Porto Cesareo were bioclastic sands, mainly composed of fragmented shells of mollusks, foraminifers, spines and exoskeleton plates of echinoids, bryozoans, and red branched algae.

2.2.3. A Two-Phase Modelling Experiment

Before the two-phase experiment, a test study was performed to evaluate adequate conditions for the worm growth. During the latter, tank 1 contained sands from Torre Mileto (Figure 4), and tank 2 contained black sands rich in magnetite from Margherita di Savoia (Figure 4), while tank 3 contained white bioclastic sands collected at Porto Cesareo (Figure 4). The salinity, temperature, and nutrient content, as well as the general sedimentation conditions in the individual tanks, were kept constant during the test period and successively replicated in the two-phase experiment; each phase lasted one month because of a slight vitality decay of the worms after this period.

2.3. Procedures for Measuring the Growth of Tubes

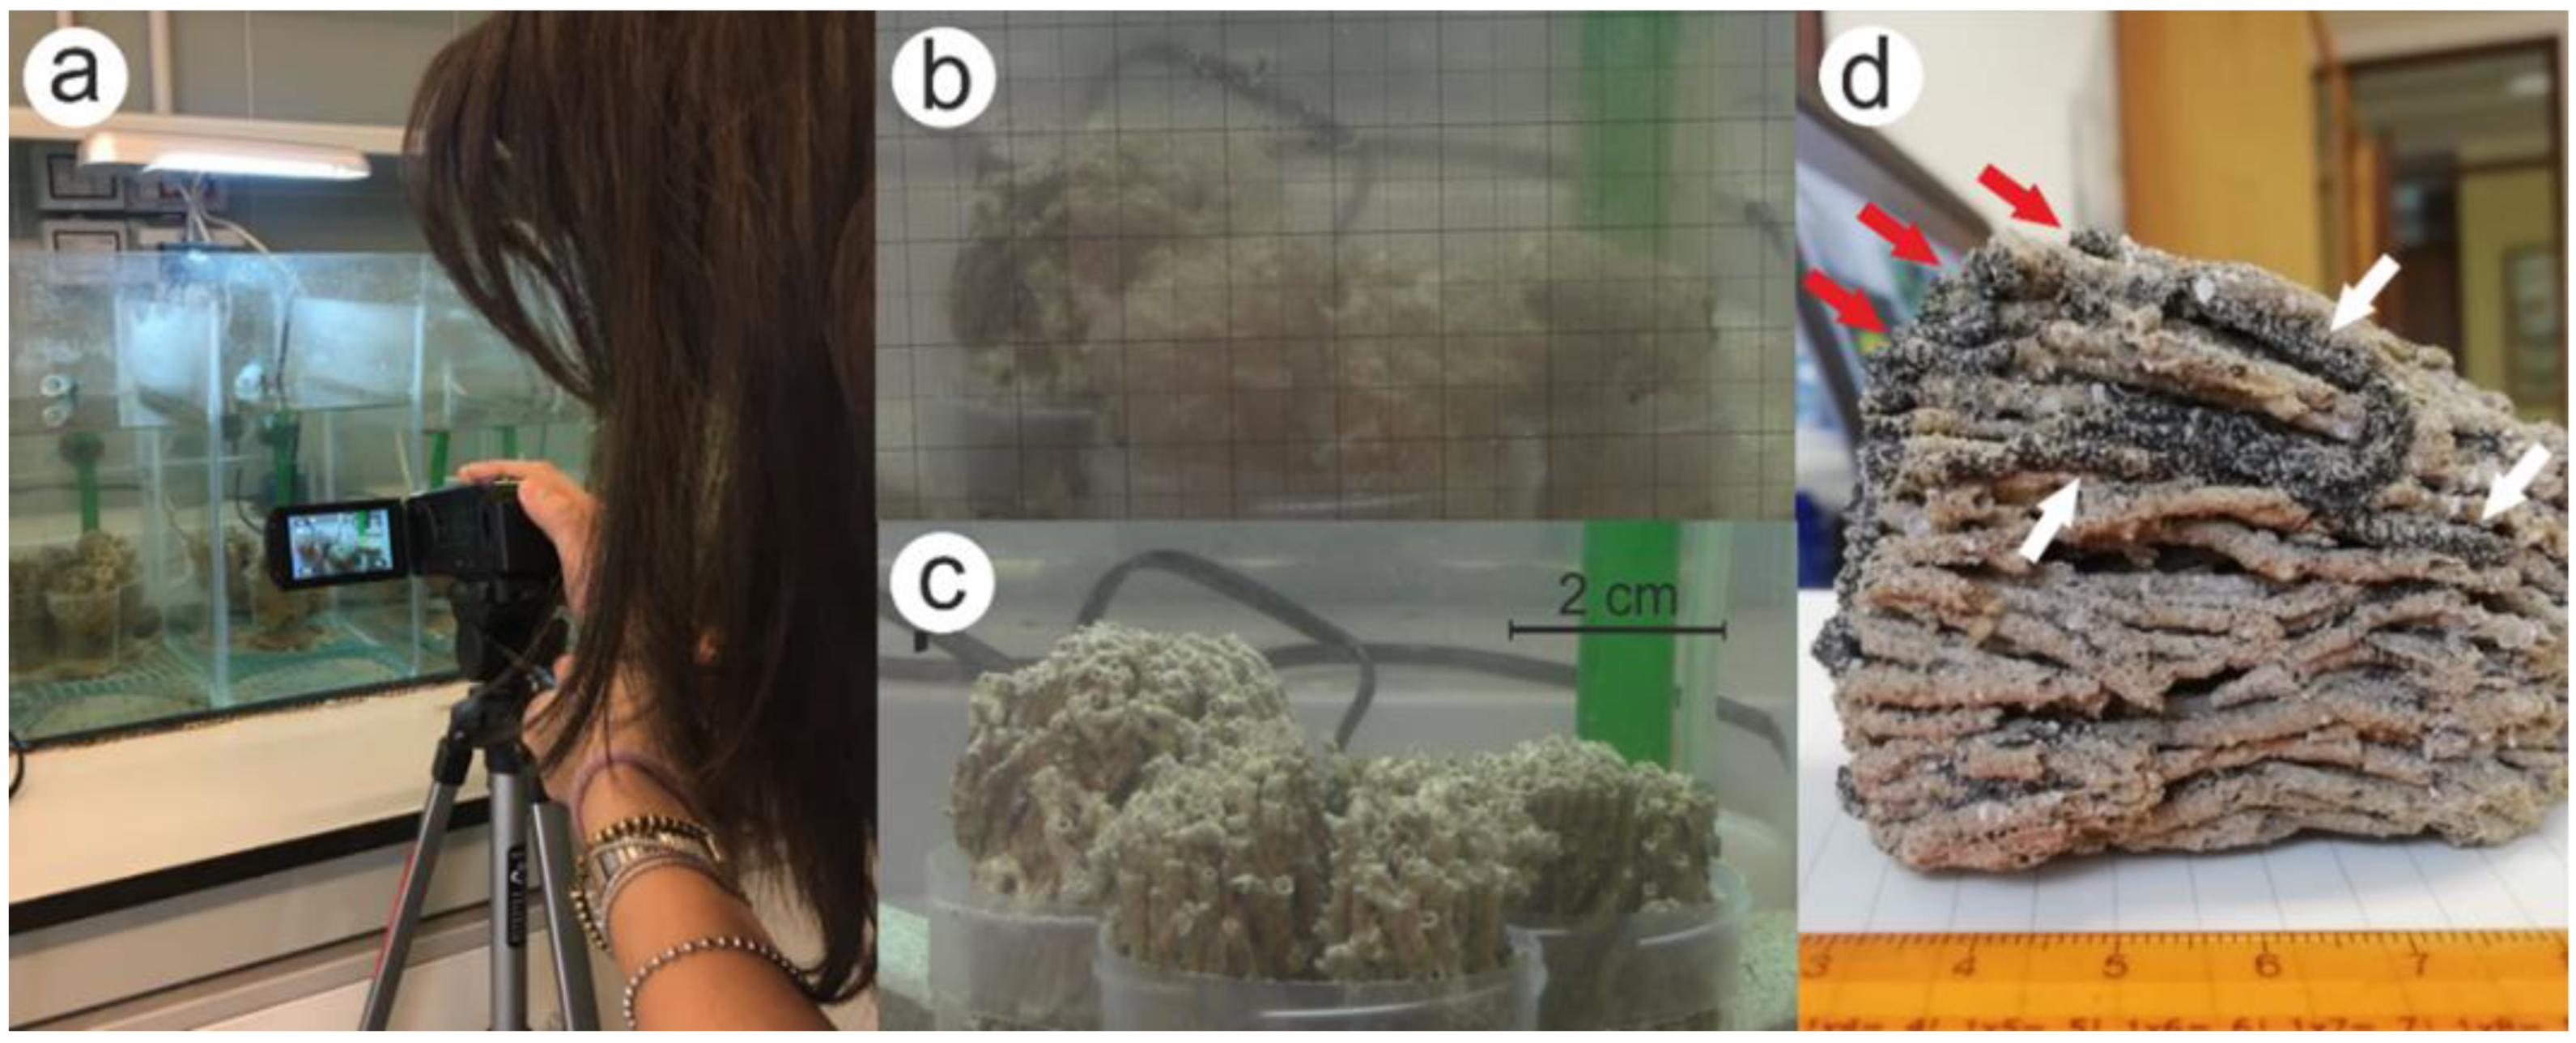
The activity of the polychaetes was determined by recording videos with a digital HD camera (Canon-Model LEGRIA HF R306) at a constant distance of 20 cm from the tank (Figure 5a). The videos allowed the evaluation of life conditions and the capture of sediment grains.
The growth of individual tubes was estimated for all replicas (n = 9), which were photographed daily in the same position using millimeter reference (Figure 5a). To verify that the optimal growth conditions were respected in all sectors, tubes with the best video resolution were taken as a reference. The first shot was taken on transparent graph paper wrapped around the outside tank surface (Figure 5b) and was used as a reference scale. The comparison between the initial and final images of each replica served to qualitatively highlight the total growth of reef fragments in test tanks (Figure 5b,c).
At the end of the experiment and after removing the samples, the growth of more than 250 tubes for each test was directly measured (Figure 5d).
After experimental tests, several reef fragments were impregnated with epoxy resin; thin sections were obtained both parallelly and perpendicularly to the direction of the tube growth to recognize the transition between natural and experimental growth conditions. Furthermore, three to six tubes for every test were accurately separated and placed on a rigid base for X-ray microtomography analysis (μX-CT). The utilized instrument was a Bruker Skyscan 1172 high-resolution μX-CT scanner equipped with a W tube. A 76 kV X-ray source was used with a current of 131 μA. The absorption radiographs were obtained over 180° rotation with an angular step of 0.30°. Beam hardening was reduced by the presence of a 0.5 mm Al filter. The nominal spatial resolution was 13.57 μm. Bruker’s NRecon software (version 1.7.4.2, Bruker μ-CT) [34] was used to reconstruct the μX-CT projection images into two-dimensional cross-sections (slices) by applying the Feldkamp algorithm [35]. Bruker’s DataViewer software (version 1.7, Bruker μ-CT) was used to observe the cross-sections, and Bruker’s CTvox software (version 3.3.1, Bruker μ-CT) was used to obtain a 3D visualization of the external microstructure of the analyzed tubes.
Statistical analyses were performed using the R statistical environment, version 3.5.2 (The R Foundation for Statistical Computing; Vienna, Austria). The Shapiro–Wilk test and graphical evaluations of each variable were performed to demonstrate the correspondence with normal distribution. Differences between tanks were determined through a one-way analysis of variance (ANOVA) followed by the Tukey post hoc test.

3. Results

3.1. First Phase (125–350 μm)

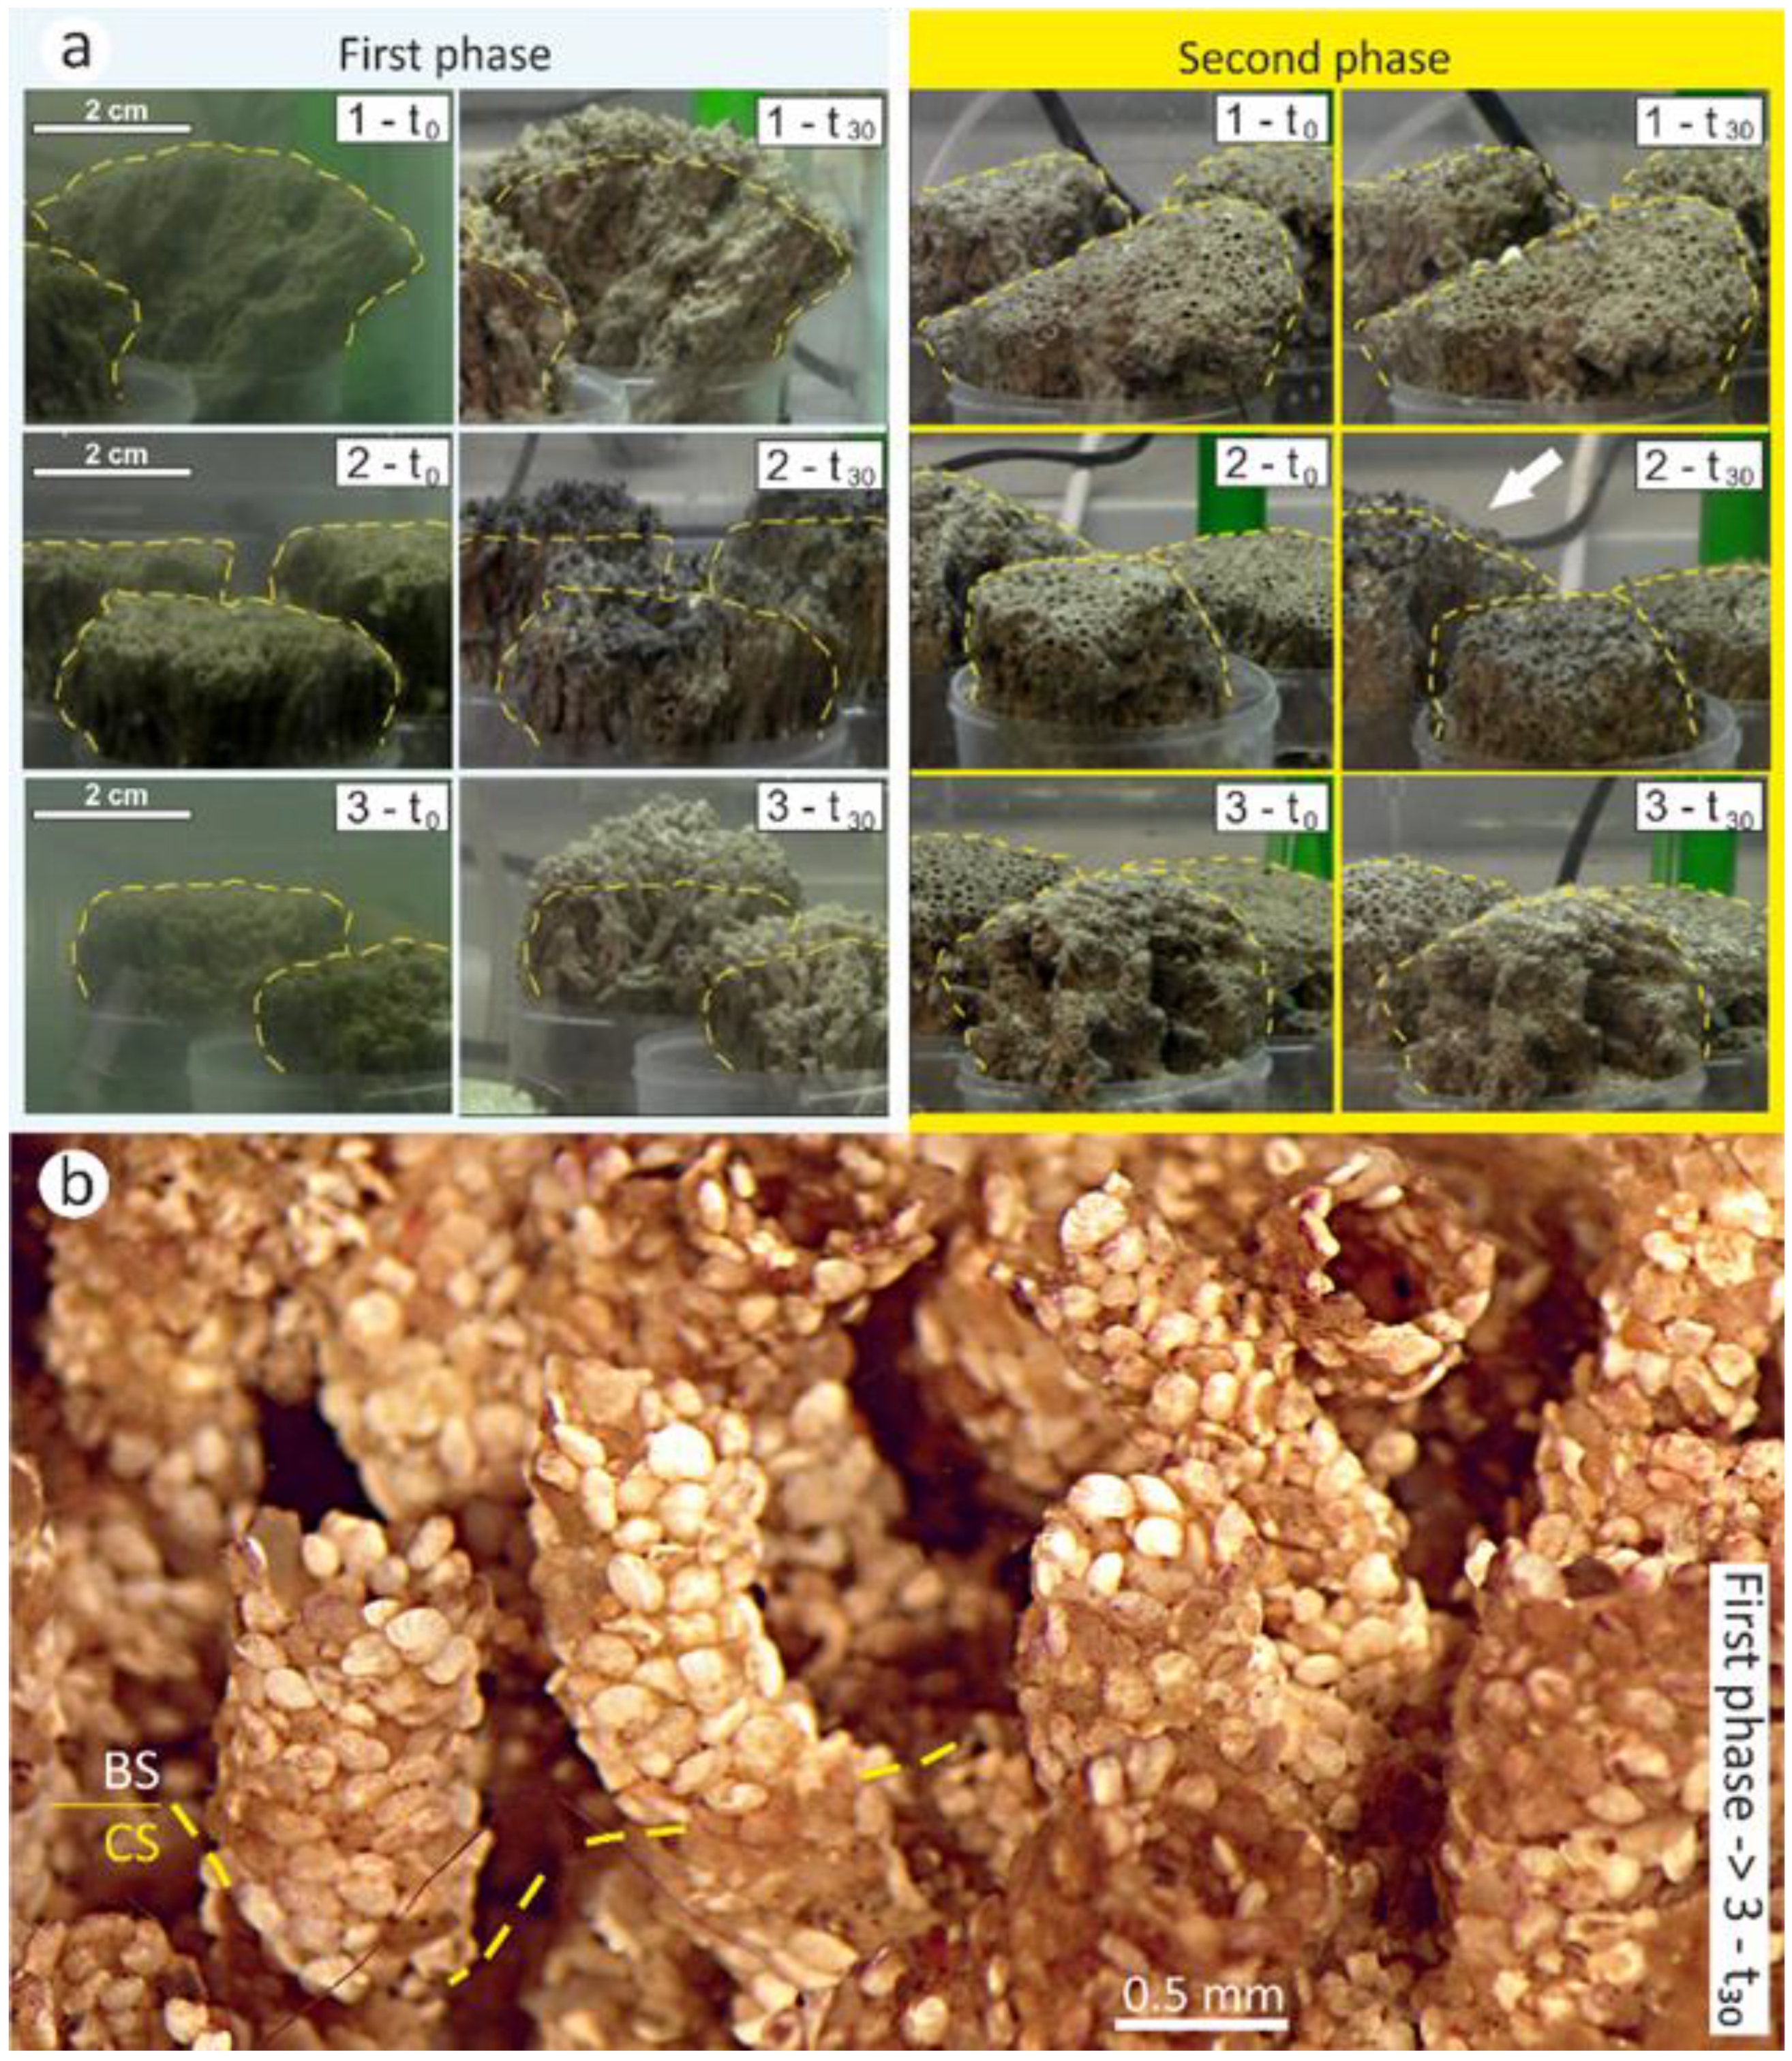
In tank 1, containing Torre Mileto’s calcilithic sands (Figure 6a), the growth of tubes in sectors 1.1 and 1.2 significantly decreased after 15 days, and after 30 days, the fragments of worm reefs appeared damaged. This was probably due to the presence of crustaceans (crabs), which were not detected during the preparation of the reef fragments and which provoked the death of many worm individuals. However, in sector 1.3, the polychaetes were still alive; in this sector, the maximum growth recorded after 30 days was almost 2 cm/1 month (tank 1 in Figure 7). The value of the average growth was 0.9 cm/1 month.
All replicas in tank 2, containing black siliciclastic sands from Margherita di Savoia (Figure 6a), showed constant growth during the entire experiment. The maximum growth measured in this tank after 30 days was 2.4 cm/1 month (tank 2 in Figure 7). The value of the average growth was approximately 0.6 cm/1 month.
In tank 3, containing bioclastic sands collected at Porto Cesareo (Figure 6a), all replicas had constant growth for the entire experiment duration (Figure 6b). The maximum growth measured in this tank after 30 days was 4.2 cm/1 month (tank 3 in Figure 7). The value of the average growth was approximately 1.3 cm/1 month.

3.2. Second Phase (350–500 μm)

Phase II involved sands of the same composition but coarser. Figure 7 summarizes the data collected in the second phase of tests. The average growth rates for sectors and in the different tanks were comparable. In all tanks, growth was minimal, and no growth of more than 2 mm was observed (Figure 6a). The growth, although modest, affected only a few large-diameter tubes. The presence of new tubes during this phase has never been reported.

3.3. Statistical Significance of Tube Growth Data Measured in the Laboratory

In phase I, significantly higher mean growth was observed in tank 3 compared with the other two tanks (p < 0.001), while no significant differences in growth were observed between tanks 1 and 2 (Figure 7). In the second phase, ANOVA test with Bonferroni correction showed no statistically significant differences among the three tanks. In addition, comparison of the entire dataset from the first and second phases indicated a significantly higher mean growth in the first phase than in the second phase (p < 0.05).

3.4. Thin Section Analysis

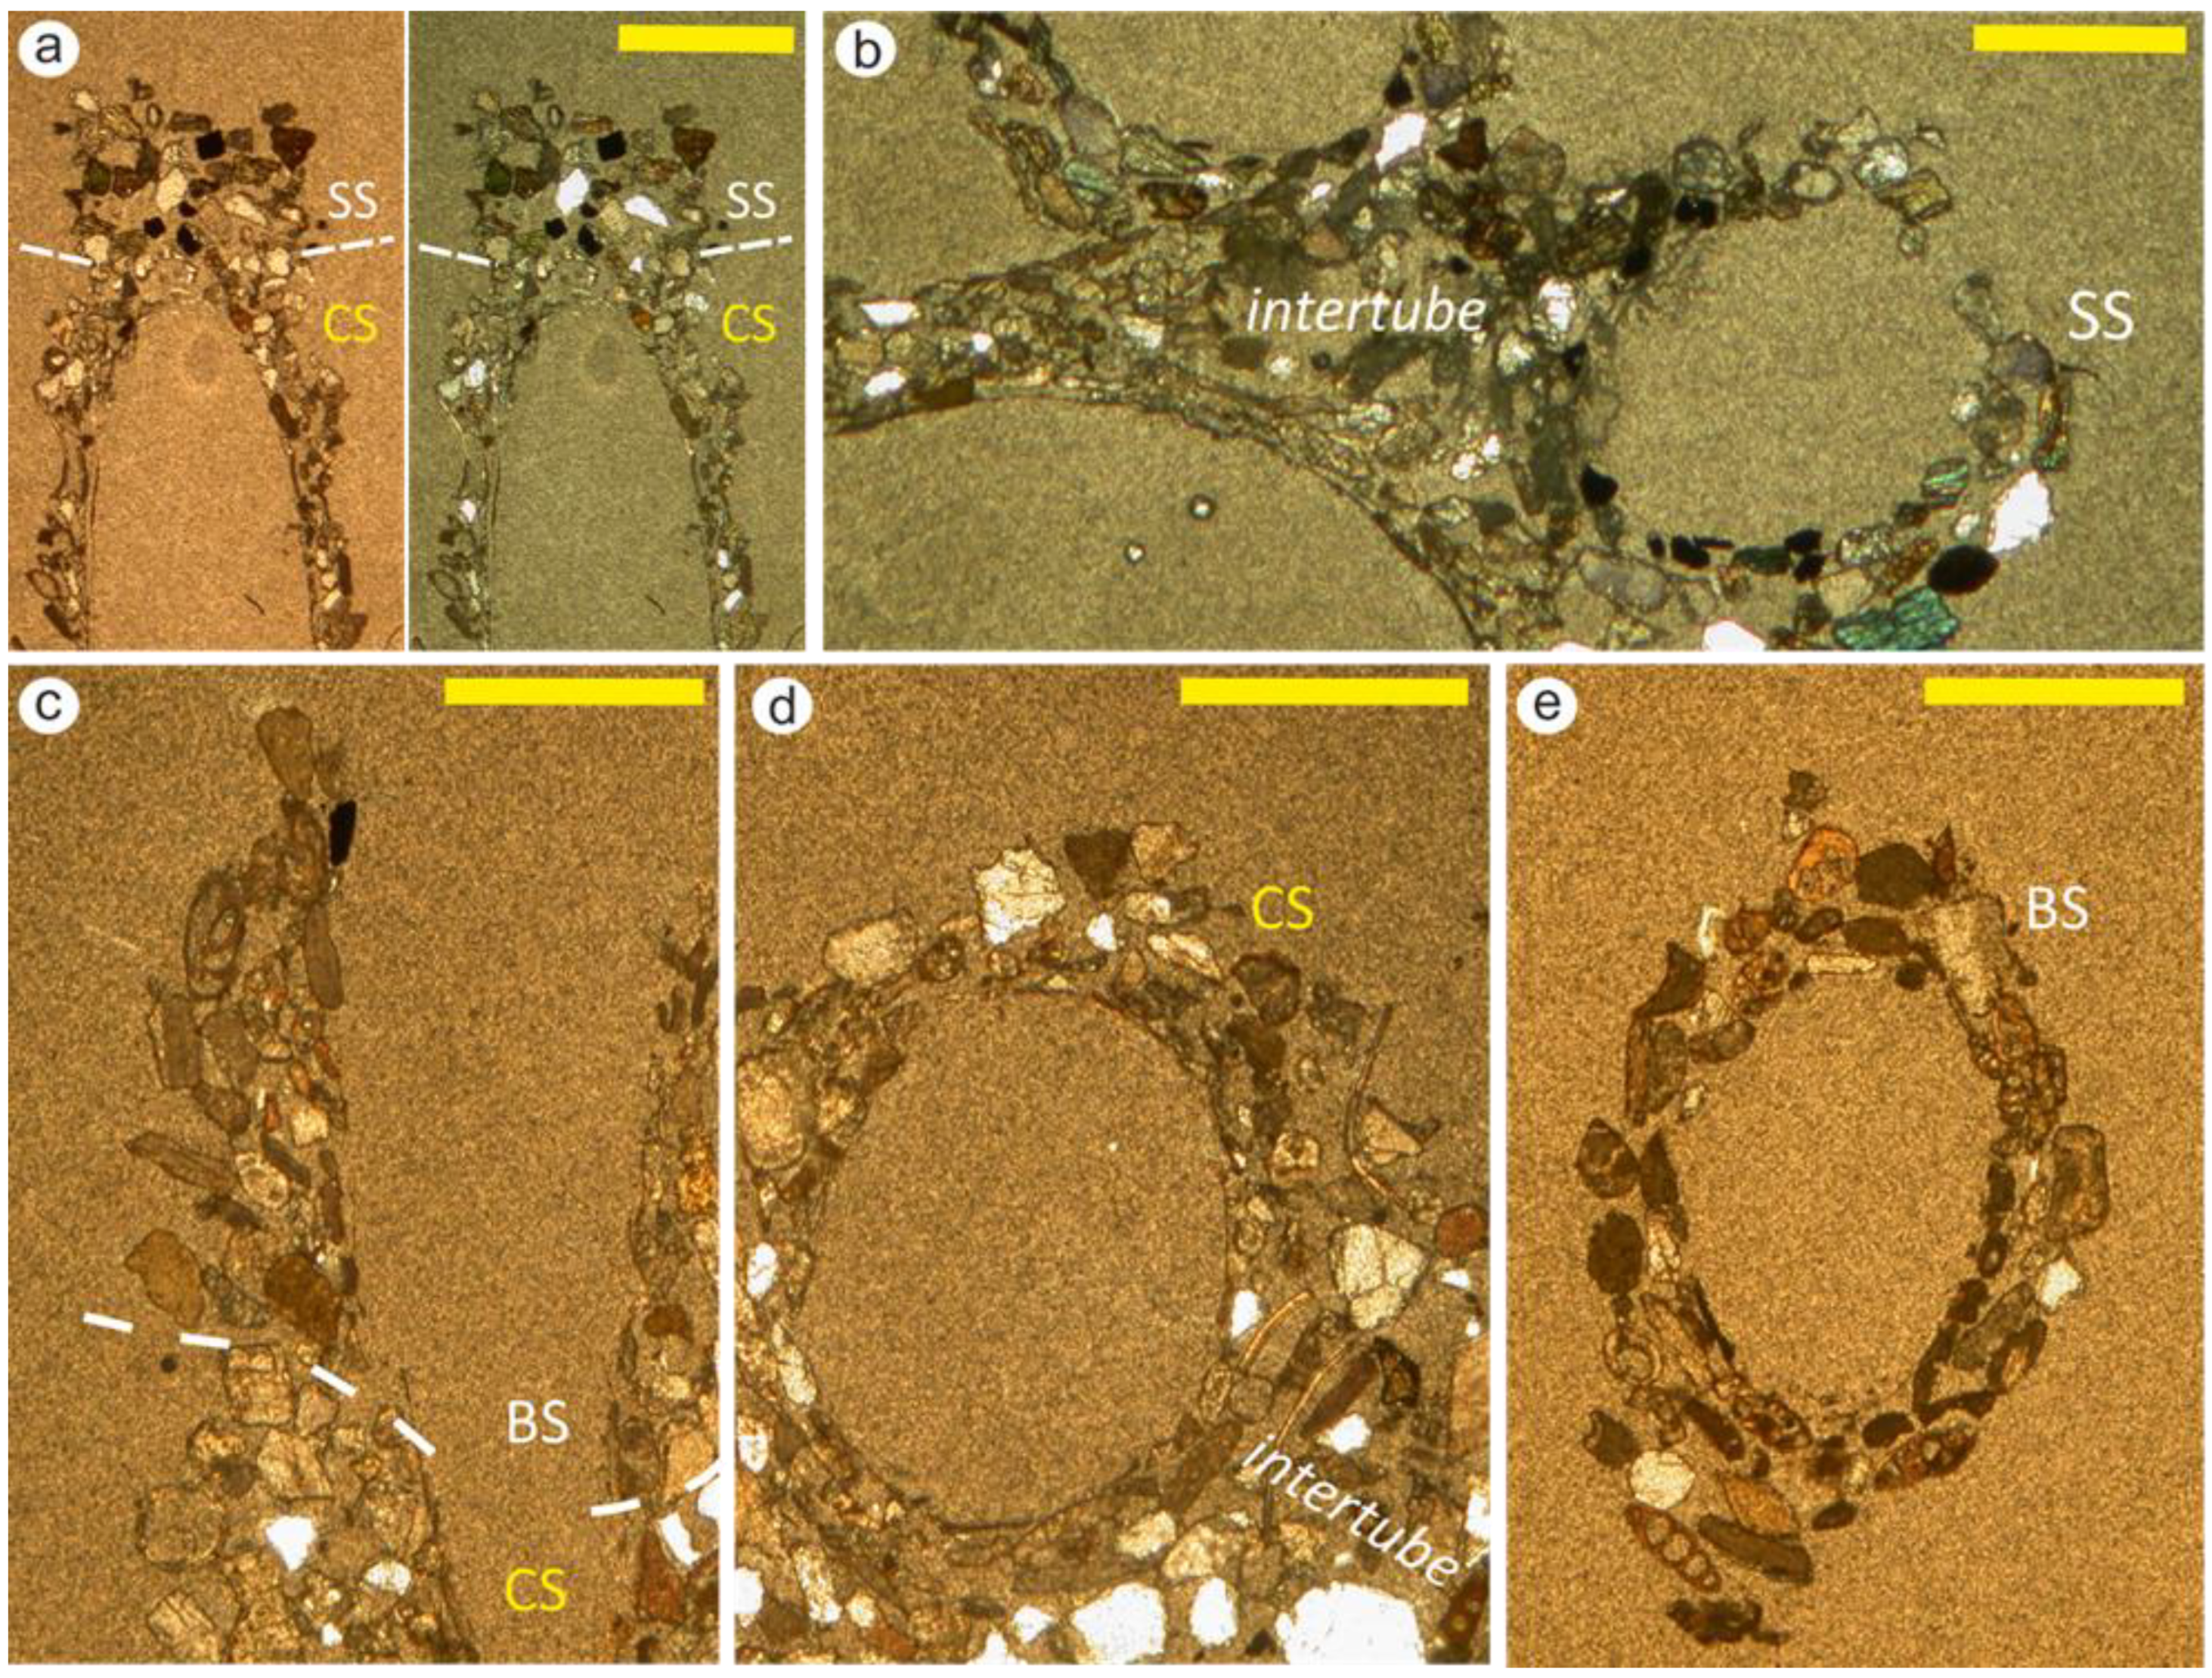
Thin section analysis of biological replicas grown in the laboratory allowed a detailed description of the worm tubes’ microstructure. Figure 8 shows the growths of the biological replicas in test tanks 2 (Figure 8a,b) and 3 (Figure 8c–e) during the first phase of the experiment.
Thin sections cut parallel to the growth of tubes (Figure 8a,c) indicated that what was observed and measured on macroscopic samples could be also confirmed at the microscopic level. It was possible to observe a sharp upward transition from the tube built in the natural conditions of the reef (calcilithic sands (CS)) to the tube built in the test tank using siliciclastic sands (SS; Figure 8a) and bioclastic sands (BS; Figure 8c). Moreover, around the vacuum left by the worm, the growth took place in the laboratory according to an arrangement of sand grains appearing similar to the natural conditions in the worm reef (Figure 8a,c).
In thin sections perpendicular to the tube growth, basal tubes grown in the sea (Figure 8d) and the upper ones grown in test tank (Figure 8b,e) clearly showed microstructures representing elementary building blocks of bioconstruction. The sand grains were captured by the worm (which occupied the central circular vacuum) and arranged to gradually form superposed circular rings consisting of sediment around its pseudo-cylindrical body. Both the size of the sands and their geometric framework remained constant when compared with growth in natural conditions (Figure 8d) and the laboratory (Figure 8b,e). Each sedimentary ring contained grains with different morphometric features (circular, rounded, elongated, etc.), and typically, most elongated grains were arranged tangentially to the circle occupied by the worm.
The microstructure was completed by sands occupying the spaces between adjacent tubes (intertube areas; Figure 8b,d), thus providing greater stability to the worm reef. Regarding grain size distribution, sands of these sectors seemed to have a casual distribution and were less sorted than sands captured directly by the worm. Intertube areas also showed similar characters in both natural reef and biological replicas of the tests (compare Figure 8b,d).

3.5. μX-CT Analysis

The microstructure of tubes grown in the laboratory was further observed using a microtomography scanner (μX-CT). The obtained images highlighted the three-dimensional structure of tubes and indicated the differences in sand density used in the experiment (Figure 9). The microtomographic images of the tubes grown in tank 2 (siliciclastic sand (SS)) showed portions formed during the experiment, as a result of the density contrast between the siliciclastic (consisting of magnetite (5.17 g/cm3) and pyroxene (3.2–4.5 g/cm3)) and calcilithic sand (consisting of calcite (2.71 g/cm3) and quartz (2.65 g/cm3)) of natural tubes. Figure 9a shows the 3D morphology of the tubes grown in the laboratory by means of bright colors of high-density sand grains. Growth sectors of natural tubes, entire tubes formed by siliciclastic sand in the laboratory, and intertube areas filled by sands deposited between adjacent tubes were well distinguishable. Bruker’s DataViewer software (version 1.7, Bruker μ-CT) was used to detail the transition between the biological replicas and the growth in the laboratory; the visualization of individual sections obtained from the intersection between the tube and a horizontal plane allowed the accurate identification of the transition zone (see Section 2 and Section 3 in Figure 9b) and the recognition of the size of the intertube areas (“it” in Figure 9b).
In the case of the tank 3 test (bioclastic sand (BC)) as well, the transition between the natural tube and that obtained in the laboratory was always clearly visible because of the low density of carbonate bioclasts (the presence of voids varies the bulk density of bioclastic material between 1.0 and 2.71 g/cm3 [36]). The external 3D morphology (Bruker’s CTvox software (version 3.3.1, Bruker μ-CT)) highlighted a character visible neither on the macroscopic samples nor in the thin section. The tube sectors grown in the tank using bioclastic sands seemed larger and formed by coarser sand than the tube grown in nature (Figure 9c). Sections obtained from the intersection between the tube and the vertical plane allowed the increase in tube diameter to be attributed to the increase in tube thickness under experimental conditions. However, the worm cannot be grown during a single month, and the vertical section of the tube shows a constant size of the vacuum occupied by the worm (Figure 9c).

4. Discussion

4.1. The Growth of Sabellaria spinulosa Bioconstructions in the Laboratory

The main purpose of the present work was to establish the best conditions for the growth of Sabellaria spinulosa bioconstructions in the laboratory, thus allowing replanting operations (as already shown by [37]) in areas where the reef is declining but also to exploit their fast growth to protect beaches where there are no worm reefs. The produced laboratory model uses easily reproducible procedures and low-cost and easily findable materials.
The results indicated that the applied experimental conditions ensure a reliable model for some of the most important natural processes driving reef growth. Sampling and transport procedures did not affect the living conditions of Sabellaria spinulosa individuals. The setting of abiotic parameters (salinity, pH, light cycles, etc.) and feeding procedures ensured the survival of worms throughout various test phases, thus allowing their reposition in the original capture site, i.e., the marine environment. Another indirect confirmation of the achievement of adequate conditions was the presence of tubes built by young individuals. Indeed, the developed experimental conditions probably allowed individuals, initially present as larvae, to develop and contribute to the reef growth in the laboratory.
Regarding sedimentary processes, our procedures modeled the phase of a decrease in the energy of storm wave events. Indeed, this is the phase in which sediments start to settle on the seabed in natural shoreface systems [27,28,29,30] after being eroded and transported by traction on the sea bottom or suspended during the energy acme of the storm wave event. The regular upward growth of the worm tubes was ensured by this “rain of sands” that decreased over time, avoiding all limits of our preliminary experiments (see Supplementary Material) and those known in the literature [21,24]. Indeed, in the experiments in [21,24], the tube growth occurred during the helicoidal flow of water, air, and sands, and the final tubes were irregular and isolated; this is a very unusual occurrence for the worm bioconstructions and is restricted to rare concretions of Sabellaria spinulosa in deeper environments [38]. Moreover, our experimental procedures allowed infilling of the spaces between adjacent tubes (intertube areas), a character of great importance for the physical resistance of the natural reef to the wave action.
After-test measurements of biological replicas confirmed exceptionally rapid growth of Sabellaria spinulosa natural reefs. Although growth rates, ranging between 1 cm and 4 cm per month, were variable, they were, however, compatible with those measured in situ at Torre Mileto, accounting for 1.6 cm/month [15]. Phase I and phase II recorded different growth rates, strictly dependent on the grain size of the sands. Higher growth was recorded when the grain size range of the sand was used, in accordance with the data from the Torre Mileto natural reef (125–350 μm), where Sabellaria spinulosa normally capture this type of sand. In coarser sediments (350–500 μm), growth rates were low. Although expected, this result experimentally showed that the reef could remain active and could slowly grow also during periods in which the available sands are coarser than the ideal size. This is not a rare condition for reefs in shallow water environments where grain size varies depending on the energy of storm waves and the grain size of sands transported by adjacent rivers in delta areas. Furthermore, this result shows that slow growth rates, stasis, and decline periods of worm reefs not only could be associated with severe storm wave events during winter and/or competition with other organisms [15] but could be also linked to gradual/sudden variations of grain size in shoreface environments where Sabellaria spinulosa builds its reefs.
The sand composition seemed to have a determining role in the growth rate of biological replicas. Although many authors have argued that Sabellaria sp. mainly selects grains according to their size [4,5], more recent studies indicated a relative enrichment of tubes in bioclasts with respect to the average composition of available sediments. For example, [39] showed the predilection of Sabellaria alveolata in capturing foraminifera. Our experiments confirmed this leaning for bioclasts by unequivocally measuring higher growth in test tank 3 (Figure 7). The exact opposite seemed to be the case in test tank 2, in which siliciclastic sediments rich in pyroxenes and magnetite were used. Test tank 1, representing the natural system of Torre Mileto’s reef with sand of mixed composition, recorded intermediate growths. This result did not represent a real preference for the mineralogical-compositional type but was probably a consequence of the different hydrodynamic behavior of the particles following their physical properties. Indeed, when shear stress exerted by waves on the sandy bottom begins to decrease, suspended particles start to settle with a velocity that depends on the dimension, density, and shape of grains [40]. Bioclasts have an intragranular porosity [41] and hence very low bulk density (about 2.0 g/cm3 [42]). They often have an elongated or irregular shape (e.g., fragments of bivalve and gastropods), and their settling velocity is lower than in pseudo-spherical particles with the same density and volume [43]. Generally, bioclasts have settling velocities that are lower than in other grains with similar dimensions but with different densities and shapes. Because of this, low bulk density flat particles (as bioclasts) tend to remain suspended for longer times than other types of sediments and are more likely to be captured by worms.
Noticeably, pseudo-spherical grains with higher density (e.g., pyroxene and magnetite (density between 3 and 5 g/cm)) are deposited with higher settling velocities than bioclasts and have less chance of being caught by the worm.

4.2. Microstructure of Sabellaria spinulosa Tubes Grown in the Laboratory

The evaluation of the growth of biological replicates at the microscopic level provided much new information and confirmed those obtained at the macroscopic level. The thin section’s analysis demonstrated that the general structure of naturally grown tubes could be replicated in the laboratory by applying the here-developed experiment settings. While changing the composition of sands, the tube growth along the vertical accretion respected natural geometry (Figure 9a,c). By observing horizontally cut sections at various heights of the tube’s growth, the typical ring structure described in many previous works [10] was observed, and this microscopic structure remained constant in the laboratory. We have observed that several factors contributed to the tube stability, including grain arrangement (those with elongated shapes are tangential to the vacuum occupied by the worm) and the presence of intertube sands ensuring the friction at the contact of sand grains and shear strength of the entire reef.
Occasionally, the particle size of the sediments captured in the laboratory experiments seemed greater than in natural environments (although always within the range of sands used, i.e., 125–350 μm). This increase in thickness and grain size was only observed when using bioclastic sands (BS). Many factors could contribute to the occurrence of this phenomenon. From a qualitative point of view, the increase in particle size seemed mainly linked to certain particles and, in particular, to the flat and elongated bioclasts (fragments of bivalves and gastropods), as could be observed by comparing the diameters of these (in white) in the lower and upper parts of the tube (CS and BS, respectively, in Figure 9c). This character could be a result of the wide presence of flat bioclasts of larger dimensions (close to 300 mm) in the bioclastic sands used in the laboratory. Specific laboratory conditions may also have helped to determine an ideal system for capturing bioclasts suitable for strengthening the tube. Due to the spatial arrangement of these larger, flat, and elongated bioclasts with larger axes inclined and directed upward (Figure 8c), the tube became thicker in the laboratory conditions. With this orientation of flat bioclasts, probably smaller grains could also end up in the tube by passive capture during their settlement. More detailed microtomographic studies will have to be carried out to verify these assumptions. This phenomenon caused a sharp increase in the thickness and strength of the tubes, which was an important characteristic for the resistance of the reef to the erosive action of storm waves.

5. Conclusions

Our experiments overcame many limitations of previous approaches and allowed the reproducibility of results using inexpensive and readily available materials. The laboratory model was based on realistic sedimentation conditions, simulating the sand settling phase that usually follows the acme of storm wave events in shoreface environments (Sabellaria spinulosa reefs are typical of subtidal conditions). The experiment included nine biological replicas for each test sector in which sands of different grain sizes and composition were used.
The laboratory results showed that sand grain size was a determining condition for the building of polychaetes’ bioconstructions. According to the results, adequate sand grain size that enhanced the growth of bioconstruction ranged between 125 and 350 μm and caused high growth rates (up to more than 4 cm/month) comparable to those measured in situ. Using coarser sand (350–500 μm), biological replicas showed barely measurable growths; these were never greater than 2 mm and involved only a small number of tubes (those with large diameters—adult worms). From a compositional point of view, the fastest growth in the laboratory was obtained using bioclastic sands. This has been interpreted as the result of bioclasts’ lower settling speed due to their elongated/flat shape and/or low bulk density. Calcilithic and siliciclastic sands, indeed, showed good growth rates but were always lower than those of bioclastic sands.
The methodologies used to investigate reef growth at the microscopic level indicated that the tube structures (in 2D and 3D) were identical to those grown in nature in all their components (tube geometries, grain arrangement, intertube areas, etc.).
Finally, the results of the present study will allow better definition of many physical parameters and processes that can affect the growth, stasis, or decline of Sabellaria spinulosa natural reefs. Although phases of reef crisis are usually considered to be connected to the action of storm waves, interspecific competition, and anthropic action (trampling or pollution), our experiments showed how slight variations in grain size and sand composition or the decline of adjacent habitats where bioclasts are produced (e.g., Posidonia meadows) can induce the same effects.

Supplementary Materials

The following supporting information can be downloaded at https://www.mdpi.com/article/10.3390/jmse11010204/s1: Figure S1: (a) Configuration of the test tank during the second experiment. (b) Diagram of the test tank that highlights the flow of suspended sand around the reef sample, which is generated by the device consisting of an aerator and wave marker. (c) Tubes grown in the test tank during the second experiment.; Table S1: Different experiments carried out for this work;. Report: Toward a reliable analogous model.

Author Contributions

Conceptualization, S.L. and M.M.; methodology, S.L., T.L. and C.P.; validation, C.P. and M.M.; formal analysis, S.L., T.L. and D.M.; investigation, S.L., T.L. and C.P.; data curation, S.L., T.L., A.d.L. and C.P.; writing—original draft preparation, S.L. and M.M.; writing—review and editing, C.P., D.M. and T.L.; visualization, S.L.; supervision, M.M.; project administration, M.M. All authors have read and agreed to the published version of the manuscript.

Funding

This research was funded by “Research for Innovation (REFIN)—POR Puglia 2014–2020”, Asse Prioritario OT X “Investire nell’istruzione, nella formazione e nella formazione professionale per le competenze e l’apprendimento permanente”—Azione 10.4.

Institutional Review Board Statement

Not applicable.

Informed Consent Statement

Not applicable.

Data Availability Statement

Not applicable.

Conflicts of Interest

The authors declare no conflict of interest.

References

  1. Wust, R.A.J. Binding organisms. In Encyclopedia of Modern Coral Reefs: Structure, Form and Process. Encyclopedia of Earth Science; Hopley, D., Ed.; Springer: Dordrecht, The Netherlands, 2011; pp. 136–139. [Google Scholar]
  2. Allen, J.H.; Billings, I.; Cutts, N.; Elliott, M. Mapping, Condition and Conservation assessment of Honeycomb Worm Sabellaria alveolata Reefs on the Eastern Irish Sea Coast. Report to English Nature, 2002, Institute of Estuarine and Coastal Studies University of Hull, Reference No: Z122-F-2002.
  3. Gruet, Y. Spatio-temporal Changes of Sabellarian Reefs Built by the Sedentary Polychaete Sabellaria alveolata (Linné). Mar. Ecol. 1986, 7, 303–319. [Google Scholar] [CrossRef]
  4. Gruet, Y. Granulometric evolution of the sand tube in relation to growth of the polychaete Annelid Sabellaria alveolate (Linné) (Sabellariidae). Ophelia 1984, 23, 181–193. [Google Scholar] [CrossRef]
  5. Naylor, L.A.; Viles, H.A. A temperate reef builder: An evaluation of the growth, morphology and composition of Sabellaria alveolata (L.) colonies on carbonate platforms in South Wales. In Carbonate Platform Systems: Components and Interactions; Insalaco, E., Skelton, P.W., Palmer, T.J., Eds.; Geological Society, Special Publications: London, UK, 2000; Volume 178, pp. 9–19. [Google Scholar]
  6. Delbono, I.; Bianchi, C.N.; Morri, C. Le biocostruzioni di Sabellaria alveolata come indicatori ambientali: Area costiera fra Chiavari e Sestri Levante. In Studi per la Creazione di Strumenti di Gestione Costiera. Golfo del Tigullio; Ferretti, O., Ed.; Golfo del Tigullio: Genoa, Italy, 2003; pp. 130–140. [Google Scholar]
  7. La Porta, B.; La Valle, P.; Gusso, C. Sabellaria alveolata (Linnaeus, 1776): La selezione dei granuli di sedimento per la costruzione dei tubi. Biol. Mar. Mediterr. 2006, 13, 593–596. [Google Scholar]
  8. Taramelli Rivosecchi, E. Osservazioni sulle biocenosi del banco a Sabellaria di Lavinio. Rend. Accad. Naz. 1961, 40–41, 1–2. [Google Scholar]
  9. Multer, H.G.; Milliman, J.D. Geological aspects of Sabellarian reefs, southeastern Florida. Bull. Mar. Sci. 1967, 17, 257.e267. [Google Scholar]
  10. Lisco, S.; Moretti, M.; Cardone, F.; Corriero, G.; Longo, C. Sedimentological features of Sabellaria spinulosa biocontructions. Mar. Pet. Geol. 2017, 87, 203–212. [Google Scholar] [CrossRef]
  11. Desroy, N.; Dubois, S.; Fournier, J.; Ricquiers, L.; Le Mao, P.; Guérin, L.; Gerla, D.; Rougerie, M.; Legendre, A. Conservation status of Sabellaria alveolata (L.) (Polychaeta: Sabellariidae) reefs in the Mont-Saint-Michel bay. Aquat. Conserv.-Mar. Freshw. Ecosyst. 2011, 21, 462–471. [Google Scholar] [CrossRef]
  12. Firth, L.B.; Mieszkowska, N.; Grant, L.M.; Bush, L.E.; Davies, A.J.; Frost, M.T.; Moschella, P.S.; Burrows, M.T.; Cunningham, P.N.; Dye, S.R.; et al. Historical comparisons reveal multiple drivers of decadal change of an ecosystem engineer at the range edge. Ecol. Evol. 2015, 5, 3210–3222. [Google Scholar] [CrossRef] [Green Version]
  13. Holt, T.J.; Rees, E.I.; Hawkins, S.J.; Seed, R. Biogenic Reefs (Volume IX). An Overview of Dynamic and Sensitivity Characteristics for Conservation Management of Marine SACs; Scottish Association for Marine Science (UK Marine SACs Project): Obam, UK, 1998; p. 170. [Google Scholar]
  14. Pearce, B.; Hill, J.M.; Grubb, L.; Harper, G. Impacts of marine aggregate dredging on adjacent Sabellaria spinulosa aggregations and other benthic fauna. In Marine Aggregates Levy Sustainability Fund MEPF 08/P39 and The Crown Estate. Marine Ecological Surveys Limited; 3 Palace Yard Mews: Bath, UK, 2011; p. 35. ISBN 978-0-9506920-5-0. [Google Scholar]
  15. Plicanti, A.; Domínguez, R.; Dubois, S.F.; Bertocci, I. Human impacts on biogenic habitats: Effects of experimental trampling on Sabellaria alveolata (Linnaeus, 1767) reefs. J. Exp. Mar. Biol. Ecol. 2016, 478, 34–44. [Google Scholar] [CrossRef]
  16. Lisco, S.N.; Pierri, C.; Lazic, T.; Bonifazi, A.; Gravina, M.F.; Giangrande, A.; Acquafredda, P.; Moretti, M. Sabellaria alveolata versus Sabellaria spinulosa Reefs along the Italian Coasts: A New Methodological Proposal to Compare Different Growth Models. Geosciences 2021, 11, 426. [Google Scholar] [CrossRef]
  17. Lisco, S.N.; Acquafredda, P.; Gallicchio, S.; Sabato, L.; Bonifazi, A.; Cardone, F.; Corriero, G.; Gravina, M.F.; Pierri, C.; Moretti, M. The sedimentary dynamics of Sabellaria alveolata bioconstructions (Ostia, Tyrrhenian Sea, central Italy). J. Palaeogeogr. 2020, 9, 2. [Google Scholar] [CrossRef] [Green Version]
  18. Fournier, J. Bioconstructions d’annélides polychètes. In Mémoire d’Habilitation à Diriger des Recherches, Volume 2; Synthese scientifique—Université de Bretagne Occidentale, Institut Universitaire Européen de la Mer, CNRS: Brest, France, 2013; p. 171. [Google Scholar]
  19. Ingrosso, G.; Abbiati, M.; Badalamenti, F.; Bavestrello, G.; Belmonte, G.; Cannas, R.; Benedetti-Cecchi, L.; Bertolino, M.; Bevilacqua, S.; Bianchi, C.N.; et al. Mediterranean Bioconstructions Along the Italian Coast. Adv. Mar. Biol. 2018, 79, 61–136. [Google Scholar] [CrossRef] [PubMed]
  20. Eckelbarger, K.J. Larval development and population aspects of the reef-building polychaete Phragmatopoma lapidosa from the east coast of Florida. Bull. Mar. Sci. 1976, 26, 117–132. [Google Scholar]
  21. Davies, A.J.; Last, K.S.; Attard, K.; Hendrick, V.J. Maintaining turbidity and current flow in laboratory aquarium studies, a case study using Sabellaria spinulosa. J. Exp. Mar. Biol. Ecol. 2009, 370, 35–40. [Google Scholar] [CrossRef]
  22. Jones, L.A.; Hiscock, K.; Connor, D.W. Marine Habitat Reviews: A Summary of Ecological Requirements and Sensitivity Characteristics for the Conservation and Management of Marine SACs; Joint Nature Conservation Committee: Peterborough, UK, 2000.
  23. Braithwaite, C.J.R.; Robinson, R.J.; Jones, G. Sabellarids: A hidden danger or an aid to subsea pipelines? Q. J. Eng. Geol. Hydrogeol. 2006, 39, 259–265. [Google Scholar] [CrossRef]
  24. Last, K.; Hendrick, V.J.; Beveridge, C.M.; Davies, A.J. Measuring the effects of suspended particulate matter and smothering on the behaviour, growth and survival of key species found in areas associated with aggregate dredging. Report for the Marine Aggregate Levy Sustainability Fund; Commercial Report, 2011; MEPF 08/P76. Available online: https://pure.uhi.ac.uk/en/publications/measuring-the-effects-of-suspended-particulate-matter-and-burial- (accessed on 12 December 2022).
  25. Giangrande, A.; Lezzi, M.; Cardone, F.; Mikac, B. Variation and ontogenetic changes of opercular paleae in a population of Sabellaria spinulosa (Polychaeta: Sabellaridae) from the South Adriatic Sea, with remarks on larval development. Sci. Mar. 2015, 79, 137–150. [Google Scholar] [CrossRef] [Green Version]
  26. Gravina, M.F.; Cardone, F.; Bonifazi, A.; Bertrandino, M.S.; Chimienti, G.; Longo, C.; Marzano, C.N.; Moretti, M.; Lisco, S.; Moretti, V.; et al. Sabellaria spinulosa (Polychaeta, Annelida) reefs in the Mediterranean Sea: Habitat mapping, dynamics and associated fauna for conservation management. Estuarine Coast. Shelf Sci. 2018, 200, 248–257. [Google Scholar] [CrossRef]
  27. Lowe, D.R. Water escape structures in coarse-grained sediments. Sedimentology 1975, 22, 157–204. [Google Scholar] [CrossRef]
  28. Van Loon, A.J.; Moretti, M.; Tropeano, M.; Acquafredda, P.; Baldacconi, R.; Festa, V.; Lisco, S.; Mastronuzzi, G.; Moretti, V.; Scotti, R. Tracing the Source of the Bio/Siliciclastic Beach Sands at Rosa Marina (Apulian Coast, SE Italy). In Sediment Provenance; Mazumder, R., Ed.; Elsevier: Amsterdam, The Netherlands, 2017; pp. 25–47. [Google Scholar] [CrossRef]
  29. Lapietra, I.; Lisco, S.N.; Milli, S.; Moretti, M. Sediment provenance of a bioclastic carbonate pocket beach—Le Dune (Ionian Sea, South Italy). J. Palaeogeogr. 2022, 11, 1–18. [Google Scholar] [CrossRef]
  30. Poppe, L.J.; Eliason, A.H.; Fredericks, J.J.; Rendigs, R.R.; Blackwood, D.; Polloni, C.F. Grain-Size Analysis of Marine Sediments e Methodology and Data Processing. In Geological Survey Open File Report 00e358; U.S. Geological Survey: Woods Hole, MA, USA, 2000. Available online: https://pubs.usgs.gov/of/2000/of00-358/text/chapter1.htm (accessed on 8 January 2023).
  31. Sanfilippo, R.; Rosso, A.; Viola, A.; Guido, A.; Deias, C. Architecture and tube structure of Sabellaria spinulosa (Leuckart, 1849): Comparison with the Mediterranean S. alveolata congener. J. Morphol. 2022, 283, 1350–1358. [Google Scholar] [CrossRef]
  32. Zuffa, G.G. Hybrid arenites: Their composition and classification. J. Sediment. Petrol. 1980, 50, 21–29. [Google Scholar]
  33. Zuffa, G.G. Optical analysis of arenites: Influence of methodology on compositional results. In Provenance of Arenites; Zuffa, G.G., Ed.; Springer: Dordrecht, The Netherlands, 1985; pp. 165–189. [Google Scholar]
  34. Liu, X.; Sasov, A. Cluster reconstruction strategies for microCT/nanoCTscanners. In Proceedings of the of Fully 3D Image Reconstruction Meeting in Radiology and Nuclear Medicine, Salt Lake City, UT, USA, 6–9 July 2005. [Google Scholar]
  35. Feldkamp, L.A.; Davis, L.C.; Kress, J.W. Practical cone-beam algorithm. J. Opt. Soc. Am. 1984, 1, 612–619. [Google Scholar] [CrossRef] [Green Version]
  36. Kench, P.S.; McLean, R.F. A comparison of settling and sieve techniques for the analysis of bioclastic sediments. Sediment. Geol. 1997, 109, 111–119. [Google Scholar] [CrossRef]
  37. Franzitta, G.; Colletti, A.; Savinelli, B.; Martire, M.L.; Corinaldesi, C.; Musco, L. Feasibility of the Sabellarid Reef Habitat Restoration. Front. Mar. Sci. 2022, 9. [Google Scholar] [CrossRef]
  38. Pearce, B.; Fariñas-Franco, J.M.; Wilson, C.; Pitts, J.; Deburgh, A.; Somerfield, P.J. Repeated mapping of reefs constructed by Sabellaria spinulosa Leuckart 1849 at an offshore wind farm site. Cont. Shelf Res. 2014, 83, 3–13. [Google Scholar] [CrossRef]
  39. Bue, G.L.; Marchini, A.; Mancin, N. Selection or random picking? Foraminiferal tests in Sabellaria alveolata (Linnaeus, 1767) bioconstructions. Mar. Environ. Res. 2022, 176, 105616. [Google Scholar] [CrossRef] [PubMed]
  40. Choquette, P.W.; Pray, L.C. Geologic nomenclature and classification of porosity in sedimentary carbonates. Am. Assoc. Pet. Geol. Bull. 1970, 54, 207–250. [Google Scholar]
  41. Jackson, D.R.; Richardson, M.D.; Isakson, M.J.; Wilson, P.S. High-Frequency Seafloor Acoustics. J. Acoust. Soc. Am. 2007, 122, 2497. [Google Scholar] [CrossRef]
  42. Maiklem, W.R. Some hydraulic properties of bioclastic carbonate grains. Sedimentology 1968, 10, 101–109. [Google Scholar] [CrossRef]
  43. Fox, H.M. Functions of the Tube in Sabellid Worms. Nature 1938, 141, 163. [Google Scholar] [CrossRef]
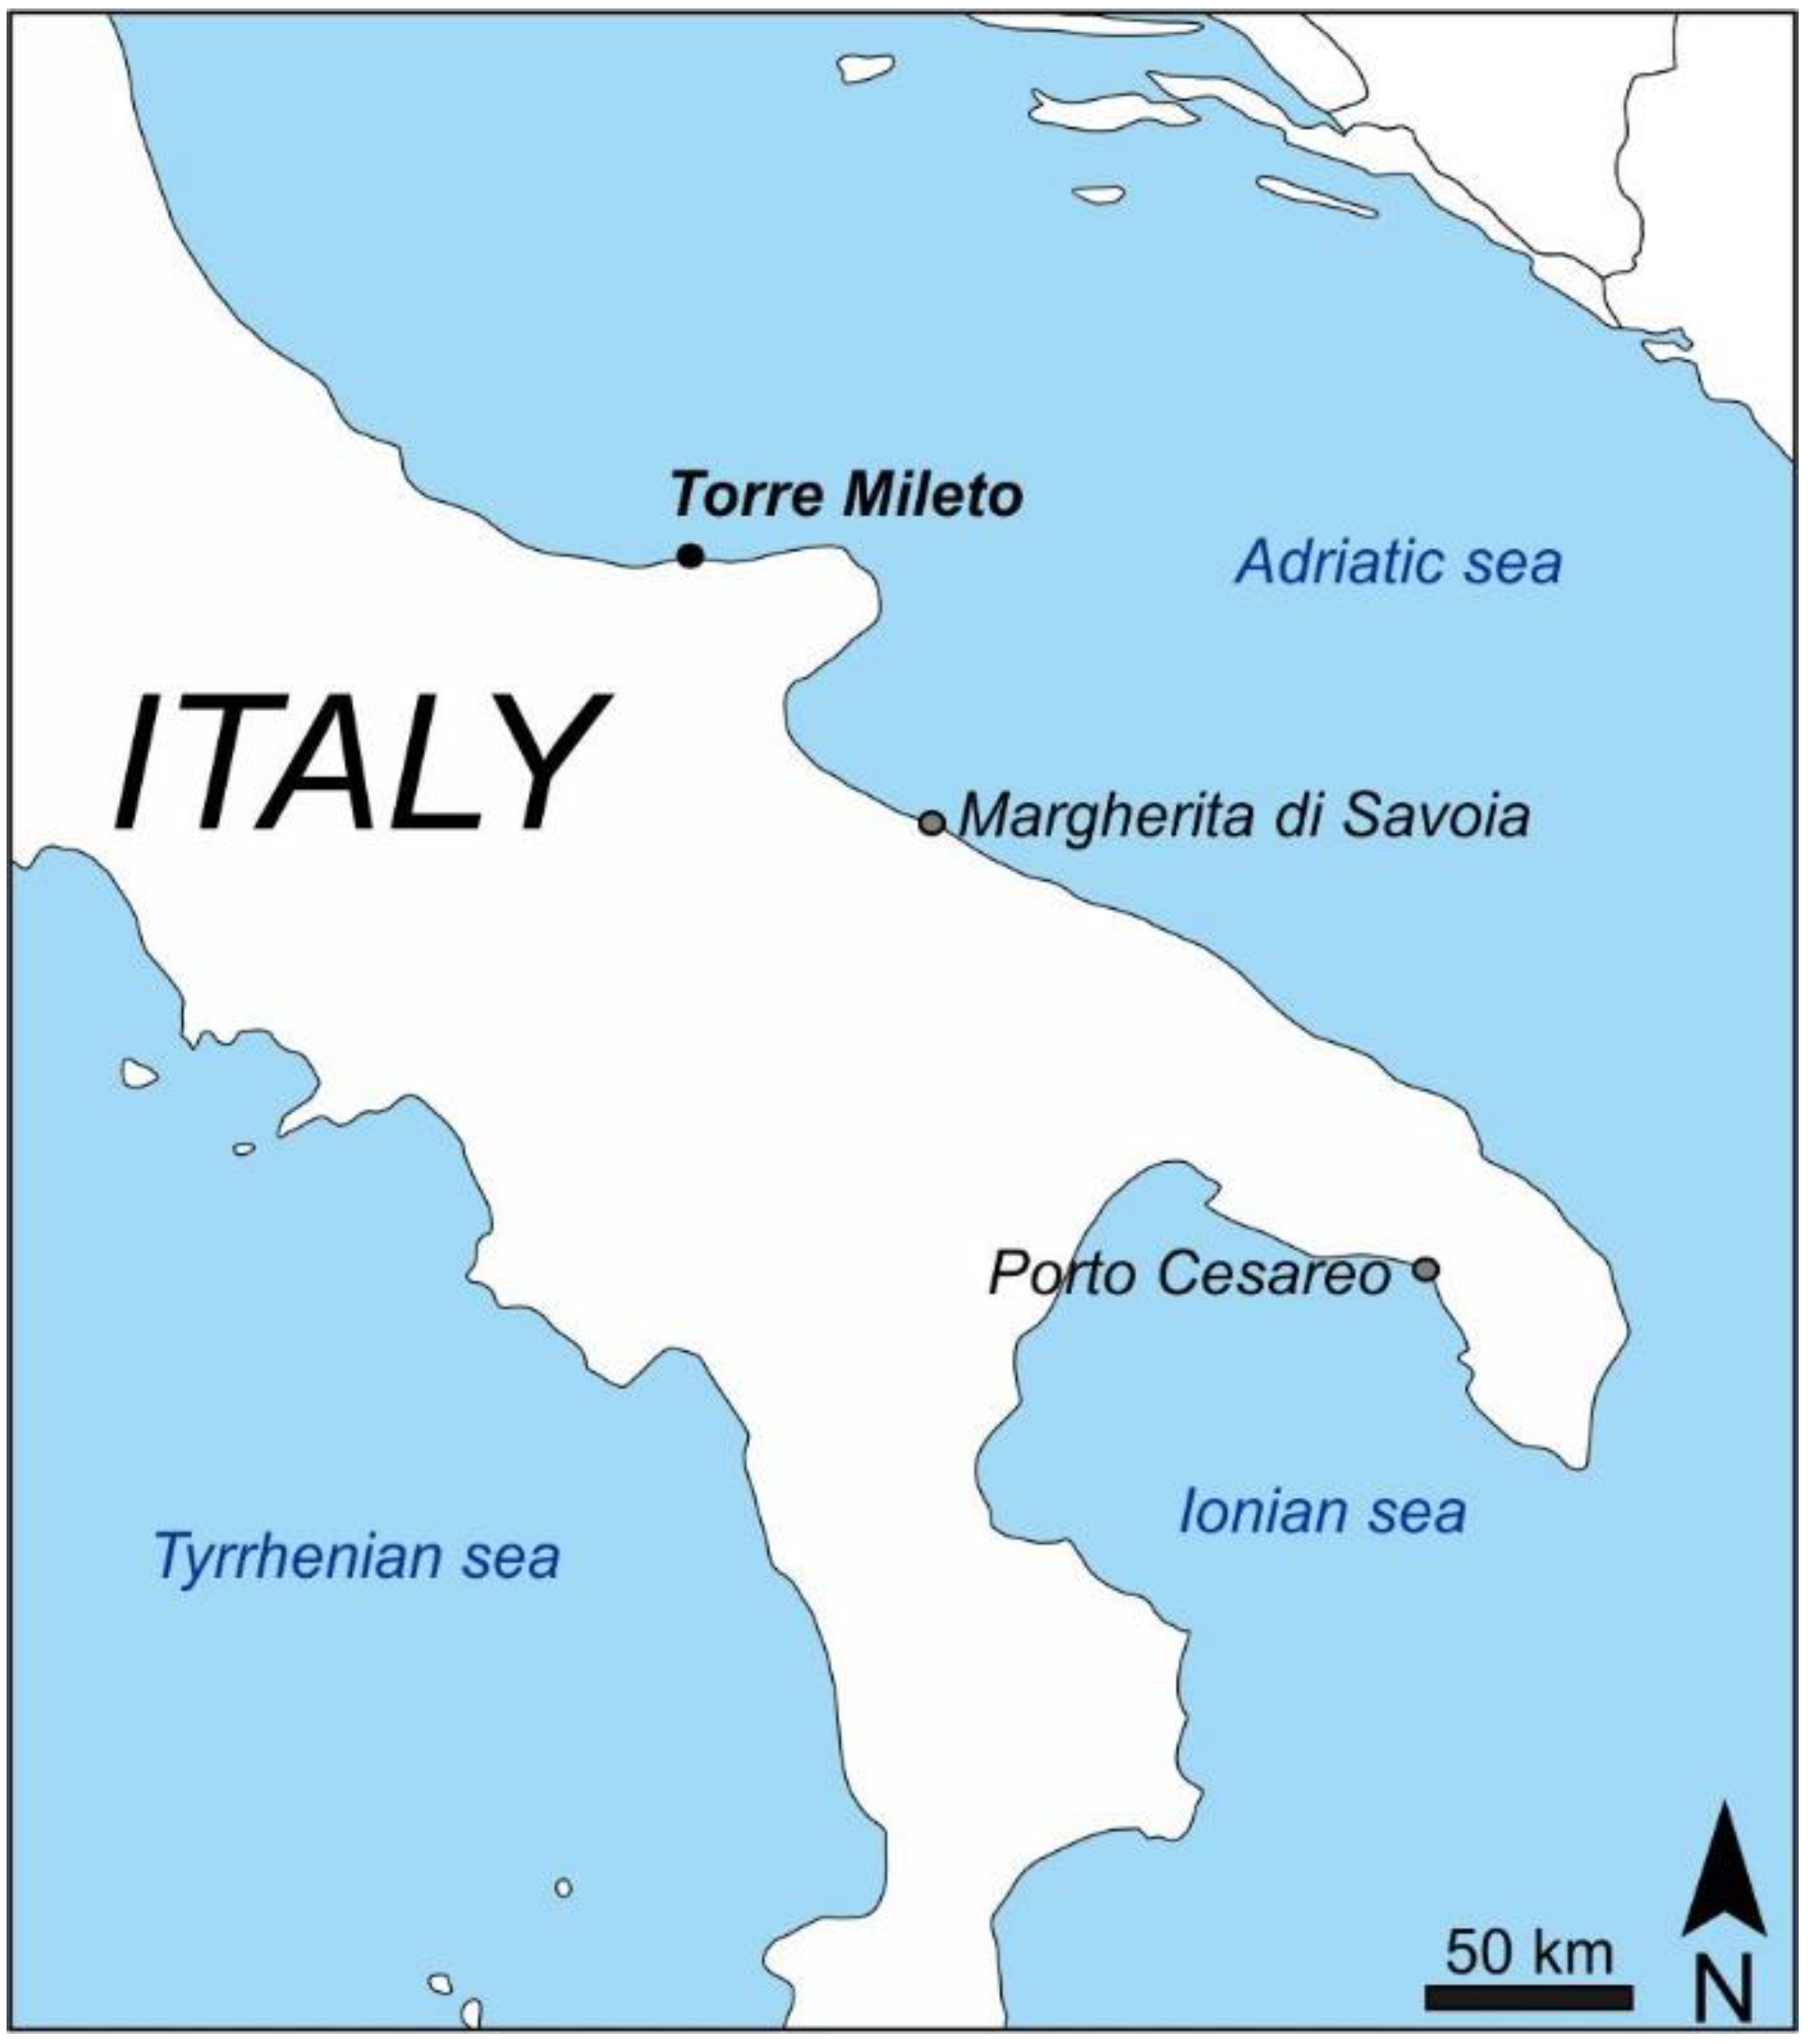
Figure 1. Sampling area. At Torre Mileto, reef fragments and incoherent sands were sampled. In Margherita di Savoia and Porto Cesareo, the sands were collected to carry out the experiments.
Jmse 11 00204 g001
Figure 2. (A) Non-scale diagram of the test tank. The flow of suspended sediment (Sf) on the sample was guaranteed by a device consisting of an aerator (A) fixed by two suction cups (S) and a filter inserted in the sand box (Sb). A constant supply of particles was obtained for a very long time (a few hours). The fragment of the reef (Rf) was raised a few centimeters from the bottom and held in a fixed position (Rfb) to avoid interaction from below. (B) The configuration of the single test tank.
Jmse 11 00204 g002
Figure 3. Grain size and compositional features of the sand used in the two-phase experiment. The cumulative curves show the granulometric range of the three kinds of sands for the first (continue lines) and second (dotted lines) phases. Note that the sands of the second phase were slightly coarser than those of the first phase. Bottom left: the composition of the sands used in both phases. They fell in the distinct fields of the Zuffa classification [32,33].
Jmse 11 00204 g003
Figure 4. Scheme of the experimental tanks (1, 2, and 3) in which different sands were used. Each tank was divided into three sectors (e.g., tank 1 is divided into sectors 1.1, 1.2, and 1.3). Each sector contained three biological replicas represented by three reef fragments. For each tank, it was therefore possible to have nine replicas for each test.
Jmse 11 00204 g004
Figure 5. Observation of polychaete activity by using videos and direct measurements at the end of the tests. (a) Acquisition of photos and videos during the activity of the polychaetes. (b) First shot pictures with the transparent graph paper used as a reference scale. (c) Second shot focused on the three replicas of each tank. (d) Example of the growth of the tubes measured at the end of the experiments. Note that tube growth occurred on top of the reef fragment (red arrows) and in the lateral sectors of this biological replica (white arrows).
Jmse 11 00204 g005
Figure 6. (a) Examples of reef growth during the two experimental phases (using different grain size sands). For each phase, the pre- (left) and post- (right) test morphologies of the biological replicas are shown for the three tanks containing sand of different compositions. Each example indicates the tank number (1, 2, or 3) and the moment of the photo (t0 = first day and t30 = last day of the test). Note how the photos taken before and after the tests clearly show the growth of biological replicas only in the first phase of the experiment. On the contrary, in the second phase (using coarser sands), the growths were very low, even if they were locally measurable (see the white arrow in the second-phase tank 2—t30). (b) After the experiments, tube growths in all biological replicas were measured manually. In the macro-photo, the growth of the tubes in the laboratory (using the bioclastic sands—BS) on the natural tubes (consisting of calcilithic sands (CS)) during the first phase of the experiment (tank 3—t30) is shown.
Jmse 11 00204 g006
Figure 7. Summary of tube growth during the experiment: the average and maximum values measured in the first and second phases in each tank are shown. Below, the statistical distribution of the measured growths during the first phase in the different tanks (1, 2, and 3) is reported. Box plots show the variability and distribution of the data; the average values for each tank are represented by the black lines, and the colored dots represent the extreme values measured in each tank.
Jmse 11 00204 g007
Figure 8. Details of the tube growth in the test tanks during phase I, in thin section. (a) Test tank 2. Thin section cut parallel to the tube growth (plane-polarized light and crossed-polarized photos). A white dotted line separates the natural tube from the sector growths during the test. In the tank, the worm captured the siliciclastic sands (SS) of Margherita di Savoia, building its tube in continuity with the natural tube sampled in the reef of Torre Mileto (calcilithic sand (CS)). Note the abundance of magnetite (always black in plane-polarized light and crossed-polarized photos) and pyroxene minerals in the upper part of the tube, grown in the laboratory. (b) Test tank 2. Thin section cut perpendicular to the tube growth (crossed-polarized photo). The circular structure of the tube was formed only by siliciclastic minerals. The most elongated grains were arranged tangentially to the circular vacuum occupied by the worm. The area between adjacent tubes (intertube) was filled by sand not directly selected by the worm. (c) Test tank 3. Thin section cut parallel to the tube growth (plane-polarized light photo). A white dotted line separates the natural tube sand (CS) from the bioclastic sand (Porto Cesareo BS) captured by the worm during the test. Note the presence of lithoclasts and quartz only in the basal/natural part of the tube (CS). (d,e) Test tank 3. Thin sections cut perpendicular to the tube growth (plane-polarized light photo) of both the basal/natural part of the tube (CS; d) and the upper sector of the tubes grown in the laboratory (BS; e). Note that the structure of the tube (geometry and thickness) and the grain size/arrangement of the sands are very similar. In (d) is also visible the intertube area in conditions of natural growth, which is similar to the intertube area shown in (b) (for tubes grown in the laboratory). The yellow scale bar indicates 500 μm.
Jmse 11 00204 g008
Figure 9. Image results obtained by microtomograph analysis of a tube grown in tanks 2 and 3. (a) A 3D view of the tubes set grown in tank 2 using the siliciclastic sand (SS). The grains of magnetite and pyroxene are highlighted by a brilliant white color. They formed tubes as a continuation of pre-existing tubes (Calcilithic sand (CS)) or by the accretion of new tubes. The SS also filled the intertube areas (it). (b) Projection image. The orange dotted line indicates the moment in which the test started. Lines 1 and 2 indicate cross-sections of the tubes grown in a natural environment, and lines 3 and 4 indicate cross-sections of the tubes developed in the tank; note the evident variation in the density of the grains (denser sands are dark grey). (c) In tank 3 (bioclastic sand (BS)), the start of the test coincided with an abrupt change in the diameter of the tube. In addition, grain size increased in the upper portion of the tube, while the void containing the worm showed a constant diameter. The thickness of the portion grown in the laboratory was clearly increased.
Jmse 11 00204 g009
Disclaimer/Publisher’s Note: The statements, opinions and data contained in all publications are solely those of the individual author(s) and contributor(s) and not of MDPI and/or the editor(s). MDPI and/or the editor(s) disclaim responsibility for any injury to people or property resulting from any ideas, methods, instructions or products referred to in the content.