Next Issue
Volume 9, December
Previous Issue
Volume 9, October
 
 
remotesensing-logo

Journal Browser

Journal Browser

Remote Sens., Volume 9, Issue 11 (November 2017) – 119 articles

Cover Story (view full-size image): 
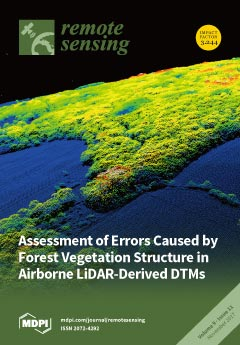
This paper was written as part of a PhD project aiming to improve greenhouse gas emissions estimates from peatland fires in Indonesia. While measuring peatland depth of burn for a previous paper, it was noted that digital terrain models (DTMs) produced from LiDAR were showing unexpected values before the fire burned the vegetation. The effects of vegetation structure were tested on LiDAR-derived DTM accuracy in a UK forest during winter when there are no leaves to block ground survey equipment (i.e., similar to post-burn forests). Over 650 ground control points were used to create a reference DTM to compare two LiDAR-derived DTMs in leaf-on and leaf-off conditions. The LiDAR point cloud was used to characterise the overlying vegetation structure, revealing that leaf-on vegetation and, in particular, dense ground-cover vegetation causes the greatest DTM errors. View the paper
  • Issues are regarded as officially published after their release is announced to the table of contents alert mailing list.
  • You may sign up for e-mail alerts to receive table of contents of newly released issues.
  • PDF is the official format for papers published in both, html and pdf forms. To view the papers in pdf format, click on the "PDF Full-text" link, and use the free Adobe Reader to open them.
Order results
Result details
Section
Select all
Export citation of selected articles as:
24 pages, 13049 KiB  
Article
Satellite Monitoring of Urban Land Change in the Middle Yangtze River Basin Urban Agglomeration, China between 2000 and 2016
by Dandan Liu 1 and Nengcheng Chen 1,2,*
1 State Key Laboratory of Information Engineering in Surveying, Mapping, and Remote Sensing, Wuhan University, 129 Luoyu Road, Wuhan 430079, China
2 Collaborative Innovation Center of Geospatial Technology, Wuhan University, 129 Luoyu Road, Wuhan 430079, China
Remote Sens. 2017, 9(11), 1086; https://doi.org/10.3390/rs9111086 - 25 Oct 2017
Cited by 20 | Viewed by 6400
Abstract
Detailed studies on the spatiotemporal patterns of urban agglomeration in the Middle Yangtze River Basin (MYRB) are rare. This paper analyzed the spatiotemporal patterns of urbanization in the MYRB using multi-temporal remote sensing data circa 2000, 2008 and 2016 integrated with geographic information [...] Read more.
Detailed studies on the spatiotemporal patterns of urban agglomeration in the Middle Yangtze River Basin (MYRB) are rare. This paper analyzed the spatiotemporal patterns of urbanization in the MYRB using multi-temporal remote sensing data circa 2000, 2008 and 2016 integrated with geographic information system (GIS) techniques and landscape analysis approaches. A multi-level analysis of the rate and intensity, type as well as the landscape changes of urban expansion at regional, prefectural and inner-city levels was performed. Results show that the MYRB experienced rapid urban expansion with an annual expansion rate of 3.199%, especially in the Chang-Zhu-Tan and Poyang Lake metropolitan areas. The small and medium cities presented faster urban expansion than the larger cities with annual growth rates three times the average level. Urban expansion within the three capital cities was further analyzed in detail. It is found that outlying expansion and edge-expansion were the dominant growth patterns at all the three levels. Although urbanization in the MYRB has a remarkable increase in the past sixteen years, its annual growth rate of urban land expansion has fallen behind the three other large urban agglomerations in China as a result. Finally, the spatial evolution of the socioeconomic structure of the MYRB was further explored. It indicated that urban land was distributed mainly along the “northwest-southeast” direction and that the economic spatial interactions among cities showed a pattern of “multi-polarization and fragmentation”, which illustrates the weak radiative driving forces of the central cities. The MYRB urban agglomeration faces a great challenge to manage trades-offs between narrowing the intra-regional disparity and maintaining synergetic development among cities. Full article
Show Figures

Graphical abstract

11 pages, 2361 KiB  
Letter
Non-Cooperative Bistatic SAR Clock Drift Compensation for Tomographic Acquisitions
by Mario Azcueta 1,2,* and Stefano Tebaldini 1
1 Department of Electronics, Information and Bioengineering, Politecnico di Milano, 20133 Milano, Italy
2 Comisión Nacional de Actividades Espaciales, 1063 Buenos Aires, Argentina
Remote Sens. 2017, 9(11), 1087; https://doi.org/10.3390/rs9111087 - 25 Oct 2017
Cited by 12 | Viewed by 4859
Abstract
In the last years, an important amount of research has been headed towards the measurement of above-ground forest biomass with polarimetric Synthetic Aperture Radar (SAR) tomography techniques. This has motivated the proposal of future bistatic SAR missions, like the recent non-cooperative SAOCOM-CS and [...] Read more.
In the last years, an important amount of research has been headed towards the measurement of above-ground forest biomass with polarimetric Synthetic Aperture Radar (SAR) tomography techniques. This has motivated the proposal of future bistatic SAR missions, like the recent non-cooperative SAOCOM-CS and PARSIFAL from CONAE and ESA. It is well known that the quality of SAR tomography is directly related to the phase accuracy of the interferometer that, in the case of non-cooperative systems, can be particularly affected by the relative drift between onboard clocks. In this letter, we provide insight on the impact of the clock drift error on bistatic interferometry, as well as propose a correction algorithm to compensate its effect. The accuracy of the compensation is tested on simulated acquisitions over volumetric targets, estimating the final impact on tomographic profiles. Full article
(This article belongs to the Special Issue Recent Advances in Polarimetric SAR Interferometry)
Show Figures

Figure 1

20 pages, 17382 KiB  
Article
Assessment of RISAT-1 and Radarsat-2 for Sea Ice Observations from a Hybrid-Polarity Perspective
by Martine M. Espeseth *, Camilla Brekke and A. Malin Johansson
Department of Physics and Technology, UiT The Arctic University of Norway, 9019 Tromsø, Norway
Remote Sens. 2017, 9(11), 1088; https://doi.org/10.3390/rs9111088 - 25 Oct 2017
Cited by 21 | Viewed by 6964
Abstract
Utilizing several Synthetic Aperture Radar (SAR) missions will provide a data set with higher temporal resolution. It is of great importance to understand the difference between various available sensors and polarization modes and to consider how to homogenize the data sets for a [...] Read more.
Utilizing several Synthetic Aperture Radar (SAR) missions will provide a data set with higher temporal resolution. It is of great importance to understand the difference between various available sensors and polarization modes and to consider how to homogenize the data sets for a following combined analysis. In this study, a uniform and consistent analysis across different SAR missions is carried out. Three pairs of overlapping hybrid- and full-polarimetric C-band SAR scenes from the Radar Imaging Satellite-1 (RISAT-1) and Radarsat-2 satellites are used. The overlapping Radarsat-2 and RISAT-1 scenes are taken close in time, with a relatively similar incidence angle covering sea ice in the Fram Strait and Northeast Greenland in September 2015. The main objective of this study is to identify the similarities and dissimilarities between a simulated and a real hybrid-polarity (HP) SAR system. The similarities and dissimilarities between the two sensors are evaluated using 13 HP features. The results indicate a similar separability between the sea ice types identified within the real HP system in RISAT-1 and the simulated HP system from Radarsat-2. The HP features that are sensitive to surface scattering and depolarization due to volume scattering showed great potential for separating various sea ice types. A subset of features (the second parameter in the Stokes vector, the ratio between the HP intensity coefficients, and the α s angle) were affected by the non-circularity property of the transmitted wave in the simulated HP system across all the scene pairs. Overall, the best features, showing high separability between various sea ice types and which are invariant to the non-circularity property of the transmitted wave, are the intensity coefficients from the right-hand circular transmit and the linear horizontal receive channel and the right-hand circular on both the transmit and the receive channel, and the first parameter in the Stokes vector. Full article
(This article belongs to the Special Issue Recent Advances in Polarimetric SAR Interferometry)
Show Figures

Graphical abstract

19 pages, 3981 KiB  
Article
Submesoscale Sea Surface Temperature Variability from UAV and Satellite Measurements
by Sandra L. Castro 1,*, William J. Emery 1, Gary A. Wick 2 and William Tandy 3
1 Colorado Center for Astrodynamics Research, University of Colorado, 431 UCB, Boulder, CO 80309, USA
2 NOAA Earth System Research Laboratory, Physical Sciences Division, R/PSD2 325 Broadway, Boulder, CO 80305, USA
3 Ball Aerospace, 1600 Commerce St., Boulder, CO 80301, USA
Remote Sens. 2017, 9(11), 1089; https://doi.org/10.3390/rs9111089 - 25 Oct 2017
Cited by 33 | Viewed by 6932
Abstract
Earlier studies of spatial variability in sea surface temperature (SST) using ship-based radiometric data suggested that variability at scales smaller than 1 km is significant and affects the perceived uncertainty of satellite-derived SSTs. Here, we compare data from the Ball Experimental Sea Surface [...] Read more.
Earlier studies of spatial variability in sea surface temperature (SST) using ship-based radiometric data suggested that variability at scales smaller than 1 km is significant and affects the perceived uncertainty of satellite-derived SSTs. Here, we compare data from the Ball Experimental Sea Surface Temperature (BESST) thermal infrared radiometer flown over the Arctic Ocean against coincident Moderate Resolution Imaging Spectroradiometer (MODIS) measurements to assess the spatial variability of skin SSTs within 1-km pixels. By taking the standard deviation, σ, of the BESST measurements within individual MODIS pixels, we show that significant spatial variability of the skin temperature exists. The distribution of the surface variability measured by BESST shows a peak value of O(0.1) K, with 95% of the pixels showing σ < 0.45 K. Significantly, high-variability pixels are located at density fronts in the marginal ice zone, which are a primary source of submesoscale intermittency near the surface. SST wavenumber spectra indicate a spectral slope of −2, which is consistent with the presence of submesoscale processes at the ocean surface. Furthermore, the BESST wavenumber spectra not only match the energy distribution of MODIS SST spectra at the satellite-resolved wavelengths, they also span the spectral slope of −2 by ~3 decades, from wavelengths of 8 km to <0.08 km. Full article
(This article belongs to the Special Issue Sea Surface Temperature Retrievals from Remote Sensing)
Show Figures

Graphical abstract

16 pages, 5147 KiB  
Article
Terrestrial Laser Scanning Intensity Correction by Piecewise Fitting and Overlap-Driven Adjustment
by Teng Xu 1, Lijun Xu 1, Bingwei Yang 1, Xiaolu Li 1,* and Junen Yao 2
1 State Key Laboratory of Inertial Science and Technology, School of Instrument Science and Opto-Electronic Engineering, Beihang University, Beijing 100191, China
2 Key Laboratory of Micro-nano Measurement-Manipulation and Physics of Ministry of Education, School of Physics and Nuclear Energy Engineering, Beihang University, Beijing 100191, China
Remote Sens. 2017, 9(11), 1090; https://doi.org/10.3390/rs9111090 - 25 Oct 2017
Cited by 45 | Viewed by 6866
Abstract
Terrestrial laser scanning sensors deliver not only three-dimensional geometric information of the scanned objects but also the intensity data of returned laser pulse. Recent studies have demonstrated potential applications of intensity data from Terrestrial Laser Scanning (TLS). However, the distance and incident angle [...] Read more.
Terrestrial laser scanning sensors deliver not only three-dimensional geometric information of the scanned objects but also the intensity data of returned laser pulse. Recent studies have demonstrated potential applications of intensity data from Terrestrial Laser Scanning (TLS). However, the distance and incident angle effects distort the TLS raw intensity data. To overcome the distortions, a new intensity correction method by combining the piecewise fitting and overlap-driven adjustment approaches was proposed in this study. The distance effect is eliminated by the piecewise fitting approach. The incident angle effect is eliminated by overlap-driven adjustment using the Oren–Nayar model that employs the surface roughness parameter of the scanned object. The surface roughness parameter at a certain point in an overlapped region of the multi-station scans is estimated by using the raw intensity data from two different stations at the point rather than estimated by averaging the surface roughness at other positions for each kind of object, which eliminates the estimation deviation. Experimental results obtained by using a TLS sensor (Riegl VZ-400i) demonstrate that the proposed method is valid and the deviations of the retrieved reflectance values from those measured by a spectrometer are all less than 3%. Full article
Show Figures

Graphical abstract

19 pages, 3461 KiB  
Article
Robinia pseudoacacia L. Flower Analyzed by Using An Unmanned Aerial Vehicle (UAV)
by Christin Carl 1,2,*, Dirk Landgraf 2, Marieke Van der Maaten-Theunissen 3, Peter Biber 1 and Hans Pretzsch 1
1 Forest Growth and Yield Science, School of Life Sciences Weihenstephan, Technische Universität München, Hans-Carl-von-Carlowitz-Platz 2, 85354 Freising, Germany
2 Forestry and Ecosystem Management, University of Applied Science Erfurt, Leipziger Straße 77, 99085 Erfurt, Germany
3 Institute of Botany and Landscape Ecology, University of Greifswald, Soldmannstrasse 15, 17489 Greifswald, Germany
Remote Sens. 2017, 9(11), 1091; https://doi.org/10.3390/rs9111091 - 26 Oct 2017
Cited by 37 | Viewed by 7521
Abstract
Tree flowers are important for flower–insect relationships, seeds, fruits, and honey production. Flowers are difficult to analyze, particularly in complex ecosystems such as forests. However, unmanned aerial vehicles (UAVs) enable detailed analyses with high spatial resolution, and avoid destruction of sensitive ecosystems. In [...] Read more.
Tree flowers are important for flower–insect relationships, seeds, fruits, and honey production. Flowers are difficult to analyze, particularly in complex ecosystems such as forests. However, unmanned aerial vehicles (UAVs) enable detailed analyses with high spatial resolution, and avoid destruction of sensitive ecosystems. In this study, we hypothesize that UAVs can be used to estimate the number of existing flowers, the quantity of nectar, and habitat potential for honeybees (Apis mellifera). To test this idea, in 2017 we combined UAV image analysis with manual counting and weighing of the flowers of eight-year-old black locust (Robinia pseudoacacia L.) trees to calculate the number of flowers, their surface area, and their volume. Estimates of flower surface area ranged from 2.97 to 0.03% as the flying altitude above the crowns increased from 2.6 m to 92.6 m. Second, for the horizontal analysis, a 133 m2 flower area at a one-hectare black locust plantation was monitored in 2017 by a UAV. Flower numbers ranged from 1913 to 15,559 per tree with an average surface area of 1.92 cm2 and average volume of 5.96 cm3. The UAV monitored 11% of the total surface and 3% of the total volume. Consequently, at the one-hectare black locust study area we estimate 5.3 million flowers (69 kg honey), which is sufficient for one bee hive to survive for one year. Full article
(This article belongs to the Section Forest Remote Sensing)
Show Figures

Figure 1

23 pages, 2382 KiB  
Article
An Automatic Accurate High-Resolution Satellite Image Retrieval Method
by Zhiwei Fan 1,†, Wen Zhang 1,†, Dongying Zhang 2 and Lingkui Meng 1,*
1 School of Remote Sensing and Information Engineering, Wuhan University, Wuhan 430079, China
2 School of Water Conservancy & Environment, Zhengzhou University, Zhengzhou 450001, China
These authors contributed equally to the work.
Remote Sens. 2017, 9(11), 1092; https://doi.org/10.3390/rs9111092 - 26 Oct 2017
Cited by 8 | Viewed by 5546
Abstract
With the growing number of high-resolution satellite images, the traditional image retrieval method has become a bottleneck in the massive application of high-resolution satellite images because of the low degree of automation. However, there are few studies on the automation of satellite image [...] Read more.
With the growing number of high-resolution satellite images, the traditional image retrieval method has become a bottleneck in the massive application of high-resolution satellite images because of the low degree of automation. However, there are few studies on the automation of satellite image retrieval. This paper presents an automatic high-resolution satellite image accurate retrieval method based on effective coverage (EC) information, which is used to replace the artificial screening stage in traditional satellite image retrieval tasks. In this method, first, we use a convolutional neural network to extract the EC of each satellite image; then, we use an effective coverage grid set (ECGS) to represent the ECs of all satellite images in the library; finally, the satellite image accurate retrieval algorithm is proposed to complete the process of screening images. The performance evaluation of the method is implemented in three regions: Wuhan, Yanling, and Tangjiashan Lake. The large number of experiments shows that our proposed method can automatically retrieve high-resolution satellite images and significantly improve efficiency. Full article
(This article belongs to the Section Remote Sensing Image Processing)
Show Figures

Graphical abstract

20 pages, 16044 KiB  
Article
A GIS-Based Procedure for Landslide Intensity Evaluation and Specific risk Analysis Supported by Persistent Scatterers Interferometry (PSI)
by Silvia Bianchini *, Lorenzo Solari and Nicola Casagli
Earth Sciences Department, University of Firenze, Via La Pira 4, I-50121 Firenze, Italy
Remote Sens. 2017, 9(11), 1093; https://doi.org/10.3390/rs9111093 - 26 Oct 2017
Cited by 25 | Viewed by 7429
Abstract
The evaluation of landslide specific risk, defined as the expected degree of loss due to landslides, requires the parameterization and the combination of a number of socio-economic and geological factors, which often needs the interaction of different skills and expertise (geologists, engineers, planners, [...] Read more.
The evaluation of landslide specific risk, defined as the expected degree of loss due to landslides, requires the parameterization and the combination of a number of socio-economic and geological factors, which often needs the interaction of different skills and expertise (geologists, engineers, planners, administrators, etc.). The specific risk sub-components, i.e., hazard and vulnerability of elements at risk, can be determined with different levels of detail depending on the available auxiliary data and knowledge of the territory. These risk factors are subject to short-term variations and nowadays turn out to be easily mappable and evaluable through remotely sensed data and GIS (Geographic Information System) tools. In this work, we propose a qualitative approach at municipal scale for producing a “specific risk” map, supported by recent satellite PSI (Persistent Scatterer Interferometry) data derived from SENTINEL-1 C-band images in the spanning time 2014–2017, implemented in a GIS environment. In particular, PSI measurements are useful for the updating of a landslide inventory map of the area of interest and are exploited for the zonation map of the intensity of ground movements, needed for evaluating the vulnerability over the study area. Our procedure is presented throughout the application to the Volterra basin and the output map could be useful to support the local authorities with updated basic information required for environmental knowledge and planning at municipal level. Moreover, the proposed procedure is easily managed and repeatable in other case studies, as well as exploiting different SAR sensors in L- or X-band. Full article
Show Figures

Figure 1

20 pages, 2853 KiB  
Article
Hashing Based Hierarchical Feature Representation for Hyperspectral Imagery Classification
by Bin Pan 1,2,3, Zhenwei Shi 1,2,3,*, Xia Xu 1,2,3 and Yi Yang 4
1 Image Processing Center, School of Astronautics, Beihang University, Beijing 100191, China
2 Beijing Key Laboratory of Digital Media, Beihang University, Beijing 100191, China
3 State Key Laboratory of Virtual Reality Technology and Systems, School of Astronautics, Beihang University, Beijing 100191, China
4 Mathematics Department, Mellon College of Science, Carnegie Mellon University, Pittsburgh, PA 15213, USA
Remote Sens. 2017, 9(11), 1094; https://doi.org/10.3390/rs9111094 - 27 Oct 2017
Cited by 4 | Viewed by 4955
Abstract
Integrating spectral and spatial information is proved effective in improving the accuracy of hyperspectral imagery classification. In recent studies, two kinds of approaches are widely investigated: (1) developing a multiple feature fusion (MFF) strategy; and (2) designing a powerful spectral-spatial feature extraction (FE) [...] Read more.
Integrating spectral and spatial information is proved effective in improving the accuracy of hyperspectral imagery classification. In recent studies, two kinds of approaches are widely investigated: (1) developing a multiple feature fusion (MFF) strategy; and (2) designing a powerful spectral-spatial feature extraction (FE) algorithm. In this paper, we combine the advantages of MFF and FE, and propose an ensemble based feature representation method for hyperspectral imagery classification, which aims at generating a hierarchical feature representation for the original hyperspectral data. The proposed method is composed of three cascaded layers: firstly, multiple features, including local, global and spectral, are extracted from the hyperspectral data. Next, a new hashing based feature representation method is proposed and conducted on the features obtained in the first layer. Finally, a simple but efficient extreme learning machine classifier is employed to get the classification results. To some extent, the proposed method is a combination of MFF and FE: instead of feature fusion or single feature extraction, we use an ensemble strategy to provide a hierarchical feature representation for the hyperspectral data. In the experiments, we select two popular and one challenging hyperspectral data sets for evaluation, and six recently proposed methods are compared. The proposed method achieves respectively 89.55%, 99.36% and 77.90% overall accuracies in the three data sets with 20 training samples per class. The results prove that the performance of the proposed method is superior to some MFF and FE based ones. Full article
(This article belongs to the Special Issue Hyperspectral Imaging and Applications)
Show Figures

Graphical abstract

17 pages, 984 KiB  
Article
The Aerosol Index and Land Cover Class Based Atmospheric Correction Aerosol Optical Depth Time Series 1982–2014 for the SMAC Algorithm
by Emmihenna Jääskeläinen *, Terhikki Manninen, Johanna Tamminen and Marko Laine
Finnish Meteorological Institute, Erik Palménin aukio 1, 00560 Helsinki, Finland
Remote Sens. 2017, 9(11), 1095; https://doi.org/10.3390/rs9111095 - 27 Oct 2017
Cited by 10 | Viewed by 4706
Abstract
Atmospheric effects, especially aerosols, are a significant source of uncertainty for optical remote sensing of surface parameters, such as albedo. Also to achieve a homogeneous surface albedo time series, the atmospheric correction has to be homogeneous. However, a global homogeneous aerosol optical depth [...] Read more.
Atmospheric effects, especially aerosols, are a significant source of uncertainty for optical remote sensing of surface parameters, such as albedo. Also to achieve a homogeneous surface albedo time series, the atmospheric correction has to be homogeneous. However, a global homogeneous aerosol optical depth (AOD) time series covering several decades did not previously exist. Therefore, we have constructed an AOD time series 1982–2014 using aerosol index (AI) data from the satellite measurements of the Total Ozone Mapping Spectrometer (TOMS) and the Ozone Monitoring Instrument (OMI), together with the Solar zenith angle and land use classification data. It is used as input for the Simplified Method for Atmospheric Correction (SMAC) algorithm when processing the surface albedo time series CLARA-A2 SAL (the Surface ALbedo from the Satellite Application Facility on Climate Monitoring project cLoud, Albedo and RAdiation data record, the second release). The surface reflectance simulations using the SMAC algorithm for different sets of satellite-based AOD data show that the aerosol-effect correction using the constructed TOMS/OMI based AOD data is comparable to using other satellite-based AOD data available for a shorter time range. Moreover, using the constructed TOMS/OMI based AOD as input for the atmospheric correction typically produces surface reflectance [-20]values closer to those obtained using in situ AOD values than when using other satellite-based AOD data. Full article
(This article belongs to the Special Issue Atmospheric Correction of Remote Sensing Data)
Show Figures

Graphical abstract

12 pages, 1900 KiB  
Article
Species Richness (of Insects) Drives the Use of Acoustic Space in the Tropics
by T. Mitchell Aide 1,2,*, Andres Hernández-Serna 1, Marconi Campos-Cerqueira 1,2, Orlando Acevedo-Charry 1,2 and Jessica L. Deichmann 3
1 Department of Biology, University of Puerto Rico, San Juan 00931-3360, Puerto Rico
2 Sieve Analytics Inc., San Juan 00911, Puerto Rico
3 Center for Conservation and Sustainability, Smithsonian Conservation Biology Institute, National Zoological Park, 1100 Jefferson Drive SW, MRC 705, Washington, DC 20013, USA
Remote Sens. 2017, 9(11), 1096; https://doi.org/10.3390/rs9111096 - 27 Oct 2017
Cited by 82 | Viewed by 13645
Abstract
Acoustic ecology, or ecoacoustics, is a growing field that uses sound as a tool to evaluate animal communities. In this manuscript, we evaluate recordings from eight tropical forest sites that vary in species richness, from a relatively low diversity Caribbean forest to a [...] Read more.
Acoustic ecology, or ecoacoustics, is a growing field that uses sound as a tool to evaluate animal communities. In this manuscript, we evaluate recordings from eight tropical forest sites that vary in species richness, from a relatively low diversity Caribbean forest to a megadiverse Amazonian forest, with the goal of understanding the relationship between acoustic space use (ASU) and species diversity across different taxonomic groups. For each site, we determined the acoustic morphospecies richness and composition of the biophony, and we used a global biodiversity dataset to estimate the regional richness of birds. Here, we demonstrate how detailed information on activity patterns of the acoustic community (<22 kHz) can easily be visualized and ASU determined by aggregating recordings collected over relatively short periods (4–13 days). We show a strong positive relationship between ASU and regional and acoustic morphospecies richness. Premontane forest sites had the highest ASU and the highest species richness, while dry forest and montane sites had lower ASU and lower species richness. Furthermore, we show that insect richness was the best predictor of variation in total ASU, and that insect richness was proportionally greater at high-diversity sites. In addition, insects used a broad range of frequencies, including high frequencies (>8000 Hz), which contributed to greater ASU. This novel approach for analyzing the presence and acoustic activity of multiple taxonomic groups contributes to our understanding of ecological community dynamics and provides a useful tool for monitoring species in the context of restoration ecology, climate change and conservation biology. Full article
(This article belongs to the Special Issue Remote Sensing of Tropical Forest Biodiversity)
Show Figures

Graphical abstract

11 pages, 1376 KiB  
Article
Enhanced Resolution of Microwave Sounder Imagery through Fusion with Infrared Sensor Data
by Igor Yanovsky 1,2,*, Ali Behrangi 1, Yixin Wen 1, Mathias Schreier 1, Van Dang 3 and Bjorn Lambrigtsen 1
1 Jet Propulsion Laboratory, California Institute of Technology, Pasadena, CA 91109, USA
2 Joint Institute for Regional Earth System Science and Engineering, University of California, Los Angeles, CA 90095, USA
3 Remote Sensing Solutions Inc., Monrovia, CA 91016, USA
Remote Sens. 2017, 9(11), 1097; https://doi.org/10.3390/rs9111097 - 27 Oct 2017
Cited by 2 | Viewed by 4815
Abstract
The images acquired by microwave sensors are blurry and have low resolution. On the other hand, the images obtained using infrared/visible sensors are often of higher resolution. In this paper, we develop a data fusion methodology and apply it to enhance the resolution [...] Read more.
The images acquired by microwave sensors are blurry and have low resolution. On the other hand, the images obtained using infrared/visible sensors are often of higher resolution. In this paper, we develop a data fusion methodology and apply it to enhance the resolution of a microwave image using the data from a collocated infrared/visible sensor. Such an approach takes advantage of the spatial resolution of the infrared instrument and the sensing accuracy of the microwave instrument. The model leverages sparsity in signals and is based on current research in sparse optimization and compressed sensing. We tested our method using a precipitation scene captured with the Advanced Microwave Sounding Unit (AMSU-B) microwave instrument and the Advanced Very High Resolution Radiometer (AVHRR) infrared instrument and compared the results to simultaneous radar observations. We show that the data fusion product is better than the original AMSU-B and AVHRR observations across all statistical indicators. Full article
Show Figures

Graphical abstract

18 pages, 16711 KiB  
Article
Circa 2010 Land Cover of Canada: Local Optimization Methodology and Product Development
by Rasim Latifovic 1,*, Darren Pouliot 2 and Ian Olthof 1
1 Natural Resources Canada, Canadian Centre for Remote Sensing, 560 Rochester, Ottawa, ON K1A 0E4, Canada
2 Environment and Climate Change Canada, Landscape Science and Technology, Ontario, 1125 Colonel By Drive, Ottawa, ON K1S 5B6, Canada
Remote Sens. 2017, 9(11), 1098; https://doi.org/10.3390/rs9111098 - 27 Oct 2017
Cited by 92 | Viewed by 11138
Abstract
Land cover information is necessary for a large range of environmental applications related to climate impacts and adaption, emergency response, wildlife habitat, etc. In Canada, a 2008 user survey indicated that the most practical land cover data is provided in a nationwide 30 [...] Read more.
Land cover information is necessary for a large range of environmental applications related to climate impacts and adaption, emergency response, wildlife habitat, etc. In Canada, a 2008 user survey indicated that the most practical land cover data is provided in a nationwide 30 m spatial resolution format, with an update frequency of five years. In response to this need, the Canada Centre for Remote Sensing (CCRS) has generated a 30 m land cover map of Canada for the base year 2010, as the first of a planned series of maps to be updated every five years, or more frequently. This land cover dataset is also the Canadian contribution to the 30 m spatial resolution 2010 Land Cover Map of North America, which is produced by Mexican, American and Canadian government institutions under a collaboration called the North American Land Change Monitoring System (NALCMS). This paper describes the mapping approach used for generating this land cover dataset for Canada from Thematic Mapper (TM) and Enhanced Thematic Mapper (ETM+) Landsat sensor observations. The innovative part of the mapping approach is the local optimization of the land cover classifier, which has resulted in increased spatial consistency and accuracy. Training and classifying with locally confined reference samples over a large number of partially overlapping areas (i.e., moving windows) ensures the optimization of the classifier to a local land cover distribution, and decreases the negative effect of signature extension. A weighted combination of labels, which is determined by the classifier in overlapping windows, defines the final label for each pixel. Since the approach requires extensive computation, it has been developed and deployed using the Government of Canada’s High-Performance Computing Center (HPC). An accuracy assessment based on 2811 randomly distributed samples shows that land cover data produced with this new approach has achieved 76.60% accuracy with no marked spatial disparities. Full article
(This article belongs to the Special Issue GIS and Remote Sensing advances in Land Change Science)
Show Figures

Graphical abstract

19 pages, 1818 KiB  
Article
Linear Multi-Task Learning for Predicting Soil Properties Using Field Spectroscopy
by Haijun Qi 1,2, Tarin Paz-Kagan 3, Arnon Karnieli 2,* and Shaowen Li 1,*
1 School of Information and Computer Science, Anhui Agricultural University, Hefei 230036, China
2 The Remote Sensing Laboratory, Jacob Blaustein Institutes for Desert Research, Ben-Gurion University of the Negev, Sede Boqer Campus 84990, Israel
3 The Department of Sensing, Information and Mechanization Engineering, Institute of Agricultural Engineering, Agricultural Research Organization (ARO), Volcani Center, Rishon LeZion 7528809, Israel
Remote Sens. 2017, 9(11), 1099; https://doi.org/10.3390/rs9111099 - 30 Oct 2017
Cited by 19 | Viewed by 6979
Abstract
Field spectroscopy has been suggested to be an efficient method for predicting soil properties using quantitative mathematical models in a rapid and non-destructive manner. Traditional multivariate regression algorithms usually regard the modeling of each soil property as a single task, which means only [...] Read more.
Field spectroscopy has been suggested to be an efficient method for predicting soil properties using quantitative mathematical models in a rapid and non-destructive manner. Traditional multivariate regression algorithms usually regard the modeling of each soil property as a single task, which means only one response variable is considered as the output during modeling. Therefore, these algorithms are less suitable for the prediction of several key soil properties with low concentrations or unobvious spectral absorption signals. In the current study, we investigated the performance of a linear multi-task learning (LMTL) algorithm based on a regularized dirty model for modeling and predicting several key soil properties using field spectroscopy (350–2500 nm) as an integrated approach. We tested seven key soil properties including available nitrogen (N), phosphorus (P) and potassium (K), pH, water content (WC), organic matter (OM), and electrical conductivity (EC) in drylands. The model performances of LMTL models were compared with the commonly used single-task algorithm of the partial least squares regression (PLS-R). Our results show that the LMTL models outperformed the PLS-R models with the advantage of shared features; the ratio of performance to deviation (RPD) values in the validation set improved by 10.24%, 4.93%, 25.77%, 11.76%, 6.74%, 53.13%, and 3.15% for N, P, K, pH, WC, OM, and EC, respectively. The best prediction was obtained for OM with RPD = 2.29, indicating high accuracy (RPD > 2). The prediction results of N, P, WC, and pH were categorized as of moderate accuracy (1.4 < RPD < 2), while K and EC were categorized as of poor accuracy (RPD < 1.4). However, the explanatory power of the LMTL models was moderate due to fewer features being selected by the regularization algorithm of the LMTL approach, which should be further studied in the soil spectral analysis. Our results highlight the use of LMTL in field spectroscopy analysis that can improve the generalization performance of regression models for predicting soil properties. Full article
(This article belongs to the Special Issue Quantitative Remote Sensing of Land Surface Variables)
Show Figures

Figure 1

19 pages, 28991 KiB  
Article
Characterizing Drought and Flood Events over the Yangtze River Basin Using the HUST-Grace2016 Solution and Ancillary Data
by Hao Zhou 1,2,*, Zhicai Luo 1,3, Natthachet Tangdamrongsub 4, Lunche Wang 5, Lijie He 6, Chuang Xu 1 and Qiong Li 1
1 MOE Key Laboratory of Fundamental Physical Quantities Measurement, Hubei Key Laboratory of Gravitation and Quantum Physics, Institute of Geophysics, School of Physics, Huazhong University of Science and Technology, Wuhan 430074, China
2 State Key Laboratory of Geodesy and Earth’s Dynamics, Institute of Geodesy and Geophysics, Chinese Academy of Sciences, Wuhan 430077, China
3 Collaborative Innovation Center of Geospatial Technology, Wuhan University, Wuhan 430079, China
4 School of Engineering, University of Newcastle, Callaghan 2308, New South Wales, Australia
5 Department of Geography, School of Earth Sciences, China University of Geosciences, Wuhan 430074, China
6 School of Resource and Environmental Science, Wuhan University, Wuhan 430079, China
Remote Sens. 2017, 9(11), 1100; https://doi.org/10.3390/rs9111100 - 27 Oct 2017
Cited by 38 | Viewed by 7843
Abstract
Accurate terrestrial water storage (TWS) estimation is important to evaluate the situation of the water resources over the Yangtze River Basin (YRB). This study exploits the TWS observation from the new temporal gravity field model, HUST-Grace2016 (Huazhong University of Science and Technology), which [...] Read more.
Accurate terrestrial water storage (TWS) estimation is important to evaluate the situation of the water resources over the Yangtze River Basin (YRB). This study exploits the TWS observation from the new temporal gravity field model, HUST-Grace2016 (Huazhong University of Science and Technology), which is developed by a new low-frequency noise processing strategy. A novel GRACE (Gravity Recovery and Climate Experiment) post-processing approach is proposed to enhance the quality of the TWS estimate, and the improved TWS is used to characterize the drought and flood events over the YRB. The HUST-Grace2016-derived TWS presents good agreement with the CSR (Center for Space Research) mascon solution as well as the PCR-GLOBWB (PCRaster Global Water Balance) hydrological model. Particularly, our solution provides remarkable performance in identifying the extreme climate events e.g., flood and drought over the YRB and its sub-basins. The comparison between GRACE-derived TWS variations and the MODIS-derived (Moderate Resolution Imaging Spectroradiometer) inundated area variations is then conducted. The analysis demonstrates that the terrestrial reflectance data can provide an alternative way of cross-comparing and validating TWS information in Poyang Lake and Dongting Lake, with a correlation coefficient of 0.77 and 0.70, respectively. In contrast, the correlation is only 0.10 for Tai Lake, indicating the limitation of cross-comparison between MODIS and GRACE data. In addition, for the first time, the NCEP/NCAR (National Centers for Environmental Prediction/National Center for Atmospheric Research) vertical velocity data is incorporated with GRACE TWS in the exploration of the climate-induced hydrological activities. The good agreement between non-seasonal NCEP/NCAR vertical velocities and non-seasonal GRACE TWSs is found in flood years (2005, 2010, 2012 and 2016) and drought years (2006, 2011 and 2013). The evidence shown in this study may contribute to the analysis of the mechanism of climate impacts on the YRB. Full article
(This article belongs to the Special Issue Remote Sensing of Groundwater from River Basin to Global Scales)
Show Figures

Figure 1

18 pages, 7504 KiB  
Article
Assessment of Errors Caused by Forest Vegetation Structure in Airborne LiDAR-Derived DTMs
by Jake E. Simpson 1,*, Thomas E. L. Smith 1 and Martin J. Wooster 1,2
1 King’s College London, Department of Geography, London WC2R 2LS, UK
2 NERC National Centre for Earth Observation (NCEO), King’s College London, London WC2R 2LS, UK
Remote Sens. 2017, 9(11), 1101; https://doi.org/10.3390/rs9111101 - 28 Oct 2017
Cited by 42 | Viewed by 9096
Abstract
Airborne Light Detection and Ranging (LiDAR) is a survey tool with many applications in forestry and forest research. It can capture the 3D structure of vegetation and topography quickly and accurately over thousands of hectares of forest. However, very few studies have assessed [...] Read more.
Airborne Light Detection and Ranging (LiDAR) is a survey tool with many applications in forestry and forest research. It can capture the 3D structure of vegetation and topography quickly and accurately over thousands of hectares of forest. However, very few studies have assessed how accurately LiDAR can measure surface topography under forest canopies, which may be important, for example, in relation to analysis of pre- and post-burn surface height maps used to quantify the combustion of organic soils. Here, we use ground survey equipment to assess digital terrain model (DTM) accuracy in a deciduous broadleaf forest, during both leaf-on and leaf-off conditions. Using the leaf-on LiDAR dataset we quantitatively assess vertical vegetation structure, and use this as a categorical explanatory variable for DTM accuracy. In the presence of leaf-on vegetation, DTM accuracy is severely reduced, with low-stature undergrowth vegetation (such as ferns) causing the greatest errors (RMSE > 1 m). Errors are lower under leaf-off conditions (RMSE = 0.22 m), but still of a magnitude similar to that reported for mean depths of burn in fires involving organic soils. We highlight the need for adequate ground control schemes to accompany any forest-based airborne LiDAR survey which require highly accurate DTMs. Full article
(This article belongs to the Special Issue Lidar for Forest Science and Management)
Show Figures

Figure 1

23 pages, 6256 KiB  
Article
A Fast Atmospheric Trace Gas Retrieval for Hyperspectral Instruments Approximating Multiple Scattering—Part 2: Application to XCO2 Retrievals from OCO-2
by Maximilian Reuter *, Michael Buchwitz, Oliver Schneising, Stefan Noël, Heinrich Bovensmann and John P. Burrows
Institute of Environmental Physics, University of Bremen, P.O. Box 330440, 28334 Bremen, Germany
Remote Sens. 2017, 9(11), 1102; https://doi.org/10.3390/rs9111102 - 28 Oct 2017
Cited by 29 | Viewed by 8494
Abstract
Satellite retrievals of the atmospheric dry-air column-average mole fraction of CO 2 (XCO 2 ) based on hyperspectral measurements in appropriate near (NIR) and short wave infrared (SWIR) O 2 and CO 2 absorption bands can help to answer important questions about the [...] Read more.
Satellite retrievals of the atmospheric dry-air column-average mole fraction of CO 2 (XCO 2 ) based on hyperspectral measurements in appropriate near (NIR) and short wave infrared (SWIR) O 2 and CO 2 absorption bands can help to answer important questions about the carbon cycle but the precision and accuracy requirements for XCO 2 data products are demanding. Multiple scattering of light at aerosols and clouds can be a significant error source for XCO 2 retrievals. Therefore, so called full physics retrieval algorithms were developed aiming to minimize scattering related errors by explicitly fitting scattering related properties such as cloud water/ice content, aerosol optical thickness, cloud height, etc. However, the computational costs for multiple scattering radiative transfer (RT) calculations can be immense. Processing all data of the Orbiting Carbon Observatory-2 (OCO-2) can require up to thousands of CPU cores and the next generation of CO 2 monitoring satellites will produce at least an order of magnitude more data. For this reason, the Fast atmOspheric traCe gAs retrievaL FOCAL has been developed reducing the computational costs by orders of magnitude by approximating multiple scattering effects with an analytic solution of the RT problem of an isotropic scattering layer. Here we confront FOCAL for the first time with measured OCO-2 data and protocol the steps undertaken to transform the input data (most importantly, the OCO-2 radiances) into a validated XCO 2 data product. This includes preprocessing, adaptation of the noise model, zero level offset correction, post-filtering, bias correction, comparison with the CAMS (Copernicus Atmosphere Monitoring Service) greenhouse gas flux inversion model, comparison with NASA’s operational OCO-2 XCO 2 product, and validation with ground based Total Carbon Column Observing Network (TCCON) data. The systematic temporal and regional differences between FOCAL and the CAMS model have a standard deviation of 1.0 ppm. The standard deviation of the single sounding mismatches amounts to 1.1 ppm which agrees reasonably well with FOCAL’s average reported uncertainty of 1.2 ppm. The large scale XCO 2 patterns of FOCAL and NASA’s operational OCO-2 product are similar and the most prominent difference is that FOCAL has about three times less soundings due to the inherently poor throughput (11%) of the MODIS (moderate-resolution imaging spectroradiometer) based cloud screening used by FOCAL’s preprocessor. The standard deviation of the difference between both products is 1.1 ppm. The validation of one year (2015) of FOCAL XCO 2 data with co-located ground based TCCON observations results in a standard deviations of the site biases of 0.67 ppm (0.78 ppm without bias correction) and an average scatter relative to TCCON of 1.34 ppm (1.60 ppm without bias correction). Full article
(This article belongs to the Special Issue Remote Sensing of Greenhouse Gases)
Show Figures

Figure 1

24 pages, 4352 KiB  
Article
Quantification of Soil Properties with Hyperspectral Data: Selecting Spectral Variables with Different Methods to Improve Accuracies and Analyze Prediction Mechanisms
by Michael Vohland 1,*, Marie Ludwig 2,3, Sören Thiele-Bruhn 2 and Bernard Ludwig 4
1 Geoinformatics and Remote Sensing, Institute for Geography, Leipzig University, 04103 Leipzig, Germany
2 Soil Science, University of Trier, 54286 Trier, Germany
3 Thünen Institute of Biodiversity, 38116 Braunschweig, Germany
4 Department of Environmental Chemistry, University of Kassel, 37213 Witzenhausen, Germany
Remote Sens. 2017, 9(11), 1103; https://doi.org/10.3390/rs9111103 - 29 Oct 2017
Cited by 50 | Viewed by 9801
Abstract
We explored the potentials of both non-imaging laboratory and airborne imaging spectroscopy to assess arable soil quality indicators. We focused on microbial biomass-C (MBC) and hot water-extractable C (HWEC), complemented by organic carbon (OC) and nitrogen (N) as well-studied spectrally active parameters. The [...] Read more.
We explored the potentials of both non-imaging laboratory and airborne imaging spectroscopy to assess arable soil quality indicators. We focused on microbial biomass-C (MBC) and hot water-extractable C (HWEC), complemented by organic carbon (OC) and nitrogen (N) as well-studied spectrally active parameters. The aggregation of different spectral variable selection strategies was used to analyze benefits for reachable estimation accuracies and to explore spectral predictive mechanisms for MBC and HWEC. With selected variables, quantification accuracies improved markedly for MBC (laboratory: RPD = 2.32 instead of 1.33 with full spectra; airborne: 2.35 instead of 1.80) and OC (laboratory: RPD = 3.08 instead of 2.36; airborne: 2.20 instead of 1.94). Patterns of selected variables indicated similarities between HWEC and OC, but significant differences between all other soil variables. This agreed to our results of indirect approaches in which both (i) wet-chemical data of OC and N and (ii) spectra fitted to measured OC and N values were used to estimate MBC and HWEC. Compared to these approaches, we found marked benefits of laboratory and airborne data for a direct spectral quantification of MBC (but not for HWEC). This suggests specificity of spectra for MBC, usable for the determination of this important soil parameter. Full article
(This article belongs to the Special Issue Recent Progress and Developments in Imaging Spectroscopy)
Show Figures

Graphical abstract

21 pages, 9643 KiB  
Article
Airborne LiDAR Data Filtering Based on Geodesic Transformations of Mathematical Morphology
by Yong Li 1,2,3,*, Bin Yong 1,2,*, Peter Van Oosterom 3, Mathias Lemmens 3, Huayi Wu 4,5, Liliang Ren 1, Mingxue Zheng 3,4 and Jiajun Zhou 2
1 State Key Laboratory of Hydrology-Water Resources and Hydraulic Engineering, Hohai University, Nanjing 210098, China
2 School of Earth Sciences and Engineering, Hohai University, Nanjing 210098, China
3 GIS Technology Section, Department OTB, Faculty of Architecture and the Built Environment, Delft University of Technology, 2628 BL Delft, The Netherlands
4 State Key Laboratory of Information Engineering in Surveying, Mapping and Remote Sensing, Wuhan University, Wuhan 430079, China
5 Collaborative Innovation Center of Geospatial Technology, Wuhan 430079, China
Remote Sens. 2017, 9(11), 1104; https://doi.org/10.3390/rs9111104 - 29 Oct 2017
Cited by 39 | Viewed by 6785
Abstract
The capability of acquiring accurate and dense three-dimensional geospatial information that covers large survey areas rapidly enables airborne light detection and ranging (LiDAR) has become a powerful technology in numerous fields of geospatial applications and analysis. LiDAR data filtering is the first and [...] Read more.
The capability of acquiring accurate and dense three-dimensional geospatial information that covers large survey areas rapidly enables airborne light detection and ranging (LiDAR) has become a powerful technology in numerous fields of geospatial applications and analysis. LiDAR data filtering is the first and essential step for digital elevation model generation, land cover classification, and object reconstruction. The morphological filtering approaches have the advantages of simple concepts and easy implementation, which are able to filter non-ground points effectively. However, the filtering quality of morphological approaches is sensitive to the structuring elements that are the key factors for the filtering success of mathematical operations. Aiming to deal with the dependence on the selection of structuring elements, this paper proposes a novel filter of LiDAR point clouds based on geodesic transformations of mathematical morphology. In comparison to traditional morphological transformations, the geodesic transformations only use the elementary structuring element and converge after a finite number of iterations. Therefore, this algorithm makes it unnecessary to select different window sizes or determine the maximum window size, which can enhance the robustness and automation for unknown environments. Experimental results indicate that the new filtering method has promising and competitive performance for diverse landscapes, which can effectively preserve terrain details and filter non-ground points in various complicated environments. Full article
Show Figures

Graphical abstract

25 pages, 6130 KiB  
Article
Exploring Subpixel Learning Algorithms for Estimating Global Land Cover Fractions from Satellite Data Using High Performance Computing
by Uttam Kumar 1,2,*, Sangram Ganguly 1,3, Ramakrishna R. Nemani 1, Kumar S Raja 4, Cristina Milesi 1, Ruchita Sinha 5, Andrew Michaelis 1,6, Petr Votava 1,6, Hirofumi Hashimoto 1,6, Shuang Li 1,3, Weile Wang 1,6, Subodh Kalia 3 and Shreekant Gayaka 3
1 NASA Ames Research Center, Moffett Field, CA 94035, USA
2 Universities Space Research Association (USRA), 7178 Columbia Gateway Drive, Columbia, MD 21046, USA
3 Bay Area Environmental Research Institute (BAERI), Sonoma, CA 95476, USA
4 Airbus Engineering Centre India, Whitefield Road, Bangalore 560048, India
5 VISA INC., 800 Metro Center Blvd, Foster City, CA 94404, USA
6 Division of Science & Environmental Policy, California State University Monterey Bay, Seaside, CA 93955, USA
Remote Sens. 2017, 9(11), 1105; https://doi.org/10.3390/rs9111105 - 29 Oct 2017
Cited by 15 | Viewed by 10080
Abstract
Land cover (LC) refers to the physical and biological cover present over the Earth’s surface in terms of the natural environment such as vegetation, water, bare soil, etc. Most LC features occur at finer spatial scales compared to the resolution of primary remote [...] Read more.
Land cover (LC) refers to the physical and biological cover present over the Earth’s surface in terms of the natural environment such as vegetation, water, bare soil, etc. Most LC features occur at finer spatial scales compared to the resolution of primary remote sensing satellites. Therefore, observed data are a mixture of spectral signatures of two or more LC features resulting in mixed pixels. One solution to the mixed pixel problem is the use of subpixel learning algorithms to disintegrate the pixel spectrum into its constituent spectra. Despite the popularity and existing research conducted on the topic, the most appropriate approach is still under debate. As an attempt to address this question, we compared the performance of several subpixel learning algorithms based on least squares, sparse regression, signal–subspace and geometrical methods. Analysis of the results obtained through computer-simulated and Landsat data indicated that fully constrained least squares (FCLS) outperformed the other techniques. Further, FCLS was used to unmix global Web-Enabled Landsat Data to obtain abundances of substrate (S), vegetation (V) and dark object (D) classes. Due to the sheer nature of data and computational needs, we leveraged the NASA Earth Exchange (NEX) high-performance computing architecture to optimize and scale our algorithm for large-scale processing. Subsequently, the S-V-D abundance maps were characterized into four classes, namely forest, farmland, water and urban areas (in conjunction with nighttime lights data) over California, USA using a random forest classifier. Validation of these LC maps with the National Land Cover Database 2011 products and North American Forest Dynamics static forest map shows a 6% improvement in unmixing-based classification relative to per-pixel classification. As such, abundance maps continue to offer a useful alternative to high-spatial-resolution classified maps for forest inventory analysis, multi-class mapping, multi-temporal trend analysis, etc. Full article
(This article belongs to the Special Issue Machine Learning Applications in Earth Science Big Data Analysis)
Show Figures

Graphical abstract

18 pages, 3988 KiB  
Article
Detection of Informal Settlements from VHR Images Using Convolutional Neural Networks
by Nicholus Mboga, Claudio Persello *, John Ray Bergado and Alfred Stein
Faculty of Geo-Information Science and Earth Observation (ITC), University of Twente, 7500 AE Enschede, The Netherlands
Remote Sens. 2017, 9(11), 1106; https://doi.org/10.3390/rs9111106 - 30 Oct 2017
Cited by 120 | Viewed by 10590
Abstract
Information about the location and extent of informal settlements is necessary to guide decision making and resource allocation for their upgrading. Very high resolution (VHR) satellite images can provide this useful information, however, different urban settlement types are hard to be automatically discriminated [...] Read more.
Information about the location and extent of informal settlements is necessary to guide decision making and resource allocation for their upgrading. Very high resolution (VHR) satellite images can provide this useful information, however, different urban settlement types are hard to be automatically discriminated and extracted from VHR imagery, because of their abstract semantic class definition. State-of-the-art classification techniques rely on hand-engineering spatial-contextual features to improve the classification results of pixel-based methods. In this paper, we propose to use convolutional neural networks (CNNs) for learning discriminative spatial features, and perform automatic detection of informal settlements. The experimental analysis is carried out on a QuickBird image acquired over Dar es Salaam, Tanzania. The proposed technique is compared against support vector machines (SVMs) using texture features extracted from grey level co-occurrence matrix (GLCM) and local binary patterns (LBP), which result in accuracies of 86.65% and 90.48%, respectively. CNN leads to better classification, resulting in an overall accuracy of 91.71%. A sensitivity analysis shows that deeper networks result in higher accuracies when large training sets are used. The study concludes that training CNN in an end-to-end fashion can automatically learn spatial features from the data that are capable of discriminating complex urban land use classes. Full article
(This article belongs to the Special Issue Earth Observation in Planning for Sustainable Urban Development)
Show Figures

Graphical abstract

11 pages, 3624 KiB  
Technical Note
Performance Analysis of Ship Wake Detection on Sentinel-1 SAR Images
by Maria Daniela Graziano 1,*, Marco Grasso 2 and Marco D’Errico 2
1 Department of Industrial Engineering, University of Naples “Federico II”, Piazzale Tecchio, 80, 80125 Naples, Italy
2 Department of Industrial and Information Engineering, University of Campania “Luigi Vanvitelli”, Via Roma, 29, 81031 Aversa (CE), Italy
Remote Sens. 2017, 9(11), 1107; https://doi.org/10.3390/rs9111107 - 30 Oct 2017
Cited by 38 | Viewed by 10264
Abstract
A novel technique for ship wake detection has been recently proposed and applied on X-band Synthetic Aperture Radar images provided by COSMO/SkyMed and TerraSAR-X. The approach shows that the vast majority of wake features are correctly detected and validated in critical situations. In [...] Read more.
A novel technique for ship wake detection has been recently proposed and applied on X-band Synthetic Aperture Radar images provided by COSMO/SkyMed and TerraSAR-X. The approach shows that the vast majority of wake features are correctly detected and validated in critical situations. In this paper, the algorithm was applied to 28 wakes imaged by Sentinel-1 mission with different polarizations and incidence angles with the aim of testing the method’s robustness with reference to radar frequency and resolution. The detection process is properly modified. The results show that the features were correctly classified in 78.5% of cases, whereas false confirmations occur mainly on Kelvin cusps. Finally, the results were compared with the algorithm performance on X-band images, showing that no significant difference arises. In fact, the total false confirmations rate was 15.8% on X-band images and 18.5% on C-band images. Moreover, since the main criticality concerns again the false confirmation of Kelvin cusps, the same empirical criterion suggested for the X-band SAR images yielded a negligible 1.5% of false detection rate. Full article
(This article belongs to the Special Issue Instruments and Methods for Ocean Observation and Monitoring)
Show Figures

Graphical abstract

15 pages, 4291 KiB  
Article
Improving the Triple-Carrier Ambiguity Resolution with a New Ionosphere-Free and Variance-Restricted Method
by Chun Jia 1, Lin Zhao 1, Liang Li 1,2,*, Hui Li 1, Jianhua Cheng 1 and Zishen Li 2
1 College of Automation, Harbin Engineering University, Harbin 150001, China
2 Academy of Opto-Electronics, Chinese Academy of Sciences, Beijing 100094, China
Remote Sens. 2017, 9(11), 1108; https://doi.org/10.3390/rs9111108 - 30 Oct 2017
Cited by 8 | Viewed by 4535
Abstract
The ionospheric bias and the combined observation noise are two crucial factors affecting the reliability of the triple-carrier ambiguity resolution (TCAR). In order to obtain a better reliability of TCAR, a new ionosphere-free and variance-restricted TCAR method is proposed through exploring the ambiguity [...] Read more.
The ionospheric bias and the combined observation noise are two crucial factors affecting the reliability of the triple-carrier ambiguity resolution (TCAR). In order to obtain a better reliability of TCAR, a new ionosphere-free and variance-restricted TCAR method is proposed through exploring the ambiguity link between each step of TCAR. The method constructs an ionosphere-free combination and simultaneously restricts the combined observation noise with respect to the wavelength to a sufficiently low level for each step of TCAR. The performance of the proposed method is tested by the datasets from the BeiDou navigation satellite system (BDS), with the baseline varying from 7.7 km to 68.8 km. Comparing with the state-of-the-art TCAR methods, the experimental results indicate that the proposed method can obtain a better performance of ambiguity resolution, even though the double-differenced ionospheric delay increases up to 72.4 cm at the baseline of 68.8 km. Full article
Show Figures

Graphical abstract

16 pages, 4304 KiB  
Article
A Novel De-Noising Method for Improving the Performance of Full-Waveform LiDAR Using Differential Optical Path
by Yang Cheng 1,2,†, Jie Cao 1,3,†, Qun Hao 1,*, Yuqing Xiao 1, Fanghua Zhang 1, Wenze Xia 1,2, Kaiyu Zhang 1 and Haoyong Yu 2
1 Key Laboratory of Biomimetic Robots and Systems, Ministry of Education, Beijing Institute of Technology, Beijing 100081, China
2 Department of Biomedical Engineering, National University of Singapore, Singapore 117575, Singapore
3 NUS Suzhou Research Institute (NUSRI), Suzhou Industrial Park, Suzhou 215123, China
These authors contributed equally to this work.
Remote Sens. 2017, 9(11), 1109; https://doi.org/10.3390/rs9111109 - 30 Oct 2017
Cited by 17 | Viewed by 5163
Abstract
A novel de-noising method for improving the performance of full-waveform light detection and ranging (LiDAR) based on differential optical path is proposed, and the mathematical models of this method are developed and verified. Backscattered full-waveform signal (BFWS) is detected by two avalanche photodiodes [...] Read more.
A novel de-noising method for improving the performance of full-waveform light detection and ranging (LiDAR) based on differential optical path is proposed, and the mathematical models of this method are developed and verified. Backscattered full-waveform signal (BFWS) is detected by two avalanche photodiodes placed before and after the focus of the focusing lens. On the basis of the proposed method, some simulations are carried out and conclusions are achieved. (1) Background noise can be suppressed effectively and peak points of the BFWS are transformed into negative-going zero-crossing points as stop timing moments. (2) The relative increment percentage of the signal-to-noise ratio based on the proposed method first dramatically increases with the increase of the distance, and then the improvement gets smaller by increasing the distance. (3) The differential Gaussian fitting with the Levenberg-Marquardt algorithm is applied, and the results show that it can decompose the BFWS with high accuracy. (4) The differential distance should not be larger than c/2 × τrmin, and two variable gain amplifiers can eliminate the inconsistency of two differential beams. The results are beneficial for designing a better performance full-waveform LiDAR. Full article
(This article belongs to the Section Remote Sensing Image Processing)
Show Figures

Figure 1

30 pages, 1912 KiB  
Technical Note
Hyperspectral Imaging: A Review on UAV-Based Sensors, Data Processing and Applications for Agriculture and Forestry
by Telmo Adão 1,2,*, Jonáš Hruška 2, Luís Pádua 2, José Bessa 2, Emanuel Peres 1,2, Raul Morais 1,2 and Joaquim João Sousa 1,2
1 Institute for Systems and Computer Engineering, Technology and Science (INESC-TEC—Formerly INESC Porto), 4200-465 Porto, Portugal
2 Department of Engineering, School of Sciences and Technology, University of Trás-os-Montes e Alto Douro, 5000-801 Vila Real, Portugal
Remote Sens. 2017, 9(11), 1110; https://doi.org/10.3390/rs9111110 - 30 Oct 2017
Cited by 1022 | Viewed by 62395
Abstract
Traditional imagery—provided, for example, by RGB and/or NIR sensors—has proven to be useful in many agroforestry applications. However, it lacks the spectral range and precision to profile materials and organisms that only hyperspectral sensors can provide. This kind of high-resolution spectroscopy was firstly [...] Read more.
Traditional imagery—provided, for example, by RGB and/or NIR sensors—has proven to be useful in many agroforestry applications. However, it lacks the spectral range and precision to profile materials and organisms that only hyperspectral sensors can provide. This kind of high-resolution spectroscopy was firstly used in satellites and later in manned aircraft, which are significantly expensive platforms and extremely restrictive due to availability limitations and/or complex logistics. More recently, UAS have emerged as a very popular and cost-effective remote sensing technology, composed of aerial platforms capable of carrying small-sized and lightweight sensors. Meanwhile, hyperspectral technology developments have been consistently resulting in smaller and lighter sensors that can currently be integrated in UAS for either scientific or commercial purposes. The hyperspectral sensors’ ability for measuring hundreds of bands raises complexity when considering the sheer quantity of acquired data, whose usefulness depends on both calibration and corrective tasks occurring in pre- and post-flight stages. Further steps regarding hyperspectral data processing must be performed towards the retrieval of relevant information, which provides the true benefits for assertive interventions in agricultural crops and forested areas. Considering the aforementioned topics and the goal of providing a global view focused on hyperspectral-based remote sensing supported by UAV platforms, a survey including hyperspectral sensors, inherent data processing and applications focusing both on agriculture and forestry—wherein the combination of UAV and hyperspectral sensors plays a center role—is presented in this paper. Firstly, the advantages of hyperspectral data over RGB imagery and multispectral data are highlighted. Then, hyperspectral acquisition devices are addressed, including sensor types, acquisition modes and UAV-compatible sensors that can be used for both research and commercial purposes. Pre-flight operations and post-flight pre-processing are pointed out as necessary to ensure the usefulness of hyperspectral data for further processing towards the retrieval of conclusive information. With the goal of simplifying hyperspectral data processing—by isolating the common user from the processes’ mathematical complexity—several available toolboxes that allow a direct access to level-one hyperspectral data are presented. Moreover, research works focusing the symbiosis between UAV-hyperspectral for agriculture and forestry applications are reviewed, just before the paper’s conclusions. Full article
(This article belongs to the Section Remote Sensing in Agriculture and Vegetation)
Show Figures

Graphical abstract

22 pages, 6762 KiB  
Article
Multi-Scale Evaluation of the SMAP Product Using Sparse In-Situ Network over a High Mountainous Watershed, Northwest China
by Lanhui Zhang 1, Chansheng He 1,2,* and Mingmin Zhang 1
1 Key Laboratory of West China’s Environmental System (Ministry of Education), College of Earth and Environmental Sciences, Lanzhou University, Lanzhou 730000, China
2 Department of Geography, Western Michigan University, Kalamazoo, MI 49008, USA
Remote Sens. 2017, 9(11), 1111; https://doi.org/10.3390/rs9111111 - 2 Nov 2017
Cited by 25 | Viewed by 6909
Abstract
As the latest L-band mission to date, evaluation of the Soil Moisture Active Passive (SMAP) products is one of its post-launch objectives. However, almost all previous studies have been conducted at the core validation sites (CVS) of the SMAP mission. This paper presents [...] Read more.
As the latest L-band mission to date, evaluation of the Soil Moisture Active Passive (SMAP) products is one of its post-launch objectives. However, almost all previous studies have been conducted at the core validation sites (CVS) of the SMAP mission. This paper presents an evaluation of the SMAP soil moisture Level 3 (L3) and Level 4 (L4) products under different vegetation types at multiple tempo-spatial scales over the upper reach of the Heihe River Watershed, a topographically complex mountainous area in Northwest China. This was done through comparisons of the L3 and L4 products with ground-based observations from a sparse in situ network of permanent and temporary stations from 1 April 2015 to 22 June 2017. Results show that, compared with in situ observations at point scale, both the L3 and L4 products represent the temporal trends of the in situ observations in the study area well, with R values of 0.601 and 0.538 for the L3 ascending and descending products, respectively, and ranging from 0.353 to 0.410 for the L4 product at eight overpassing moments. However, because of the uncertainties of brightness temperature TBp and effective temperature Teff as well as their propagations in the inversion algorithm, both products did not achieve the accuracy of 0.04 m3/m3 in mountainous area. These uncertainties also result in the “dry bias” of the SMAP products in almost all the evaluations to date. Compared with areal average values at the watershed scale, the L3 product is far beyond the accuracy of 0.04 m3/m3 and the L4 product basically achieves the accuracy. In vegetation-covered land, the suitability and the variability of the coefficient bp result in both products performing best in cropland, then coniferous forest, sparse grassland, dense grassland, and alpine meadow, and worst in shrub. In barren land, the errors in estimating surface roughness h caused by the complex topography lead to poor performance of the SMAP products. With the relative errors of the SMAP brightness temperature observations and the corresponding land model forecast in the assimilation; the L3 and L4 products show different performance at both temporal and spatial scales; and the L3 product provides more reliable soil moisture estimates in the study area. Based on the results of this study, we propose: quantifying the uncertainties in estimating brightness temperature TBp and effective temperature Teff; determine coefficient bp and surface roughness h factor under various conditions; improving Goddard Earth Observing Model System Version 5 (GEOS-5) model; and deriving the SMAP-only climatology to improve the SMAP soil moisture estimates in the future. Full article
(This article belongs to the Special Issue Retrieval, Validation and Application of Satellite Soil Moisture Data)
Show Figures

Graphical abstract

20 pages, 6753 KiB  
Article
Semi-Automatic System for Land Cover Change Detection Using Bi-Temporal Remote Sensing Images
by ZhiYong Lv 1,*, WenZhong Shi 2,*, XiaoCheng Zhou 3 and Jón Atli Benediktsson 4
1 School of Computer Science and Engineering, Xi’an University of Technology, Xi’an 710048, China
2 Department of Land Surveying and Geo-Informatics, The Hong Kong Polytechnic University, Hung Hom, Hong Kong, China
3 Key Laboratory of Spatial Data Mining & Information Sharing of Ministry of Education, Fuzhou University, Fuzhou 350116, China
4 Faculty of Electrical and Computer Engineering, University of Iceland, Reykjavik IS 107, Iceland
Remote Sens. 2017, 9(11), 1112; https://doi.org/10.3390/rs9111112 - 31 Oct 2017
Cited by 32 | Viewed by 6929
Abstract
Change detection is an increasingly important research topic in remote sensing application. Previous studies achieved land cover change detection (LCCD) using bi-temporal remote sensing images. However, many widely used methods detected change depending on a series of parameters, and determining parameters is time-consuming. [...] Read more.
Change detection is an increasingly important research topic in remote sensing application. Previous studies achieved land cover change detection (LCCD) using bi-temporal remote sensing images. However, many widely used methods detected change depending on a series of parameters, and determining parameters is time-consuming. Furthermore, numerous methods are data-dependent. Therefore, their degree of automation should be improved significantly. Three techniques, which consist of a semi-automatic change detection system, are proposed for LCCD to overcome the abovementioned drawbacks. The three techniques are as follows: (1) change magnitude image (CMI) noise reduction is based on Gaussian filter (GF), which is coupled with OTSU for reducing CMI noise automatically using an iterative optimization strategy; (2) a method based on histogram curve fitting is suggested to predict the threshold range for parameter determination; and (3) a modified region growing algorithm is built for iteratively constructing the final change detection map. The detection accuracies of the proposed system are investigated through four experiments with different bi-temporal image scenes. Compared with several widely used change detection methods, the proposed system can be applied to detect land cover change with high accuracy and flexibility. This work is an attempt to provide a change detection system that is compatible with remote sensing images with high and median-low spatial resolution. Full article
(This article belongs to the Special Issue GIS and Remote Sensing advances in Land Change Science)
Show Figures

Graphical abstract

24 pages, 3003 KiB  
Article
A Novel Principal Component Analysis Method for the Reconstruction of Leaf Reflectance Spectra and Retrieval of Leaf Biochemical Contents
by Liangyun Liu *, Bowen Song, Su Zhang and Xinjie Liu
Key Laboratory of Digital Earth Science, Institute of Remote Sensing and Digital Earth, Chinese Academy of Sciences, Beijing 100094, China
Remote Sens. 2017, 9(11), 1113; https://doi.org/10.3390/rs9111113 - 31 Oct 2017
Cited by 53 | Viewed by 8144
Abstract
Vegetation variable retrieval from reflectance data is typically grouped into three categories: the statistical–empirical category, the physical category and the hybrid category (physical models applied to statistical models). Based on the similarities between the spectra of leaves in the optical domain, the leaf [...] Read more.
Vegetation variable retrieval from reflectance data is typically grouped into three categories: the statistical–empirical category, the physical category and the hybrid category (physical models applied to statistical models). Based on the similarities between the spectra of leaves in the optical domain, the leaf reflectance spectra can be linearly modelled using a very limited number of principal components (PCs) if the PCA (principal component analysis) transformation is carried out at the sample dimension. In this paper, we present a novel data-driven approach that uses the PCA transformation to reconstruct leaf reflectance spectra and also to retrieve leaf biochemical contents. First, the PCA transformation was carried out on a training dataset simulated by the PROSPECT-5 model. The results showed that the leaf reflectance spectra can be accurately reconstructed using only a few leading PCs, as the ten leading PCs contained 99.999% of the total information in the 3636 training samples. The spectral error between the simulated or measured reflectance and the reconstructed spectra was also investigated using the simulated and measured datasets (ANGERS and LOPEX’93). The mean root mean squared error (RMSE) values varied from 5.56 × 10⁻⁵ to 6.18 × 10⁻³, which is about 3–10 times more accurate than the PROSPECT simulation method for measured datasets. Secondly, the relationship between PCs and leaf biochemical components was investigated, and we found that the PCs are closely related to the leaf biochemical components and to the reflectance spectra. Only when the weighting coefficient of the most sensitive PC was employed to retrieve the leaf biochemical contents, the coefficients of determination for the PCA data-driven model were 0.69, 0.99, 0.94 and 0.68 for the specific leaf weight (SLW), equivalent water thickness (EWT), chlorophyll content (Cab) and carotenoid content (Car), respectively. Finally, statistical models for the retrieval of leaf biochemical contents were developed based on the weighting coefficients of the sensitive PCs, and the PCA data-driven models were validated and compared to the traditional VI-based and physically-based approaches for the retrieval of leaf properties. The results show that the PCA method shows similar or better performance in the estimation of leaf biochemical contents. Therefore, the PCA method provides a new and accurate data-driven method for reconstructing leaf reflectance spectra and also for retrieving leaf biochemical contents. Full article
(This article belongs to the Section Remote Sensing in Agriculture and Vegetation)
Show Figures

Graphical abstract

21 pages, 1356 KiB  
Article
Nearest-Regularized Subspace Classification for PolSAR Imagery Using Polarimetric Feature Vector and Spatial Information
by Fan Zhang 1, Jun Ni 1, Qiang Yin 1,*, Wei Li 1, Zheng Li 1, Yifan Liu 2 and Wen Hong 2
1 College of Information Science and Technology, Beijing University of Chemical Technology, Beijing 100029, China
2 Institute of Electronics, Chinese Academy of Sciences, Beijing 100190, China
Remote Sens. 2017, 9(11), 1114; https://doi.org/10.3390/rs9111114 - 1 Nov 2017
Cited by 34 | Viewed by 5869
Abstract
Feature extraction using polarimetric synthetic aperture radar (PolSAR) images is of great interest in SAR classification, no matter if it is applied in an unsupervised approach or a supervised approach. In the supervised classification framework, a major group of methods is based on [...] Read more.
Feature extraction using polarimetric synthetic aperture radar (PolSAR) images is of great interest in SAR classification, no matter if it is applied in an unsupervised approach or a supervised approach. In the supervised classification framework, a major group of methods is based on machine learning. Various machine learning methods have been investigated for PolSAR image classification, including neural network (NN), support vector machine (SVM), and so on. Recently, representation-based classifications have gained increasing attention in hyperspectral imagery, such as the newly-proposed sparse-representation classification (SRC) and nearest-regularized subspace (NRS). These classifiers provide excellent performance that is comparable to or even better than the classic SVM for remotely-sensed image processing. However, rare studies have been found to extend this representation-based NRS classification into PolSAR images. By the use of the NRS approach, a polarimetric feature vector-based PolSAR image classification method is proposed in this paper. The polarimetric SAR feature vector is constructed by the components of different target decomposition algorithms for each pixel, including those scattering components of Freeman, Huynen, Krogager, Yamaguchi decomposition, as well as the eigenvalues, eigenvectors and their consequential parameters such as entropy, anisotropy and mean scattering angle. Furthermore, because all these representation-based methods were originally designed to be pixel-wise classifiers, which only consider the separate pixel signature while ignoring the spatial-contextual information, the Markov random field (MRF) model is also introduced in our scheme. MRF can provide a basis for modeling contextual constraints. Two AIRSAR data in the Flevoland area are used to validate the proposed classification scheme. Experimental results demonstrate that the proposed method can reach an accuracy of around 99 % for both AIRSAR data by randomly selecting 300 pixels of each class as the training samples. Under the condition that the training data ratio is more than 4 % , it has better performance than the SVM, SVM-MRF and NRS methods. Full article
(This article belongs to the Special Issue Recent Advances in Polarimetric SAR Interferometry)
Show Figures

Figure 1

19 pages, 81728 KiB  
Article
Effects of External Digital Elevation Model Inaccuracy on StaMPS-PS Processing: A Case Study in Shenzhen, China
by Yanan Du, Guangcai Feng *, Zhiwei Li, Xing Peng, Jianjun Zhu and Zhengyong Ren
School of Geosciences and Info-Physics, Central South University, Changsha 410083, China
Remote Sens. 2017, 9(11), 1115; https://doi.org/10.3390/rs9111115 - 1 Nov 2017
Cited by 20 | Viewed by 7071
Abstract
External Digital Elevation Models (DEMs) with different resolutions and accuracies cause different topographic residuals in differential interferograms of Multi-temporal InSAR (MTInSAR), especially for the phase-based StaMPS-PS. The PS selection and deformation parameter estimation of StaMPS-PS are closely related to the spatially uncorrected error, [...] Read more.
External Digital Elevation Models (DEMs) with different resolutions and accuracies cause different topographic residuals in differential interferograms of Multi-temporal InSAR (MTInSAR), especially for the phase-based StaMPS-PS. The PS selection and deformation parameter estimation of StaMPS-PS are closely related to the spatially uncorrected error, which is directly affected by external DEMs. However, it is still far from clear how the high resolution and accurate external DEM affects the results of the StaMPS-PS (e.g., PS selection and deformation parameter calculation) on different platforms (X band TerraSAR, C band ENVISAT ASAR and L band ALOS/PALSAR1). In this study, abundant synthetic tests are performed to assess the influences of external DEMs on parameter estimations, such as the mean deformation rate and the deformation time-series. Real SAR images, covering Shenzhen city in China, are also selected to analyze the PS selection and distribution as well as to validate the results of synthetic tests. The results show that the PS points selected by the 5 m TanDEM-X DEM are 10.32%, 4.25% and 0.34% more than those selected by the 30 m SRTM DEM at X, C and L bands SAR platforms, respectively, when a multi-look geocoding operation is adopted for X band in the SRTM DEM case. We also find that the influences of external DEMs on the mean deformation rate are not significant and are inversely proportional to the wavelength of the satellite platforms. The standard deviations of the mean deformation rate difference for the X, C and L bands are 0.54, 0.30 and 0.10 mm/year, respectively. Similarly, the influences of external DEMs on the deformation time-series estimation for the three platforms are also slight, except for local artifacts whose root-mean-square error (RMSE) 6 mm. Based on these analyses, some implications and suggestions for external DEMs on StaMPS-PS processing are discussed and provided. Full article
(This article belongs to the Special Issue Radar Interferometry for Geohazards)
Show Figures

Graphical abstract

17 pages, 1983 KiB  
Article
Relationships of S-Band Radar Backscatter and Forest Aboveground Biomass in Different Forest Types
by Ramesh K. Ningthoujam 1,2,*, Heiko Balzter 1,3,†, Kevin Tansey 1,†, Ted R. Feldpausch 4, Edward T. A. Mitchard 5, Akhlaq A. Wani 6 and Pawan K. Joshi 7
1 School of Geography, Geology and the Environment , Centre for Landscape and Climate Research, University of Leicester, Leicester LE1 7RH, UK
2 Department of Life Sciences, Imperial College London, Silwood Park Campus, Buckhurst Road, Ascot SL5 7PY, UK
3 National Centre for Earth Observation (NCEO), University of Leicester, Leicester LE1 7RH, UK
4 Geography, College of Life and Environmental Sciences, University of Exeter, Exeter EX44RJ, UK
5 School of Geosciences, University of Edinburgh, Edinburgh EH9 3FF, UK
6 Faculty of Forestry, Sher-e-Kashmir University of Agricultural Sciences and Technology of Kashmir, Benhama Ganderbal J&K 191201, India
7 School of Environmental Sciences, Jawaharlal Nehru University, New Delhi 110067, India
These authors contributed equally to this work.
Remote Sens. 2017, 9(11), 1116; https://doi.org/10.3390/rs9111116 - 2 Nov 2017
Cited by 29 | Viewed by 6830
Abstract
Synthetic Aperture Radar (SAR) signals respond to the interactions of microwaves with vegetation canopy scatterers that collectively characterise forest structure. The sensitivity of S-band (7.5–15 cm) backscatter to the different forest types (broadleaved, needleleaved) with varying aboveground biomass (AGB) across temperate (mixed, needleleaved) [...] Read more.
Synthetic Aperture Radar (SAR) signals respond to the interactions of microwaves with vegetation canopy scatterers that collectively characterise forest structure. The sensitivity of S-band (7.5–15 cm) backscatter to the different forest types (broadleaved, needleleaved) with varying aboveground biomass (AGB) across temperate (mixed, needleleaved) and tropical (broadleaved, woody savanna, secondary) forests is less well understood. In this study, Michigan Microwave Canopy Scattering (MIMICS-I) radiative transfer model simulations showed strong volume scattering returns from S-band SAR for broadleaved canopies caused by ground/trunk interactions. A general relationship between AirSAR S-band measurements and MIMICS-I simulated radar backscatter with forest AGB up to nearly 100 t/ha in broadleaved forest in the UK was found. Simulated S-band backscatter-biomass relationships suggest increasing backscatter sensitivity to forest biomass with a saturation level close to 100 t/ha and errors between 37 t/ha and 44 t/ha for HV and VV polarisations for tropical ecosystems. In the near future, satellite SAR-derived forest biomass from P-band BIOMASS mission and L-band ALOS-2 PALSAR-2 in combination with S-band UK NovaSAR-S and the joint NASA-ISRO NISAR sensors will provide better quantification of large-scale forest AGB at varying sensitivity levels across primary and secondary forests and woody savannas. Full article
(This article belongs to the Special Issue Biomass Remote Sensing in Forest Landscapes)
Show Figures

Graphical abstract

19 pages, 2546 KiB  
Article
Fire Regimes and Their Drivers in the Upper Guinean Region of West Africa
by Francis K. Dwomoh * and Michael C. Wimberly
Geospatial Sciences Center of Excellence, South Dakota State University, Brookings, SD 57007, USA
Remote Sens. 2017, 9(11), 1117; https://doi.org/10.3390/rs9111117 - 2 Nov 2017
Cited by 25 | Viewed by 6226
Abstract
The Upper Guinean region of West Africa exhibits strong geographic variation in land use, climate, vegetation, and human population and has experienced phenomenal biophysical and socio-economic changes in recent decades. All of these factors influence spatial heterogeneity and temporal trends in fires, but [...] Read more.
The Upper Guinean region of West Africa exhibits strong geographic variation in land use, climate, vegetation, and human population and has experienced phenomenal biophysical and socio-economic changes in recent decades. All of these factors influence spatial heterogeneity and temporal trends in fires, but their combined effects on fire regimes are not well understood. The main objectives of this study were to characterize the spatial patterns and interrelationships of multiple fire regime components, identify recent trends in fire activity, and explore the relative influences of climate, topography, vegetation type, and human activity on fire regimes. Fire regime components, including active fire density, burned area, fire season length, and fire radiative power, were characterized using MODIS fire products from 2003 to 2015. Both active fire and burned area were most strongly associated with vegetation type, whereas fire season length was most strongly influenced by climate and topography variables, and fire radiative power was most strongly influenced by climate. These associations resulted in a gradient of increasing fire activity from forested coastal regions to the savanna-dominated interior, as well as large variations in burned area and fire season length within the savanna regions and high fire radiative power in the westernmost coastal regions. There were increasing trends in active fire detections in parts of the Western Guinean Lowland Forests ecoregion and decreasing trends in both active fire detections and burned area in savanna-dominated ecoregions. These results portend that ongoing regional landscape and socio-economic changes along with climate change will lead to further changes in the fire regimes in West Africa. Efforts to project future fire regimes and develop regional strategies for adaptation will need to encompass multiple components of the fire regime and consider multiple drivers, including land use as well as climate. Full article
Show Figures

Graphical abstract

24 pages, 14302 KiB  
Article
Comparison of Global Land Cover Datasets for Cropland Monitoring
by Ana Pérez-Hoyos *, Felix Rembold, Hervé Kerdiles and Javier Gallego
European Commission, Joint Research Centre, Directorate of Sustainable Resources, Via E. Fermi 2749, I-21027 Ispra, Italy
Remote Sens. 2017, 9(11), 1118; https://doi.org/10.3390/rs9111118 - 3 Nov 2017
Cited by 144 | Viewed by 14616
Abstract
Accurate and reliable information on the spatial distribution of major crops is needed for detecting possible production deficits with the aim of preventing food security crises and anticipating response planning. In this paper, we compared some of the most widely used global land [...] Read more.
Accurate and reliable information on the spatial distribution of major crops is needed for detecting possible production deficits with the aim of preventing food security crises and anticipating response planning. In this paper, we compared some of the most widely used global land cover datasets to examine their comparative advantages for cropland monitoring. Cropland class areas are compared for the following datasets: FAO-GLCshare (FAO Global Land Cover Network), Geowiki IIASA-Hybrid (Hybrid global land cover map from the International Institute of Applied System Analysis), GLC2000 (Global Land Cover 2000), GLCNMO2008 (Global Land Cover by National Mapping Organizations), GlobCover, Globeland30, LC-CCI (Land Cover Climate Change Initiative) 2010 and 2015, and MODISLC (MODIS Land Cover product). The methodology involves: (1) highlighting discrepancies in the extent and spatial distribution of cropland, (2) comparing the areas with FAO agricultural statistics at the country level, and (3) providing accuracy assessment through freely available reference datasets. Recommendations for crop monitoring at the country level are based on a priority ranking derived from the results obtained from analyses 2 and 3. Our results revealed that cropland information varies substantially among the analyzed land cover datasets. FAO-GLCshare and Globeland30 generally provided adequate results to monitor cropland areas, whereas LC-CCI2010 and GLC2000 are less unsuitable due to large overestimations in the former and out of date information and low accuracy in the latter. The recently launched LC-CCI datasets (i.e., LC-CCI2015) show a higher potential for cropland monitoring uses than the previous version (i.e., LC-CCI2010). Full article
(This article belongs to the Special Issue Validation on Global Land Cover Datasets)
Show Figures

Graphical abstract

21 pages, 5863 KiB  
Article
Detection of Irrigated Crops from Sentinel-1 and Sentinel-2 Data to Estimate Seasonal Groundwater Use in South India
by Sylvain Ferrant 1,*,†, Adrien Selles 2,3,†, Michel Le Page 1,†, Pierre-Alexis Herrault 1, Charlotte Pelletier 1, Ahmad Al-Bitar 1, Stéphane Mermoz 1, Simon Gascoin 1, Alexandre Bouvet 1, Mehdi Saqalli 4, Benoit Dewandel 2, Yvan Caballero 2, Shakeel Ahmed 3, Jean-Christophe Maréchal 2 and Yann Kerr 1
1 Centre d’Etude Spatiale de la BIOsphère-Université Paul Sabatier-Centre National de la Recherche Scientifique-Institut de Recherche pour le Développement-Centre National d’Etudes Spatiales (CESBIO-UPS-CNRS-IRD-CNES), 18 av. Ed. Belin, 31401 Toulouse CEDEX 9, France
2 Bureau de Recherches Géologiques et Minières (BRGM), Université de Montpellier, 1039 rue de Pinville, 34000 Montpellier, France
3 Indo French Center for Groundwater Research, Bureau de Recherches Géologiques et Minières (BRGM), National Geophysical Research Institute (NGRI), Uppal Road, Hyderabad 50007, India
4 Environmental Geography (GEODE), CNRS-Université Toulouse—Jean Jaurès/Maison de la Recherche/5, Allées Antonio-Machado 31058 Toulouse CEDEX 9, France
These authors contributed equally to this work.
Remote Sens. 2017, 9(11), 1119; https://doi.org/10.3390/rs9111119 - 3 Nov 2017
Cited by 90 | Viewed by 14687
Abstract
Indian agriculture relies on monsoon rainfall and irrigation from surface and groundwater. The interannual variability of monsoon rainfalls is high, which forces South Indian farmers to adapt their irrigated areas to local water availability. In this study, we have developed and tested a [...] Read more.
Indian agriculture relies on monsoon rainfall and irrigation from surface and groundwater. The interannual variability of monsoon rainfalls is high, which forces South Indian farmers to adapt their irrigated areas to local water availability. In this study, we have developed and tested a methodology for monitoring these spatiotemporal variations using Sentinel-1 and -2 observations over the Kudaliar catchment, Telangana State (~1000 km2). These free radar and optical data have been acquired since 2015 on a weekly basis over continental areas, at a high spatial resolution (10–20 m) that is well adapted to the small areas of South Indian field crops. A machine learning algorithm, the Random Forest method, was used over three growing seasons (January to March and July to November 2016 and January to March 2017) to classify small patches of inundated rice paddy, maize, and other irrigated crops, as well as surface water stored in the small reservoirs scattered across the landscape. The crop production comprises only irrigated crops (less than 20% of the areas) during the dry season (Rabi, December to March), to which rain-fed cotton is added to reach 60% of the areas during the monsoon season (Kharif, June to November). Sentinel-1 radar backscatter provides useful observations during the cloudy monsoon season. The lowest irrigated area totals were found during Rabi 2016 and Kharif 2016, accounting for 3.5 and 5% with moderate classification confusion. This confusion decreases with increasing areas of irrigated crops during Rabi 2017. During this season, 16% of rice and 6% of irrigated crops were detected after the exceptional rainfalls observed in September. Surface water in small surface reservoirs reached 3% of the total area, which corresponds to a high value. The use of both Sentinel datasets improves the method accuracy and strengthens our confidence in the resulting maps. This methodology shows the potential of automatically monitoring, in near real time, the high short term variability of irrigated area totals in South India, as a proxy for estimating irrigated water and groundwater needs. These are estimated over the study period to range from 49.5 ± 0.78 mm (1.5% uncertainty) in Rabi 2016, and 44.9 ± 2.9 mm (6.5% uncertainty) in the Kharif season, to 226.2 ± 5.8 mm (2.5% uncertainty) in Rabi 2017. This variation must be related to groundwater recharge estimates that range from 10 mm to 160 mm·yr−1 in the Hyderabad region. These dynamic agro-hydrological variables estimated from Sentinel remote sensing data are crucial in calibrating runoff, aquifer recharge, water use and evapotranspiration for the spatially distributed agro-hydrological models employed to quantify the impacts of agriculture on water resources. Full article
Show Figures

Graphical abstract

30 pages, 36583 KiB  
Article
Appling the One-Class Classification Method of Maxent to Detect an Invasive Plant Spartina alterniflora with Time-Series Analysis
by Xiang Liu 1,2,3,4, Huiyu Liu 1,2,3,4,*, Haibo Gong 1,2,3,4, Zhenshan Lin 1,2,3,4 and Shicheng Lv 5
1 College of Geography Science, Nanjing Normal University, Nanjing 210023, China
2 Key Laboratory of Virtual Geographic Environment, Nanjing Normal University, Ministry of Education, Nanjing 210023, China
3 State Key Laboratory Cultivation Base of Geographical Environment Evolution (Jiangsu Province), Nanjing 210023, China
4 Jiangsu Center for Collaborative Innovation in Geographical Information Resource Development and Application, Nanjing 210023, China
5 Yancheng National Natural Reserve, Yancheng 224333, China
Remote Sens. 2017, 9(11), 1120; https://doi.org/10.3390/rs9111120 - 4 Nov 2017
Cited by 39 | Viewed by 7823
Abstract
Spartina alterniflora has become the main invasive plant along the Chinese coast and now threatens the local ecological environment. Accurately monitoring the distribution of S. alterniflora is urgent and essential for developing cost-effective control strategies. In this study, we applied the One-Class Classification [...] Read more.
Spartina alterniflora has become the main invasive plant along the Chinese coast and now threatens the local ecological environment. Accurately monitoring the distribution of S. alterniflora is urgent and essential for developing cost-effective control strategies. In this study, we applied the One-Class Classification (OCC) methods of Maximum entropy (Maxent) and Biased Support Vector Machine (BSVM) based on Landsat time-series imagery to detect the species on the middle coast of Jiangsu in east China. We conducted four experimental setups (i.e., single-scene analysis, time-series analysis, Normalized Difference Vegetation Index (NDVI) time-series analysis and a compressed time-series analysis), using OCC methods to recognize the species. Then, we tested the performance of a compressed time-series model for S. alterniflora detection and evaluated the expansibility of this approach when it was applied to a larger region. Our principal findings are as follows: (1) Maxent and BSVM performed equally well, and Maxent appeared to have a more balanced performance over the summer months; (2) the Maxent model with the Default Parameter Set (Maxent-DPS) showed a slightly higher accuracy and more overfitting than Maxent with the Akaike Information Criterion corrected for small samples sizes (AICc)-selected parameter set model, but a t-test found no significant difference between these two settings; (3) April and December were deemed to be important periods for the detection of S. alterniflora; (4) a compressed time-series analysis model—including only three variables (December NDVI, March green and the third Principal Component in January, PC3)—yielded higher accuracy than single-scene analyses, which indicated that time-series analysis can better detect S. alterniflora than single-scene analyses; and (5) the Maxent model using the reconstructed optimal variables and 70 training samples over a larger region produced encouraging results with an overall accuracy of 90.88% and a Kappa of 0.78. The one-class classification method combined with a phenology-based detection strategy is therefore promising for the application of the long-term detection of S. alterniflora over extended areas. Full article
(This article belongs to the Section Remote Sensing in Agriculture and Vegetation)
Show Figures

Graphical abstract

15 pages, 4034 KiB  
Article
Combining Estimation of Green Vegetation Fraction in an Arid Region from Landsat 7 ETM+ Data
by Kun Jia 1,2,*, Yuwei Li 1,2, Shunlin Liang 1,2,3, Xiangqin Wei 4 and Yunjun Yao 1,2
1 State Key Laboratory of Remote Sensing Science, Faculty of Geographical Science, Beijing Normal University, Beijing 100875, China
2 Beijing Engineering Research Center for Global Land Remote Sensing Products, Institute of Remote Sensing Science and Engineering, Faculty of Geographical Science, Beijing Normal University, Beijing 100875, China
3 Department of Geographical Sciences, University of Maryland, College Park, MD 20742, USA
4 Institute of Remote Sensing and Digital Earth, Chinese Academy of Sciences, Beijing 100101, China
Remote Sens. 2017, 9(11), 1121; https://doi.org/10.3390/rs9111121 - 3 Nov 2017
Cited by 28 | Viewed by 5772
Abstract
Fractional vegetation cover (FVC), or green vegetation fraction, is an important parameter for characterizing conditions of the land surface vegetation, and also a key variable of models for simulating cycles of water, carbon and energy on the land surface. There are several types [...] Read more.
Fractional vegetation cover (FVC), or green vegetation fraction, is an important parameter for characterizing conditions of the land surface vegetation, and also a key variable of models for simulating cycles of water, carbon and energy on the land surface. There are several types of FVC estimation models using remote sensing data, and evaluating their performance over a specific region is of great significance. Therefore, this study firstly evaluated three types of FVC estimation models using Landsat 7 ETM+ data in an agriculture region of Heihe River Basin, China, and then proposed a combination strategy from different individual models to improve the FVC estimation accuracy, which employed the multiple linear regression (MLR) and Bayesian model average (BMA) methods. The validation results indicated that the spectral mixture analysis model with three endmembers (SMA3) achieved the best FVC estimation accuracy (determination coefficient (R2) = 0.902, root mean square error (RMSE) = 0.076) among the seven individual models using Landsat 7 ETM+ data. In addition, the MLR and BMA combination methods could both improve FVC estimation accuracy (R2 = 0.913, RMSE = 0.063 and R2 = 0.904, RMSE = 0.069 for MLR and BMA, respectively). Therefore, it could be concluded that both MLR and BMA combination methods integrating FVC estimates from different models using Landsat 7 ETM+ data could effectively weaken the estimation errors of individual models and improve the final FVC estimation accuracy. Full article
(This article belongs to the Section Forest Remote Sensing)
Show Figures

Graphical abstract

18 pages, 10666 KiB  
Article
Fusion of Multi-Source Satellite Data and DEMs to Create a New Glacier Inventory for Novaya Zemlya
by Philipp Rastner 1,*, Tazio Strozzi 2 and Frank Paul 1
1 Department of Geography, University of Zurich, 8057 Zurich, Switzerland
2 Gamma Remote Sensing, 3073 Gümligen, Switzerland
Remote Sens. 2017, 9(11), 1122; https://doi.org/10.3390/rs9111122 - 4 Nov 2017
Cited by 22 | Viewed by 7600
Abstract
Monitoring glacier changes in remote Arctic regions are strongly facilitated by satellite data. This is especially true for the Russian Arctic where recently increased optical and SAR satellite imagery (Landsat 8 OLI, Sentinel 1/2), and digital elevation models (TanDEM-X, ArcticDEM) are becoming available. [...] Read more.
Monitoring glacier changes in remote Arctic regions are strongly facilitated by satellite data. This is especially true for the Russian Arctic where recently increased optical and SAR satellite imagery (Landsat 8 OLI, Sentinel 1/2), and digital elevation models (TanDEM-X, ArcticDEM) are becoming available. These datasets offer new possibilities to create high-quality glacier inventories. Here, we present a new glacier inventory derived from a fusion of multi-source satellite data for Novaya Zemlya in the Russian Arctic. We mainly used Landsat 8 OLI data to automatically map glaciers with the band ratio method. Missing debris-covered glacier parts and misclassified lakes were manually corrected. Whereas perennial snow fields were a major obstacle in glacier identification, seasonal snow was identified and removed using Landsat 5 TM scenes from the year 1998. Drainage basins were derived semi-automatically using the ArcticDEM (gap-filled by the ASTER GDEM V2) and manually corrected using fringes from ALOS PALSAR. The new glacier inventory gives a glacierized area of 22,379 ± 246.16 km2 with 1474 glacier entities >0.05 km2. The region is dominated by large glaciers, as 909 glaciers <0.5 km2 (62% by number) cover only 156 ± 1.7 km2 or 0.7% of the area, whereas 49 glaciers >100 km2 (3.3% by number) cover 18,724 ± 205.9 km2 or 84%. In total, 41 glaciers are marine terminating covering an area of 16,063.7 ± 118.8 km2. The mean elevation is 596 m for all glaciers in the study region (528 m in the northern part, 641 in the southern part). South-east (north-west) facing glaciers cover >35% (20%) of the area. For the smaller glaciers in the southern part we calculated an area loss of ~5% (52.5 ± 4.5 km2) from 2001 to 2016. Full article
(This article belongs to the Special Issue Remote Sensing of Glaciers)
Show Figures

Graphical abstract

16 pages, 5348 KiB  
Article
Assessment of MODIS BRDF/Albedo Model Parameters (MCD43A1 Collection 6) for Directional Reflectance Retrieval
by Xianghong Che 1,2,3, Min Feng 3,*, Joseph O. Sexton 3, Saurabh Channan 3, Yaping Yang 1,4 and Qing Sun 5
1 State Key Laboratory of Resources and Environmental Information System, Institute of Geographic Sciences and Natural Resources Research, Chinese Academy of Sciences, Beijing 100101, China
2 University of Chinese Academy of Sciences, Beijing 100049, China
3 Global Land Cover Facility, Department of Geographical Sciences, University of Maryland, College Park, MD 20742, USA
4 Jiangsu Center for Collaborative Innovation in Geographical Information Resource Development and Application, Nanjing 210023, China
5 Collaborative Innovation Center on Forecast and Evaluation of Meteorological Disasters (CIC-FEMD), Nanjing University of Information Science & Technology, Nanjing 210044, China
Remote Sens. 2017, 9(11), 1123; https://doi.org/10.3390/rs9111123 - 4 Nov 2017
Cited by 17 | Viewed by 7569
Abstract
Measurements of solar radiation reflected from Earth’s surface are the basis for calculating albedo, vegetation indices, and other terrestrial attributes. However, the “bi-directional” geometry of illumination and viewing (i.e., the Bi-directional Reflectance Distribution Function (BRDF)) impacts reflectance and all variables derived or estimated [...] Read more.
Measurements of solar radiation reflected from Earth’s surface are the basis for calculating albedo, vegetation indices, and other terrestrial attributes. However, the “bi-directional” geometry of illumination and viewing (i.e., the Bi-directional Reflectance Distribution Function (BRDF)) impacts reflectance and all variables derived or estimated based on these data. The recently released MODIS BRDF/Albedo Model Parameters (MCD43A1 Collection 6) dataset enables retrieval of directional reflectance at arbitrary solar and viewing angles, potentially increasing precision and comparability of data collected under different illumination and observation geometries. We quantified the ability of MCD43A1 Collection 6 for retrieving directional reflectance and compared the daily Collection 6 retrievals to those of MCD43A1 Collection 5, which are retrieved on an eight-day basis. Correcting MODIS-based estimates of surface reflectance from the illumination and viewing geometry of the Terra satellite (MOD09GA) to that of the MODIS Aqua (MYD09GA) overpass, as well as MCD43A4 Collection 6 and Landsat-5 TM images show that the BRDF correction of MCD43A1 Collection 6 results in greater consistency among datasets, with higher R2 (0.63–0.955), regression slopes closer to unity (0.718–0.955), lower root mean squared difference (RMSD) (0.422–3.142), and lower mean absolute error (MAE) (0.282–1.735) compared to the Collection 5 data. Smaller levels of noise (observed as high-frequency variability within the time series) in MCD43A1 Collection 6 in comparison to Collection 5 corroborates the improvement of BRDF parameters time series. These results corroborates that the daily MCD43A1 Collection 6 product represents the anisotropy of surface features and results in more precise directional reflectance derivation at any solar and viewing geometry than did the previous Collection 5. Full article
Show Figures

Graphical abstract

15 pages, 3638 KiB  
Article
Temporal Evolution of Regional Drought Detected from GRACE TWSA and CCI SM in Yunnan Province, China
by Siyu Ma 1,2, Qianxin Wu 1,2, Jie Wang 3 and Shiqiang Zhang 1,2,*
1 Shaanxi Key Laboratory of Earth Surface System and Environmental Carrying Capacity, Northwest University, Xi’an 710127, China
2 College of Urban and Environmental Science, Northwest University, Xi’an 710127, China
3 Yunnan Institute of Water Resources and Hydropower Research, Kunming 650221, China
Remote Sens. 2017, 9(11), 1124; https://doi.org/10.3390/rs9111124 - 4 Nov 2017
Cited by 36 | Viewed by 6357
Abstract
Droughts are one of the most devastating natural disasters, which impose increasing risks to humanity and the environment in the 21st century. The recent and continuous drought in China has led to detrimental effects on the local environment and societies in Yunnan Province, [...] Read more.
Droughts are one of the most devastating natural disasters, which impose increasing risks to humanity and the environment in the 21st century. The recent and continuous drought in China has led to detrimental effects on the local environment and societies in Yunnan Province, thus there is an urgent need to monitor the spatial and temporal evolution of the drought. The characteristics of the spatial distribution of drought processes and the impact of droughts on soil moisture and water storage remains unclear. In this study, the direction, magnitude, start time, and duration of droughts were investigated, based on Total Water Storage Anomalies (TWSA) of Gravity Recovery and Climate Experiment (GRACE), Climate Change Initiative Soil Moisture (CCI SM), and observed precipitation data. The spatial patterns of TWSA trends at each time duration segment suggest that the evolution of drought processes is very complex, and can be clustered into three zones. The spatial distribution of TWSA revealed that the drought status lasted more than one year longer in the north and east parts compared to other parts of Yunnan Province. Water losses occurred in the south part, while water gains were found in the central, north, and east parts of Yunnan Province, from 2002 to 2014, indicating a higher possibility of droughts in the south part in the future. Both de-seasonalized TWSA and CCI SM effectively captured the serious drought from 2009 to 2010 in Yunnan, and their spatial patterns were found to be consistent. The drought detected from CCI SMA had a one-month lag and TWSA had a two-month lag, in comparison to the meteorological drought from precipitation data, which indicates that the drought data derived from CCI SMA and TWSA are better able to represent the impact of droughts, particularly on agriculture. The contribution of surface SM changes in TWSA was determined to be about 41.94%, suggesting that variations in soil moisture only explain less than half of the total water storage change. GRACE observations and CCI SM can be used as important indicators of the spatial distribution of the drought process and its impact on the environment and local communities, which will improve the management of water resources and early detection and monitoring of droughts. Full article
(This article belongs to the Section Remote Sensing in Geology, Geomorphology and Hydrology)
Show Figures

Graphical abstract

28 pages, 77982 KiB  
Article
A Spatio-Temporal Data Fusion Model for Generating NDVI Time Series in Heterogeneous Regions
by Chunhua Liao 1,*, Jinfei Wang 1, Ian Pritchard 1, Jiangui Liu 2 and Jiali Shang 2
1 Department of Geography, Western University, London, ON N6A 5C2, Canada
2 Science and Technology Branch, Agriculture and Agri-Food Canada, 960 Carling Ave., Ottawa, ON K1A 0C6, Canada
Remote Sens. 2017, 9(11), 1125; https://doi.org/10.3390/rs9111125 - 4 Nov 2017
Cited by 50 | Viewed by 10438
Abstract
Time series vegetation indices with high spatial resolution and high temporal frequency are important for crop growth monitoring and management. However, due to technical constraints and cloud contamination, it is difficult to obtain such datasets. In this study, a spatio-temporal vegetation index image [...] Read more.
Time series vegetation indices with high spatial resolution and high temporal frequency are important for crop growth monitoring and management. However, due to technical constraints and cloud contamination, it is difficult to obtain such datasets. In this study, a spatio-temporal vegetation index image fusion model (STVIFM) was developed to generate high spatial resolution Normalized Difference Vegetation Index (NDVI) time-series images with higher accuracy, since most of the existing methods have some limitations in accurately predicting NDVI in heterogeneous regions, or rely on very computationally intensive steps and land cover maps for heterogeneous regions. The STVIFM aims to predict the fine-resolution NDVI through understanding the contribution of each fine-resolution pixel to the total NDVI change, which was calculated from the coarse-resolution images acquired on two dates. On the one hand, it considers the difference in relationships between the fine- and coarse-resolution images on different dates and the difference in NDVI change rates at different growing stages. On the other hand, it neither needs to search similar pixels nor needs to use land cover maps. The Landsat-8 and MODIS data acquired over three test sites with different landscapes were used to test the spatial and temporal performance of the proposed model. Compared with the spatial and temporal adaptive reflectance fusion model (STARFM), enhanced spatial and temporal adaptive reflectance fusion model (ESTARFM) and the flexible spatiotemporal data fusion (FSDAF) method, the proposed STVIFM outperforms the STARFM and ESTARFM at three study sites and different stages when the land cover or NDVI changes were captured by the two pairs of fine- and coarse-resolution images, and it is more robust and less computationally intensive than the FSDAF. Full article
Show Figures

Graphical abstract

18 pages, 13712 KiB  
Article
A Strategy of Rapid Extraction of Built-Up Area Using Multi-Seasonal Landsat-8 Thermal Infrared Band 10 Images
by Ping Zhang 1,2, Qiangqiang Sun 1, Ming Liu 1, Jing Li 1 and Danfeng Sun 1,2,*
1 Land Resources and Management Department, College of Natural Resources and Environmental Sciences, China Agricultural University, Beijing 100094, China
2 Key Laboratory of Remote Sensing for Agri-Hazards, Ministry of Agriculture, Beijing 100083, China
Remote Sens. 2017, 9(11), 1126; https://doi.org/10.3390/rs9111126 - 4 Nov 2017
Cited by 24 | Viewed by 5600
Abstract
Recently, studies have focused more attention on surface feature extraction using thermal infrared remote sensing (TIRS) as supplementary materials. Innovatively, in this paper, using three-date (winter, early spring, and end of spring) TIRS Band 10 images of Landsat-8, we proposed an empirical normalized [...] Read more.
Recently, studies have focused more attention on surface feature extraction using thermal infrared remote sensing (TIRS) as supplementary materials. Innovatively, in this paper, using three-date (winter, early spring, and end of spring) TIRS Band 10 images of Landsat-8, we proposed an empirical normalized difference of a seasonal brightness temperature index (NDSTI) for enhancing a built-up area based on the contrast heat emission seasonal response of a built-up area to solar radiation, and adopted a decision tree classification method for the rapidly accurate extraction of the built-up area. Four study areas, including one major experimental study area (Tangshan) and three verification areas (Minqin, Laizhou, and Yugan) in different climate zones, respectively, were used to empirically establish the overall strategy system, then we specified constrained conditions of this strategy. Moreover, we compared the NDSTI to the current built-up indices, respectively, for extracting the built-up area. The results showed that (1) the new index (NDSTI) exploited the seasonal thermal characteristic variation between the built-up area and other covers in the time series analysis, helping achieve more accurate built-up area extraction than other spectral indices; (2) this strategy could effectively realize rapid built-up area extraction with generally satisfied overall accuracy (over 80%), and was especially excellent in Tangshan and Laizhou; however, (3) it may be constrained by climate patterns and other surface characteristics, which need to be improved from the view of the results of Minqin and Yugan. In summary, the method developed in this study has the potential and advantage to extract the built-up area rapidly from the multi-seasonal thermal infrared remote sensing data. It could be an operative tool for long-term monitoring of built-up areas efficiently and for more applications of thermal infrared images in the future. Full article
Show Figures

Graphical abstract

8 pages, 4334 KiB  
Communication
On the Spatial and Temporal Sampling Errors of Remotely Sensed Precipitation Products
by Ali Behrangi * and Yixin Wen
Jet Propulsion Laboratory, California Institute of Technology, 4800 Oak Grove Drive, MS 233-302E, Pasadena, CA 91109, USA
Remote Sens. 2017, 9(11), 1127; https://doi.org/10.3390/rs9111127 - 5 Nov 2017
Cited by 33 | Viewed by 5257
Abstract
Observation with coarse spatial and temporal sampling can cause large errors in quantification of the amount, intensity, and duration of precipitation events. In this study, the errors resulting from temporal and spatial sampling of precipitation events were quantified and examined using the latest [...] Read more.
Observation with coarse spatial and temporal sampling can cause large errors in quantification of the amount, intensity, and duration of precipitation events. In this study, the errors resulting from temporal and spatial sampling of precipitation events were quantified and examined using the latest version (V4) of the Global Precipitation Measurement (GPM) mission integrated multi-satellite retrievals for GPM (IMERG), which is available since spring of 2014. Relative mean square error was calculated at 0.1° × 0.1° every 0.5 h between the degraded (temporally and spatially) and original IMERG products. The temporal and spatial degradation was performed by producing three-hour (T3), six-hour (T6), 0.5° × 0.5° (S5), and 1.0° × 1.0° (S10) maps. The results show generally larger errors over land than ocean, especially over mountainous regions. The relative error of T6 is almost 20% larger than T3 over tropical land, but is smaller in higher latitudes. Over land relative error of T6 is larger than S5 across all latitudes, while T6 has larger relative error than S10 poleward of 20°S–20°N. Similarly, the relative error of T3 exceeds S5 poleward of 20°S–20°N, but does not exceed S10, except in very high latitudes. Similar results are also seen over ocean, but the error ratios are generally less sensitive to seasonal changes. The results also show that the spatial and temporal relative errors are not highly correlated. Overall, lower correlations between the spatial and temporal relative errors are observed over ocean than over land. Quantification of such spatiotemporal effects provides additional insights into evaluation studies, especially when different products are cross-compared at a range of spatiotemporal scales. Full article
Show Figures

Graphical abstract

21 pages, 2837 KiB  
Article
A Flexible Algorithm for Detecting Challenging Moving Objects in Real-Time within IR Video Sequences
by Andrea Zingoni 1,*, Marco Diani 2 and Giovanni Corsini 1
1 Department of Information Engineering, University of Pisa, Via G. Caruso 16, 56122 Pisa, Italy
2 Italian Naval Academy, Viale Italia 72, 57127 Livorno, Italy
Remote Sens. 2017, 9(11), 1128; https://doi.org/10.3390/rs9111128 - 6 Nov 2017
Cited by 15 | Viewed by 5565
Abstract
Real-time detecting moving objects in infrared video sequences may be particularly challenging because of the characteristics of the objects, such as their size, contrast, velocity and trajectory. Many proposed algorithms achieve good performances but only in the presence of some specific kinds of [...] Read more.
Real-time detecting moving objects in infrared video sequences may be particularly challenging because of the characteristics of the objects, such as their size, contrast, velocity and trajectory. Many proposed algorithms achieve good performances but only in the presence of some specific kinds of objects, or by neglecting the computational time, becoming unsuitable for real-time applications. To obtain more flexibility in different situations, we developed an algorithm capable of successfully dealing with small and large objects, slow and fast objects, even if subjected to unusual movements, and poorly-contrasted objects. The algorithm is also capable to handle the contemporary presence of multiple objects within the scene and to work in real-time even using cheap hardware. The implemented strategy is based on a fast but accurate background estimation and rejection, performed pixel by pixel and updated frame by frame, which is robust to possible background intensity changes and to noise. A control routine prevents the estimation from being biased by the transit of moving objects, while two noise-adaptive thresholding stages, respectively, drive the estimation control and allow extracting moving objects after the background removal, leading to the desired detection map. For each step, attention has been paid to develop computationally light solution to achieve the real-time requirement. The algorithm has been tested on a database of infrared video sequences, obtaining promising results against different kinds of challenging moving objects and outperforming other commonly adopted solutions. Its effectiveness in terms of detection performance, flexibility and computational time make the algorithm particularly suitable for real-time applications such as intrusion monitoring, activity control and detection of approaching objects, which are fundamental task in the emerging research area of Smart City. Full article
Show Figures

Graphical abstract

22 pages, 89446 KiB  
Article
Deriving 3-D Time-Series Ground Deformations Induced by Underground Fluid Flows with InSAR: Case Study of Sebei Gas Fields, China
by Xiaoge Liu 1, Jun Hu 1,*, Qian Sun 2, Zhiwei Li 1 and Jianjun Zhu 1
1 School of Geosciences and Info-Physics, Central South University, Changsha 410083, China
2 College of Resources and Environmental Science, Hunan Normal University, Changsha 410081, China
Remote Sens. 2017, 9(11), 1129; https://doi.org/10.3390/rs9111129 - 6 Nov 2017
Cited by 11 | Viewed by 5472
Abstract
Multi-temporal Interferometric Synthetic Aperture Radar (MT-InSAR) technique has proven to be a powerful tool for the monitoring of time-series ground deformations along the line-of-sight (LOS) direction. However, the one-dimensional (1-D) measurements cannot provide comprehensive information for interpreting the related geo-hazards. Recently, a novel [...] Read more.
Multi-temporal Interferometric Synthetic Aperture Radar (MT-InSAR) technique has proven to be a powerful tool for the monitoring of time-series ground deformations along the line-of-sight (LOS) direction. However, the one-dimensional (1-D) measurements cannot provide comprehensive information for interpreting the related geo-hazards. Recently, a novel method has been proposed to map the three-dimensional (3-D) deformation associated with underground fluid flows based on single-track InSAR LOS measurements and the deformation modeling associated with the Green’s function. In this study, the method is extended in temporal domain by exploiting the MT-InSAR measurements, and applied for the first time to investigate the 3-D time series deformation over Sebei gas field in Qinghai, Northwest China with 37 Sentinel-1 images acquired during October 2014–July 2017. The estimated 3-D time series deformations provide a more complete view of ongoing deformation processes as compared to the 1-D time series deformations or the 3-D deformation velocities, which is of great importance for assessing the possible geohazards. In addition, the extended method allows for the retrieval of time series of fluid volume changes due to the gas extraction in the Sebei field, which agrees well with those from the PetroChina Qinghai Oilfield Company Yearbooks (PQOCYs). This provides a new way to study the variations of subsurface fluids at unprecedented resolution. Full article
(This article belongs to the Special Issue Radar Interferometry for Geohazards)
Show Figures

Graphical abstract

25 pages, 8764 KiB  
Article
Optimizing the Timing of Unmanned Aerial Vehicle Image Acquisition for Applied Mapping of Woody Vegetation Species Using Feature Selection
by Gilad Weil 1,2,*, Itamar M. Lensky 3, Yehezkel S. Resheff 4,5 and Noam Levin 1
1 Department of Geography, The Hebrew University of Jerusalem, 91905 Jerusalem, Israel
2 Israel Nature and Parks Authority, 3 Am Ve Olamo Street, 95463 Jerusalem, Israel
3 Department of Geography and Environment, Bar Ilan University, 52900 Ramat Gan, Israel
4 Edmond and Lily Safra Center for Brain Sciences, The Hebrew University of Jerusalem, 91905 Jerusalem, Israel
5 3P Labs, 9432526 Jerusalem, Israel
Remote Sens. 2017, 9(11), 1130; https://doi.org/10.3390/rs9111130 - 6 Nov 2017
Cited by 30 | Viewed by 6737
Abstract
Most recent studies relating to the classification of vegetation species on the individual level use cutting-edge sensors and follow a data-driven approach, aimed at maximizing classification accuracy within a relatively small allocated area of optimal conditions. However, this approach does not incorporate cost-benefit [...] Read more.
Most recent studies relating to the classification of vegetation species on the individual level use cutting-edge sensors and follow a data-driven approach, aimed at maximizing classification accuracy within a relatively small allocated area of optimal conditions. However, this approach does not incorporate cost-benefit considerations or the ability of applying the chosen methodology for applied mapping over larger areas with higher natural heterogeneity. In this study, we present a phenology-based cost-effective approach for optimizing the number and timing of unmanned aerial vehicle (UAV) imagery acquisition, based on a priori near-surface observations. A ground-placed camera was used in order to generate annual time series of nine spectral indices and three color conversions (red, green and blue to hue, saturation and value) in four different East Mediterranean sites that represent different environmental conditions. After outliers’ removal, the time series dataset represented 1852 individuals of 12 common vegetation species and annual herbaceous patches. A feature selection process was used for identifying the optimal dates for species classification in every site. The feature selection can be designed for various objectives, e.g., optimization of overall classification, discrimination between two species, or discrimination of one species from all others. In order to evaluate the a priori findings, a UAV was flown for acquiring five overhead multiband orthomosaics (five bands in the visible-near infrared range based on the five optimal dates identified in the feature selection of the near-surface time series of the previous year. An object-based classification methodology was used for the discrimination of 976 individuals of nine species and annual herbaceous patches in the UAV imagery, and resulted in an average overall accuracy of 85% and an average Kappa coefficient of 0.82. This cost-effective approach has high potential for detailed vegetation mapping, regarding the accessibility of UAV-produced time series, compared to hyper-spectral imagery with high spatial resolution which is more expensive and involves great difficulties in implementation over large areas. Full article
(This article belongs to the Section Remote Sensing in Agriculture and Vegetation)
Show Figures

Graphical abstract

20 pages, 4243 KiB  
Article
Performance of Three MODIS Fire Products (MCD45A1, MCD64A1, MCD14ML), and ESA Fire_CCI in a Mountainous Area of Northwest Yunnan, China, Characterized by Frequent Small Fires
by Davide Fornacca 1,2,3, Guopeng Ren 1,3 and Wen Xiao 1,3,*
1 Institute of Eastern-Himalaya Biodiversity Research, Dali University, Hongsheng Rd. 2, Dali 671003, China
2 Institute for Environmental Sciences, University of Geneva, 66 Boulevard Carl Vogt, 1205 Geneva, Switzerland
3 Collaborative Innovation Center for Biodiversity and Conservation in the Three Parallel Rivers Region of China, Dali 671003, China
Remote Sens. 2017, 9(11), 1131; https://doi.org/10.3390/rs9111131 - 6 Nov 2017
Cited by 98 | Viewed by 10003
Abstract
An increasing number of end-users looking for ground data about fire activity in regions where accurate official datasets are not available adopt a free-of-charge global burned area (BA) and active fire (AF) products for applications at the local scale. One of the pressing [...] Read more.
An increasing number of end-users looking for ground data about fire activity in regions where accurate official datasets are not available adopt a free-of-charge global burned area (BA) and active fire (AF) products for applications at the local scale. One of the pressing requirements from the user community is an improved ability to detect small fires (less than 50 ha), whose impact on terrestrial environments is empirically known but poorly quantified, and is often excluded from global earth system models. The newest generation of BA algorithms combines the capabilities of both the BA and AF detection approaches, resulting in a general improvement of detection compared to their predecessors. Accuracy assessments of these products have been done in several ecosystems; but more complex ones, such as regions that are characterized by frequent small fires and steep terrain has never been assessed. This study contributes to the understanding of the performance of global BA and AF products with a first assessment of four selected datasets: MODIS-based MCD45A1; MCD64A1; MCD14ML; and, ESA’s Fire_CCI in a mountainous region of northwest Yunnan; P.R. China. Due to the medium to coarse resolution of the tested products and the reduced sizes of fires (often smaller than 50 ha) we used a polygon intersection assessment method where the number and locations of fire events extracted from each dataset were compared against a reference dataset that was compiled using Landsat scenes. The results for the two sample years (2006 and 2009) show that the older, non-hybrid products MCD45A1 and, MCD14ML were the best performers with Sørensen index (F1 score) reaching 0.42 and 0.26 in 2006, and 0.24 and 0.24 in 2009, respectively, while producer’s accuracies (PA) were 30% and 43% in 2006, and 16% and 47% in 2009, respectively. All of the four tested products obtained higher probabilities of detection when smaller fires were excluded from the assessment, with PAs for fires bigger than 50 ha being equal to 53% and 61% in 2006, 41% and 66% in 2009 for MCD45A1 and MCD14ML, respectively. Due to the technical limitations of the satellites’ sensors, a relatively low performance of the four products was expected. Surprisingly, the new hybrid algorithms produced worse results than the former two. Fires smaller than 50 ha were poorly detected by the products except for the only AF product. These findings are significant for the future design of improved algorithms aiming for increased detection of small fires in a greater diversity of ecosystems. Full article
(This article belongs to the Special Issue Mountain Remote Sensing)
Show Figures

Graphical abstract

19 pages, 6398 KiB  
Article
Assessment of WorldView-3 Data for Lithological Mapping
by Bei Ye 1, Shufang Tian 1,*, Jia Ge 2 and Yaqin Sun 3
1 School of Earth Sciences and Resources, China University of Geosciences (Beijing), Beijing 100083, China
2 Oil and Gas Survey, China Geological Survey, Beijing 100083, China
3 China Aero Geophysical Survey and Remote Sensing Center (AGRS), Beijing 100083, China
Remote Sens. 2017, 9(11), 1132; https://doi.org/10.3390/rs9111132 - 6 Nov 2017
Cited by 68 | Viewed by 10026
Abstract
The WorldView-3 (WV-3) satellite is a new sensor with high spectral resolution, which equips eight multispectral bands in the visible and near-infrared (VNIR) and additional eight bands in the shortwave infrared (SWIR). In order to meet the requirements of large-scale geological mapping, this [...] Read more.
The WorldView-3 (WV-3) satellite is a new sensor with high spectral resolution, which equips eight multispectral bands in the visible and near-infrared (VNIR) and additional eight bands in the shortwave infrared (SWIR). In order to meet the requirements of large-scale geological mapping, this paper assessed WV-3 data for lithological mapping in comparison with Advanced Spaceborne Thermal Emission and Reflection Radiometer (ASTER) and Operational Land Imager (OLI/Landsat-8) data. The study area is located in the Pobei area of the Xinjiang Uygur Autonomous Region, where bedrock outcrops are widely distributed. The whole experiment was divided into six steps: data pre-processing, visual interpretation of various lithological units, samples procedure, lithological mapping by a support vector machine algorithm (SVM), accuracy evaluation, and assessment. The results showed that the classification accuracy of WV-3 data was 87%, which kept 17% higher than that of ASTER data, 14% higher than that of OLI/Landsat-8 data, indicated that WV-3 data contained more diagnostic absorption features mainly thanks to its SWIR bands, and benefited by its high spatial resolution, as well. However, it also confirmed that there were some considerable flaws, such as the confusing identification of biotite-quartz schist. Overall, the WV-3 data is still the most promising data for geological applications currently. Full article
(This article belongs to the Section Remote Sensing in Geology, Geomorphology and Hydrology)
Show Figures

Graphical abstract

16 pages, 1591 KiB  
Technical Note
Predicting Top-of-Atmosphere Thermal Radiance Using MERRA-2 Atmospheric Data with Deep Learning
by Tania Kleynhans *, Matthew Montanaro, Aaron Gerace and Christopher Kanan
Chester F. Carlson Center for Imaging Science, Rochester Institute of Technology, 54 Lomb Memorial Drive, Rochester, NY 14623, USA
Remote Sens. 2017, 9(11), 1133; https://doi.org/10.3390/rs9111133 - 7 Nov 2017
Cited by 35 | Viewed by 6304
Abstract
Image data from space-borne thermal infrared (IR) sensors are used for a variety of applications, however they are often limited by their temporal resolution (i.e., repeat coverage). To potentially increase the temporal availability of thermal image data, a study was performed to determine [...] Read more.
Image data from space-borne thermal infrared (IR) sensors are used for a variety of applications, however they are often limited by their temporal resolution (i.e., repeat coverage). To potentially increase the temporal availability of thermal image data, a study was performed to determine the extent to which thermal image data can be simulated from available atmospheric and surface data. The work conducted here explored the use of Modern-Era Retrospective analysis for Research and Applications, Version 2 (MERRA-2) developed by The National Aeronautics and Space Administration (NASA) to predict top-of-atmosphere (TOA) thermal IR radiance globally at time scales finer than available satellite data. For this case study, TOA radiance data was derived for band 31 (10.97 μ m) of the Moderate-Resolution Imaging Spectroradiometer (MODIS) sensor. Two approaches have been followed, namely an atmospheric radiative transfer forward modeling approach and a supervised learning approach. The first approach uses forward modeling to predict TOA radiance from the available surface and atmospheric data. The second approach applied four different supervised learning algorithms to the atmospheric data. The algorithms included a linear least squares regression model, a non-linear support vector regression (SVR) model, a multi-layer perceptron (MLP), and a convolutional neural network (CNN). This research found that the multi-layer perceptron model produced the lowest overall error rates with an root mean square error (RMSE) of 1.36 W/m 2 ·sr· μ m when compared to actual Terra/MODIS band 31 image data. These studies found that for radiances above 6 W/m 2 ·sr· μ m, the forward modeling approach could predict TOA radiance to within 12 percent, and the best supervised learning approach can predict TOA to within 11 percent. Full article
(This article belongs to the Section Atmospheric Remote Sensing)
Show Figures

Graphical abstract

15 pages, 6289 KiB  
Article
Improving Rainfall Erosivity Estimates Using Merged TRMM and Gauge Data
by Hongfen Teng 1, Ziqiang Ma 1, Adrian Chappell 2, Zhou Shi 1,*, Zongzheng Liang 1 and Wu Yu 3
1 Institute of Agricultural Remote Sensing and Information Technology Application, College of Environmental and Resource Sciences, Zhejiang University, Hangzhou 310058, China
2 School of Earth and Ocean Science, Cardiff University, Cardiff CF10 3XQ, UK
3 College of Resource and Environment, Tibet University, Nyingchi 860114, China
Remote Sens. 2017, 9(11), 1134; https://doi.org/10.3390/rs9111134 - 6 Nov 2017
Cited by 36 | Viewed by 5781
Abstract
Soil erosion is a global issue that threatens food security and causes environmental degradation. Management of water erosion requires accurate estimates of the spatial and temporal variations in the erosive power of rainfall (erosivity). Rainfall erosivity can be estimated from rain gauge stations [...] Read more.
Soil erosion is a global issue that threatens food security and causes environmental degradation. Management of water erosion requires accurate estimates of the spatial and temporal variations in the erosive power of rainfall (erosivity). Rainfall erosivity can be estimated from rain gauge stations and satellites. However, the time series rainfall data that has a high temporal resolution are often unavailable in many areas of the world. Satellite remote sensing allows provision of the continuous gridded estimates of rainfall, yet it is generally characterized by significant bias. Here we present a methodology that merges daily rain gauge measurements and the Tropical Rainfall Measuring Mission (TRMM) 3B42 data using collocated cokriging (ColCOK) to quantify the spatial distribution of rainfall and thereby to estimate rainfall erosivity across China. This study also used block kriging (BK) and TRMM to estimate rainfall and rainfall erosivity. The methodologies are evaluated based on the individual rain gauge stations. The results from the present study generally indicate that the ColCOK technique, in combination with TRMM and gauge data, provides merged rainfall fields with good agreement with rain gauges and with the best accuracy with rainfall erosivity estimates, when compared with BK gauges and TRMM alone. Full article
Show Figures

Graphical abstract

20 pages, 6138 KiB  
Article
A Novel Method of Unsupervised Change Detection Using Multi-Temporal PolSAR Images
by Wensong Liu 1, Jie Yang 1,*, Jinqi Zhao 1,2 and Le Yang 1
1 State Key Laboratory of Information Engineering in Surveying, Mapping and Remote Sensing, Wuhan University, Wuhan 430079, China
2 Huffington Department of Earth Sciences, Southern Methodist University, Dallas, TX 75275, USA
Remote Sens. 2017, 9(11), 1135; https://doi.org/10.3390/rs9111135 - 6 Nov 2017
Cited by 23 | Viewed by 4598
Abstract
The existing unsupervised change detection methods using full-polarimetric synthetic aperture radar (PolSAR) do not use all the polarimetric information, and the results are subject to the influence of noise. In order to solve these problems, a novel automatic and unsupervised change detection approach [...] Read more.
The existing unsupervised change detection methods using full-polarimetric synthetic aperture radar (PolSAR) do not use all the polarimetric information, and the results are subject to the influence of noise. In order to solve these problems, a novel automatic and unsupervised change detection approach based on multi-temporal full PolSAR images is presented in this paper. The proposed method integrates the advantages of the test statistic, generalized statistical region merging (GSRM), and generalized Gaussian mixture model (GMM) techniques. It involves three main steps: (1) the difference image (DI) is obtained by the likelihood-ratio parameter based on a test statistic; (2) the GSRM method is applied to the DI; and (3) the DI, after segmentation, is automatically analyzed by the generalized GMM to generate the change detection map. The generalized GMM is derived under a non-Gaussian assumption for modeling the distributions of the changed and unchanged classes, and automatically identifies the optimal number of components. The efficiency of the proposed method is demonstrated with multi-temporal PolSAR images acquired by Radarsat-2 over the city of Wuhan in China. The experimental results show that the overall accuracy of the change detection results is improved and the false alarm rate reduced, when compared with some of the traditional change detection methods. Full article
(This article belongs to the Section Remote Sensing Image Processing)
Show Figures

Graphical abstract

16 pages, 14254 KiB  
Article
Urban Sprawl and Adverse Impacts on Agricultural Land: A Case Study on Hyderabad, India
by Murali Krishna Gumma 1,*, Irshad Mohammad 1, Swamikannu Nedumaran 1, Anthony Whitbread 1 and Carl Johan Lagerkvist 2
1 Remote sensing/GIS Lab, Innovation Systems for the Drylands Program (ISD), International Crops Research Institute for the Semi-Arid Tropics (ICRISAT), Patancheru-502324, India
2 Department of Economics, Swedish University of Agricultural Sciences, 75007 Uppsala, Sweden
Remote Sens. 2017, 9(11), 1136; https://doi.org/10.3390/rs9111136 - 7 Nov 2017
Cited by 62 | Viewed by 15072
Abstract
Many Indian capitals are rapidly becoming megacities due to industrialization and rural–urban emigration. Land use within city boundaries has changed dynamically, accommodating development while replacing traditional land-use patterns. Using Landsat-8 and IRS-P6 data, this study investigated land-use changes in urban and peri-urban Hyderabad [...] Read more.
Many Indian capitals are rapidly becoming megacities due to industrialization and rural–urban emigration. Land use within city boundaries has changed dynamically, accommodating development while replacing traditional land-use patterns. Using Landsat-8 and IRS-P6 data, this study investigated land-use changes in urban and peri-urban Hyderabad and their influence on land-use and land-cover. Advanced methods, such as spectral matching techniques with ground information were deployed in the analysis. From 2005 to 2016, the wastewater-irrigated area adjacent to the Musi river increased from 15,553 to 20,573 hectares, with concurrent expansion of the city boundaries from 38,863 to 80,111 hectares. Opportunistic shifts in land-use, especially related to wastewater-irrigated agriculture, emerged in response to growing demand for fresh vegetables and urban livestock feed, and to easy access to markets due to the city’s expansion. Validation performed on the land-use maps developed revealed 80–85% accuracy. Full article
(This article belongs to the Special Issue Remote Sensing of Urban Agriculture and Land Cover)
Show Figures

Graphical abstract

16 pages, 1780 KiB  
Article
Potential of Spaceborne Lidar Measurements of Carbon Dioxide and Methane Emissions from Strong Point Sources
by Christoph Kiemle *, Gerhard Ehret, Axel Amediek, Andreas Fix, Mathieu Quatrevalet and Martin Wirth
Deutsches Zentrum für Luft-und Raumfahrt (DLR), Institut für Physik der Atmosphäre, D-82234 Oberpfaffenhofen, Germany
Remote Sens. 2017, 9(11), 1137; https://doi.org/10.3390/rs9111137 - 8 Nov 2017
Cited by 21 | Viewed by 6156
Abstract
Emissions from strong point sources, primarily large power plants, are a major portion of the total CO2 emissions. International climate agreements will increasingly require their independent monitoring. A satellite-based, double-pulse, direct detection Integrated Path Differential Absorption (IPDA) Lidar with the capability to [...] Read more.
Emissions from strong point sources, primarily large power plants, are a major portion of the total CO2 emissions. International climate agreements will increasingly require their independent monitoring. A satellite-based, double-pulse, direct detection Integrated Path Differential Absorption (IPDA) Lidar with the capability to actively target point sources has the potential to usefully complement the current and future GHG observing system. This initial study uses simple approaches to determine the required Lidar characteristics and the expected skill of spaceborne Lidar plume detection and emission quantification. A Gaussian plume model simulates the CO2 or CH4 distribution downstream of the sources. A Lidar simulator provides the instrument characteristics and dimensions required to retrieve the emission rates, assuming an ideal detector configuration. The Lidar sampling frequency, the footprint distance to the emitting source and the error of an individual measurement are of great importance. If wind speed and direction are known and environmental conditions are ideal, an IPDA Lidar on a 500-km orbit with 2 W average power in the 1.6 µm CO2 absorption band, 500 Hz pulse repetition frequency, 50 m footprint at sea level and 0.7 m telescope diameter can be expected to measure CO2 emission rates of 20 Mt/a with an average accuracy better than 3% up to a distance of 3 km away from the source. CH4 point source emission rates can be quantified with comparable skill if they are larger than 10 kt/a, or if the Lidar pulse repetition frequency is augmented. Full article
(This article belongs to the Special Issue Remote Sensing of Greenhouse Gases)
Show Figures

Graphical abstract

24 pages, 6763 KiB  
Article
Estimating Daily Global Evapotranspiration Using Penman–Monteith Equation and Remotely Sensed Land Surface Temperature
by Roozbeh Raoufi * and Edward Beighley
Civil and Environmental Engineering, Northeastern University, 360 Huntington Ave., Boston, MA 02115, USA
Remote Sens. 2017, 9(11), 1138; https://doi.org/10.3390/rs9111138 - 7 Nov 2017
Cited by 40 | Viewed by 10081
Abstract
Daily evapotranspiration (ET) is modeled globally for the period 2000–2013 based on the Penman–Monteith equation with radiation and vapor pressures derived using remotely sensed Land Surface Temperature (LST) from the MODerate resolution Imaging Spectroradiometer (MODIS) on the Aqua and [...] Read more.
Daily evapotranspiration (ET) is modeled globally for the period 2000–2013 based on the Penman–Monteith equation with radiation and vapor pressures derived using remotely sensed Land Surface Temperature (LST) from the MODerate resolution Imaging Spectroradiometer (MODIS) on the Aqua and Terra satellites. The ET for a given land area is based on four surface conditions: wet/dry and vegetated/non-vegetated. For each, the ET resistance terms are based on land cover, leaf area index (LAI) and literature values. The vegetated/non-vegetated fractions of the land surface are estimated using land cover, LAI, a simplified version of the Beer–Lambert law for describing light transition through vegetation and newly derived light extension coefficients for each MODIS land cover type. The wet/dry fractions of the land surface are nonlinear functions of LST derived humidity calibrated using in-situ ET measurements. Results are compared to in-situ measurements (average of the root mean squared errors and mean absolute errors for 39 sites are 0.81 mm day−1 and 0.59 mm day−1, respectively) and the MODIS ET product, MOD16, (mean bias during 2001–2013 is −0.2 mm day−1). Although the mean global difference between MOD16 and ET estimates is only 0.2 mm day−1, local temperature derived vapor pressures are the likely contributor to differences, especially in energy and water limited regions. The intended application for the presented model is simulating ET based on long-term climate forecasts (e.g., using only minimum, maximum and mean daily or monthly temperatures). Full article
(This article belongs to the Section Remote Sensing in Geology, Geomorphology and Hydrology)
Show Figures

Graphical abstract

22 pages, 22314 KiB  
Article
Hyperspectral Image Spatial Super-Resolution via 3D Full Convolutional Neural Network
by Shaohui Mei 1,*, Xin Yuan 1, Jingyu Ji 1, Yifan Zhang 1, Shuai Wan 1 and Qian Du 2
1 School of Electronics and Information, Northwestern Polytechnical University, Xi’an 710129, China
2 Department of Electrical and Computer Engineering, Mississippi State University, Starkville, MS 39762, USA
Remote Sens. 2017, 9(11), 1139; https://doi.org/10.3390/rs9111139 - 7 Nov 2017
Cited by 292 | Viewed by 17294
Abstract
Hyperspectral images are well-known for their fine spectral resolution to discriminate different materials. However, their spatial resolution is relatively low due to the trade-off in imaging sensor technologies, resulting in limitations in their applications. Inspired by recent achievements in convolutional neural network (CNN) [...] Read more.
Hyperspectral images are well-known for their fine spectral resolution to discriminate different materials. However, their spatial resolution is relatively low due to the trade-off in imaging sensor technologies, resulting in limitations in their applications. Inspired by recent achievements in convolutional neural network (CNN) based super-resolution (SR) for natural images, a novel three-dimensional full CNN (3D-FCNN) is constructed for spatial SR of hyperspectral images in this paper. Specifically, 3D convolution is used to exploit both the spatial context of neighboring pixels and spectral correlation of neighboring bands, such that spectral distortion when directly applying traditional CNN based SR algorithms to hyperspectral images in band-wise manners is alleviated. Furthermore, a sensor-specific mode is designed for the proposed 3D-FCNN such that none of the samples from the target scene are required for training. Fine-tuning by a small number of training samples from the target scene can further improve the performance of such a sensor-specific method. Extensive experimental results on four benchmark datasets from two well-known hyperspectral sensors, namely hyperspectral digital imagery collection experiment (HYDICE) and reflective optics system imaging spectrometer (ROSIS) sensors, demonstrate that our proposed 3D-FCNN outperforms several existing SR methods by ensuring higher quality both in reconstruction and spectral fidelity. Full article
(This article belongs to the Special Issue Spatial Enhancement of Hyperspectral Data and Applications)
Show Figures

Graphical abstract

23 pages, 11340 KiB  
Article
Satellite-Derived Spatiotemporal Variations in Evapotranspiration over Northeast China during 1982–2010
by Lilin Zhang 1,2, Yunjun Yao 1,2,*, Zhiqiang Wang 3, Kun Jia 1,2, Xiaotong Zhang 1,2, Yuhu Zhang 4, Xuanyu Wang 1,2, Jia Xu 1,2 and Xiaowei Chen 1,2
1 State Key Laboratory of Remote Sensing Science, Faculty of Geographical Science, Beijing Normal University, Beijing 100875, China
2 Beijing Engineering Research Center for Global Land Remote Sensing Products, Institute of Remote Sensing Science and Engineering, Faculty of Geographical Science, Beijing Normal University, Beijing 100875, China
3 National Disaster Reduction Center/Satellite Application Center for Disaster Reduction of the Ministry of Civil Affairs, Beijing 100124, China
4 College of Resource Environment and Tourism, Capital Normal University, Beijing 100048, China
Remote Sens. 2017, 9(11), 1140; https://doi.org/10.3390/rs9111140 - 7 Nov 2017
Cited by 15 | Viewed by 4634
Abstract
Evapotranspiration (ET) is a critical process for the climate system and water cycles. However, the spatiotemporal variations in terrestrial ET over Northeast China over the past three decades calculated from sparse meteorological point-based data remain large uncertain. In this paper, a recently proposed [...] Read more.
Evapotranspiration (ET) is a critical process for the climate system and water cycles. However, the spatiotemporal variations in terrestrial ET over Northeast China over the past three decades calculated from sparse meteorological point-based data remain large uncertain. In this paper, a recently proposed modified satellite-based Priestley–Taylor (MS–PT) algorithm was applied to estimate ET of Northeast China during 1982–2010. Validation results show that the square of the correlation coefficients (R2) for the six flux tower sites varies from 0.55 to 0.88 (p < 0.01), and the mean root mean square error (RMSE) is 0.92 mm/d. The ET estimated by MS–PT has an annual mean of 441.14 ± 18 mm/year in Northeast China, with a decreasing trend from southeast coast to northwest inland. The ET also shows in both annual and seasonal linear trends over Northeast China during 1982–2010, although this trend seems to have ceased after 1998, which increased on average by 12.3 mm per decade pre-1998 (p < 0.1) and decreased with large interannual fluctuations post-1998. Importantly, our analysis on ET trends highlights a large difference from previous studies that the change of potential evapotranspiration (PET) plays a key role for the change of ET over Northeast China. Only in the western part of Northeast China does precipitation appear to be a major controlling influence on ET. Full article
Show Figures

Graphical abstract

13 pages, 4305 KiB  
Article
Spatial Recognition of the Urban-Rural Fringe of Beijing Using DMSP/OLS Nighttime Light Data
by Yuli Yang 1,2,3, Mingguo Ma 4,*, Chao Tan 4 and Wangping Li 2
1 Northwest Institute of Eco-Environment and Resources, CAS, Lanzhou 730000, China
2 School of civil engineering, Lanzhou University of Technology, Lanzhou 730050, China
3 University of Chinese Academy of Sciences, Beijing 100049, China
4 Chongqing Engineering Research Center for Remote Sensing Big Data Application, Southwest University, Chongqing 400715, China
Remote Sens. 2017, 9(11), 1141; https://doi.org/10.3390/rs9111141 - 7 Nov 2017
Cited by 40 | Viewed by 5732
Abstract
Spatial identification of the urban-rural fringes is very significant for deeply understanding the development processes and regulations of urban space and guiding urban spatial development in the future. Traditionally, urban-rural fringe areas are identified using statistical analysis methods that consider indexes from single [...] Read more.
Spatial identification of the urban-rural fringes is very significant for deeply understanding the development processes and regulations of urban space and guiding urban spatial development in the future. Traditionally, urban-rural fringe areas are identified using statistical analysis methods that consider indexes from single or multiple factors, such as population densities, the ratio of building land, the proportion of the non-agricultural population, and economic levels. However, these methods have limitations, for example, the statistical data are not continuous, the statistical standards are not uniform, the data is seldom available in real time, and it is difficult to avoid issues on the statistical effects from edges of administrative regions or express the internal differences of these areas. This paper proposes a convenient approach to identify the urban-rural fringe using nighttime light data of DMSP/OLS images. First, a light characteristics–combined value model was built in ArcGIS 10.3, and the combined characteristics of light intensity and the degree of light intensity fluctuation are analyzed in the urban, urban-rural fringe, and rural areas. Then, the Python programming language was used to extract the breakpoints of the characteristic combination values of the nighttime light data in 360 directions taking Tian An Men as the center. Finally, the range of the urban-rural fringe area is identified. The results show that the urban-rural fringe of Beijing is mainly located in the annular band around Tian An Men. The average inner radius is 19 km, and the outer radius is 26 km. The urban-rural fringe includes the outer portions of the four city center districts, which are the Chaoyang District, Haidian District, Fengtai District, and Shijingshan District and the part area border with Daxing District, Tongzhou District, Changping District, Mentougou District, Shunyi District, and Fangshan District. The area of the urban-rural fringe is approximately 765 km2. This paper provides a convenient, feasible, and real-time approach for the identification of the urban-rural fringe areas. It is very significant to extract the urban-rural fringes. Full article
Show Figures

Graphical abstract

26 pages, 6486 KiB  
Article
Similarities and Improvements of GPM Dual-Frequency Precipitation Radar (DPR) upon TRMM Precipitation Radar (PR) in Global Precipitation Rate Estimation, Type Classification and Vertical Profiling
by Jinyu Gao 1, Guoqiang Tang 1 and Yang Hong 1,2,*
1 State Key Laboratory of Hydroscience and Engineering, Department of Hydraulic Engineering, Tsinghua University, Beijing 100084, China
2 Department of Civil Engineering and Environmental Science, University of Oklahoma, Norman, OK 73019, USA
Remote Sens. 2017, 9(11), 1142; https://doi.org/10.3390/rs9111142 - 7 Nov 2017
Cited by 51 | Viewed by 9807
Abstract
Spaceborne precipitation radars are powerful tools used to acquire adequate and high-quality precipitation estimates with high spatial resolution for a variety of applications in hydrological research. The Global Precipitation Measurement (GPM) mission, which deployed the first spaceborne Ka- and Ku-dual frequency radar (DPR), [...] Read more.
Spaceborne precipitation radars are powerful tools used to acquire adequate and high-quality precipitation estimates with high spatial resolution for a variety of applications in hydrological research. The Global Precipitation Measurement (GPM) mission, which deployed the first spaceborne Ka- and Ku-dual frequency radar (DPR), was launched in February 2014 as the upgraded successor of the Tropical Rainfall Measuring Mission (TRMM). This study matches the swath data of TRMM PR and GPM DPR Level 2 products during their overlapping periods at the global scale to investigate their similarities and DPR’s improvements concerning precipitation amount estimation and type classification of GPM DPR over TRMM PR. Results show that PR and DPR agree very well with each other in the global distribution of precipitation, while DPR improves the detectability of precipitation events significantly, particularly for light precipitation. The occurrences of total precipitation and the light precipitation (rain rates < 1 mm/h) detected by GPM DPR are ~1.7 and ~2.53 times more than that of PR. With regard to type classification, the dual-frequency (Ka/Ku) and single frequency (Ku) methods performed similarly. In both inner (the central 25 beams) and outer swaths (1–12 beams and 38–49 beams) of DPR, the results are consistent. GPM DPR improves precipitation type classification remarkably, reducing the misclassification of clouds and noise signals as precipitation type “other” from 10.14% of TRMM PR to 0.5%. Generally, GPM DPR exhibits the same type division for around 82.89% (71.02%) of stratiform (convective) precipitation events recognized by TRMM PR. With regard to the freezing level height and bright band (BB) height, both radars correspond with each other very well, contributing to the consistency in stratiform precipitation classification. Both heights show clear latitudinal dependence. Results in this study shall contribute to future development of spaceborne radar precipitation retrievals and benefit hydrological and meteorological research. Full article
Show Figures

Figure 1

13 pages, 1786 KiB  
Review
Measurement of the Earth Radiation Budget at the Top of the Atmosphere—A Review
by Steven Dewitte * and Nicolas Clerbaux
Observations Division, Royal Meteorological Institute of Belgium, 1180 Brussels, Belgium
Remote Sens. 2017, 9(11), 1143; https://doi.org/10.3390/rs9111143 - 7 Nov 2017
Cited by 49 | Viewed by 12187
Abstract
The Earth Radiation Budget at the top of the atmosphere quantifies how the Earth gains energy from the Sun and loses energy to space. It is of fundamental importance for climate and climate change. In this paper, the current state-of-the-art of the satellite [...] Read more.
The Earth Radiation Budget at the top of the atmosphere quantifies how the Earth gains energy from the Sun and loses energy to space. It is of fundamental importance for climate and climate change. In this paper, the current state-of-the-art of the satellite measurements of the Earth Radiation Budget is reviewed. Combining all available measurements, the most likely value of the Total Solar Irradiance at a solar minimum is 1362 W/m 2, the most likely Earth albedo is 29.8%, and the most likely annual mean Outgoing Longwave Radiation is 238 W/m 2. We highlight the link between long-term changes of the Outgoing Longwave Radiation, the strengthening of El Nino in the period 1985–1997 and the strengthening of La Nina in the period 2000–2009. Full article
(This article belongs to the Special Issue Feature Papers for Section Atmosphere Remote Sensing)
Show Figures

Graphical abstract

29 pages, 5569 KiB  
Article
Application of Low-Cost UASs and Digital Photogrammetry for High-Resolution Snow Depth Mapping in the Arctic
by Emiliano Cimoli 1,2,*, Marco Marcer 1,3, Baptiste Vandecrux 1,4, Carl E. Bøggild 1, Guy Williams 2,5 and Sebastian B. Simonsen 6
1 Arctic Technology Centre, Technical University of Denmark, 2800 Kgs. Lyngby, Denmark
2 Institute for Marine and Antarctic Studies, University of Tasmania, Hobart, Tasmania 7001, Australia
3 Institut de Géographie Alpine, Université Grenoble-Alpes, 3800 Grenoble, France
4 Geological Survey of Denmark and Greenland, 1350 Copenhagen K, Denmark
5 Antarctic Climate and Ecosystem Cooperative Research Centre, University of Tasmania, Hobart, Tasmania 7001, Australia
6 DTU Space, Department of Geodynamics, Technical University of Denmark, 2800 Kgs. Lyngby, Denmark
Remote Sens. 2017, 9(11), 1144; https://doi.org/10.3390/rs9111144 - 7 Nov 2017
Cited by 42 | Viewed by 8969
Abstract
The repeat acquisition of high-resolution snow depth measurements has important research and civil applications in the Arctic. Currently the surveying methods for capturing the high spatial and temporal variability of the snowpack are expensive, in particular for small areal extents. An alternative methodology [...] Read more.
The repeat acquisition of high-resolution snow depth measurements has important research and civil applications in the Arctic. Currently the surveying methods for capturing the high spatial and temporal variability of the snowpack are expensive, in particular for small areal extents. An alternative methodology based on Unmanned Aerial Systems (UASs) and digital photogrammetry was tested over varying surveying conditions in the Arctic employing two diverse and low-cost UAS-camera combinations (500 and 1700 USD, respectively). Six areas, two in Svalbard and four in Greenland, were mapped covering from 1386 to 38,410 m2. The sites presented diverse snow surface types, underlying topography and light conditions in order to test the method under potentially limiting conditions. The resulting snow depth maps achieved spatial resolutions between 0.06 and 0.09 m. The average difference between UAS-estimated and measured snow depth, checked with conventional snow probing, ranged from 0.015 to 0.16 m. The impact of image pre-processing was explored, improving point cloud density and accuracy for different image qualities and snow/light conditions. Our UAS photogrammetry results are expected to be scalable to larger areal extents. While further validation is needed, with the inclusion of extra validation points, the study showcases the potential of this cost-effective methodology for high-resolution monitoring of snow dynamics in the Arctic and beyond. Full article
(This article belongs to the Special Issue Snow Remote Sensing)
Show Figures

Figure 1

20 pages, 30941 KiB  
Article
A New Low-Rank Representation Based Hyperspectral Image Denoising Method for Mineral Mapping
by Lianru Gao 1,2, Dan Yao 1,3, Qingting Li 1, Lina Zhuang 4, Bing Zhang 1,3,* and José M. Bioucas-Dias 4
1 Key Laboratory of Digital Earth Science, Institute of Remote Sensing and Digital Earth, Chinese Academy of Sciences, Beijing 100094, China
2 College of Computer Science and Software Engineering, Computer Vision Research Institute, Shenzhen University, Shenzhen 518060, China
3 School of Electronic, Electrical and Communication Engineering, University of Chinese Academy of Sciences, Beijing 100049, China
4 Instituto de Telecomunicações, Instituto Superior Técnico, Universidade de Lisboa, 1900-118 Lisbon, Portugal
Remote Sens. 2017, 9(11), 1145; https://doi.org/10.3390/rs9111145 - 8 Nov 2017
Cited by 53 | Viewed by 7435
Abstract
Hyperspectral imaging technology has been used for geological analysis for many years wherein mineral mapping is the dominant application for hyperspectral images (HSIs). The very high spectral resolution of HSIs enables the identification and the diagnosis of different minerals with detection accuracy far [...] Read more.
Hyperspectral imaging technology has been used for geological analysis for many years wherein mineral mapping is the dominant application for hyperspectral images (HSIs). The very high spectral resolution of HSIs enables the identification and the diagnosis of different minerals with detection accuracy far beyond that offered by multispectral images. However, HSIs are inevitably corrupted by noise during acquisition and transmission processes. The presence of noise may significantly degrade the quality of the extracted mineral information. In order to improve the accuracy of mineral mapping, denoising is a crucial pre-processing task. By leveraging on low-rank and self-similarity properties of HSIs, this paper proposes a state-of-the-art HSI denoising algorithm that implements two main steps: (1) signal subspace learning via fine-tuned Robust Principle Component Analysis (RPCA); and (2) denoising the images associated with the representation coefficients, with respect to an orthogonal subspace basis, using BM3D, a self-similarity based state-of-the-art denoising algorithm. Accordingly, the proposed algorithm is named Hyperspectral Denoising via Robust principle component analysis and Self-similarity (HyDRoS), which can be considered as a supervised version of FastHyDe. The effectiveness of HyDRoS is evaluated in a series of mineral mapping experiments using noise-reduced AVIRIS and Hyperion HSIs. In these experiments, the proposed denoiser yielded systematically state-of-the-art performance. Full article
Show Figures

Graphical abstract

16 pages, 5122 KiB  
Article
Estimation of High-Resolution Surface Shortwave Radiative Fluxes Using SARA AOD over the Southern Great Plains
by Eslam Javadnia 1,2,*, Ali Akbar Abkar 1,3 and Per Schubert 4,*
1 Department of Photogrammetry and Remote Sensing, Faculty of Geodesy & Geomatics Engineering, K. N. Toosi University of Technology, Tehran 19967-15433, Iran
2 Surveying Engineering Department, Faculty of Engineering, University of Zanjan, Zanjan 45371-38791, Iran
3 AgriWatch B.V., Weerninklanden 24, 7542 SC Enschede, The Netherlands
4 Department Science, Environment and Society, Faculty of Education and Society, Malmö University, 205 06 Malmö, Sweden
Remote Sens. 2017, 9(11), 1146; https://doi.org/10.3390/rs9111146 - 8 Nov 2017
Cited by 6 | Viewed by 6042
Abstract
Atmospheric aerosol optical depth (AOD) plays a determinant role in estimations of surface shortwave (SW) radiative fluxes. Therefore, this study aims to develop a hybrid scheme to produce surface SW fluxes, based on AOD at 1-km spatial resolution retrieved from the Simplified Aerosol [...] Read more.
Atmospheric aerosol optical depth (AOD) plays a determinant role in estimations of surface shortwave (SW) radiative fluxes. Therefore, this study aims to develop a hybrid scheme to produce surface SW fluxes, based on AOD at 1-km spatial resolution retrieved from the Simplified Aerosol Retrieval Algorithm (SARA) and several Terra MODIS land and atmospheric products (i.e., geolocation properties, water vapor amount, total ozone column, surface reflectance, and top-of-atmosphere (TOA) radiance). Estimations based on SARA were made over the Southern Great Plains (SGP) under cloud-free conditions in 2014 and compared with estimations based on the latest Terra MODIS AOD product at 3-km resolution. Validation against ground-based measurements showed that SARA-based fluxes obtain lower RMSE and bias values compared with MODIS-based estimations. MODIS-based downward and net fluxes are satisfactory, while the direct and diffuse components are less reliable. The results demonstrate that the SARA-based scheme produces better surface SW radiative fluxes than the MODIS-based estimates provided in this and other similar studies and that these fluxes are comparable to existing CERES data products which have been tested over the SGP. Full article
(This article belongs to the Section Biogeosciences Remote Sensing)
Show Figures

Figure 1

19 pages, 1566 KiB  
Technical Note
Measurement of Precipitation in the Alps Using Dual-Polarization C-Band Ground-Based Radars, the GPM Spaceborne Ku-Band Radar, and Rain Gauges
by Marco Gabella 1,*, Peter Speirs 2,3, Ulrich Hamann 1, Urs Germann 1 and Alexis Berne 2
1 MeteoSwiss, via ai Monti 146, CH-6605 Locarno-Monti, Switzerland
2 Environmental Remote Sensing Lab, EPFL, CH-1015 Lausanne, Switzerland
3 Institute of Applied Physics, University of Bern, CH-3012 Bern, Switzerland
Remote Sens. 2017, 9(11), 1147; https://doi.org/10.3390/rs9111147 - 8 Nov 2017
Cited by 37 | Viewed by 7233
Abstract
The complex problem of quantitative precipitation estimation in the Alpine region is tackled from four different points of view: (1) the modern MeteoSwiss network of automatic telemetered rain gauges (GAUGE); (2) the recently upgraded MeteoSwiss dual-polarization Doppler, ground-based weather radar network (RADAR); (3) [...] Read more.
The complex problem of quantitative precipitation estimation in the Alpine region is tackled from four different points of view: (1) the modern MeteoSwiss network of automatic telemetered rain gauges (GAUGE); (2) the recently upgraded MeteoSwiss dual-polarization Doppler, ground-based weather radar network (RADAR); (3) a real-time merging of GAUGE and RADAR, implemented at MeteoSwiss, in which a technique based on co-kriging with external drift (CombiPrecip) is used; (4) spaceborne observations, acquired by the dual-wavelength precipitation radar on board the Global Precipitation Measuring (GPM) core satellite. There are obviously large differences in these sampling modes, which we have tried to minimize by integrating synchronous observations taken during the first 2 years of the GPM mission. The data comprises 327 “wet” overpasses of Switzerland, taken after the launch of GPM in February 2014. By comparing the GPM radar estimates with the MeteoSwiss products, a similar performance was found in terms of bias. On average (whole country, all days and seasons, both solid and liquid phases), underestimation is as large as −3.0 (−3.4) dB with respect to RADAR (GAUGE). GPM is not suitable for assessing what product is the best in terms of average precipitation over the Alps. GPM can nevertheless be used to evaluate the dispersion of the error around the mean, which is a measure of the geographical distribution of the error inside the country. Using 221 rain-gauge sites, the result is clear both in terms of correlation and in terms of scatter (a robust, weighted measure of the dispersion of the multiplicative error around the mean). The best agreement was observed between GPM and CombiPrecip, and, next, between GPM and RADAR, whereas a larger disagreement was found between GPM and GAUGE. Hence, GPM confirms that, for precipitation mapping in the Alpine region, the best results are obtained by combining ground-based radar with rain-gauge measurements using a geostatistical approach. The GPM mission is adding significant new coverage to mountainous areas, especially in poorly instrumented parts of the world and at latitudes not previously covered by the Tropical Rainfall Measuring Mission (TRMM). According to this study, one could expect an underestimation of the precipitation product by the dual-frequency precipitation radar (DPR) also in other mountainous areas of the world. Full article
Show Figures

Graphical abstract

19 pages, 4303 KiB  
Article
Impervious Surface Change Mapping with an Uncertainty-Based Spatial-Temporal Consistency Model: A Case Study in Wuhan City Using Landsat Time-Series Datasets from 1987 to 2016
by Lingfei Shi 1,2, Feng Ling 1,*, Yong Ge 3, Giles M. Foody 4, Xiaodong Li 1, Lihui Wang 1, Yihang Zhang 1 and Yun Du 1
1 Institute of Geodesy and Geophysics, Chinese Academy of Sciences, Wuhan 430077, China
2 The University of Chinese Academy of Sciences, Beijing 100049, China
3 State Key Laboratory of Resources and Environmental Information System, Institute of Geographic Sciences & Natural Resources Research, Chinese Academy of Sciences, Beijing 100101, China
4 School of Geography, University of Nottingham, University Park, Nottingham NG7 2RD, UK
Remote Sens. 2017, 9(11), 1148; https://doi.org/10.3390/rs9111148 - 14 Nov 2017
Cited by 29 | Viewed by 7344
Abstract
Detailed information on the spatial-temporal change of impervious surfaces is important for quantifying the effects of rapid urbanization. Free access of the Landsat archive provides new opportunities for impervious surface mapping with fine spatial and temporal resolution. To improve the classification accuracy, a [...] Read more.
Detailed information on the spatial-temporal change of impervious surfaces is important for quantifying the effects of rapid urbanization. Free access of the Landsat archive provides new opportunities for impervious surface mapping with fine spatial and temporal resolution. To improve the classification accuracy, a temporal consistency (TC) model may be applied on the original classification results of Landsat time-series datasets. However, existing TC models only use class labels, and ignore the uncertainty of classification during the process. In this study, an uncertainty-based spatial-temporal consistency (USTC) model was proposed to improve the accuracy of the long time series of impervious surface classifications. In contrast to existing TC methods, the proposed USTC model integrates classification uncertainty with the spatial-temporal context information to better describe the spatial-temporal consistency for the long time-series datasets. The proposed USTC model was used to obtain an annual map of impervious surfaces in Wuhan city with Landsat Thematic Mapper (TM), Enhanced Thematic Mapper (ETM+), and Operational Land Imager (OLI) images from 1987 to 2016. The impervious surfaces mapped by the proposed USTC model were compared with those produced by the support vector machine (SVM) classifier and the TC model. The accuracy comparison of these results indicated that the proposed USTC model had the best performance in terms of classification accuracy. The increase of overall accuracy was about 4.23% compared with the SVM classifier, and about 1.79% compared with the TC model, which indicates the effectiveness of the proposed USTC model in mapping impervious surfaces from long-term Landsat sensor imagery. Full article
(This article belongs to the Special Issue Uncertainty in Remote Sensing Image Analysis)
Show Figures

Graphical abstract

18 pages, 5473 KiB  
Article
Assessment of In-Season Cotton Nitrogen Status and Lint Yield Prediction from Unmanned Aerial System Imagery
by Carlos Ballester 1,*, John Hornbuckle 1, James Brinkhoff 1, John Smith 2 and Wendy Quayle 1
1 Centre for Regional and Rural Futures (CeRRF), Deakin University, Griffith, NSW 2680, Australia
2 Yanco Agricultural Institute, Department of Primary Industries (DPI), Yanco, NSW 2703, Australia
Remote Sens. 2017, 9(11), 1149; https://doi.org/10.3390/rs9111149 - 8 Nov 2017
Cited by 78 | Viewed by 9760
Abstract
The present work assessed the usefulness of a set of spectral indices obtained from an unmanned aerial system (UAS) for tracking spatial and temporal variability of nitrogen (N) status as well as for predicting lint yield in a commercial cotton (Gossypium hirsutum [...] Read more.
The present work assessed the usefulness of a set of spectral indices obtained from an unmanned aerial system (UAS) for tracking spatial and temporal variability of nitrogen (N) status as well as for predicting lint yield in a commercial cotton (Gossypium hirsutum L.) farm. Organic, inorganic and a combination of both types of fertilizers were used to provide a range of eight N rates from 0 to 340 kg N ha−1. Multi-spectral images (reflectance in the blue, green, red, red edge and near infrared bands) were acquired on seven days throughout the season, from 62 to 169 days after sowing (DAS), and data were used to compute structure- and chlorophyll-sensitive vegetation indices (VIs). Above-ground plant biomass was sampled at first flower, first cracked boll and maturity and total plant N concentration (N%) and N uptake determined. Lint yield was determined at harvest and the relationships with the VIs explored. Results showed that differences in plant N% and N uptake between treatments increased as the season progressed. Early in the season, when fertilizer applications can still have an effect on lint yield, the simplified canopy chlorophyll content index (SCCCI) was the index that best explained the variation in N uptake and plant N% between treatments. Around first cracked boll and maturity, the linear regression obtained for the relationships between the VIs and both plant N% and N uptake was statistically significant, with the highest r2 values obtained at maturity. The normalized difference red edge (NDRE) index, and SCCCI were generally the indices that best distinguished the treatments according to the N uptake and total plant N%. Treatments with the highest N rates (from 307 to 340 kg N ha−1) had lower normalized difference vegetation index (NDVI) than treatments with 0 and 130 kg N ha−1 at the first measurement day (62 DAS), suggesting that factors other than fertilization N rate affected plant growth at this early stage of the crop. This fact affected the earliest date at which the structure-sensitive indices NDVI and the visible atmospherically resistant index (VARI) enabled yield prediction (97 DAS). A statistically significant linear regression was obtained for the relationships between SCCCI and NDRE with lint yield at 83 DAS. Overall, this study shows the practicality of using an UAS to monitor the spatial and temporal variability of cotton N status in commercial farms. It also illustrates the challenges of using multi-spectral information for fertilization recommendation in cotton at early stages of the crop. Full article
(This article belongs to the Section Remote Sensing in Agriculture and Vegetation)
Show Figures

Graphical abstract

18 pages, 8016 KiB  
Article
Exploiting Multi-View SAR Images for Robust Target Recognition
by Baiyuan Ding * and Gongjian Wen
Science and Technology on Automatic Target Recognition Laboratory, National University of Defense Technology, Changsha 410073, China
Remote Sens. 2017, 9(11), 1150; https://doi.org/10.3390/rs9111150 - 9 Nov 2017
Cited by 84 | Viewed by 6038
Abstract
The exploitation of multi-view synthetic aperture radar (SAR) images can effectively improve the performance of target recognition. However, due to the various extended operating conditions (EOCs) in practical applications, some of the collected views may not be discriminative enough for target recognition. Therefore, [...] Read more.
The exploitation of multi-view synthetic aperture radar (SAR) images can effectively improve the performance of target recognition. However, due to the various extended operating conditions (EOCs) in practical applications, some of the collected views may not be discriminative enough for target recognition. Therefore, each of the input views should be examined before being passed through to multi-view recognition. This paper proposes a novel structure for multi-view SAR target recognition. The multi-view images are first classified by sparse representation-based classification (SRC). Based on the output residuals, a reliability level is calculated to evaluate the effectiveness of a certain view for multi-view recognition. Meanwhile, the support samples for each view selected by SRC collaborate to construct an enhanced local dictionary. Then, the selected views are classified by joint sparse representation (JSR) based on the enhanced local dictionary for target recognition. The proposed method can eliminate invalid views for target recognition while enhancing the representation capability of JSR. Therefore, the individual discriminability of each valid view as well as the inner correlation among all of the selected views can be exploited for robust target recognition. Experiments are conducted on the moving and stationary target acquisition recognition (MSTAR) dataset to demonstrate the validity of the proposed method. Full article
(This article belongs to the Section Remote Sensing Image Processing)
Show Figures

Figure 1

16 pages, 2101 KiB  
Article
Fusion Approaches for Land Cover Map Production Using High Resolution Image Time Series without Reference Data of the Corresponding Period
by Benjamin Tardy 1,*, Jordi Inglada 1 and Julien Michel 2
1 CESBIO (Centre d’Etudes Spatiales de la BIOsphere), Université de Toulouse, CNES/CNRS/IRD/UPS, 18 avenue Edouard Belin, 31401 Toulouse CEDEX 9, France
2 CNES (Centre National d’Etudes Spatiales), 18 avenue Edouard Belin, 31401 Toulouse CEDEX 9, France
Remote Sens. 2017, 9(11), 1151; https://doi.org/10.3390/rs9111151 - 9 Nov 2017
Cited by 15 | Viewed by 5369
Abstract
Optical sensor time series images allow one to produce land cover maps at a large scale. The supervised classification algorithms have been shown to be the best to produce maps automatically with good accuracy. The main drawback of these methods is the need [...] Read more.
Optical sensor time series images allow one to produce land cover maps at a large scale. The supervised classification algorithms have been shown to be the best to produce maps automatically with good accuracy. The main drawback of these methods is the need for reference data, the collection of which can introduce important production delays. Therefore, the maps are often available too late for some applications. Domain adaptation methods seem to be efficient for using past data for land cover map production. According to this idea, the main goal of this study is to propose several simple past data fusion schemes to override the current land cover map production delays. A single classifier approach and three voting rules are considered to produce maps without reference data of the corresponding period. These four approaches reach an overall accuracy of around 80% with a 17-class nomenclature using Formosat-2 image time series. A study of the impact of the number of past periods used is also done. It shows that the overall accuracy increases with the number of periods used. The proposed methods require at least two or three previous years to be used. Full article
Show Figures

Graphical abstract

13 pages, 20593 KiB  
Technical Note
Use of High-Quality and Common Commercial Mirrors for Scanning Close-Range Surfaces Using 3D Laser Scanners: A Laboratory Experiment
by Adrián J. Riquelme 1,*, Belén Ferrer 1 and David Mas 2
1 Department of Civil Engineering, University of Alicante, 03690 San Vicente del Raspeig, Alicante, Spain
2 Department of Optics, Pharmacology and Anatomy, University of Alicante, 03690 San Vicente del Raspeig, Alicante, Spain
Remote Sens. 2017, 9(11), 1152; https://doi.org/10.3390/rs9111152 - 10 Nov 2017
Cited by 11 | Viewed by 6338
Abstract
Three Dimension (3D) laser scanners enable the acquisition of millions of points of a visible object. Terrestrial laser scanners (TLS) are ground-based scanners, and nowadays the available instruments have the ability of rotating their sensor in two axes, capturing almost any point. Since [...] Read more.
Three Dimension (3D) laser scanners enable the acquisition of millions of points of a visible object. Terrestrial laser scanners (TLS) are ground-based scanners, and nowadays the available instruments have the ability of rotating their sensor in two axes, capturing almost any point. Since many sensors can only operate in a vertical position, they cannot capture points located beneath themselves. Consequently, these instruments are generally unable to capture data in a vertical descending direction. Moreover, since the device positioning has certain requirements of space and terrain stability, it is possible that specific regions of interest are outside the reach of the laser. A possible solution is to address the laser beam towards the desired direction by means of a mirror. Common mirrors are very cheap; therefore, they are easy to manipulate and to substitute in case they get broken. However, due to their careless fabrication process, it seems reasonable to think that they are unprecise. In contrast, front-end mirrors are more expensive and delicate, and consequently, deflecting angles are more precise. In this research, we designed a laboratory test to analyze the arising noise when standard and high-quality mirrors are used during the TLS scanning process. The results show that the noise introduced when scanning through a standard mirror is higher than that produced when using a high-quality mirror. However, both cases show that this introduced error is lower than the instrumental error. As a result, this study concludes that it is reasonable to use standard mirrors when scanning in similar conditions to this laboratory test. Full article
(This article belongs to the Special Issue Uncertainty in Remote Sensing Image Analysis)
Show Figures

Graphical abstract

22 pages, 4725 KiB  
Article
Forest Types Classification Based on Multi-Source Data Fusion
by Ming Lu 1,2, Bin Chen 3, Xiaohan Liao 1, Tianxiang Yue 1,2,*, Huanyin Yue 1, Shengming Ren 4, Xiaowen Li 3, Zhen Nie 5 and Bing Xu 3,5,*
1 State Key Laboratory of Resources and Environment Information System, Institute of Geographical Science and Natural Resources Research, Chinese Academy of Sciences, Beijing 100101, China
2 College of Resources and Environment, University of Chinese Academy of Sciences, Beijing 100049, China
3 Department of Earth System Science, Tsinghua University, Beijing 100084, China
4 Key Laboratory of Watershed ecology and Geographical Environment Monitoring, National Administration of Surveying, Mapping and Geoinformation, Nanchang 330209, China
5 State Key Lab of Remote Sensing Science, College of Global Change and Earth System Science, Beijing Normal University, Beijing 100875 China
Remote Sens. 2017, 9(11), 1153; https://doi.org/10.3390/rs9111153 - 10 Nov 2017
Cited by 39 | Viewed by 9698
Abstract
Forest plays an important role in global carbon, hydrological and atmospheric cycles and provides a wide range of valuable ecosystem services. Timely and accurate forest-type mapping is an essential topic for forest resource inventory supporting forest management, conservation biology and ecological restoration. Despite [...] Read more.
Forest plays an important role in global carbon, hydrological and atmospheric cycles and provides a wide range of valuable ecosystem services. Timely and accurate forest-type mapping is an essential topic for forest resource inventory supporting forest management, conservation biology and ecological restoration. Despite efforts and progress having been made in forest cover mapping using multi-source remotely sensed data, fine spatial, temporal and spectral resolution modeling for forest type distinction is still limited. In this paper, we proposed a novel spatial-temporal-spectral fusion framework through spatial-spectral fusion and spatial-temporal fusion. Addressing the shortcomings of the commonly-used spatial-spectral fusion model, we proposed a novel spatial-spectral fusion model called the Segmented Difference Value method (SEGDV) to generate fine spatial-spectra-resolution images by blending the China environment 1A series satellite (HJ-1A) multispectral image (Charge Coupled Device (CCD)) and Hyperspectral Imager (HSI). A Hierarchical Spatiotemporal Adaptive Fusion Model (HSTAFM) was used to conduct spatial-temporal fusion to generate the fine spatial-temporal-resolution image by blending the HJ-1A CCD and Moderate Resolution Imaging Spectroradiometer (MODIS) data. The spatial-spectral-temporal information was utilized simultaneously to distinguish various forest types. Experimental results of the classification comparison conducted in the Gan River source nature reserves showed that the proposed method could enhance spatial, temporal and spectral information effectively, and the fused dataset yielded the highest classification accuracy of 83.6% compared with the classification results derived from single Landsat-8 (69.95%), single spatial-spectral fusion (70.95%) and single spatial-temporal fusion (78.94%) images, thereby indicating that the proposed method could be valid and applicable in forest type classification. Full article
Show Figures

Figure 1

11 pages, 26308 KiB  
Article
A Case Study of UAS Borne Laser Scanning for Measurement of Tree Stem Diameter
by Martin Wieser 1,*, Gottfried Mandlburger 1,2, Markus Hollaus 1, Johannes Otepka 1, Philipp Glira 1 and Norbert Pfeifer 1
1 Department of Geodesy and Geoinformation, Technische Universität Wien, Gußhausstraße 27-29, 1040 Vienna, Austria
2 Institute for Photogrammetry, University of Stuttgart, Geschwister-Scholl-Str.24D, 70174 Stuttgart, Germany
Remote Sens. 2017, 9(11), 1154; https://doi.org/10.3390/rs9111154 - 10 Nov 2017
Cited by 83 | Viewed by 7752
Abstract
Diameter at breast height (DBH) is one of the most important parameter in forestry. With increasing use of terrestrial and airborne laser scanning in forestry, new exceeding possibilities to directly derive DBH emerge. In particular, high resolution point clouds from laser scanners on [...] Read more.
Diameter at breast height (DBH) is one of the most important parameter in forestry. With increasing use of terrestrial and airborne laser scanning in forestry, new exceeding possibilities to directly derive DBH emerge. In particular, high resolution point clouds from laser scanners on board unmanned aerial systems (UAS) are becoming available over forest areas. In this case study, DBH estimation from a UAS point cloud based on modeling the relevant part of the tree stem with a cylinder, is analyzed with respect to accuracy and completeness. As reference, manually measured DBHs and DBHs from terrestrial laser scanning point clouds are used for comparison. We demonstrate that accuracy and completeness of the cylinder fit are depending on the stem diameter. Stems with DBH > 20 cm feature almost 100% successful reconstruction with relative differences to the reference DBH of 9% (DBH 20–30 cm) down to 1.8% for DBH > 40 cm. Full article
(This article belongs to the Section Forest Remote Sensing)
Show Figures

Figure 1

20 pages, 18553 KiB  
Article
Disaggregation of SMOS Soil Moisture to 100 m Resolution Using MODIS Optical/Thermal and Sentinel-1 Radar Data: Evaluation over a Bare Soil Site in Morocco
by Omar Ali Eweys 1,2,3,*, Maria José Escorihuela 1, Josep M. Villar 2, Salah Er-Raki 4, Abdelhakim Amazirh 4,6, Luis Olivera 6, Lionel Jarlan 6, Saïd Khabba 5 and Olivier Merlin 5,6
1 isardSAT, ParcTecnològic Barcelona Activa, Carrer de Marie Curie, 8, 08042 Barcelona, Spain
2 Environment and Soil Science Department, University of Lleida, 25003 Lleida, Spain
3 Soil Sciences Department, Faculty of Agriculture, Cairo University, Gamaa Street 6, 12613 Giza, Egypt
4 LP2M2E, Dèpartment de Physique Appliquèe, Facultè des Sciences et Techniques, Universitè Cadi Ayyad, 40000 Marrakech, Morocco
5 LMME, Dèpartment de Physique, Facultè des Sciences Semlalia, Universitè Cadi Ayyad, 40000 Marrakech, Morocco
6 CESBIO, Université de Toulouse, IRD, UPS, CNRS, CNES, 31400 Toulouse, France
Remote Sens. 2017, 9(11), 1155; https://doi.org/10.3390/rs9111155 - 10 Nov 2017
Cited by 20 | Viewed by 5569
Abstract
The 40 km resolution SMOS (Soil Moisture and Ocean Salinity) soil moisture, previously disaggregated at a 1 km resolution using the DISPATCH (DISaggregation based on Physical And Theoretical scale CHange) method based on MODIS optical/thermal data, is further disaggregated to 100 m resolution [...] Read more.
The 40 km resolution SMOS (Soil Moisture and Ocean Salinity) soil moisture, previously disaggregated at a 1 km resolution using the DISPATCH (DISaggregation based on Physical And Theoretical scale CHange) method based on MODIS optical/thermal data, is further disaggregated to 100 m resolution using Sentinel-1 backscattering coefficient (σ°). For this purpose, three distinct radar-based disaggregation methods are tested by linking the spatio-temporal variability of σ° and soil moisture data at the 1 km and 100 m resolution. The three methods are: (1) the weight method, which estimates soil moisture at 100 m resolution at a certain time as a function of σ° ratio (100 m to 1 km resolution) and the 1 km DISPATCH products of the same time; (2) the regression method which estimates soil moisture as a function of σ° where the regression parameters (e.g., intercept and slope) vary in space and time; and (3) the Cumulative Distribution Function (CDF) method, which estimates 100 m resolution soil moisture from the cumulative probability of 100 m resolution backscatter and the maximum to minimum 1 km resolution (DISPATCH) soil moisture difference. In each case, disaggregation results are evaluated against in situ measurements collected between 1 January 2016 and 11 October 2016 over a bare soil site in central Morocco. The determination coefficient (R2) between 1 km resolution DISPATCH and localized in situ soil moisture is 0.31. The regression and CDF methods have marginal effect on improving the DISPATCH accuracy at the station scale with a R2 between remotely sensed and in situ soil moisture of 0.29 and 0.34, respectively. By contrast, the weight method significantly improves the correlation between remotely sensed and in situ soil moisture with a R2 of 0.52. Likewise, the soil moisture estimates show low root mean square difference with in situ measurements (RMSD= 0.032 m3 m−3). Full article
Show Figures

Figure 1

19 pages, 7025 KiB  
Article
Ship-Iceberg Discrimination in Sentinel-2 Multispectral Imagery by Supervised Classification
by Peder Heiselberg 1 and Henning Heiselberg 2,*
1 Climate & Geophysics, Niels Bohr Institute, Juliane Maries Vej 30, 2100 Copenhagen Ø, Denmark
2 National Space Institute, Technical University of Denmark, 2800 Kongens Lyngby, Denmark
Remote Sens. 2017, 9(11), 1156; https://doi.org/10.3390/rs9111156 - 10 Nov 2017
Cited by 20 | Viewed by 6413
Abstract
The European Space Agency Sentinel-2 satellites provide multispectral images with pixel sizes down to 10 m. This high resolution allows for fast and frequent detection, classification and discrimination of various objects in the sea, which is relevant in general and specifically for the [...] Read more.
The European Space Agency Sentinel-2 satellites provide multispectral images with pixel sizes down to 10 m. This high resolution allows for fast and frequent detection, classification and discrimination of various objects in the sea, which is relevant in general and specifically for the vast Arctic environment. We analyze several sets of multispectral image data from Denmark and Greenland fall and winter, and describe a supervised search and classification algorithm based on physical parameters that successfully finds and classifies all objects in the sea with reflectance above a threshold. It discriminates between objects like ships, islands, wakes, and icebergs, ice floes, and clouds with accuracy better than 90%. Pan-sharpening the infrared bands leads to classification and discrimination of ice floes and clouds better than 95%. For complex images with abundant ice floes or clouds, however, the false alarm rate dominates for small non-sailing boats. Full article
(This article belongs to the Section Ocean Remote Sensing)
Show Figures

Graphical abstract

18 pages, 6436 KiB  
Article
Remote Sensing of 2000–2016 Alpine Spring Snowline Elevation in Dall Sheep Mountain Ranges of Alaska and Western Canada
by David Verbyla 1,*, Troy Hegel 2, Anne W. Nolin 3, Madelon Van de Kerk 4, Thomas A. Kurkowski 5 and Laura R. Prugh 4
1 School of Natural Resources and Extension, University of Alaska Fairbanks, Fairbanks, AK 99775, USA
2 Yukon Department of Environment, Whitehorse, YT Y1A 4Y9, Canada
3 College of Earth, Ocean and Atmospheric Sciences, Oregon State University, Corvallis, OR 97331, USA
4 School of Environmental and Forestry Sciences, University of Washington, Seattle, WA 98195, USA
5 Scenarios Network for Alaska and Arctic Planning, University of Alaska Fairbanks, Fairbanks, AK 99775, USA
Remote Sens. 2017, 9(11), 1157; https://doi.org/10.3390/rs9111157 - 11 Nov 2017
Cited by 23 | Viewed by 5980
Abstract
The lowest elevation of spring snow (“snowline”) is an important factor influencing recruitment and survival of wildlife in alpine areas. In this study, we assessed the spatial and temporal variability of alpine spring snowline across major Dall sheep mountain areas in Alaska and [...] Read more.
The lowest elevation of spring snow (“snowline”) is an important factor influencing recruitment and survival of wildlife in alpine areas. In this study, we assessed the spatial and temporal variability of alpine spring snowline across major Dall sheep mountain areas in Alaska and northwestern Canada. We used a daily MODIS snow fraction product to estimate the last day of 2000–2016 spring snow for each 500-m pixel within 28 mountain areas. We then developed annual (2000–2016) regression models predicting the elevation of alpine snowline during mid-May for each mountain area. MODIS-based regression estimates were compared with estimates derived using a Normalized Difference Snow Index from Landsat-8 Operational Land Imager (OLI) surface reflectance data. We also used 2000–2009 decadal climate grids to estimate total winter precipitation and mean May temperature for each of the 28 mountain areas. Based on our MODIS regression models, the 2000–2016 mean May 15 snowline elevation ranged from 339 m in the cold arctic class to 1145 m in the interior mountain class. Spring snowline estimates from MODIS and Landsat OLI were similar, with a mean absolute error of 106 m. Spring snowline elevation was significantly related to mean May temperature and total winter precipitation. The late spring of 2013 may have impacted some sheep populations, especially in the cold arctic mountain areas which were snow-covered in mid-May, while some interior mountain areas had mid-May snowlines exceeding 1000 m elevation. We found this regional (>500,000 km2) remote sensing application useful for determining the inter-annual and regional variability of spring alpine snowline among 28 mountain areas. Full article
Show Figures

Graphical abstract

22 pages, 10401 KiB  
Article
The Cross-Calibration of Spectral Radiances and Cross-Validation of CO2 Estimates from GOSAT and OCO-2
by Fumie Kataoka 1,*, David Crisp 2, Thomas E. Taylor 3, Chris W. O’Dell 3, Akihiko Kuze 4, Kei Shiomi 4, Hiroshi Suto 4, Carol Bruegge 2, Florian M. Schwandner 2,5, Robert Rosenberg 2, Lars Chapsky 2 and Richard A. M. Lee 2
1 Remote Sensing Technology Center of Japan, 2-1-1 Sengen, Tsukuba 305-8505, Japan
2 Jet Propulsion Laboratory, 4800 Oak Grove Drive, Pasadena, CA 91109, USA
3 Cooperative Institute for Research in the Atmosphere, Colorado State University, Fort Collins, CO 80523, USA
4 Japan Aerospace Exploration Agency, 2-1-1 Sengen, Tsukuba 305-8505, Japan
5 Joint Institute for Regional Earth System Science and Engineering (JIFRESSE), University of California, Los Angeles (UCLA), Los Angeles, CA 90095, USA
Remote Sens. 2017, 9(11), 1158; https://doi.org/10.3390/rs9111158 - 11 Nov 2017
Cited by 25 | Viewed by 8250
Abstract
The Greenhouse gases Observing SATellite (GOSAT) launched in January 2009 has provided radiance spectra with a Fourier Transform Spectrometer for more than eight years. The Orbiting Carbon Observatory 2 (OCO-2) launched in July 2014, collects radiance spectra using an imaging grating spectrometer. Both [...] Read more.
The Greenhouse gases Observing SATellite (GOSAT) launched in January 2009 has provided radiance spectra with a Fourier Transform Spectrometer for more than eight years. The Orbiting Carbon Observatory 2 (OCO-2) launched in July 2014, collects radiance spectra using an imaging grating spectrometer. Both sensors observe sunlight reflected from Earth’s surface and retrieve atmospheric carbon dioxide (CO2) concentrations, but use different spectrometer technologies, observing geometries, and ground track repeat cycles. To demonstrate the effectiveness of satellite remote sensing for CO2 monitoring, the GOSAT and OCO-2 teams have worked together pre- and post-launch to cross-calibrate the instruments and cross-validate their retrieval algorithms and products. In this work, we first compare observed radiance spectra within three narrow bands centered at 0.76, 1.60 and 2.06 µm, at temporally coincident and spatially collocated points from September 2014 to March 2017. We reconciled the differences in observation footprints size, viewing geometry and associated differences in surface bidirectional reflectance distribution function (BRDF). We conclude that the spectral radiances measured by the two instruments agree within 5% for all bands. Second, we estimated mean bias and standard deviation of column-averaged CO2 dry air mole fraction (XCO2) retrieved from GOSAT and OCO-2 from September 2014 to May 2016. GOSAT retrievals used Build 7.3 (V7.3) of the Atmospheric CO2 Observations from Space (ACOS) algorithm while OCO-2 retrievals used Version 7 of the OCO-2 retrieval algorithm. The mean biases and standard deviations are −0.57 ± 3.33 ppm over land with high gain, −0.17 ± 1.48 ppm over ocean with high gain and −0.19 ± 2.79 ppm over land with medium gain. Finally, our study is complemented with an analysis of error sources: retrieved surface pressure (Psurf), aerosol optical depth (AOD), BRDF and surface albedo inhomogeneity. We found no change in XCO2 bias or standard deviation with time, demonstrating that both instruments are well calibrated. Full article
(This article belongs to the Special Issue Remote Sensing of Greenhouse Gases)
Show Figures

Figure 1

32 pages, 2528 KiB  
Article
A Fast Atmospheric Trace Gas Retrieval for Hyperspectral Instruments Approximating Multiple Scattering—Part 1: Radiative Transfer and a Potential OCO-2 XCO2 Retrieval Setup
by Maximilian Reuter *, Michael Buchwitz, Oliver Schneising, Stefan Noël, Vladimir Rozanov, Heinrich Bovensmann and John P. Burrows
Institute of Environmental Physics, University of Bremen, P.O. Box 330440, 28334 Bremen, Germany
Remote Sens. 2017, 9(11), 1159; https://doi.org/10.3390/rs9111159 - 11 Nov 2017
Cited by 28 | Viewed by 6956
Abstract
Satellite retrievals of the atmospheric dry-air column-average mole fraction of CO 2 (XCO 2 ) based on hyperspectral measurements in appropriate near (NIR) and short wave infrared (SWIR) O 2 and CO 2 absorption bands can help to answer important questions about the [...] Read more.
Satellite retrievals of the atmospheric dry-air column-average mole fraction of CO 2 (XCO 2 ) based on hyperspectral measurements in appropriate near (NIR) and short wave infrared (SWIR) O 2 and CO 2 absorption bands can help to answer important questions about the carbon cycle but the precision and accuracy requirements for XCO 2 data products are demanding. Multiple scattering of light at aerosols and clouds can be a significant error source for XCO 2 retrievals. Therefore, so called full physics retrieval algorithms were developed aiming to minimize scattering related errors by explicitly fitting scattering related properties such as cloud water/ice content, aerosol optical thickness, cloud height, etc. However, the computational costs for multiple scattering radiative transfer (RT) calculations can be immense. Processing all data of the Orbiting Carbon Observatory-2 (OCO-2) can require up to thousands of CPU cores and the next generation of CO 2 monitoring satellites will produce at least an order of magnitude more data. Here we introduce the Fast atmOspheric traCe gAs retrievaL FOCAL including a scalar RT model which approximates multiple scattering effects with an analytic solution of the RT problem of an isotropic scattering layer and a Lambertian surface. The computational performance is similar to an absorption only model and currently determined by the convolution of the simulated spectra with the instrumental line shape function (ILS). We assess FOCAL’s quality by confronting it with accurate multiple scattering vector RT simulations using SCIATRAN. The simulated scenarios do not cover all possible geophysical conditions but represent, among others, some typical cloud and aerosol scattering scenarios with optical thicknesses of up to 0.7 which have the potential to survive the pre-processing of a XCO 2 algorithm for real OCO-2 measurements. Systematic errors of XCO 2 range from −2.5 ppm (−6.3‰) to 3.0 ppm (7.6‰) and are usually smaller than ±0.3 ppm (0.8‰). The stochastic uncertainty of XCO 2 is typically about 1.0 ppm (2.5‰). FOCAL simultaneously retrieves the dry-air column-average mole fraction of H 2 O (XH 2 O) and the solar induced chlorophyll fluorescence at 760 nm (SIF). Systematic and stochastic errors of XH 2 O are most times smaller than ±6 ppm and 9 ppm, respectively. The systematic SIF errors are always below 0.02 mW/m 2 /sr/nm, i.e., it can be expected that instrumental or forward model effects causing an in-filling of the used Fraunhofer lines will dominate the systematic errors when analyzing actually measured data. The stochastic uncertainty of SIF is usually below 0.3 mW/m 2 /sr/nm. Without understating the importance of analyzing synthetic measurements as presented here, the actual retrieval performance can only be assessed by analyzing measured data which is subject to part 2 of this publication. Full article
(This article belongs to the Special Issue Remote Sensing of Greenhouse Gases)
Show Figures

Graphical abstract

14 pages, 4897 KiB  
Article
RapidScat Cross-Calibration Using the Double Difference Technique
by Josko Zec 1, W. Linwood Jones 2, Ruaa Alsabah 1 and Ali Al-Sabbagh 1,*
1 Department of Electrical and Computer Engineering, Florida Institute of Technology, Melbourne, FL 32901, USA
2 Central Florida Remote Sensing Laboratory, Department of Electrical Engineering and Computer Science, University of Central Florida, Orlando, FL 28816-2450, USA
Remote Sens. 2017, 9(11), 1160; https://doi.org/10.3390/rs9111160 - 12 Nov 2017
Cited by 8 | Viewed by 4509
Abstract
RapidScat is a National Aeronautics and Space Administration (NASA) Ku-Band scatterometer that was operated onboard the International Space Station between September 2014 and August 2016 when the mission effectively ended after an irrecoverable instrument failure. A unique non-Sun-synchronous orbit facilitated global contiguous geographical [...] Read more.
RapidScat is a National Aeronautics and Space Administration (NASA) Ku-Band scatterometer that was operated onboard the International Space Station between September 2014 and August 2016 when the mission effectively ended after an irrecoverable instrument failure. A unique non-Sun-synchronous orbit facilitated global contiguous geographical sampling between the ±56° latitude. For the first time, such an orbit enabled an overlap with other scatterometers flying in Sun-synchronous orbits. The double-difference technique was developed and successfully used for microwave radiometer calibration at the Remote Sensing Laboratory at the University of Central Florida, USA. This paper presents the extension of the double difference methodology to scatterometry. The methodology has been adopted for the cross-instrument calibration between RapidScat and QuikScat scatterometers simultaneously orbiting the Earth on-board two independent satellite platforms. The double-difference technique was deployed to compare measurements from these two scatterometers, as a more accurate alternative to the classic single difference approach. The work summarized in this paper addressed a cross-calibration algorithm developed and applied to RapidScat and QuikScat data in the period from January 2015 to March 2016. The initial results of the statistical analysis and biases between the two scatterometers are presented. Calculated biases may be used for measurement correction and reprocessing. Full article
(This article belongs to the Section Ocean Remote Sensing)
Show Figures

Figure 1

21 pages, 6241 KiB  
Article
Burned Area Mapping in the Brazilian Savanna Using a One-Class Support Vector Machine Trained by Active Fires
by Allan A. Pereira 1,*, José M. C. Pereira 2,†, Renata Libonati 3,†, Duarte Oom 2,†, Alberto W. Setzer 4,†, Fabiano Morelli 4,†, Fausto Machado-Silva 3,† and Luis Marcelo Tavares De Carvalho 5,†
1 Instituto Federal de Ciência e Tecnologia do Sul de Minas Gerais, 37713-100 Poços de Caldas, Brazil
2 Centro de Estudos Florestais, Instituto Superior de Agronomia, Universidade de Lisboa, 1349-017 Lisboa, Portugal
3 Departamento de Meteorologia, Universidade Federal do Rio de Janeiro, 21941-916 Rio de Janeiro, Brazil
4 Centro de Previsão do Tempo e Estudos Climáticos, Instituto Nacional de Pesquisas Espaciais, 12227-010 São José dos Campos, Brazil
5 Departamento de Engenharia Florestal, Universidade Federal de Lavras, 37200-000 Lavras, Brazil
These authors equally contributed to this work.
Remote Sens. 2017, 9(11), 1161; https://doi.org/10.3390/rs9111161 - 14 Nov 2017
Cited by 69 | Viewed by 9961
Abstract
We used the Visible Infrared Imaging Radiometer Suite (VIIRS) active fire data (375 m spatial resolution) to automatically extract multispectral samples and train a One-Class Support Vector Machine for burned area mapping, and applied the resulting classification algorithm to 300-m spatial resolution imagery [...] Read more.
We used the Visible Infrared Imaging Radiometer Suite (VIIRS) active fire data (375 m spatial resolution) to automatically extract multispectral samples and train a One-Class Support Vector Machine for burned area mapping, and applied the resulting classification algorithm to 300-m spatial resolution imagery from the Project for On-Board Autonomy-Vegetation (PROBA-V). The active fire data were screened to prevent extraction of unrepresentative burned area samples and combined with surface reflectance bi-weekly composites to produce burned area maps. The procedure was applied over the Brazilian Cerrado savanna, validated with reference maps obtained from Landsat images and compared with the Collection 6 Moderate Resolution Imaging Spectrometer (MODIS) Burned Area product (MCD64A1) Results show that the algorithm developed improved the detection of small-sized scars and displayed results more similar to the reference data than MCD64A1. Unlike active fire-based region growing algorithms, the proposed approach allows for the detection and mapping of burn scars without active fires, thus eliminating a potential source of omission error. The burned area mapping approach presented here should facilitate the development of operational-automated burned area algorithms, and is very straightforward for implementation with other sensors. Full article
(This article belongs to the Section Forest Remote Sensing)
Show Figures

Graphical abstract

16 pages, 21365 KiB  
Article
Reduced Methane Emissions from Santa Barbara Marine Seeps
by Thomas Krings 1,*, Ira Leifer 2, Sven Krautwurst 1, Konstantin Gerilowski 1, Markus Horstjann 1, Heinrich Bovensmann 1, Michael Buchwitz 1, John P. Burrows 1, Richard W. Kolyer 3, Haflidi H. Jonsson 4 and Matthew M. Fladeland 3
1 Institute of Environmental Physics, University of Bremen, FB 1, P.O. Box 330440, D-28334 Bremen, Germany
2 Bubbleology Research International (BRI), Solvang, CA 93463, USA
3 Earth Science Division, NASA Ames Research Center (ARC), Mountain View, CA 94035, USA
4 Center for Interdisciplinary Remotely-Piloted Aircraft Studies (CIRPAS), Marina, CA 93933, USA
Remote Sens. 2017, 9(11), 1162; https://doi.org/10.3390/rs9111162 - 13 Nov 2017
Cited by 1 | Viewed by 5103
Abstract
Airborne in situ and remote sensing measurements of methane were performed over the marine seeps in the Santa Barbara Channel close to the Coal Oil Point in California on two days in June and August 2014 with the aim to re-assess their methane [...] Read more.
Airborne in situ and remote sensing measurements of methane were performed over the marine seeps in the Santa Barbara Channel close to the Coal Oil Point in California on two days in June and August 2014 with the aim to re-assess their methane emissions. During this period, methane column averaged dry air mole fractions derived from airborne remote sensing measurements in the short-wave infrared and airborne in situ measurements of methane indicate that emissions are 2–6 kt CH 4 y 1 , significantly lower than expected from previous publications. This is also confirmed by the on ground in situ measurement time series recorded at the onshore West Campus Monitoring Station in Santa Barbara. Using a time series of methane data, a decline in methane concentrations between 2008 and 2015 of more than a factor of two was derived for air masses originating from the seep field direction. Full article
(This article belongs to the Special Issue Remote Sensing of Greenhouse Gases)
Show Figures

Graphical abstract

21 pages, 7391 KiB  
Article
Generation of Radiometric, Phenological Normalized Image Based on Random Forest Regression for Change Detection
by Dae Kyo Seo 1, Yong Hyun Kim 2, Yang Dam Eo 3,*, Wan Yong Park 4 and Hyun Chun Park 4
1 Department of Smart ICT Convergence, Konkuk University, Seoul 05029, Korea
2 Department of Civil and Environmental Engineering, Seoul National University, Seoul 08826, Korea
3 Department of Advanced Technology Fusion, Konkuk University, Seoul 05029, Korea
4 Agency for Defense Development, Daejeon 34060, Korea
Remote Sens. 2017, 9(11), 1163; https://doi.org/10.3390/rs9111163 - 13 Nov 2017
Cited by 68 | Viewed by 6310
Abstract
Efforts have been made to detect both naturally occurring and anthropogenic changes to the Earth’s surface by using satellite remote sensing imagery. There is a need to maintain the homogeneity of radiometric and phenological conditions to ensure accuracy in change detection, but images [...] Read more.
Efforts have been made to detect both naturally occurring and anthropogenic changes to the Earth’s surface by using satellite remote sensing imagery. There is a need to maintain the homogeneity of radiometric and phenological conditions to ensure accuracy in change detection, but images to assess long-term changes in time-series data that satisfy such conditions are difficult to obtain. For this reason, image normalization is essential. In particular, the normalizing compositive conditions require nonlinear modeling, and random forest (RF) techniques can be utilized for this normalization. This study employed Landsat-5 Thematic Mapper satellite images with temporal, radiometric and phenological differences, and obtained Radiometric Control Set Samples by selecting no-change pixels between the subject image and reference image using scattergrams. In the obtained no-change regions, RF regression was modeled, and normalized images were obtained. Next, normalization performance was evaluated by comparing the results against the following conventional linear regression methods: mean-standard deviation regression, simple regression, and no-change regression. The normalization performance of RF regression was much higher. In addition, for an additional usefulness evaluation in normalization, the normalization performance was compared with other nonlinear ensemble regressions, i.e. Adaptive Boosting regression and Stochastic Gradient Boosting regression, which confirmed that the normalization performance of RF regression was significantly higher. In other words, it was found to be highly useful for normalization when compared to other nonlinear ensemble regressions. Finally, as a result of performing change detection, normalized subject images generated by RF regression showed the highest accuracy, which indicated that the proposed method (where the image was normalized using RF regression) may be useful in change detection between multi-temporal image datasets. Full article
(This article belongs to the Special Issue Uncertainty in Remote Sensing Image Analysis)
Show Figures

Figure 1

17 pages, 11579 KiB  
Article
Coupling Uncertainties with Accuracy Assessment in Object-Based Slum Detections, Case Study: Jakarta, Indonesia
by Jati Pratomo, Monika Kuffer *, Javier Martinez and Divyani Kohli
Faculty of Geo-Information Science & Earth Observation (ITC), University of Twente, 7514 AE Enschede, The Netherlands
Remote Sens. 2017, 9(11), 1164; https://doi.org/10.3390/rs9111164 - 13 Nov 2017
Cited by 49 | Viewed by 8918
Abstract
Object-Based Image Analysis (OBIA) has been successfully used to map slums. In general, the occurrence of uncertainties in producing geographic data is inevitable. However, most studies concentrated solely on assessing the classification accuracy and neglecting the inherent uncertainties. Our research analyses the impact [...] Read more.
Object-Based Image Analysis (OBIA) has been successfully used to map slums. In general, the occurrence of uncertainties in producing geographic data is inevitable. However, most studies concentrated solely on assessing the classification accuracy and neglecting the inherent uncertainties. Our research analyses the impact of uncertainties in measuring the accuracy of OBIA-based slum detection. We selected Jakarta as our case study area because of a national policy of slum eradication, which is causing rapid changes in slum areas. Our research comprises of four parts: slum conceptualization, ruleset development, implementation, and accuracy and uncertainty measurements. Existential and extensional uncertainty arise when producing reference data. The comparison of a manual expert delineations of slums with OBIA slum classification results into four combinations: True Positive, False Positive, True Negative and False Negative. However, the higher the True Positive (which lead to a better accuracy), the lower the certainty of the results. This demonstrates the impact of extensional uncertainties. Our study also demonstrates the role of non-observable indicators (i.e., land tenure), to assist slum detection, particularly in areas where uncertainties exist. In conclusion, uncertainties are increasing when aiming to achieve a higher classification accuracy by matching manual delineation and OBIA classification. Full article
(This article belongs to the Special Issue Earth Observation in Planning for Sustainable Urban Development)
Show Figures

Graphical abstract

20 pages, 7338 KiB  
Article
Parameterizing Anthropogenic Heat Flux with an Energy-Consumption Inventory and Multi-Source Remote Sensing Data
by Shanshan Chen and Deyong Hu *
College of Resource Environment and Tourism, Capital Normal University, Beijing 100048, China
Remote Sens. 2017, 9(11), 1165; https://doi.org/10.3390/rs9111165 - 13 Nov 2017
Cited by 60 | Viewed by 7337
Abstract
Anthropogenic heat (AH) generated by human activities is an important factor affecting the urban climate. Thus, refined AH parameterization of a large area can provide data support for regional meteorological research. In this study, we developed a refined anthropogenic heat flux (RAHF) parameterization [...] Read more.
Anthropogenic heat (AH) generated by human activities is an important factor affecting the urban climate. Thus, refined AH parameterization of a large area can provide data support for regional meteorological research. In this study, we developed a refined anthropogenic heat flux (RAHF) parameterization scheme to estimate the gridded anthropogenic heat flux (AHF). Firstly, the annual total AH emissions and annual mean AHF of Beijing municipality in the year 2015 were estimated using a top-down, energy-consumption inventory method, which was derived based on socioeconomic statistics and energy consumption data. The heat released from industry, transportation, buildings (including both commercial and residential buildings), and human metabolism were taken into account. Then, the county-scale AHF estimation model was constructed based on multi-source remote sensing data, such as Suomi national polar-orbiting partnership (Suomi-NPP) visible infrared imaging radiometer suite (VIIRS) nighttime light (NTL) data and moderate resolution imaging spectroradiometer (MODIS) data. This model was applied to estimate the annual mean AHF of the counties in the Beijing–Tianjin–Hebei region. Finally, the gridded AHF data with 500-m resolution was obtained using a RAHF parameterization scheme. The results indicate that the annual total AH emissions of Beijing municipality in the year 2015 was approximately 1.704 × 10¹⁸ J. Of this, the buildings contribute about 34.5%, followed by transportation and industry with about 30.5% and 30.1%, respectively, and human metabolism with only about 4.9%. The annual mean AHF value of the Beijing–Tianjin–Hebei region is about 6.07 W·m−2, and the AHF in urban areas is about in the range of 20 W·m−2 and 130 W·m−2. The maximum AHF value is approximately 130.84 W·m−2, mostly in airports, railway stations, central business districts, and other densely-populated areas. The error analysis of the county-scale AHF results showed that the residual between the model estimation and energy consumption statistics is less than 1%. In addition, the spatial distribution of RAHF results is generally centered on urban area and gradually decreases towards suburbs. The spatial pattern of the RAHF results within urban areas corresponds well to the distribution of population density, building density, and the industrial district. The spatial heterogeneity of AHF within urban areas is well-reflected through the RAHF results. The RAHF results can be used in meteorological and environmental modeling for the Beijing–Tianjin–Hebei region. The results of this study also highlight the superiority of Suomi-NPP VIIRS NTL data for AHF estimation. Full article
(This article belongs to the Special Issue Remote Sensing of Night Lights – Beyond DMSP)
Show Figures

Graphical abstract

28 pages, 1625 KiB  
Article
Sparse Unmixing of Hyperspectral Data with Noise Level Estimation
by Chang Li 1,2,3, Yong Ma 1,*, Xiaoguang Mei 1,*, Fan Fan 1, Jun Huang 1 and Jiayi Ma 1
1 Electronic Information School, Wuhan University, Wuhan 430072, China
2 School of Electronic Information and Communications, Huazhong University of Science and Technology, Wuhan 430074, China
3 School of Mathematics and Computer Science, Wuhan Polytechnic University, Wuhan 430023, China
Remote Sens. 2017, 9(11), 1166; https://doi.org/10.3390/rs9111166 - 13 Nov 2017
Cited by 19 | Viewed by 4695
Abstract
Recently, sparse unmixing has received particular attention in the analysis of hyperspectral images (HSIs). However, traditional sparse unmixing ignores the different noise levels in different bands of HSIs, making such methods sensitive to different noise levels. To overcome this problem, the noise levels [...] Read more.
Recently, sparse unmixing has received particular attention in the analysis of hyperspectral images (HSIs). However, traditional sparse unmixing ignores the different noise levels in different bands of HSIs, making such methods sensitive to different noise levels. To overcome this problem, the noise levels at different bands are assumed to be different in this paper, and a general sparse unmixing method based on noise level estimation (SU-NLE) under the sparse regression framework is proposed. First, the noise in each band is estimated on the basis of the multiple regression theory in hyperspectral applications, given that neighboring spectral bands are usually highly correlated. Second, the noise weighting matrix can be obtained from the estimated noise. Third, the noise weighting matrix is integrated into the sparse regression unmixing framework, which can alleviate the impact of different noise levels at different bands. Finally, the proposed SU-NLE is solved by the alternative direction method of multipliers. Experiments on synthetic datasets show that the signal-to-reconstruction error of the proposed SU-NLE is considerably higher than those of the corresponding traditional sparse regression unmixing methods without noise level estimation, which demonstrates the efficiency of integrating noise level estimation into the sparse regression unmixing framework. The proposed SU-NLE also shows promising results in real HSIs. Full article
(This article belongs to the Section Remote Sensing Image Processing)
Show Figures

Graphical abstract

16 pages, 2761 KiB  
Article
Comparison of Retrieved L2 Products from Four Successive Versions of L1B Spectra in the Thermal Infrared Band of TANSO-FTS over the Arctic Ocean
by Sébastien Payan 1,*, Claude Camy-Peyret 2 and Jérôme Bureau 1
1 LATMOS/IPSL, UPMC University Paris 06 Sorbonne Universités, Paris 06, CNRS, 75252 Paris CEDEX 05, France
2 IPSL, UPMC/IPSL, 75252 Paris CEDEX 05, France
Remote Sens. 2017, 9(11), 1167; https://doi.org/10.3390/rs9111167 - 14 Nov 2017
Cited by 5 | Viewed by 4011
Abstract
This paper concentrates on the calibration/validation of the Thermal and Near Infrared Sensor for Carbon Observation (TANSO)–Fourier Transform Spectrometer (FTS) spectra in the thermal infrared (TIR) spectral region (B4 band) over the Arctic Ocean. We have performed inter-comparisons of the retrieved L2 products [...] Read more.
This paper concentrates on the calibration/validation of the Thermal and Near Infrared Sensor for Carbon Observation (TANSO)–Fourier Transform Spectrometer (FTS) spectra in the thermal infrared (TIR) spectral region (B4 band) over the Arctic Ocean. We have performed inter-comparisons of the retrieved L2 products from four successive versions of L1B products (V150, V160, V201, V203) to check the differences and the improvement in the spectral and radiometric calibration of TANSO-FTS spectra in the narrow spectral domain of 940–980 cm−1 covering CO2 lines of the so-called laser band in the rather clear 10.4 μm atmospheric window, allowing sounding down to the lowest atmospheric layers. To our knowledge, this is the first attempt to retrieve XCO2 from this spectral region. The period covered is the summer months (July, August, September) and the years from 2009 to 2015. Internal comparisons of L1B TANSO-FTS spectra, as well as comparisons of retrieved L2 products, i.e., Tsurf (sea surface temperature or SST) and the retrieved column-averaged dry air volume mixing ratio XCO2 derived with the same algorithm are presented. The overall trend in the CO2 column-averaged VMR is well captured over the six year period for Green-house Gases Observing Satellite (GOSAT), but calibration issues are still hindering the use of TANSO-FTS TIR spectra for accurate and stable XCO2 and Tsurf products. However, an internal comparison of the successive L1B versions is possible and helpful to make progress with respect to the radiometric and spectral calibration TIR spectra collected by TANSO-FTS on GOSAT. Full article
(This article belongs to the Special Issue Remote Sensing of Greenhouse Gases)
Show Figures

Graphical abstract

27 pages, 6289 KiB  
Article
Temporal and Spatial Comparison of Agricultural Drought Indices from Moderate Resolution Satellite Soil Moisture Data over Northwest Spain
by Miriam Pablos *, José Martínez-Fernández, Nilda Sánchez and Ángel González-Zamora
Instituto Hispano-Luso de Investigaciones Agrarias (CIALE), University of Salamanca (USAL), Duero 12, 37185 Villamayor, Spain
Remote Sens. 2017, 9(11), 1168; https://doi.org/10.3390/rs9111168 - 14 Nov 2017
Cited by 61 | Viewed by 9978
Abstract
During the last decade, a variety of agricultural drought indices have been developed using soil moisture (SM), or any of its surrogates, as the primary drought indicator. In this study, a comprehensive study of four innovative SM-based indices, the Soil Water Deficit Index [...] Read more.
During the last decade, a variety of agricultural drought indices have been developed using soil moisture (SM), or any of its surrogates, as the primary drought indicator. In this study, a comprehensive study of four innovative SM-based indices, the Soil Water Deficit Index (SWDI), the Soil Moisture Agricultural Drought Index (SMADI), the Soil Moisture Deficit Index (SMDI) and the Soil Wetness Deficit Index (SWetDI), is conducted over a large semi-arid crop region in northwest Spain. The indices were computed on a weekly basis from June 2010 to December 2016 using 1-km satellite SM estimations from Soil Moisture and Ocean Salinity (SMOS) and/or Moderate Resolution Imaging Spectroradiometer (MODIS) data. The temporal dynamics of the indices were compared to two well-known agricultural drought indices, the atmospheric water deficit (AWD) and the crop moisture index (CMI), to analyze the levels of similarity, correlation, seasonality and number of weeks with drought. In addition, the spatial distribution and intensities of the indices were assessed under dry and wet SM conditions at the beginning of the growing season. The results showed that the SWDI and SMADI were the appropriate indices for developing an efficient drought monitoring system, with higher significant correlation coefficients (R ≈ 0.5–0.8) when comparing with the AWD and CMI, whereas lower values (R ≤ 0.3) were obtained for the SMDI and SWetDI. Full article
(This article belongs to the Special Issue Satellite Remote Sensing for Water Resources in a Changing Climate)
Show Figures

Graphical abstract

22 pages, 4945 KiB  
Article
Ionospheric Reconstructions Using Faraday Rotation in Spaceborne Polarimetric SAR Data
by Cheng Wang 1,*, Liang Chen 1, Haisheng Zhao 2, Zheng Lu 3, Mingming Bian 3, Running Zhang 3 and Jian Feng 2
1 Qian Xuesen Laboratory of Space Technology, China Academy of Space Technology, Beijing 100094, China
2 National Key Laboratory of Electromagnetic Environment, China Research Institute of Radiowave Propagation, Qingdao 266107, China
3 Beijing Institute of Spacecraft System Engineering, China Academy of Space Technology, Beijing 100094, China
Remote Sens. 2017, 9(11), 1169; https://doi.org/10.3390/rs9111169 - 14 Nov 2017
Cited by 12 | Viewed by 5172
Abstract
It is well known that the Faraday rotation (FR) is obviously embedded in spaceborne polarimetric synthetic aperture radar (PolSAR) data at L-band and lower frequencies. By model inversion, some widely used FR angle estimators have been proposed for compensation and provide a new [...] Read more.
It is well known that the Faraday rotation (FR) is obviously embedded in spaceborne polarimetric synthetic aperture radar (PolSAR) data at L-band and lower frequencies. By model inversion, some widely used FR angle estimators have been proposed for compensation and provide a new field in high-resolution ionospheric soundings. However, as an integrated product of electron density and the parallel component of the magnetic field, FR angle measurements/observations demonstrate the ability to characterize horizontal ionosphere. In order to make a general study of ionospheric structure, this paper reconstructs the electron density distribution based on a modified two-dimensional computerized ionospheric tomography (CIT) technique, where the FR angles, rather than the total electron content (TEC), are regarded as the input. By using the full-pol (full polarimetric) data of Phase Array L-band Synthetic Aperture Radar (PALSAR) on board Advanced Land Observing Satellite (ALOS), International Reference Ionosphere (IRI) and International Geomagnetic Reference Field (IGRF) models, numerical simulations corresponding to different FR estimators and SAR scenes are made to validate the proposed technique. In simulations, the imaging of kilometer-scale ionospheric disturbances, a spatial scale that is rarely detectable by CIT using GPS, is presented. In addition, the ionospheric reconstruction using SAR polarimetric information does not require strong point targets within a SAR scene, which is necessary for CIT using SAR imaging information. Finally, the effects of system errors including noise, channel imbalance and crosstalk on the reconstruction results are also analyzed to show the applicability of CIT based on spaceborne full-pol SAR data. Full article
(This article belongs to the Special Issue Advances in SAR: Sensors, Methodologies, and Applications)
Show Figures

Graphical abstract

17 pages, 17964 KiB  
Article
Arbitrary-Oriented Vehicle Detection in Aerial Imagery with Single Convolutional Neural Networks
by Tianyu Tang *, Shilin Zhou *, Zhipeng Deng, Lin Lei and Huanxin Zou
College of Electronic Science, National University of Defense Technology, Changsha 410073, China
Remote Sens. 2017, 9(11), 1170; https://doi.org/10.3390/rs9111170 - 14 Nov 2017
Cited by 128 | Viewed by 11908
Abstract
Vehicle detection with orientation estimation in aerial images has received widespread interest as it is important for intelligent traffic management. This is a challenging task, not only because of the complex background and relatively small size of the target, but also the various [...] Read more.
Vehicle detection with orientation estimation in aerial images has received widespread interest as it is important for intelligent traffic management. This is a challenging task, not only because of the complex background and relatively small size of the target, but also the various orientations of vehicles in aerial images captured from the top view. The existing methods for oriented vehicle detection need several post-processing steps to generate final detection results with orientation, which are not efficient enough. Moreover, they can only get discrete orientation information for each target. In this paper, we present an end-to-end single convolutional neural network to generate arbitrarily-oriented detection results directly. Our approach, named Oriented_SSD (Single Shot MultiBox Detector, SSD), uses a set of default boxes with various scales on each feature map location to produce detection bounding boxes. Meanwhile, offsets are predicted for each default box to better match the object shape, which contain the angle parameter for oriented bounding boxes’ generation. Evaluation results on the public DLR Vehicle Aerial dataset and Vehicle Detection in Aerial Imagery (VEDAI) dataset demonstrate that our method can detect both the location and orientation of the vehicle with high accuracy and fast speed. For test images in the DLR Vehicle Aerial dataset with a size of 5616 × 3744 , our method achieves 76.1% average precision (AP) and 78.7% correct direction classification at 5.17 s on an NVIDIA GTX-1060. Full article
Show Figures

Graphical abstract

19 pages, 27596 KiB  
Article
Mapping Radar Glacier Zones and Dry Snow Line in the Antarctic Peninsula Using Sentinel-1 Images
by Chunxia Zhou 1,2 and Lei Zheng 1,2,*
1 Chinese Antarctic Center of Surveying and Mapping, Wuhan University, Wuhan 430079, China
2 Key Laboratory of Polar Surveying and Mapping, National Administration of Surveying, Mapping and Geoinformation, Wuhan 430079, China
Remote Sens. 2017, 9(11), 1171; https://doi.org/10.3390/rs9111171 - 15 Nov 2017
Cited by 47 | Viewed by 9350
Abstract
Surface snowmelt causes changes in mass and energy balance, and endangers the stabilities of the ice shelves in the Antarctic Peninsula (AP). The dynamic changes of the snow and ice conditions in the AP were observed by Sentinel-1 images with a spatial resolution [...] Read more.
Surface snowmelt causes changes in mass and energy balance, and endangers the stabilities of the ice shelves in the Antarctic Peninsula (AP). The dynamic changes of the snow and ice conditions in the AP were observed by Sentinel-1 images with a spatial resolution of 40 m in this study. Snowmelt detected by the special sensor microwave/imager (SSM/I) is used to study the relationship between summer snowmelt and winter synthetic aperture radar (SAR) backscatter. Radar glacier zones (RGZs) classifications were conducted based on their differences in liquid snow content, snow grain size, and the relative elevations. We developed a practical method based on the simulations of a microwave scattering model to classify RGZs by using Sentinel-1 images in the AP. The summer snowmelt detected by SSM/I and Sentinel-1 data are compared between 2014 and 2015. The SSM/I-derived melting days is used to validate the winter dry snow line (DSL). RGZs derived from Sentinel-1 images suggest that snowmelt expanded from inland of the Larsen C Ice Shelf to the coastal area, whereas an opposite direction was found in the George VI Ice Shelf. The long melting season in the grounding zone of the Larsen C Ice Shelf may result from the adiabatically-dried föhn winds on the east side of the AP. As the uppermost limit of summer snowmelt, DSL was mapped based on the winter Sentinel-1 mosaic of the AP. Compared with the SSM/I-derived melting days, the winter DSL mainly distributed in the areas melted for one to three days in summer. DSL elevations on the Palmer Land increased from south to north. Full article
(This article belongs to the Special Issue Snow Remote Sensing)
Show Figures

Graphical abstract

24 pages, 12940 KiB  
Article
A Heuristic Method for Power Pylon Reconstruction from Airborne LiDAR Data
by Ruqin Zhou 1, Wanshou Jiang 1,2,*, Wei Huang 1, Bo Xu 1 and San Jiang 1
1 State Key Laboratory of Information Engineering in Surveying, Mapping and Remote Sensing, Wuhan University, 129 Luoyu Road, Wuhan 430079, China
2 Collaborative Innovation Center of Geospatial Technology, Wuhan University, 129 Luoyu Road, Wuhan 430079, China
Remote Sens. 2017, 9(11), 1172; https://doi.org/10.3390/rs9111172 - 16 Nov 2017
Cited by 29 | Viewed by 7690
Abstract
Object reconstruction from airborne LiDAR data is a hot topic in photogrammetry and remote sensing. Power fundamental infrastructure monitoring plays a vital role in power transmission safety. This paper proposes a heuristic reconstruction method for power pylons widely used in high voltage transmission [...] Read more.
Object reconstruction from airborne LiDAR data is a hot topic in photogrammetry and remote sensing. Power fundamental infrastructure monitoring plays a vital role in power transmission safety. This paper proposes a heuristic reconstruction method for power pylons widely used in high voltage transmission systems from airborne LiDAR point cloud, which combines both data-driven and model-driven strategies. Structurally, a power pylon can be decomposed into two parts: the pylon body and head. The reconstruction procedure assembles two parts sequentially: firstly, the pylon body is reconstructed by a data-driven strategy, where a RANSAC-based algorithm is adopted to fit four principal legs; secondly, a model-driven strategy is used to reconstruct the pylon head with the aid of a predefined 3D head model library, where the pylon head’s type is recognized by a shape context algorithm, and their parameters are estimated by a Metropolis–Hastings sampler coupled with a Simulated annealing algorithm. The proposed method has two advantages: (1) optimal strategies are adopted to reconstruct different pylon parts, which are robust to noise and partially missing data; and (2) both the number of parameters and their search space are greatly reduced when estimating the head model’s parameters, as the body reconstruction results information about the original point cloud, and relationships between parameters are used in the pylon head reconstruction process. Experimental results show that the proposed method can efficiently reconstruct power pylons, and the average residual between the reconstructed models and the raw data was smaller than 0.3 m. Full article
(This article belongs to the Section Remote Sensing Image Processing)
Show Figures

Figure 1

13 pages, 6282 KiB  
Article
An Evaluation of Four MODIS Collection 6 Aerosol Products in a Humid Subtropical Region
by Ming Zhang 1, Bo Huang 2,* and Qingqing He 2
1 School of Resources and Environmental Engineering, Wuhan University of Technology, Wuhan 430070, China
2 Department of Geography and Resource Management, The Chinese University of Hong Kong, Shatin, NT, Hong Kong, China
Remote Sens. 2017, 9(11), 1173; https://doi.org/10.3390/rs9111173 - 16 Nov 2017
Cited by 11 | Viewed by 4573
Abstract
Moderate resolution imaging spectroradiometer (MODIS) aerosol optical depth (AOD) products have been widely used to characterize the temporal variations and spatial distributions of atmospheric aerosols. In the present study, we evaluate the performance of four Terra and Aqua MODIS Collection 6 (C6) quality [...] Read more.
Moderate resolution imaging spectroradiometer (MODIS) aerosol optical depth (AOD) products have been widely used to characterize the temporal variations and spatial distributions of atmospheric aerosols. In the present study, we evaluate the performance of four Terra and Aqua MODIS Collection 6 (C6) quality assured AOD products in the Pearl River Delta (PRD) region, a humid subtropical region. The 10 km AOD products retrieved by the Dark Target (DT) and Deep Blue (DB) algorithms, the merged DT/DB (DTDB) 10 km product, and the DT 3 km AOD product were obtained for 2006–2015. These products were compared with Aerosol Robotic Network (AERONET) observations, and with each other. The Terra- and Aqua-derived AODs are quantitatively similar. However, there are significant differences among the four AOD products. The DT 10 km product correlates more closely with AERONET AOD observations than does the DB 10 km product. The latter tends to underestimate the AOD, whereas the former typically overestimates it for highly urbanized areas. The DTDB 10 km product is mainly derived from the DT 10 km product; it does not provide a gap-filled data set, because valid DB 10 km retrievals are not included in the merged product even when DT 10 km retrievals are unavailable. Therefore, the DT/DB merging protocol should be improved. The DT 3 km AOD product closely mimics the DT 10 km product; however, it contains fewer data than the DT 10 km product over water-contaminated areas. In addition, although the quality assured AOD products are recommended for use in quantitative applications by the MODIS aerosol science team, the sampling frequency of these products is generally lower than 25%. Thus, the sampling issues of these products should be considered in humid subtropical areas. Full article
(This article belongs to the Special Issue Aerosol Remote Sensing)
Show Figures

Graphical abstract

24 pages, 5707 KiB  
Article
A Hyperspectral Imaging Approach to White Matter Hyperintensities Detection in Brain Magnetic Resonance Images
by Hsian-Min Chen 1,2, Hsin Che Wang 1, Jyh-Wen Chai 3,4,*, Chi-Chang Clayton Chen 3, Bai Xue 5, Lin Wang 6, Chunyan Yu 7, Yulei Wang 7,8, Meiping Song 7 and Chein-I Chang 5,7,9,10
1 Center for Quantitative Imaging in Medicine (CQUIM), Department of Medical Research, Taichung Veterans General Hospital, Taichung 40705, Taiwan
2 Department of Biomedical Engineering, Hungkuang University, Taichung 43302, Taiwan
3 Department of Radiology, Taichung Veterans General Hospital, Taichung 40705, Taiwan
4 College of Medicine, China Medical University, Taichung 40402, Taiwan
5 Remote Sensing Signal and Image Processing Laboratory, Department of Computer Science and Electrical Engineering, University of Maryland, Baltimore County, Baltimore, MD 21250, USA
6 School of Physics and Optoelectronic Engineering, Xidian University, Xi’an 710126, China
7 Center for Hyperspectral Imaging in Remote Sensing (CHIRS), Information and Technology College, Dalian Maritime University, Dalian 116026, China
8 State Key Laboratory of Integrated Services Networks, Xi’an 710071, China
9 Department of Computer Science and Information Engineering, National Yunlin University of Science and Technology, Yunlin 64002, Taiwan
10 Department of Computer Science and Information Management, Providence University, Taichung 43301, Taiwan
Remote Sens. 2017, 9(11), 1174; https://doi.org/10.3390/rs9111174 - 16 Nov 2017
Cited by 8 | Viewed by 5730
Abstract
White matter hyperintensities (WMHs) are closely related to various geriatric disorders including cerebrovascular diseases, cardiovascular diseases, dementia, and psychiatric disorders of elderly people, and can be generally detected on T2 weighted (T2W) or fluid attenuation inversion recovery (FLAIR) brain magnetic resonance (MR) images. [...] Read more.
White matter hyperintensities (WMHs) are closely related to various geriatric disorders including cerebrovascular diseases, cardiovascular diseases, dementia, and psychiatric disorders of elderly people, and can be generally detected on T2 weighted (T2W) or fluid attenuation inversion recovery (FLAIR) brain magnetic resonance (MR) images. This paper develops a new approach to detect WMH in MR brain images from a hyperspectral imaging perspective. To take advantage of hyperspectral imaging, a nonlinear band expansion (NBE) process is proposed to expand MR images to a hyperspectral image. It then redesigns the well-known hyperspectral subpixel target detection, called constrained energy minimization (CEM), as an iterative version of CEM (ICEM) for WMH detection. Its idea is to implement CEM iteratively by feeding back Gaussian filtered CEM-detection maps to capture spatial information. To show effectiveness of NBE-ICEM in WMH detection, the lesion segmentation tool (LST), which is an open source toolbox for statistical parametric mapping (SPM), is used for comparative study. For quantitative analysis, the synthetic images in BrainWeb provided by McGill University are used for experiments where our proposed NBE-ICEM performs better than LST in all cases, especially for noisy MR images. As for real images collected by Taichung Veterans General Hospital, the NBE-ICEM also shows its advantages over and superiority to LST. Full article
(This article belongs to the Special Issue Hyperspectral Imaging and Applications)
Show Figures

Figure 1

16 pages, 7947 KiB  
Article
Monitoring Thermal Pollution in Rivers Downstream of Dams with Landsat ETM+ Thermal Infrared Images
by Feng Ling 1,*, Giles M. Foody 2, Hao Du 3, Xuan Ban 1, Xiaodong Li 1, Yihang Zhang 1 and Yun Du 1
1 Institute of Geodesy and Geophysics, Chinese Academy of Sciences, Wuhan 430077, China
2 School of Geography, University of Nottingham, University Park, Nottingham NG7 2RD, UK
3 Yangtze River Fisheries Research Institute, Chinese Academy of Fishery Science, Jingzhou 434000, China
Remote Sens. 2017, 9(11), 1175; https://doi.org/10.3390/rs9111175 - 16 Nov 2017
Cited by 53 | Viewed by 11682
Abstract
Dams play a significant role in altering the spatial pattern of temperature in rivers and contribute to thermal pollution, which greatly affects the river aquatic ecosystems. Understanding the temporal and spatial variation of thermal pollution caused by dams is important to prevent or [...] Read more.
Dams play a significant role in altering the spatial pattern of temperature in rivers and contribute to thermal pollution, which greatly affects the river aquatic ecosystems. Understanding the temporal and spatial variation of thermal pollution caused by dams is important to prevent or mitigate its harmful effect. Assessments based on in-situ measurements are often limited in practice because of the inaccessibility of water temperature records and the scarcity of gauges along rivers. By contrast, thermal infrared remote sensing provides an alternative approach to monitor thermal pollution downstream of dams in large rivers, because it can cover a large area and observe the same zone repeatedly. In this study, Landsat Enhanced Thematic Mapper Plus (ETM+) thermal infrared imagery were applied to assess the thermal pollution caused by two dams, the Geheyan Dam and the Gaobazhou Dam, located on the Qingjiang River, a tributary of the Yangtze River downstream of the Three Gorges Reservoir in Central China. The spatial and temporal characteristics of thermal pollution were analyzed with water temperatures estimated from 54 cloud-free Landsat ETM+ scenes acquired in the period from 2000 to 2014. The results show that water temperatures downstream of both dams are much cooler than those upstream of both dams in summer, and the water temperature remains stable along the river in winter, showing evident characteristic of the thermal pollution caused by dams. The area affected by the Geheyan Dam reaches beyond 20 km along the downstream river, and that affected by the Gaobazhou Dam extends beyond the point where the Qingjiang River enters the Yangtze River. Considering the long time series and global coverage of Landsat ETM+ imagery, the proposed technique in the current study provides a promising method for globally monitoring the thermal pollution caused by dams in large rivers. Full article
Show Figures

Graphical abstract

19 pages, 5935 KiB  
Article
Evaluating the Applicability of Four Latest Satellite–Gauge Combined Precipitation Estimates for Extreme Precipitation and Streamflow Predictions over the Upper Yellow River Basins in China
by Jianbin Su 1, Haishen Lü 1,*, Jianqun Wang 1, Ali M. Sadeghi 2 and Yonghua Zhu 1
1 State Key Laboratory of Hydrology-Water Resources and Hydraulic Engineering, College of Hydrology and Water Resources, Hohai University, Nanjing 210098, China
2 Rm. 104, Bldg. 007, USDA-ARS Hydrology and Remote Sensing Laboratory, Beltsville Agricultural Research Center, Beltsville, MD 20705-2350, USA
Remote Sens. 2017, 9(11), 1176; https://doi.org/10.3390/rs9111176 - 21 Nov 2017
Cited by 49 | Viewed by 5646
Abstract
This study aimed to statistically and hydrologically assess the performance of the four latest and widely used satellite–gauge combined precipitation estimates (SGPEs), namely CRT (CMORPH CRT), BLD (CMORPH BLD), CDR (PERSIANN CDR), 3B42 (TMPA 3B42 version 7) over the upper yellow river basins [...] Read more.
This study aimed to statistically and hydrologically assess the performance of the four latest and widely used satellite–gauge combined precipitation estimates (SGPEs), namely CRT (CMORPH CRT), BLD (CMORPH BLD), CDR (PERSIANN CDR), 3B42 (TMPA 3B42 version 7) over the upper yellow river basins (UYRB) in china during 2001–2012 time period. The performances of the SGPEs were compared with the Chinese Meteorological Administration (CMA) datasets using the hydrologic model called Variable Infiltration Capacity (VIC) which is known as a land surface hydrologic model. Results indicated that irrespective of the slight underestimation in the western mountains and overestimation in the southeast, the four SGPEs could generally captured the spatial distribution of precipitation well. Although 3B42 exhibited a better performance in capturing the spatial distribution of daily average precipitation, BLD agreed best with CMA in the time series of watershed average precipitation, which resulted in BLD having a comparable performance to the CMA in the long-term hydrological simulations. Moreover, the potential for disastrous heavy rain mainly occurs in southeastern corner of the basin, and CRT and BLD comparisons showed to be closer to the CMA in the distribution of extreme precipitation events while 3B42 and CDR overestimated the extreme precipitation especially over the southeast of UYRB region. Therefore, CRT and BLD were able to match the high peak discharges very well for the wet seasons, while 3B42 and CDR overrated the high peak discharges. In addition, the four SGPEs performed well for the 2005 flood event but exhibited poorly when tested for the 2012 flood event. Results indicate that the application of the four SGPEs should be used with caution in simulating massive flood events over UYRB region. Full article
Show Figures

Figure 1

22 pages, 20707 KiB  
Article
Automated Detection of Buildings from Heterogeneous VHR Satellite Images for Rapid Response to Natural Disasters
by Shaodan Li 1,2, Hong Tang 1,2,*, Xin Huang 3, Ting Mao 1,2 and Xiaonan Niu 1,2
1 Key Laboratory of Environment Change and Natural Disaster, Ministry of Education, Beijing Normal University, Beijing 100875, China
2 State Key Laboratory of Earth Surface Processes and Resource Ecology, Beijing Normal University, Beijing 100875, China
3 School of Remote Sensing and Information Engineering, Wuhan University, Wuhan 430072, China
Remote Sens. 2017, 9(11), 1177; https://doi.org/10.3390/rs9111177 - 17 Nov 2017
Cited by 17 | Viewed by 6671
Abstract
In this paper, we present a novel approach for automatically detecting buildings from multiple heterogeneous and uncalibrated very high-resolution (VHR) satellite images for a rapid response to natural disasters. In the proposed method, a simple and efficient visual attention method is first used [...] Read more.
In this paper, we present a novel approach for automatically detecting buildings from multiple heterogeneous and uncalibrated very high-resolution (VHR) satellite images for a rapid response to natural disasters. In the proposed method, a simple and efficient visual attention method is first used to extract built-up area candidates (BACs) from each multispectral (MS) satellite image. After this, morphological building indices (MBIs) are extracted from all the masked panchromatic (PAN) and MS images with BACs to characterize the structural features of buildings. Finally, buildings are automatically detected in a hierarchical probabilistic model by fusing the MBI and masked PAN images. The experimental results show that the proposed method is comparable to supervised classification methods in terms of recall, precision and F-value. Full article
(This article belongs to the Section Remote Sensing Image Processing)
Show Figures

Graphical abstract

27 pages, 2516 KiB  
Article
Evaluation and Aggregation Properties of Thermal Infra-Red-Based Evapotranspiration Algorithms from 100 m to the km Scale over a Semi-Arid Irrigated Agricultural Area
by Malik Bahir 1,2, Gilles Boulet 1,*, Albert Olioso 2, Vincent Rivalland 1, Belen Gallego-Elvira 3, Maria Mira 2,4, Julio-Cesar Rodriguez 5, Lionel Jarlan 1 and Olivier Merlin 1
1 CESBIO, Université de Toulouse, CNES/CNRS/IRD/UPS, 31401 Toulouse, France
2 EMMAH, INRA, Université d’Avignon et des Pays de Vaucluse, 84000 Avignon, France
3 NERC Centre for Ecology & Hydrology, Wallingford OX10 8BB, Oxfordshire, UK
4 Grumets Research Group, Department of Geography, Universitat Autònoma de Barcelona (UAB), 08193 Bellaterra, Catalonia, Spain
5 Departamento de Agricultura y Ganadería, Universidad de Sonora, 83000 Hermosillo, Sonora, Mexico
Remote Sens. 2017, 9(11), 1178; https://doi.org/10.3390/rs9111178 - 17 Nov 2017
Cited by 7 | Viewed by 5725
Abstract
Evapotranspiration (ET) estimates are particularly needed for monitoring the available water of arid lands. Remote sensing data offer the ideal spatial and temporal coverage needed by irrigation water management institutions to deal with increasing pressure on available water. Low spatial resolution (LR) products [...] Read more.
Evapotranspiration (ET) estimates are particularly needed for monitoring the available water of arid lands. Remote sensing data offer the ideal spatial and temporal coverage needed by irrigation water management institutions to deal with increasing pressure on available water. Low spatial resolution (LR) products present strong advantages. They cover larger zones and are acquired more frequently than high spatial resolution (HR) products. Current sensors such as Moderate-Resolution Imaging Spectroradiometer (MODIS) offer a long record history. However, validation of ET products at LR remains a difficult task. In this context, the objective of this study is to evaluate scaling properties of ET fluxes obtained at high and low resolution by two commonly used Energy Balance models, the Surface Energy Balance System (SEBS) and the Two-Source Energy Balance model (TSEB). Both are forced by local meteorological observations and remote sensing data in Visible, Near Infra-Red and Thermal Infra-Red spectral domains. Remotely sensed data stem from Advanced Spaceborne Thermal Emission and Reflection Radiometer (ASTER) and MODIS sensors, respectively, resampled at 100 m and 1000 m resolutions. The study zone is a square area of 4 by 4 km2 located in a semi-arid irrigated agricultural zone in the northwest of Mexico. Wheat is the dominant crop, followed by maize and vegetables. The HR ASTER dataset includes seven dates between the 30 December 2007 and 13 May 2008 and the LR MODIS products were retrieved for the same overpasses. ET retrievals from HR ASTER products provided reference ET maps at LR once linearly aggregated at the km scale. The quality of this retrieval was assessed using eddy covariance data at seven locations within the 4 by 4 km2 square. To investigate the impact of input aggregation, we first compared to the reference dataset all fluxes obtained by running TSEB and SEBS models using ASTER reflectances and radiances previously aggregated at the km scale. Second, we compared to the same reference dataset all fluxes obtained with SEBS and TSEB models using MODIS data. LR fluxes obtained by both models driven by aggregated ASTER input data compared well with the reference simulations and illustrated the relatively good accuracy achieved using aggregated inputs (relative bias of about 3.5% for SEBS and decreased to less than 1% for TSEB). Results also showed that MODIS ET estimates compared well with the reference simulation (relative bias was down to about 2% for SEBS and 3% for TSEB). Discrepancies were mainly related to fraction cover mapping for TSEB and to surface roughness length mapping for SEBS. This was consistent with the sensitivity analysis of those parameters previously published. To improve accuracy from LR estimates obtained using the 1 km surface temperature product provided by MODIS, we tested three statistical and one deterministic aggregation rules for the most sensible input parameter, the surface roughness length. The harmonic and geometric averages appeared to be the most accurate. Full article
(This article belongs to the Section Remote Sensing in Agriculture and Vegetation)
Show Figures

Graphical abstract

24 pages, 10582 KiB  
Article
Data Assimilation to Extract Soil Moisture Information from SMAP Observations
by Jana Kolassa 1,2,*, Rolf H. Reichle 2, Qing Liu 2,3, Michael Cosh 4, David D. Bosch 5, Todd G. Caldwell 6, Andreas Colliander 7, Chandra Holifield Collins 8, Thomas J. Jackson 4, Stan J. Livingston 9, Mahta Moghaddam 10 and Patrick J. Starks 11
1 Universities Space Research Association, Columbia, MD 21046, USA
2 Global Modeling and Assimilation Office, NASA Goddard Space Flight Center, Greenbelt, MD 20771, USA
3 Science Systems and Applications Inc., Lanham, MD 20706, USA
4 USDA ARS Hydrology and Remote Sensing Laboratory, Beltsville, MD 20705, USA
5 USDA ARS Southeast Watershed Research Center, Tifton, GA 31793, USA
6 Bureau of Economic Geology, The University of Texas at Austin, Austin, TX 78712, USA
7 Jet Propulsion Laboratory, California Institute of Technology, Pasadena, CA 91125, USA
8 USDA ARS Southwest Watershed Research Center, Tucson, AZ 85719, USA
9 USDA ARS National Soil Erosion Research Laboratory, West Lafayette, IN 47907, USA
10 Viterbi School of Engineering, University of Southern California, Los Angeles, CA 90089, USA
11 USDA ARS Grazinglands Research Laboratory, El Reno, OK 73036, USA
add Show full affiliation list remove Hide full affiliation list
Remote Sens. 2017, 9(11), 1179; https://doi.org/10.3390/rs9111179 - 17 Nov 2017
Cited by 37 | Viewed by 7552
Abstract
This study compares different methods to extract soil moisture information through the assimilation of Soil Moisture Active Passive (SMAP) observations. Neural network (NN) and physically-based SMAP soil moisture retrievals were assimilated into the National Aeronautics and Space Administration (NASA) Catchment model over the [...] Read more.
This study compares different methods to extract soil moisture information through the assimilation of Soil Moisture Active Passive (SMAP) observations. Neural network (NN) and physically-based SMAP soil moisture retrievals were assimilated into the National Aeronautics and Space Administration (NASA) Catchment model over the contiguous United States for April 2015 to March 2017. By construction, the NN retrievals are consistent with the global climatology of the Catchment model soil moisture. Assimilating the NN retrievals without further bias correction improved the surface and root zone correlations against in situ measurements from 14 SMAP core validation sites (CVS) by 0.12 and 0.16, respectively, over the model-only skill, and reduced the surface and root zone unbiased root-mean-square error (ubRMSE) by 0.005 m 3 m 3 and 0.001 m 3 m 3 , respectively. The assimilation reduced the average absolute surface bias against the CVS measurements by 0.009 m 3 m 3 , but increased the root zone bias by 0.014 m 3 m 3 . Assimilating the NN retrievals after a localized bias correction yielded slightly lower surface correlation and ubRMSE improvements, but generally the skill differences were small. The assimilation of the physically-based SMAP Level-2 passive soil moisture retrievals using a global bias correction yielded similar skill improvements, as did the direct assimilation of locally bias-corrected SMAP brightness temperatures within the SMAP Level-4 soil moisture algorithm. The results show that global bias correction methods may be able to extract more independent information from SMAP observations compared to local bias correction methods, but without accurate quality control and observation error characterization they are also more vulnerable to adverse effects from retrieval errors related to uncertainties in the retrieval inputs and algorithm. Furthermore, the results show that using global bias correction approaches without a simultaneous re-calibration of the land model processes can lead to skill degradation in other land surface variables. Full article
(This article belongs to the Special Issue Retrieval, Validation and Application of Satellite Soil Moisture Data)
Show Figures

Graphical abstract

24 pages, 10188 KiB  
Article
Tree-Species Classification in Subtropical Forests Using Airborne Hyperspectral and LiDAR Data
by Xin Shen and Lin Cao *
Co-Innovation Center for Sustainable Forestry in Southern China, Nanjing Forestry University, Nanjing 210037, China
Remote Sens. 2017, 9(11), 1180; https://doi.org/10.3390/rs9111180 - 17 Nov 2017
Cited by 113 | Viewed by 13674
Abstract
Accurate classification of tree-species is essential for sustainably managing forest resources and effectively monitoring species diversity. In this study, we used simultaneously acquired hyperspectral and LiDAR data from LiCHy (Hyperspectral, LiDAR and CCD) airborne system to classify tree-species in subtropical forests of southeast [...] Read more.
Accurate classification of tree-species is essential for sustainably managing forest resources and effectively monitoring species diversity. In this study, we used simultaneously acquired hyperspectral and LiDAR data from LiCHy (Hyperspectral, LiDAR and CCD) airborne system to classify tree-species in subtropical forests of southeast China. First, each individual tree crown was extracted using the LiDAR data by a point cloud segmentation algorithm (PCS) and the sunlit portion of each crown was selected using the hyperspectral data. Second, different suites of hyperspectral and LiDAR metrics were extracted and selected by the indices of Principal Component Analysis (PCA) and the mean decrease in Gini index (MDG) from Random Forest (RF). Finally, both hyperspectral metrics (based on whole crown and sunlit crown) and LiDAR metrics were assessed and used as inputs to Random Forest classifier to discriminate five tree-species at two levels of classification. The results showed that the tree delineation approach (point cloud segmentation algorithm) was suitable for detecting individual tree in this study (overall accuracy = 82.9%). The classification approach provided a relatively high accuracy (overall accuracy > 85.4%) for classifying five tree-species in the study site. The classification using both hyperspectral and LiDAR metrics resulted in higher accuracies than only hyperspectral metrics (the improvement of overall accuracies = 0.4–5.6%). In addition, compared with the classification using whole crown metrics (overall accuracies = 85.4–89.3%), using sunlit crown metrics (overall accuracies = 87.1–91.5%) improved the overall accuracies of 2.3%. The results also suggested that fewer of the most important metrics can be used to classify tree-species effectively (overall accuracies = 85.8–91.0%). Full article
(This article belongs to the Section Forest Remote Sensing)
Show Figures

Graphical abstract

21 pages, 28428 KiB  
Article
Source Parameters of the 2016–2017 Central Italy Earthquake Sequence from the Sentinel-1, ALOS-2 and GPS Data
by Guangyu Xu 1, Caijun Xu 1,2,3,*, Yangmao Wen 1,2,3 and Guoyan Jiang 4
1 School of Geodesy and Geomatics, Wuhan University, Wuhan 430079, China
2 Key Laboratory of Geospace Environment and Geodesy, Ministry of Education, Wuhan University, Wuhan 430079, China
3 Collaborative Innovation Center of Geospatial Technology, Wuhan University, Wuhan 430079, China
4 Earth System Science Programme, Science Faculty, The Chinese University of Hong Kong, Hong Kong, China
Remote Sens. 2017, 9(11), 1182; https://doi.org/10.3390/rs9111182 - 17 Nov 2017
Cited by 51 | Viewed by 7348
Abstract
In this study, joint inversions of Synthetic Aperture Radar (SAR) and Global Position System (GPS) measurements are used to investigate the source parameters of four Mw > 5 events of the 2016–2017 Central Italy earthquake sequence. The results show that the four events [...] Read more.
In this study, joint inversions of Synthetic Aperture Radar (SAR) and Global Position System (GPS) measurements are used to investigate the source parameters of four Mw > 5 events of the 2016–2017 Central Italy earthquake sequence. The results show that the four events are all associated with a normal fault striking northwest–southeast and dipping southwest. The observations, in all cases, are consistent with slip on a rupture plane, with strike in the range of 157° to 164° and dip in the range of 39° to 44° that penetrates the uppermost crust to a depth of 0 to 8 km. The primary characteristics of these four events are that the 24 August 2016 Mw 6.2 Amatrice earthquake had pronounced heterogeneity of the slip distribution marked by two main slip patches, the 26 October 2016 Mw 6.1 Visso earthquake had a concentrated slip at 3–6 km, and the predominant slip of the 30 October 2016 Mw 6.6 Norcia earthquake occurred on the fault with a peak magnitude of 2.5 m at a depth of 0–6 km, suggesting that the rupture may have reached the surface, and the 18 January 2017 Mw 5.7 Campotosto earthquake had a large area of sliding at depth 3–9 km. The positive static stress changes on the fault planes of the latter three events demonstrate that the 24 August 2016 Amatrice earthquake may have triggered a cascading failure of earthquakes along the complex normal fault system in Central Italy. Full article
(This article belongs to the Special Issue Radar Interferometry for Geohazards)
Show Figures

Graphical abstract

12 pages, 6323 KiB  
Technical Note
Identification of C-Band Radio Frequency Interferences from Sentinel-1 Data
by Andrea Monti-Guarnieri 1,*, Davide Giudici 2 and Andrea Recchia 2
1 Dipartimento di Elettronica, Informazione e Bioingegneria, Politecnico di Milano, Piazza Leonardo da Vinci 32, 20133 Milan, Italy
2 ARESYS srl, Via Flumendosa 16, 20132 Milan, Italy
Remote Sens. 2017, 9(11), 1183; https://doi.org/10.3390/rs9111183 - 17 Nov 2017
Cited by 43 | Viewed by 11973
Abstract
We propose the use of Sentinel-1 Synthetic Aperture Radar (SAR) to provide a continuous and global monitoring of Radio Frequency Interferences (RFI) in C-band. We take advantage of the first 8–10 echo measures at the beginning of each burst, a 50–70 MHz wide [...] Read more.
We propose the use of Sentinel-1 Synthetic Aperture Radar (SAR) to provide a continuous and global monitoring of Radio Frequency Interferences (RFI) in C-band. We take advantage of the first 8–10 echo measures at the beginning of each burst, a 50–70 MHz wide bandwidth and a ground beam coverage of ~25 km (azimuth) by 70 km (range). Such observations can be repeated with a frequency better than three days, by considering two satellites and both ascending and descending passes. These measures can be used to qualify the same Sentinel-1 (S1) dataset as well as to monitor the availability and the use of radio frequency spectrum for present and future spaceborne imagers and for policy makers. In the paper we investigate the feasibility and the limits of this approach, and we provide a first Radio Frequency Interference (RFI) map with continental coverage over Europe. Full article
(This article belongs to the Special Issue Advances in SAR: Sensors, Methodologies, and Applications)
Show Figures

Graphical abstract

19 pages, 9570 KiB  
Article
In-Season Crop Mapping with GF-1/WFV Data by Combining Object-Based Image Analysis and Random Forest
by Qian Song 1, Qiong Hu 1, Qingbo Zhou 1, Ciara Hovis 2, Mingtao Xiang 1, Huajun Tang 1 and Wenbin Wu 1,*
1 Key Laboratory of Agricultural Remote Sensing (AGRIRS), Ministry of Agriculture/Institute of Agricultural Resources and Regional Planning, Chinese Academy of Agricultural Sciences, Beijing 100081, China
2 Center for System Integration and Sustainability, Michigan State University, East Lansing, MI 48824, USA
Remote Sens. 2017, 9(11), 1184; https://doi.org/10.3390/rs9111184 - 17 Nov 2017
Cited by 87 | Viewed by 9837
Abstract
Producing accurate crop maps during the current growing season is essential for effective agricultural monitoring. Substantial efforts have been made to study regional crop distribution from year to year, but less attention is paid to the dynamics of composition and spatial extent of [...] Read more.
Producing accurate crop maps during the current growing season is essential for effective agricultural monitoring. Substantial efforts have been made to study regional crop distribution from year to year, but less attention is paid to the dynamics of composition and spatial extent of crops within a season. Understanding how crops are distributed at the early developing stages allows for the timely adjustment of crop planting structure as well as agricultural decision making and management. To address this knowledge gap, this study presents an approach integrating object-based image analysis with random forest (RF) for mapping in-season crop types based on multi-temporal GaoFen satellite data with a spatial resolution of 16 meters. A multiresolution local variance strategy was used to create crop objects, and then object-based spectral/textural features and vegetation indices were extracted from those objects. The RF classifier was employed to identify different crop types at four crop growth seasons by integrating available features. The crop classification performance of different seasons was assessed by calculating F-score values. Results show that crop maps derived using seasonal features achieved an overall accuracy of more than 87%. Compared to the use of spectral features, a feature combination of in-season textures and multi-temporal spectral and vegetation indices performs best when classifying crop types. Spectral and temporal information is more important than texture features for crop mapping. However, texture can be essential information when there is insufficient spectral and temporal information (e.g., crop identification in the early spring). These results indicate that an object-based image analysis combined with random forest has considerable potential for in-season crop mapping using high spatial resolution imagery. Full article
(This article belongs to the Section Remote Sensing in Agriculture and Vegetation)
Show Figures

Graphical abstract

28 pages, 10174 KiB  
Article
Davos-Laret Remote Sensing Field Laboratory: 2016/2017 Winter Season L-Band Measurements Data-Processing and Analysis
by Reza Naderpour 1,*, Mike Schwank 1,2 and Christian Mätzler 2
1 Swiss Federal Research Institute WSL, CH-8903 Birmensdorf, Switzerland
2 Gamma Remote Sensing AG, CH-3073 Gümligen, Switzerland
Remote Sens. 2017, 9(11), 1185; https://doi.org/10.3390/rs9111185 - 21 Nov 2017
Cited by 29 | Viewed by 5944
Abstract
The L-band radiometry data and in-situ ground and snow measurements performed during the 2016/2017 winter campaign at the Davos-Laret remote sensing field laboratory are presented and discussed. An improved version of the procedure for the computation of L-band brightness temperatures from ELBARA radiometer [...] Read more.
The L-band radiometry data and in-situ ground and snow measurements performed during the 2016/2017 winter campaign at the Davos-Laret remote sensing field laboratory are presented and discussed. An improved version of the procedure for the computation of L-band brightness temperatures from ELBARA radiometer raw data is introduced. This procedure includes a thorough explanation of the calibration and filtering including a refined radio frequency interference (RFI) mitigation approach. This new mitigation approach not only performs better than conventional “normality” tests (kurtosis and skewness) but also allows for the quantification of measurement uncertainty introduced by non-thermal noise contributions. The brightness temperatures of natural snow covered areas and areas with a reflector beneath the snow are simulated for varying amounts of snow liquid water content distributed across the snow profile. Both measured and simulated brightness temperatures emanating from natural snow covered areas and areas with a reflector beneath the snow reveal noticeable sensitivity with respect to snow liquid water. This indicates the possibility of estimating snow liquid water using L-band radiometry. It is also shown that distinct daily increases in brightness temperatures measured over the areas with the reflector placed on the ground indicate the onset of the snow melting season, also known as “early-spring snow”. Full article
(This article belongs to the Special Issue Snow Remote Sensing)
Show Figures

Figure 1

17 pages, 3258 KiB  
Article
Wave Height Estimation from First-Order Backscatter of a Dual-Frequency High Frequency Radar
by Yingwei Tian 1,*, Biyang Wen 1, Hao Zhou 1, Caijun Wang 1, Jing Yang 1 and Weimin Huang 2
1 School of Electronic Information, Wuhan University, Wuhan 430072, China
2 Department of Electrical and Computer Engineering, Memorial University, St. John’s, NL A1B 3X5, Canada
Remote Sens. 2017, 9(11), 1186; https://doi.org/10.3390/rs9111186 - 18 Nov 2017
Cited by 21 | Viewed by 6084
Abstract
Second-order scattering based wave height measurement with high-frequency (HF) radar has always been subjected to problems such as distance limitation and external interference especially under low or moderate sea state. The performance is further exacerbated for a compact system with small antennas. First-order [...] Read more.
Second-order scattering based wave height measurement with high-frequency (HF) radar has always been subjected to problems such as distance limitation and external interference especially under low or moderate sea state. The performance is further exacerbated for a compact system with small antennas. First-order Bragg scattering has been investigated to relate wave height to the stronger Bragg backscatter, but calibrating the echo power along distance and direction is challenging. In this paper, a new method is presented to deal with the calibration and improve the Bragg scattering based wave height estimation from dual-frequency radar data. The relative difference of propagation attenuation and directional spreading between two operating frequencies has been found to be identifiable along range and almost independent of direction, and it is employed to effectively reduce the fitting requirements of in situ wave buoys. A 20-day experiment was performed over the Taiwan Strait of China to validate this method. Comparison of wave height measured by radar and buoys at distance of 15 km and 70 km shows that the root-mean-square errors are 0.34 m and 0.56 m, respectively, with correlation coefficient of 0.82 and 0.84. Full article
(This article belongs to the Special Issue Instruments and Methods for Ocean Observation and Monitoring)
Show Figures

Graphical abstract

23 pages, 4363 KiB  
Article
Photogrammetric UAV Mapping of Terrain under Dense Coastal Vegetation: An Object-Oriented Classification Ensemble Algorithm for Classification and Terrain Correction
by Xuelian Meng 1,2,*, Nan Shang 1, Xukai Zhang 1, Chunyan Li 2,3, Kaiguang Zhao 4, Xiaomin Qiu 5 and Eddie Weeks 3
1 Department of Geography & Anthropology, Louisiana State University, Baton Rouge, LA 70803, USA
2 Coastal Studies Institute, Louisiana State University, Baton Rouge, LA 70803, USA
3 Department of Oceanography and Coastal Sciences, Louisiana State University, Baton Rouge, LA 70803, USA
4 School of Environment and Natural Resources, Ohio Agriculture Research and Development Center, Ohio State University, Wooster, OH 44691, USA
5 Department of Geography, Geology and Planning, Missouri State University, Springfield, MO 65897, USA
Remote Sens. 2017, 9(11), 1187; https://doi.org/10.3390/rs9111187 - 19 Nov 2017
Cited by 46 | Viewed by 11742
Abstract
Photogrammetric UAV sees a surge in use for high-resolution mapping, but its use to map terrain under dense vegetation cover remains challenging due to a lack of exposed ground surfaces. This paper presents a novel object-oriented classification ensemble algorithm to leverage height, texture [...] Read more.
Photogrammetric UAV sees a surge in use for high-resolution mapping, but its use to map terrain under dense vegetation cover remains challenging due to a lack of exposed ground surfaces. This paper presents a novel object-oriented classification ensemble algorithm to leverage height, texture and contextual information of UAV data to improve landscape classification and terrain estimation. Its implementation incorporates multiple heuristics, such as multi-input machine learning-based classification, object-oriented ensemble, and integration of UAV and GPS surveys for terrain correction. Experiments based on a densely vegetated wetland restoration site showed classification improvement from 83.98% to 96.12% in overall accuracy and from 0.7806 to 0.947 in kappa value. Use of standard and existing UAV terrain mapping algorithms and software produced reliable digital terrain model only over exposed bare grounds (mean error = −0.019 m and RMSE = 0.035 m) but severely overestimated the terrain by ~80% of mean vegetation height in vegetated areas. The terrain correction method successfully reduced the mean error from 0.302 m to −0.002 m (RMSE from 0.342 m to 0.177 m) in low vegetation and from 1.305 m to 0.057 m (RMSE from 1.399 m to 0.550 m) in tall vegetation. Overall, this research validated a feasible solution to integrate UAV and RTK GPS for terrain mapping in densely vegetated environments. Full article
(This article belongs to the Section Remote Sensing in Agriculture and Vegetation)
Show Figures

Graphical abstract

22 pages, 6196 KiB  
Article
Stochastic Models of Very High-Rate (50 Hz) GPS/BeiDou Code and Phase Observations
by Yuanming Shu, Rongxin Fang and Jingnan Liu *
GNSS Research Center, Wuhan University, 129 Luoyu Road, Wuhan 430079, China
Remote Sens. 2017, 9(11), 1188; https://doi.org/10.3390/rs9111188 - 21 Nov 2017
Cited by 10 | Viewed by 4913
Abstract
In recent years, very high-rate (10–50 Hz) Global Navigation Satellite System (GNSS) has gained a rapid development and has been widely applied in seismology, natural hazard early warning system and structural monitoring. However, existing studies on stochastic models of GNSS observations are limited [...] Read more.
In recent years, very high-rate (10–50 Hz) Global Navigation Satellite System (GNSS) has gained a rapid development and has been widely applied in seismology, natural hazard early warning system and structural monitoring. However, existing studies on stochastic models of GNSS observations are limited to sampling rates not higher than 1 Hz. To support very high-rate GNSS applications, we assess the precisions, cross correlations and time correlations of very high-rate (50 Hz) Global Positioning System (GPS)/BeiDou code and phase observations. The method of least-squares variance component estimation is applied with the geometry-based functional model using the GNSS single-differenced observations. The real-data experimental results show that the precisions are elevation-dependent at satellite elevation angles below 40° and nearly constant at satellite elevation angles above 40°. The precisions of undifferenced observations are presented, exhibiting different patterns for different observation types and satellites, especially for BeiDou because different types of satellites are involved. GPS and BeiDou have comparable precisions at high satellite elevation angles, reaching 0.91–1.26 mm and 0.13–0.17 m for phase and code, respectively, while, at low satellite elevation angles, GPS precisions are generally lower than BeiDou ones. The cross correlation between dual-frequency phase is very significant, with the coefficients of 0.773 and 0.927 for GPS and BeiDou, respectively. The cross correlation between dual-frequency code is much less significant, and no correlation can be found between phase and code. Time correlations exist for GPS/BeiDou phase and code at time lags within 1 s. At very small time lags of 0.02–0.12 s, time correlations of 0.041–0.293 and 0.858–0.945 can be observed for phase and code observations, respectively, indicating that the correlations in time should be taken into account in very high-rate applications. Full article
Show Figures

Graphical abstract

21 pages, 4447 KiB  
Article
Photochemical Reflectance Index (PRI) for Detecting Responses of Diurnal and Seasonal Photosynthetic Activity to Experimental Drought and Warming in a Mediterranean Shrubland
by Chao Zhang 1,2,*, Iolanda Filella 1,2, Daijun Liu 1,2, Romà Ogaya 1,2, Joan Llusià 1,2, Dolores Asensio 1,2 and Josep Peñuelas 1,2
1 CREAF, 08193 Cerdanyola del Vallès, Catalonia, Spain
2 CSIC, Global Ecology Unit CREAF-CSIC-UAB, 08193 Bellaterra, Catalonia, Spain
Remote Sens. 2017, 9(11), 1189; https://doi.org/10.3390/rs9111189 - 20 Nov 2017
Cited by 45 | Viewed by 9319
Abstract
Climatic warming and drying are having profound impacts on terrestrial carbon cycling by altering plant physiological traits and photosynthetic processes, particularly for species in the semi-arid Mediterranean ecosystems. More effective methods of remote sensing are needed to accurately assess the physiological responses and [...] Read more.
Climatic warming and drying are having profound impacts on terrestrial carbon cycling by altering plant physiological traits and photosynthetic processes, particularly for species in the semi-arid Mediterranean ecosystems. More effective methods of remote sensing are needed to accurately assess the physiological responses and seasonal photosynthetic activities of evergreen species to climate change. We evaluated the stand reflectance in parallel to the diurnal and seasonal changes in gas exchange, fluorescence and water contents of leaves and soil for a Mediterranean evergreen shrub, Erica multiflora, submitted to long-term experimental warming and drought. We also calculated a differential photochemical reflectance index (ΔPRI, morning PRI subtracted from midday PRI) to assess the diurnal responses of photosynthesis (ΔA) to warming and drought. The results indicated that the PRI, but not the normalized difference vegetation index (NDVI), was able to assess the seasonal changes of photosynthesis. Changes in water index (WI) were consistent with seasonal foliar water content (WC). In the warming treatment, ΔA value was higher than control in winter but ΔYield was significantly lower in both summer and autumn, demonstrating the positive effect of the warming on the photosynthesis in winter and the negative effect in summer and autumn, i.e., increased photosynthetic midday depression in summer and autumn, when temperatures were much higher than in winter. Drought treatment increased the midday depression of photosynthesis in summer. Importantly, ΔPRI was significantly correlated with ΔA both under warming and drought, indicating the applicability of ΔPRI for tracking the midday depression of photosynthetic processes. Using PRI and ΔPRI to monitor the variability in photosynthesis could provide a simple method to remotely sense photosynthetic seasonality and midday depression in response to ongoing and future environmental stresses. Full article
(This article belongs to the Special Issue Remote Sensing of Arid/Semiarid Lands)
Show Figures

Graphical abstract

19 pages, 4205 KiB  
Article
Sparse Weighted Constrained Energy Minimization for Accurate Remote Sensing Image Target Detection
by Ying Wang *, Miao Fan, Jie Li and Zhaobin Cui
Lab of Video and Image Processing Systems, School of Electronic Engineering, Xidian University, Xi’an 710071, China
Remote Sens. 2017, 9(11), 1190; https://doi.org/10.3390/rs9111190 - 20 Nov 2017
Cited by 8 | Viewed by 4276
Abstract
Target detection is an important task for remote sensing images, while it is still difficult to obtain satisfied performance when some images possess complex and confusion spectrum information, for example, the high similarity between target and background spectrum under some circumstance. Traditional detectors [...] Read more.
Target detection is an important task for remote sensing images, while it is still difficult to obtain satisfied performance when some images possess complex and confusion spectrum information, for example, the high similarity between target and background spectrum under some circumstance. Traditional detectors always detect target without any preprocessing procedure, which can increase the difference between target spectrum and background spectrum. Therefore, these methods could not discriminate the target from complex or similar background effectively. In this paper, sparse representation was introduced to weight each pixel for further increasing the difference between target and background spectrum. According to sparse reconstruction error matrix of pixels on images, adaptive weights will be assigned to each pixel for improving the difference between target and background spectrum. Furthermore, the sparse weighted-based constrained energy minimization method only needs to construct target dictionary, which is easier to acquire. Then, according to more distinct spectrum characteristic, the detectors can distinguish target from background more effectively and efficiency. Comparing with state-of-the-arts of target detection on remote sensing images, the proposed method can obtain more sensitive and accurate detection performance. In addition, the method is more robust to complex background than the other methods. Full article
(This article belongs to the Section Remote Sensing Image Processing)
Show Figures

Figure 1

17 pages, 8274 KiB  
Article
Advancing the PROSPECT-5 Model to Simulate the Spectral Reflectance of Copper-Stressed Leaves
by Chengye Zhang 1,2,3,4, Huazhong Ren 1,2,3, Yanzhen Liang 5, Suhong Liu 6, Qiming Qin 1,2,3,* and Okan K. Ersoy 4
1 Institute of Remote Sensing and Geographic Information System, School of Earth and Space Sciences, Peking University, Beijing 100871, China
2 Beijing Key Lab of Spatial Information Integration and 3S Application, Peking University, Beijing 100871, China
3 Mapping and Geo-Information for Geographic Information Basic Softwares and Applications, Engineering Research Center of National Administration of Surveying, Beijing 100871, China
4 School of Electrical and Computer Engineering, Purdue University, West Lafayette, IN 47907, USA
5 Earth Observation System & Data Center, China National Space Administration, Beijing 100101, China
6 Faculty of Geographical Science, Beijing Normal University, Beijing 100875, China
Remote Sens. 2017, 9(11), 1191; https://doi.org/10.3390/rs9111191 - 20 Nov 2017
Cited by 15 | Viewed by 5891
Abstract
This paper proposes a modified model based on the PROSPECT-5 model to simulate the spectral reflectance of copper-stressed leaves. Compared with PROSPECT-5, the modified model adds the copper content of leaves as one of input variables, and the specific absorption coefficient related to [...] Read more.
This paper proposes a modified model based on the PROSPECT-5 model to simulate the spectral reflectance of copper-stressed leaves. Compared with PROSPECT-5, the modified model adds the copper content of leaves as one of input variables, and the specific absorption coefficient related to copper (Kcu) was estimated and fixed in the modified model. The specific absorption coefficients of other biochemical components (chlorophyll, carotenoid, water, dry matter) were the same as those in PROSPECT-5. Firstly, based on PROSPECT-5, we estimated the leaf structure parameters (N), using biochemical contents (chlorophyll, carotenoid, water, and dry matter) and the spectra of all the copper-stressed leaves (samples). Secondly, the specific absorption coefficient related to copper (Kcu) was estimated by fitting the simulated spectra to the measured spectra using 22 samples. Thirdly, other samples were used to verify the effectiveness of the modified model. The spectra with the new model are closer to the measured spectra when compared to that with PROSPECT-5. Moreover, for all the datasets used for validation and calibration, the root mean square errors (RMSEs) from the new model are less than that from PROSPECT-5. The differences between simulated reflectance and measured reflectance at key wavelengths with the new model are nearer to zero than those with the PROSPECT-5 model. This study demonstrated that the modified model could get more accurate spectral reflectance from copper-stressed leaves when compared with PROSPECT-5, and would provide theoretical support for monitoring the vegetation stressed by copper using remote sensing. Full article
Show Figures

Graphical abstract

20 pages, 4339 KiB  
Article
Validation and Calibration of QAA Algorithm for CDOM Absorption Retrieval in the Changjiang (Yangtze) Estuarine and Coastal Waters
by Yongchao Wang, Fang Shen *, Leonid Sokoletsky and Xuerong Sun
State Key Laboratory of Estuarine and Coastal Research, East China Normal University, 3663 Zhongshan N. Road, Shanghai 200062, China
Remote Sens. 2017, 9(11), 1192; https://doi.org/10.3390/rs9111192 - 21 Nov 2017
Cited by 39 | Viewed by 7217
Abstract
Distribution, migration and transformation of chromophoric dissolved organic matter (CDOM) in coastal waters are closely related to marine biogeochemical cycle. Ocean color remote sensing retrieval of CDOM absorption coefficient (ag(λ)) can be used as an indicator to trace [...] Read more.
Distribution, migration and transformation of chromophoric dissolved organic matter (CDOM) in coastal waters are closely related to marine biogeochemical cycle. Ocean color remote sensing retrieval of CDOM absorption coefficient (ag(λ)) can be used as an indicator to trace the distribution and variation characteristics of the Changjiang diluted water, and further to help understand estuarine and coastal biogeochemical processes in large spatial and temporal scales. The quasi-analytical algorithm (QAA) has been widely applied to remote sensing inversions of optical and biogeochemical parameters in water bodies such as oceanic and coastal waters, however, whether the algorithm can be applicable to highly turbid waters (i.e., Changjiang estuarine and coastal waters) is still unknown. In this study, large amounts of in situ data accumulated in the Changjiang estuarine and coastal waters from 9 cruise campaigns during 2011 and 2015 are used to verify and calibrate the QAA. Furthermore, the QAA is remodified for CDOM retrieval by employing a CDOM algorithm (QAA_CDOM). Consequently, based on the QAA and the QAA_CDOM, we developed a new version of algorithm, named QAA_cj, which is more suitable for highly turbid waters, e.g., Changjiang estuarine and coastal waters, to decompose ag from adg (CDOM and non-pigmented particles absorption coefficient). By comparison of matchups between Geostationary Ocean Color Imager (GOCI) retrievals and in situ data, it reveals that the accuracy of retrievals from calibrated QAA is significantly improved. The root mean square error (RMSE), mean absolute relative error (MARE) and bias of total absorption coefficients (a(λ)) are lower than 1.17, 0.52 and 0.66 m−1, and ag(λ) at 443 nm are lower than 0.07, 0.42 and 0.018 m−1. These results indicate that the calibrated algorithm has a better applicability and prospect for highly turbid coastal waters with extremely complicated optical properties. Thus, reliable CDOM products from the improved QAA_cj can advance our understanding of the land-ocean interaction process by earth observations in monitoring spatial-temporal distribution of the river plume into sea. Full article
Show Figures

Graphical abstract

22 pages, 18313 KiB  
Article
Developing a Random Forest Algorithm for MODIS Global Burned Area Classification
by Rubén Ramo and Emilio Chuvieco *
Enviromental Remote Sensing Research Group, Department of Geology, Geography and the Environment, University of Alcalá, Colegios 2, 28801 Alcalá de Henares, Spain
Remote Sens. 2017, 9(11), 1193; https://doi.org/10.3390/rs9111193 - 21 Nov 2017
Cited by 104 | Viewed by 10839
Abstract
This paper aims to develop a global burned area (BA) algorithm for MODIS BRDF-corrected images based on the Random Forest (RF) classifier. Two RF models were generated, including: (1) all MODIS reflective bands; and (2) only the red (R) and near infrared (NIR) [...] Read more.
This paper aims to develop a global burned area (BA) algorithm for MODIS BRDF-corrected images based on the Random Forest (RF) classifier. Two RF models were generated, including: (1) all MODIS reflective bands; and (2) only the red (R) and near infrared (NIR) bands. Active fire information, vegetation indices and auxiliary variables were taken into account as well. Both RF models were trained using a statistically designed sample of 130 reference sites, which took into account the global diversity of fire conditions. For each site, fire perimeters were obtained from multitemporal pairs of Landsat TM/ETM+ images acquired in 2008. Those fire perimeters were used to extract burned and unburned areas to train the RF models. Using the standard MD43A4 resolution (500 × 500 m), the training dataset included 48,365 burned pixels and 6,293,205 unburned pixels. Different combinations of number of trees and number of parameters were tested. The final RF models included 600 trees and 5 attributes. The RF full model (considering all bands) provided a balanced accuracy of 0.94, while the RF RNIR model had 0.93. As a first assessment of these RF models, they were used to classify daily MCD43A4 images in three test sites for three consecutive years (2006–2008). The selected sites included different ecosystems: Australia (Tropical), Boreal (Canada) and Temperate (California), and extended coverage (totaling more than 2,500,000 km2). Results from both RF models for those sites were compared with national fire perimeters, as well as with two existing BA MODIS products; the MCD45 and MCD64. Considering all three years and three sites, commission error for the RF Full model was 0.16, with an omission error of 0.23. For the RF RNIR model, these errors were 0.19 and 0.21, respectively. The existing MODIS BA products had lower commission errors, but higher omission errors (0.09 and 0.33 for the MCD45 and 0.10 and 0.29 for the MCD64) than those obtained with the RF models, and therefore they showed less balanced accuracies. The RF models developed here should be applicable to other biomes and years, as they were trained with a global set of reference BA sites. Full article
(This article belongs to the Section Forest Remote Sensing)
Show Figures

Graphical abstract

19 pages, 47319 KiB  
Article
The 2015–2016 Ground Displacements of the Shanghai Coastal Area Inferred from a Combined COSMO-SkyMed/Sentinel-1 DInSAR Analysis
by Lei Yu 1,2,3,4,5,6, Tianliang Yang 2,7,8, Qing Zhao 1,2,3,4,5,6,*, Min Liu 1,3,6 and Antonio Pepe 9
1 Key Laboratory of Geographic Information Science, Ministry of Education, East China Normal University, Shanghai 200241, China
2 Key Laboratory of Land Subsidence Monitoring and Prevention, Ministry of Land and Resources, Shanghai 200072, China
3 School of Geographic Sciences, East China Normal University, Shanghai 200241, China
4 Laboratory for Environmental Remote Sensing and Data Assimilation, East China Normal University, Shanghai 200062, China
5 ECNU-CSU Joint Research Institute for New Energy and the Environment, East China Normal University, Shanghai 200062, China
6 Chongming ECO Institute, East China Normal University, Shanghai 200241, China
7 Shanghai Engineering Research Center of Land Subsidence, Shanghai 200072, China
8 Shanghai Institute of Geological Survey, Shanghai 200072, China
9 Institute for Electromagnetic Sensing of the Environment (IREA), Italian National Research Council, 328Diocleziano, Napoli 80124, Italy
Remote Sens. 2017, 9(11), 1194; https://doi.org/10.3390/rs9111194 - 21 Nov 2017
Cited by 32 | Viewed by 7857
Abstract
In this work, ground deformation of the Shanghai coastal area is inferred by using the multiple-satellite Differential Synthetic Aperture Radar interferometry (DInSAR) approach, also known as the minimum acceleration (MinA) combination algorithm. The MinA technique allows discrimination and time-evolution monitoring of the inherent [...] Read more.
In this work, ground deformation of the Shanghai coastal area is inferred by using the multiple-satellite Differential Synthetic Aperture Radar interferometry (DInSAR) approach, also known as the minimum acceleration (MinA) combination algorithm. The MinA technique allows discrimination and time-evolution monitoring of the inherent two-dimensional components (i.e., with respect to east-west and up-down directions) of the ongoing deformation processes. It represents an effective post-processing tool that allows an easy combination of preliminarily-retrieved multiple-satellite Line-Of-Sight-projected displacement time-series, obtained by using one (or more) of the currently available multi-pass DInSAR toolboxes. Specifically, in our work, the well-known small baseline subset (SBAS) algorithm has been exploited to recover LOS deformation time-series from two sets of Synthetic Aperture Radar (SAR) data relevant to the coast of Shanghai, collected from 2014 to 2017 by the COSMO-SkyMed (CSK) and the Sentinel-1A (S1-A) sensors. The achieved results evidence that the Shanghai ocean-reclaimed areas were still subject to residual deformations in 2016, with maximum subsidence rates of about 30 mm/year. Moreover, the investigation has revealed that the detected deformations are predominantly vertical, whereas the east-west deformations are less significant. Full article
(This article belongs to the Special Issue Radar Interferometry for Geohazards)
Show Figures

Graphical abstract

17 pages, 5342 KiB  
Article
Estimating Snow Depth Using Multi-Source Data Fusion Based on the D-InSAR Method and 3DVAR Fusion Algorithm
by Yang Liu 1,2, Lanhai Li 1,2, Jinming Yang 3, Xi Chen 1,2,* and Jiansheng Hao 1,2
1 State Key Laboratory of Desert and Oasis Ecology, Xinjiang Institute of Ecology and Geography, Chinese Academy of Sciences, Urumqi 830011, China
2 CAS Research Center for Ecology and Environment of Central Asia, No. 818 South Beijing Road, Urumqi 830011, China
3 College of Resource and Environment Science, Xinjiang University, Urumqi 830046, China
Remote Sens. 2017, 9(11), 1195; https://doi.org/10.3390/rs9111195 - 21 Nov 2017
Cited by 28 | Viewed by 6795
Abstract
Snow depth is a general input variable in many models of agriculture, hydrology, climate, and ecology. However, there are some uncertainties in the retrieval of snow depth by remote sensing. Errors occurred in snow depth evaluation under the D-InSAR methods will affect the [...] Read more.
Snow depth is a general input variable in many models of agriculture, hydrology, climate, and ecology. However, there are some uncertainties in the retrieval of snow depth by remote sensing. Errors occurred in snow depth evaluation under the D-InSAR methods will affect the accuracy of snow depth inversion to a certain extent. This study proposes a scheme to estimate spatial snow depth that combines remote sensing with site observation. On the one hand, this scheme adopts the Sentinel-1 C-band of the European Space Agency (ESA), making use of the two-pass method of differential interferometry for inversion of spatial snow depth. On the other hand, the 3DVAR (three dimensional variational) fusion algorithm is used to integrate actual snow depth data of virtual stations and real-world observation stations into the snow depth inversion results. Thus, the accuracy of snow inversion will be improved. This scheme is applied in the study area of Bayanbulak Basin, which is located in the central hinterland of Tianshan Mountains in Xinjiang, China. Observation data from stations in different altitudes are selected to test the fusion method. According to the results, most of the obtained snow depth values using interferometry are lower than the observed ones. However, after the fusion using the 3DVAR algorithm, the snow depth accuracy is slightly higher than it was in the inversion results (R2 = 0.31 vs. R2 = 0.50, RMSE = 2.51 cm vs. RMSE = 1.96 cm; R2 = 0.27 vs. R2 = 0.46, RMSE = 4.04 cm vs. RMSE = 3.65 cm). When compared with the inversion results, the relative error (RE) improved by 6.97% and 3.59%, respectively. This study shows that the scheme can effectively improve the accuracy of regional snow depth estimation. Therefore, its future application is of great potential. Full article
(This article belongs to the Special Issue Snow Remote Sensing)
Show Figures

Graphical abstract

24 pages, 7247 KiB  
Article
Hyperspectral Super-Resolution with Spectral Unmixing Constraints
by Charis Lanaras *, Emmanuel Baltsavias and Konrad Schindler
Photogrammetry and Remote Sensing, ETH Zurich, 8093 Zurich, Switzerland
Remote Sens. 2017, 9(11), 1196; https://doi.org/10.3390/rs9111196 - 21 Nov 2017
Cited by 38 | Viewed by 8790
Abstract
Hyperspectral sensors capture a portion of the visible and near-infrared spectrum with many narrow spectral bands. This makes it possible to better discriminate objects based on their reflectance spectra and to derive more detailed object properties. For technical reasons, the high spectral resolution [...] Read more.
Hyperspectral sensors capture a portion of the visible and near-infrared spectrum with many narrow spectral bands. This makes it possible to better discriminate objects based on their reflectance spectra and to derive more detailed object properties. For technical reasons, the high spectral resolution comes at the cost of lower spatial resolution. To mitigate that problem, one may combine such images with conventional multispectral images of higher spatial, but lower spectral resolution. The process of fusing the two types of imagery into a product with both high spatial and spectral resolution is called hyperspectral super-resolution. We propose a method that performs hyperspectral super-resolution by jointly unmixing the two input images into pure reflectance spectra of the observed materials, along with the associated mixing coefficients. Joint super-resolution and unmixing is solved by a coupled matrix factorization, taking into account several useful physical constraints. The formulation also includes adaptive spatial regularization to exploit local geometric information from the multispectral image. Moreover, we estimate the relative spatial and spectral responses of the two sensors from the data. That information is required for the super-resolution, but often at most approximately known for real-world images. In experiments with five public datasets, we show that the proposed approach delivers up to 15% improved hyperspectral super-resolution. Full article
(This article belongs to the Section Remote Sensing Image Processing)
Show Figures

Graphical abstract

18 pages, 5647 KiB  
Article
Soil Moisture Retrieval and Spatiotemporal Pattern Analysis Using Sentinel-1 Data of Dahra, Senegal
by Zhiqu Liu, Pingxiang Li * and Jie Yang
State Key Laboratory of Information Engineering in Surveying, Mapping and Remote Sensing (LIESMARS), Wuhan University, Wuhan 430079, China
Remote Sens. 2017, 9(11), 1197; https://doi.org/10.3390/rs9111197 - 21 Nov 2017
Cited by 24 | Viewed by 8421
Abstract
The spatiotemporal pattern of soil moisture is of great significance for the understanding of the water exchange between the land surface and the atmosphere. The two-satellite constellation of the Sentinel-1 mission provides C-band synthetic aperture radar (SAR) observations with high spatial and temporal [...] Read more.
The spatiotemporal pattern of soil moisture is of great significance for the understanding of the water exchange between the land surface and the atmosphere. The two-satellite constellation of the Sentinel-1 mission provides C-band synthetic aperture radar (SAR) observations with high spatial and temporal resolutions, which are suitable for soil moisture monitoring. In this paper, we aim to assess the capability of pattern analysis based on the soil moisture retrieved from Sentinel-1 time-series data of Dahra in Senegal. The look-up table (LUT) method is used in the retrieval with the backscattering coefficients that are simulated by the advanced integrated equation Model (AIEM) for the soil layer and the Michigan microwave canopy scattering (MIMICS) model for the vegetation layer. The temporal trend of Sentinel-1A soil moisture is evaluated by the ground measurements from the site at Dahra, with an unbiased root-mean-squared deviation (ubRMSD) of 0.053 m3/m3, a mean average deviation (MAD) of 0.034 m3/m3, and an R value of 0.62. The spatial variation is also compared with the existing microwave products at a coarse scale, which confirms the reliability of the Sentinel-1A soil moisture. The spatiotemporal patterns are analyzed by empirical orthogonal functions (EOF), and the geophysical factors that are affecting soil moisture are discussed. The first four EOFs of soil moisture explain 77.2% of the variance in total and the primary EOF explains 66.2%, which shows the dominant pattern at the study site. Soil texture and the normalized difference vegetation index are more closely correlated with the primary pattern than the topography and temperature in the study area. The investigation confirms the potential for soil moisture retrieval and spatiotemporal pattern analysis using Sentinel-1 images. Full article
(This article belongs to the Section Remote Sensing in Geology, Geomorphology and Hydrology)
Show Figures

Graphical abstract

20 pages, 11161 KiB  
Article
Airport Detection Using End-to-End Convolutional Neural Network with Hard Example Mining
by Bowen Cai 1,2, Zhiguo Jiang 1,2, Haopeng Zhang 1,2,*, Danpei Zhao 1,2 and Yuan Yao 1,2
1 Image Processing Center, School of Astronautics, Beihang University, Beijing 100191, China
2 Beijing Key Laboratory of Digital Media, Beihang University, Beijing 100191, China
Remote Sens. 2017, 9(11), 1198; https://doi.org/10.3390/rs9111198 - 21 Nov 2017
Cited by 38 | Viewed by 7188
Abstract
Deep convolutional neural network (CNN) achieves outstanding performance in the field of target detection. As one of the most typical targets in remote sensing images (RSIs), airport has attracted increasing attention in recent years. However, the essential challenge for using deep CNN to [...] Read more.
Deep convolutional neural network (CNN) achieves outstanding performance in the field of target detection. As one of the most typical targets in remote sensing images (RSIs), airport has attracted increasing attention in recent years. However, the essential challenge for using deep CNN to detect airport is the great imbalance between the number of airports and background examples in large-scale RSIs, which may lead to over-fitting. In this paper, we develop a hard example mining and weight-balanced strategy to construct a novel end-to-end convolutional neural network for airport detection. The initial motivation of the proposed method is that backgrounds contain an overwhelming number of easy examples and a few hard examples. Therefore, we design a hard example mining layer to automatically select hard examples by their losses, and implement a new weight-balanced loss function to optimize CNN. Meanwhile, the cascade design of proposal extraction and object detection in our network releases the constraint on input image size and reduces spurious false positives. Compared with geometric characteristics and low-level manually designed features, the hard example mining based network could extract high-level features, which is more robust for airport detection in complex environment. The proposed method is validated on a multi-scale dataset with complex background collected from Google Earth. The experimental results demonstrate that our proposed method is robust, and superior to the state-of-the-art airport detection models. Full article
(This article belongs to the Section Remote Sensing Image Processing)
Show Figures

Graphical abstract

23 pages, 11205 KiB  
Article
Effect of Heat Wave Conditions on Aerosol Optical Properties Derived from Satellite and Ground-Based Remote Sensing over Poland
by Iwona S. Stachlewska 1,*, Olga Zawadzka 1 and Ronny Engelmann 2
1 Faculty of Physics, Institute of Geophysics, University of Warsaw, 02-093 Warsaw, Poland
2 Leibniz Institute for Tropospheric Research, 04318 Leipzig, Germany
Remote Sens. 2017, 9(11), 1199; https://doi.org/10.3390/rs9111199 - 22 Nov 2017
Cited by 28 | Viewed by 7923
Abstract
During an exceptionally warm September in 2016, unique and stable weather conditions contributed to a heat wave over Poland, allowing for observations of aerosol optical properties, using a variety of ground-based and satellite remote sensors. The data set collected during 11–16 September 2016 [...] Read more.
During an exceptionally warm September in 2016, unique and stable weather conditions contributed to a heat wave over Poland, allowing for observations of aerosol optical properties, using a variety of ground-based and satellite remote sensors. The data set collected during 11–16 September 2016 was analysed in terms of aerosol transport (HYbrid Single-Particle Lagrangian Integrated Trajectory model (HYSPLIT)), aerosol load model simulations (Copernicus Atmosphere Monitoring Service (CAMS), Navy Aerosol Analysis and Prediction System (NAAPS), Global Environmental Multiscale-Air Quality (GEM-AQ), columnar aerosol load measured at ground level (Aerosol Robotic NETwork (AERONET), Polish Aerosol Research Network (PolandAOD)) and from satellites (Spinning Enhanced Visible and Infrared Imager (SEVIRI), Moderate Resolution Imaging Spectroradiometer (MODIS)), as well as with 24/7 PollyXT Raman Lidar observations at the European Aerosol Research Lidar Network (EARLINET) site in Warsaw. Analyses revealed a single day of a relatively clean background aerosol related to an Arctic air-mass inflow, surrounded by a few days with a well increased aerosol load of differing origin: pollution transported from Germany and biomass burning from Ukraine. Such conditions proved excellent to test developed-in-house algorithms designed for near real-time aerosol optical depth (AOD) derivation from the SEVIRI sensor. The SEVIRI AOD maps derived over the territory of Poland, with an exceptionally high resolution (every 15 min; 5.5 × 5.5 km2), revealed on an hourly scale, very low aerosol variability due to heat wave conditions. Comparisons of SEVIRI with NAAPS and CAMS AOD maps show strong qualitative similarities; however, NAAPS underestimates AOD and CAMS tends to underestimate it on relatively clean days (<0.2), and overestimate it for a high aerosol load (>0.4). A slight underestimation of the SEVIRI AOD is reported for pixel-to-column comparisons with AODs of several radiometers (AERONET, PolandAOD) and Lidar (EARLINET) with high correlation coefficients (r2 of 0.8–0.91) and low root-mean-square error (RMSE of 0.03–0.05). A heat wave driven increase of the boundary layer height of 10% is accompanied with the AOD increase of 8–12% for an urban site dominated by anthropogenic pollution. Contrary trend, with an AOD decrease of around 4% for a rural site dominated by a long-range transported biomass burning aerosol is reported. There is a positive feedback of heat wave conditions on local and transported pollution and an extenuating effect on transported biomass burning aerosol. The daytime mean SEVIRI PM2.5 converted from the SEVIRI AODs at a pixel representative for Warsaw is in agreement with the daily mean PM2.5 surface measurements, whereby SEVIRI PM2.5 and Lidar-derived Ångström exponent are anti-correlated. Full article
(This article belongs to the Special Issue Aerosol Remote Sensing)
Show Figures

Graphical abstract

21 pages, 2394 KiB  
Article
A Phenological Approach to Spectral Differentiation of Low-Arctic Tundra Vegetation Communities, North Slope, Alaska
by Alison Leslie Beamish 1,*, Nicholas Coops 2, Sabine Chabrillat 3 and Birgit Heim 1
1 Alfred Wegener Institute, Helmholtz Centre for Polar and Marine Research, Research Unit Potsdam, Telegrafenberg, A45, 14473 Potsdam, Germany
2 Integrated Remote Sensing Studio (IRSS) Faculty of Forestry, University of British Columbia, 2424 Main Mall, Vancouver, BC V6T 1Z4, Canada
3 Helmholtz Centre Potsdam GFZ German Research Centre for Geosciences, Telegrafenberg, 14473 Potsdam, Germany
Remote Sens. 2017, 9(11), 1200; https://doi.org/10.3390/rs9111200 - 22 Nov 2017
Cited by 21 | Viewed by 6637
Abstract
Arctic tundra ecosystems exhibit small-scale variations in species composition, micro-topography as well as significant spatial and temporal variations in moisture. These attributes result in similar spectral characteristics between distinct vegetation communities. In this study we examine spectral variability at three phenological phases of [...] Read more.
Arctic tundra ecosystems exhibit small-scale variations in species composition, micro-topography as well as significant spatial and temporal variations in moisture. These attributes result in similar spectral characteristics between distinct vegetation communities. In this study we examine spectral variability at three phenological phases of leaf-out, maximum canopy, and senescence of ground-based spectroscopy, as well as a simulated Environmental Mapping and Analysis Program (EnMAP) and simulated Sentinel-2 reflectance spectra, from five dominant low-Arctic tundra vegetation communities in the Toolik Lake Research Area, Alaska, in order to inform spectral differentiation and subsequent vegetation classification at both the ground and satellite scale. We used the InStability Index (ISI), a ratio of between endmember and within endmember variability, to determine the most discriminative phenophase and wavelength regions for identification of each vegetation community. Our results show that the senescent phase was the most discriminative phenophase for the identification of the majority of communities when using both ground-based and simulated EnMAP reflectance spectra. Maximum canopy was the most discriminative phenophase for the majority of simulated Sentinel-2 reflectance data. As with previous ground-based spectral characterization of Alaskan low-Arctic tundra, the blue, red, and red-edge parts of the spectrum were most discriminative for all three reflectance datasets. Differences in vegetation colour driven by pigment dynamics appear to be the optimal areas of the spectrum for differentiation using high spectral resolution field spectroscopy and simulated hyperspectral EnMAP and multispectral Sentinel-2 reflectance spectra. The phenological aspect of this study highlights the potential exploitation of more extreme colour differences in vegetation observed during senescence when hyperspectral data is available. The results provide insight into both the community and seasonal dynamics of spectral variability to better understand and interpret currently used broadband vegetation indices and also for improved spectral unmixing of hyperspectral aerial and satellite data which is useful for a wide range of applications from fine-scale monitoring of shifting vegetation composition to the identification of vegetation vigor. Full article
(This article belongs to the Special Issue Remote Sensing of Arctic Tundra)
Show Figures

Figure 1

23 pages, 9552 KiB  
Article
Satellite and Ground Observations of Snow Cover in Tibet during 2001–2015
by Droma Basang 1,2,3,*, Knut Barthel 1 and Jan Asle Olseth 1
1 Geophysical Institute, University of Bergen, Allégaten 70, N-5007 Bergen, Norway
2 Institute of Tibetan Plateau Atmospheric and Environmental Scientific Research, Lhasa 850000, China
3 Lhasa Division of the Institute of Plateau Meteorology, China Meteorological Administration, Chengdu 610072, China
Remote Sens. 2017, 9(11), 1201; https://doi.org/10.3390/rs9111201 - 22 Nov 2017
Cited by 32 | Viewed by 7331
Abstract
The seasonal snow cover of the Tibetan Plateau exerts a profound environmental influence both regionally and globally. Daily observations of snow depth at 37 meteorological stations in Tibet and MODIS eight-day snow products (MOD10A2) during the period 2001–2015 are analyzed with respect to [...] Read more.
The seasonal snow cover of the Tibetan Plateau exerts a profound environmental influence both regionally and globally. Daily observations of snow depth at 37 meteorological stations in Tibet and MODIS eight-day snow products (MOD10A2) during the period 2001–2015 are analyzed with respect to the frequency and spatial distribution of snow cover for each season and for various altitude ranges. The results show that the average snow cover percentage was 16%. Snow cover frequency was less than 21% for 70% of the Tibetan area, while it was more than 40% in eastern Tibet and in the Himalayas. We also estimated the variations in the starting times of snow accumulation and ablation. During the 15 years, both datasets revealed a significant trend of earlier onset of ablation, but no evident trend for the start of accumulation. The two datasets differed slightly with respect to the seasonal variation of snow cover. MODIS data showed more snow in winter than in other seasons, but the ground data showed most snow in early spring. For the station locations, the correlation between ground and MODIS snow cover percentage (number of snow-covered stations/number of cloud-free stations) is 0.77. Combining the advantages of remote sensing data and ground observation data is the best way to investigate snow in Tibet. Full article
(This article belongs to the Special Issue Cryospheric Remote Sensing II)
Show Figures

Graphical abstract

16 pages, 4914 KiB  
Article
Estimating Leaf Area Density of Individual Trees Using the Point Cloud Segmentation of Terrestrial LiDAR Data and a Voxel-Based Model
by Shihua Li 1,2,*, Leiyu Dai 1, Hongshu Wang 3, Yong Wang 4, Ze He 1 and Sen Lin 1
1 School of Resources and Environment, University of Electronic Science and Technology of China, No. 2006, Xiyuan Ave, West Hi-Tech Zone, Chengdu 611731, China
2 Center for Information Geoscience, University of Electronic Science and Technology of China, No. 2006, Xiyuan Ave, West Hi-Tech Zone, Chengdu 611731, China
3 Department of Surveying and Mapping Engineering, Sichuan Water Conservancy Vocational College, Chongzhou 611231, China
4 Department of Geography, Planning, and Environment, East Carolina University, Greenville, NC 27858, USA
Remote Sens. 2017, 9(11), 1202; https://doi.org/10.3390/rs9111202 - 22 Nov 2017
Cited by 105 | Viewed by 13406
Abstract
The leaf area density (LAD) within a tree canopy is very important for the understanding and modeling of photosynthetic studies of the tree. Terrestrial light detection and ranging (LiDAR) has been applied to obtain the three-dimensional structural properties of vegetation and estimate the [...] Read more.
The leaf area density (LAD) within a tree canopy is very important for the understanding and modeling of photosynthetic studies of the tree. Terrestrial light detection and ranging (LiDAR) has been applied to obtain the three-dimensional structural properties of vegetation and estimate the LAD. However, there is concern about the efficiency of available approaches. Thus, the objective of this study was to develop an effective means for the LAD estimation of the canopy of individual magnolia trees using high-resolution terrestrial LiDAR data. The normal difference method based on the differences in the structures of the leaf and non-leaf components of trees was proposed and used to segment leaf point clouds. The vertical LAD profiles were estimated using the voxel-based canopy profiling (VCP) model. The influence of voxel size on the LAD estimation was analyzed. The leaf point cloud’s extraction accuracy for two magnolia trees was 86.53% and 84.63%, respectively. Compared with the ground measured leaf area index (LAI), the retrieved accuracy was 99.9% and 90.7%, respectively. The LAD (as well as LAI) was highly sensitive to the voxel size. The spatial resolution of point clouds should be the appropriate estimator for the voxel size in the VCP model. Full article
Show Figures

Graphical abstract

21 pages, 19358 KiB  
Article
Mechanisms of SAR Imaging of Shallow Water Topography of the Subei Bank
by Shuangshang Zhang 1, Qing Xu 1,*, Quanan Zheng 2 and Xiaofeng Li 3
1 College of Oceanography, Hohai University, Nanjing 210098, China
2 Department of Atmospheric and Oceanic Science, University of Maryland, College Park, MD 20742, USA
3 GST, NESDIS/NOAA, College Park, MD 20740, USA
Remote Sens. 2017, 9(11), 1203; https://doi.org/10.3390/rs9111203 - 22 Nov 2017
Cited by 14 | Viewed by 8652
Abstract
In this study, the C-band radar backscatter features of the shallow water topography of Subei Bank in the Southern Yellow Sea are statistically investigated using 25 ENVISAT (Environmental Satellite) ASAR (advanced synthetic aperture radar) and ERS-2 (European Remote-Sensing Satellite-2) SAR images acquired between [...] Read more.
In this study, the C-band radar backscatter features of the shallow water topography of Subei Bank in the Southern Yellow Sea are statistically investigated using 25 ENVISAT (Environmental Satellite) ASAR (advanced synthetic aperture radar) and ERS-2 (European Remote-Sensing Satellite-2) SAR images acquired between 2006 and 2010. Different bathymetric features are found on SAR imagery under different sea states. Under low to moderate wind speeds (3.1~6.3 m/s), the wide bright patterns with an average width of 6 km are shown and correspond to sea surface imprints of tidal channels formed by two adjacent sand ridges, while the sand ridges appear as narrower (only 1 km wide), fingerlike, quasi-linear features on SAR imagery in high winds (5.4~13.9 m/s). Two possible SAR imaging mechanisms of coastal bathymetry are proposed in the case where the flow is parallel to the major axes of tidal channels or sand ridges. When the surface Ekman current is opposite to the mean tidal flow, two vortexes will converge at the central line of the tidal channel in the upper layer and form a convergent zone over the sea surface. Thus, the tidal channels are shown as wide and bright stripes on SAR imagery. For the SAR imaging of sand ridges, all the SAR images were acquired at low tidal levels. In this case, the ocean surface waves are possibly broken up under strong winds when propagating from deep water to the shallower water, which leads to an increase of surface roughness over the sand ridges. Full article
(This article belongs to the Special Issue Ocean Remote Sensing with Synthetic Aperture Radar)
Show Figures

Graphical abstract

15 pages, 12792 KiB  
Article
Reconstruction of Daily Sea Surface Temperature Based on Radial Basis Function Networks
by Zhihong Liao 1,2,3, Qing Dong 1,*, Cunjin Xue 1, Jingwu Bi 1,2 and Guangtong Wan 1
1 Institute of Remote Sensing and Digital Earth, Chinese Academy of Sciences, Beijing 100094, China
2 University of Chinese Academy of Sciences, Beijing 100049, China
3 National Meteorological Information Center, China Meteorological Administration, Beijing 100081, China
Remote Sens. 2017, 9(11), 1204; https://doi.org/10.3390/rs9111204 - 22 Nov 2017
Cited by 6 | Viewed by 5273
Abstract
A radial basis function network (RBFN) method is proposed to reconstruct daily Sea surface temperatures (SSTs) with limited SST samples. For the purpose of evaluating the SSTs using this method, non-biased SST samples in the Pacific Ocean (10°N–30°N, 115°E–135°E) are selected when the [...] Read more.
A radial basis function network (RBFN) method is proposed to reconstruct daily Sea surface temperatures (SSTs) with limited SST samples. For the purpose of evaluating the SSTs using this method, non-biased SST samples in the Pacific Ocean (10°N–30°N, 115°E–135°E) are selected when the tropical storm Hagibis arrived in June 2014, and these SST samples are obtained from the Reynolds optimum interpolation (OI) v2 daily 0.25° SST (OISST) products according to the distribution of AVHRR L2p SST and in-situ SST data. Furthermore, an improved nearest neighbor cluster (INNC) algorithm is designed to search for the optimal hidden knots for RBFNs from both the SST samples and the background fields. Then, the reconstructed SSTs from the RBFN method are compared with the results from the OI method. The statistical results show that the RBFN method has a better performance of reconstructing SST than the OI method in the study, and that the average RMSE is 0.48 °C for the RBFN method, which is quite smaller than the value of 0.69 °C for the OI method. Additionally, the RBFN methods with different basis functions and clustering algorithms are tested, and we discover that the INNC algorithm with multi-quadric function is quite suitable for the RBFN method to reconstruct SSTs when the SST samples are sparsely distributed. Full article
(This article belongs to the Special Issue Sea Surface Temperature Retrievals from Remote Sensing)
Show Figures

Graphical abstract

Previous Issue
Next Issue
Back to TopTop