Parameterizing Anthropogenic Heat Flux with an Energy-Consumption Inventory and Multi-Source Remote Sensing Data


Abstract

1. Introduction
2. Methodology and Procedure
2.1. Estimation of County-Scale Annual Mean AHF with a Top-Down Energy-Consumption Inventory
2.2. RAHF Parameterization of the Beijing–Tianjin–Hebei Region
2.2.1. County-Scale AHF Estimation Model from Multi-Source Remote Sensing Data
2.2.2. RAHF Parameterized Model
2.3. Procedure of the RAHF Parameterization Scheme
3. Study Area and Data
4. Results
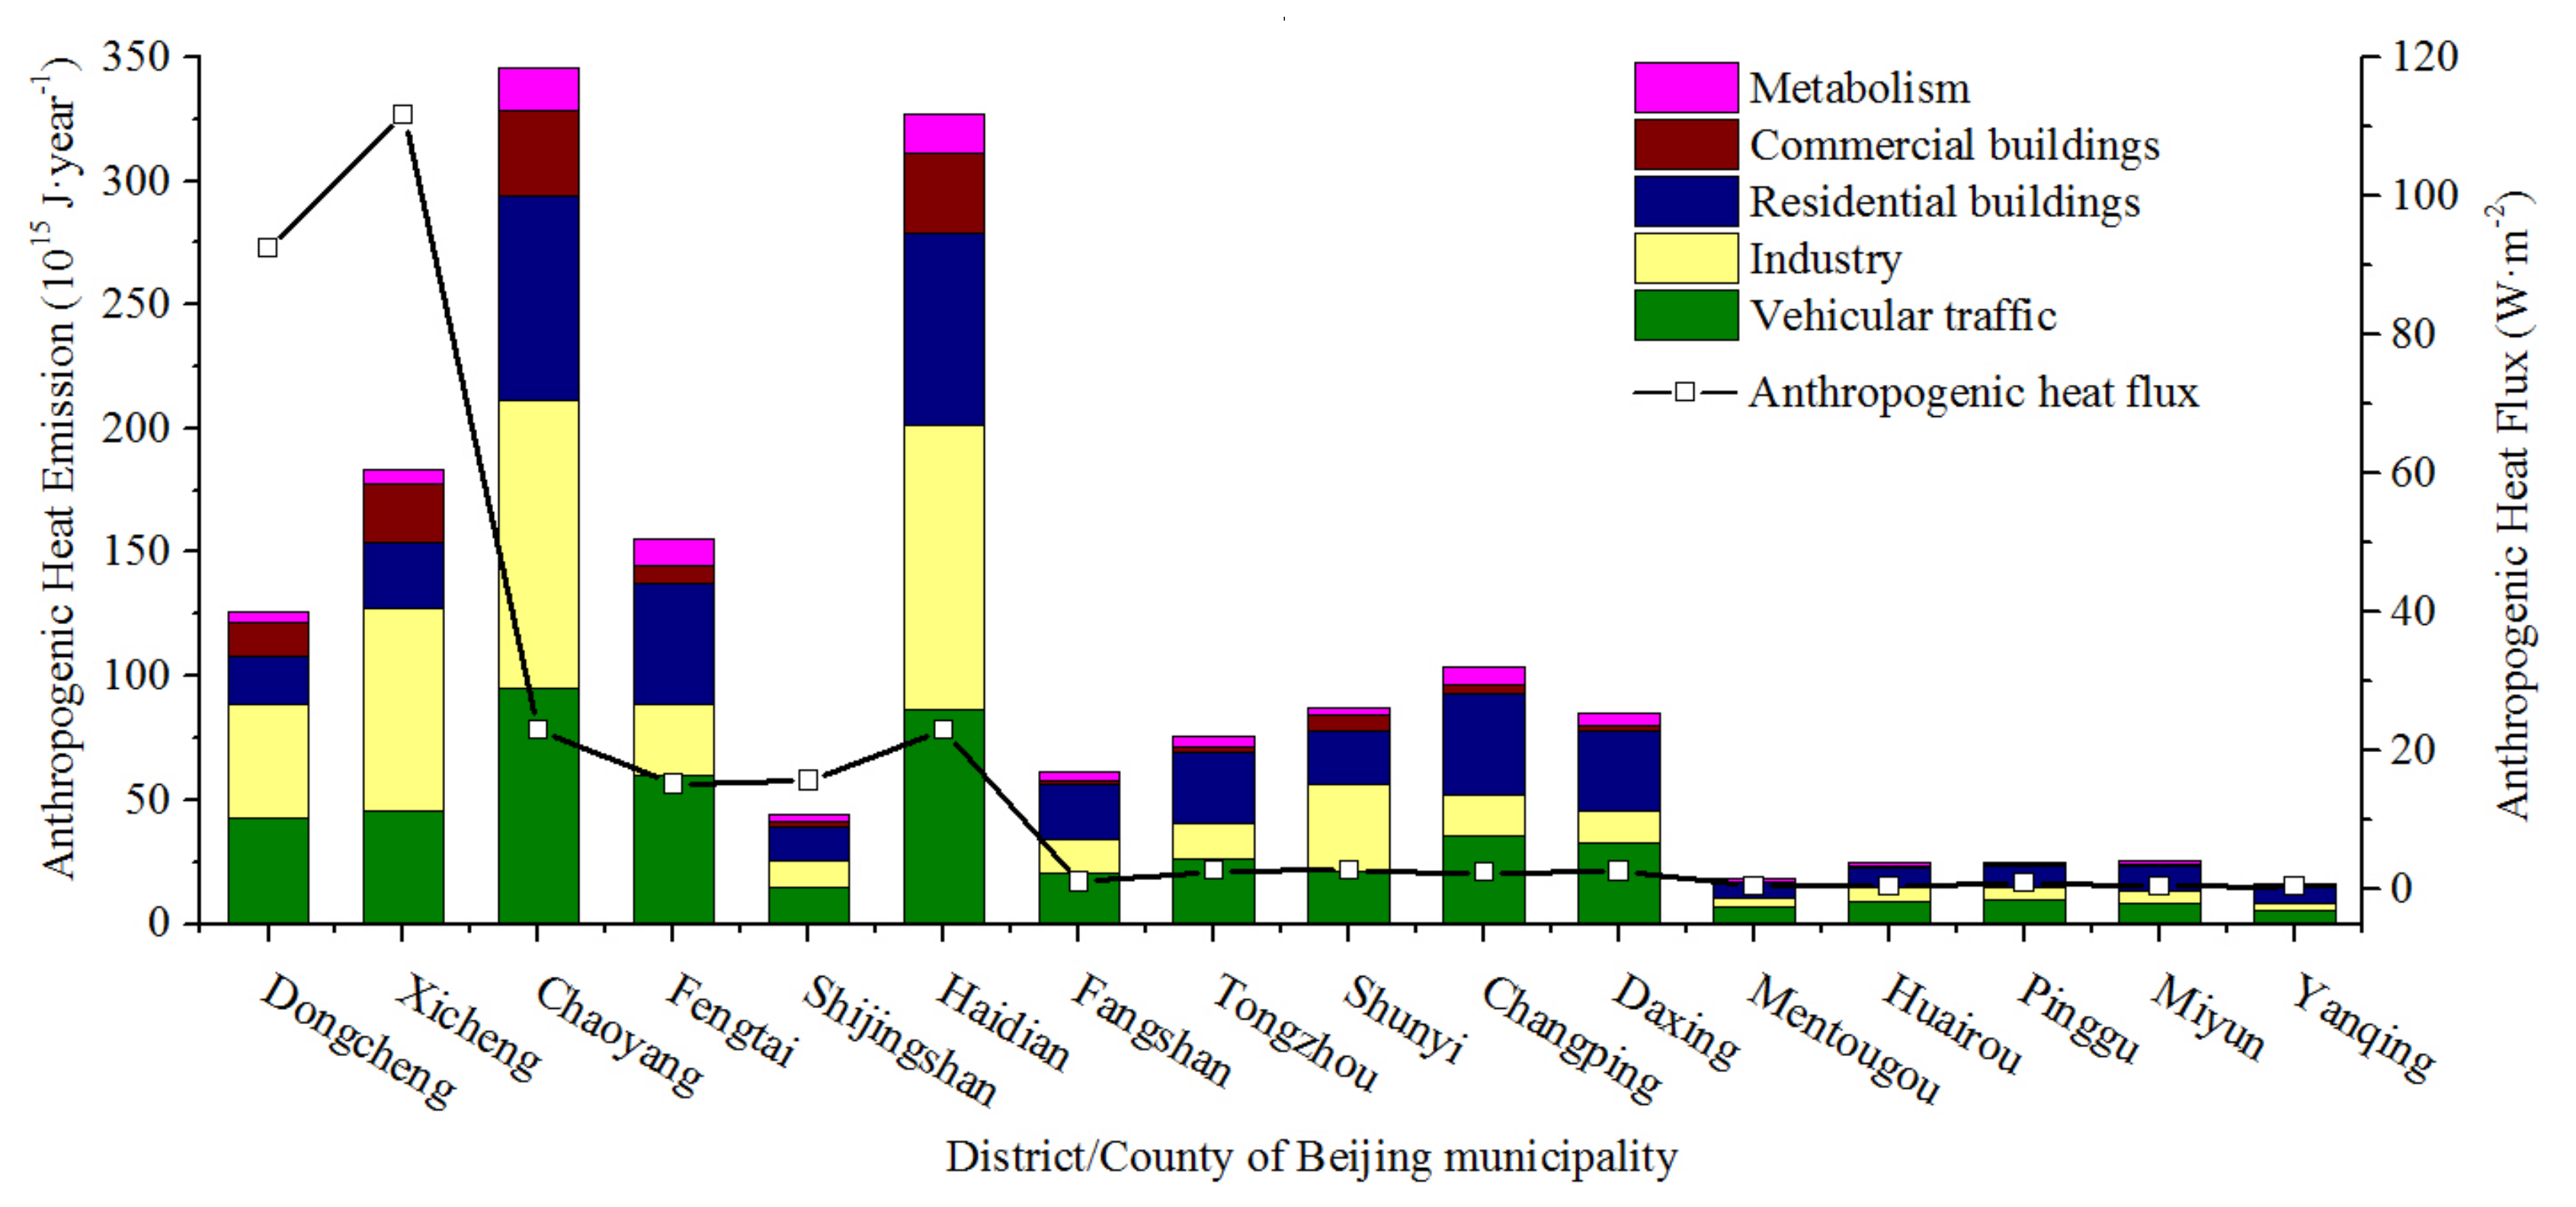
4.1. Annual Total AH and Annual Mean AHF Results of Beijing Municipality
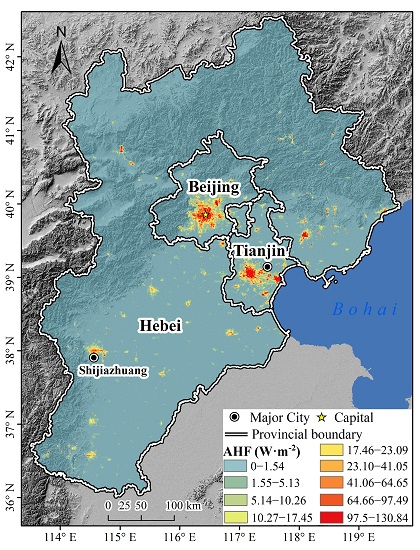
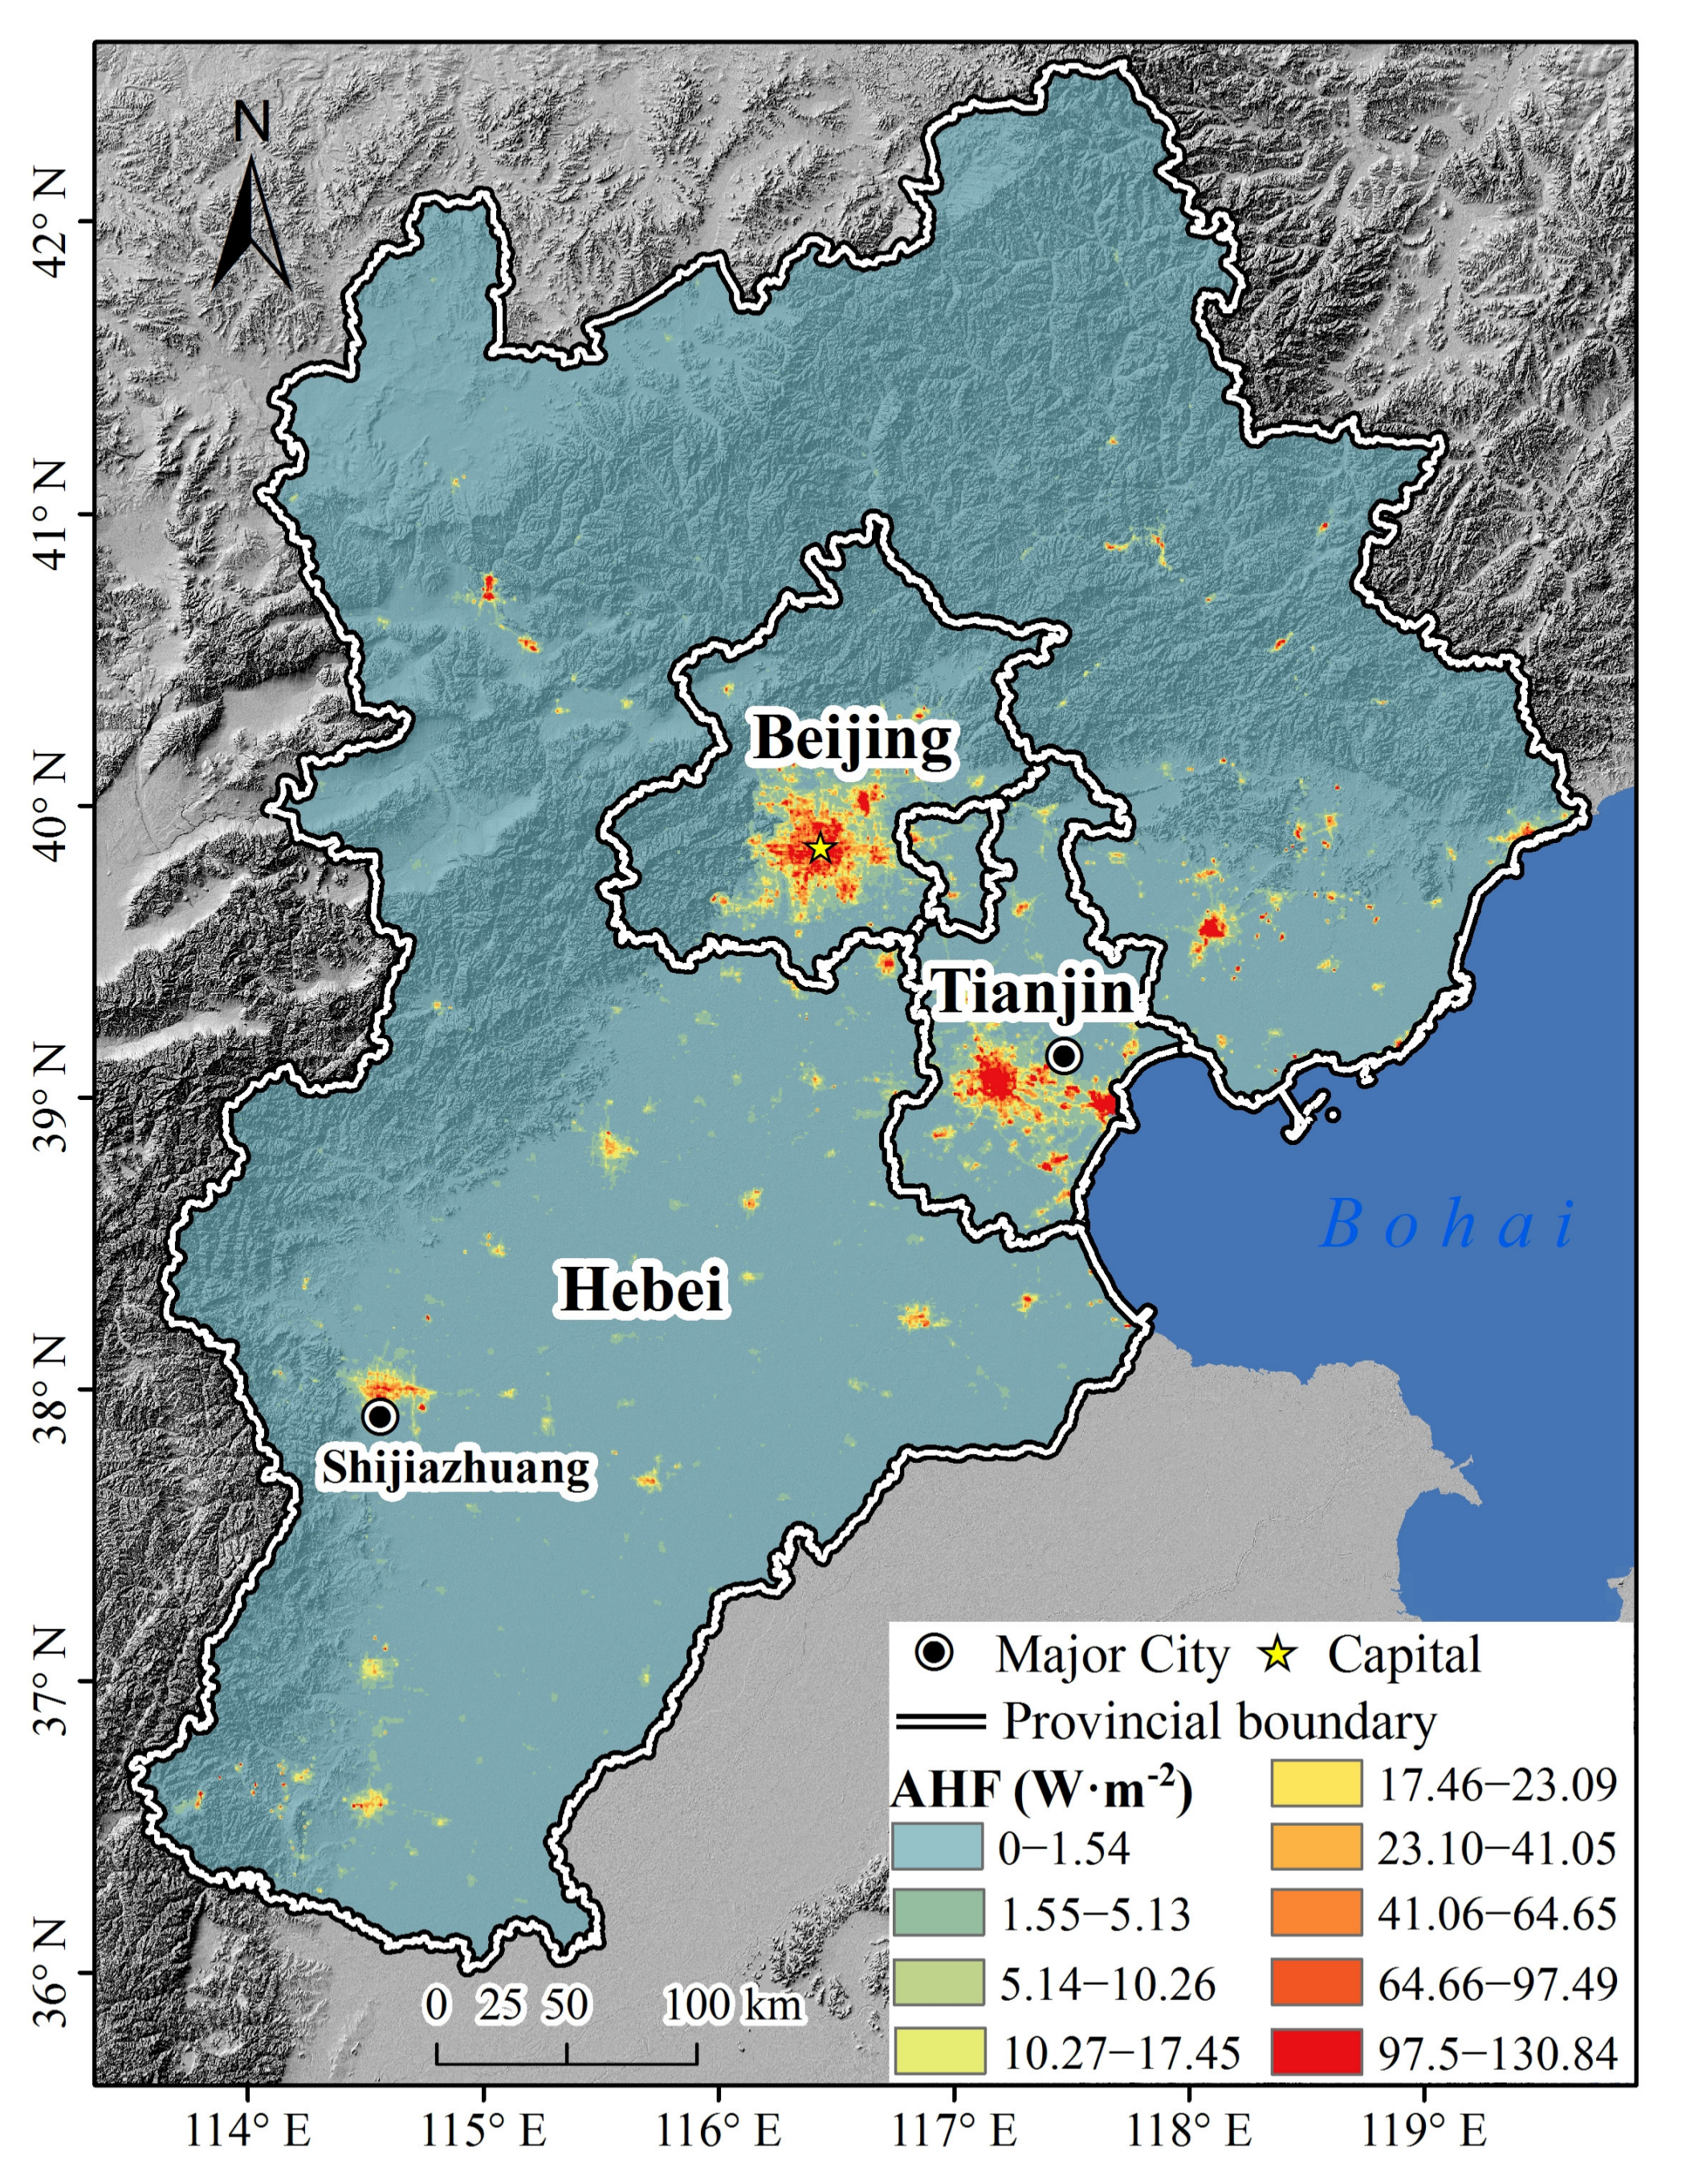
4.2. County-Scale Annual Mean AHF Estimation of the Beijing–Tianjin–Hebei Region
4.3. RAHF Results and Validation of the Beijing–Tianjin–Hebei Region
5. Discussion
5.1. Comparison of Three County-Scale AHF Estimation Models
5.2. Accuracy Comparison between RAHF Results and Other AHF Products
5.3. Novelty and Opportunities of Suomi-NPP VIIRS Nighttime Light Data in RAHF Parameterization
6. Conclusions
- For the county-scale AHF estimation model, the mean residual between the AHF estimation result and AHF computed based on the top-down energy-consumption inventory of all municipalities is less than 1%, indicating that the model can be used to estimate the county-scale AHF in the Beijing–Tianjin–Hebei region.
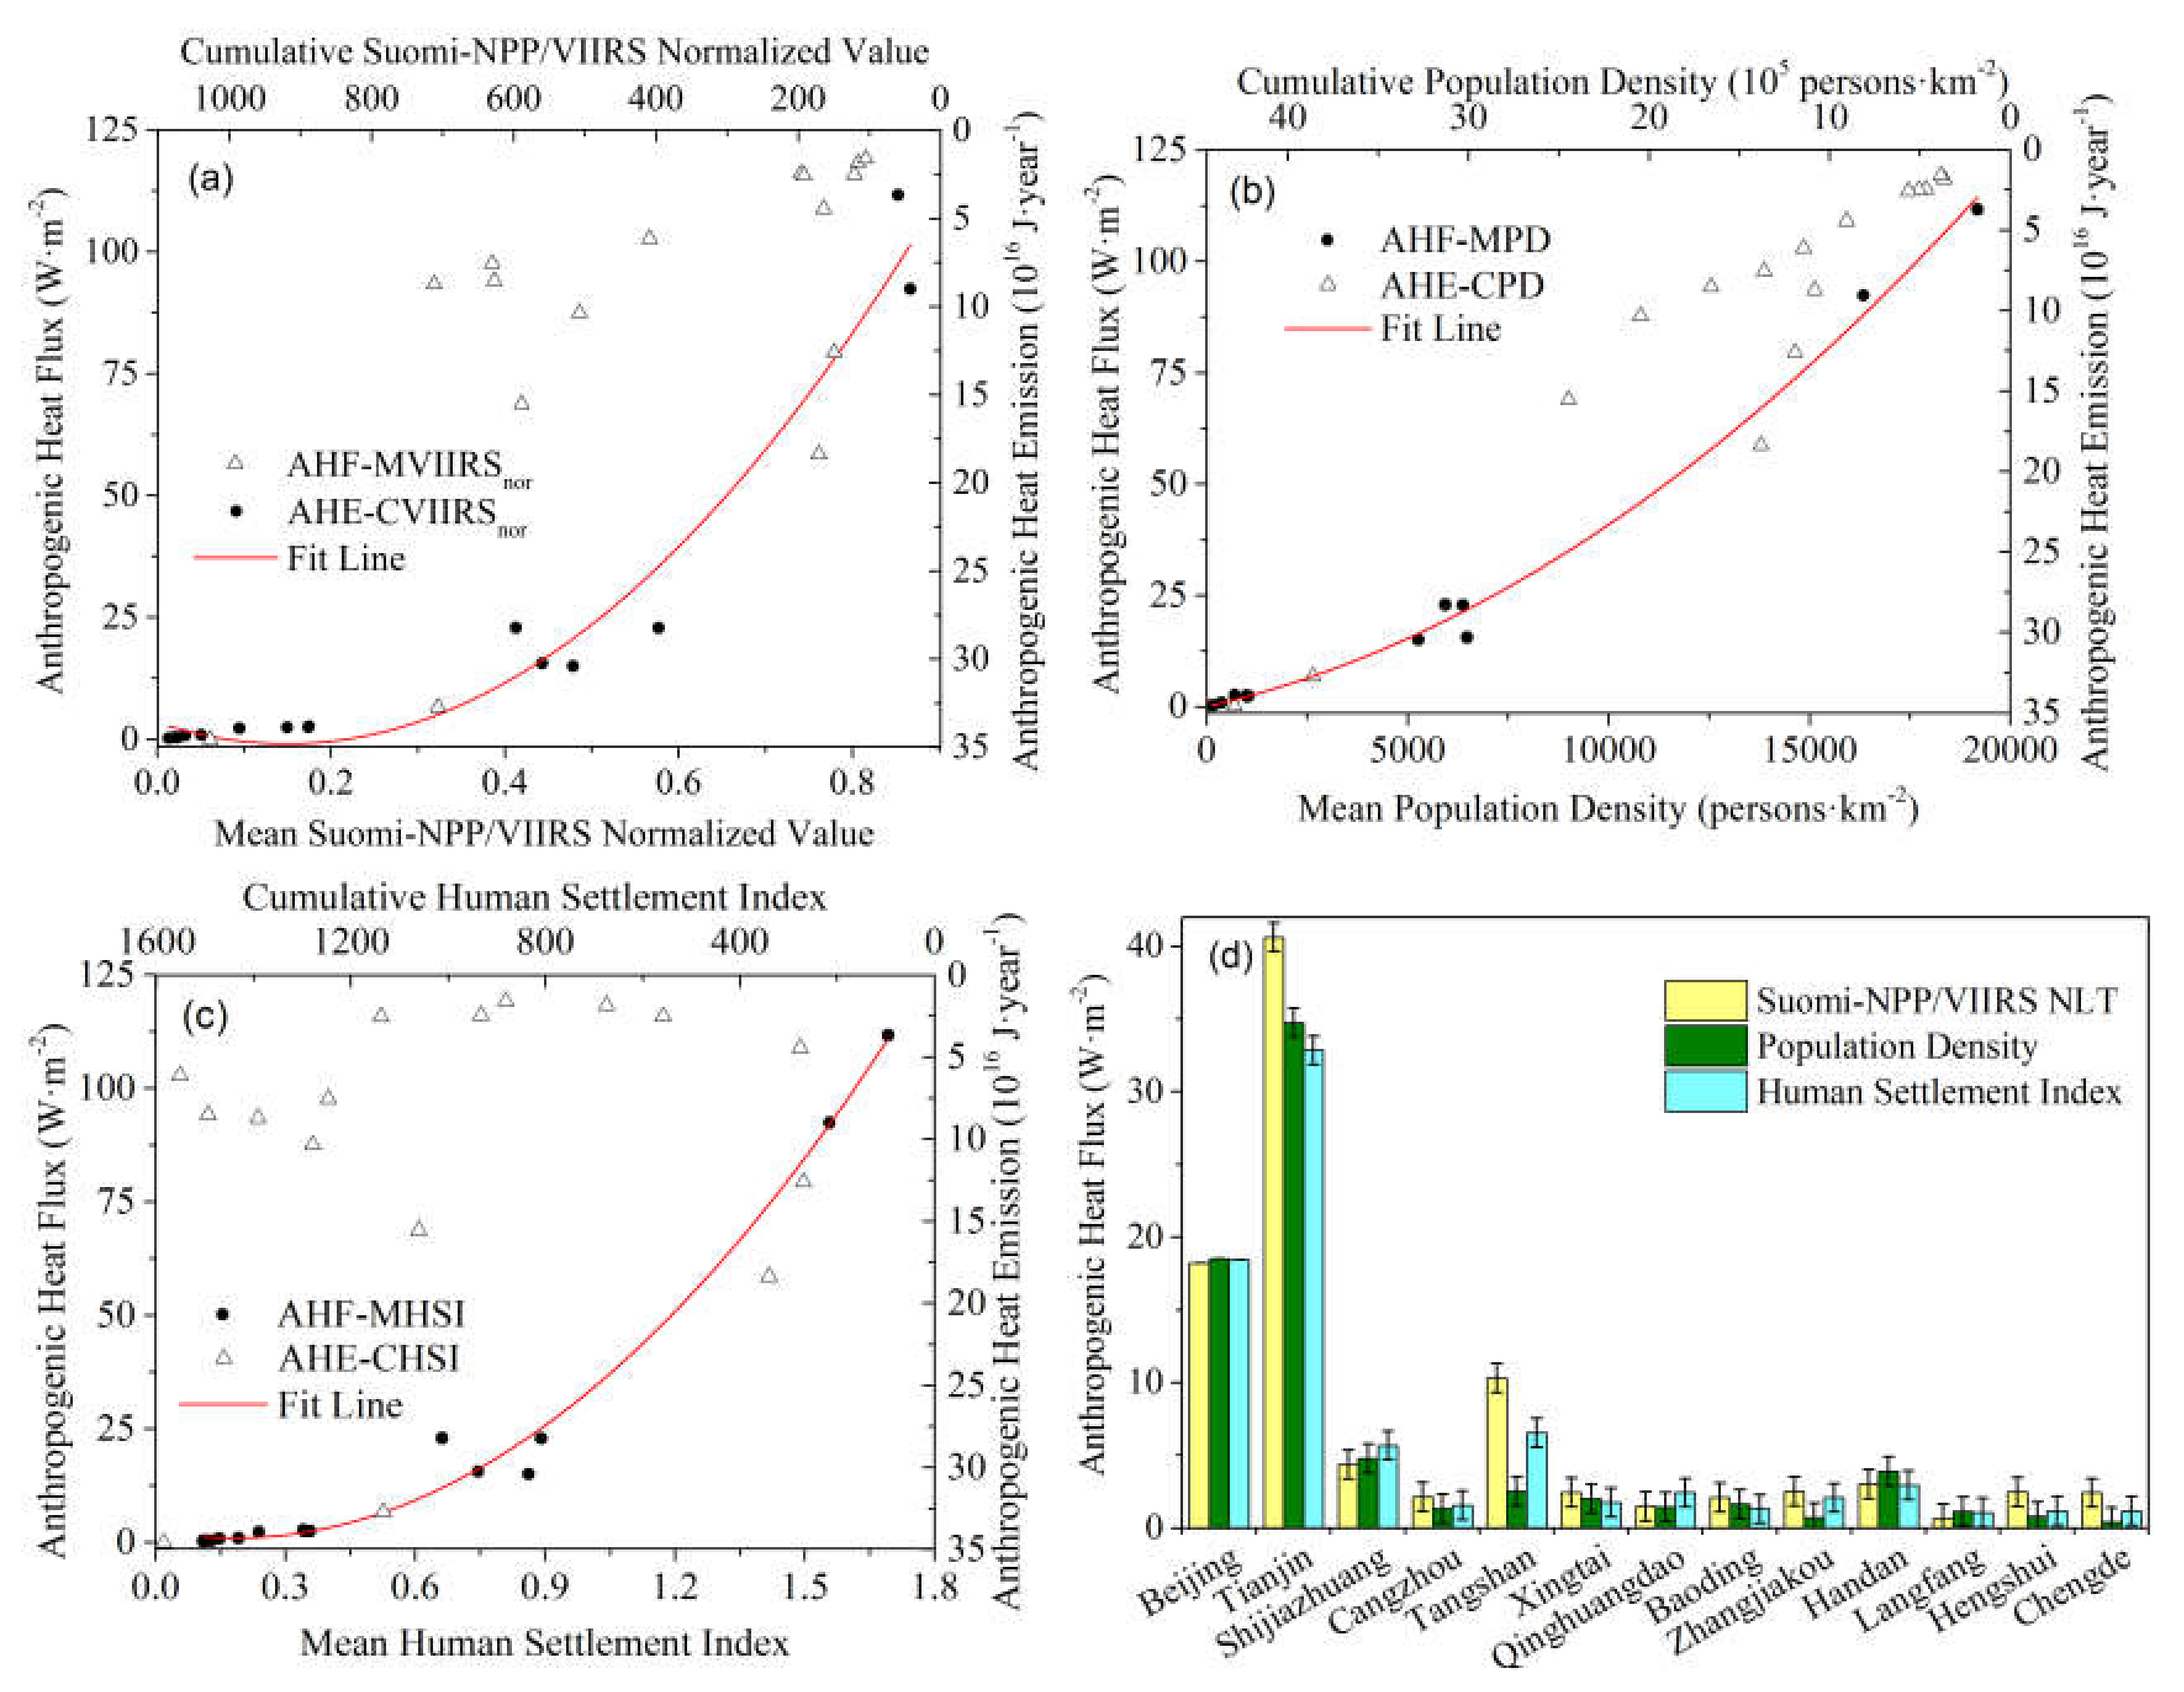
- According to the statistical regression analysis, Suomi-NPP VIIRS NTL data, grid-scale PD, and HSI can all be used to estimate county-scale AHF to some extent. For the estimation of county-scale AHF in the Beijing–Tianjin–Hebei region, the residuals were 0.9%, 0.7% and 0.6%, respectively. HSI can achieve slightly better performance than Suomi-NPP VIIRS NTL data and grid-scale PD.
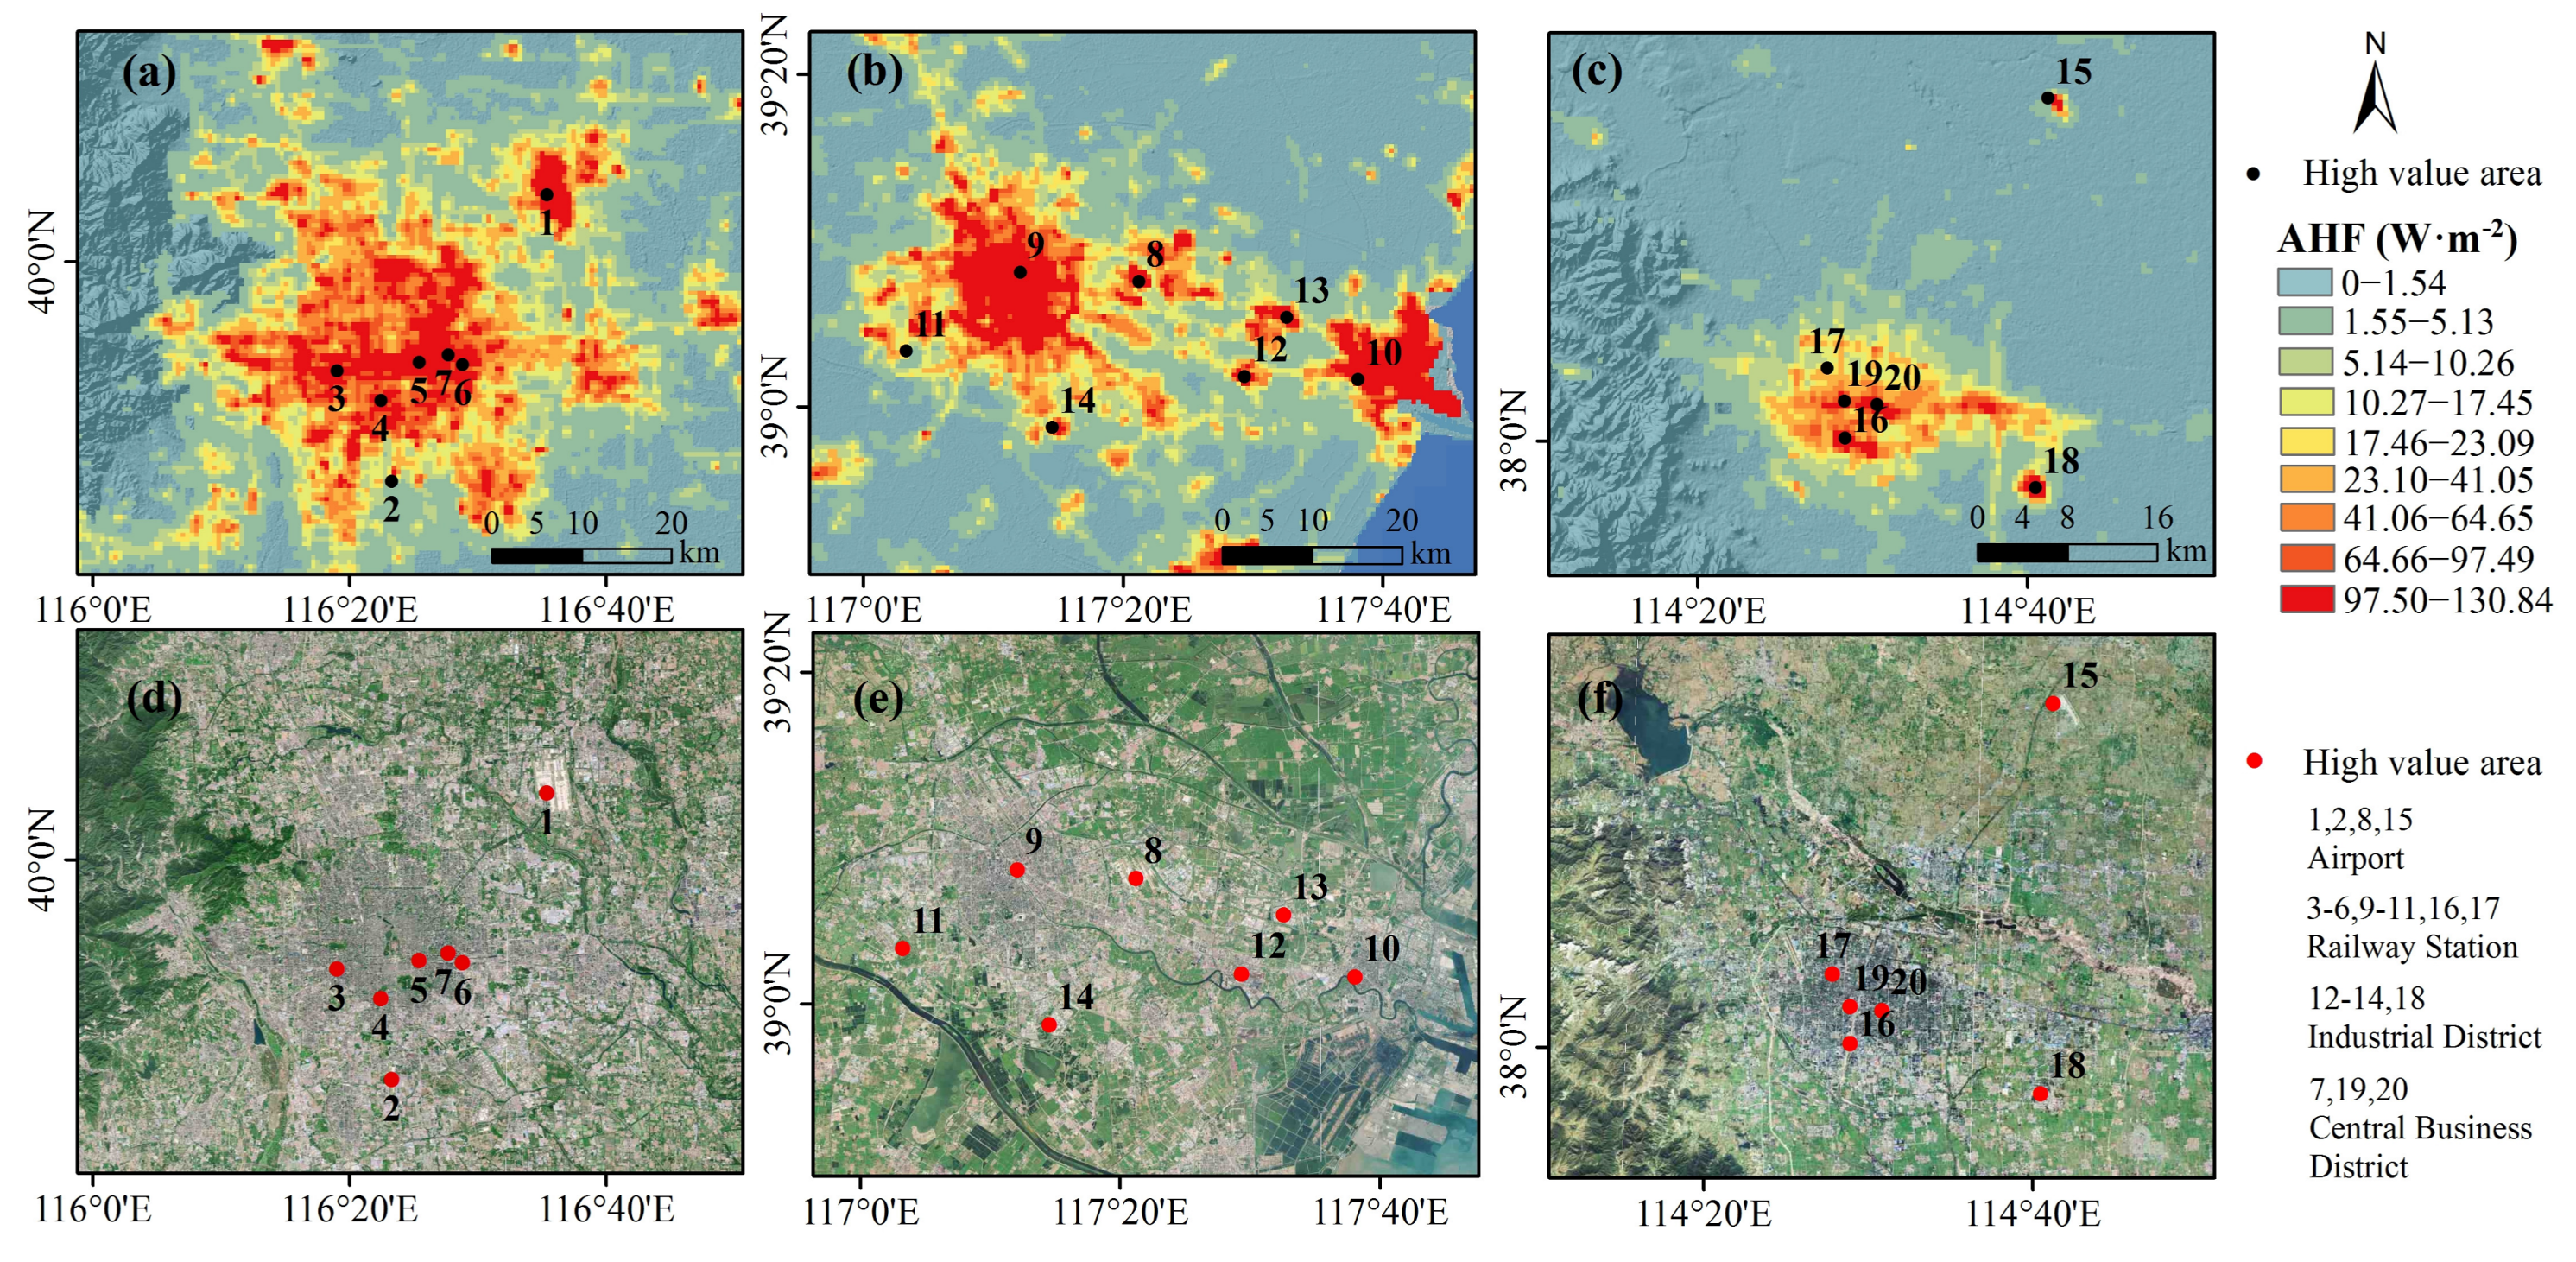
- The spatial proxy data used to get grid-scale AHF within the districts and counties was established from multi-source remote sensing images. The 500-m resolution grid-scale RAHF was ultimately generated. According to a comparison of RAHF results and other AHF products, the RAHF parameterization scheme can get more refined AHF, and it has obvious advantages in the representation of spatial detail. Furthermore, the RAHF results of different underlying surfaces are also more reasonable.
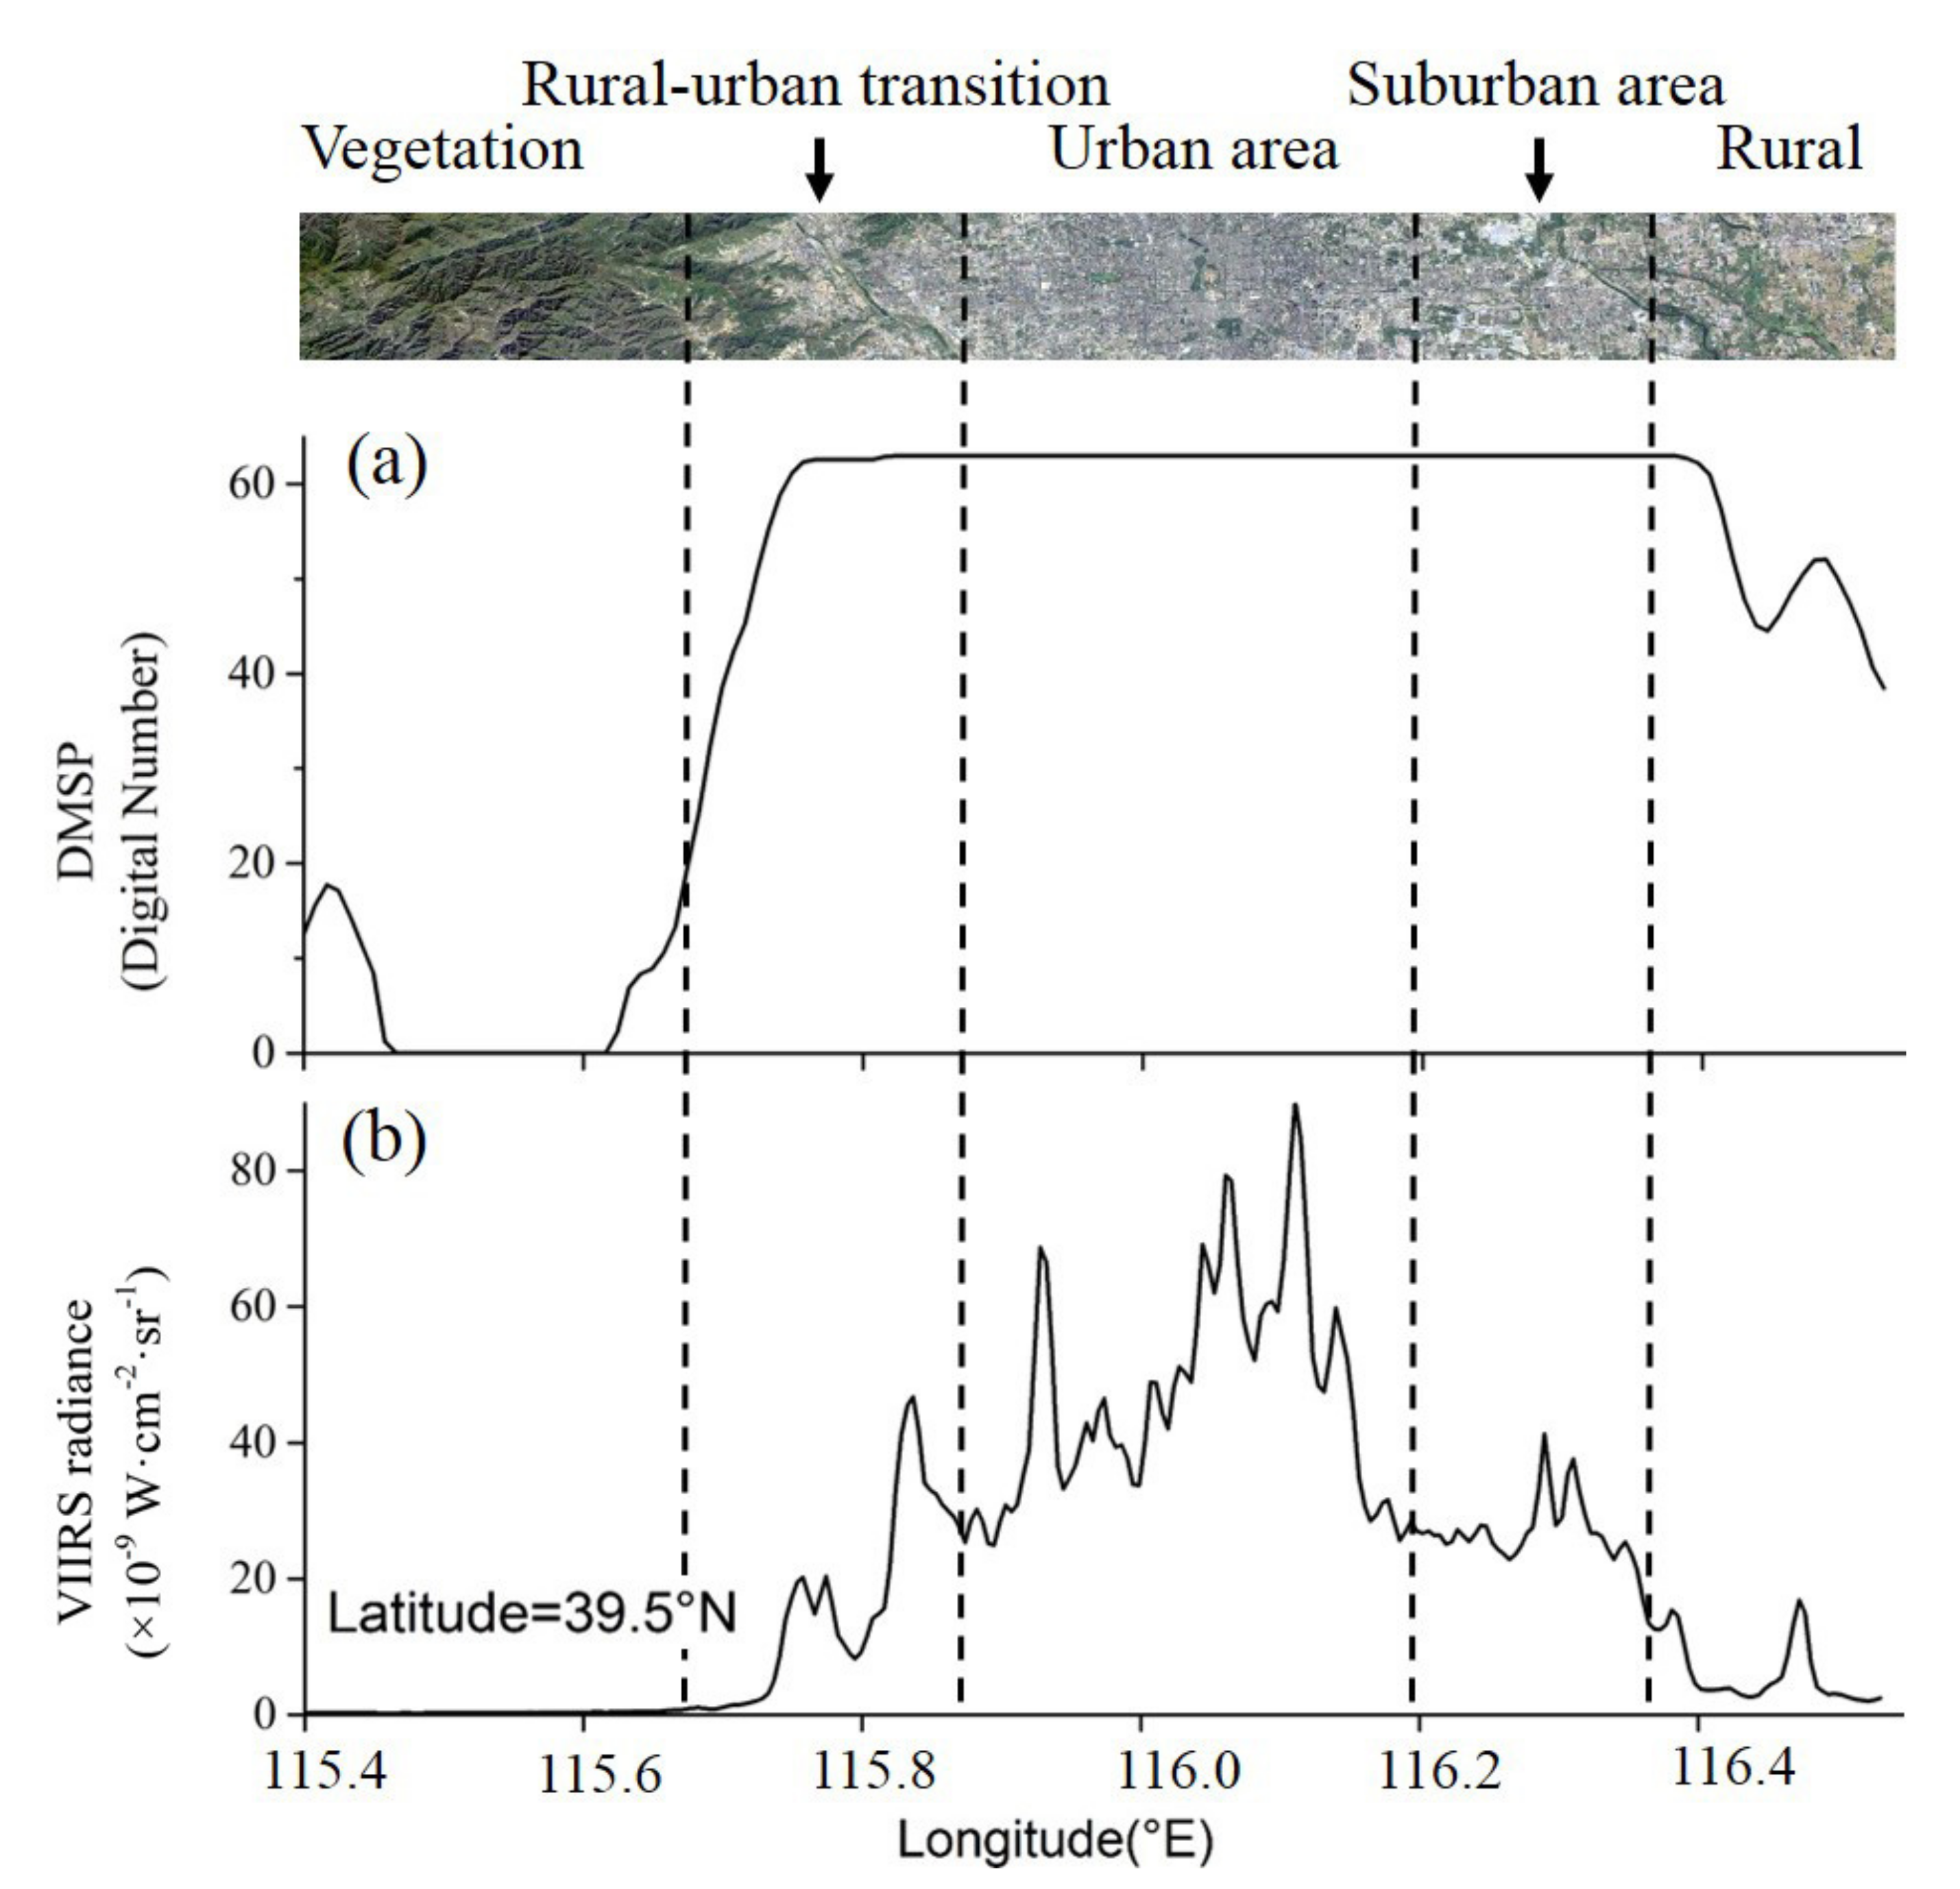
- After population density, GDP, land use data and DMSP/OLS NTL data, the validity of the Suomi-NPP VIIRS NTL data used in RAHF parameterization has been confirmed. It can produce more accurate and higher spatial resolution AHF results than DMSP/OLS NTL data. The results of this study indicate that Suomi-NPP VIIRS NTL data has a good application prospect for AHF estimation.
Acknowledgments
Author Contributions
Conflicts of Interest
Appendix A
References
- Fan, H.; Sailor, D.J. Modeling the impacts of anthropogenic heating on the urban climate of Philadelphia: A comparison of implementations in two PBL schemes. Atmos. Environ. 2005, 39, 73–84. [Google Scholar] [CrossRef]
- He, X.; Jiang, W.; Chen, Y.; Liu, G. Numerical simulation of the impacts of anthropogenic heat on the structure of the urban boundary layer. Chin. J. Geophys. 2007, 50, 75–83. [Google Scholar] [CrossRef]
- Ichinose, T.; Shimodozono, K.; Hanaki, K. Impact of anthropogenic heat on urban climate in Tokyo. Atmos. Environ. 1999, 33, 3897–3909. [Google Scholar] [CrossRef]
- Tong, H.; Liu, H.; Sang, J.; Hu, F. The impact of urban anthropogenic heat on Beijing heat environment. Clim. Environ. Res. 2004, 9, 411–421. [Google Scholar]
- Iamarino, M.; Beevers, S.; Grimmond, C.S.B. High-resolution (space, time) anthropogenic heat emissions: London 1970–2025. Int. J. Climatol. 2012, 32, 1754–1767. [Google Scholar] [CrossRef]
- Sailor, D.J. A review of methods for estimating anthropogenic heat and moisture emissions in the urban environment. Int. J. Climatol. 2010, 31, 189–199. [Google Scholar] [CrossRef]
- Oke, T.R. Boundary Layer Climates, 2nd ed.; Methuen: London, UK, 1987. [Google Scholar] [CrossRef]
- Hu, D.; Yang, L.; Zhou, J.; Deng, L. Estimation of urban energy heat flux and anthropogenic heat discharge using aster image and meteorological data: Case study in Beijing metropolitan area. J. Appl. Remote Sens. 2012, 6. [Google Scholar] [CrossRef]
- Kato, S.; Yamaguchi, Y. Analysis of urban heat-island effect using ASTER and ETM+ Data: Separation of anthropogenic heat discharge and natural heat radiation from sensible heat flux. Remote Sens. Environ. 2005, 99, 44–54. [Google Scholar] [CrossRef]
- Pigeon, G.; Legain, D.; Durand, P.; Masson, V. Anthropogenic heat release in an old European agglomeration (Toulouse, France). Int. J. Climatol. 2010, 27, 1969–1981. [Google Scholar] [CrossRef]
- Zhou, Y.; Weng, Q.; Gurney, K.R.; Shuai, Y.; Hu, X. Estimation of the relationship between remotely sensed anthropogenic heat discharge and building energy use. ISPRS J. Photogramm. Remote Sens. 2012, 67, 65–72. [Google Scholar] [CrossRef]
- Dhakal, S.; Hanaki, K.; Ai, H. Estimation of heat discharges by residential buildings in Tokyo. Energy Convers. Manag. 2003, 44, 1487–1499. [Google Scholar] [CrossRef]
- Heiple, S.; Sailor, D.J. Using building energy simulation and geospatial modeling techniques to determine high resolution building sector energy consumption profiles. Energy Build. 2008, 40, 1426–1436. [Google Scholar] [CrossRef]
- Kikegawa, Y.; Genchi, Y.; Kondo, H.; Hanaki, K. Impacts of city-block-scale countermeasures against urban heat-island phenomena upon a building’s energy-consumption for air-conditioning. Appl. Energy 2006, 83, 649–668. [Google Scholar] [CrossRef]
- Dong, Y.; Varquez, A.C.G.; Kanda, M. Global anthropogenic heat flux database with high spatial resolution. Atmos. Environ. 2017, 150, 276–294. [Google Scholar] [CrossRef]
- Grimmond, C.S.B. The suburban energy balance: Methodological considerations and results for a mid-latitude west coast city under winter and spring conditions. Int. J. Climatol. 2010, 12, 481–497. [Google Scholar] [CrossRef]
- Quah, A.K.L.; Roth, M. Diurnal and weekly variation of anthropogenic heat emissions in a tropical city, Singapore. Atmos. Environ. 2012, 46, 92–103. [Google Scholar] [CrossRef]
- Lu, Y.; Wang, Q.G.; Zhai, Y.R.; Song, Y.Y.; Zhang, Y.Y.; Sun, P. Anthropogenic heat emissions in the Yangtze River Delta region. China Environ. Sci. 2014, 34, 295–301. [Google Scholar]
- Wang, Y.; Chen, T.; Sun, R. Assessing the spatiotemporal characteristics of anthropogenic heat in Beijing. China Environ. Sci. 2016, 36, 2178–2185. [Google Scholar]
- Xie, M.; Zhu, K.G.; Wang, T.J.; Feng, W.; Zhu, X.S.; Chen, F.; Ouyang, Y.; Liu, Z.J. Study on the distribution of anthropogenic heat flux over China. China Environ. Sci. 2015, 35, 728–734. [Google Scholar]
- Lu, Y.; Wang, Q.; Zhang, Y.; Sun, P.; Qian, Y. An estimate of anthropogenic heat emissions in China. Int. J. Climatol. 2015, 36, 1134–1142. [Google Scholar] [CrossRef]
- Kimura, F.; Takahashi, S. The effects of land-use and anthropogenic heating on the surface temperature in the Tokyo Metropolitan area: A numerical experiment. Atmos. Environ. Part B Urban Atmos. 1991, 25, 155–164. [Google Scholar] [CrossRef]
- Coscieme, L.; Pulselli, F.M.; Bastianoni, S.; Elvidge, C.D.; Anderson, S.; Sutton, P.C. A thermodynamic geography: Night-time satellite imagery as a proxy measure of emergy. Ambio 2014, 43, 969–979. [Google Scholar] [CrossRef] [PubMed]
- Li, Y.; Zhao, X. An empirical study of the impact of human activity on long-term temperature change in China: A perspective from energy consumption. J. Geophys. Res. Atmos. 2012, 117. [Google Scholar] [CrossRef]
- Li, X.; Xu, H.; Chen, X.; Li, C. Potential of NPP-VIIRS nighttime Light imagery for modeling the regional economy of China. Remote Sens. 2013, 5, 3057–3081. [Google Scholar] [CrossRef]
- Zhou, Y.; Ma, T.; Zhou, C.; Xu, T. Nighttime light derived assessment of regional inequality of socioeconomic development in China. Remote Sens. 2015, 7, 1242–1262. [Google Scholar] [CrossRef]
- Chen, B.; Shi, G. Estimation of the distribution of global anthropogenic heat flux. Atmos. Ocean. Sci. Lett. 2012, 5, 108–112. [Google Scholar] [CrossRef][Green Version]
- Yang, W.; Chen, B.; Cui, X. High-resolution mapping of anthropogenic heat in China from 1992 to 2010. Int. J. Environ. Res. Public Health 2014, 11, 4066–4077. [Google Scholar] [CrossRef] [PubMed]
- Ma, P.P.; Wu, J.J.; Yang, X.C.; Qi, J.G. Spatialization of anthropogenic heat using multi-sensor remote sensing data: A case study of Zhejiang Province, East China. China Environ. Sci. 2016, 36, 314–320. [Google Scholar]
- Chen, F.; Yang, X.; Wu, J. Simulation of the urban climate in a Chinese megacity with spatially heterogeneous anthropogenic heat data. J. Geophys. Res. Atmos. 2016, 121, 5193–5212. [Google Scholar] [CrossRef]
- Elvidge, C.D.; Baugh, K.E.; Zhizhin, M.; Hsu, F.C. Why VIIRS data are superior to DMSP for mapping nighttime lights. Proc. Asia-Pac. Adv. Netw. 2013, 35, 62–69. [Google Scholar] [CrossRef]
- Shi, K.; Yu, B.; Huang, Y.; Hu, Y.; Yin, B.; Chen, Z.; Chen, L.; Wu, J. Evaluating the ability of NPP-VIIRS nighttime light data to estimate the gross domestic product and the electric power consumption of China at multiple scales: A Comparison with DMSP-OLS data. Remote Sens. 2014, 6, 1705–1724. [Google Scholar] [CrossRef]
- Sailor, D.J.; Lu, L. A top–down methodology for developing diurnal and seasonal anthropogenic heating profiles for urban area. Atmos. Environ. 2004, 38, 2737–2748. [Google Scholar] [CrossRef]
- Ferreira, M.J.; Oliveira, A.P.D.; Soares, J. Anthropogenic heat in the city of São Paulo, Brazil. Theor. Appl. Climatol. 2011, 104, 43–56. [Google Scholar] [CrossRef]
- Nie, W.S.; Sun, T.; Ni, G.H. Spatiotemporal characteristics of anthropogenic heat in an urban environment: A case study of Tsinghua Campus. Build. Environ. 2014, 82, 675–686. [Google Scholar] [CrossRef]
- Lu, D.; Tian, H.; Zhou, G.; Ge, H. Regional mapping of human settlements in southeastern China with multisensor remotely sensed data. Remote Sens. Environ. 2008, 112, 3668–3679. [Google Scholar] [CrossRef]
- Frolking, S.; Milliman, T.; Seto, K.C.; Friedl, M.A. A global fingerprint of macro-scale changes in urban structure from 1999 to 2009. Environ. Res. Lett. 2013, 8. [Google Scholar] [CrossRef]
- Wu, J.; Liu, H.; Peng, J.; Lin, M. Hierarchical structure and spatial pattern of China’s urban system: Evidence from DMSP/OLS nightlight data. Acta Geogr. Sin. 2014, 69, 759–770. [Google Scholar]
- Hartigan, J.A.; Wong, M.A. A K-means clustering algorithm. J. R. Stat. Soc. Ser. C (Appl. Satat.) 1979, 28, 100–108. [Google Scholar] [CrossRef]
- National Bureau of Statistics of the People’s Republic of China: Chinese Statistical Yearbook. Available online: http://www.stats.gov.cn/tjsj/ndsj/ (accessed on 25 September 2017).
- Beijing Municipal Bureau of Statistics: Beijing Economic Yearbook. Available online: http://www.bjstats.gov.cn/tjsj/ (accessed on 25 September 2017).
- Tianjin Municipal Bureau of Statistics: Tianjin Economic Yearbook. Available online: http://61.181.81.253/Item/26545.aspx (accessed on 25 September 2017).
- Hebei Provincial Bureau of Statistics: Hebei Economic Yearbook. Available online: http://www.hetj.gov.cn/res/nj2016/indexch.htm (accessed on 25 September 2017).
- The Level-1 and Atmosphere Archive and Distribution System (LAADS) Distributed Active Archive Center (DAAC). Available online: https://ladsweb.nascom.nasa.gov/search/ (accessed on 25 September 2017).
- Huete, A.; Didan, K.; Miura, T.; Rodriguez, E.P.; Gao, X.; Ferreira, L.G. Overview of the radiometric and biophysical performance of the MODIS vegetation indices. Remote Sens. Environ. 2002, 83, 195–213. [Google Scholar] [CrossRef]
- National Oceanic and Atmospheric Administration/National Geophysical Data Center (NOAA/NGDC). Available online: https://ngdc.noaa.gov/eog/viirs/download_dnb_composites.html (accessed on 25 September 2017).
- Baugh, K.; Hsu, F.C.; Elvidge, C.D.; Zhizhin, M. Nighttime lights compositing using the VIIRS day-night band: Preliminary results. Proc. Asia-Pac. Adv. Netw. 2013, 35, 70–86. [Google Scholar] [CrossRef]
- Ma, T.; Zhou, C.; Tao, P.; Haynie, S.; Fan, J. Responses of Suomi-NPP VIIRS-derived nighttime lights to socioeconomic activity in China’s cities. Remote Sens. Lett. 2014, 5, 165–174. [Google Scholar] [CrossRef]
- Oke, T.R. The urban energy balance. Prog. Phys. Geogr. 1988, 12, 471–508. [Google Scholar] [CrossRef]
- Offerle, B.; Grimmond, C.S.B.; Fortuniak, K. Heat storage and anthropogenic heat flux in relation to the energy balance of a central European city center. Int. J. Climatol. 2005, 25, 1405–1419. [Google Scholar] [CrossRef]
- Nie, W.; Zaitchik, B.F.; Guangheng, N.I.; Sun, T. Impacts of anthropogenic heat on summertime rainfall in Beijing. J. Hydrometeorol. 2017. [Google Scholar] [CrossRef]
- Allen, L.; Lindberg, F.; Grimmond, C.S.B. Global to city scale urban anthropogenic heat flux: Model and variability. Int. J. Climatol. 2011, 31, 1990–2005. [Google Scholar] [CrossRef]
- Flanner, M.G. Integrating anthropogenic heat flux with global climate models. Internet Healthc. Strateg. 2009, 36, 270–271. [Google Scholar] [CrossRef]
- Deichmann, U.; Balk, D.; Yetman, G. Transforming Population Data for Interdisciplinary Usages: From Census to Grid. Documentation for GPW Version 2. 2001. Available online: http://sedac.ciesin.org/downloads/docs/gpw-v3/gpwdocumentation.pdf (accessed on 25 September 2017).
- US Bureau of Energy Information Statistics. Available online: https://www.eia.doe.gov/emeu/iea (accessed on 25 September 2017).
- Columbia University Socioeconomic Data Application Center. Available online: http://www.cgd.ucar.edu/tss/ahf/ (accessed on 25 September 2017).
- Urban Micromet London Urban Meteorological Observatory. Available online: http://londonclimate.info/ (accessed on 25 September 2017).
- European Space Agency (ESA). Available online: http://maps.elie.ucl.ac.be/CCI/viewer/ (accessed on 25 September 2017).
- Xian, G.; Homer, C.; Dewitz, J.; Fry, J.; Hossain, N.; Wickham, J. The change of impervious surface area between 2001 and 2006 in the conterminous United States. Photogramm. Eng. Remote Sens. 2011, 77, 758–762. [Google Scholar]
- Multi-Resolution Land Characteristics Consortium (MRLC) National Land Cover Database (NLCD). Available online: https://www.mrlc.gov/nlcd11_data.php (accessed on 25 September 2017).
- Xiao, J.; Zhang, Q.; Wang, Y.; Na, J.; Xing, L. Urban Surface heat flux analysis based on remote sensing: A case study of Shijiazhuang city. Sci. Geogr. Sin. 2014, 34, 338–343. [Google Scholar]
- Chen, B.; Shi, G.; Wang, B.; Zhao, J.; Tan, S. Estimation of the anthropogenic heat release distribution in China from 1992 to 2009. J. Meteorol. Res. 2012, 26, 507–515. [Google Scholar] [CrossRef]


| Municipalities of Beijing–Tianjin–Hebei Region | Mean AHF of Districts (W·m−2) | Mean AHF of Counties (W·m−2) | Mean AHF at Municipal Level (W·m−2) |
|---|---|---|---|
| Beijing | 24.22 | 1.10 | 18.44 |
| Tianjin | 39.21 | 1.02 | 32.85 |
| Shijiazhuang | 18.91 | 1.01 | 5.68 |
| Cangzhou | 5.16 | 1.05 | 1.56 |
| Tangshan | 20.49 | 0.97 | 6.55 |
| Xingtai | 7.80 | 1.03 | 1.74 |
| Qinghuangdao | 4.32 | 0.99 | 2.42 |
| Baoding | 3.47 | 1.02 | 1.31 |
| Zhangjiakou | 5.11 | 1.14 | 2.07 |
| Handan | 10.16 | 1.04 | 2.96 |
| Langfang | 1.18 | 0.97 | 1.05 |
| Hengshui | 1.15 | 1.18 | 1.17 |
| Chengde | 1.02 | 1.23 | 1.17 |
| AHF Categories | Percentage Contribution | AHF Categories | Percentage Contribution |
|---|---|---|---|
| (W·m−2) | (%) | (W·m−2) | (%) |
| <0 | 0 | 50–60 | 5.11 |
| 0–10 | 39.03 | 60–70 | 2.57 |
| 10–20 | 6.34 | 70–80 | 2.69 |
| 20–30 | 6.21 | 80–90 | 2.45 |
| 30–40 | 4.26 | 90–100 | 5.31 |
| 40–50 | 4.36 | >100 | 21.66 |
| Municipalities of the Beijing–Tianjin–Hebei Region | Residual between AHF Estimation Result of the AHF Estimation Model and AHF Computed Based on Official Statistics |
|---|---|
| Beijing | 0.6 |
| Tianjin | 2.1 |
| Shijiazhuang | 0.7 |
| Cangzhou | 0.2 |
| Tangshan | 0.9 |
| Xingtai | 0.2 |
| Qinghuangdao | 0.5 |
| Baoding | 0.2 |
| Zhangjiakou | 1.4 |
| Handan | 0.3 |
| Langfang | 0.1 |
| Hengshui | 0.2 |
| Chengde | 1.1 |
| Parameters for Statistical Regression | Fitting Equation | R Square |
|---|---|---|
| AHF-VIIRSnor | AHF = 198.94(VIIRSnor)2 − 59.311(VIIRSnor) + 3.470 | 0.963 |
| AHF-PD | AHF = 2 × 10⁻⁷(PD)2 + 0.002(PD) + 0.064 | 0.995 |
| AHF-HSI | AHF = 48.287(HSI)2 − 17.716(HSI) + 2.541 | 0.989 |
| LCCS | Mean AHF (W·m−2) | Max AHF (W·m−2) | |||||
|---|---|---|---|---|---|---|---|
| Type | Percent | RAHF | LUCY | Flanner | RAHF | LUCY | Flanner |
| (%) | |||||||
| Agriculture | 55.07 | 0.81 | 0.24 | 1.04 | 0.99 | 34.10 | 20.06 |
| Forest | 12.57 | 0.09 | 0.05 | 0.43 | 0.92 | 9.54 | 13.30 |
| Grassland | 22.81 | 0.45 | 0.07 | 0.37 | 1.13 | 13.30 | 34.60 |
| Settlement | 7.85 | 11.10 | 1.24 | 3.00 | 130.84 | 79.89 | 49.58 |
| Water and Wetland | 1.14 | 0.03 | 0.17 | 0.90 | 0.99 | 14.53 | 35.20 |
| Others | 0.56 | 0.97 | 0.27 | 1.04 | 4.30 | 21.77 | 35.20 |
| Impervious Surface Percent (%) | Mean AHF (W·m−2) | ||
|---|---|---|---|
| RAHF | LUCY | Flanner | |
| 0–10 | 1.18 | 0.23 | 1.03 |
| 10–40 | 3.68 | 0.53 | 1.72 |
| 40–70 | 9.41 | 0.96 | 2.63 |
| 70–100 | 33.57 | 2.86 | 5.81 |
© 2017 by the authors. Licensee MDPI, Basel, Switzerland. This article is an open access article distributed under the terms and conditions of the Creative Commons Attribution (CC BY) license (http://creativecommons.org/licenses/by/4.0/).
Share and Cite
Chen, S.; Hu, D. Parameterizing Anthropogenic Heat Flux with an Energy-Consumption Inventory and Multi-Source Remote Sensing Data. Remote Sens. 2017, 9, 1165. https://doi.org/10.3390/rs9111165
Chen S, Hu D. Parameterizing Anthropogenic Heat Flux with an Energy-Consumption Inventory and Multi-Source Remote Sensing Data. Remote Sensing. 2017; 9(11):1165. https://doi.org/10.3390/rs9111165
Chicago/Turabian StyleChen, Shanshan, and Deyong Hu. 2017. "Parameterizing Anthropogenic Heat Flux with an Energy-Consumption Inventory and Multi-Source Remote Sensing Data" Remote Sensing 9, no. 11: 1165. https://doi.org/10.3390/rs9111165
APA StyleChen, S., & Hu, D. (2017). Parameterizing Anthropogenic Heat Flux with an Energy-Consumption Inventory and Multi-Source Remote Sensing Data. Remote Sensing, 9(11), 1165. https://doi.org/10.3390/rs9111165