1. Introduction
Ship wake has been largely exploited for ship route estimation by high resolution Synthetic Aperture Radar (SAR) images, and several techniques have been proposed to improve wake detection [
1,
2,
3,
4,
5,
6,
7,
8] and velocity estimation performance [
3,
4]. The common assumption of the existing approaches is related to wake structure, which is basically composed by the turbulent wake, two narrow-V wakes, and the Kelvin pattern [
9]. The turbulent wake is imaged as a dark line, surrounded by two bright lines, representative of the narrow-V wakes. The Kelvin pattern shows three features: the transverse, divergent, and cusp wakes, all imaged within an angle of 19.5° [
10] with respect to the ship track. Since the cusps are the most discernible features in SAR images, only the detection of the cusp line [
11] is implemented in the proposed algorithms [
3,
4]. In the following, the above described wake signature is assumed. Other dissimilar appearances can occur; as an example, the radar manifestations of ship wake in zones of phytoplankton bloom show the turbulent wake as a bright line [
12].
The existing approaches to detect wake components exploit the Radon Transform [
13], which converts straight lines in the image domain in dots in a transformed domain. Hence, dark lines, e.g., turbulent wake, appears as dark dots in the Radon domain and, similarly, bright lines are imaged as bright dots. For sake of clarity, since in the real images the wake components are not lines but streets of bright/dark pixels, they are converted into clusters of bright/dark dots in the Radon domain, thus rendering the detection process more difficult.
In this ambit, an original wake detection algorithm is presented in Reference [
4] and applied to high-resolution X-band images by COSMO/SkyMed and TerraSAR-X. The technique takes advantages from the Radon-based previous techniques [
1,
3], but it has been conceived to overcome their intrinsic limitations by exploiting the relative angular distance of wake components during the detection process. In detail, the detection phase leads to the identification of five wake components, which are then classified as really imaged or not by means of merit indexes. The results showed that the vast majority of wake features are correctly detected and also validated in critical situations. The main criticality concerned the false confirmation of Kelvin cusps, and an empirical criterion was suggested to strongly limit this phenomenon.
Recently, plenty of experimental analyses have focused on the utilization of Sentinel-1 SAR data for maritime surveillance [
14,
15,
16,
17,
18,
19], strongly encouraged by free-accessed data. In Reference [
18], a first comparison of Sentinel-1 and TerraSAR-X data is shown, and the wake appearance is investigated in only one case: a fishing vessel that shows a wake more pronounced in the VV-polarized C-band image than in the HH-polarized X-band image. In Reference [
16], TerraSAR-X images are used together with Sentinel-1 and RADARSAT data to detect ships, oil spills, and icebergs, and the wake detection is considered as extensions under development.
In this paper, the wake detection algorithm [
4] is applied to C-band SAR images gathered by the Sentinel-1 mission. The aim is to investigate the method’s robustness with reference to radar frequency and resolution. To this end, 28 ship wakes are identified in 8 Stripmap images with different polarization and incidence angle, and their components are detected and classified.
The paper is organized as follows:
Section 2 analyzes the effects of SAR-related parameters on wake visibility;
Section 3 briefly summarizes the detection algorithm; and
Section 4 discusses the results of the technique application on Sentinel-1 images.
2. Ship Wake Visibility in SAR Images
Several authors investigated the occurrence of a wake in a radar image. In Reference [
20], 47 ERS-1 SAR scenes were analyzed and it was found that 63.3% of the ship-like targets show a distinguishable wake. Additional results were assessed in Reference [
21], in which about 72.8% and 93% of ship-like targets exhibit a wake-like feature in Seasat and ERS-1 images, respectively.
The wake visibility in SAR images depends on several parameters, related both to radar characteristics and ship motion, as well as to local conditions, such as wind speed and direction.
Plenty of literature results [
10,
22,
23,
24,
25] are available on the effects of such parameters on the appearance of wake components. As a general rule, the Bragg waves over the ocean comes from roughness components that are approximately of similar wavelength as the radar wavelength [
22]. This leads to a smoother appearance of the sea at lower frequencies. With reference to the visibility of wake components, all the authors agree that a turbulent wake is the most distinguishable feature. As an example, Melsheimer et al. [
25] analyzed about 400 SAR wakes and 100 optical wakes and found that at least one component of the Kelvin wake could be seen in 17% of the SAR wake images, but that a turbulent wake is visible in all investigated cases. Moreover, a larger contrast of turbulent wakes at lower frequencies under moderate wind speeds was found in Reference [
10]. Since narrow-V wakes come from Bragg scattering, the angle between the turbulent wake and narrow V-wakes decreases when the wavelength decreases [
10]. In detail, in L-band images, narrow-V wakes appear within a half-angle from the turbulent direction ranging from 1.5° to 4°, whereas in X-band images [
10,
26], they appear as bright edges of the turbulent wake. For sake of clarity, it is worth noting that in Reference [
10] only the former ones are called narrow-V wakes, whereas the latter ones are considered as components of a turbulent system. On the contrary, in Reference [
3], the turbulent wake’s bright edges in an airborne X-band image are also referred to as narrow-V wakes. In the following, the bright features appearing within 4° from the turbulent wake are called narrow-V wakes.
Finally, the Kelvin pattern appearance in radar images has been also investigated and the results show that the visibility of Kelvin arms is:
significantly higher at horizontal (HH) than at vertical (VV) polarization [
23,
24].
not particularly dependent on the radar frequency [
23], with a slightly larger contrast at higher frequencies [
24].
more pronounced at steeper incidence angles [
23,
24].
more distinguishable when the direction of propagation of the waves is parallel to the radar look direction, leading to only one arm being visible in the most cases [
25].
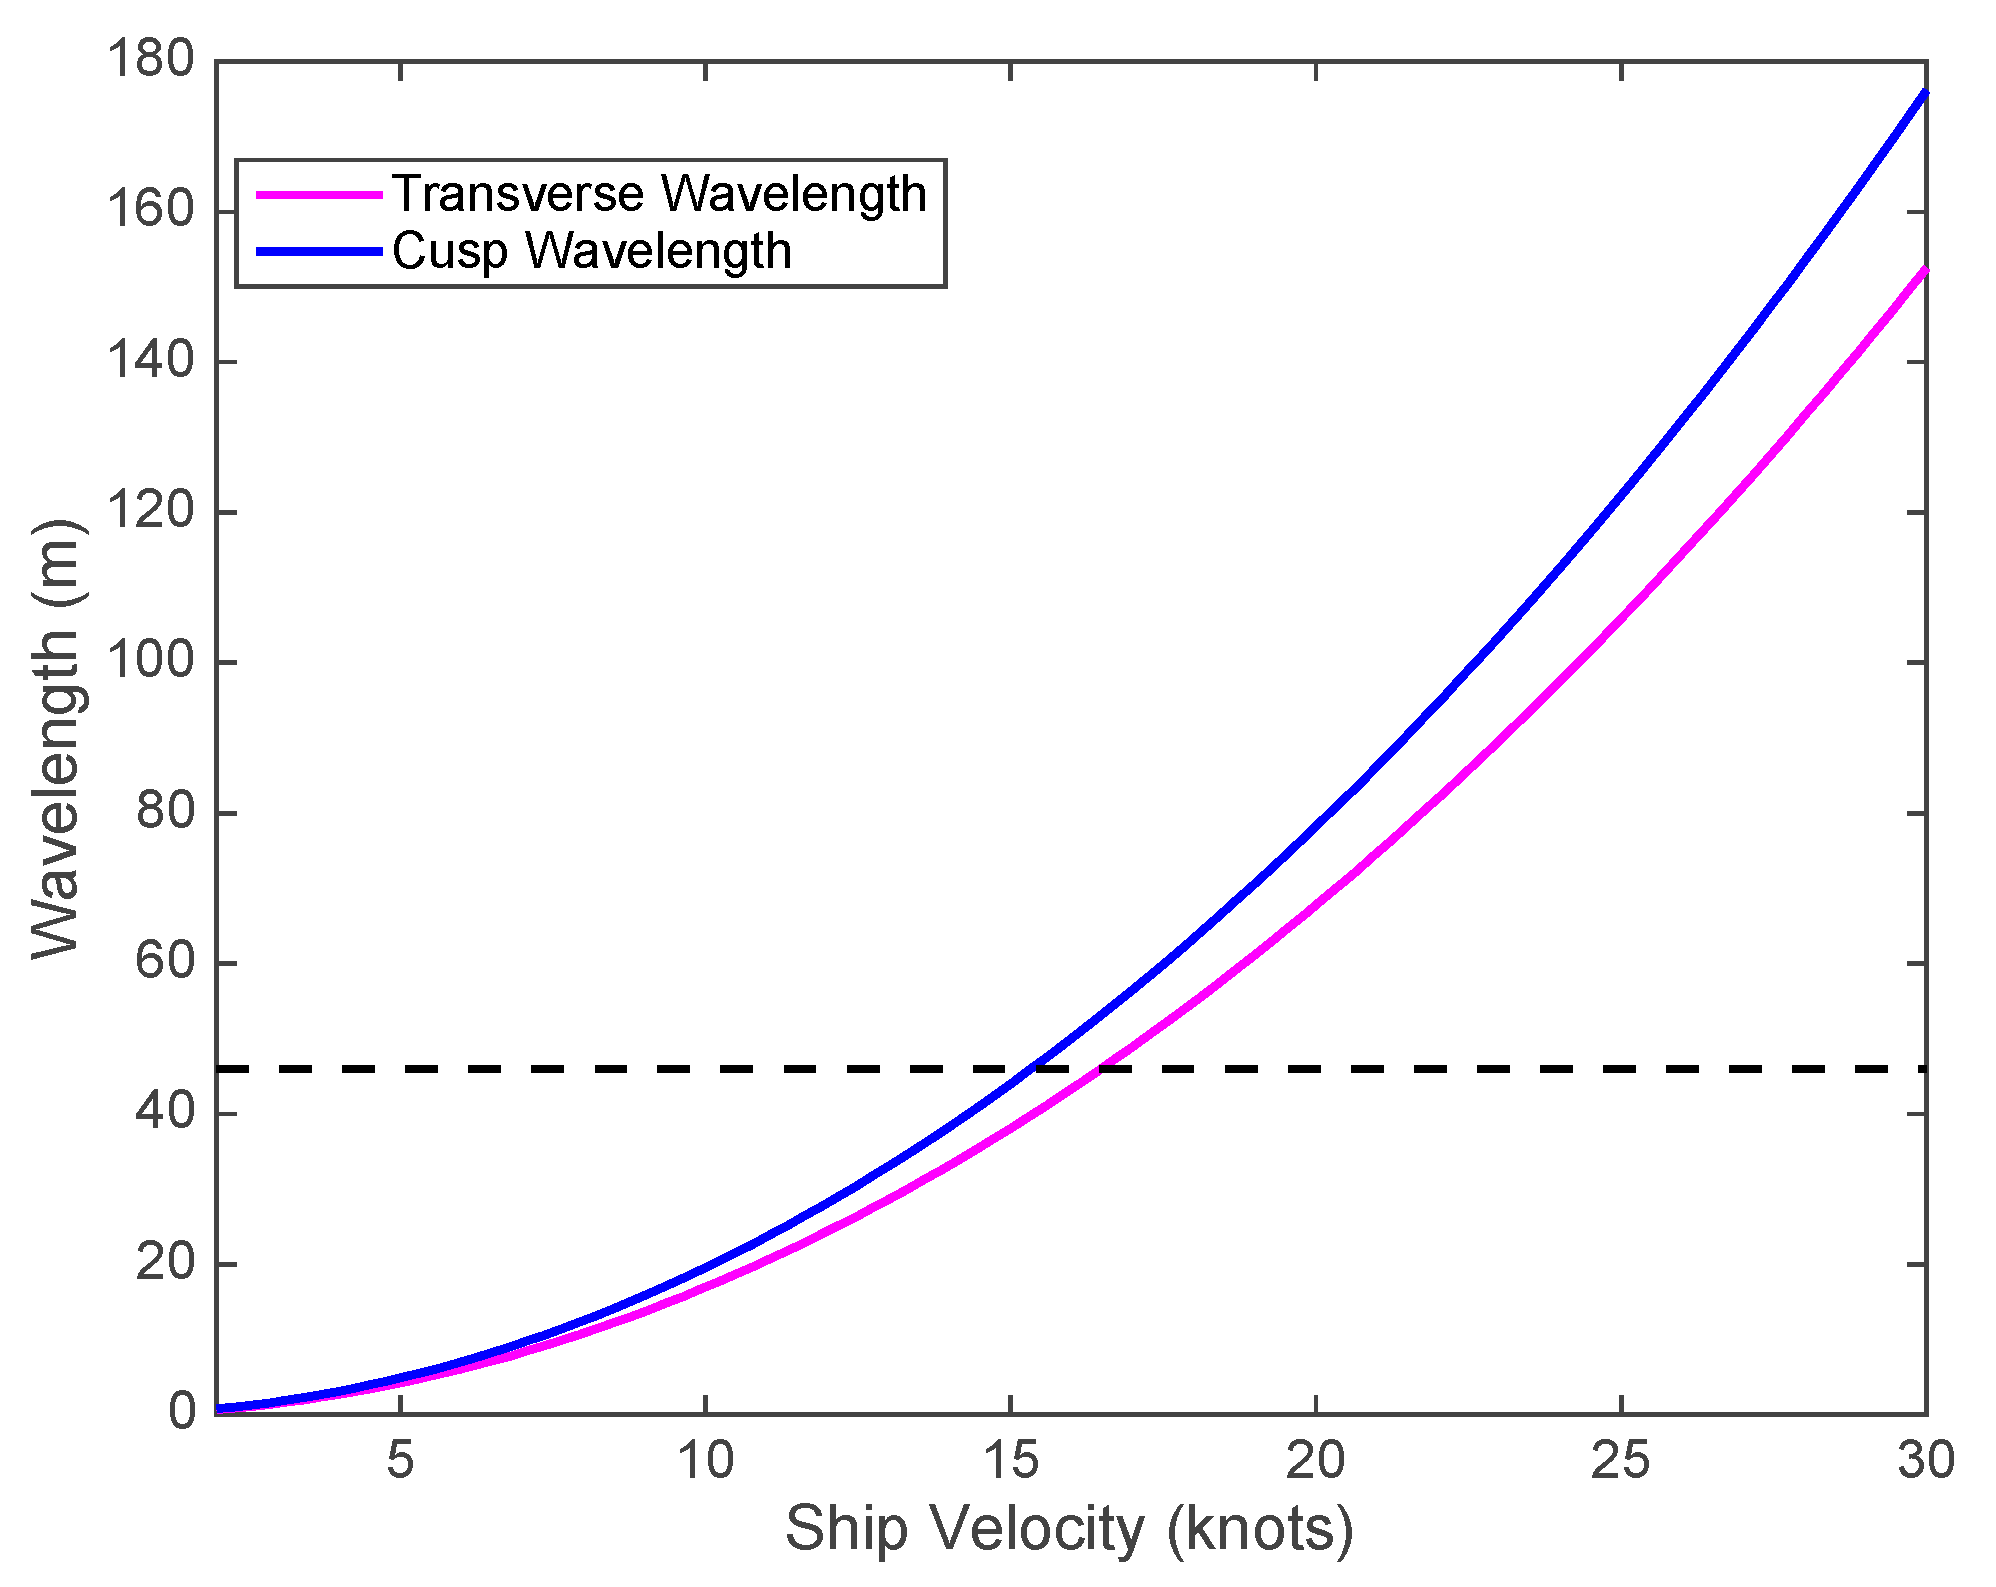
The effect of the image resolution is also of interest. The wavelength of transverse (
λt) [
27] and cusp (
λc) [
3] waves depend on the ship velocity, as defined by Equation (1) and shown in
Figure 1. Such relations are widely exploited for ship velocity estimation [
3,
27].
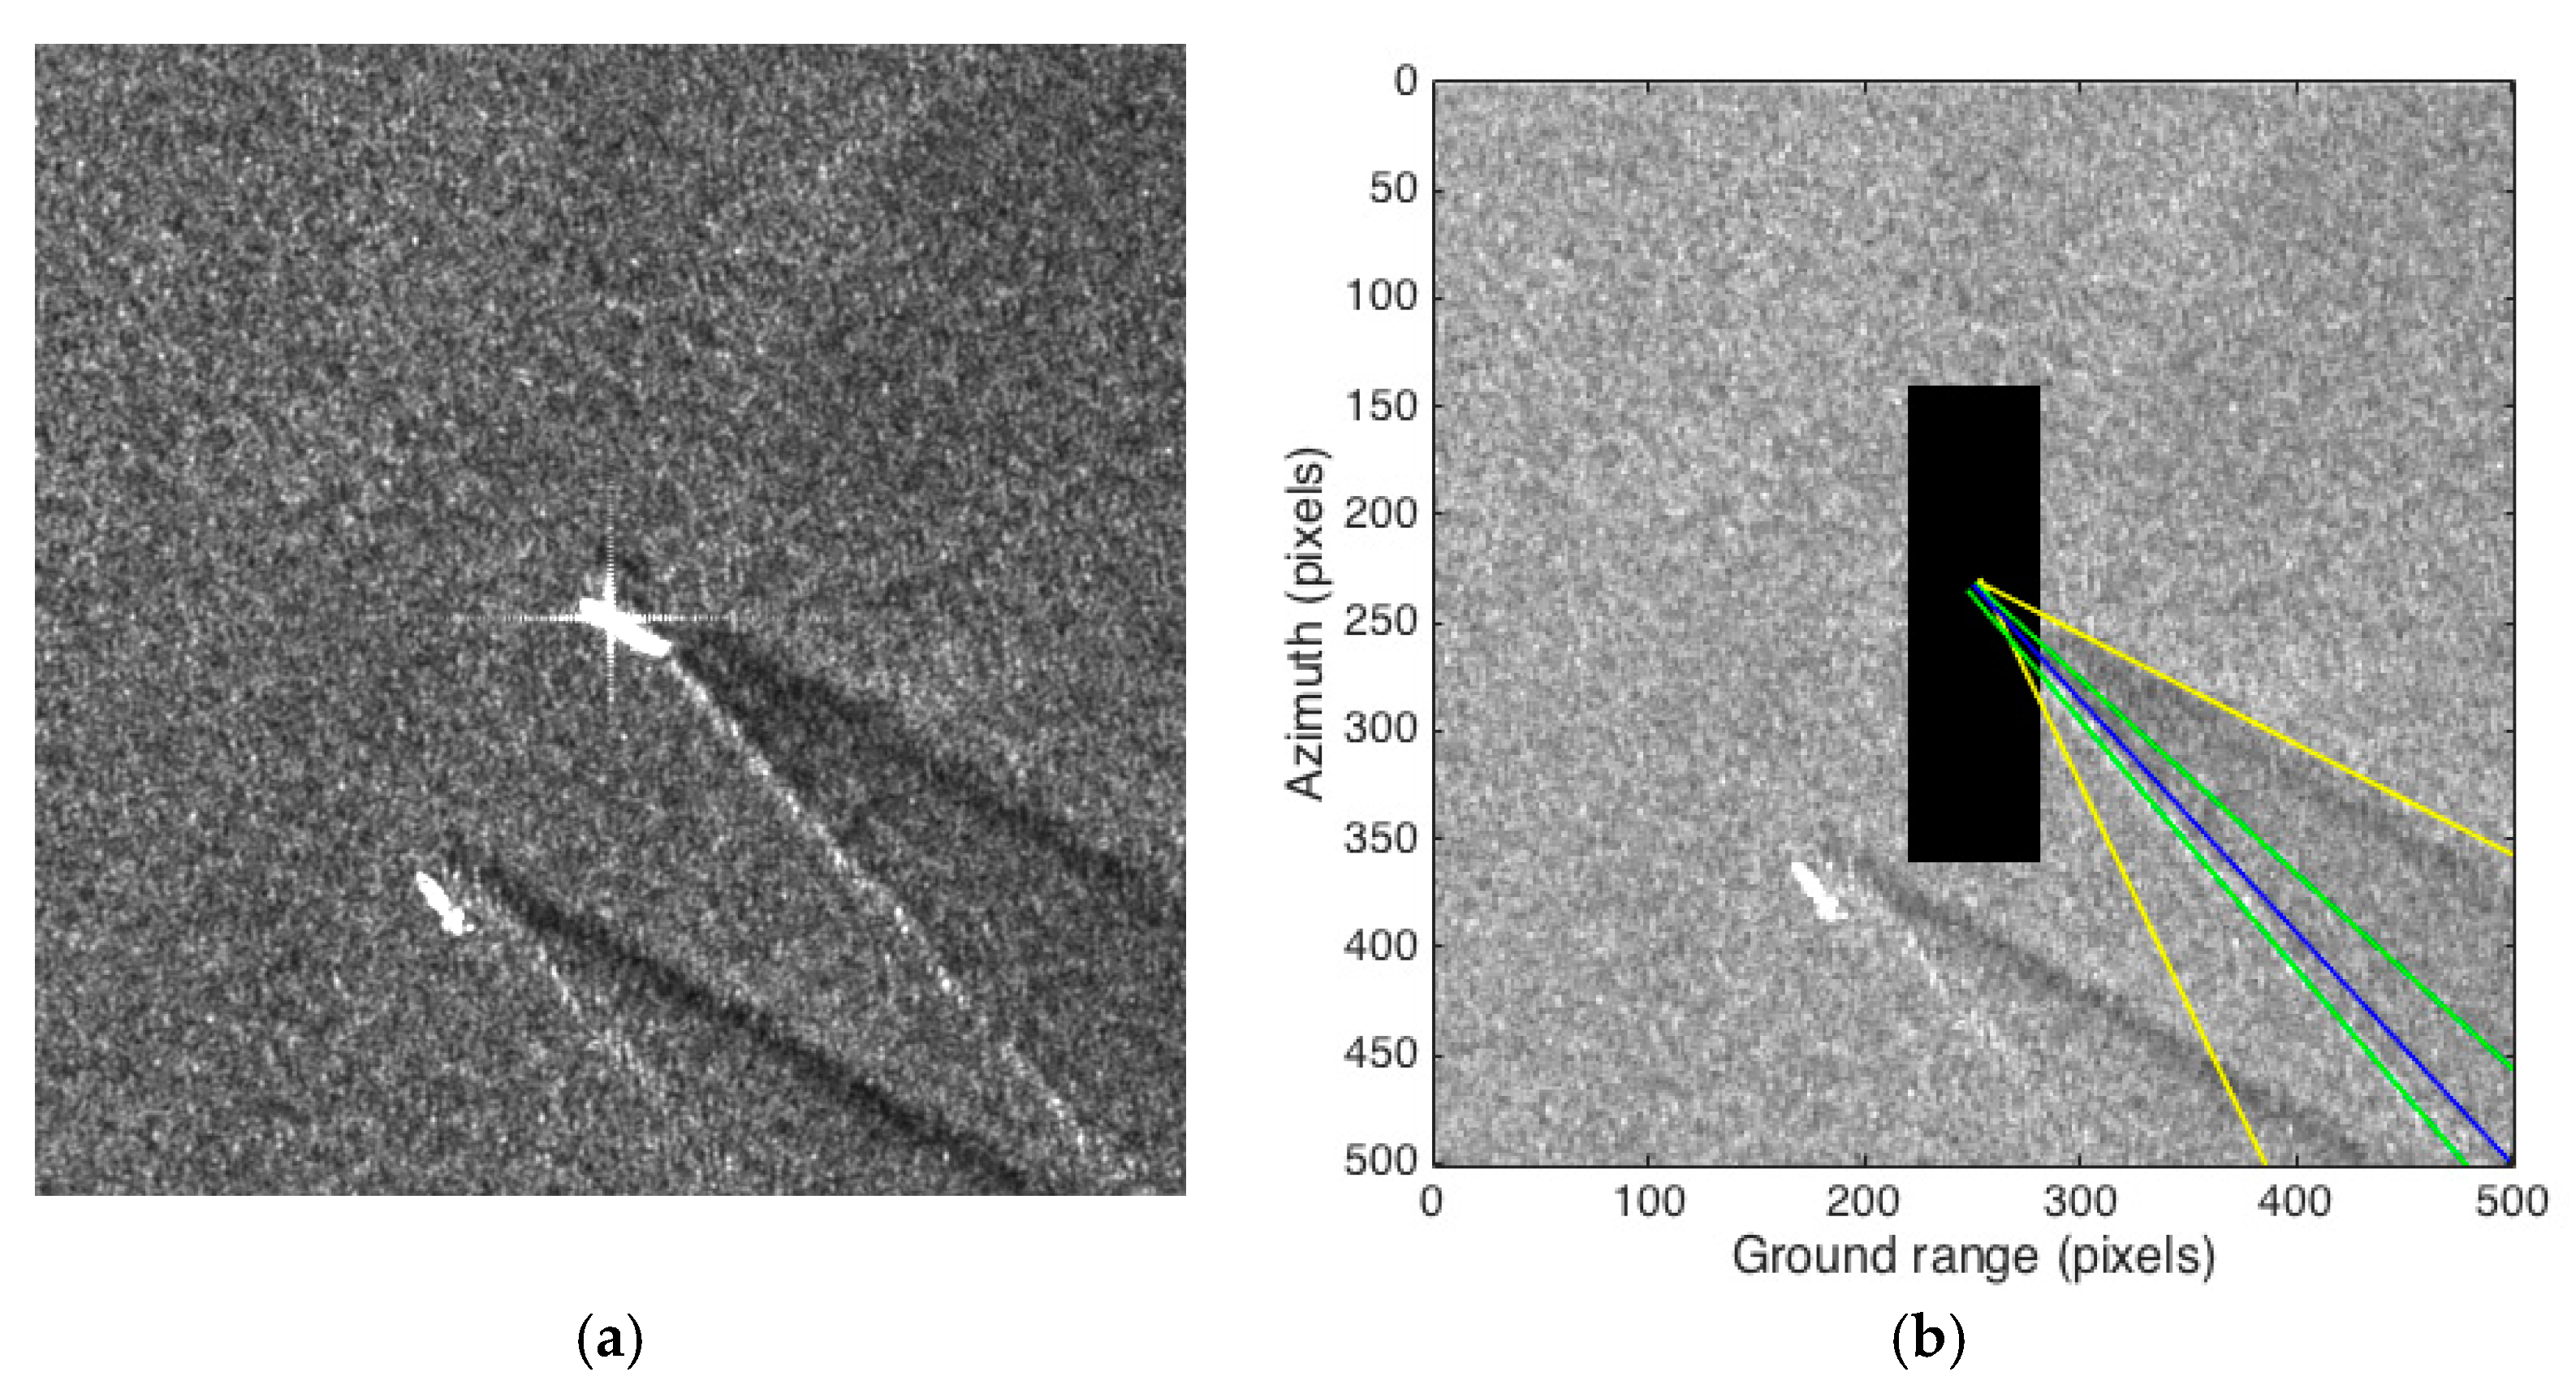
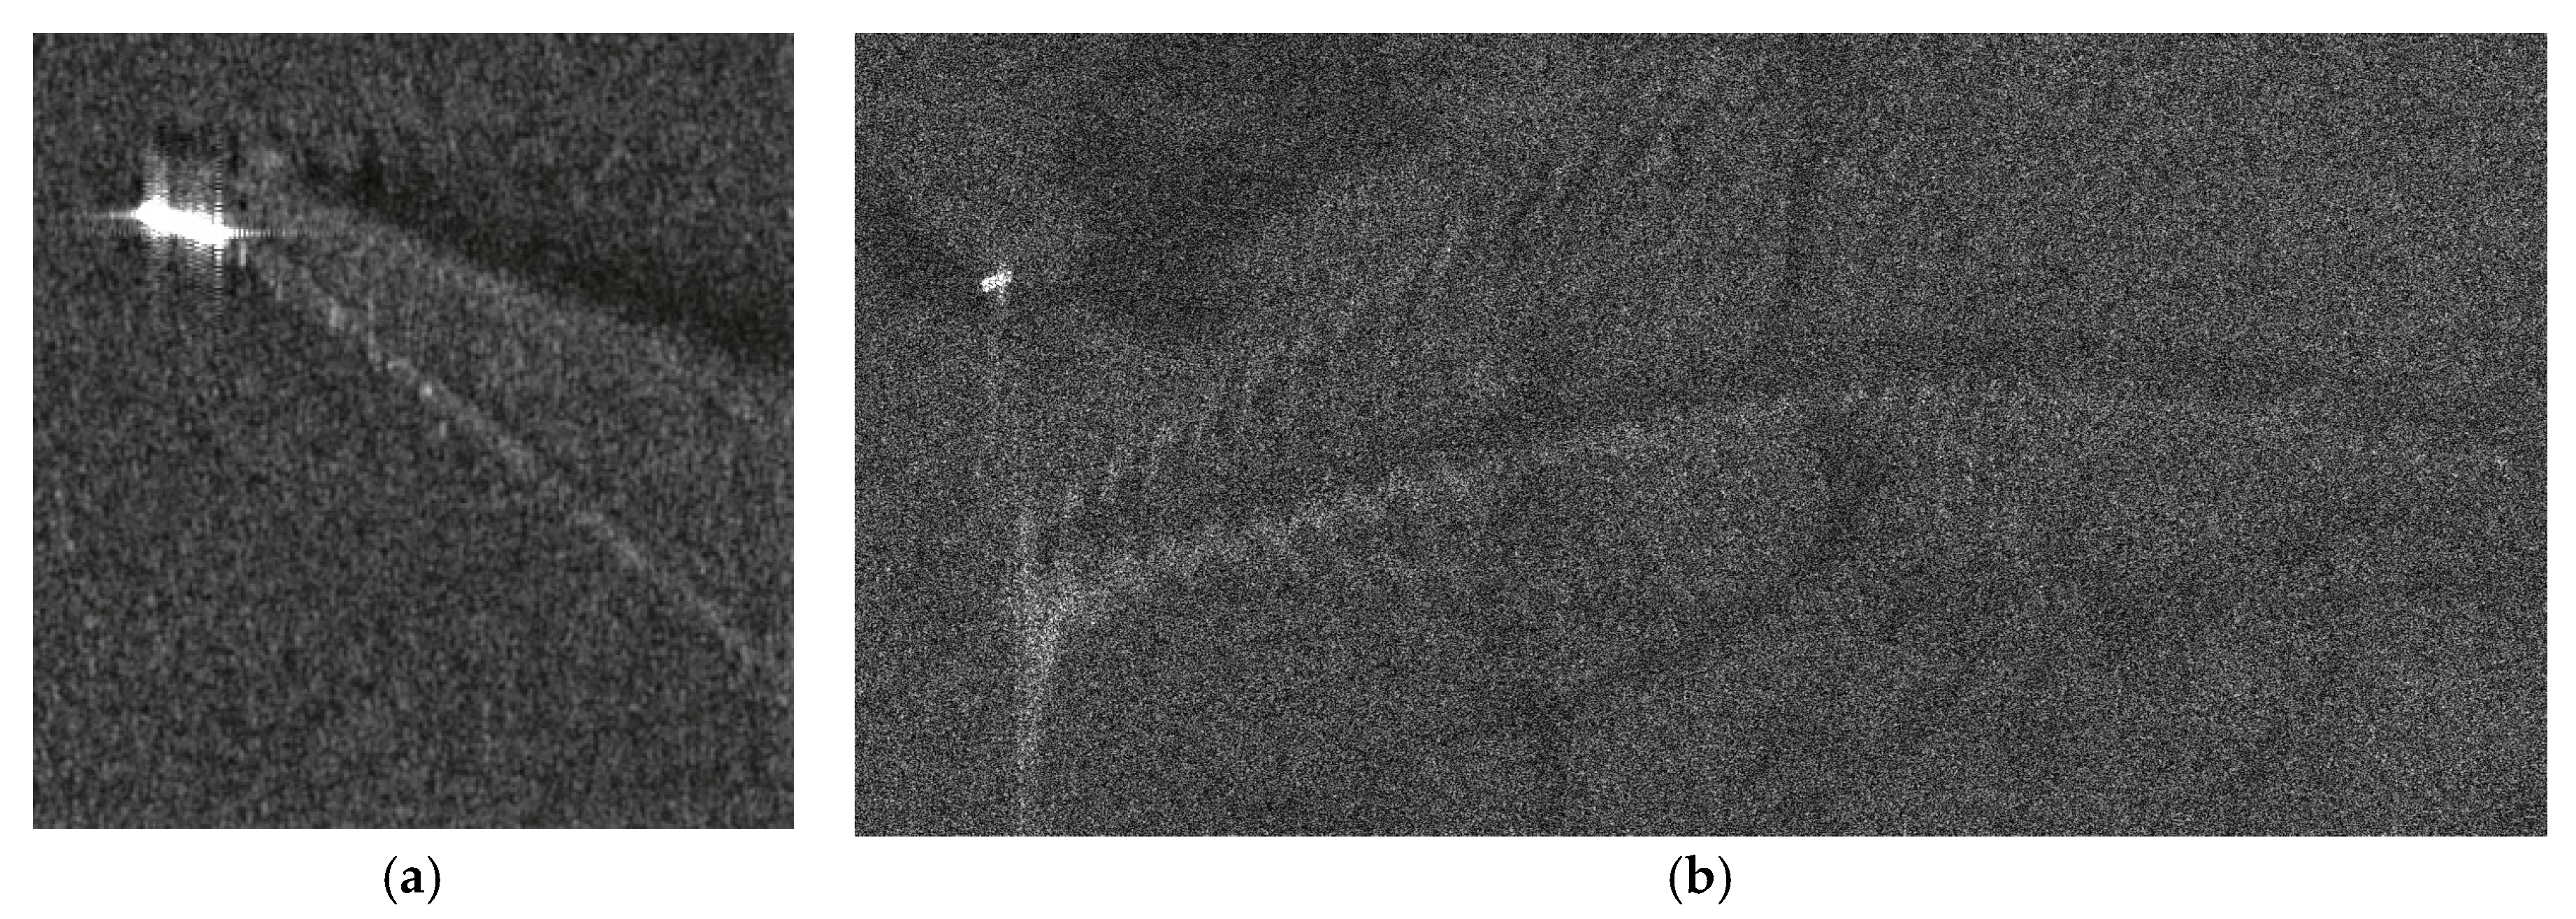
Therefore, only the Kelvin transverse or cusp wakes generated by a ship cruising at an appropriate velocity can be distinguished. As an example, a ship traveling at about 15 knots creates cusp wakes with a wavelength of 46 m. Hence, according to the Nyquist criterion and assuming the typical resolution of Stripmap Sentinel-1 image, a resolvable wake can be observed only for ships moving at this speed or faster. The effect is that the cusps cannot be resolved and appear as a bright line along the edge of the Kelvin envelope rather than as individual wave fronts [
10]. As an example,
Figure 2 shows the Kelvin wakes imaged by Sentinel-1 (a) and COSMO/SkyMed (b).
Finally, it is worth recalling the role of wind speed. The turbulent wake is observed under moderate wind conditions, i.e., wind speed between 3 m/s and 10 m/s. On the contrary, the narrow-V wakes are observed in very calm sea states [
10]. Among the Kelvin pattern components, the cusp waves are more persistent against wind speed, so they are visible even for relatively high wind speed, e.g., from 6 m/s to 10 m/s, as shown in Reference [
23]. Divergent and transverse waves, instead, are clearly imaged for relatively lower wind speeds.
3. Method Description
The detection method identifies the five candidate wake features, which are then investigated by properly merit indexes to classify them as features really related to wake. This section summarizes the method steps and focuses on the aspects that are affected by the different radar frequencies and resolutions of Sentinel-1 data. Extensive details of the algorithm are included in Reference [
4].
Since the method is conceived to validate the ship presence and, in the affirmative case, estimate its route, it is applied after a preliminary screening phase, in which the candidate ship positions have been identified. Then, an image tile is cut out around the ship. Since the tile dimensions are fixed according to the typical length of wake features, e.g., 3 km to 5 km for turbulent wake, the size of the tile in pixels depends on the image resolution. This slightly reduces the already very low computational cost of the proposed technique when applied to Sentinel-1 data with respect to COSMO/SkyMed and TerraSAR-X images [
4].
Then, the ship-centered tile shows the bright pixels relative to: (a) the ship return pixels; (b) the propeller wake; and (c) land returns, if imaged. Such features have to be removed since they lead to bright curves in the Radon domain, affecting the successive detection phases. The ship and propeller wake bright pixels are managed by defining a mask, properly sized, and applying the algorithm to unmasked pixels. The azimuth dimension of the mask is chosen as the maximum expected azimuth offset, which depends on the radar platform slant range and velocity and the maximum expected ship velocity along the slant range direction [
28,
29], as well as on the image resolution for meters to pixels conversion. Moreover, the range dimension of the mask is the maximum size along the range direction of the bright cluster due to ship returns, increased by one ship length aft to include the propeller wake [
30]. In the following, a constant false alarm algorithm [
31,
32,
33] is applied to detect ship cluster. Finally, the area affected by land returns are identified by land masking and ignored by the wake detection process.
The detection of wake features is performed in the Radon domain. In detail, after the application of the Radon Transform, the domain is restricted between two sine curves both to reduce computational time and to detect only peak relative to the wakes of the ship under investigation. The proposed method foresees successive detection steps. Firstly, the turbulent and one narrow-V wake are identified in the Radon domain as the peak and the trough with angular distance less than or equal to 4°, providing the maximum difference between their Radon Transform values. To this end, the Radon Transform of the tile is scanned by a window and the turbulent and one narrow-V wake are detected as the trough/peak pair, which maximizes their difference. The window dimensions are properly set, accounting for both the angular discretization step in Radon Transform derivation and the linear discretization step as well as the width of the wake. The latter parameter depends on the image resolution. When the turbulent wake direction and one narrow-V wake direction are known, the second narrow-V wake is identified as the peak within 4° of the turbulent wake, on the opposite side with respect to the first narrow-V wake. Finally, the Kelvin boundaries are detected as the peaks in rectangular areas obtained with the same considerations made for the second narrow-V detection, except for the angular distance that is about 19° instead of 4°. The results of the previous peak/trough detection phase are five dots, one for each component of the typical wake appearance. Each dot identifies a line in the input domain, obtained by the inverse Radon Transform, corresponding to the directions of the wakes in the intensity image. In order to select the half line representative of the wake, the 180°-ambiguity, intrinsic of the Radon-based integration approach, must be solved. To this end, we estimate the mean value along the two half lines in which the turbulent wake line is divided by the ship position. The direction of wake propagation is, finally, selected as the one for which the mean value is smaller.
Finally, since some features can be invisible, a classification phase is performed to classify the features as true wake structures by means of merit indexes defined in the intensity domain. For bright features, the merit index F
I indicates to what extent the considered half-line is brighter than the mean intensity of the masked image subset. Differently from Reference [
4], the merit index is calculated along each detected half-line representing narrow-V and Kelvin wakes, discarding 10% to 5% of brighter pixels (T = 0.95 and 0.90 in
Table 1) of the half line to filter out the effect of localized brighter spots. The percentage of discarded bright pixels is varied to analyze its effect on the detection performance and, in particular, on the false detections occurrence, which affect the results in Reference [
4]. Differently, for the turbulent wake, the merit index
defines to what extent the half-line is darker than the mean intensity of the masked image subset.
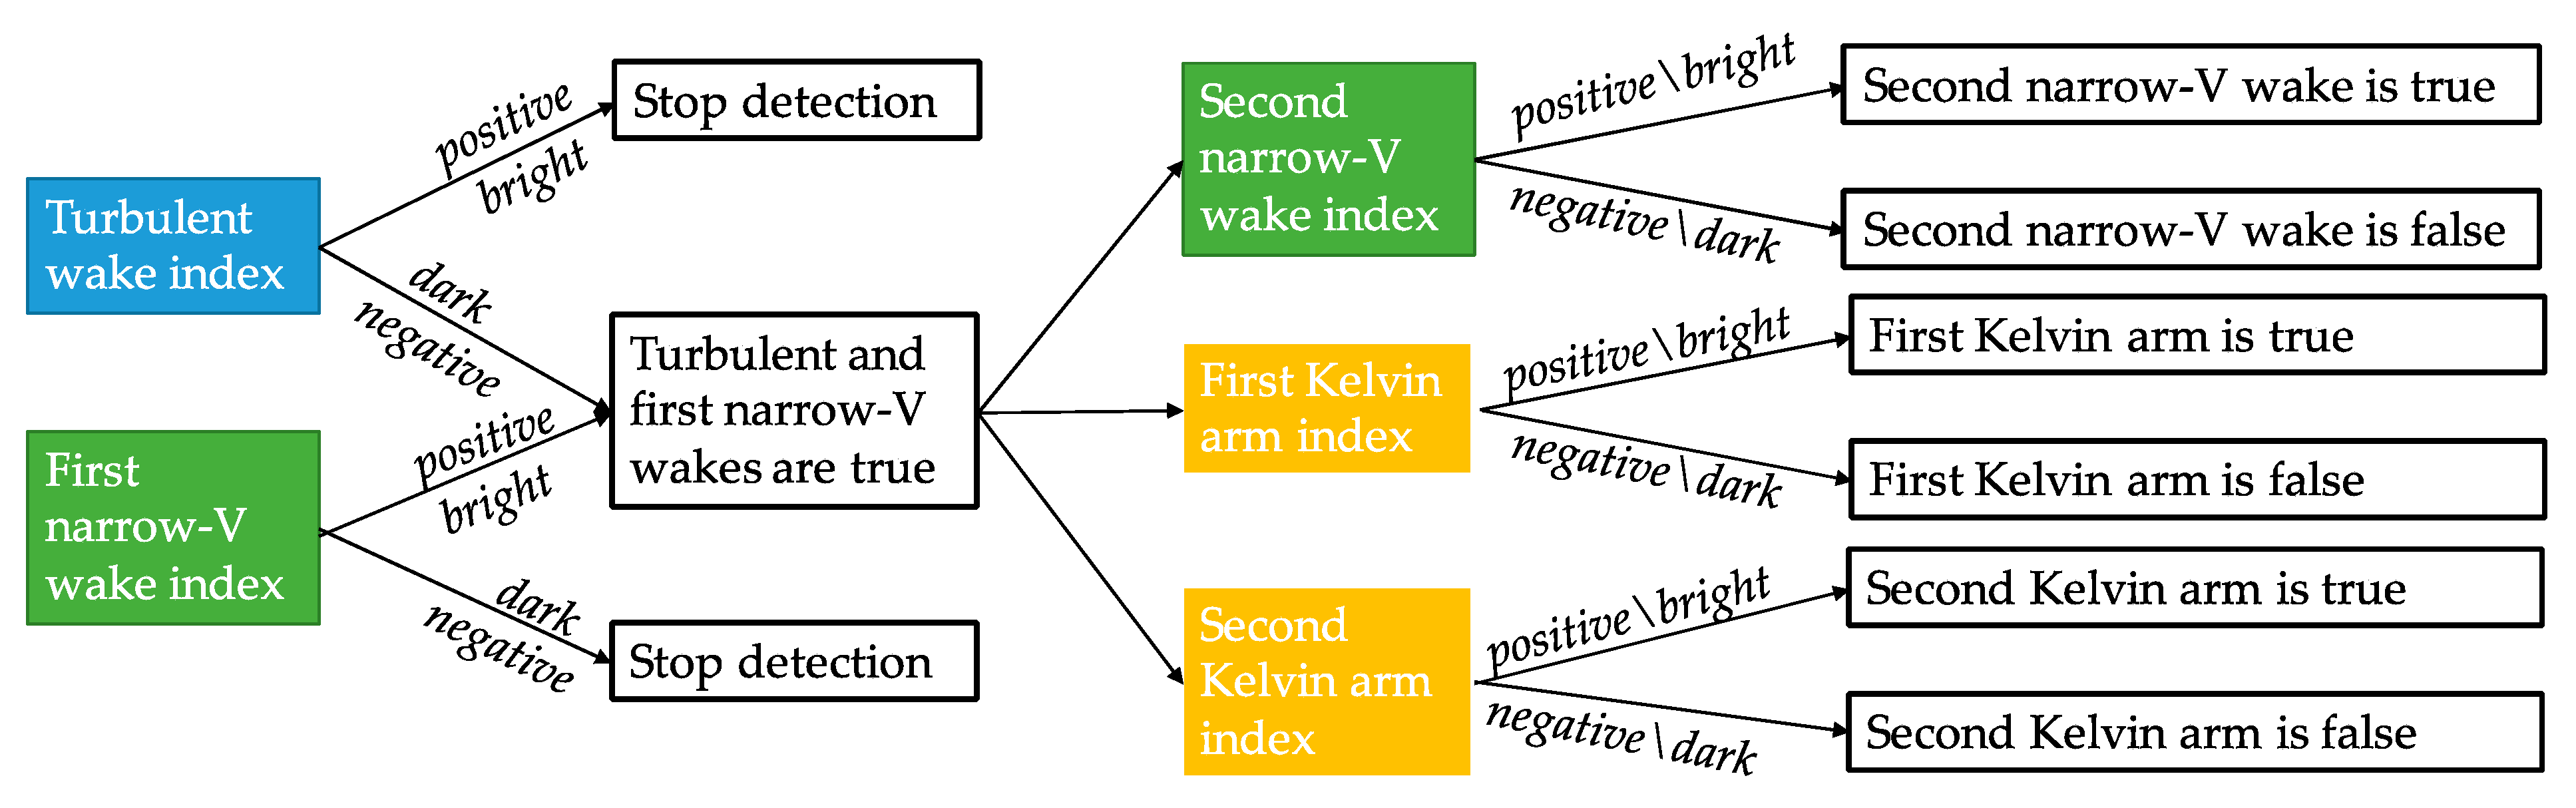
The wake components are classified as true, i.e., really imaged, or false, i.e., due to algorithm detection process, on the basis of the index values, as shown in
Figure 3. It is worth noting that the detection process stops if turbulent wake or the first narrow-V wake or both are classified as false. As declared in Reference [
4], such a case occurs when the ship pixels detection is false. In this sense, the wake detection is a validation of the ship’s presence.
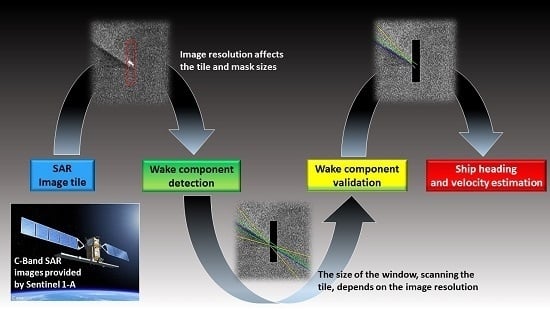
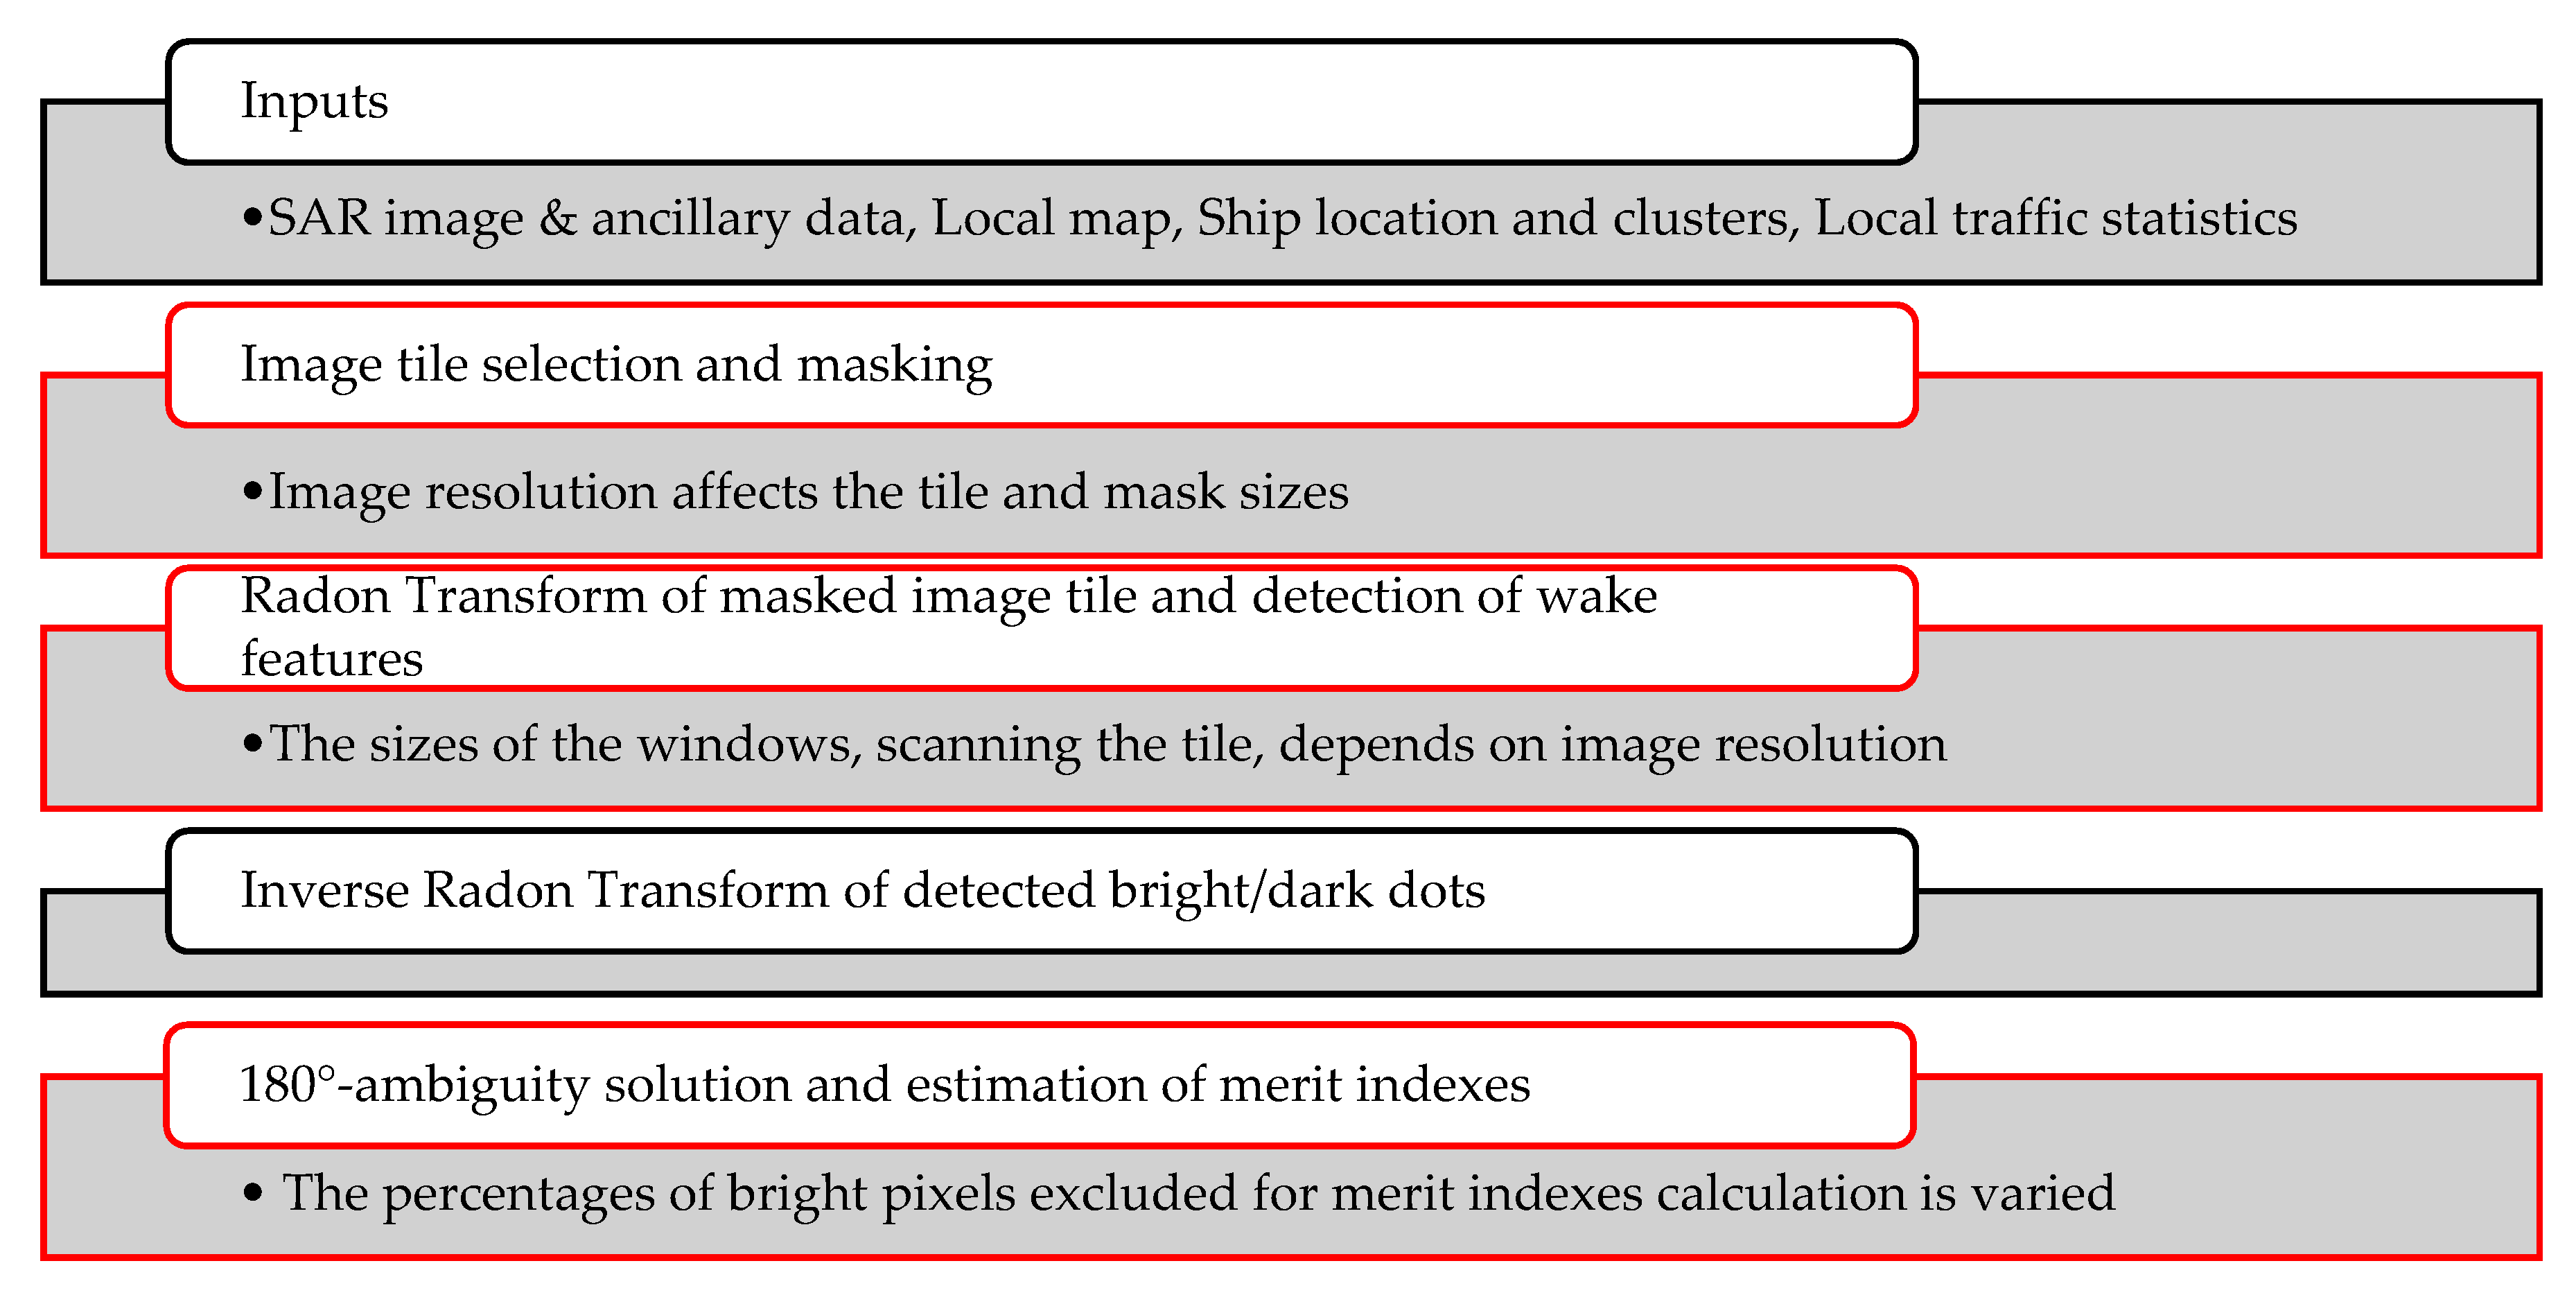
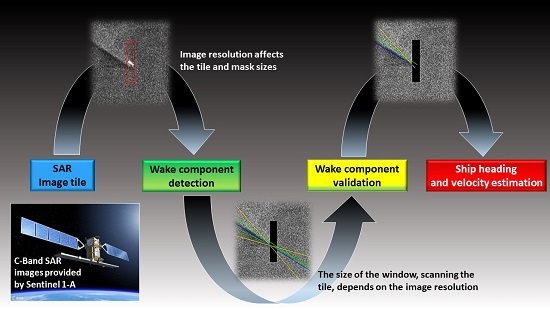
For sake of clarity,
Figure 4 portrays the flow-chart of the algorithm. The steps affected by the different characteristics of Sentinel-1 images are shown in red.
4. Results
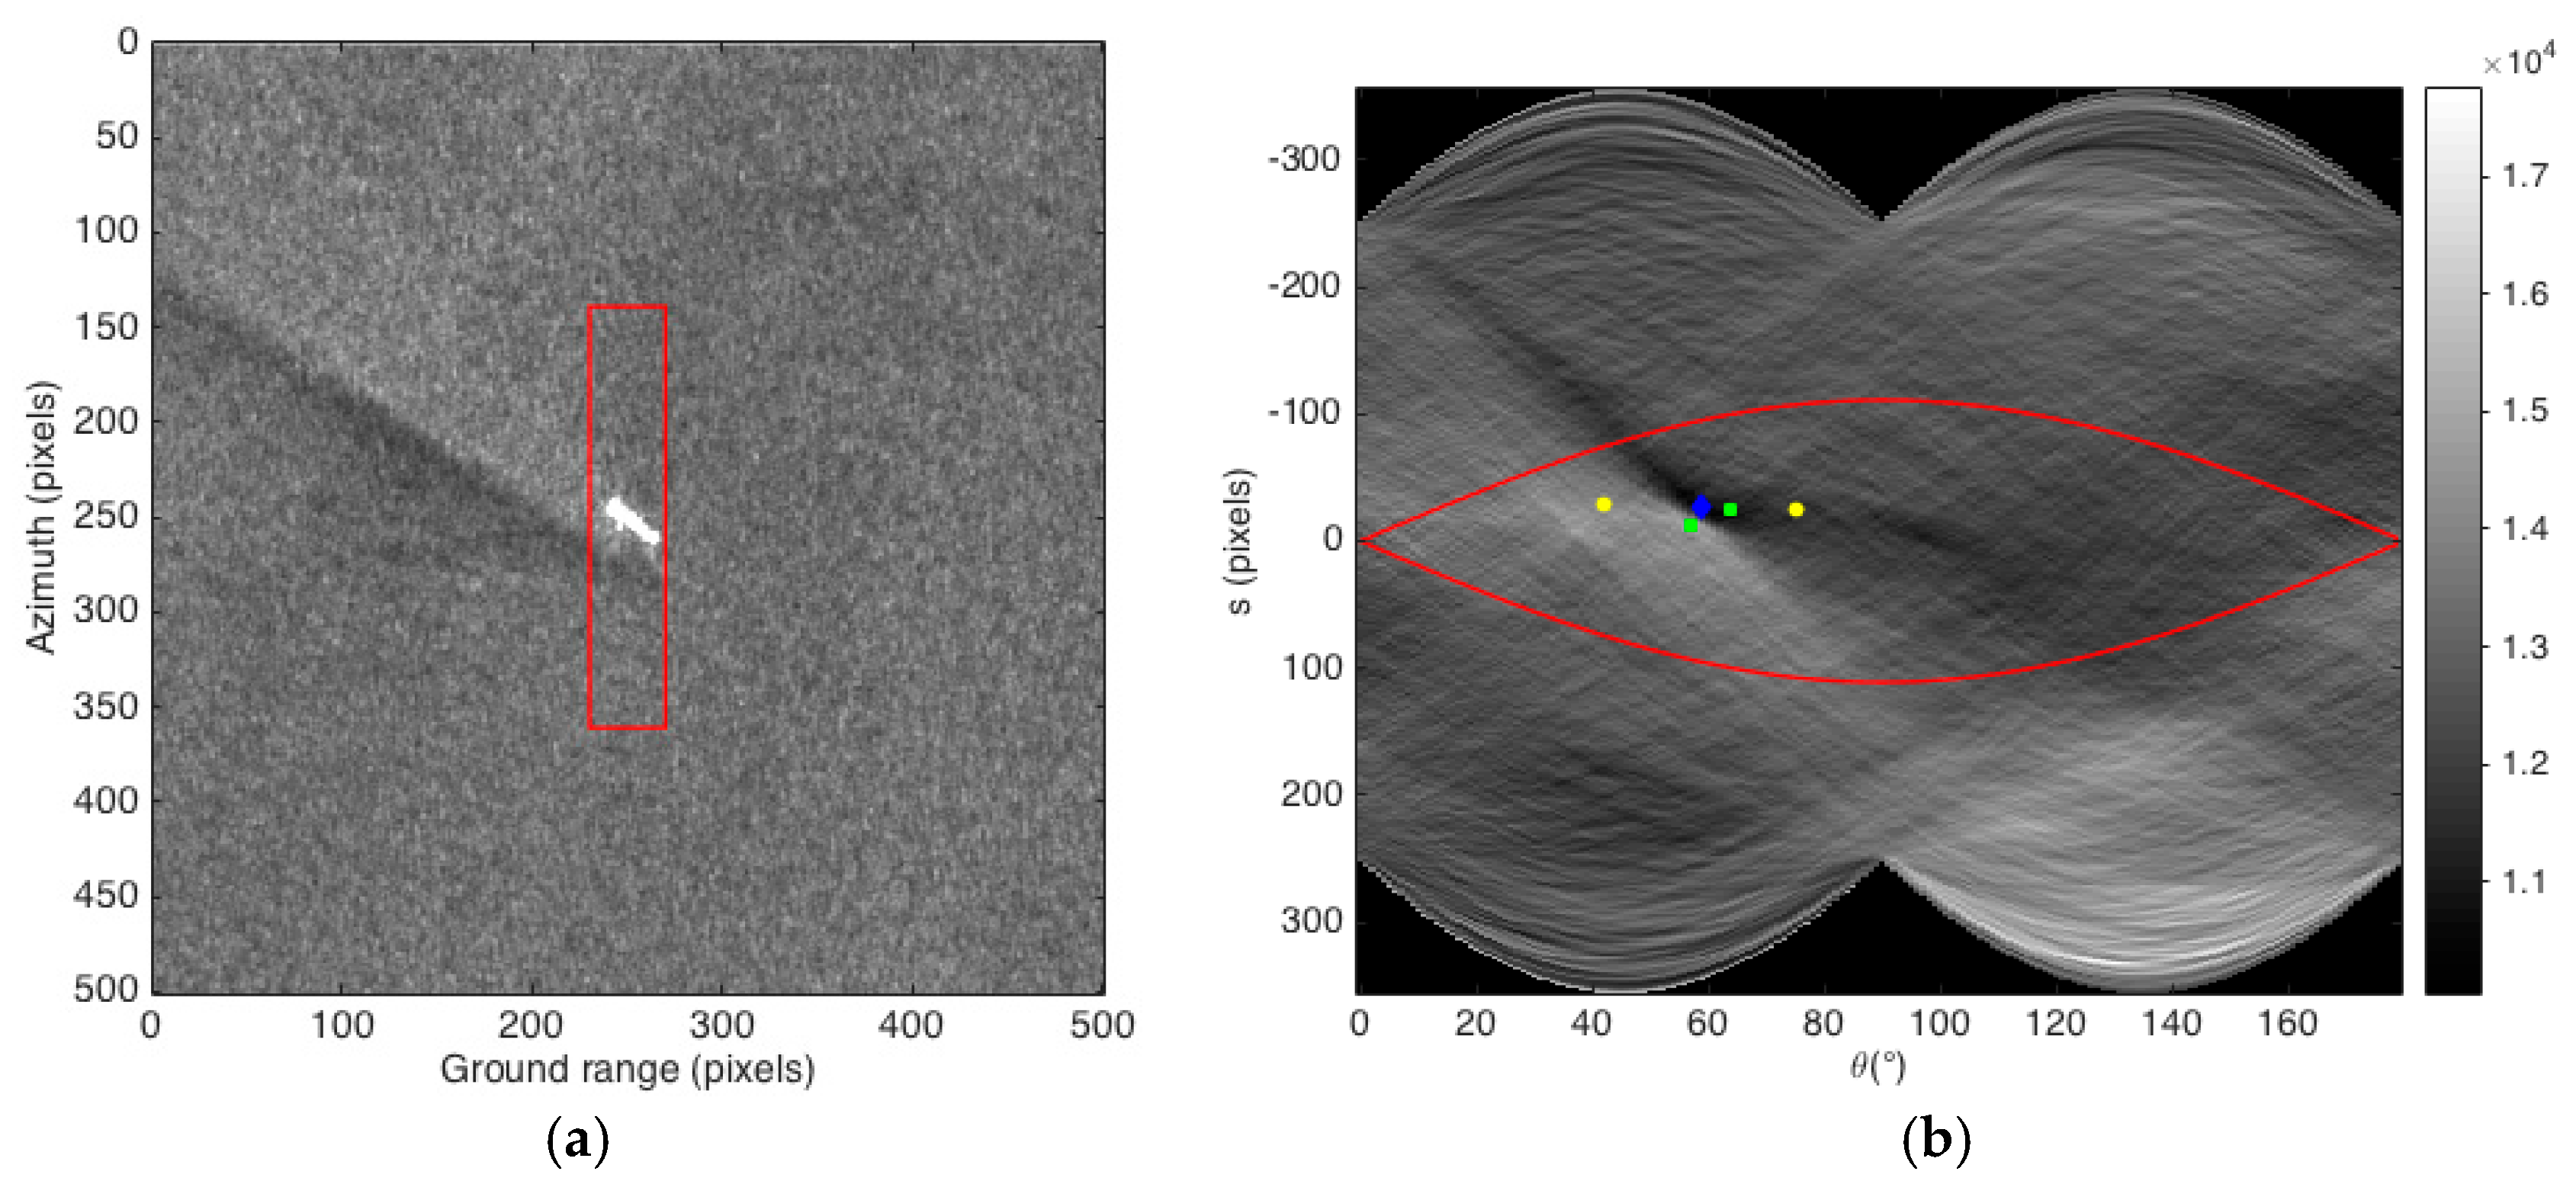
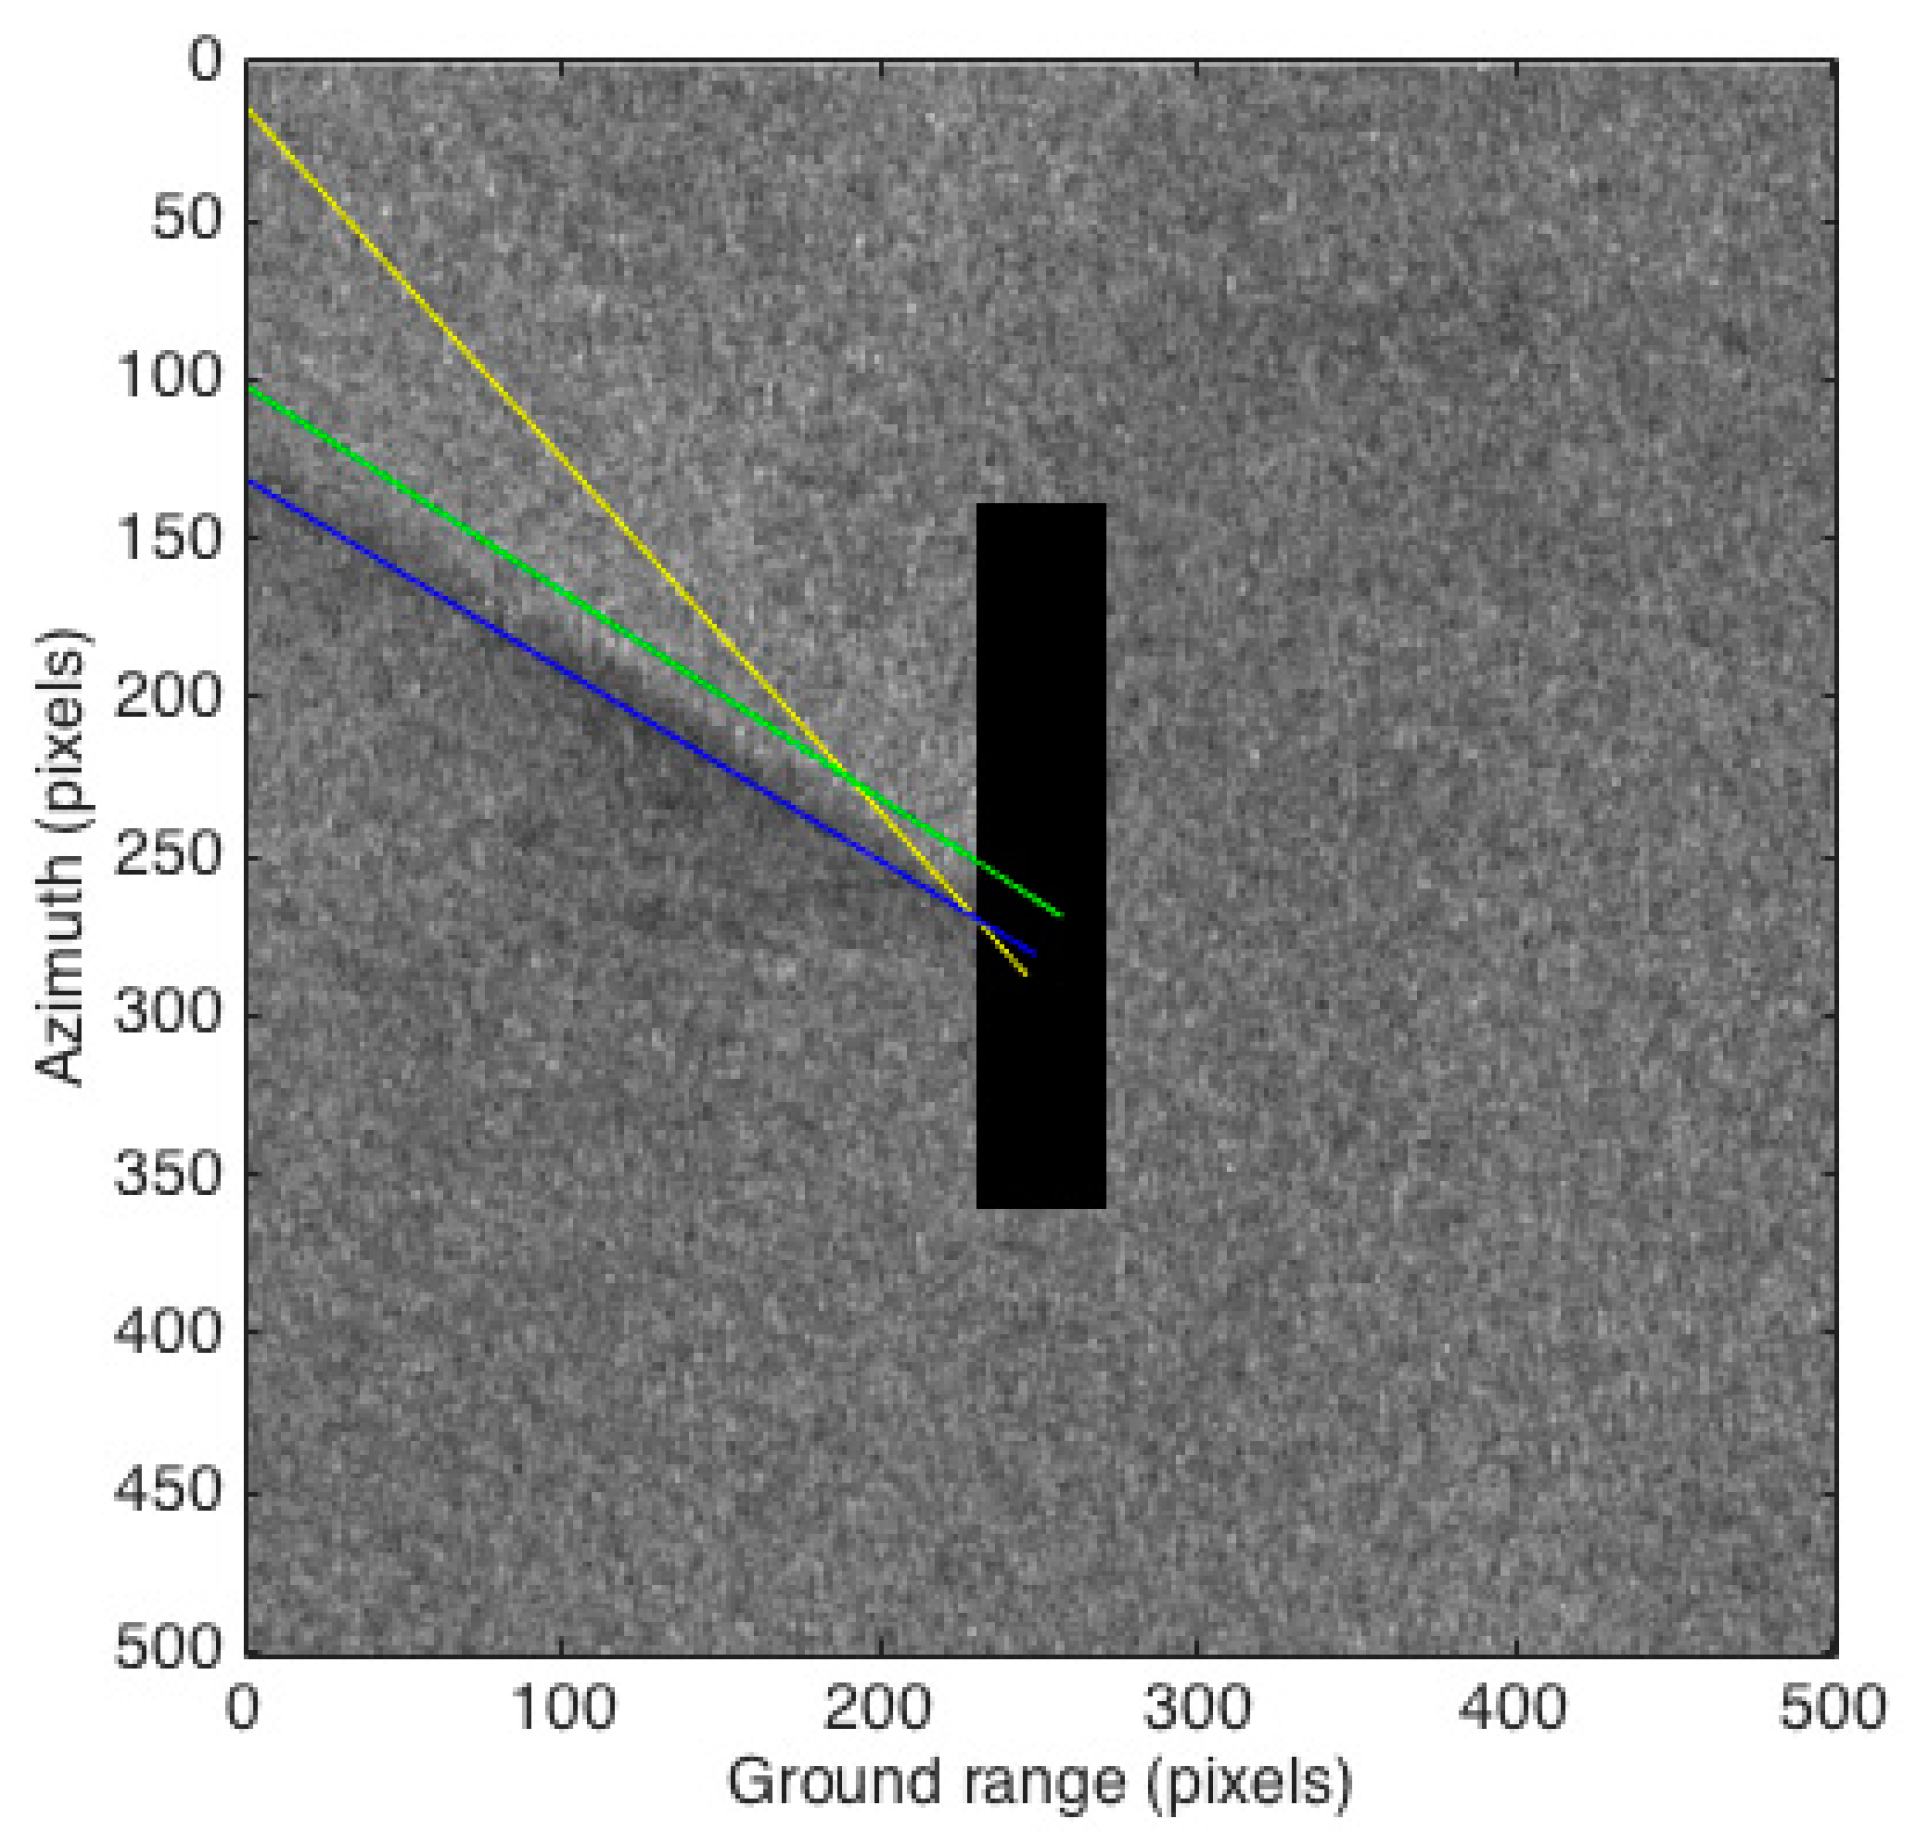
An example of wake features detection and validation is shown in
Figure 5. The wake was imaged by Sentinel-1 on 6 September 2016 (Wake #2 in
Table 2). The image is HH-polarized L1 Ground Range Detected (GRD) Stripmap with 23 m of range and azimuth resolution. The ship wake is partially imaged: only turbulent wake, one narrow-V wake, and one Kelvin arm are distinguishable. Hence, it represents a good case for testing the algorithm performance to detect five possible candidate features and, then, validate them as true.
The image tile is firstly masked (
Figure 5a). The maximum azimuth displacement corresponding to the mask dimension along the azimuth direction is 120 pixels, assuming a maximum ship velocity of 25 knots. The mask size along the range direction is 20 pixels. The Radon Transform is applied to the masked tile and the detection process is only carried out within the two sinusoidal curves shown in
Figure 5b. As the method is conceived, five wake features are detected in the Radon: turbulent wake (blue diamond), two narrow-V wakes (green squares), and two Kelvin arms (yellow dots).
The validation phase is performed in the image domain after the application of the Radon Anti-Transform by means of merit indexes, listed in
Table 1. The turbulent and first narrow-V wake indexes are negative and positive, respectively. Hence, these features are classified as true wake components and the wake detection process can proceed. The second narrow-V wake and the second Kelvin arm are false, whereas the first Kelvin arm is true. The final reconstructed wake is shown in
Figure 6, in which the black rectangle includes the pixels affected by ship return and propeller wakes inside the red rectangle in
Figure 5a and, hence, is not processed by the wake detection algorithm.
To gain an overall view of detection performance, the algorithm was tested over 28 wakes in eight different L1 GRD Stripmap (SM) images, provided by Sentinel-1 over the sea area between Rotterdam and the United Kindgom (
Table 2). Even if the High Level Operation Plan (HLOP) of the Sentinel mission [
34] only plans acquisitions of SM data over limited areas, e.g., the sea around volcanic islands, SM acquisition mode is preferred in the present work since it provides high range and azimuth resolution and, for better comparisons, the results of the X-band Stripmap images [
4] gathered by COSMO/SkyMed [
35] and TerraSAR-X [
36]. The range and azimuth image resolution is 23 m [
37] and the incidence angle is almost below 30°, except for wake #25. With reference to image polarization, 12 wakes are imaged in HH polarization and 16 wakes in VV polarization.
The results show that no missed detection occurred and only in two cases was the detection process stopped since the first narrow-V wake was not imaged. A visual inspection reveals that the remaining wakes show a structure composed of the turbulent wake and one narrow-V wake in 40% of cases, and an additional Kelvin arm is distinguishable in 60% of cases. No complete wake structure is recognized.
Table 3 summarizes the detection performance in terms of:
True Confirmations: imaged features classified as true
True Discards: not-imaged features classified as false
False Confirmations: not-imaged features classified as true
Wrong Positioning: feature locations mismatch the true locations
The features are correctly classified in 78.5% of cases, whereas false confirmations occur in 18.5% of the components, no matter the percentage of discarded bright pixels (T in
Table 1). A deeper investigation reveals that the false confirmations mainly affect the Kelvin arms, with only three among the 25 false detections related to narrow-V wakes.
In only one case (wake #1 of
Table 2) were the wake features wrongly positioned. In detail, the wake was composed by turbulent wake, a weak narrow-V wake at the edge of the turbulent wake, and a very bright Kelvin arm (
Figure 7a). The reconstructed wake is shown in
Figure 7b, in which the real Kelvin arm that was detected as the first narrow-V wake. This is due to the detection algorithm in the Radon domain, which identifies the pair turbulent-first narrow-V wakes on the basis of the difference of intensity values in the scanning window. In this case, the difference of the Kelvin arm’s intensity and its surrounding pixels is larger than the difference between the turbulent wake and the weak narrow-V wake. The positive outcome of such a test case is that the method is robust with respect to the presence of the second ship.
Finally, the results are compared with the algorithm performance on X-band images [
4]. In the X-band case, among the 170 wake features (34 wakes), 25 false confirmations occurred for the Kelvin arms, whereas only two false confirmations were relative to narrow-V wakes. Hence, a total false confirmations rate of 15.8% was reached and no significant differences arose with performance in C-band. Furthermore, in Reference [
4], no false confirmations occurred thanks to the strategy of confirming only Kelvin arms when the index is larger than 0.33. The same strategy on C-band images yielded a negligible false confirmation rate of 1.5%, with only two false Kelvin arms classified as true.
5. Conclusions
A technique for ship wake detection has been recently proposed and applied to X-band SAR images provided by COSMO/SkyMed and TerraSAR-X. The approach showed that the vast majority of wake features are correctly detected and validated in critical situations. The main criticality concerned the false confirmation of Kelvin cusps, and an empirical criterion was suggested to strongly limit this phenomenon.
In this paper, to assess the method’s robustness with respect to wake appearance in C-band images, the algorithm was applied over 28 wakes imaged by the Sentinel-1 mission with different polarizations and incidence angles. The detection process was properly modified in order to manage the different radar frequencies and resolutions. A visual inspection revealed that the wakes under investigation showed a structure composed of the turbulent wake and one narrow-V wake in 40% of cases, an additional Kelvin arm was distinguishable in 60% of cases, and the complete wake structure was never shown.
The detection performance was analyzed in order to distinguish between true confirmations, i.e., imaged features classified as true; true discards, i.e., not-imaged features classified as false; false confirmations, i.e., not-imaged features classified as true; and wrong positioning, i.e., feature locations mismatched with the true locations. The results showed that the features were correctly classified in 78.5% of cases, whereas false confirmations occurred in 18.5% of the components. A deeper investigation revealed that the false confirmations affect mainly the Kelvin arms, with only three among the 25 false detections related to narrow-V wakes. In only one case were the wake features wrongly positioned, due to an unusually bright Kelvin arm.
Finally, the results were compared with the algorithm performance on X-band images, showing that no significant differences arose. In fact, the total false confirmations rate of 15.8% reached on X-band images was comparable with the 18.5% of C-band images. and the strategy of confirming only Kelvin arms when the index is larger than 0.33 yielded a negligible false confirmation rate of 1.5%, with only two false Kelvin arms classified as true.
An additional result concerned the application of the proposed technique as a validation of ship presence. In fact, the algorithm correctly validates the visibility the wake and the detection is never stopped when the ship is present. Hence, future planned activities could further investigate the performance of wake detection without applying the preliminary pre-screening for ship detection, taking into account the computation throughput.


