Article

An Evaluation of Four MODIS Collection 6 Aerosol Products in a Humid Subtropical Region

1
School of Resources and Environmental Engineering, Wuhan University of Technology, Wuhan 430070, China
2
Department of Geography and Resource Management, The Chinese University of Hong Kong, Shatin, NT, Hong Kong, China
*
Author to whom correspondence should be addressed.
Remote Sens. 2017, 9(11), 1173; https://doi.org/10.3390/rs9111173
Submission received: 20 October 2017 / Revised: 8 November 2017 / Accepted: 13 November 2017 / Published: 16 November 2017
(This article belongs to the Special Issue Aerosol Remote Sensing)

Abstract

:
Moderate resolution imaging spectroradiometer (MODIS) aerosol optical depth (AOD) products have been widely used to characterize the temporal variations and spatial distributions of atmospheric aerosols. In the present study, we evaluate the performance of four Terra and Aqua MODIS Collection 6 (C6) quality assured AOD products in the Pearl River Delta (PRD) region, a humid subtropical region. The 10 km AOD products retrieved by the Dark Target (DT) and Deep Blue (DB) algorithms, the merged DT/DB (DTDB) 10 km product, and the DT 3 km AOD product were obtained for 2006–2015. These products were compared with Aerosol Robotic Network (AERONET) observations, and with each other. The Terra- and Aqua-derived AODs are quantitatively similar. However, there are significant differences among the four AOD products. The DT 10 km product correlates more closely with AERONET AOD observations than does the DB 10 km product. The latter tends to underestimate the AOD, whereas the former typically overestimates it for highly urbanized areas. The DTDB 10 km product is mainly derived from the DT 10 km product; it does not provide a gap-filled data set, because valid DB 10 km retrievals are not included in the merged product even when DT 10 km retrievals are unavailable. Therefore, the DT/DB merging protocol should be improved. The DT 3 km AOD product closely mimics the DT 10 km product; however, it contains fewer data than the DT 10 km product over water-contaminated areas. In addition, although the quality assured AOD products are recommended for use in quantitative applications by the MODIS aerosol science team, the sampling frequency of these products is generally lower than 25%. Thus, the sampling issues of these products should be considered in humid subtropical areas.

Graphical Abstract

1. Introduction

Aerosols are tiny particles suspended in the atmosphere. Naturally and anthropogenically generated aerosols have gained increasing attention because of their influences on climate and human health [1,2]. Recent advancements in satellite remote sensing of aerosols have enabled the quantitative analysis of aerosol properties. A variety of sensors that are well-suited for aerosol studies have been launched, which enable aerosol properties to be characterized at local, regional, and global scales [3,4].
Moderate resolution imaging spectroradiometer (MODIS) instruments on board Terra and Aqua satellites provide daily global records of aerosol properties [5]. Because the signal received by the sensor is composed of contributions from both the atmosphere and the surface, several algorithms have been developed to retrieve aerosol properties and produce aerosol products from MODIS. Over land, the operational MODIS aerosol products are generated using the Dark Target (DT) and Deep Blue (DB) algorithms; both of these algorithms are continuously being updated [6,7]. Current operational MODIS aerosol products are grouped into Collection 6 (C6), with a standard resolution of 10 km. The MODIS C6 aerosol data sets also include a 3 km aerosol product retrieved by the DT algorithm, and a merged DT/DB product with 10-km resolution [7].
The ability of sparsely located ground monitoring stations to address the distributions and changes of regional particle pollutants is limited. Because satellite-derived aerosol optical depth (AOD) is directly related to particle mass loading, many researchers have attempted to use satellite-derived AOD products to supplement ground-based monitoring of particulate matter concentrations [8,9,10,11,12]. MODIS AOD products have been widely used in studies at global and regional scales, because they have been extensively validated and are readily accessible [13,14].
Although several studies have been conducted to compare and evaluate different aspects of MODIS C6 AOD products, these studies have typically focused on a subset of MODIS data and some of them have only used observations obtained during a short period of time [15,16,17,18,19]. In addition, most of these studies have only assessed the accuracy of AOD retrievals, whereas the sampling issues of different products have typically been ignored [20]. Hence, it is necessary to conduct detailed analyses and systematic comparisons of the four MODIS C6 AOD products over a long period.
In the present study, we evaluated the performance of Terra and Aqua MODIS C6 aerosol products for the Pearl River Delta (PRD) region, a humid subtropical region. We comprehensively compared MODIS C6 DT 10 km, DT 3 km, DB 10 km, and merged DT/DB 10 km AOD data sets with AERONET measurements and against each other. The complex topography and emissions of the PRD, and its unique climatological conditions make the region an interesting study area for atmospheric research [21]. Therefore, a comparison of different MODIS C6 AOD products in this region will provide a reference for MODIS data users to understand the characteristics of different data sets. In addition, identifying the strengths and weaknesses of different products will assist users in choosing the most appropriate data set for their specific applications.

2. Materials and Methods
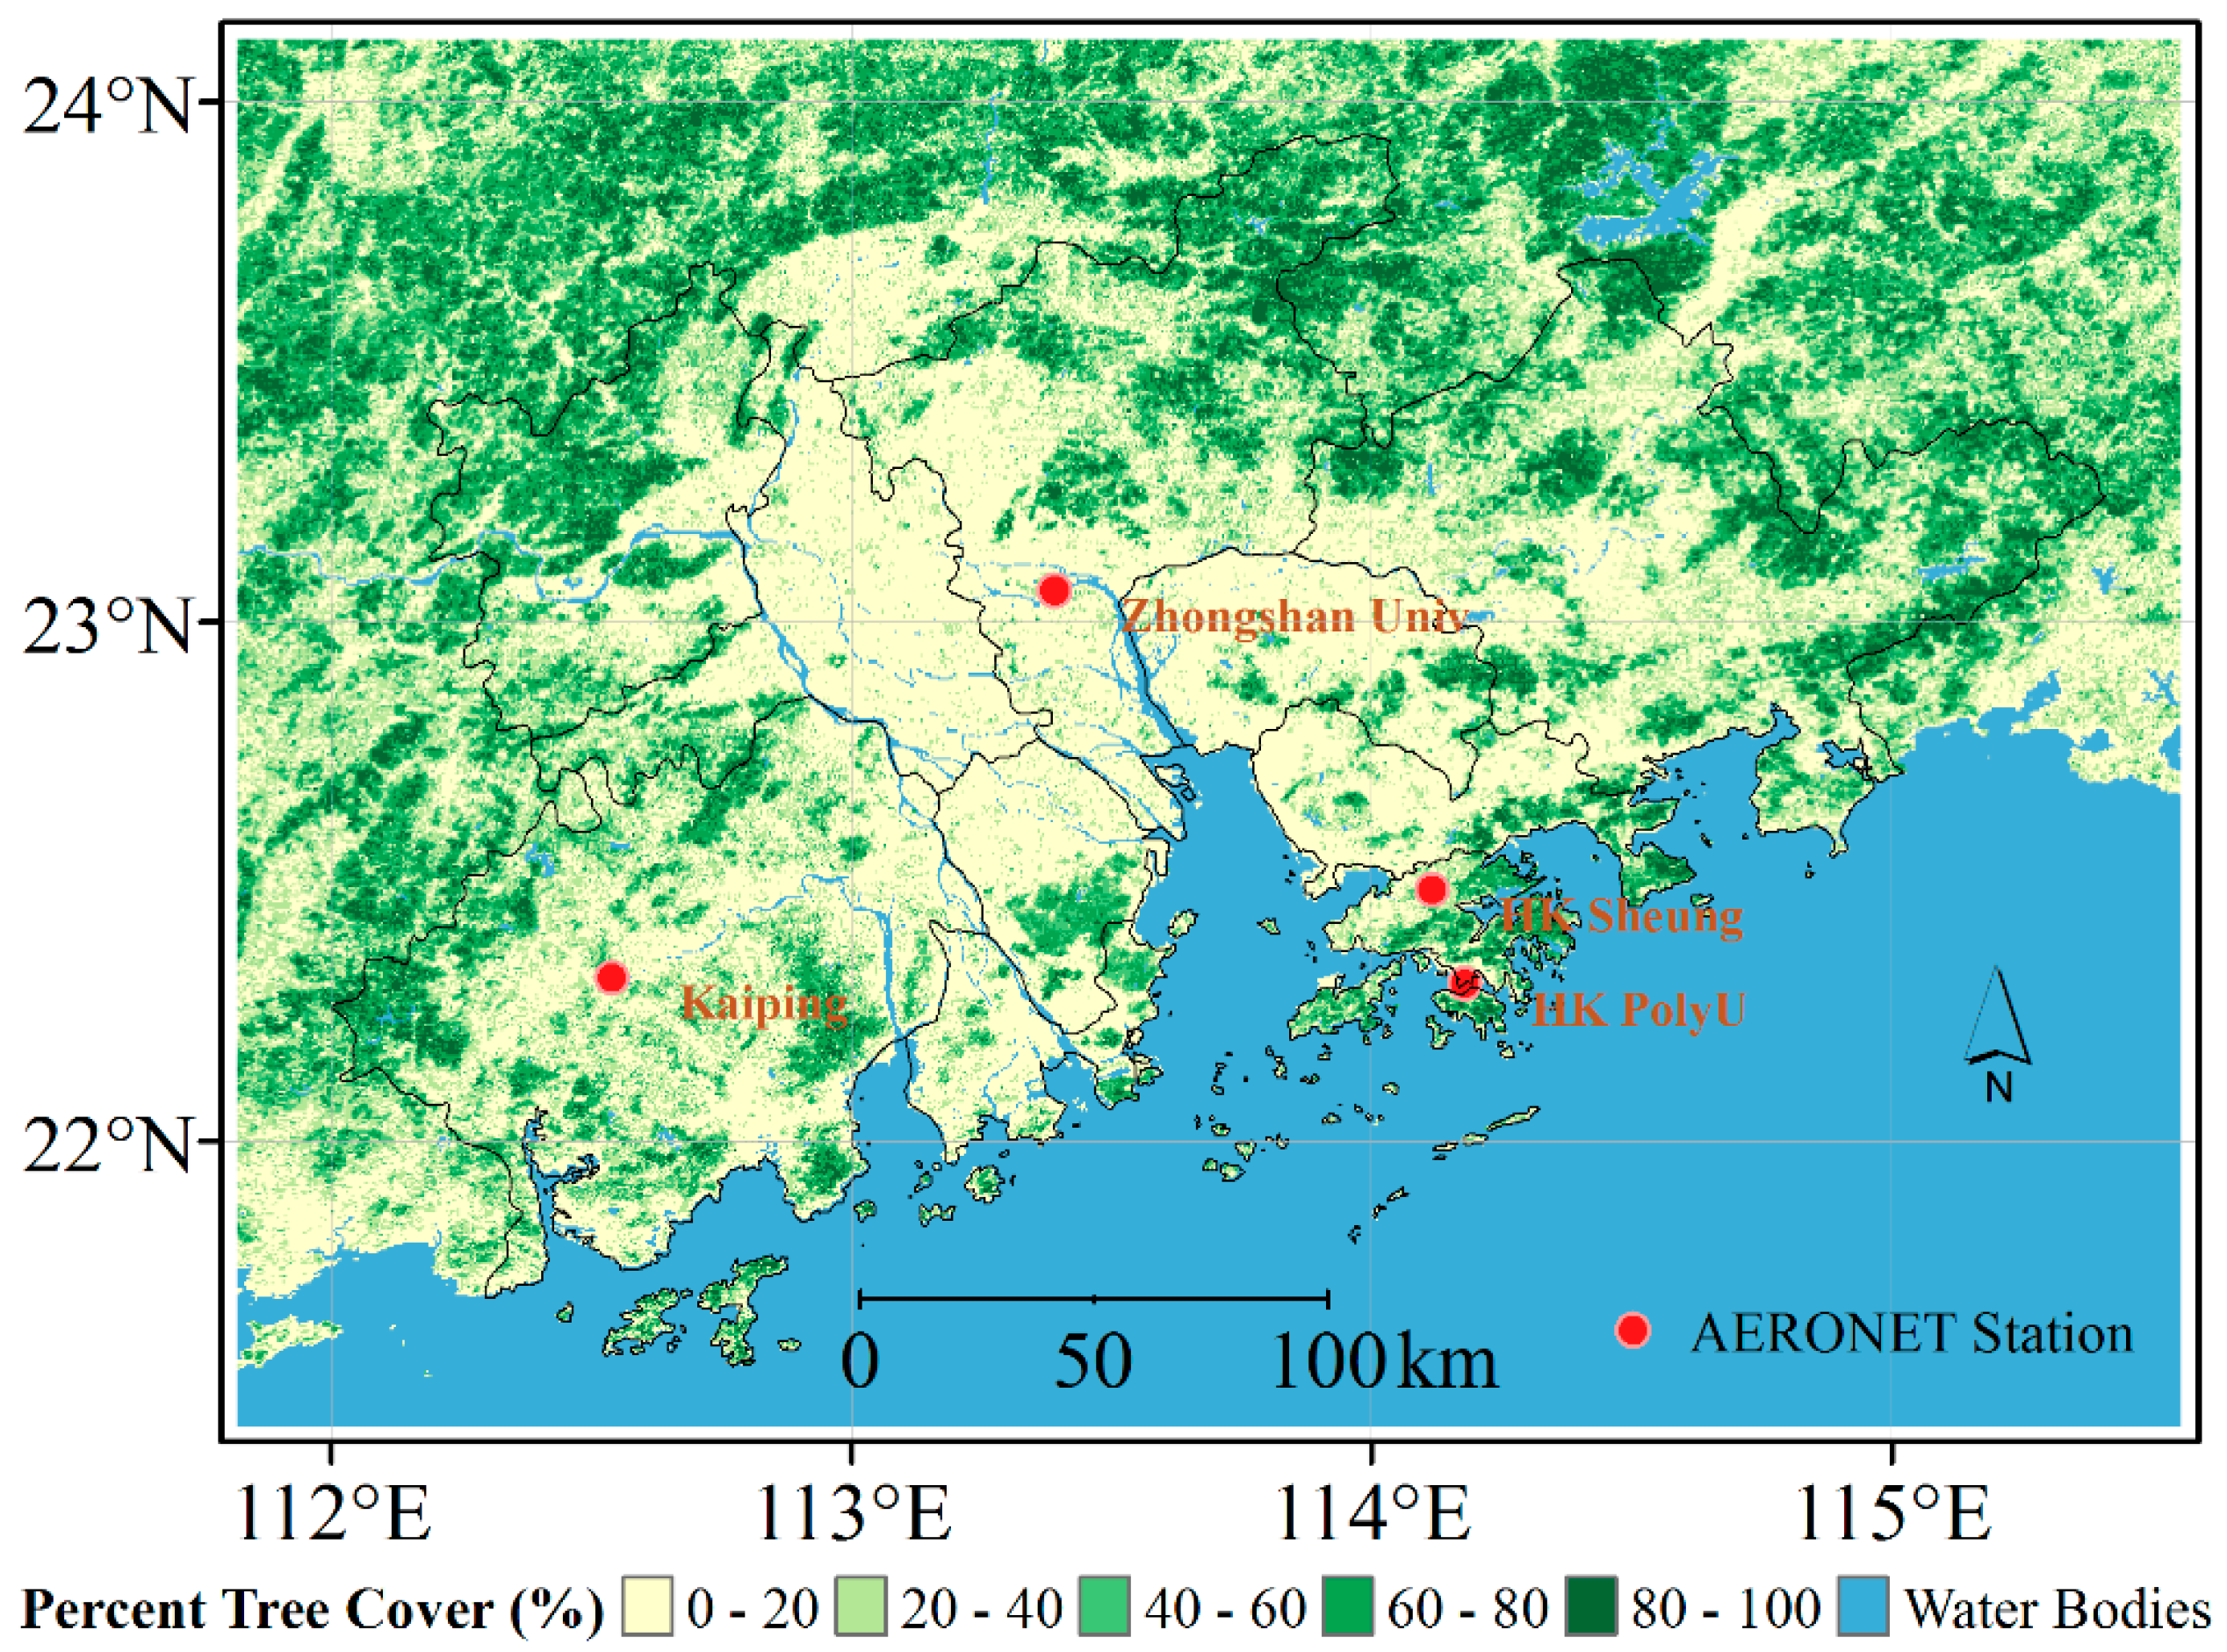
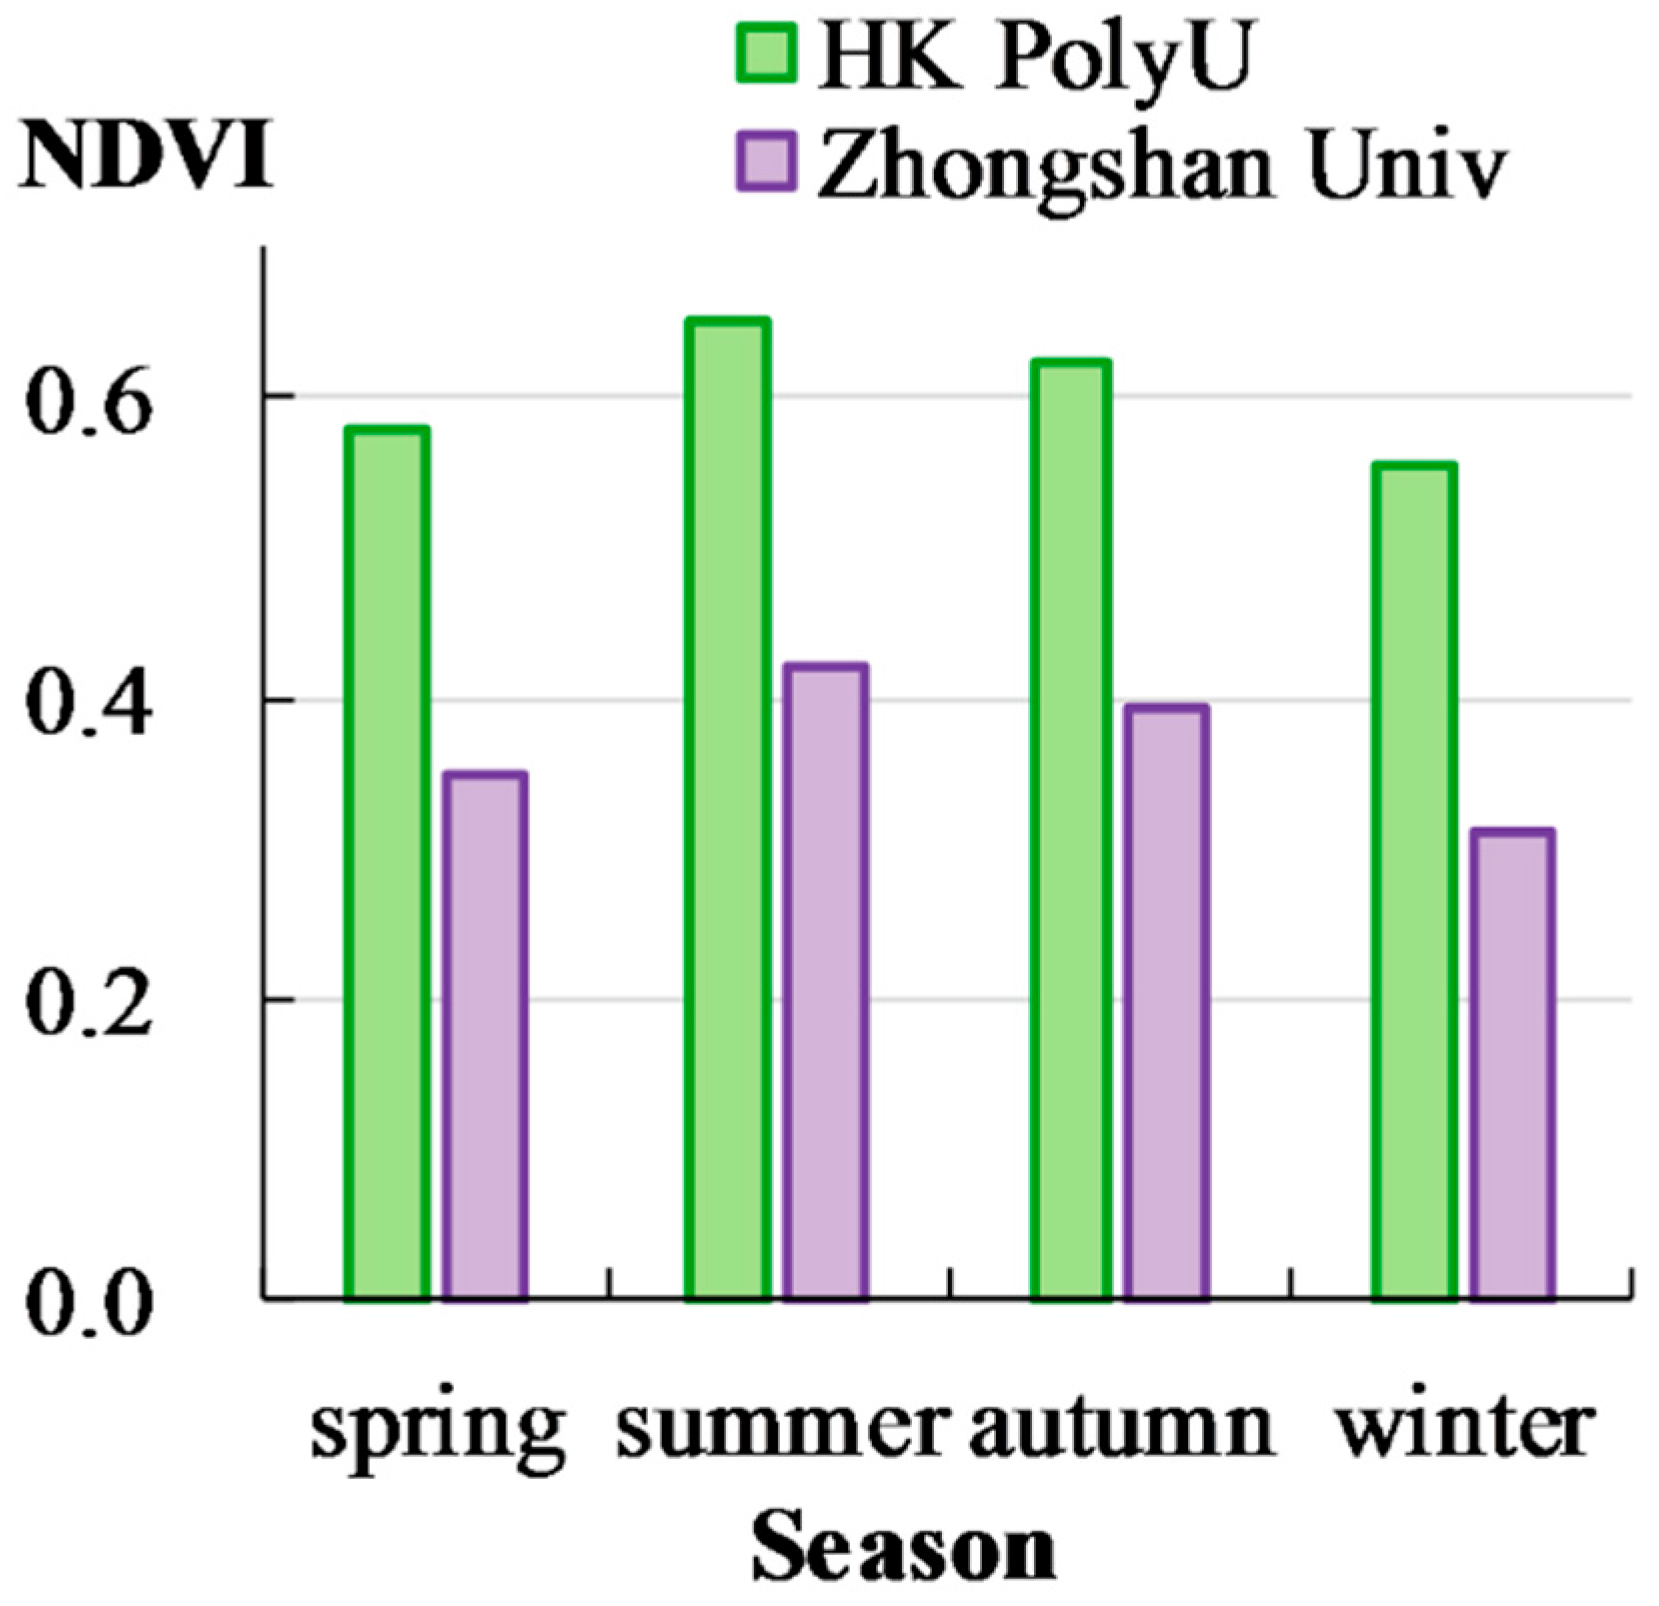
2.1. Study Area

The PRD region is located in southern China, and has a subtropical climate. The terrain of this region is complex; it is surrounded by mountains to the east, west, and north, and its south side is adjacent to the South China Sea (Figure 1). The complex landscape can result in substantial spatial variations in pollutant concentrations in this region; the hilly topography and jagged coastline can induce complex wind fields and thus influence the transport of air pollutants [22]. The PRD region is one of the most urbanized and industrialized regions in China, and contains several densely populated cities. Rapid economic growth has resulted in high aerosol concentrations and poor visibility [23]. Long-term air-quality data indicate that particle concentrations in the PRD region have remained at high levels, and that high aerosol concentrations are the major cause of low visibility [24,25]. Because of rapid economic development, unique geographical and climatological conditions, and complex regional air pollution problems, the PRD region is of special interest to atmospheric researchers [21,23].

2.2. MODIS Data Sets

Currently, there are two MODIS instruments on board the Terra and Aqua satellites, which cross the equator from north to south at about 10:30 (Terra), and from south to north at about 13:30 (Aqua) local solar time. The DT and DB algorithms were designed to retrieve aerosol properties from MODIS data over land. The DT algorithm utilizes the empirical relationship between the surface reflectances in the shortwave infrared and visible channels for visually ‘dark’ regions [5,7,26]. The DB algorithm is based on a surface reflectance database generated using the minimum reflectivity technique [6,27]. The DT algorithm is suitable for vegetated and dark-soiled land, whereas the DB algorithm was originally developed for retrieving aerosol properties for bright desert and urban areas [7]. Both the DT and DB algorithms are used to generate the operational MODIS aerosol products; and resulting data sets are typically provided at a spatial resolution of 10 km [6,7,28]. In order to provide a data set with reduced-gap coverage, a simple empirical approach is used to merge the products obtained using the DT and DB algorithms. This approach is based on quality assurance (QA) checks and a normalized difference vegetation index (NDVI) climatology database; only pixels with high retrieval confidence are retained [18]. The merged DT/DB product (DTDB) is included in the MODIS C6 release, and the spatial resolution of the merged aerosol product is 10 km. Although the 10 km product is useful for determining global aerosol climatology, it is too coarse to resolve local aerosol variability and there is a significant need for a finer-resolution product [29]. Therefore, a 3 km product was introduced as part of MODIS C6 [7,30]. The DT algorithm was used to derive the 3 km product. The only differences between the 3 km and the 10 km retrievals were the ways in which the pixels were grouped and selected [7,30].
In the present study, Terra and Aqua MODIS C6 Level 2 aerosol products (MOD/MYD04_L2 and MOD/MYD04_3K) from 1 January 2006 to 31 December 2015 were obtained from the Level 1 and Atmosphere Archive and Distribution System (LAADS) Distributed Active Archive Center (DAAC) at NASA’s Goddard Space Flight Center in Greenbelt, Maryland, United States. The DT, DB, and DTDB 10 km AOD products and the DT 3 km AOD products, were extracted. Only high-quality AOD retrievals (QA = 3 for DT, QA = 2 or 3 for DB) were utilized. Multiyear mean AOD distributions were calculated using a straightforward averaging of all of the retrievals. A minimum sampling frequency of 5% for each pixel was applied to exclude poorly sampled pixels.
In addition, Terra and Aqua MODIS-derived monthly vegetation indices (MOD/MYD13C2) for 2006–2015 were downloaded from LAADS. The seasonal mean NDVI values were calculated by averaging the Terra and Aqua MODIS-derived monthly NDVI products.

2.3. AERONET Data and Matchup Methodology

AERONET is a global network established for characterizing aerosol optical properties using stable and well-calibrated sun photometers. The typical uncertainty of AERONET AOD data is within ±0.01 for longer wavelengths (>440 nm) and ±0.02 for shorter wavelengths [31]. Therefore, AERONET measurements provide a standardized high-quality data set for validating satellite AOD retrievals. In the present study, available Level 2 AOD products observed at four AERONET stations (Figure 1) across the PRD region were used to validate the MODIS C6 AOD products. Two of these stations, “HK PolyU” and “Zhongshan Univ”, are located in urban areas. One station, “Kaiping”, is located in a suburban area, and station “HK Sheung” is a rural site. Details of the four AERONET stations used in this study are shown in Table 1.
To validate MODIS AOD, coincident satellite–ground AOD pairs were obtained by spatially averaging satellite data near to the AERONET station, and temporally averaging AERONET data around the satellite overpass time [32]. The AERONET AOD at 550 nm was obtained by interpolating the measured AOD at 440, 500, 670, and 870 nm based on a quadratic fit on a log–log scale [33,34]. Following a widely used matchup protocol, a window of 3 × 3 pixels centered on the AERONET site was chosen to match a one-hour AERONET data segment centered on the time of the satellite overpass. In addition, a minimum of five collocations were required for each AERONET site.

3. Results

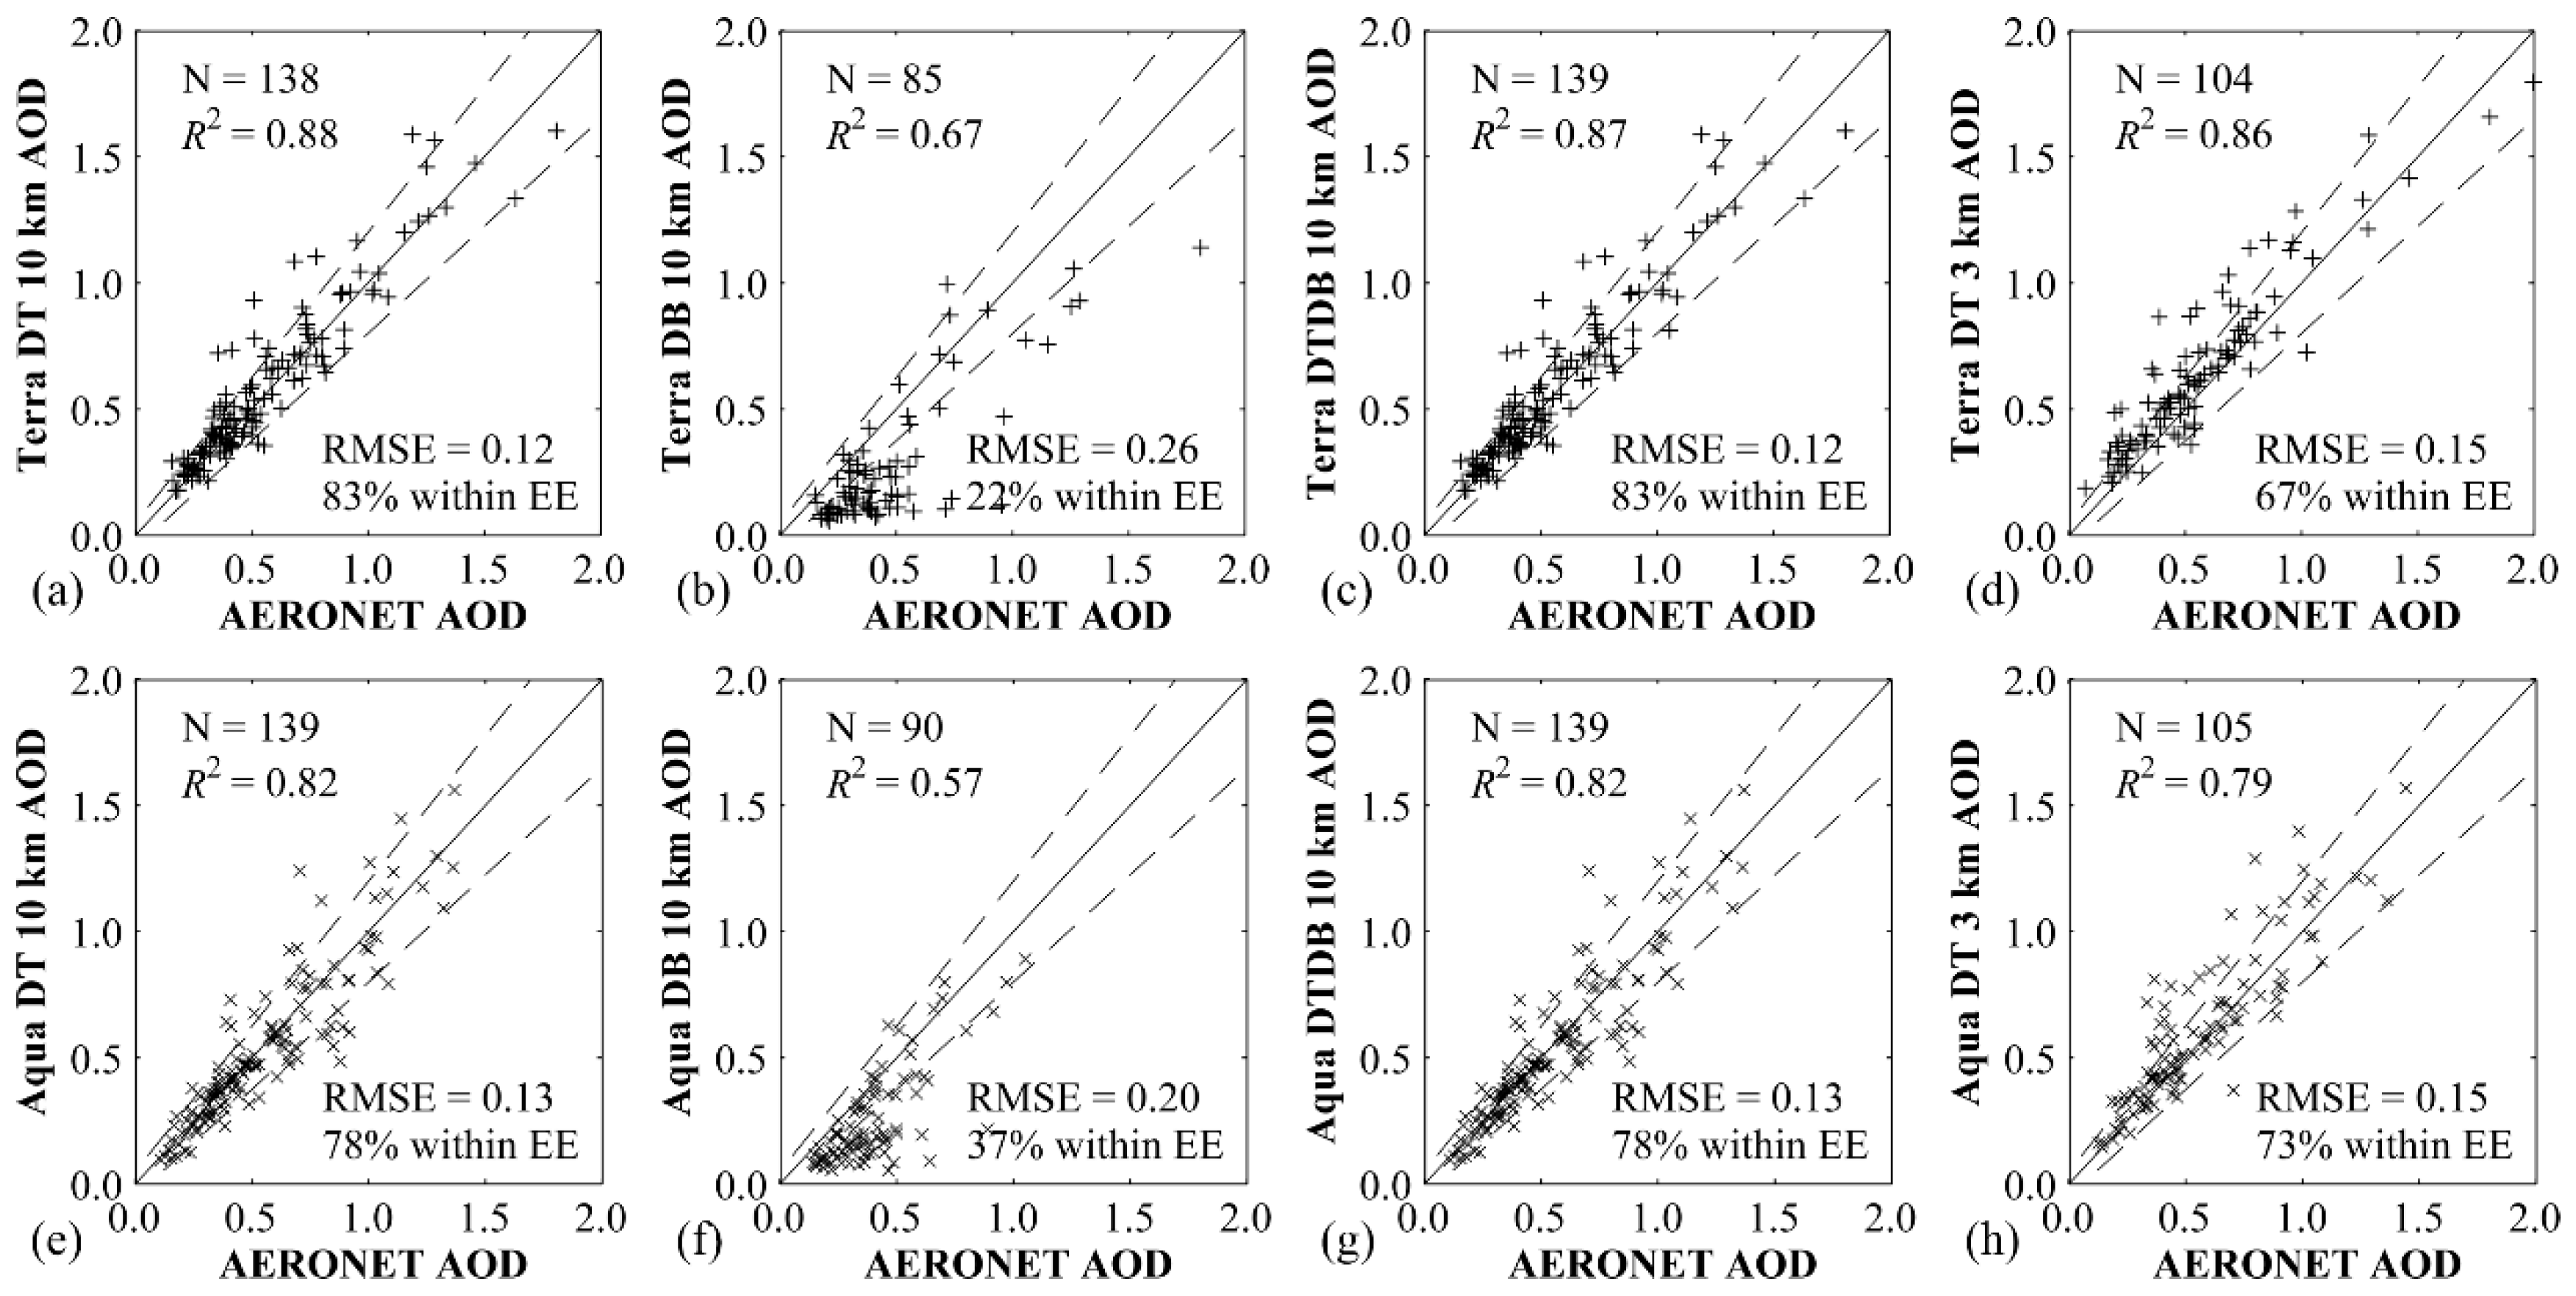
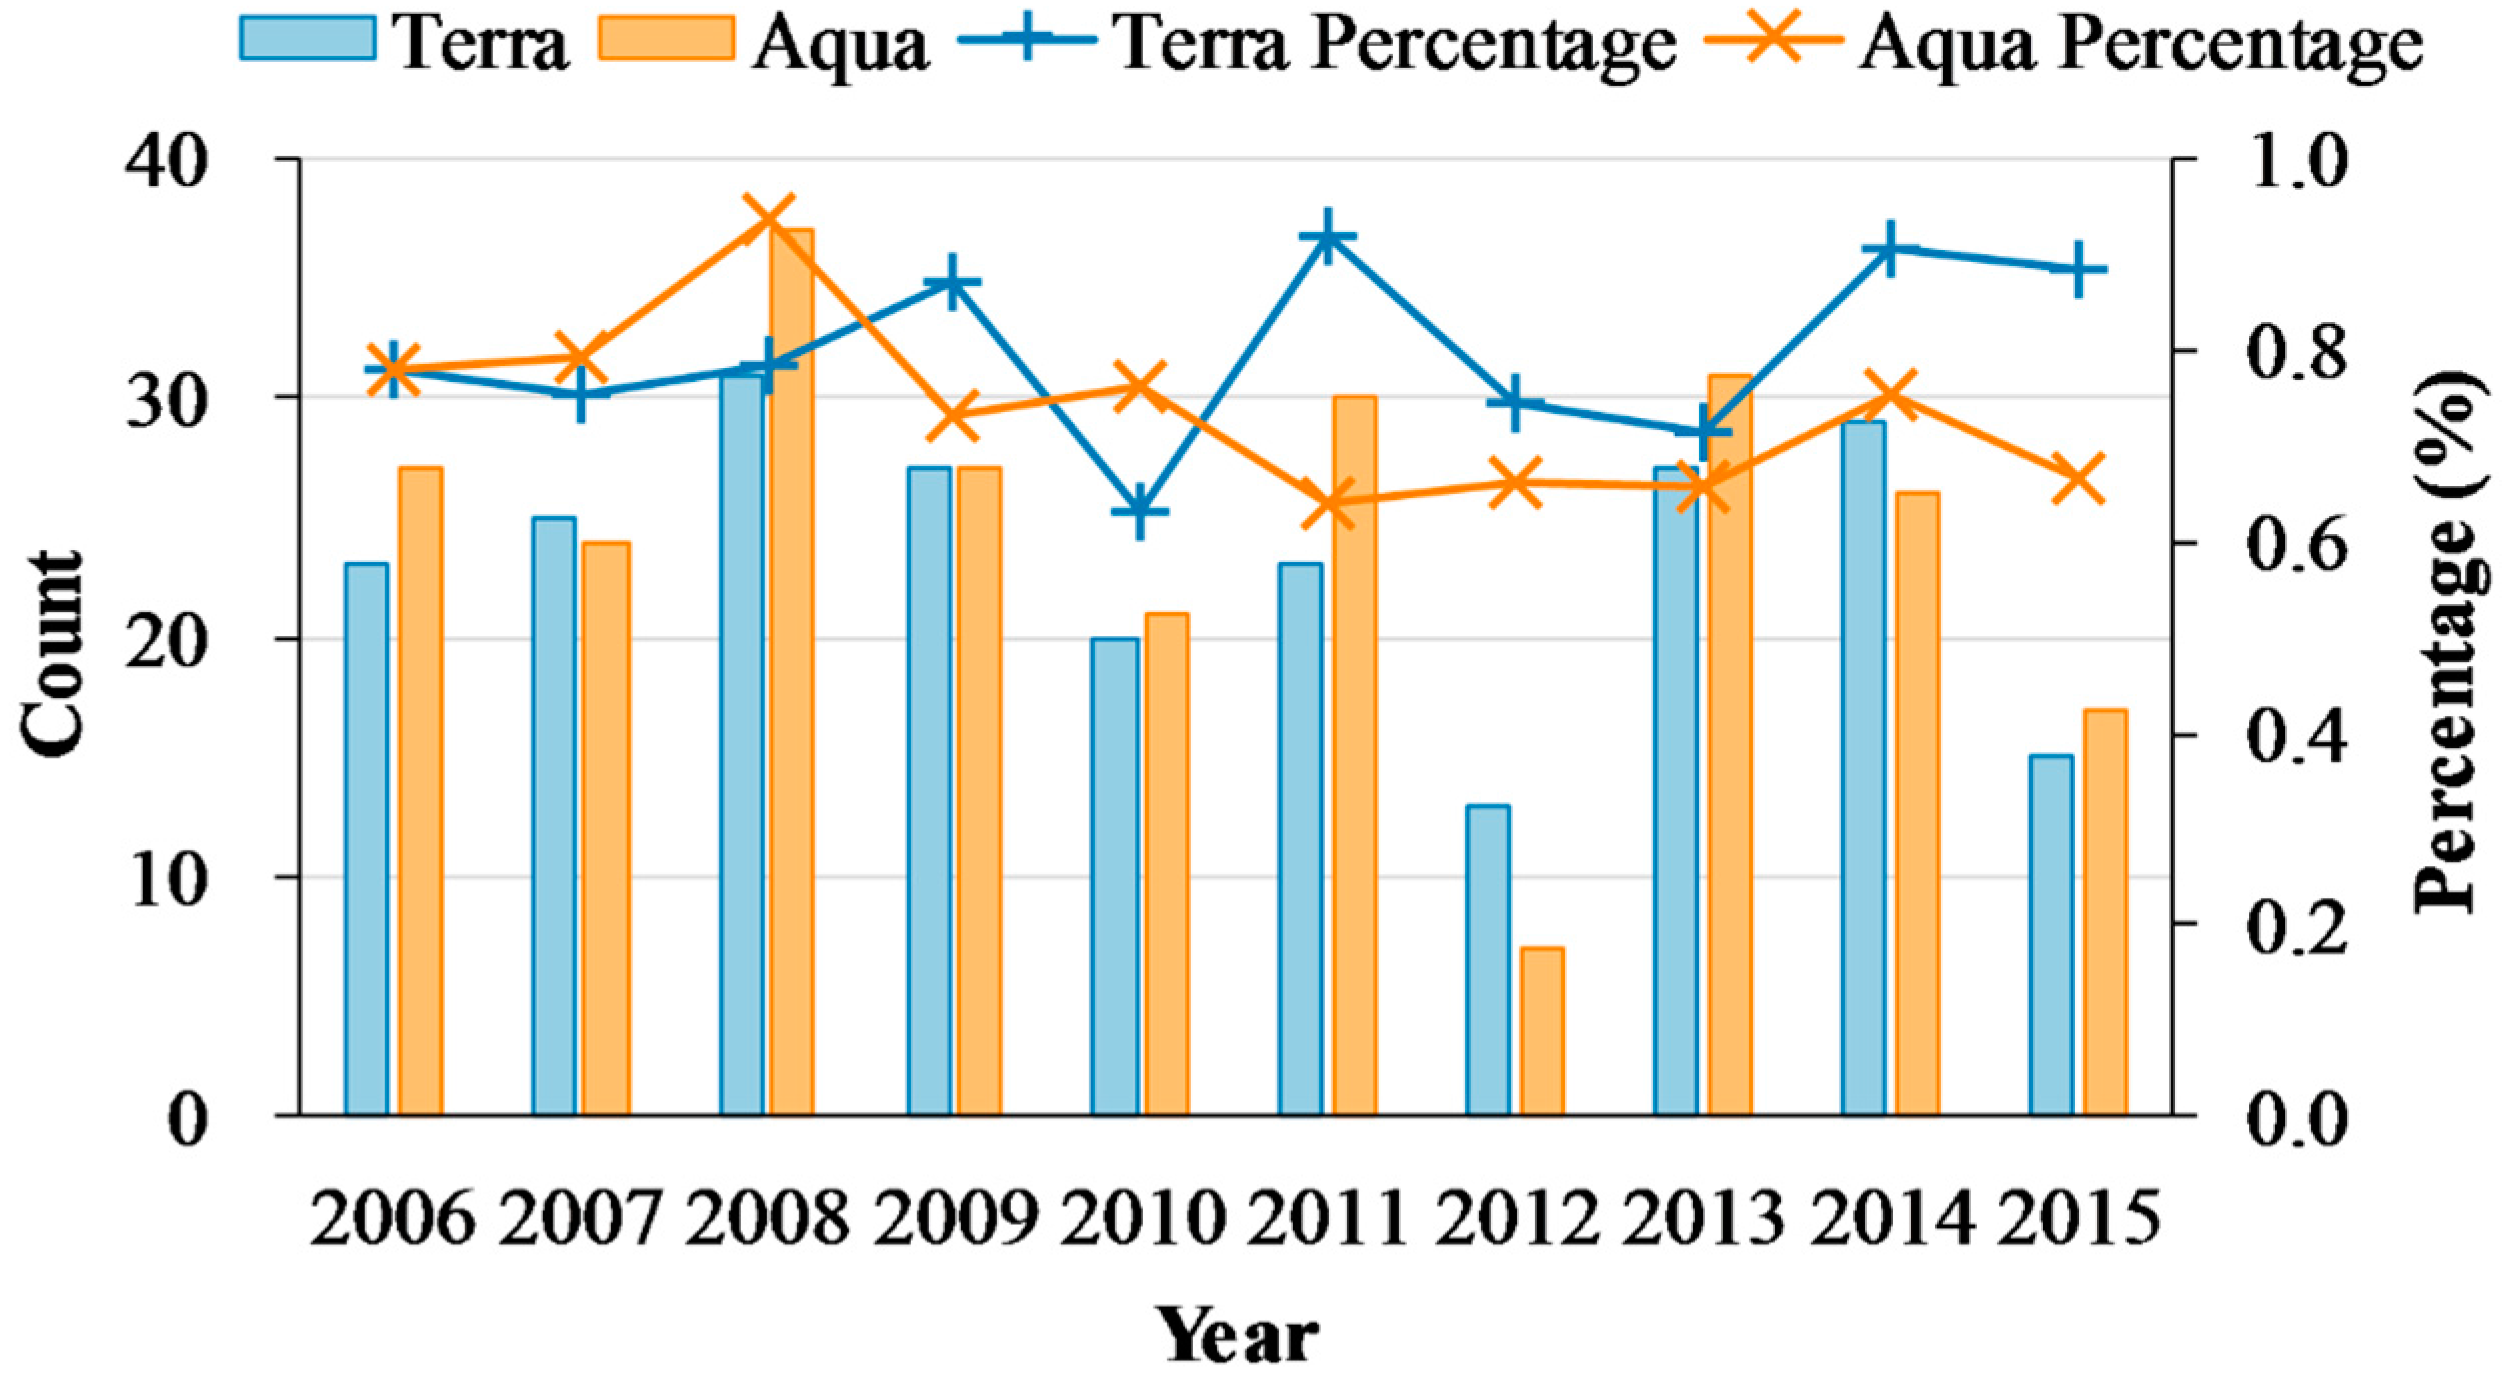
3.1. AERONET Data Comparisons

Scatter plots of MODIS AOD and AERONET measurements over the PRD region are shown in Figure 2. The total population of matchup retrievals for all of the AERONET stations was used to evaluate the performance of different data sets. Although different data sets have different expected uncertainties, the expected error (EE) of ±(0.05 + 0.15AOD) was used to enable direct comparisons between different data sets [18]. Figure 2 indicates that the accuracy of the Terra and Aqua data sets is similar; this is to be expected, because the two instruments were designed to be quantitatively similar. However, AOD values retrieved by the DT and DB algorithms and the levels of agreement with AERONET data differ. Generally, the DT 10 km AOD products are better correlated with AERONET data than the DB 10 km AOD products. Furthermore, the root mean square error (RMSE) values for the DT 10 km products are lower than those of the DB 10 km products. The DT 3 km AOD product was retrieved by the same algorithm as the DT 10 km product, and was expected to closely mirror the DT 10 km product. Although the DT 3 km product is highly correlated to AERONET observations, the RMSE of DT 3 km is slightly higher than that of DT 10 km, and the number of collocations for DT 3 km is typically fewer than that of DT 10 km; this is consistent with previously reported results [19,30].
The scatter plots for DTDB 10 km products are almost the same as those for the corresponding DT 10 km products. This is because the DTDB 10 km products are mainly derived from the DT 10 km products. In order to identify how frequently the merged data set is derived from the DB 10 km product, the days that the DTDB 10 km AOD was partially drawn from the DB 10 km AOD were counted on a yearly basis and the mean percentage of pixels contributed by the DB 10 km AOD during these days was calculated (Figure 3). The results indicate that there were typically less than 40 days each year when the DTDB 10 km product was partially drawn from the DB 10 km product, and that, on average, less than 1% of the pixels were contributed by the DB 10 km product during these days. Therefore, the DTDB 10 km product is almost the same as the DT 10 km product over the PRD region.

3.2. Site-Level Analyses

The site-level statistical summary for the validation of Terra and Aqua MODIS AOD products is shown in Table 2. The DT 10 km AOD products typically contain more retrievals that fall within the EE, and have lower RMSE values, than the other AOD products. However, Table 2 indicates that none of the products consistently outperform the others over the PRD region. The relative mean bias (RMB) is the ratio of the satellite mean to the AERONET mean. An RMB value greater than or less than 1 indicates an average overestimation or underestimation, respectively, of the AOD values. The RMB values suggest that the DB algorithm tends to underestimate AOD values over the PRD region, and the 10 km and 3 km AOD products retrieved by the DT algorithm better represent the regional mean. However, both the DT 10 km and 3 km products exhibit a positive bias at the “Zhongshan Univ” site. This is because the DT algorithm typically underestimates surface contributions over highly urbanized areas with limited vegetation cover, resulting in the overestimation of AOD values [35]. Although the number of MODIS/AERONET collocations at the “Zhongshan Univ” site is small, the results demonstrate the limitations of the DT algorithm over non-vegetated urban areas, which is consistent with previous reports [15,18]. Because the differences between the R2 values of the DT 10 km and DT 3 km products against the AERONET data are generally less than 0.05, and because of the limited number of collocations at each AERONET site, it is difficult to robustly infer which of these products is superior. However, high RMB values at the “Zhongshan Univ” site suggest that the DT 3 km products tend to include overestimated AOD values over urban areas that are not present in the DT 10 km product.
Table 2 shows that the number of collocations for DB 10 km at the “HK PolyU” station is significantly smaller than for DT 10 km. This is because the DB algorithm has difficulties in accurately determining the surface reflectance over coastal urban areas because of the heterogeneity of the underlying surface. In contrast, the DT algorithm can obtain good estimations of the surface reflectance in complex coastal environments if sufficient vegetated pixels exist.
The RMB values shown in Table 2 suggest that, unlike the “Zhongshan Univ” site, the DT 10 km and 3 km AOD values are not overestimated at the “HK PolyU” site. This is because the land surface properties around the two sites are quite different, even though both are located in urban areas. Figure 4 shows the seasonal mean NDVI values within 7.5-km radii around the “Zhongshan Univ” and “HK PolyU” sites, calculated from the Terra and Aqua MODIS-derived monthly NDVI products. The results indicate that the “HK PolyU” site has comparatively high vegetation cover. That is, the surface conditions around the “HK PolyU” site are more favorable for the DT algorithm than those at the “Zhongshan Univ” site. Therefore, more darker, vegetated, targets could be found around the “HK PolyU” site than around the “Zhongshan Univ” site, and the DT algorithm is more likely to provide robust aerosol retrieval at the “HK PolyU” site.

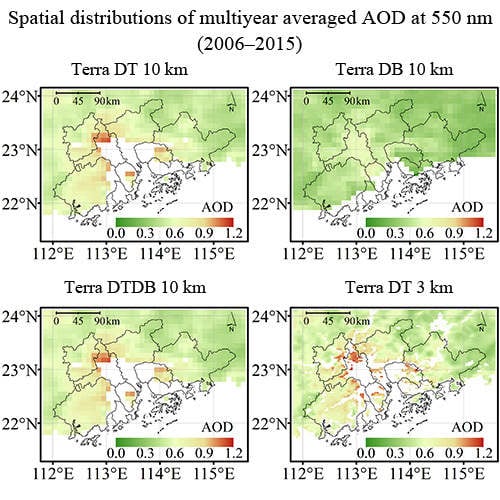
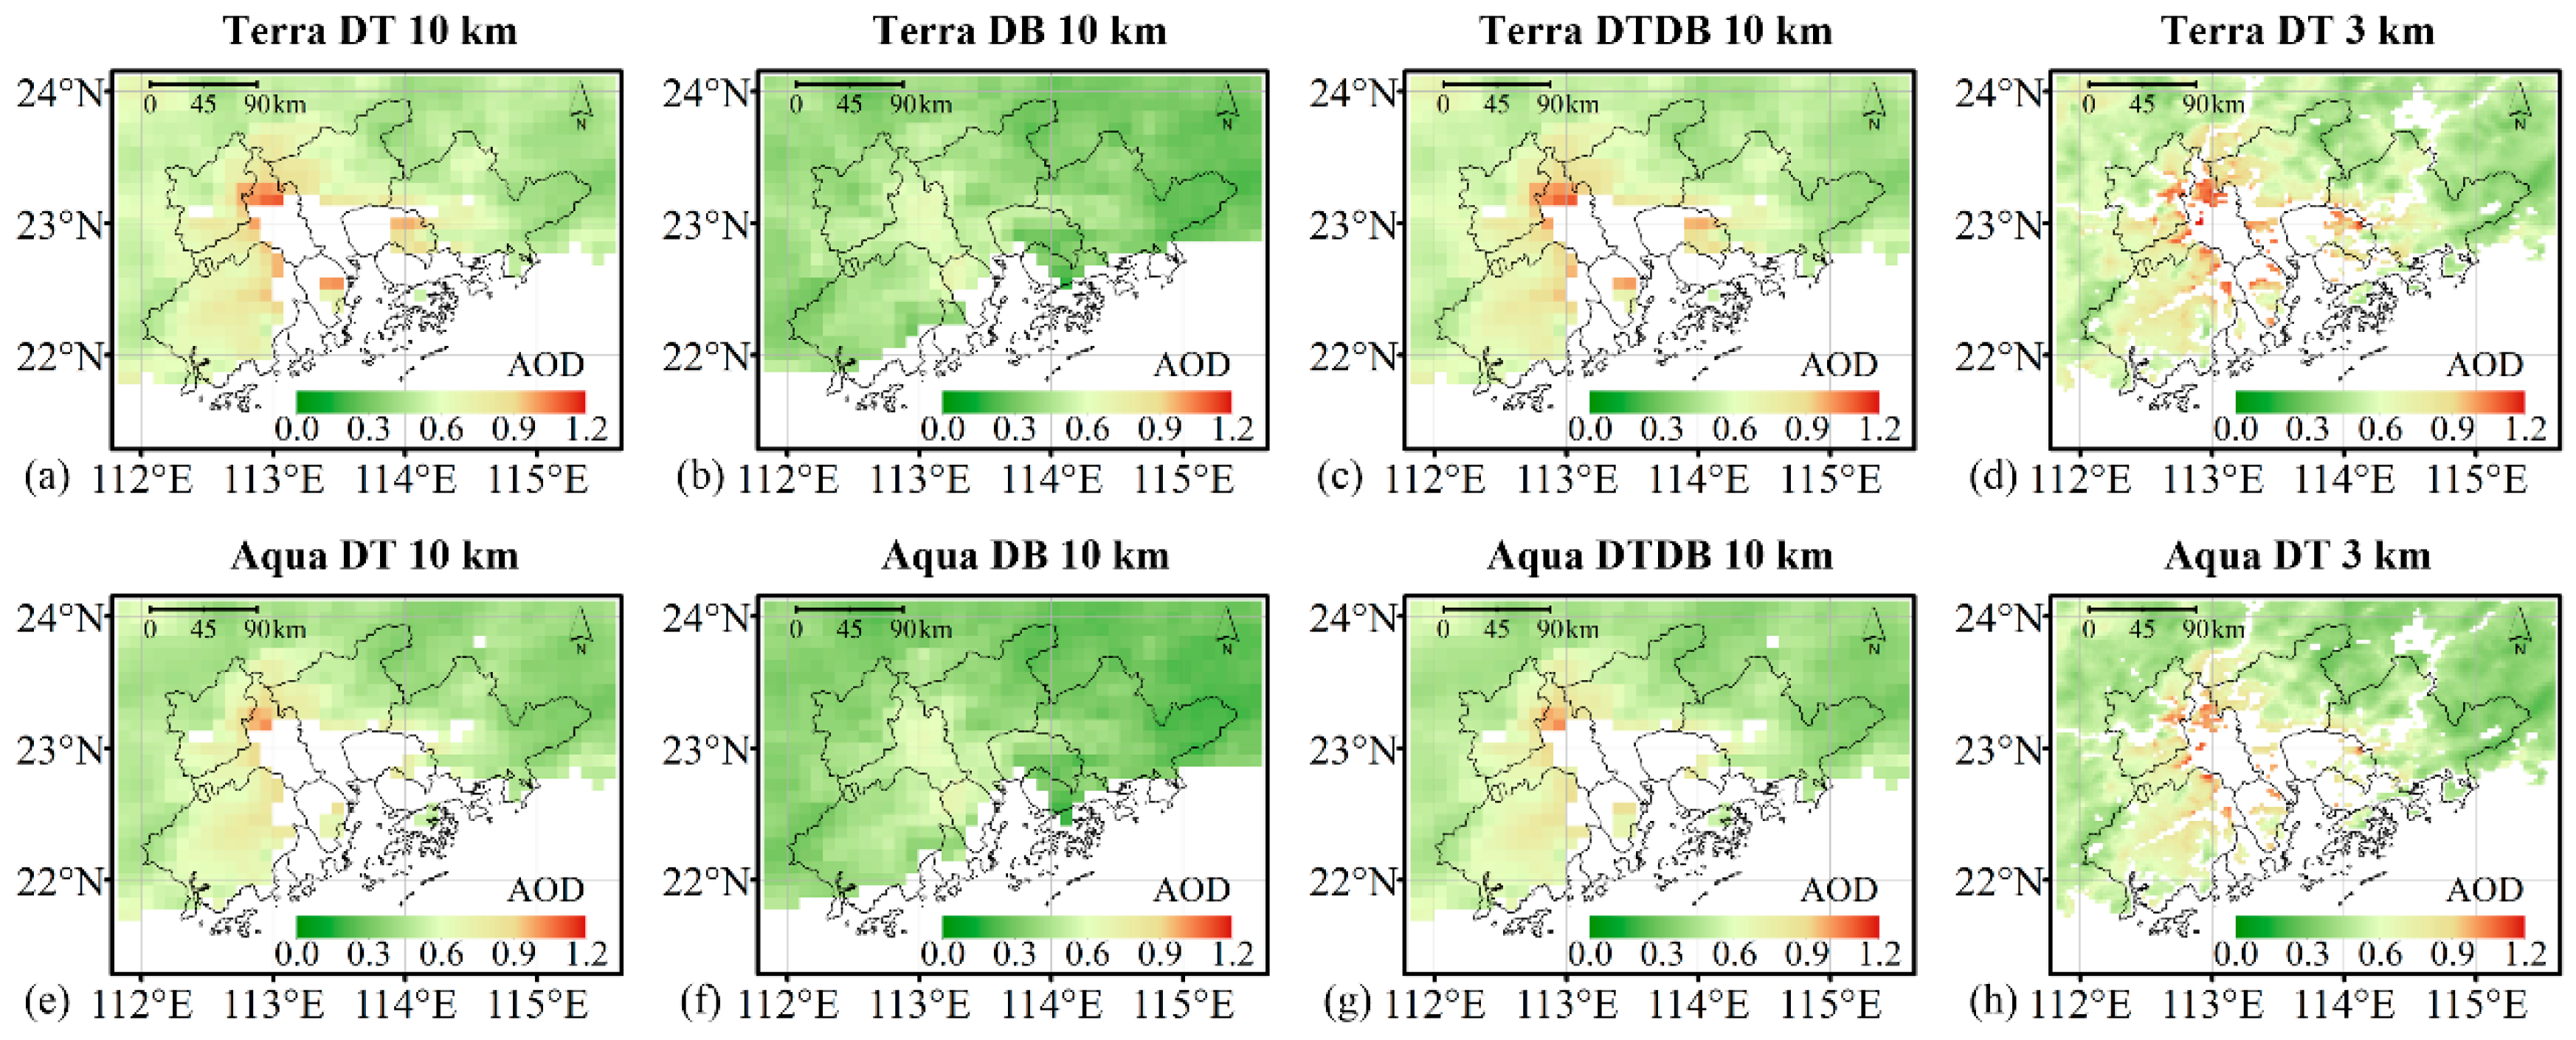
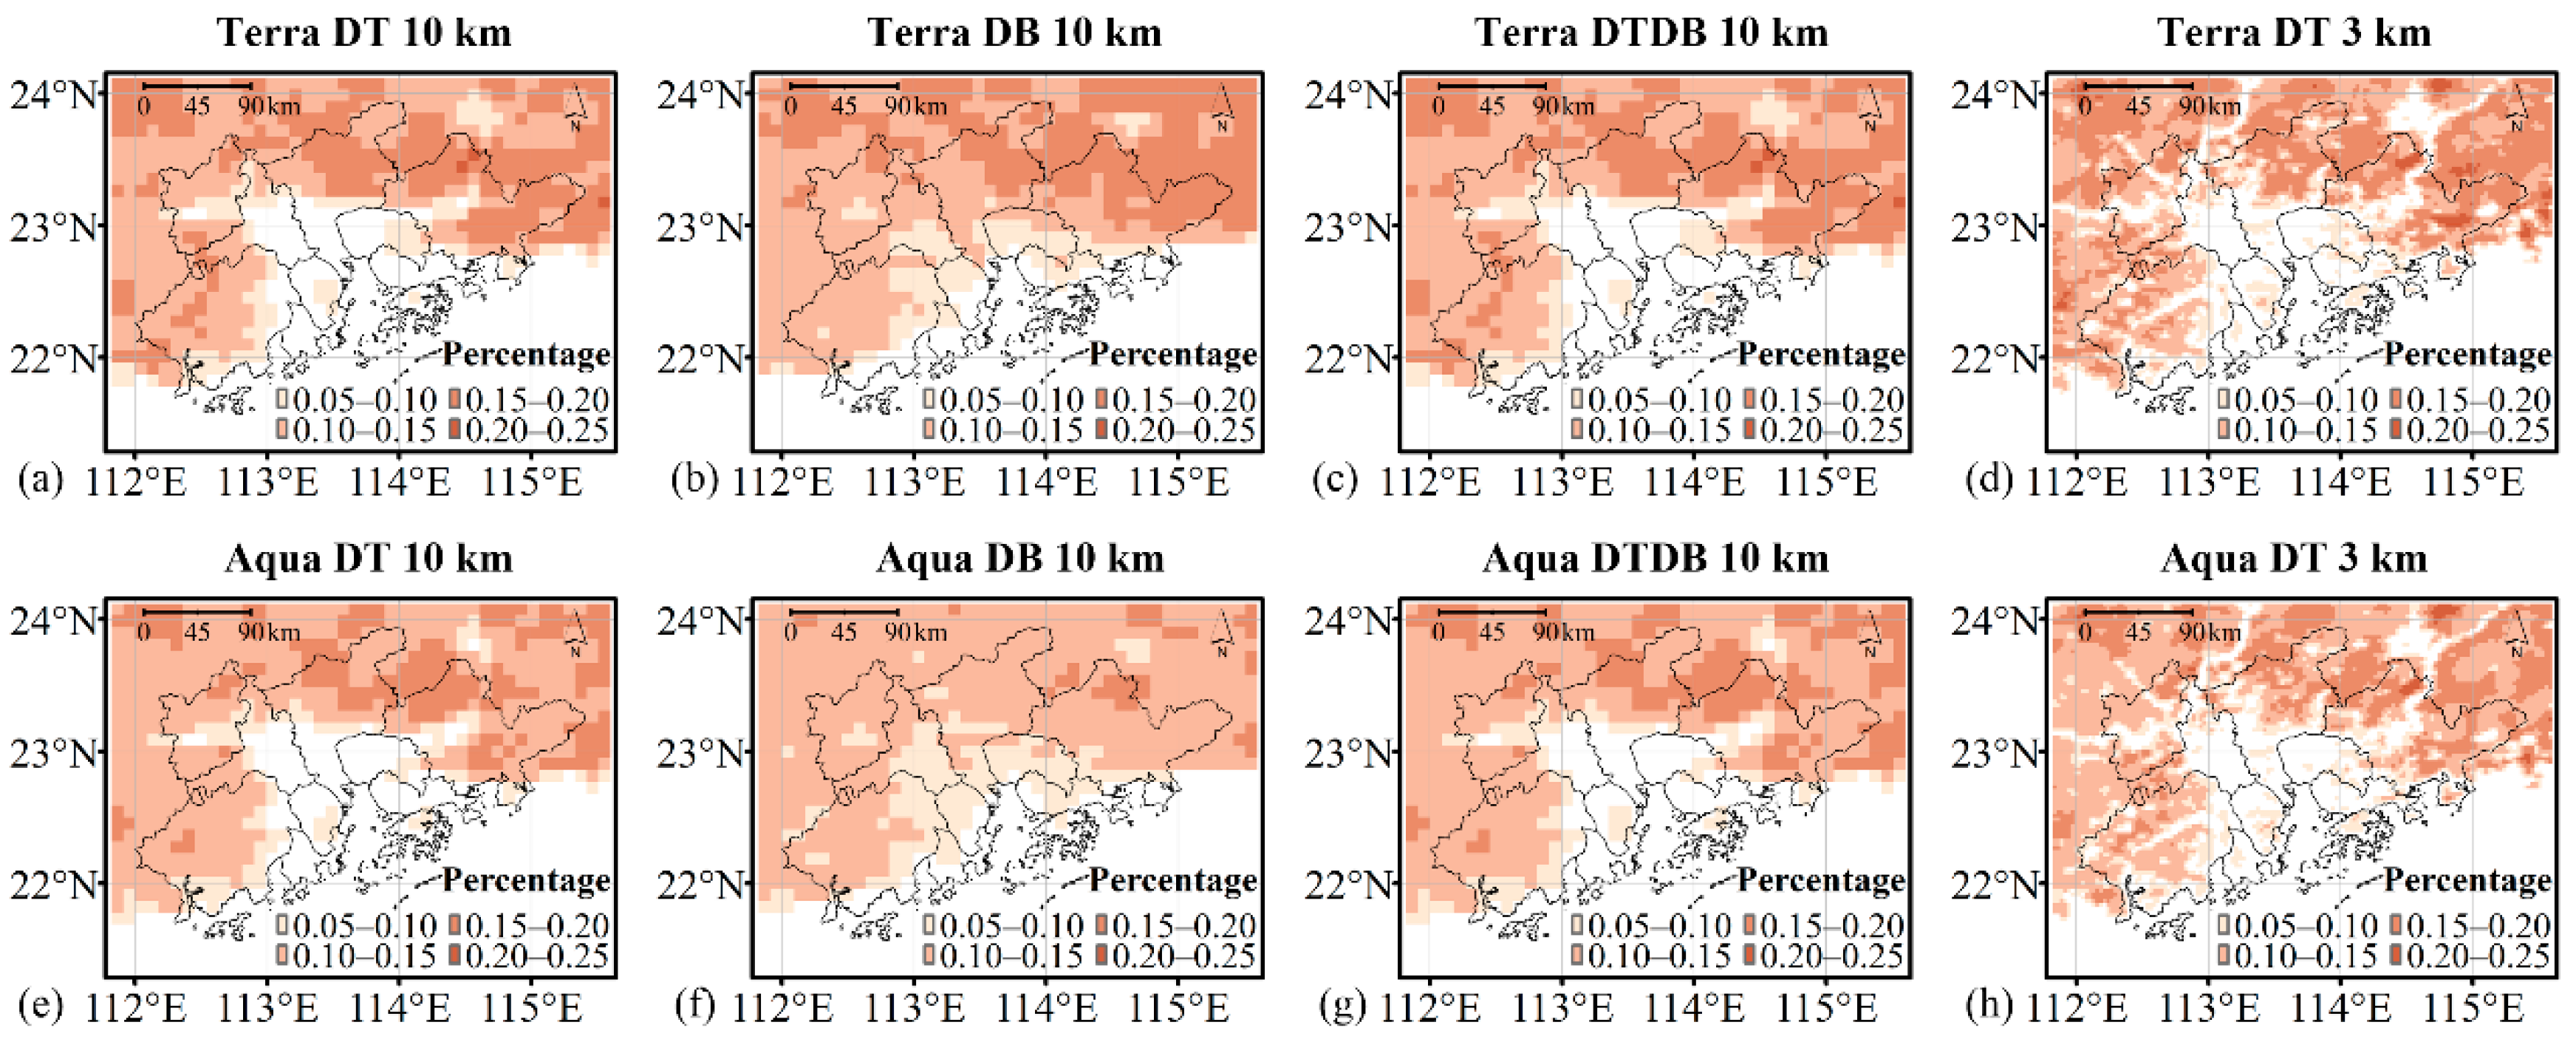
3.3. Comparisons of MODIS Data Sets

The distributions of AOD averaged from different MODIS aerosol products and their sampling frequencies during 2006–2015 over the PRD region are shown in Figure 5 and Figure 6, respectively. These figures indicate that corresponding Terra and Aqua AOD data sets show very similar spatial patterns, spatial coverage, and sampling frequencies.
Figure 5 shows that the spatial patterns and spatial coverage of different AOD products can differ significantly. The DT 10 km AOD is generally higher than the DB 10 km AOD, and mainly covers the vegetated area. The DB 10 km AOD covers the urban areas, which are typically missing from the DT 10 km product. However, the DB product has more missing points over the coastal areas. The multiyear averaged AOD derived from the DTDB 10 km product is almost the same as that derived from the DT 10 km product. This is to be expected, because the DTDB 10 km product is mainly derived from the DT 10 km product. The DT 3 km AOD product closely mimics the DT 10 km product on a finer scale, and resolves details of small-scale AOD gradients which are missed by the DT 10 km product. However, the 3 km product exhibits decreased spatial coverage, with missing data over water contaminated areas, when compared with the DT 10 km product.
Figure 6 indicates that the sampling frequencies of different MODIS aerosol products at collocated regions are similar, and that the sampling frequencies of different products are typically lower than 25%. This is partly because the QA filtering process removes those pixels that fail QA checks. In addition, AOD data are only available during clear-sky conditions. Hence, a large amount of AOD data are missing because of frequent cloudy and rainy weather over the PRD region. Therefore, although the quality assured AOD products are recommended for quantitative use [18], the limited sampling of these products should be taken into account during analyses of the PRD region.

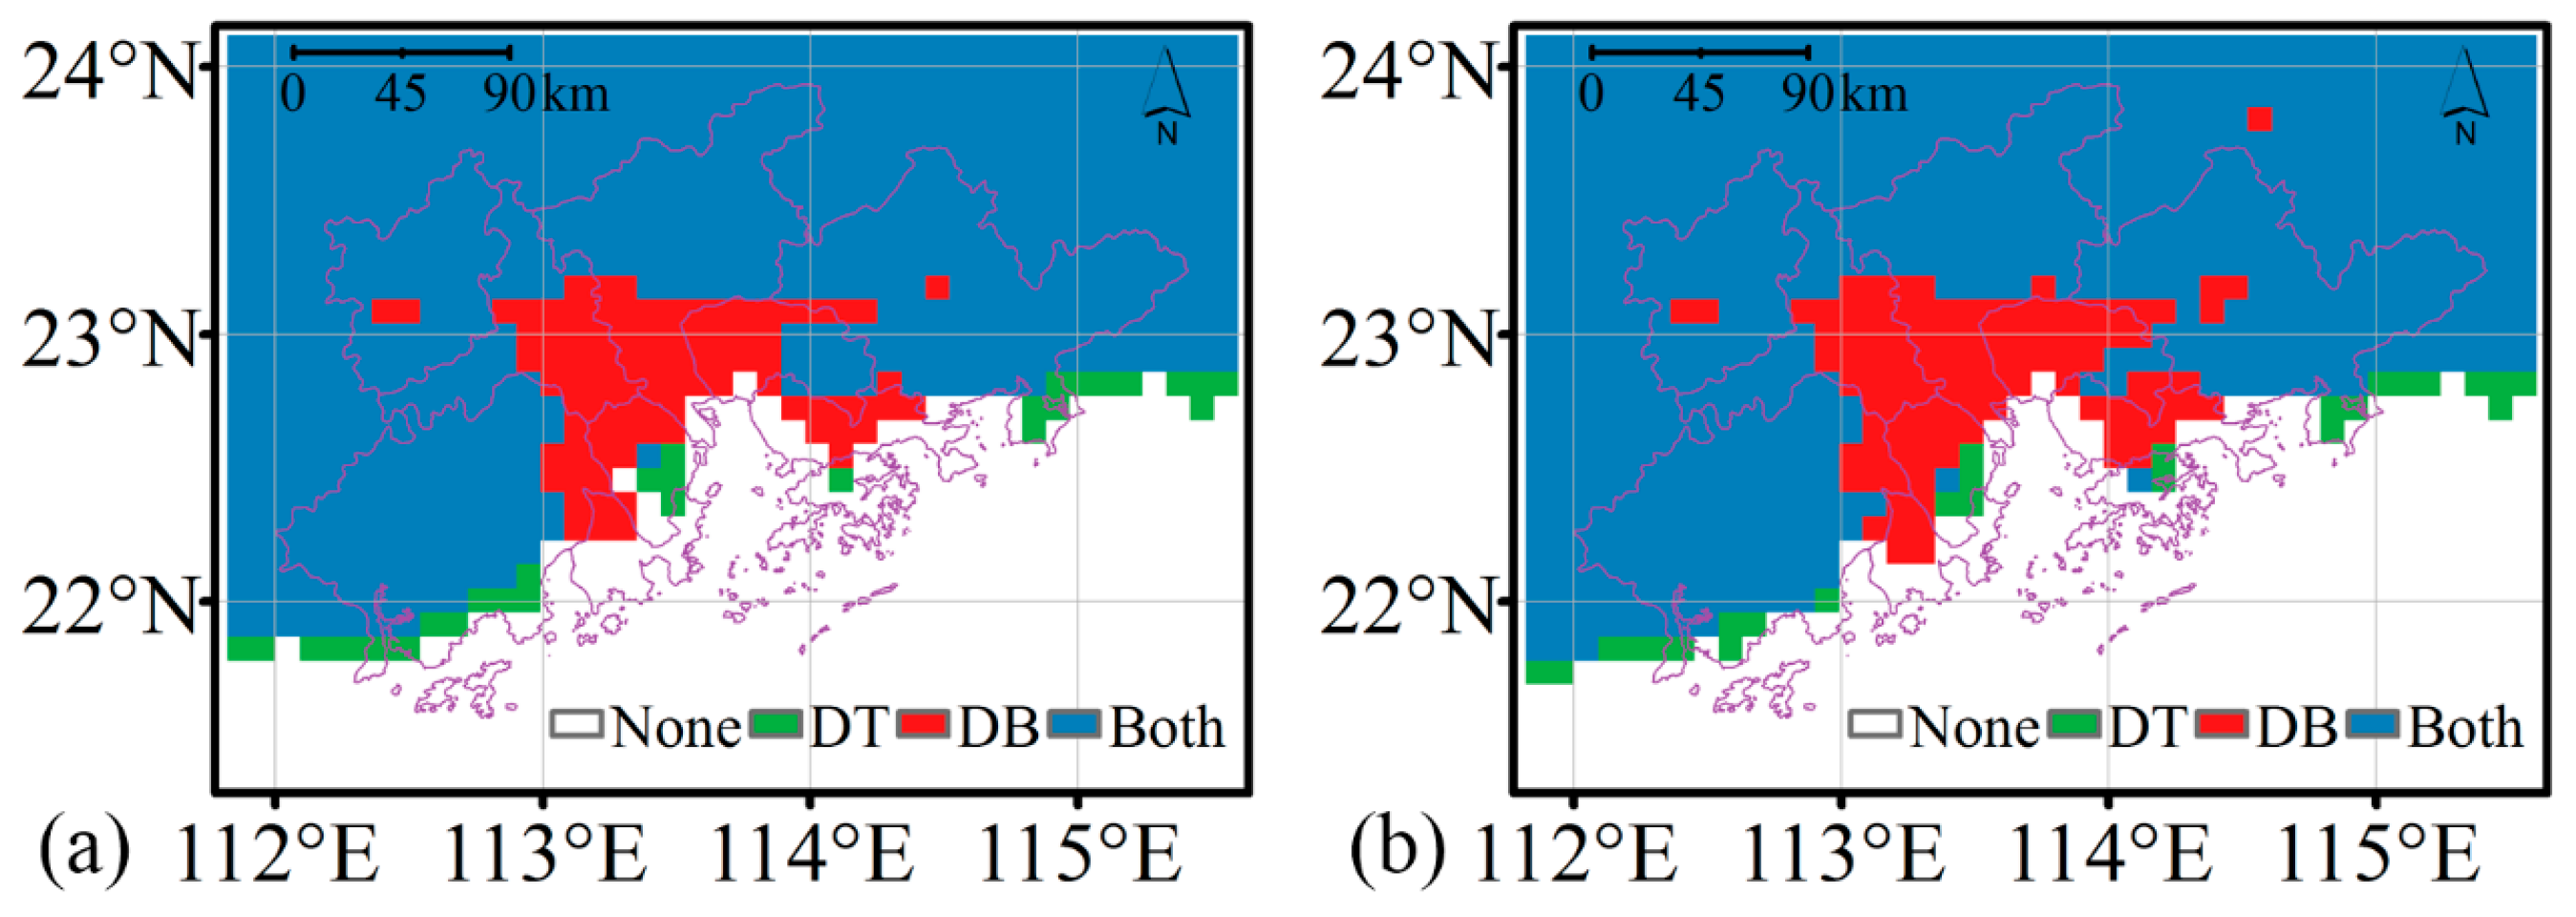
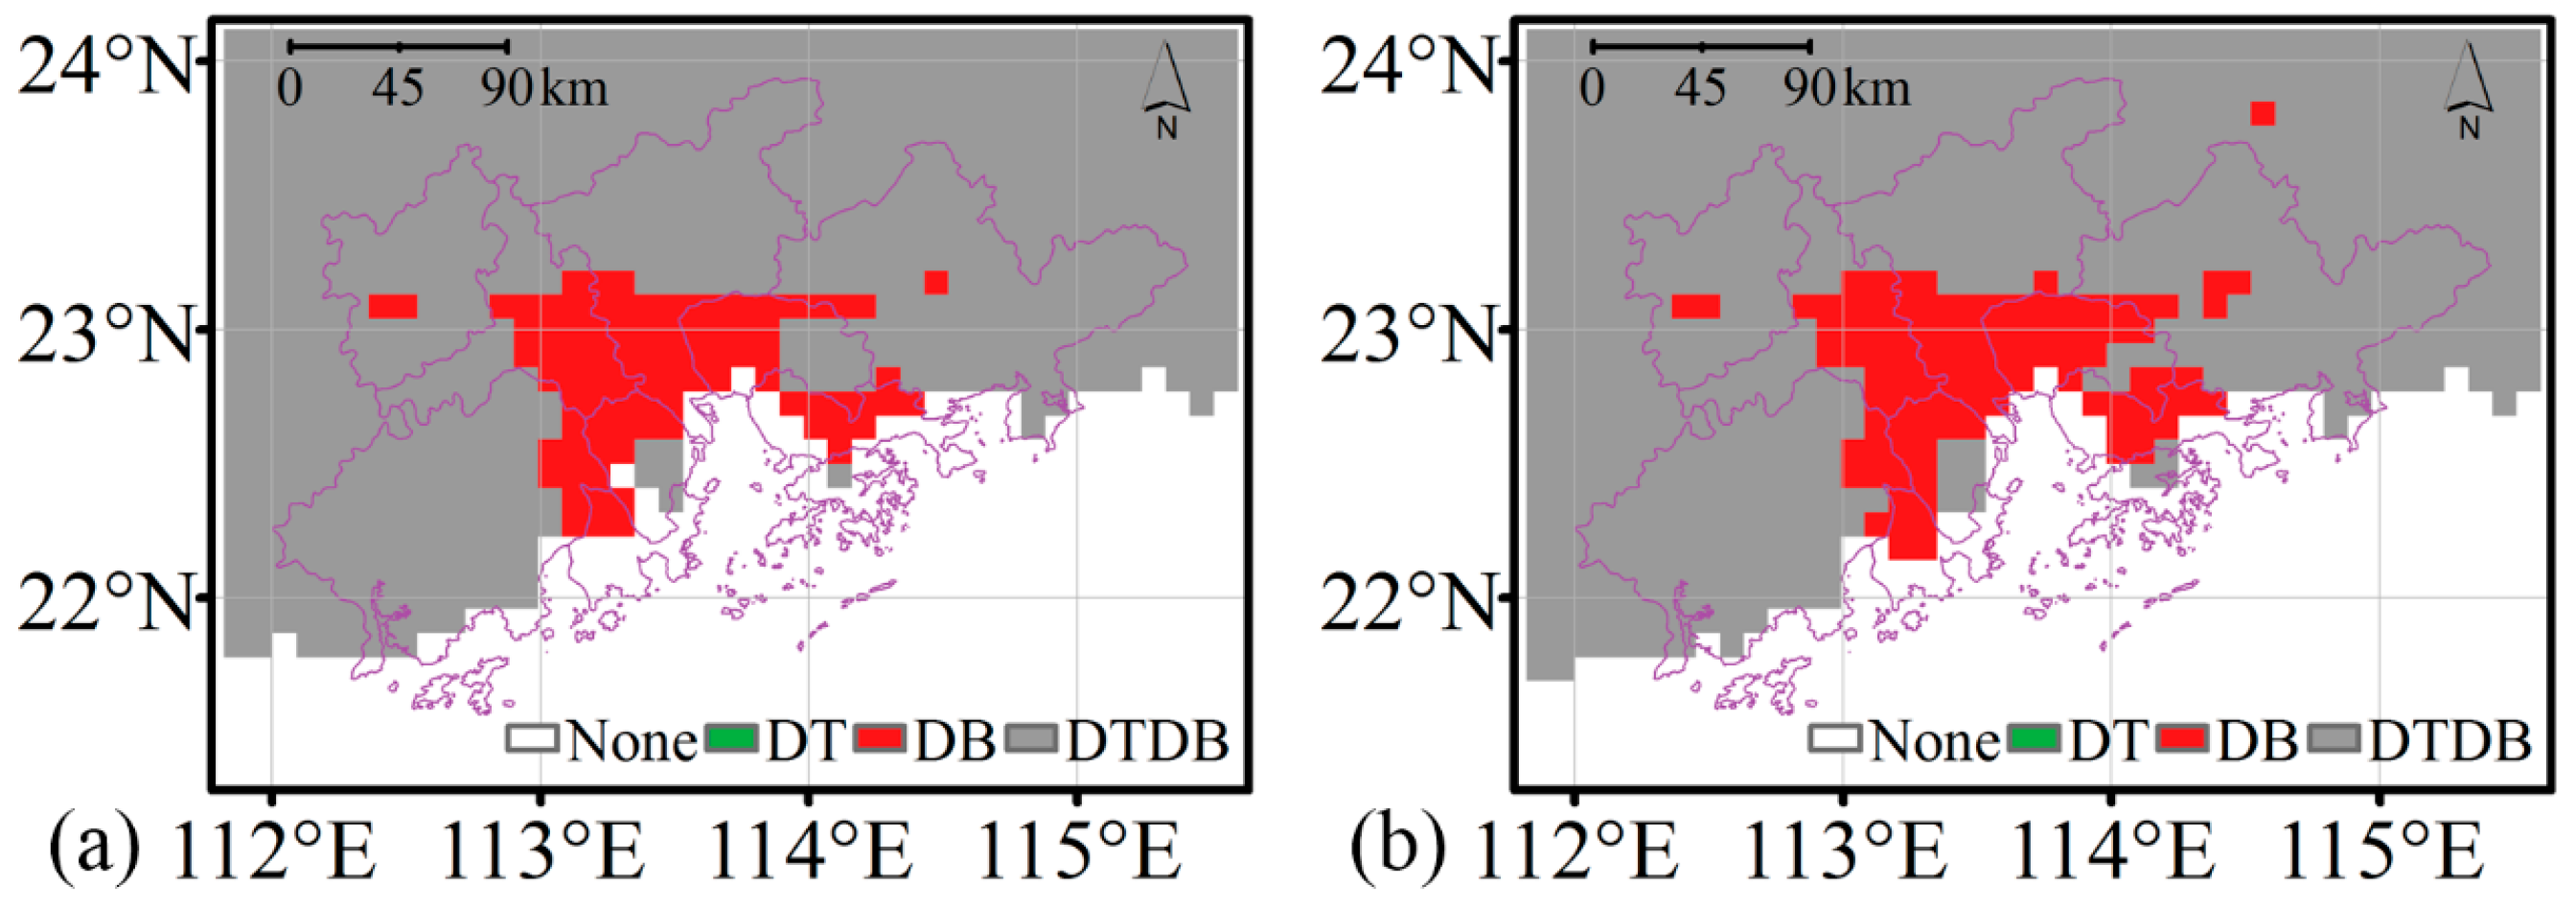
3.4. Evaluation of the DT/DB Merging Protocol

Figure 7 shows the comparison results of the spatial coverage of multiyear mean AOD derived from DT and DB 10 km AOD products. The DB 10 km product provides valid retrievals over highly urbanized areas which are missed by the DT 10 km product. In contrast, the DT 10 km product has better coverage than the DB 10 km product over coastal areas. Thus, if an appropriate merging algorithm is used, it is possible to obtain a data set with reduced-gap coverage by utilizing the strengths of the DT and DB 10 km products. However, Figure 8 indicates that many valid DB 10 km retrievals are excluded in the merging process. Furthermore, comparing Figure 7 and Figure 8 demonstrates that the DTDB 10 km product has similar coverage to the DT 10 km product. Thus, although the merged AOD product is intended to provide a more complete data set than either the DT or DB 10 km products, it does not do so over the PRD region.
The protocol used to generate the merged DT/DB AOD product is based on three classifications determined from a climatological NDVI map. If an NDVI ≥ 0.3, then the DT 10 km AOD (QA = 3) is used, and if an NDVI ≤ 0.2, then the DB 10 km AOD (QA = 2 or 3) is used. For intermediate NDVI values, the retrieval with the highest QA value is used, or, if both values exhibit high confidence, the average of the two retrievals is used [7,18]. Figure 9 shows the spatial distributions of the seasonal mean NDVI values derived from the Terra and Aqua MODIS-derived monthly NDVI product for 2006–2015. The NDVI is generally higher than 0.3 over the PRD region, especially in summer and autumn. Therefore, many valid DB 10 km AOD retrievals will not be included in the merged AOD product, even when DT 10 km retrievals are unavailable. In addition, Figure 9 indicates that there are only a small number of pixels with an NDVI value of less than 0.2 over the PRD region throughout the year. Hence, the DTDB 10 km products are mainly derived from the DT 10 km products. In order to generate more complete AOD products over the PRD region, it is necessary to improve the protocol used to merge the DT and DB AOD products.

4. Discussion

Along with the development of MODIS aerosol retrieval algorithms, MODIS AOD products have been extensively evaluated and validated on both global and regional scales, and most of these studies mainly focused on evaluating the accuracy of different products. Some of the AERONET sites used in this study have also been included in other studies, for example, “HK PolyU” and “Zhongshan Univ”. Tao et al. (2015) showed that DT 10 km AOD exhibited an overestimation in “HK PolyU” and “Zhongshan Univ”, whereas Nichol and Bilal (2016) showed that DT 10 km AOD was not overestimated at “HK PolyU” [15,36]. It was because the study periods were different, and the latter study covered a longer period than the former one. Our results also indicated that AOD retrieved by the DT algorithm was not overestimated at “HK PolyU” by using observations obtained during 2006–2015. In addition, Nichol and Bilal (2016) suggested that the dense and high rise environment around the “HK PolyU” site created long shadows and reduced the bias in surface reflectance estimation over bright surfaces. We investigated the surface properties around “HK PolyU” and “Zhongshan Univ”, and the results showed in Figure 4 indicated that the surface condition around “HK PolyU” was quite different from typical urban sites, with seasonal mean NDVI values greater than 0.5, which was a favorable surface condition for the DT algorithm.
The sampling issues of satellite-derived AOD products were typically ignored in applications. This study indicated that the sampling frequencies of different MODIS C6 AOD products were generally lower than 25% over the PRD region. Although a simple merging procedure could be used to improve the data coverage, it should be noted that different AOD products were derived from the same measurements and they were not independent from each other [18]. In addition, since a large amount of AOD data are missing due to the cloudy and rainy weather, the improvement of the data coverage will be limited by using a simple merging procedure over the PRD region. In order to compensate for the sampling issues of AOD products over the humid subtropical area, the spatiotemporal geostatistical method seems to be a promising approach [37,38].

5. Conclusions

In the present study, we evaluated the performance of different Terra and Aqua MODIS C6 aerosol products for analysis of the PRD, a humid subtropical region. The results indicate that, as expected, the corresponding Terra and Aqua data sets are quantitatively similar. Significant differences were observed between MODIS C6 AOD products. Although it is difficult to conclude which of the products is superior because of the limited number of AERONET observations, the DT and DTDB 10 km products exhibit higher correlations with the AERONET measurements than the other products. The DB 10 km AOD tends to be underestimated, and the DT 10 km AOD shows a positive bias over highly urbanized areas. The DTDB 10 km product is mainly derived from the DT 10 km product, and does not provide a more complete data set as intended. Gaps in the DTDB data set are present because the NDVI is generally larger than 0.3 over the PRD region, and the DTDB 10 km product is populated using only the DT 10 km AOD when NDVI ≥ 0.3. Therefore, the method used to merge the DT and DB 10 km AOD products requires improvement. The DT 3 km product closely mirrors the DT 10 km product at a higher resolution, but exhibits more missing data over water-contaminated areas. Because the QA filtering process, and the prevalence of cloudy and rainy weather in the PRD region, the sampling frequencies of different AOD products are typically lower than 25%. Hence, the limited sampling of these quality assured AOD products should be considered in analyses of humid subtropical areas. The results presented here will assist users of these products to understand their strengths and weaknesses; thereby helping them to choose the most appropriate data set for their target applications. In addition, this study can be used as a reference for future algorithm development and refinement at a regional scale.

Acknowledgments

The authors would like to acknowledge the NASA Goddard Earth Science Distributed Active Archive Center for the MODIS Level 2 data, and we would like to thank the principal investigators of the four AERONET stations in Table 1. This work was supported by the funding from National Natural Science Foundation of China (NSFC: 41571514, 41671406).

Author Contributions

Ming Zhang conceived and designed the experiments, Ming Zhang and Bo Huang wrote the paper. Qingqing He revised and edited the manuscript.

Conflicts of Interest

The authors declare no conflict of interest.

References

  1. Kaufman, Y.J.; Tanré, D.; Boucher, O. A satellite view of aerosols in the climate system. Nature 2002, 419, 215–223. [Google Scholar] [CrossRef]
  2. Pope, C.A.; Dockery, D.W. Health effects of fine particulate air pollution: Lines that connect. J. Air Waste Manag. Assoc. 2006, 56, 709–742. [Google Scholar] [CrossRef]
  3. Li, Z.; Zhao, X.; Kahn, R.; Mishchenko, M.; Remer, L.; Lee, K.H.; Wang, M.; Laszlo, I.; Nakajima, T.; Maring, H. Uncertainties in satellite remote sensing of aerosols and impact on monitoring its long-term trend: A review and perspective. Ann. Geophys. 2009, 27, 2755–2770. [Google Scholar] [CrossRef]
  4. Kokhanovsky, A.A. Remote sensing of atmospheric aerosol using spaceborne optical observations. Earth-Sci. Rev. 2013, 116, 95–108. [Google Scholar] [CrossRef]
  5. Kaufman, Y.J.; Tanré, D.; Remer, L.A.; Vermote, E.F.; Chu, A.; Holben, B.N. Operational remote sensing of tropospheric aerosol over land from eos moderate resolution imaging spectroradiometer. J. Geophys. Res. Atmos. 1997, 102, 17051–17067. [Google Scholar] [CrossRef]
  6. Hsu, N.C.; Jeong, M.J.; Bettenhausen, C.; Sayer, A.M.; Hansell, R.; Seftor, C.S.; Huang, J.; Tsay, S.C. Enhanced deep blue aerosol retrieval algorithm: The second generation. J. Geophys. Res. Atmos. 2013, 118, 9296–9315. [Google Scholar] [CrossRef]
  7. Levy, R.C.; Mattoo, S.; Munchak, L.A.; Remer, L.A.; Sayer, A.M.; Patadia, F.; Hsu, N.C. The collection 6 modis aerosol products over land and ocean. Atmos. Meas. Tech. 2013, 6, 2989–3034. [Google Scholar] [CrossRef]
  8. Song, W.; Jia, H.; Huang, J.; Zhang, Y. A satellite-based geographically weighted regression model for regional pm2.5 estimation over the Pearl River delta region in china. Remote Sens. Environ. 2014, 154, 1–7. [Google Scholar] [CrossRef]
  9. Ma, Z.; Liu, Y.; Zhao, Q.; Liu, M.; Zhou, Y.; Bi, J. Satellite-derived high resolution pm2.5 concentrations in yangtze river delta region of china using improved linear mixed effects model. Atmos. Environ. 2016, 133, 156–164. [Google Scholar] [CrossRef]
  10. Wang, J.; Christopher, S.A. Intercomparison between satellite-derived aerosol optical thickness and pm2.5 mass: Implications for air quality studies. Geophys. Res. Lett. 2003, 30, 267–283. [Google Scholar] [CrossRef]
  11. Van Donkelaar, A.; Martin, R.V.; Brauer, M.; Kahn, R.; Levy, R.; Verduzco, C.; Villeneuve, P.J. Global estimates of ambient fine particulate matter concentrations from satellite-based aerosol optical depth: Development and application. Environ. Health Perspect. 2010, 118, 847–855. [Google Scholar] [CrossRef]
  12. Hoff, R.M.; Christopher, S.A. Remote sensing of particulate pollution from space: Have we reached the promised land? J. Air Waste Manag. Assoc. 2009, 59, 645–675. [Google Scholar]
  13. Remer, L.A.; Kaufman, Y.J.; Tanré, D.; Mattoo, S.; Chu, D.A.; Martins, J.V.; Li, R.R.; Ichoku, C.; Levy, R.C.; Kleidman, R.G.; et al. The modis aerosol algorithm, products, and validation. J. Atmos. Sci. 2005, 62, 947–973. [Google Scholar] [CrossRef]
  14. Levy, R.C.; Remer, L.A.; Kleidman, R.G.; Mattoo, S.; Ichoku, C.; Kahn, R.; Eck, T.F. Global evaluation of the collection 5 modis dark-target aerosol products over land. Atmos. Chem. Phys. 2010, 10, 10399–10420. [Google Scholar] [CrossRef] [Green Version]
  15. Tao, M.; Chen, L.; Wang, Z.; Tao, J.; Che, H.; Wang, X.; Wang, Y. Comparison and evaluation of the modis collection 6 aerosol data in china. J. Geophys. Res. Atmos. 2015, 120, 6992–7005. [Google Scholar] [CrossRef]
  16. Xiao, Q.; Zhang, H.; Choi, M.; Li, S.; Kondragunta, S.; Kim, J.; Holben, B.; Levy, R.C.; Liu, Y. Evaluation of viirs, goci, and modis collection 6 aod retrievals against ground sunphotometer observations over east asia. Atmos. Chem. Phys. 2016, 16, 1255–1269. [Google Scholar] [CrossRef]
  17. Sayer, A.M.; Hsu, N.C.; Bettenhausen, C.; Jeong, M.J. Validation and uncertainty estimates for modis collection 6 “deep blue” aerosol data. J. Geophys. Res. Atmos. 2013, 118, 7864–7872. [Google Scholar] [CrossRef]
  18. Sayer, A.M.; Munchak, L.A.; Hsu, N.C.; Levy, R.C.; Bettenhausen, C.; Jeong, M.J. Modis collection 6 aerosol products: Comparison between aqua’s e-deep blue, dark target, and “merged” data sets, and usage recommendations. J. Geophys. Res. Atmos. 2014, 119, 13965–13989. [Google Scholar] [CrossRef]
  19. Bilal, M.; Nichol, J.E. Evaluation of modis aerosol retrieval algorithms over the beijing-tianjin-hebei region during low to very high pollution events. J. Geophys. Res. Atmos. 2015, 120, 7941–7957. [Google Scholar] [CrossRef]
  20. Schutgens, N.A.J.; Partridge, D.G.; Stier, P. The importance of temporal collocation for the evaluation of aerosol models with observations. Atmos. Chem. Phys. 2016, 16, 1065–1079. [Google Scholar] [CrossRef]
  21. Zhang, Y.H.; Hu, M.; Zhong, L.J.; Wiedensohler, A.; Liu, S.C.; Andreae, M.O.; Wang, W.; Fan, S.J. Regional integrated experiments on air quality over pearl river delta 2004 (pride-prd2004): Overview. Atmos. Environ. 2008, 42, 6157–6173. [Google Scholar] [CrossRef]
  22. Liu, H.; Chan, J.C.L.; Cheng, A.Y.S. Internal boundary layer structure under sea-breeze conditions in Hong Kong. Atmos. Environ. 2001, 35, 683–692. [Google Scholar] [CrossRef]
  23. Li, Y.; Lin, C.; Lau, A.K.H.; Liao, C.; Zhang, Y.; Zeng, W.; Li, C.; Fung, J.C.H.; Tse, T.K.T. Assessing long-term trend of particulate matter pollution in the pearl river delta region using satellite remote sensing. Environ. Sci. Technol. 2015, 49, 11670–11678. [Google Scholar] [CrossRef]
  24. Deng, X.; Tie, X.; Wu, D.; Zhou, X.; Bi, X.; Tan, H.; Li, F.; Jiang, C. Long-term trend of visibility and its characterizations in the pearl river delta (prd) region, china. Atmos. Environ. 2008, 42, 1424–1435. [Google Scholar] [CrossRef]
  25. Chen, J.; Xin, J.; An, J.; Wang, Y.; Liu, Z.; Chao, N.; Meng, Z. Observation of aerosol optical properties and particulate pollution at background station in the pearl river delta region. Atmos. Res. 2014, 143, 216–227. [Google Scholar] [CrossRef]
  26. Levy, R.C.; Remer, L.A.; Mattoo, S.; Vermote, E.F.; Kaufman, Y.J. Second-generation operational algorithm: Retrieval of aerosol properties over land from inversion of moderate resolution imaging spectroradiometer spectral reflectance. J. Geophys. Res. Atmos. 2007, 112, 1–21. [Google Scholar] [CrossRef]
  27. Hsu, N.C.; Tsay, S.C.; King, M.D.; Herman, J.R. Aerosol properties over bright-reflecting source regions. IEEE Trans. Geosci. Remote Sens. 2004, 42, 557–569. [Google Scholar] [CrossRef]
  28. Sayer, A.M.; Hsu, N.C.; Bettenhausen, C.; Jeong, M.J.; Meister, G. Effect of modis terra radiometric calibration improvements on collection 6 deep blue aerosol products: Validation and terra/aqua consistency. J. Geophys. Res. Atmos. 2015, 120, 12,157–12,174. [Google Scholar] [CrossRef]
  29. Munchak, L.A.; Levy, R.C.; Mattoo, S.; Remer, L.A.; Holben, B.N.; Schafer, J.S.; Hostetler, C.A.; Ferrare, R.A. Modis 3 km aerosol product: Applications over land in an urban/suburban region. Atmos. Meas. Tech. 2013, 6, 1747–1759. [Google Scholar] [CrossRef]
  30. Remer, L.A.; Mattoo, S.; Levy, R.C.; Munchak, L.A. Modis 3 km aerosol product: Algorithm and global perspective. Atmos. Meas. Tech. 2013, 6, 1829–1844. [Google Scholar] [CrossRef]
  31. Holben, B.N.; Eck, T.F.; Slutsker, I.; Tanré, D.; Buis, J.P.; Setzer, A.; Vermote, E.; Reagan, J.A.; Kaufman, Y.J.; Nakajima, T.; et al. Aeronet—A federated instrument network and data archive for aerosol characterization. Remote Sens. Environ. 1998, 66, 1–16. [Google Scholar] [CrossRef]
  32. Ichoku, C.; Chu, D.A.; Mattoo, S.; Kaufman, Y.J.; Remer, L.A.; Tanré, D.; Slutsker, I.; Holben, B.N. A spatio-temporal approach for global validation and analysis of modis aerosol products. Geophys. Res. Lett. 2002, 29, 1–4. [Google Scholar] [CrossRef]
  33. Eck, T.; Holben, B.; Reid, J.; Dubovik, O.; Smirnov, A.; O’neill, N.; Slutsker, I.; Kinne, S. Wavelength dependence of the optical depth of biomass burning, urban, and desert dust aerosols. J. Geophys. Res. Atmos. 1999, 104, 31333–31349. [Google Scholar] [CrossRef]
  34. Zhang, M.; Huang, B.; Jiang, R. Using satellite data to estimate particulate air quality in a subtropical city: An evaluation of accuracy and sampling issues. Remote Sens. Lett. 2015, 6, 370–379. [Google Scholar] [CrossRef]
  35. Jäkel, E.; Mey, B.; Levy, R.; Gu, X.; Yu, T.; Li, Z.; Althausen, D.; Heese, B.; Wendisch, M. Adaption of the modis aerosol retrieval algorithm using airborne spectral surface reflectance measurements over urban areas: A case study. Atmos. Meas. Tech. 2015, 8, 5237–5249. [Google Scholar] [CrossRef]
  36. Nichol, J.; Bilal, M. Validation of modis 3 km resolution aerosol optical depth retrievals over Asia. Remote Sens. 2016, 8, 328. [Google Scholar] [CrossRef]
  37. Nguyen, H.; Cressie, N.; Braverman, A. Spatial statistical data fusion for remote sensing applications. J. Am. Stat. Assoc. 2012, 107, 1004–1018. [Google Scholar] [CrossRef]
  38. Tang, Q.; Bo, Y.; Zhu, Y. Spatiotemporal fusion of multiple-satellite aerosol optical depth (aod) products using bayesian maximum entropy method. J. Geophys. Res. Atmos. 2016, 121, 4034–4048. [Google Scholar] [CrossRef]
Figure 1. Map of the study area with locations of the AERONET stations used for validating satellite AOD products. Percentile tree cover obtained from the Center for Environmental Remote Sensing, Chiba University represents the density of trees over this region.
Remotesensing 09 01173 g001
Figure 2. Validation of different Terra (ad) and Aqua (eh) MODIS AOD products against AERONET measurements. Dashed lines represent the expected error (EE) of ±(0.05 + 0.15 AOD), and solid lines represent the one-to-one relationships.
Remotesensing 09 01173 g002
Figure 3. Number of days in each year that the DTDB 10 km AOD was partially derived from the DB 10 km AOD, and the mean percentage of pixels that were contributed by the DB 10 km AOD during these days.
Remotesensing 09 01173 g003
Figure 4. Seasonal distribution of multiyear averaged MODIS NDVI around the “HK PolyU” and “Zhongshan Univ” sites for 2006–2015.
Remotesensing 09 01173 g004
Figure 5. Ten-year (2006–2015) mean AOD for Terra (ad) and Aqua (eh) MODIS aerosol products.
Remotesensing 09 01173 g005
Figure 6. Ten-year (2006–2015) mean sampling frequencies for Terra (ad) and Aqua (eh) MODIS aerosol products.
Remotesensing 09 01173 g006
Figure 7. Comparison of the spatial coverage of multiyear mean AOD derived from (a) Terra and (b) Aqua DT and DB 10 km AOD products for 2006–2015. Pixels included only in the DT or DB 10 km AOD data are marked in green and red, respectively. Pixels covered by both data sets are marked in blue.
Remotesensing 09 01173 g007
Figure 8. Spatial coverage of multiyear mean AOD derived from (a) Terra and (b) Aqua DTDB 10 km AOD products for 2006–2015. Pixels covered by the DTDB 10 km AOD are marked in grey. Green and red pixels indicate the regions where valid DT 10 km or DB 10 km retrievals, respectively, are not included in the DTDB 10 km product.
Remotesensing 09 01173 g008
Figure 9. Seasonal distributions of multi-year averaged MODIS NDVI data for 2006–2015.
Remotesensing 09 01173 g009
Table 1. AERONET data used in this study.
Site NameSite TypeLongitude/LatitudeTime Period
HK PolyUurban114.180/22.3032006.1–2015.10
Zhongshan Univurban113.390/23.0602011.11–2012.7
Kaipingsuburban112.539/22.3152008.10–2008.11
HK Sheungrural114.117/22.4832012.2–2014.7
Table 2. Statistics of the site-level comparisons between different MODIS AOD products and AERONET observations.
AERONETAOD ProductTerra/Aqua Statistics
N aR2RMSE bRMB cwithin EE d (%)
HK PolyUDT 10 km86/890.94/0.870.07/0.120.99/0.9193/79
DB 10 km29/370.78/0.680.23/0.170.44/0.553/19
DTDB 10 km86/890.94/0.870.07/0.120.99/0.9193/79
DT 3 km44/450.92/0.820.11/0.141.06/1.0382/84
Zhongshan UnivDT 10 km16/130.90/0.870.23/0.241.32/1.3738/38
DB 10 km27/230.57/0.820.26/0.100.76/0.9244/78
DTDB 10 km17/130.81/0.870.23/0.241.27/1.3835/38
DT 3 km13/110.93/0.830.30/0.301.47/1.588/9
KaipingDT 10 km10/90.90/0.910.10/0.071.04/1.1580/89
DB 10 km10/100.94/0.910.18/0.140.68/0.7130/50
DTDB 10 km10/90.90/0.910.10/0.071.04/1.1580/89
DT 3 km10/110.95/0.970.10/0.111.16/1.1670/82
HK SheungDT 10 km26/280.87/0.910.14/0.101.09/0.9881/89
DB 10 km19/200.76/0.570.32/0.310.44/0.4716/15
DTDB 10 km26/280.87/0.910.14/0.101.09/0.9881/89
DT 3 km 37/380.89/0.860.12/0.101.12/1.0370/76
a N = number of collocations; b RMSE = the root mean square error; c RMB = the relative mean bias, it is the ratio of the satellite mean to the AERONET mean; d EE = expected error, ± (0.05 + 0.15AOD).

