Next Issue
Volume 12, August
Previous Issue
Volume 12, June


Hydrology, Volume 12, Issue 7 (July 2025) – 35 articles

Cover Story (view full-size image): 
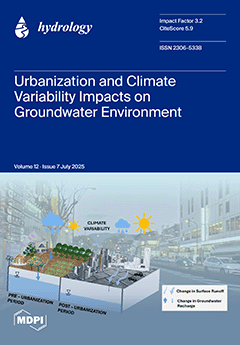
Groundwater resources worldwide are facing a decline in hydraulic heads due to the combined impacts of urbanization and climate forcings. This study evaluated the impact of these two forcings on groundwater resources during the Pre- and Post-Urbanization Periods (PreUP:1980–1988; PostUP:2000–2008) within a multi-layer aquifer system. Our findings indicate a significant decrease in hydraulic heads of about 5 m from the PreUP to PostUP in the unconfined aquifer, influenced by land use and climate change. In contrast, the average head decline in deep confined aquifers is about 4 m and is mainly influenced by long-term climatic variations. The impervious land use types experienced greater declines in hydraulic heads than permeable areas due to impeded groundwater recharge, which exacerbates the climate variability effect. View this paper
  • Issues are regarded as officially published after their release is announced to the table of contents alert mailing list.
  • You may sign up for e-mail alerts to receive table of contents of newly released issues.
  • PDF is the official format for papers published in both, html and pdf forms. To view the papers in pdf format, click on the "PDF Full-text" link, and use the free Adobe Reader to open them.
Order results
Result details
Section
Select all
Export citation of selected articles as:
28 pages, 12894 KiB  
Article
Evolution of Rainfall Characteristics in Catalonia, Spain, Using a Moving-Window Approach (1950–2022)
by Carina Serra, María del Carmen Casas-Castillo, Raül Rodríguez-Solà and Cristina Periago
Hydrology 2025, 12(7), 194; https://doi.org/10.3390/hydrology12070194 - 19 Jul 2025
Viewed by 213
Abstract
A comprehensive analysis of the evolution of rainfall characteristics in Catalonia, NE Spain, was conducted using monthly data from 72 rain gauges over the period 1950–2022. A moving-window approach was applied at annual, seasonal, and monthly scales, calculating mean values, coefficients of variation [...] Read more.
A comprehensive analysis of the evolution of rainfall characteristics in Catalonia, NE Spain, was conducted using monthly data from 72 rain gauges over the period 1950–2022. A moving-window approach was applied at annual, seasonal, and monthly scales, calculating mean values, coefficients of variation (CV), and trends across 43 overlapping 31-year periods. To assess trends in these moving statistics, a modified Mann–Kendall test was applied to both the 31-year means and CVs. Results revealed a significant 10% decrease in annual rainfall, with summer showing the most pronounced decline, as nearly 90% of stations exhibited negative trends, while the CV showed negative trends in coastal areas and mostly positive trends inland. At the monthly scale, February, March, June, August, and December exhibited negative trends at more than 50% of stations, with rainfall reductions ranging from 20% to 30%. Additionally, the temporal evolution of Mann–Kendall trend coefficients within each 31-year moving window displayed a fourth-degree polynomial pattern, with a periodicity of 30–35 years at annual and seasonal scales, and for some months. Finally, at the annual scale and in two centennial series, the 80-year oscillations found were inversely correlated with the large-scale climate indices North Atlantic Oscillation (NAO) and Atlantic Multidecadal Oscillation (AMO). Full article
Show Figures

Figure 1

24 pages, 5725 KiB  
Article
Modeling of Hydrological Processes in a Coal Mining Subsidence Area with High Groundwater Levels Based on Scenario Simulations
by Shiyuan Zhou, Hao Chen, Qinghe Hou, Haodong Liu and Pingjia Luo
Hydrology 2025, 12(7), 193; https://doi.org/10.3390/hydrology12070193 - 19 Jul 2025
Viewed by 213
Abstract
The Eastern Huang–Huai region of China is a representative mining area with a high groundwater level. High-intensity underground mining activities have not only induced land cover and land use changes (LUCC) but also significantly changed the watershed hydrological behavior. This study integrated the [...] Read more.
The Eastern Huang–Huai region of China is a representative mining area with a high groundwater level. High-intensity underground mining activities have not only induced land cover and land use changes (LUCC) but also significantly changed the watershed hydrological behavior. This study integrated the land use prediction model PLUS and the hydrological simulation model MIKE 21. Taking the Bahe River Watershed in Huaibei City, China, as an example, it simulated the hydrological response trends of the watershed in 2037 under different land use scenarios. The results demonstrate the following: (1) The land use predictions for each scenario exhibit significant variation. In the maximum subsidence scenario, the expansion of water areas is most pronounced. In the planning scenario, the increase in construction land is notable. Across all scenarios, the area of cultivated land decreases. (2) In the maximum subsidence scenario, the area of high-intensity waterlogging is the greatest, accounting for 31.35% of the total area of the watershed; in the planning scenario, the proportion of high-intensity waterlogged is the least, at 19.10%. (3) In the maximum subsidence scenario, owing to the water storage effect of the subsidence depression, the flood peak is conspicuously delayed and attains the maximum value of 192.3 m3/s. In the planning scenario, the land reclamation rate and ecological restoration rate of subsidence area are the highest, while the regional water storage capacity is the lowest. As a result, the total cumulative runoff is the greatest, and the peak flood value is reduced. The influence of different degrees of subsidence on the watershed hydrological behavior varies, and the coal mining subsidence area has the potential to regulate and store runoff and perform hydrological regulation. The results reveal the mechanism through which different land use scenarios influence hydrological processes, which provides a scientific basis for the territorial space planning and sustainable development of coal mining subsidence areas. Full article
Show Figures

Figure 1

17 pages, 1939 KiB  
Article
Comprehensive Assessment of Water Quality of China’s Largest Freshwater Lake Under the Impact of Extreme Floods and Droughts
by Zhiyu Mao, Junxiang Cheng, Ligang Xu, Mingliang Jiang and Hailin You
Hydrology 2025, 12(7), 192; https://doi.org/10.3390/hydrology12070192 - 14 Jul 2025
Viewed by 454
Abstract
Poyang Lake, a large floodplain lake, plays a crucial role in the ecological safety and quality of life in surrounding areas. Over the past decade (2013–2022), amid economic development and environmental changes, the water environment of Poyang Lake has encountered complex challenges. This [...] Read more.
Poyang Lake, a large floodplain lake, plays a crucial role in the ecological safety and quality of life in surrounding areas. Over the past decade (2013–2022), amid economic development and environmental changes, the water environment of Poyang Lake has encountered complex challenges. This study evaluated the water quality of Poyang Lake in a recent 10-year span by the water quality index (WQI), trophic level index (TLI) and a newly constructed comprehensive evaluation index, and it analyzed the trend of water quality change under extreme events. Meanwhile, the main factors affecting the water quality of Poyang Lake were analyzed by partial least squares (PLS), a multivariate statistical method that accounts for multicollinearity. The results indicate that: (1) The water quality of Poyang Lake in summer and autumn is slightly worse than that in spring and winter. Each water quality index reflects the distinct states of the water environment in Poyang Lake. (2) Each water quality evaluation index responds differently to influencing factors. (3) Extreme flood and drought events have markedly different impacts on the water environment of Poyang Lake, exhibiting significant spatial heterogeneity. Domestic sewage discharge and total water resources have a relatively great impact on the water environment of Poyang Lake. The results of this study provide important insights for water quality management and policy formulation in Poyang Lake, supporting sustainable regional development. Full article
Show Figures

Figure 1

19 pages, 2285 KiB  
Review
Aquatic Pollution in the Bay of Bengal: Impacts on Fisheries and Ecosystems
by Nowrin Akter Shaika, Saleha Khan, Sadiqul Awal, Md. Mahfuzul Haque, Abul Bashar and Halis Simsek
Hydrology 2025, 12(7), 191; https://doi.org/10.3390/hydrology12070191 - 11 Jul 2025
Viewed by 566
Abstract
Aquatic pollution in the Bay of Bengal has become a major environmental issue with long-term impacts on fisheries, biodiversity, and ecosystems. The review paper examines the major pathways, sources, and ecological consequences of aquatic pollution in the Bay of Bengal. Pollutants such as [...] Read more.
Aquatic pollution in the Bay of Bengal has become a major environmental issue with long-term impacts on fisheries, biodiversity, and ecosystems. The review paper examines the major pathways, sources, and ecological consequences of aquatic pollution in the Bay of Bengal. Pollutants such as heavy metals, pesticides, petroleum hydrocarbons, and microplastics have been reported at concerning levels in the soil and water in aquatic ecosystems. Rivers act as key routes, transporting pollutants from inland sources to the Bay of Bengal. These contaminants disrupt metabolic and physiological functions in fish and other aquatic species and pose serious threats to food safety and public health through bioaccumulation. Harmful algal blooms (HABs), caused by nutrient enrichment, further exacerbate ecosystem degradation in the Bay of Bengal. The review highlights the immediate need for strengthened pollution control regulations, real-time water quality monitoring, sustainable farming practices, and community-based policy interventions to preserve biodiversity and safeguard fisheries. Full article
(This article belongs to the Section Surface Waters and Groundwaters)
Show Figures

Figure 1

19 pages, 3696 KiB  
Article
Reproducibility Limits of the Frequency Equation for Estimating Long-Linear Internal Wave Periods in Lake Biwa
by Hibiki Yoneda, Chunmeng Jiao, Keisuke Nakayama, Hiroki Matsumoto and Kazuhide Hayakawa
Hydrology 2025, 12(7), 190; https://doi.org/10.3390/hydrology12070190 - 11 Jul 2025
Viewed by 209
Abstract
In a large deep lake, the generation of internal Kelvin waves and internal Poincaré waves due to wind stress on the lake surface is a significant phenomenon. These internal waves play a crucial role in material transport within the lake and have profound [...] Read more.
In a large deep lake, the generation of internal Kelvin waves and internal Poincaré waves due to wind stress on the lake surface is a significant phenomenon. These internal waves play a crucial role in material transport within the lake and have profound effects on its ecosystem and environment. Our study, which investigated the modes of internal waves in Lake Biwa using the vertical temperature distribution from field observations, has yielded important findings. We have demonstrated the applicability of the frequency equation solutions, considering the Coriolis force. The period of the internal Poincaré waves, as observed in the field, was found to match the solutions of the frequency equation. For example, observational data collected in late October revealed excellent agreement with the theoretical solutions derived from the frequency equation, showing periods of 14.7 h, 11.8 h, 8.2 h, and 6.3 h compared to the theoretical values of 14.4 h, 11.7 h, 8.5 h, and 6.1 h, respectively. However, the periods of the internal Kelvin waves in the field observation results were longer than those of the theoretical solutions. The Modified Mathew function uses a series expansion around qi=0, making it difficult to estimate the periods of internal Kelvin waves under conditions where qi>1.0. Furthermore, in lakes with an elliptical shape, such as Lake Biwa, the elliptical cylinder showed better reproducibility than the circular cylinder. These findings have significant implications for the rapid estimation of internal wave periods using the frequency equation. Full article
(This article belongs to the Section Hydrological and Hydrodynamic Processes and Modelling)
Show Figures

Figure 1

26 pages, 7164 KiB  
Article
Evapotranspiration Partitioning in Selected Subtropical Fruit Tree Orchards Based on Sentinel 2 Data Using a Light Gradient-Boosting Machine (LightGBM) Learning Model in Malelane, South Africa
by Prince Dangare, Zama E. Mashimbye, Paul J. R. Cronje, Joseph N. Masanganise, Shaeden Gokool, Zanele Ntshidi, Vivek Naiken, Tendai Sawunyama and Sebinasi Dzikiti
Hydrology 2025, 12(7), 189; https://doi.org/10.3390/hydrology12070189 - 11 Jul 2025
Viewed by 366
Abstract
The accurate estimation of evapotranspiration (ET) and its components are vital for water resource management and irrigation planning. This study models tree transpiration (T) and ET for grapefruit, litchi, and mango orchards using light gradient-boosting machine (LightGBM) [...] Read more.
The accurate estimation of evapotranspiration (ET) and its components are vital for water resource management and irrigation planning. This study models tree transpiration (T) and ET for grapefruit, litchi, and mango orchards using light gradient-boosting machine (LightGBM) optimized using the Bayesian hyperparameter optimization. Grounds T and ET for these crops were measured using the heat ratio method of monitoring sap flow and the eddy covariance technique for quantifying ET. The Sentinel 2 satellite was used to compute field leaf area index (LAI). The modelled data were used to partition the orchard ET into beneficial (T) and non-beneficial water uses (orchard floor evaporation—Es). We adopted the 10-fold cross-validation to test the model robustness and an independent validation to test performance on unseen data. The 10-fold cross-validation and independent validation on ET and T models produced high accuracy with coefficient of determination (R2) 0.88, Kling–Gupta efficiency (KGE) 0.91, root mean square error (RMSE) 0.04 mm/h, and mean absolute error (MAE) 0.03 mm/h for all the crops. The study demonstrates that LightGBM can accurately model the transpiration and evapotranspiration for subtropical tree crops using Sentinel 2 data. The study found that Es which combined soil evaporation and understorey vegetation transpiration contributed 35, 32, and 31% to the grapefruit, litchi and mango orchard evapotranspiration, respectively. We conclude that improvements on orchard floor management practices can be utilized to minimize non-beneficial water losses while promoting the productive water use (T). Full article
(This article belongs to the Special Issue GIS Modelling of Evapotranspiration with Remote Sensing)
Show Figures

Figure 1

19 pages, 10696 KiB  
Article
Dynamics of Nocturnal Evapotranspiration in a Dry Region of the Chinese Loess Plateau: A Multi-Timescale Analysis
by Fengnian Guo, Dengfeng Liu, Shuhong Mo, Qiang Li, Fubo Zhao, Mingliang Li and Fiaz Hussain
Hydrology 2025, 12(7), 188; https://doi.org/10.3390/hydrology12070188 - 10 Jul 2025
Viewed by 234
Abstract
Evapotranspiration (ET) is an important part of agricultural water consumption, yet little is known about nocturnal evapotranspiration (ETN) patterns. An eddy covariance system was used to observe ET over five consecutive years (2020–2024) during the growing season in a [...] Read more.
Evapotranspiration (ET) is an important part of agricultural water consumption, yet little is known about nocturnal evapotranspiration (ETN) patterns. An eddy covariance system was used to observe ET over five consecutive years (2020–2024) during the growing season in a dry farming area of the Loess Plateau. Daytime and nocturnal evapotranspiration were partitioned using the photosynthetically active radiation threshold to reveal the changing characteristics of ETN at multiple time scales and its control variables. The results showed the following: (1) In contrast to the non-significant trend in ETN on the diurnal and daily scales, monthly ETN dynamics exhibited two peak fluctuations during the growing season. (2) The contribution of ETN to ET exhibited seasonal characteristics, being relatively low in summer, with interannual variations ranging from 10.9% to 14.3% and an annual average of 12.8%. (3) The half-hourly ETN, determined by machine learning methods, was driven by a combination of factors. The main driving factors were the difference between surface temperature and air temperature (Ts-Ta) and net radiation (Rn), which have almost equivalent contributions. Regression analysis results suggested that Ta was the main factor influencing ETN/ET at the monthly scale. This study focuses on the nighttime water loss process in dry farming fields in Northwest China, and the results provide a basis for rational allocation and efficient utilization of agricultural water resources in arid regions. Full article
(This article belongs to the Section Hydrology–Climate Interactions)
Show Figures

Figure 1

19 pages, 13316 KiB  
Article
Mapping of Closed Depressions in Karst Terrains: A GIS-Based Delineation of Endorheic Catchments in the Alburni Massif (Southern Apennine, Italy)
by Libera Esposito, Guido Leone, Michele Ginolfi, Saman Abbasi Chenari and Francesco Fiorillo
Hydrology 2025, 12(7), 186; https://doi.org/10.3390/hydrology12070186 - 10 Jul 2025
Viewed by 296
Abstract
A deep interaction between groundwater and surface hydrology characterizes karst environments. These settings feature closed depressions, whose hydrological role varies depending on whether they have genetic and hydraulic relationships with overland–subsurface flow (epigenic) or deep groundwater circulation (hypogenic). Epigenic dolines and poljes are [...] Read more.
A deep interaction between groundwater and surface hydrology characterizes karst environments. These settings feature closed depressions, whose hydrological role varies depending on whether they have genetic and hydraulic relationships with overland–subsurface flow (epigenic) or deep groundwater circulation (hypogenic). Epigenic dolines and poljes are among the diagnostic landforms of karst terrains. In this study, we applied a hydrological criterion to map closed depressions—including dolines—across the Alburni karst massif, in southern Italy. A GIS-based, semi-automatic approach was employed, combining the sink-filling method (applied to a 5 m DEM) with the visual interpretation of various informative layers. This process produced a raster representing the location and depth of karst closed depressions. This raster was then used to automatically delineate endorheic areas using classic GIS tools. The resulting map reveals a thousand dolines and hundreds of adjacent endorheic areas. Endorheic areas form a complex mosaic across the massif, a feature that had been poorly emphasized in previous works. The main morphometric features of the dolines and endorheic areas were statistically analyzed and compared with the structural characteristics of the massif. The results of the proposed mapping approach provide valuable insights for groundwater management, karst area protection, recharge modeling, and tracer test planning. Full article
Show Figures

Figure 1

15 pages, 2181 KiB  
Article
The Impact of Shifts in Both Precipitation Pattern and Temperature Changes on River Discharge in Central Japan
by Bing Zhang, Jingyan Han, Jianbo Liu and Yong Zhao
Hydrology 2025, 12(7), 187; https://doi.org/10.3390/hydrology12070187 - 9 Jul 2025
Viewed by 362
Abstract
Rivers play a crucial role in the hydrological cycle and serve as essential freshwater resources for both human populations and ecosystems. Climate change significantly alters precipitation patterns and river discharge variability. However, the impact of precipitation patterns (rainfall and snowfall) and air temperature [...] Read more.
Rivers play a crucial role in the hydrological cycle and serve as essential freshwater resources for both human populations and ecosystems. Climate change significantly alters precipitation patterns and river discharge variability. However, the impact of precipitation patterns (rainfall and snowfall) and air temperature on river discharge in coastal zones remains inadequately understood. This study focused on Toyama Prefecture, located along the Sea of Japan, as a representative coastal area. We analyzed over 30 years of datasets, including air temperature, precipitation, snowfall, and river discharge, to assess the effects of climate change on river discharge. Trends in hydroclimatic datasets were assessed using the rescaled adjusted partial sums (RAPS) method and the Mann–Kendall (MK) non-parametric test. Furthermore, a correlation analysis and the Structural Equation Model (SEM) were applied to construct a relationship between precipitation, temperature, and river discharge. Our findings indicated a significant increase in air temperature at a rate of 0.2 °C per decade, with notable warming observed in late winter (January and February) and early spring (March). The average river fluxes for the Jinzu, Oyabe, Kurobe, Shou, and Joganji rivers were 182.52 m3/s, 60.37 m3/s, 41.40 m3/s, 38.33 m3/s, and 18.72 m3/s, respectively. The tipping point for snowfall decline occurred in 1992, marked by an obvious decrease in snowfall depth. The SEM showed that, although rainfall dominated the changes in river discharge (loading = 0.94), the transition from solid (snow) to liquid (rain) precipitation may alter the river discharge regime. The percentage of flood occurrence increased from 19% (1940–1992) to 41% (1993–2020). These changes highlight the urgent need to raise awareness about the impacts of climate change on river floods and freshwater resources in global coastal regions. Full article
Show Figures

Figure 1

14 pages, 1711 KiB  
Article
Using Machine Learning to Develop a Surrogate Model for Simulating Multispecies Contaminant Transport in Groundwater
by Thu-Uyen Nguyen, Heejun Suk, Ching-Ping Liang, Yu-Chieh Ho and Jui-Sheng Chen
Hydrology 2025, 12(7), 185; https://doi.org/10.3390/hydrology12070185 - 8 Jul 2025
Viewed by 416
Abstract
Traditional numerical models have been widely employed to simulate the transport of multispecies reactive contaminants in groundwater systems; however, their high computational cost limits their applicability in real-time or large-scale scenarios. Recent advances in artificial intelligence (AI) offer promising alternatives, particularly data-driven machine [...] Read more.
Traditional numerical models have been widely employed to simulate the transport of multispecies reactive contaminants in groundwater systems; however, their high computational cost limits their applicability in real-time or large-scale scenarios. Recent advances in artificial intelligence (AI) offer promising alternatives, particularly data-driven machine learning techniques, for accelerating such simulations. This study presents the development of a surrogate model based on artificial neural networks (ANNs) to simulate the transport and decay of interacting multispecies contaminants in groundwater. High-fidelity training datasets are generated through finite difference-based reactive transport simulations across a wide range of environmental and geochemical conditions. The ANN model is trained to learn the complex nonlinear relationships governing the multispecies transport and transformation processes. Model validation reveals that the ANN surrogate accurately reproduces the spatial–temporal concentration profiles of both original and degradation species, capturing key dynamic behaviors with high precision. Notably, the ANN model achieves up to a 100-fold reduction in computational time compared to traditional analytical or semi-analytical solutions. These results highlight the ANN’s potential as an efficient and accurate surrogate modeling tool for groundwater contamination assessment, offering a valuable advancement for decision-making in environmental risk analysis and remediation planning. Full article
(This article belongs to the Topic Advances in Groundwater Science and Engineering)
Show Figures

Figure 1

19 pages, 46997 KiB  
Article
Integrating the PLUS-InVEST Model to Project Water Conservation Dynamics and Decipher Climatic Drivers in the Chengdu–Chongqing Economic Zone Under Multiple Future Scenarios
by Kangwen Zhu, Suqiong Li, Wei Huang, Peng Hou, Yaqun Liu, Jian Liu and Zihui Li
Hydrology 2025, 12(7), 184; https://doi.org/10.3390/hydrology12070184 - 7 Jul 2025
Viewed by 373
Abstract
Identifying the evolutionary trends of water conservation functions and their climatic impacts under future scenarios is crucial for enhancing regional ecological security. This study integrates the PLUS and InVEST models with projected land use and meteorological data to analyze water conservation patterns in [...] Read more.
Identifying the evolutionary trends of water conservation functions and their climatic impacts under future scenarios is crucial for enhancing regional ecological security. This study integrates the PLUS and InVEST models with projected land use and meteorological data to analyze water conservation patterns in the Chengdu–Chongqing Economic Zone during 2030–2050 under natural development (ND) and ecological protection (EP) scenarios. Key findings include the following: (1) during 2000–2020, low-value areas decreased from 60% to 40%, while high-value zones expanded from 27.32% to 40.35%; (2) both the ND and EP scenarios project lower water conservation volumes compared to 2020 levels; (3) under the ND scenario, the combined proportion of high and extreme importance zones fluctuates at 0.51% (2030), 0.11% (2040), and 3.97% (2050); (4) spatial heterogeneity shows high-value clusters concentrated in Chengdu’s urban core and northeastern regions, contrasting with midland low-value areas; (5) the SSP1-1.9 climate scenario yields higher water conservation capacity with stronger spatial aggregation compared to SSP2-4.5. This integrated modeling of PLUS and InVEST provides scientific support for regional ecological security and sustainable development strategies. Full article
Show Figures

Figure 1

31 pages, 19561 KiB  
Article
Geostatistics Precision Agriculture Modeling on Moisture Root Zone Profiles in Clay Loam and Clay Soils, Using Time Domain Reflectometry Multisensors and Soil Analysis
by Agathos Filintas
Hydrology 2025, 12(7), 183; https://doi.org/10.3390/hydrology12070183 - 7 Jul 2025
Cited by 1 | Viewed by 419
Abstract
Accurate measurement and understanding of the spatiotemporal distribution of soil water content (SWC) are crucial in various environmental and agricultural sectors. The present study implements a novel precision agriculture (PA) approach under sugarbeet field conditions of two moisture-irrigation treatments with two subfactors, clay [...] Read more.
Accurate measurement and understanding of the spatiotemporal distribution of soil water content (SWC) are crucial in various environmental and agricultural sectors. The present study implements a novel precision agriculture (PA) approach under sugarbeet field conditions of two moisture-irrigation treatments with two subfactors, clay loam (CL) and clay (C) soils, for geostatistics modeling (seven models’ evaluation) of time domain reflectometry (TDR) multisensor network measurements. Two different sensor calibration methods (M1 and M2) were trialed, as well as the results of laboratory soil analysis for geospatial two-dimensional (2D) imaging for accurate GIS maps of root zone moisture profiles, granular, and hydraulic profiles in multiple soil layers (0–75 cm depth). Modeling results revealed that the best-fitted semi-variogram models for the granular attributes were circular, exponential, pentaspherical, and spherical, while for hydraulic attributes were found to be exponential, circular, and spherical models. The results showed that kriging modeling, spatial and temporal imaging for accurate profile SWC θvTDR (m3·m−3) maps, the exponential model was identified as the most appropriate with TDR sensors using calibration M1, and the exponential and spherical models were the most appropriate when using calibration M2. The resulting PA profile maps depict spatiotemporal soil water variability with very high resolutions at the centimeter scale. The best validation measures of PA profile SWC θvTDR maps obtained were Nash-Sutcliffe model efficiency NSE = 0.6657, MPE = 0.00013, RMSE = 0.0385, MSPE = −0.0022, RMSSE = 1.6907, ASE = 0.0418, and MSDR = 0.9695. The sensor results using calibration M2 were found to be more valuable in environmental irrigation decision-making for a more accurate and timely decision on actual crop irrigation, with the lowest statistical and geostatistical errors. The best validation measures for accurate profile SWC θvTDR (m3·m−3) maps obtained for clay loam over clay soils. Visualizing the SWC results and their temporal changes via root zone profile geostatistical maps assists farmers and scientists in making informed and timely environmental irrigation decisions, optimizing energy, saving water, increasing water-use efficiency and crop production, reducing costs, and managing water–soil resources sustainably. Full article
(This article belongs to the Special Issue Hydrological Processes in Agricultural Watersheds)
Show Figures

Figure 1

16 pages, 5095 KiB  
Article
Analyzing the Impact of Climate Change on Compound Flooding Under Interdecadal Variations in Rainfall and Tide
by Jiun-Huei Jang, Tien-Hao Chang, Yen-Mo Wu, Ting-En Liao and Chih-Hung Hsu
Hydrology 2025, 12(7), 182; https://doi.org/10.3390/hydrology12070182 - 6 Jul 2025
Viewed by 416
Abstract
Coastal regions are increasingly threatened by compound flooding due to the increasing intensities of storm surges and rainfall under climate change. However, relevant research has been limited because significant amounts of data, scenarios, and computations are often required to evaluate long-term variations in [...] Read more.
Coastal regions are increasingly threatened by compound flooding due to the increasing intensities of storm surges and rainfall under climate change. However, relevant research has been limited because significant amounts of data, scenarios, and computations are often required to evaluate long-term variations in compound flood risk. In this study, a framework was proposed through efficient hydraulic simulations and a consequence-based statistical method using data projected under different general circulation models (GCMs). The analysis focuses on analyzing the interdecadal trends of compound flood risk for a coastal area in southwestern Taiwan across a baseline period and four future periods in the short-term (2021–2040), mid-term (2041–2060), mid-to-long-term (2061–2080), and long-term (2081–2100). Although discrepancies exist in the short term, the results show that the values of the annual maximum flood area exhibit an increasing pattern in the future for all GCMs by increasing about 27.8% on average at the end of the 21st century. This means that, under the same flood areas given in the baseline period, the return periods will decrease, and flood events will occur more frequently in the future. This framework can be extended to other regions to assess the impacts of compound flooding with different geographical and meteorological conditions. Full article
(This article belongs to the Special Issue Runoff Modelling under Climate Change)
Show Figures

Figure 1

13 pages, 1512 KiB  
Article
Uncertainty in Kinetic Energy Models for Rainfall Erosivity Estimation in Semi-Arid Regions
by José Bandeira Brasil, Ana Célia Maia Meireles, Carlos Wagner Oliveira, Sirleide Maria de Menezes, Francisco Dirceu Duarte Arraes and Maria Simas Guerreiro
Hydrology 2025, 12(7), 181; https://doi.org/10.3390/hydrology12070181 - 4 Jul 2025
Viewed by 346
Abstract
The Brazilian semi-arid Northeast plays a critical role in regional hydrology, where rainfall is marked by pronounced temporal variability and short duration, presenting significant challenges for understanding and managing hydrological and erosive processes. This study aims to evaluate the performance of empirical models [...] Read more.
The Brazilian semi-arid Northeast plays a critical role in regional hydrology, where rainfall is marked by pronounced temporal variability and short duration, presenting significant challenges for understanding and managing hydrological and erosive processes. This study aims to evaluate the performance of empirical models for estimating rainfall kinetic energy (KE) and erosivity index (EI30) in this region, for all events and erosive events, using high-resolution rainfall data collected at the Federal University of Cariri (UFCA), Ceará. A total of 283 natural rainfall events were analyzed, with KE and EI30 values calculated using multiple models: Wischmeier and Smith, USDA, Van Dijk, a temporal variation-based model (KE_VT), and a regional model developed for Brazil’s semi-arid zone, which served as the reference. The results show a predominance of small rainfall events (<5.2 mm), though maximum EI30 values exceeded 1300 MJ ha−1 mm h−1, highlighting the potential for extreme erosive events. Comparative analysis revealed that all international models significantly underestimated KE and EI30 values compared to the regional reference, with the KE_VT model showing the closest approximation (13% underestimation), for all events and erosive events. Statistical assessments using the Wilcoxon test, Nash–Sutcliffe efficiency, and Willmott concordance index confirmed the superior performance of the KE_VT, for all events and erosive events. These findings underscore the importance of considering intra-event rainfall variability and regional calibration when modeling erosivity in semi-arid climates, contributing to more effective soil conservation and hydrological planning. Full article
Show Figures

Figure 1

16 pages, 5918 KiB  
Article
Effects of Climate Change and Human Activities on the Flow of the Muling River
by Xiang Meng, Chang-Lei Dai, Yi-Ding Zhang, Geng-Wei Liu, Xiao Yang and Xue Feng
Hydrology 2025, 12(7), 180; https://doi.org/10.3390/hydrology12070180 - 3 Jul 2025
Viewed by 204
Abstract
In the context of global warming and the intensification of human activities, the change in runoff is also increasing. It is very important to determine the change in runoff for the rational utilization of water resources. In order to determine the influencing factors [...] Read more.
In the context of global warming and the intensification of human activities, the change in runoff is also increasing. It is very important to determine the change in runoff for the rational utilization of water resources. In order to determine the influencing factors of runoff change in Muling River, the SWAT model was used in this study to separate different coupling factors and calculate the contribution rate of a single factor to runoff change at the annual scale and quarterly scale, respectively. In the process of calibration, different single rate times were used to analyze the influence of different rate times on the calibration results. The results show that the runoff in the Muling River basin shows a downward trend, the quarterly temperature factor has the greatest influence on the runoff change, which is 50–60%, the annual precipitation has the greatest influence on the runoff change, which is 68%, and the maximum change in the runoff from the reservoir is 42.5% under the change in human activities. In the SWAT-CUP software, the optimal number of calibration for this basin is 500. This research provides a scientific basis for the flow analysis of the Muling River basin. Full article
Show Figures

Figure 1

29 pages, 12574 KiB  
Article
Weathering Records from an Early Cretaceous Syn-Rift Lake
by Yaohua Li, Qianyou Wang and Richard H. Worden
Hydrology 2025, 12(7), 179; https://doi.org/10.3390/hydrology12070179 - 3 Jul 2025
Viewed by 243
Abstract
The Aptian–Albian interval represents a significant cooling phase within the Cretaceous “hothouse” climate, marked by dynamic climatic fluctuations. High-resolution continental records are essential for reconstructing terrestrial climate and ecosystem evolution during this period. This study examines a lacustrine-dominated succession of the Shahezi Formation [...] Read more.
The Aptian–Albian interval represents a significant cooling phase within the Cretaceous “hothouse” climate, marked by dynamic climatic fluctuations. High-resolution continental records are essential for reconstructing terrestrial climate and ecosystem evolution during this period. This study examines a lacustrine-dominated succession of the Shahezi Formation (Lishu Rift Depression, Songliao Basin, NE Asia) to access paleo-weathering intensity and paleoclimate variability between the Middle Aptian and Early Albian (c. 118.2–112.3 Ma). Multiple geochemical proxies, including the Chemical Index of Alteration (CIA), were applied within a sequence stratigraphic framework covering four stages of lake evolution. Our results indicate that a hot and humid subtropical climate predominated in the Lishu paleo-lake, punctuated by transient cooling and drying events. Periods of lake expansion corresponded to episodes of intense chemical weathering, while two distinct intervals of aridity and cooling coincided with phases of a reduced lake level and fan delta progradation. To address the impact of potassium enrichment on CIA values, we introduced a rectangular coordinate system on A(Al2O3)-CN(CaO* + Na2O)-K(K2O) ternary diagrams, enabling more accurate weathering trends and CIA corrections (CIAcorr). Uncertainties in CIA correction were evaluated by integrating geochemical and petrographic evidence from deposits affected by hydrothermal fluids and external potassium addition. Importantly, our results show that metasomatic potassium addition cannot be reliably inferred solely from deviations in A-CN-K diagrams or the presence of authigenic illite and altered plagioclase. Calculations of “excess K2O” and CIAcorr values should only be made when supported by robust geochemical and petrographic evidence for external potassium enrichment. This work advances lacustrine paleoclimate reconstruction methodology and highlights the need for careful interpretation of weathering proxies in complex sedimentary systems. Full article
(This article belongs to the Special Issue Lakes as Sensitive Indicators of Hydrology, Environment, and Climate)
Show Figures

Figure 1

24 pages, 10218 KiB  
Article
Rainfall Organization and Storm Tracking in Urban Barcelona, NE Spain, Using a High-Resolution Rain Gauge Network
by María del Carmen Casas-Castillo, Xavier Navarro and Raül Rodríguez-Solà
Hydrology 2025, 12(7), 178; https://doi.org/10.3390/hydrology12070178 - 3 Jul 2025
Cited by 1 | Viewed by 300
Abstract
Extreme rainfall in urban areas can cause major economic damage, a problem expected to intensify with climate change. Despite this, high-resolution studies at the city scale remain limited. This study analyzes rainfall organization and storm dynamics over Barcelona using data from a dense [...] Read more.
Extreme rainfall in urban areas can cause major economic damage, a problem expected to intensify with climate change. Despite this, high-resolution studies at the city scale remain limited. This study analyzes rainfall organization and storm dynamics over Barcelona using data from a dense rain gauge network (1994–2019). The aim is to identify dominant spatial patterns and understand how storms evolve in relation to local urban and topographic features. Principal component analysis and simple scaling analysis revealed signs of a rainfall island effect, possibly linked to the urban heat island and modulated by orographic and coastal influences. Tailored rainfall indices highlighted a division between inland areas shaped by orography and coastal zones influenced by the sea. These spatial structures evolved with rainfall duration, shifting from localized contrasts at a 10 min resolution to more homogeneous distributions at daily scales. Storm tracking showed that 90% of speeds ranged from 5 to 60 km/h and intense rainfall events typically moved east–southeast toward the sea and north–northeast. Faster storms tended to follow preferred directions reflecting mesoscale circulations and possible modulations by local terrain. These findings underscore how urban morphology, local relief, and a coastal setting may shape rainfall at the city scale, in interaction with broader Mediterranean synoptic dynamics. Full article
Show Figures

Graphical abstract

25 pages, 1568 KiB  
Article
Analysis of the Potential Impacts of Climate Change on the Mean Annual Water Balance and Precipitation Deficits for a Catchment in Southern Ecuador
by Luis-Felipe Duque, Greg O’Donnell, Jimmy Cordero, Jorge Jaramillo and Enda O’Connell
Hydrology 2025, 12(7), 177; https://doi.org/10.3390/hydrology12070177 - 2 Jul 2025
Viewed by 457
Abstract
The mean annual water balance is essential for evaluating water availability in a catchment and planning water resources. Climate change alters this balance by affecting precipitation, evapotranspiration, and overall water availability. This study analyses the impact of climate change on the mean annual [...] Read more.
The mean annual water balance is essential for evaluating water availability in a catchment and planning water resources. Climate change alters this balance by affecting precipitation, evapotranspiration, and overall water availability. This study analyses the impact of climate change on the mean annual water balance in the Catamayo catchment, a key water source for irrigation and hydropower in southern Ecuador and northern Peru. A Budyko-based approach was employed due to its conceptual simplicity and proven robustness for estimating long-term water balances under changing climatic conditions. Using outputs from 23 Global Circulation Models (GCMs) under CMIP6’s SSP2-4.5 and SSP8.5 scenarios, the results indicate increasing aridity, particularly in the lower and middle parts of the catchment, which correspond to arid and semi-arid zones. Water availability may decrease by 26.3 ± 12.3% to 33.3 ± 17% until 2080 due to negligible changes (statistically speaking) in average precipitation but rising evapotranspiration. However, historical precipitation analysis (1961–2020) reveals an increasing trend over this historical period which can be attributed to natural climatic variability associated to the El Nino-Southern Oscillation (ENSO), possibly enhanced by anthropogenic climate change. A novel hybrid method combining the statistics of historical precipitation deficits with GCM mean projections provides estimates of future precipitation deficits. These findings suggest potential reductions in crop yields and hydropower capacity, which (although not quantitatively assessed in this study) are inferred based on the projected decline in water availability. Such impacts could lead to higher energy costs, increased reliance on fossil fuels, and intensified competition for water. Mitigation measures, including water-saving strategies, energy diversification, and integrated water resource management, are recommended to address these challenges. Full article
Show Figures

Figure 1

23 pages, 2289 KiB  
Article
Experimental Study on Influence of Height of Full-Width Plate Weirs on Flow Behavior, Discharge, and Energy Dissipation
by Ali Mahdian Khalili, Hossein Sohrabzadeh Anzani, Mehdi Hamidi and Sameh Ahmed Kantoush
Hydrology 2025, 12(7), 176; https://doi.org/10.3390/hydrology12070176 - 1 Jul 2025
Viewed by 271
Abstract
The role of weirs in flow regulation in water resources infrastructure and flood control is well known. In the meantime, the study of full-width plate weirs (FWPW), due to their wide application and lacking findings, is of great importance. In this study, experimental [...] Read more.
The role of weirs in flow regulation in water resources infrastructure and flood control is well known. In the meantime, the study of full-width plate weirs (FWPW), due to their wide application and lacking findings, is of great importance. In this study, experimental models were conducted at Babol Noshirvani University of Technology to investigate flow passing through FWPWs with five different heights (p = 0.07, 0.09, 0.11, and 0.15 m) under eight discharge conditions (Q = 1.4 to 6.3 L/s). The experiments were carried out in a flume measuring 4 m in length, 0.6 m in width, and 0.2 m in height. The discharges were measured with a calibrated flowmeter, and the water depths upstream of the weir (h) and the tailwater depths (h1) were measured with a point gauge with an accuracy of 0.1 mm. For each test, the discharge coefficient (Cd), relative residual energy (E1/E0), and relative energy dissipation ((E0E1)/E0) were computed. The proposed equation for calculating discharge achieved good accuracy with RMSE = 0.0002, MAE=0.0002, and R2 = 0.997. Results show a reducing trend of Cd by increasing h/P, which is compatible with previous results. It was observed that at a constant discharge, relative residual energy reduces by an average of 47% by increasing weir height, and at a constant P, increasing flow discharge increases it a little. A novel accurate equation for relative energy dissipation in FWPW was proposed based on h/P that provided specific constant coefficients for each p value. Full article
(This article belongs to the Section Hydrological and Hydrodynamic Processes and Modelling)
Show Figures

Figure 1

27 pages, 5041 KiB  
Article
Differential Evolution in Hydrochemical Characteristics Amongst Porous, Fissured and Karst Aquifers in China
by Chengsong Li, Jie Fang, Feisheng Feng, Tingting Yao, Yongping Shan and Wanli Su
Hydrology 2025, 12(7), 175; https://doi.org/10.3390/hydrology12070175 - 1 Jul 2025
Viewed by 385
Abstract
The efficacy of water resource management and protection hinges on a profound understanding of the controlling factors and regulatory mechanisms that shape groundwater chemistry within aquifers. Despite this, our comprehension of how groundwater chemistry and ion sources vary across diverse aquifer types remained [...] Read more.
The efficacy of water resource management and protection hinges on a profound understanding of the controlling factors and regulatory mechanisms that shape groundwater chemistry within aquifers. Despite this, our comprehension of how groundwater chemistry and ion sources vary across diverse aquifer types remained limited. To bridge this gap, our study conducted a detailed hydrochemical and statistical investigation of porous, fissured, and karst aquifers. By applying multivariate statistical techniques, including principal component analysis (PCA) and hierarchical cluster analysis (HCA), the hydrochemical characteristics and main ion sources of each aquifer type, as well as distinct controlling factors and regulation patterns, were determined. Notably, evaporation predominantly affected the hydrochemistry of porous aquifers, whereas mineral dissolution and rock weathering processes played a pivotal role in shaping the groundwater evolution of fissured and karst aquifers. HCO3 and SO42− are the most common anions of all types, while Na+ is dominant in porous and fissured aquifers and Ca2+ is dominant in karst aquifers. The most common hydrochemical types identified were HCO3-Ca·Mg (accounting for approximately 56.84%) and SO4·Cl-Na (constituting approximately 21.75%). PCA results revealed that lateral recharge from fissured aquifers in hilly regions into the groundwater of porous aquifer, and wastewater discharge and agricultural fertilizer application, significantly impact the groundwater chemistry across all three aquifer types. It is worth noting that the dissolution of carbonate minerals, often influenced by human activities, had a profound effect on the hydrochemistry of each aquifer. Conversely, the dissolution of evaporitic minerals affected groundwater chemistry primarily through cation exchange processes. In summary, the hydrochemical characteristics of these aquifer types were predominantly shaped by a complex interplay of mineral dissolution, cation exchange, evaporation, and anthropogenic activities, with notable contributions from fissured aquifer recharge and pollution. These insights were critical for informing national-level strategies for groundwater resource protection and management. Full article
Show Figures

Figure 1

24 pages, 5443 KiB  
Article
The Characteristics and Trend Prediction of Water and Sediment Evolution at the Toudaoguai Station on the Yellow River from 1960 to 2019
by Chao Li, Jing Guo, Xinlei Guo and Hui Fu
Hydrology 2025, 12(7), 174; https://doi.org/10.3390/hydrology12070174 - 30 Jun 2025
Viewed by 217
Abstract
The Yellow River is a renowned sediment-laden river and analyzing its water–sediment evolution characteristics and trends is critical for rational water resource utilization and water security. Using annual runoff and sediment transport data from Toudaoguai Hydrological Station (1960–2019), Mann–Kendall tests, cumulative anomalies analysis, [...] Read more.
The Yellow River is a renowned sediment-laden river and analyzing its water–sediment evolution characteristics and trends is critical for rational water resource utilization and water security. Using annual runoff and sediment transport data from Toudaoguai Hydrological Station (1960–2019), Mann–Kendall tests, cumulative anomalies analysis, and wavelet analysis were used to investigate the decadal variations. A coupled ARIMA-BP model was developed to improve simulation accuracy over standalone ARIMA/BP models for trend prediction. The results showed significant decreasing trends in both runoff (Z = −3.22) and sediment transport (Z = −4.73) during 1960–2019, with change points in 1986 (runoff) and 1984 (sediment). The primary periodicities were 12 years for runoff and 31 years for sediment transport. The coupled model achieved good consistency (R2 = 0.9142 for runoff, 0.8637 for sediment), outperforming individual models. Projections indicate continued declines in both variables from 2020 to 2029. Natural factors are the main cause affecting the changes in runoff, while human activities are the primary influencing factor for the changes in sediment load. This study introduces a novel approach for water–sediment analysis in the Yellow River Basin, providing technical support for sustainable water resource management. Full article
Show Figures

Figure 1

20 pages, 4438 KiB  
Article
Impacts of Urbanization and Climate Variability on Groundwater Environment in a Basin Scale
by Olawale Joshua Abidakun, Mitsuyo Saito, Shin-ichi Onodera and Kunyang Wang
Hydrology 2025, 12(7), 173; https://doi.org/10.3390/hydrology12070173 - 30 Jun 2025
Viewed by 391
Abstract
Globally, groundwater resources are experiencing a decline in hydraulic heads resulting from the dual effects of urbanization and climate change, highlighting the need for integrated and sustainable water resources management. Urban development in the cities of Kansai region, western Japan, presents a significant [...] Read more.
Globally, groundwater resources are experiencing a decline in hydraulic heads resulting from the dual effects of urbanization and climate change, highlighting the need for integrated and sustainable water resources management. Urban development in the cities of Kansai region, western Japan, presents a significant challenge to the sustainability of groundwater resources. This study aims to assess the combined influence of urbanization and climate change on the groundwater resources of the Nara Basin using MODFLOW 6 for two distinct periods: The Pre-Urbanization Period (PreUP: 1980–1988), and the Post-Urbanization Period (PostUP, 2000–2008) with an emphasis on spatiotemporal distribution of recharge in a multi-layer aquifer system. Simulated hydraulic heads were evaluated under three different recharge scenarios: uniformly, spatiotemporally and spatially distributed. The uniform recharge scenario both overestimates and underestimates hydraulic heads, while the spatially distributed scenario produced a simulated heads distribution similar to the spatiotemporally distributed recharge scenario, underscoring the importance of incorporating spatiotemporal variability in recharge input for accurate groundwater flow simulation. Moreover, our results highlight the relevance of spatial distribution of recharge input than temporal distribution. Our findings indicate a significant decrease in hydraulic heads of approximately 5 m from the PreUP to PostUP in the unconfined aquifer, primarily driven by changes in land use and climate. In contrast, the average head decline in deep confined aquifers is about 4 m and is mainly influenced by long-term climatic variations. The impervious land use types experienced more decline in hydraulic heads than the permeable areas under changing climate because of the impedance to infiltration and percolation exacerbating the climate variability effect. These changes in hydraulic heads were particularly evident in the interactions between surface and groundwater. The cumulative volume of groundwater discharge to the river decreased by 27%, while the river seepage into the aquifer increased by 16%. Sustainable groundwater resources management under conditions of urbanization and climate change necessitates a holistic and integrated approach. Full article
(This article belongs to the Section Hydrological and Hydrodynamic Processes and Modelling)
Show Figures

Figure 1

25 pages, 4553 KiB  
Article
Predictive Modeling of Flood Frequency Utilizing an Analysis of the Casimcea River in Romania
by Carmen Maftei, Constantin Cerneaga and Ashok Vaseashta
Hydrology 2025, 12(7), 172; https://doi.org/10.3390/hydrology12070172 - 30 Jun 2025
Viewed by 260
Abstract
Flooding is a recurrent natural hazard in Romania, causing significant socio-economic impacts. Historical data highlights the severity of floods, particularly the unprecedented flood of 1926. Between 1960 and 2010, Romania experienced over 400 major floods, which significantly impacted its infrastructure and population. Particularly, [...] Read more.
Flooding is a recurrent natural hazard in Romania, causing significant socio-economic impacts. Historical data highlights the severity of floods, particularly the unprecedented flood of 1926. Between 1960 and 2010, Romania experienced over 400 major floods, which significantly impacted its infrastructure and population. Particularly, the floods in 2005 and 2006 affected over 1.5 million people, resulting in 93 deaths and causing damages exceeding EUR 2 billion. In compliance with the Floods Directive, EU member states must assess and map flood hazards and risks. This study aims to develop a frequency analysis to determine discharges as a predictive indicator for different hazard levels: frequent events (10-year return period), medium probability events (100-year return period), and extreme events. The Casimcea catchment in central Dobrogea, drained by the Casimcea River into Lake Tasaul, serves as the study area. The annual maximum discharge data analysis, conducted through frequency analysis and the ELECTRE method, indicates that EV3-Min-Weibull, L-moments, and GEV-Min (L-moments) are the most effective probability density functions (PDFs). To conclude, although a single PDF model cannot be determined for the Casimcea River and its tributaries, it contributes to predictive modeling efforts. Full article
Show Figures

Figure 1

31 pages, 4407 KiB  
Article
A Comparative Analysis of Remotely Sensed and High-Fidelity ArcSWAT Evapotranspiration Estimates Across Various Timescales in the Upper Anthemountas Basin, Greece
by Stefanos Sevastas, Ilias Siarkos and Zisis Mallios
Hydrology 2025, 12(7), 171; https://doi.org/10.3390/hydrology12070171 - 29 Jun 2025
Viewed by 328
Abstract
In data-scarce regions and ungauged basins, remotely sensed evapotranspiration (ET) products are increasingly employed to support hydrological model calibration. In this study, a high-resolution hydrological model was developed for the Upper Anthemountas Basin using ArcSWAT, with a focus on comparing simulated ET outputs [...] Read more.
In data-scarce regions and ungauged basins, remotely sensed evapotranspiration (ET) products are increasingly employed to support hydrological model calibration. In this study, a high-resolution hydrological model was developed for the Upper Anthemountas Basin using ArcSWAT, with a focus on comparing simulated ET outputs to three freely available remote sensing-based ET products: the MODIS MOD16 Collection 5, the updated MODIS MOD16A2GF Collection 6.1, and the SSEBop Version 5 dataset. ET estimates derived from the calibrated SWAT model were compared to all remote sensing products at the basin scale, across various temporal scales over the 2002–2014 simulation period. Results indicate that the MOD16 Collection 5 product achieved the closest correspondence with SWAT-simulated ET across all temporal scales. The MOD16A2GF Collection 6.1 product exhibited moderate overall agreement, with improved performance during early summer. The SSEBop Version 5 dataset generally displayed weaker correlation, but demonstrated enhanced alignment during the driest years of the record. Strong correspondence is observed when averaging the ET values from all satellite products. These findings underscore the importance of exercising caution when utilizing remotely sensed ET products as the sole basis for hydrological model calibration, particularly given the variability in performance among different datasets. Full article
Show Figures

Figure 1

19 pages, 1630 KiB  
Article
Just a Single-Layer CNN for Stochastic Modeling: A Discriminator-Free Approach
by Evangelos Rozos
Hydrology 2025, 12(7), 170; https://doi.org/10.3390/hydrology12070170 - 29 Jun 2025
Viewed by 316
Abstract
The advent of machine learning (ML) has significantly transformed hydrology, particularly in the simulation of hydrological flows. However, ML techniques have not been employed to the same extent in stochastic hydrology. In applied sciences, the most common ML-based approach for developing stochastic simulation [...] Read more.
The advent of machine learning (ML) has significantly transformed hydrology, particularly in the simulation of hydrological flows. However, ML techniques have not been employed to the same extent in stochastic hydrology. In applied sciences, the most common ML-based approach for developing stochastic simulation schemes is the use of generative adversarial networks (GANs), which consist of two sub-models, that is, a generator and a discriminator. Despite their potential, GANs have notable limitations, including high architectural complexity and the requirement to divide observed time series into shorter segments to generate sufficient training examples. This segmentation reduces the effective length of the series, limiting the model’s ability to capture and reproduce long-term dependencies. In this study, we propose a simpler stochastic scheme based on a single convolutional neural network (CNN) used as a generator, replacing the discriminator component of the GAN with a specifically designed cost function. The model is applied to a case study involving measured flow velocity time series and evaluated against traditional stochastic schemes designed for both Markovian and Hurst–Kolmogorov processes. Results show that the CNN-based approach not only offers computational simplicity but also outperforms conventional methods in preserving key statistical characteristics of the observed data. Full article
(This article belongs to the Section Statistical Hydrology)
Show Figures

Figure 1

14 pages, 7591 KiB  
Article
A Paleo-Perspective of 21st Century Drought in the Hron River (Slovakia)
by Igor Leščešen, Abel Andrés Ramírez Molina and Glenn Tootle
Hydrology 2025, 12(7), 169; https://doi.org/10.3390/hydrology12070169 - 28 Jun 2025
Viewed by 396
Abstract
The Hron River is a vital waterway in central Slovakia. In evaluating observed streamflow records for the past ~90 years, the Hron River displayed historically low hydrologic summer (April–May–June–July–August–September (AMJJAS)) streamflow for the 10-, 20-, and 30-year periods ending in 2020. When using [...] Read more.
The Hron River is a vital waterway in central Slovakia. In evaluating observed streamflow records for the past ~90 years, the Hron River displayed historically low hydrologic summer (April–May–June–July–August–September (AMJJAS)) streamflow for the 10-, 20-, and 30-year periods ending in 2020. When using self-calibrated Palmer Drought Severity Index (scPDSI) proxies developed from tree-ring records, skillful regression-based reconstructions of AMJJAS streamflow were developed for two gauges (Banská Bystrica and Brehy) on the Hron River. The recent observed droughts were compared to these reconstructions and revealed the Hron River experienced extreme drought in the 21st century. A further comparison of observed wet (pluvial) periods revealed that the most extreme robust streamflow periods in the observed record were frequently exceeded in the reconstructed (paleo) record. The Hron River has recently been experiencing decline, and we hypothesize that this decline may be associated with anthropogenic influences, the natural climatic cycle, or the changing climate. Full article
Show Figures

Figure 1

19 pages, 4916 KiB  
Article
Deep Learning-Based Daily Streamflow Prediction Model for the Hanjiang River Basin
by Jianze Huang, Jialang Chen, Haijun Huang and Xitian Cai
Hydrology 2025, 12(7), 168; https://doi.org/10.3390/hydrology12070168 - 27 Jun 2025
Cited by 1 | Viewed by 625
Abstract
The sharp decline in streamflow prediction accuracy with increasing lead times remains a persistent challenge for effective water resources management and flood mitigation. In this study, we developed a coupled deep learning model for daily streamflow prediction in the Hanjiang River Basin, China. [...] Read more.
The sharp decline in streamflow prediction accuracy with increasing lead times remains a persistent challenge for effective water resources management and flood mitigation. In this study, we developed a coupled deep learning model for daily streamflow prediction in the Hanjiang River Basin, China. The proposed model integrates self-attention (SA), a one-dimensional convolutional neural network (1D-CNN), and bidirectional long short-term memory (BiLSTM). The model’s effectiveness was assessed during flood events, and its predictive uncertainty was quantified using kernel density estimation (KDE). The results demonstrate that the proposed model consistently outperforms baseline models across all lead times. It achieved Nash-Sutcliffe Efficiency (NSE) scores of 0.92, 0.86, and 0.79 for 1-, 3-, and 5-days, respectively, showing particular strength at these extended lead time predictions. During major flood events, the model demonstrated an enhanced capacity to capture peak magnitudes and timings. It achieved the highest NSE values of 0.924, 0.862, and 0.797 for the 1-, 3-, and 5-day forecasting horizons, respectively, thereby showcasing the strengths of integrating CNN and SA mechanisms for recognizing local hydrological patterns. Furthermore, KDE-based uncertainty analysis identified a high prediction interval coverage in different forecast periods and a relatively narrow prediction interval width, indicating the strong robustness of the proposed model. Overall, the proposed SA-CNN-BiLSTM model demonstrates significantly improved accuracy, especially for extended lead times and flood events, and provides robust uncertainty quantification, thereby offering a more reliable tool for reservoir operation and flood risk management. Full article
Show Figures

Figure 1

22 pages, 9661 KiB  
Article
Regional Groundwater Flow and Advective Contaminant Transport Modeling in a Typical Hydrogeological Environment of Northern New Jersey
by Toritseju Oyen and Duke Ophori
Hydrology 2025, 12(7), 167; https://doi.org/10.3390/hydrology12070167 - 27 Jun 2025
Viewed by 406
Abstract
This study develops a numerical model to simulate groundwater flow and contaminant transport in a “typical hydrogeological environment” of northern New Jersey, addressing freshwater decline. Focusing on the Lower Passaic water management area (WMA), we model chloride transport in a fractured-rock aquifer, where [...] Read more.
This study develops a numerical model to simulate groundwater flow and contaminant transport in a “typical hydrogeological environment” of northern New Jersey, addressing freshwater decline. Focusing on the Lower Passaic water management area (WMA), we model chloride transport in a fractured-rock aquifer, where fracture networks control hydraulic conductivity and porosity. The urbanized setting—encompassing Montclair State University (MSU) and municipal wells—features heterogeneous groundwater systems and critical water resources, providing an ideal case study for worst-case contaminant transport scenarios. Using MODFLOW and MODPATH, we simulated flow and tracked particles over 20 years. Results show that chloride from MSU reached the Third River in 4 years and the Passaic River in 10 years in low-porosity fractures (0.2), with longer times (8 and 20 years) in high-porosity zones (0.4). The First Watchung Mountains were identified as the primary recharge area. Chloride was retained in immobile pores but transported rapidly through fractures, with local flow systems (MSU to Third River) faster than regional systems (MSU to Passaic River). These findings confirm chloride in groundwater, which may originate from road salt application, can reach discharge points in 4–20 years, emphasizing the need for recharge-area monitoring, salt-reduction policies, and site-specific assessments to protect fractured-rock aquifers. Full article
Show Figures

Figure 1

25 pages, 8903 KiB  
Article
Comparative Analysis of Satellite-Based Rainfall Products for Drought Assessment in a Data-Poor Region
by Hansini Gayanthika, Dimuthu Lakshitha, Manthika Chathuranga, Gouri De Silva and Jeewanthi Sirisena
Hydrology 2025, 12(7), 166; https://doi.org/10.3390/hydrology12070166 - 27 Jun 2025
Viewed by 351
Abstract
Drought is one of the most impactful natural disasters, and it significantly impacts three main sectors of a country: the environment, society, and the economy. Therefore, drought assessment and monitoring are essential for reducing vulnerability and risk. However, insufficient and sparse long-term in [...] Read more.
Drought is one of the most impactful natural disasters, and it significantly impacts three main sectors of a country: the environment, society, and the economy. Therefore, drought assessment and monitoring are essential for reducing vulnerability and risk. However, insufficient and sparse long-term in situ rainfall data limit drought assessment in developing countries. Recently developed satellite-based rainfall products, available at different temporal and spatial resolutions, offer a valuable alternative in data-poor regions like Sri Lanka, where rain gauge networks are sparse and maintenance issues are prevalent. This study evaluates the accuracy of satellite-based rainfall estimates compared to in situ observations for drought assessment within the Mi Oya River Basin, Sri Lanka. We assessed the performance of various satellite-based rainfall products, including IMERG, GSMaP, CHIRPS, PERSIANN, and PERSIANN-CDR, by comparing them with ground-based observations over 20 years, from 2003 to 2022. Our methodology involved checking detection accuracy using the False Alarm Ratio (FAR), Probability of Detection (POD), and Critical Success Index (CSI), and assessing accuracy through metrics such as Root Mean Square Error (RMSE), Pearson Correlation Coefficient (CC), Percentage Bias (PBias), and Nash–Sutcliffe Efficiency (NSE). The two best-performing satellite-based rainfall products were used for meteorological and hydrological drought assessment. In the accuracy detection metrics, the results indicate that while products like IMERG and GSMaP generally provide reliable rainfall estimates, others like PERSIANN and PERSIANN-CDR tend to overestimate rainfall. For instance, IMERG shows a CSI range of 0.04–0.25 for moderate and heavy rainfall and 0.10–0.30 for light rainfall. On a monthly scale, IMERG and CHIRPS showed the highest performance, with CC (NSE) values of 0.81–0.94 (0.53–0.83) and 0.79–0.86 (0.54–0.74), respectively. However, GSMaP showed the lowest bias, with a range of −17.1–13.2%. Recorded drought periods over 1981–2022 (1998–2022) were reasonably well captured by CHIRPS (IMERG) products in the Mi Oya River Basin. Our results highlighted uncertainties and discrepancies in the capability of different rainfall products to assess drought conditions. This research provides valuable insights for optimizing the use of satellite rainfall products in hydrological modeling and disaster preparedness in the Mi Oya River Basin. Full article
Show Figures

Figure 1

17 pages, 6551 KiB  
Article
Monitoring the Impacts of Human Activities on Groundwater Storage Changes Using an Integrated Approach of Remote Sensing and Google Earth Engine
by Sepide Aghaei Chaleshtori, Omid Ghaffari Aliabad, Ahmad Fallatah, Kamil Faisal, Masoud Shirali, Mousa Saei and Teodosio Lacava
Hydrology 2025, 12(7), 165; https://doi.org/10.3390/hydrology12070165 - 26 Jun 2025
Viewed by 428
Abstract
Groundwater storage refers to the water stored in the pore spaces of underground aquifers, which has been increasingly affected by both climate change and anthropogenic activities in recent decades. Therefore, monitoring their changes and the factors that affect it is of great importance. [...] Read more.
Groundwater storage refers to the water stored in the pore spaces of underground aquifers, which has been increasingly affected by both climate change and anthropogenic activities in recent decades. Therefore, monitoring their changes and the factors that affect it is of great importance. Although the influence of natural factors on groundwater is well-recognized, the impact of human activities, despite being a major contributor to its change, has been less explored due to the challenges in measuring such effects. To address this gap, our study employed an integrated approach using remote sensing and the Google Earth Engine (GEE) cloud-free platform to analyze the effects of various anthropogenic factors such as built-up areas, cropland, and surface water on groundwater storage in the Lake Urmia Basin (LUB), Iran. Key anthropogenic variables and groundwater data were pre-processed and analyzed in GEE for the period from 2000 to 2022. The processes linking these variables to groundwater storage were considered. Built-up area expansion often increases groundwater extraction and reduces recharge due to impervious surfaces. Cropland growth raises irrigation demand, especially in semi-arid areas like the LUB, leading to higher groundwater use. In contrast, surface water bodies can supplement water supply or enhance recharge. The results were then exported to XLSTAT software2019, and statistical analysis was conducted using the Mann–Kendall (MK) non-parametric trend test on the variables to investigate their potential relationships with groundwater storage. In this study, groundwater storage refers to variations in groundwater storage anomalies, estimated using outputs from the Global Land Data Assimilation System (GLDAS) model. Specifically, these anomalies are derived as the residual component of the terrestrial water budget, after accounting for soil moisture, snow water equivalent, and canopy water storage. The results revealed a strong negative correlation between built-up areas and groundwater storage, with a correlation coefficient of −1.00. Similarly, a notable negative correlation was found between the cropland area and groundwater storage (correlation coefficient: −0.85). Conversely, surface water availability showed a strong positive correlation with groundwater storage, with a correlation coefficient of 0.87, highlighting the direct impact of surface water reduction on groundwater storage. Furthermore, our findings demonstrated a reduction of 168.21 mm (millimeters) in groundwater storage from 2003 to 2022. GLDAS represents storage components, including groundwater storage, in units of water depth (mm) over each grid cell, employing a unit-area, mass balance approach. Although storage is conceptually a volumetric quantity, expressing it as depth allows for spatial comparison and enables conversion to volume by multiplying by the corresponding surface area. Full article
Show Figures

Figure 1

Previous Issue
Next Issue
Back to TopTop