Article

The Characteristics and Trend Prediction of Water and Sediment Evolution at the Toudaoguai Station on the Yellow River from 1960 to 2019

1
College of Water Conservancy and Civil Engineering, Inner Mongolia Agricultural University, Hohhot 010018, China
2
State Key Laboratory of Simulation and Regulation of Water Cycle in River Basin, China Institute of Water Resources and Hydropower Research, Beijing 100038, China
*
Authors to whom correspondence should be addressed.
Hydrology 2025, 12(7), 174; https://doi.org/10.3390/hydrology12070174
Submission received: 27 May 2025 / Revised: 26 June 2025 / Accepted: 27 June 2025 / Published: 30 June 2025

Abstract

The Yellow River is a renowned sediment-laden river and analyzing its water–sediment evolution characteristics and trends is critical for rational water resource utilization and water security. Using annual runoff and sediment transport data from Toudaoguai Hydrological Station (1960–2019), Mann–Kendall tests, cumulative anomalies analysis, and wavelet analysis were used to investigate the decadal variations. A coupled ARIMA-BP model was developed to improve simulation accuracy over standalone ARIMA/BP models for trend prediction. The results showed significant decreasing trends in both runoff (Z = −3.22) and sediment transport (Z = −4.73) during 1960–2019, with change points in 1986 (runoff) and 1984 (sediment). The primary periodicities were 12 years for runoff and 31 years for sediment transport. The coupled model achieved good consistency (R2 = 0.9142 for runoff, 0.8637 for sediment), outperforming individual models. Projections indicate continued declines in both variables from 2020 to 2029. Natural factors are the main cause affecting the changes in runoff, while human activities are the primary influencing factor for the changes in sediment load. This study introduces a novel approach for water–sediment analysis in the Yellow River Basin, providing technical support for sustainable water resource management.

1. Introduction

The primary challenge in the management of the Yellow River lies in its imbalanced water–sediment relationship, characterized by low water discharge and high sediment load [1]. The Inner Mongolia reach of the Yellow River is located in the upper part of the “π”-shaped bend of the Yellow River. It receives water and sediment from upstream, as well as sediment contributions from the four major deserts (Hedong Sandy Land, Tengger Desert, Ulan Buh Desert, and Kubuqi Desert) and tributaries such as the “Ten Major Kongdui”. The characteristics of water and sediment variations in this reach are extremely complex and heterogeneous. In-depth research on the long-term evolution trends in the water–sediment relationship and its response to ecological and environmental changes is crucial for determining the reasonable range of sediment concentration and implementing the scientific regulation of water and sediment in the medium- and long-term. In recent years, the water–sediment characteristics of the Inner Mongolia reach have undergone significant changes due to factors such as reservoir regulation, soil and water conservation in the basin, and variations in water withdrawal for industrial and agricultural purposes. The Toudaoguai Hydrological Station, located in the downstream part of the Inner Mongolia reach, marks the transition point of the Yellow River from a wandering plain-type channel (Hetao Plain and Tumochuan Plain) to a canyon-type channel (Jin-Shaan Gorge). It is also the hydrological station that delineates the boundary between the upper and middle reaches of the Yellow River. The unique geographical location of this station, combined with the complex channel morphology, upstream water–sediment regulation, and the confluence of tributaries within the basin, makes the water–sediment relationship and trends at the Toudaoguai section a focal point in Yellow River water–sediment research [2,3]. The runoff and sediment transport data from this station not only reflect the erosion and deposition evolution characteristics of the upstream channel but also have significant implications for downstream water–sediment regulation, water resource development, and management.
In the 1980s and 1990s, the water–sediment relationship in the Yellow River deteriorated significantly, leading to channel shrinkage and the formation of a 268 km long perched river in the Bayangaole-Toudaoguai reach [4]. In recent years, the water–sediment regime of the Yellow River has undergone notable changes due to intensified climate change and human activities. To investigate the impacts of climate change and human activity on the evolution of water and sediment in the Yellow River, researchers have employed methods such as field monitoring, data analysis, physical model experiments, and numerical simulations to study the characteristics of sediment particle movement, sediment transport mechanisms, influencing factors, channel morphology evolution, and mathematical models of sediment transport at the Toudaoguai section. These studies have clarified the characteristics of water–sediment evolution and identified the primary driving factors [5,6,7]. The unique water and sediment inflow processes, hydrological and climatic characteristics, and changes in human activity have contributed to the imbalanced water–sediment relationship at the Toudaoguai Station in the Inner Mongolia reach of the Yellow River. In particular, the influence of human activity has led to a significant reduction in the water and sediment discharge into the sea, with pronounced interannual fluctuations [8,9]. Hu Chunhong [10], through an analysis of the centennial evolution characteristics and recent fluctuations in sediment in the Yellow River, highlighted that soil and water conservation measures have played a critical role in reducing sediment input into the Yellow River. However, in recent times, the scouring and release of deposited sediment caused by extreme rainfall or human activity have become new significant sources of sediment during “high-sediment” years. Common methods for predicting water–sediment evolution trends in the Yellow River Basin include the “hydrological method,” “soil and water conservation method,” and “mathematical modelling method.” However, the Yellow River Basin is a complex system characterized by the coupling of water–sediment, geomorphological, and ecological processes; the superposition of natural processes and artificial measures; and the hydrodynamic-driven processes of runoff and sediment production and transport. As a result, the reliability of predictions varies across different methods [11,12]. Ensemble modelling using multiple models can overcome the high randomness associated with single-model simulations, thereby improving the reliability of conclusions. Consequently, the application of machine-learning algorithms for the ensemble simulation of water–sediment processes has emerged as a significant breakthrough method for identifying the causes of water–sediment variability and enhancing prediction accuracy [13].
This study is based on the runoff and sediment transport data from the Toudaoguai Hydrological Station in the Inner Mongolia reach of the Yellow River from 1960 to 2019. Utilizing methods such as the Mann–Kendall test, cumulative anomaly analysis, wavelet analysis, and machine learning, this research investigates the characteristics of the water–sediment evolution at the Toudaoguai Station. A water–sediment prediction model is constructed to simulate and forecast future trends in water and sediment changes. The findings provide technical support for water–sediment regulation, ecological management, and water-resource development and utilization in the Yellow River Basin.

2. Overview of the Research Area and Research Methodology

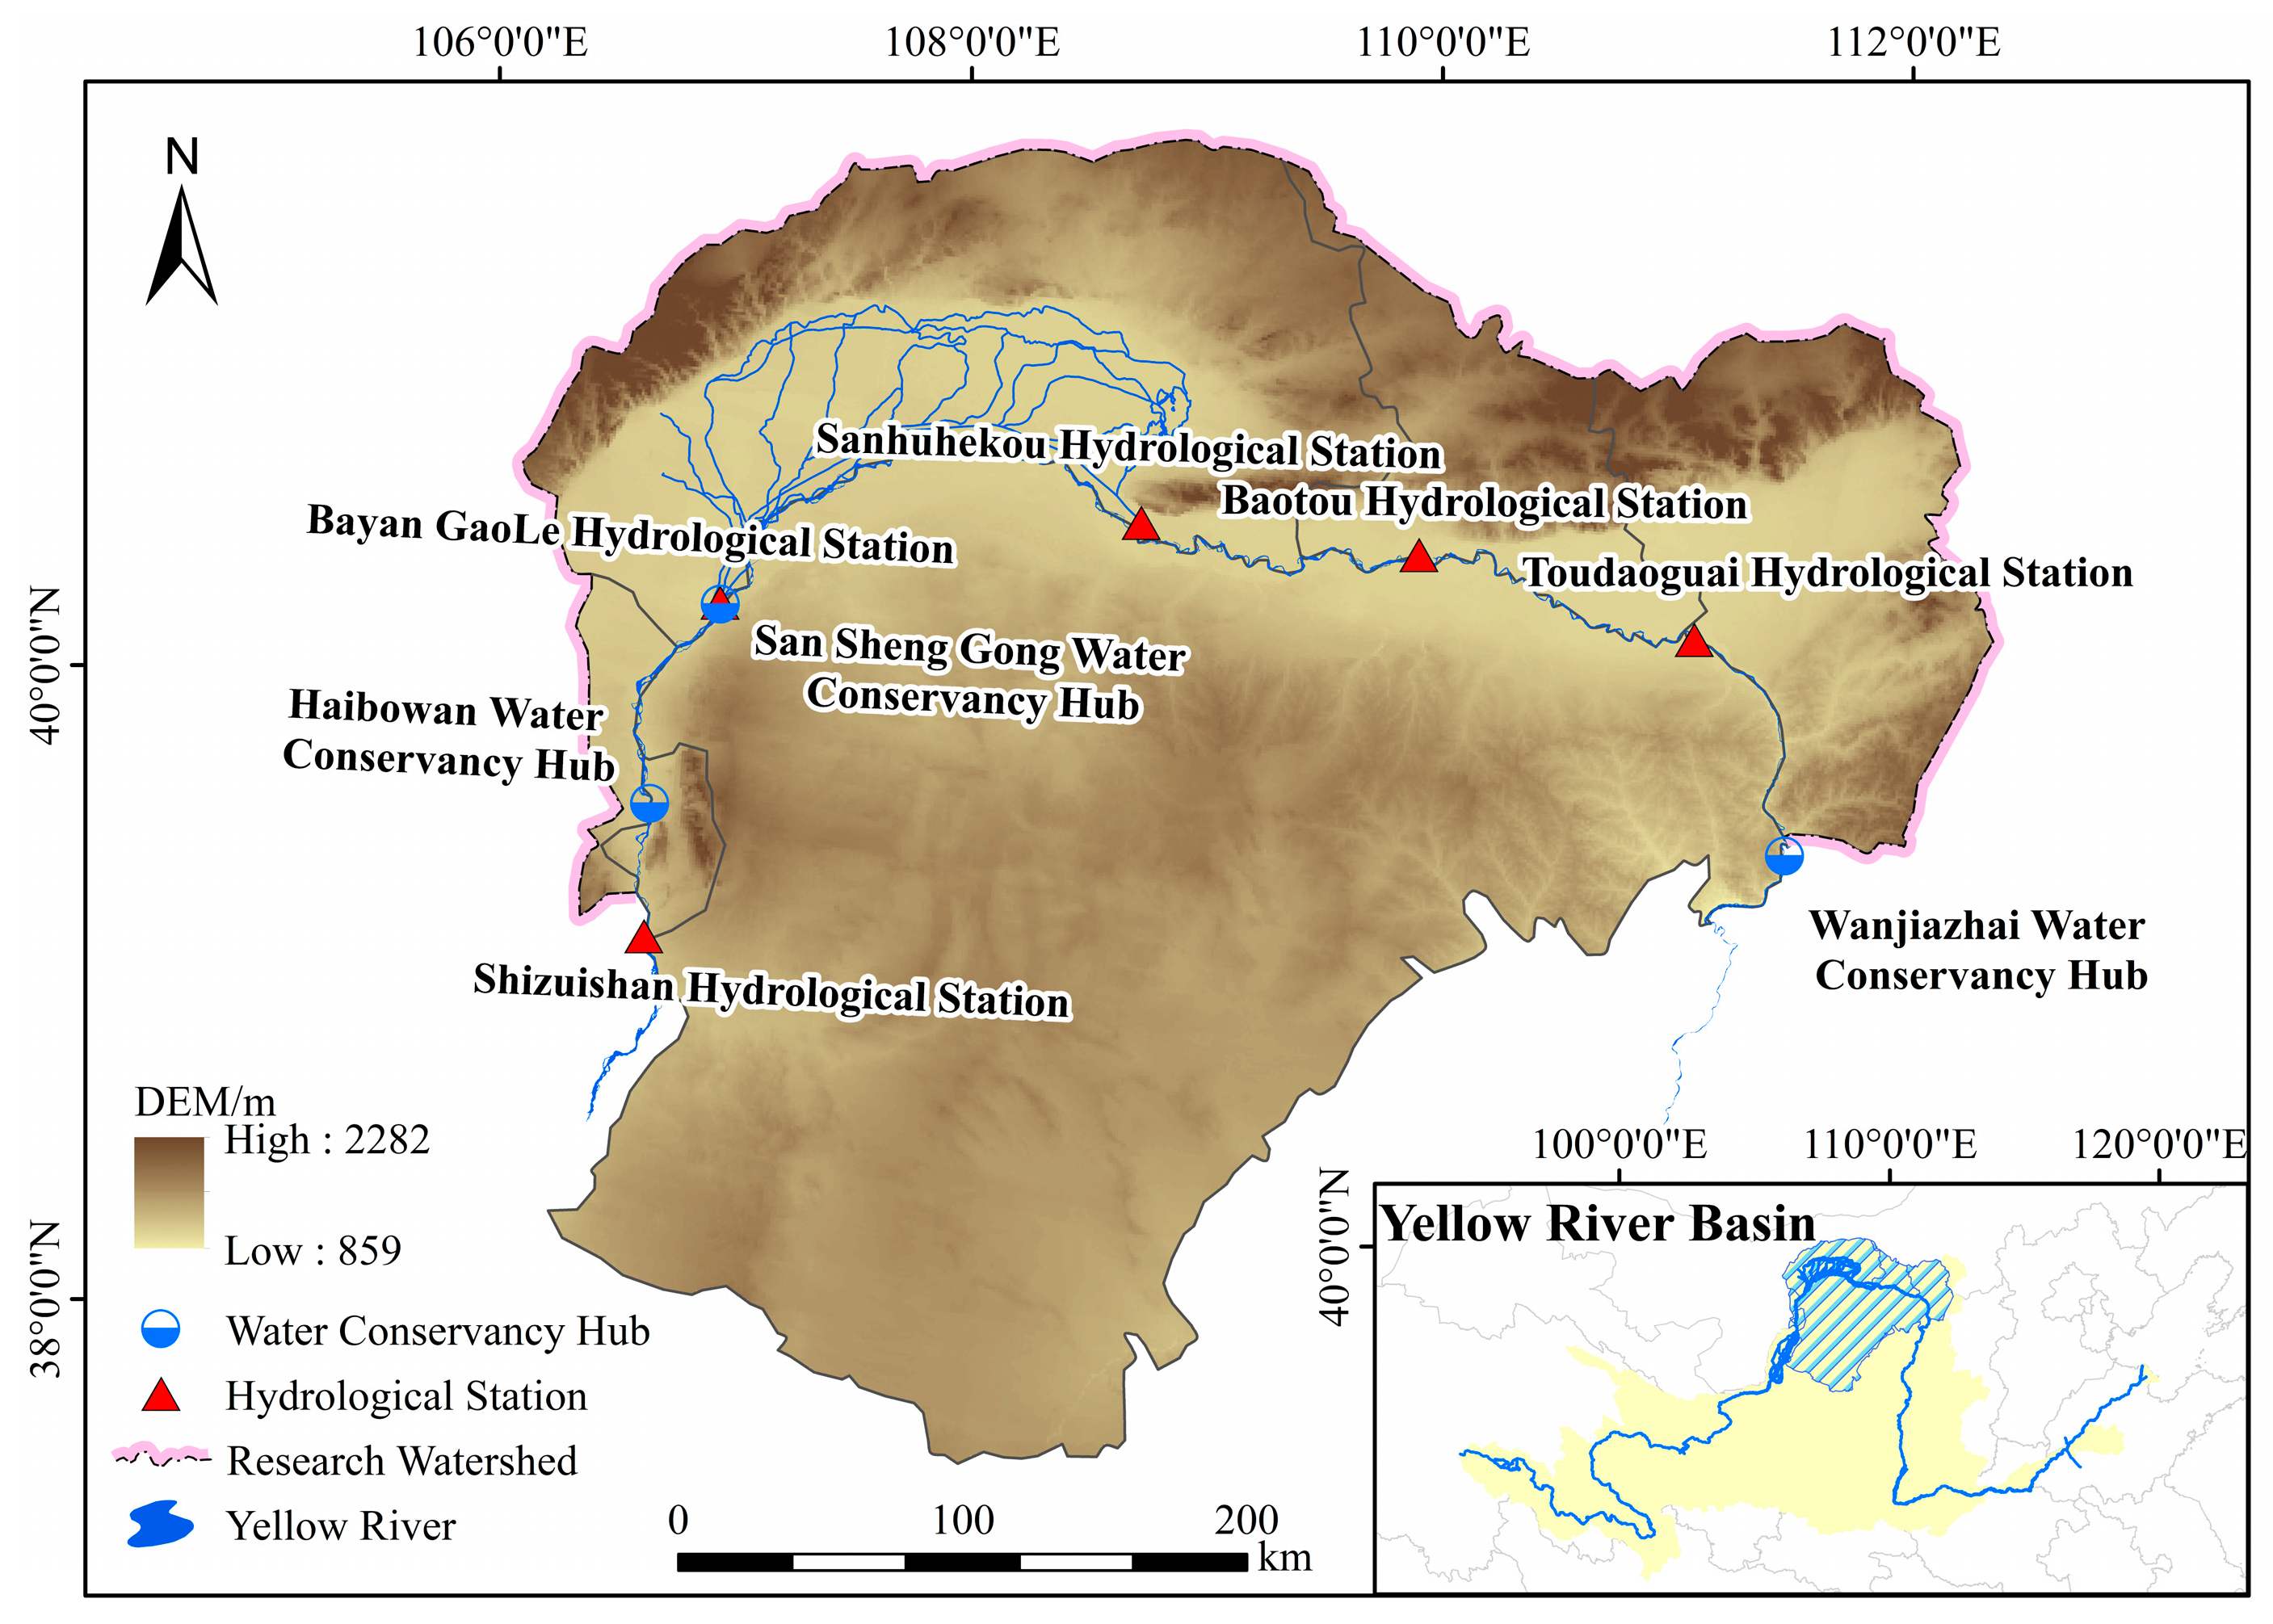
2.1. Overview of the Research Area

The Inner Mongolia reach of the Yellow River is located at the northernmost part of the Yellow River Basin, entering from Shizuishan in Ningxia and exiting through Jungar Banner in Ordos City, with a total length of approximately 840 km; it accounts for 15.74% of the main stem of the Yellow River. Its geographical location is shown in Figure 1. This reach includes four hydrological stations: Bayangaole, Sanhuhekou, Baotou, and Toudaoguai. The entry and exit hydraulic hubs are the Haibowan Hydraulic Hub and the Wanjiazhai Hydraulic Hub, respectively. The reach also encompasses several agricultural irrigation districts and industrial water intake points, such as the Hetao Irrigation District, the South Bank Irrigation District of the Yellow River, the Dengkou Pumping Irrigation District in Baotou, and the Madihao Pumping Irrigation District in Tuoketuo County. The Touaoguai Hydrological Station is the exit hydrological station of the Yellow River in Inner Mongolia and also the hydrological station at the boundary between the upper and middle reaches of the Yellow River. The annual runoff and sediment load of this hydrological station can reflect the characteristics and patterns of water and sediment from the upper reaches of the Yellow River. It has important reference value for the water and sediment regulation of the upper reaches and the basin governance. Meanwhile, it can also guide the water and sediment regulation and operation of the Wanjiazhai Water Conservancy Hub in the middle reaches of the Yellow River. Therefore, this study takes the cross-section of the Toudaoguai Hydrological Station as the research site.
The Toudaoguai Hydrological Station is located in Tuoketuo County, Hohhot City, with a multi-year average temperature of 7.8 °C and a multi-year average precipitation of 450 mm. The multi-year average runoff is 21.05 billion m3 (1960–2019), with the lowest runoff occurring in May, averaging 0.87 billion m3, and the highest in September, averaging 3.18 billion m3. The multi-year average sediment transport is 87.4 million tons. The ice flood period in this reach lasts from late November to mid-to-late March, during which the sediment transport accounts for less than 10% of the annual total, while the flood season contributes 78% of the annual sediment transport. The upstream channel exhibits distinct plain-type river characteristics, with a small riverbed slope (average of 1/8000), wide water surface, shallow depth, low flow velocity, and weak sediment carrying capacity. The downstream channel transitions into a canyon-type river, with a significantly increased slope, higher flow velocity, and narrower width. Major tributaries in the Inner Mongolia reach include the “Ten Major Kongdui,” the Kundulun River, the Wudang Gully, and the Dahei River. The basin’s soil is loose with poor cohesion, and the vegetation coverage is low. During flood seasons, heavy rainfall triggers flash floods, leading to large amounts of sediment entering the Yellow River vertically, which can easily cause main channel migration, river regime changes, and soil erosion [14].

2.2. Methodology

2.2.1. M–K Method

The Mann–Kendall (M–K) test includes both the mutation test and the trend test. The M–K mutation test is a theoretically significant method currently used to analyze the variation trends in water–sediment time series. It can identify the specific time periods and regions of mutations based on the output of two sequences (UF and UB) [15]. The M–K trend test is a non-parametric statistical method widely applied for trend analysis in water–sediment time series data [16]. In the M–K trend test, a positive value of the statistic Z indicates an increasing trend in water–sediment relationships, while a negative value indicates a decreasing trend. When |Z| ≥ 1.645, 1.96, or 2.576, it signifies that the trend has passed the significance tests at the 0.1, 0.05, and 0.01 levels, respectively.

2.2.2. Cumulative Anomaly Method

The cumulative anomaly method is a technique used to determine the variation trends in time series data [17]. It evaluates the fluctuations in hydrological and meteorological factors by calculating the cumulative deviations of these elements from their multi-year average values over a specific period. The specific calculation method is as follows:
S i = i = 1 n ( X i X ¯ ) ,
In the formula, Si represents the cumulative anomaly value for the i-th year; Xi denotes the element value for the i-th year (where i = 1,2,3,…, n = 1,2,3,…,); and X ¯ is the multi-year average value.

2.2.3. Wavelet Analysis Method

Wavelet analysis is employed to identify the periodicity of hydrometeorological sequences. This involves performing a wavelet transform on the hydrometeorological sequence and integrating the squared wavelet coefficients across different scales to obtain the wavelet variance. Morlet wavelet analysis refers to the use of a cluster of wavelet functions to represent or approximate a specific function or signal, which can simultaneously reveal the local characteristics of the time series in both the time and frequency domains [18]. Wavelet functions are characterized by their oscillatory nature and rapid decay to zero. Through operations such as wavelet transforms, wavelet coefficients can be obtained, and the wavelet variance is derived by integrating the squared values of these coefficients over the b-domain. The data processing methodology includes the following: data format conversion → elimination or reduction in boundary effects → calculation of wavelet coefficients → computation of the real parts and variances of complex wavelet coefficients → plotting of the real parts of wavelet coefficients using MATLAB → generation of wavelet variance plots.
The graphical results of wavelet analysis are as follows: ① contour plots of the real parts of wavelet coefficients, which reveal the periodicity of the hydrological series at different time scales and can be used to analyze future trends; ② wavelet variance plots, which identify the primary variation periods through the fluctuation process of the hydrological series; ③ main period trend plots, which determine the average period and the characteristics of wet and dry periods based on the main period trend in the hydrological series.

2.2.4. Methods for Simulation of Water–Sediment Evolution and Trend Prediction

The autoregressive integrated moving average (ARIMA) model is frequently employed for data simulation and forecasting. It is a comprehensive framework that integrates the autoregressive (AR) model, the moving average (MA) model, and differencing techniques [19,20].
The AR model can be expressed as follows:
y t = μ + i = 1 p γ i y t 1 + ε t
where μ is the constant term; p is the order; i is the autocorrelation coefficient; and t is the noise term.
The MA model is expressed as follows:
y t = μ + i = 1 q θ i ε t 1 + ε t
where q denotes the order and i represents the regression coefficient.
Adding Equations (2) and (3) yields the expression of the ARMA model, which is as follows:
Y t = μ + i = 1 p γ i y t 1 + i = 1 q θ i ε t 1 + ε t
The ARIMA model performs a d-th order differencing on the time series and then utilizes Equation (4) for simulation and prediction, denoted as y t .
The BP neural network, a widely used artificial neural network model, consists of multiple layers of neurons and exhibits strong nonlinear mapping capabilities and adaptability, enabling it to capture the nonlinear trends in the historical data of runoff and sediment transport. In this study, the residual sequences from the ARIMA models of runoff and sediment transport are extracted, and the BP network is employed to model the nonlinear information within these residual sequences.
(1)
Forward Propagation Process:
The forward propagation process of the BP neural network refers to the transmission of information from the input layer to the output layer [21]. In this process, the weighted sum of each input sample is first calculated, followed by activation function processing to obtain the output of the hidden layer. Subsequently, the output of the hidden layer serves as the input to compute the output from the hidden layer to the output layer, which is then processed through an activation function to yield the final output of the output layer.
The calculation formulas for the outputs of the hidden layer and the output layer are as follows:
h j = f ( i = 1 n ω j i x i + b j )
y k = f ( j = 1 m v k j h j + c k )
where h j represents the output of the j-th neuron in the hidden layer; y k denotes the output of the k-th neuron in the output layer; ω j i indicates the connection weight from the input layer to the hidden layer; v k j signifies the connection weight from the hidden layer to the output layer; b and ck represent the biases of the hidden layer and the output layer, respectively; and xi denotes the input of the i-th neuron in the input layer.
(2)
Backpropagation Process:
The backpropagation process of the BP neural network refers to the procedure of updating the network parameters based on the output error. Specifically, the error of the output layer is first calculated, and the connection weights and biases between the hidden layer and the output layer are then adjusted using the error backpropagation algorithm to minimize the prediction error of the network.
The calculation formula for the output layer error is as follows:
δ k = ( y k t k ) × f ( n e t k )
where δk represents the error of the k-th neuron in the output layer; tk represents the target output of the sample; netk represents the weighted sum of inputs to the output layer; and f ′(·) represents the derivative of the activation function.
The calculation formula for the error of the hidden layer is as follows:
δ j = f ( n e t j ) × k = 1 L δ k v k j
where δj represents the error of the j-th neuron in the hidden layer and L denotes the number of neurons in the output layer.
(3)
ARIMA-BP Coupled Model:
To fully utilize historical information and capture both linear and nonlinear relationships within the data, the difference between the observed values of water and sediment and the ARIMA-predicted values is fed into the BP neural network for further prediction. Finally, the predicted results from the BP network are added to the ARIMA prediction results, constructing the ARIMA-BP coupled model.

3. Analysis of Water and Sediment Evolution Characteristics at the Toudaoguai Hydrometric Station Cross-Section in the Inner Mongolia Reach of the Yellow River

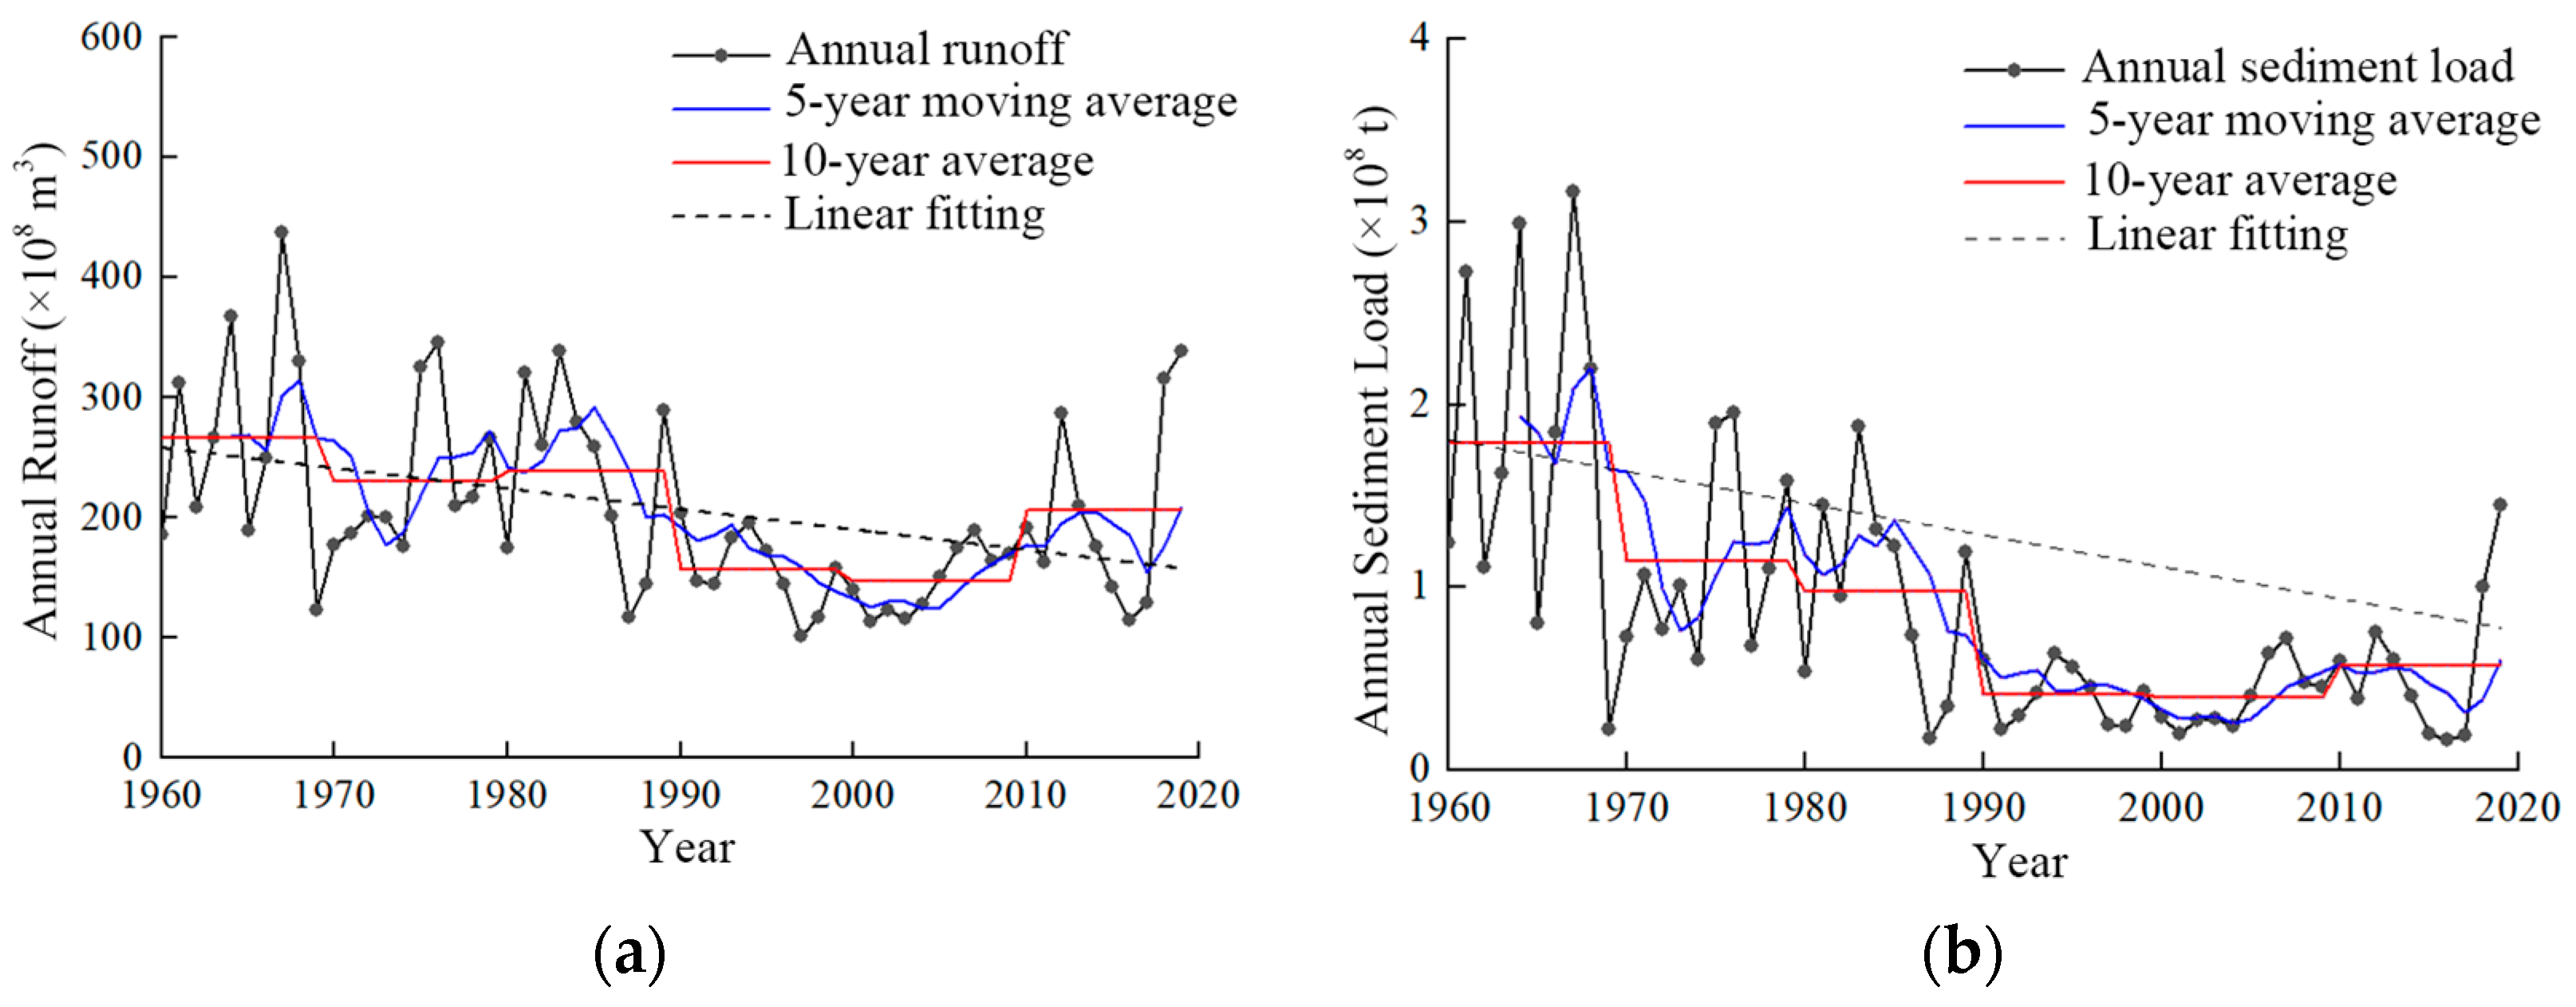
3.1. Interannual Trend of Water and Sediment Evolution

Figure 2 illustrates the interannual variations in annual runoff and sediment load at the Toudaoguai Hydrological Station from 1960 to 2019. Over the past 60 years, the average annual runoff was 21.05 billion m3, and the average annual sediment load was 87.438 million tons. As shown in the figure, both the annual runoff and sediment load at the Toudaoguai Station exhibited an overall decreasing trend from 1960 to 2019, with the rate of decline in the sediment load being significantly higher than that of runoff. Compared to the period of 1960–1970, the average annual runoff in the last decade has decreased by 13.3%, while the sediment load has decreased by 62.3%. Through the M–K trend test analysis of annual runoff and sediment loads (as shown in Table 1), the Z-values for annual runoff and sediment load were found to be −3.22 and −4.73, respectively. The absolute values of Z were both greater than 2.576, passing the significance test at the 0.01 level. This indicates that both annual runoff and sediment load have significantly decreased, with the decreasing trend in the sediment load being more pronounced than that in the runoff. Chen used the R/S analysis method to study the trend in water and sediment changes at the Head Gully hydrological station of the Yellow River from 1956 to 2018 and calculated the Hurst exponents of runoff and sediment transport at the Head Gully hydrological station to be 0.609 and 0.658, respectively, both of which are greater than 0.5 [22]. They pointed out that the runoff at the Head Gully hydrological station section is expected to decrease slowly in the future, and the sediment transport will continue to decrease. Other scholars calculated the statistical value |Z| of the 5-year moving average of runoff and sediment transport at Head Gully station in the past 60 years. Due to the different years of the data series, the calculation results are slightly different, but the |Z| of runoff and sediment transport are both greater than 3.0 and 4.5, respectively, indicating that both runoff and sediment transport show a decreasing trend, and the decrease in sediment transport is more significant, which is consistent with the research conclusions of this paper [23,24].

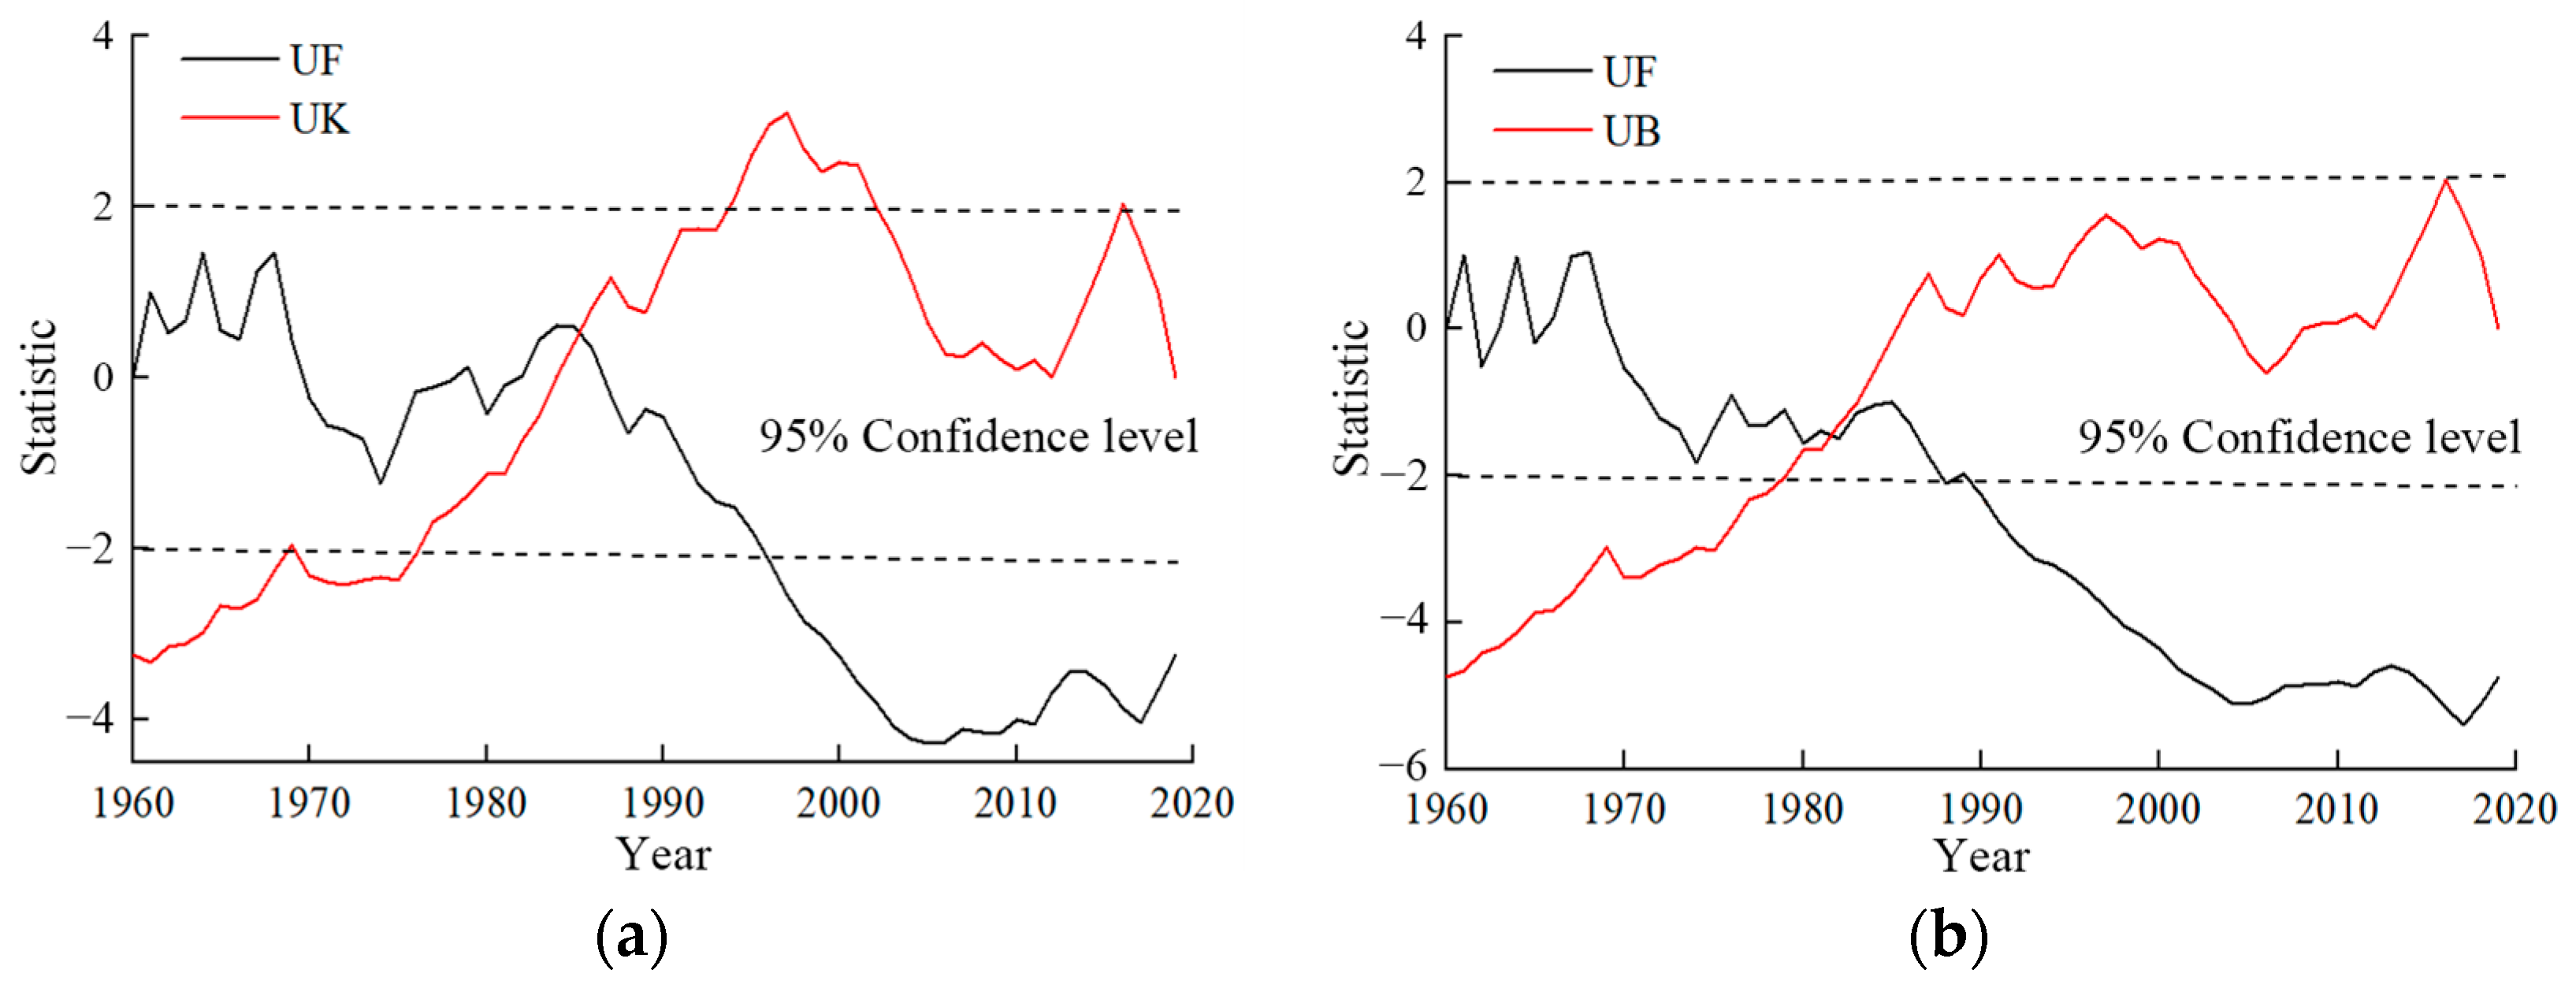
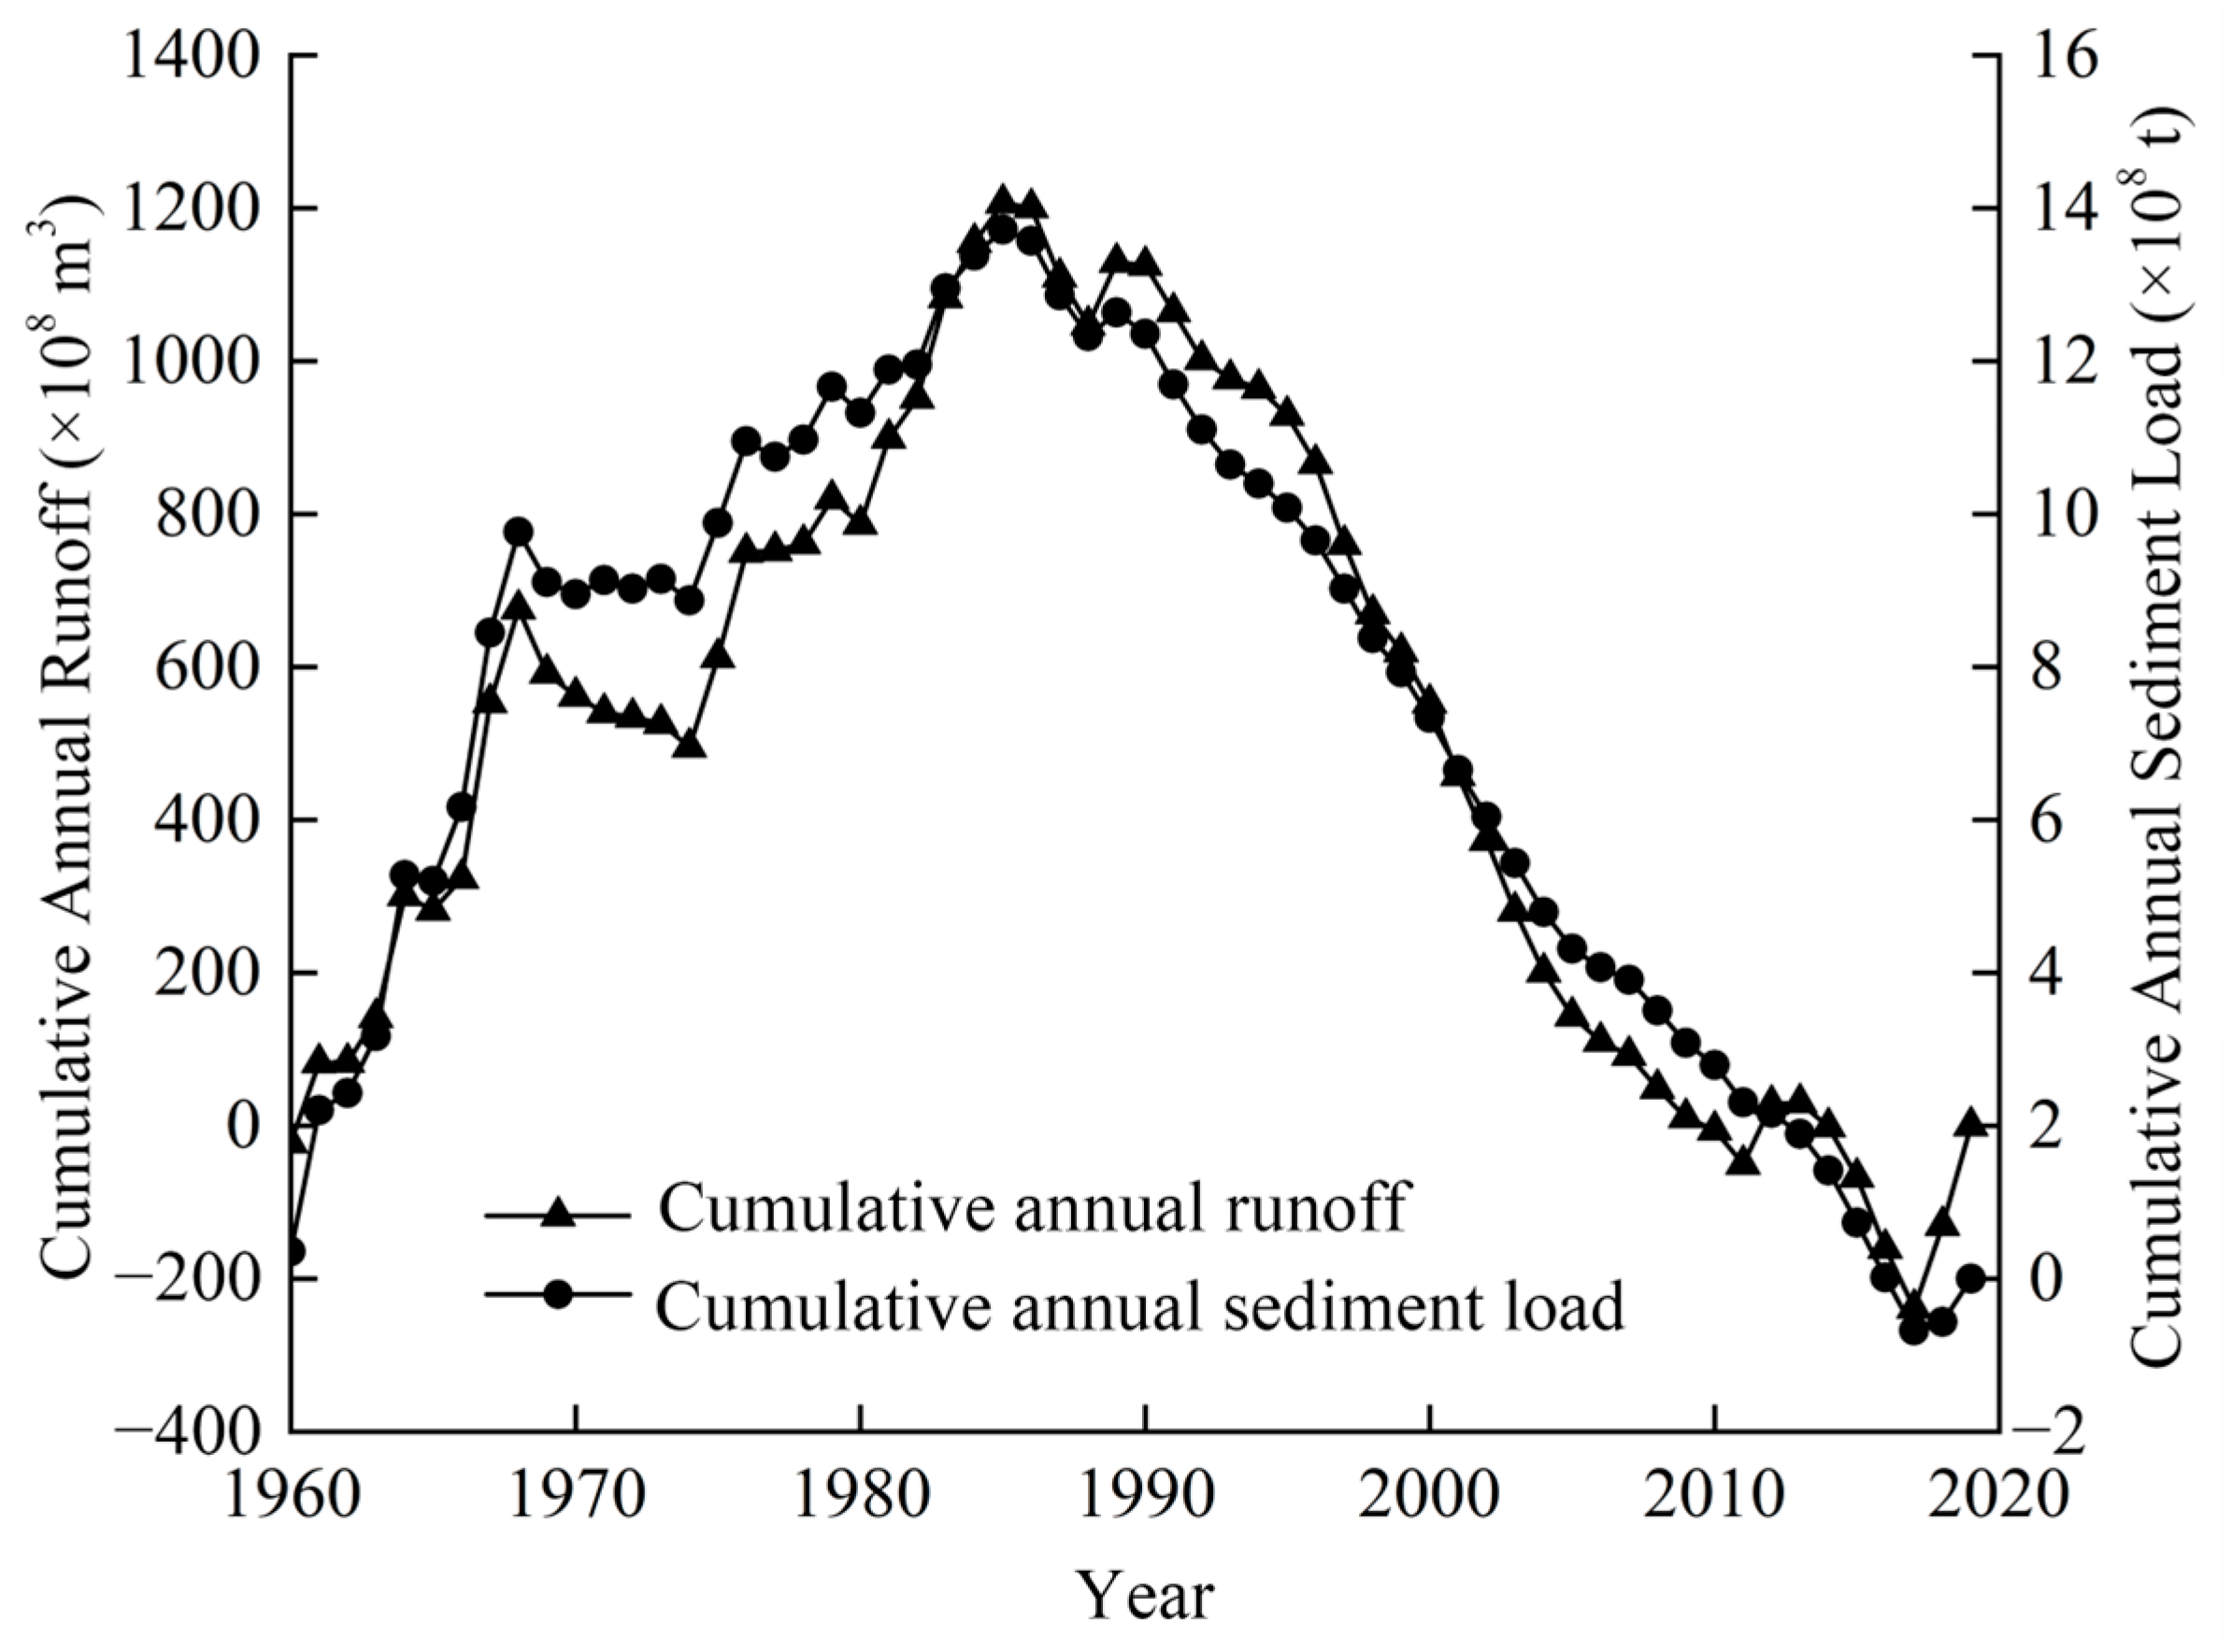
3.2. Abruptness of Water and Sediment Evolution

Figure 3 presents the M–K abrupt change test for the interannual variations in water and sediment at the Toudaoguai Hydrological Station from 1960 to 2019. As shown in Figure 3a, the UF and UB curves for runoff intersect in 1986. Combined with the cumulative anomaly values of runoff in Figure 4, the cumulative anomaly curve of annual runoff at the Toudaoguai Station exhibits two distinct phases: an increasing phase and a decreasing phase. From 1960 to 1986, the cumulative anomaly values exhibited an increasing trend, while from 1987 to 2019, they exhibited a decreasing trend. The annual runoff transitioned from an increasing to a decreasing trend in 1986, indicating that the abrupt change point for annual runoff occurred in 1986. Similarly, as shown in Figure 3b, the UF and UB curves for sediment load intersect in 1984. Combined with the cumulative anomaly values of sediment load, the cumulative anomaly curve of annual sediment load at the Toudaoguai Station also displays two phases: a high-sediment period and a low-sediment period. The transition from high- to low-sediment load occurred in 1984. From 1960 to 1984, the cumulative anomaly values exhibited an increasing trend, representing the high-sediment period, while from 1985 to 2019, they exhibited a decreasing trend, representing the low-sediment period. The annual sediment load transitioned from high to low in 1984, indicating that the abrupt change point for annual sediment load occurred in 1984. Hu and Zhao conducted the Pettitt mutation test on the runoff and sediment transport data of Head Gully station from 1950 to 2016 and pointed out that the mutation years of runoff and sediment transport were 1986 and 1985, respectively [12,25]. Wang used the cumulative anomaly method to calculate the anomalies of annual runoff and sediment transport at Head Gully hydrological station from 1960 to 2019. They combined the T-test method to verify the mutation results of mutation points with high credibility or multiple mutations during the test process and determined that the mutation years of annual runoff and sediment transport at Head Gully station were both 1985 [24]. Chen used the M-K mutation test method to analyze the interannual changes in runoff and sediment transport at four hydrological stations: Xiaheyuan, Shizuishan, Sanhuhukou, and Head Gully from 1960 to 2016. It was determined that the mutation years of annual runoff and sediment transport at Head Gully station were 1986 and 1984, respectively [26]. Although there are slight differences in the mutation years of annual sediment transport and annual runoff at Head Gully station studied by different scholars, they all fall within the range of 1984–1986. The reasons are, on the one hand, the differences in the selected data time series, and on the other hand, the main reason is that after the 1980s, the decrease in the number of extreme rainfall days was combined with the joint regulation of the Liujiaxia and Longyangxia reservoirs as well as soil and water conservation measures and human activities in the basin [27,28,29].

3.3. Periodicity of Water–Sediment Evolution

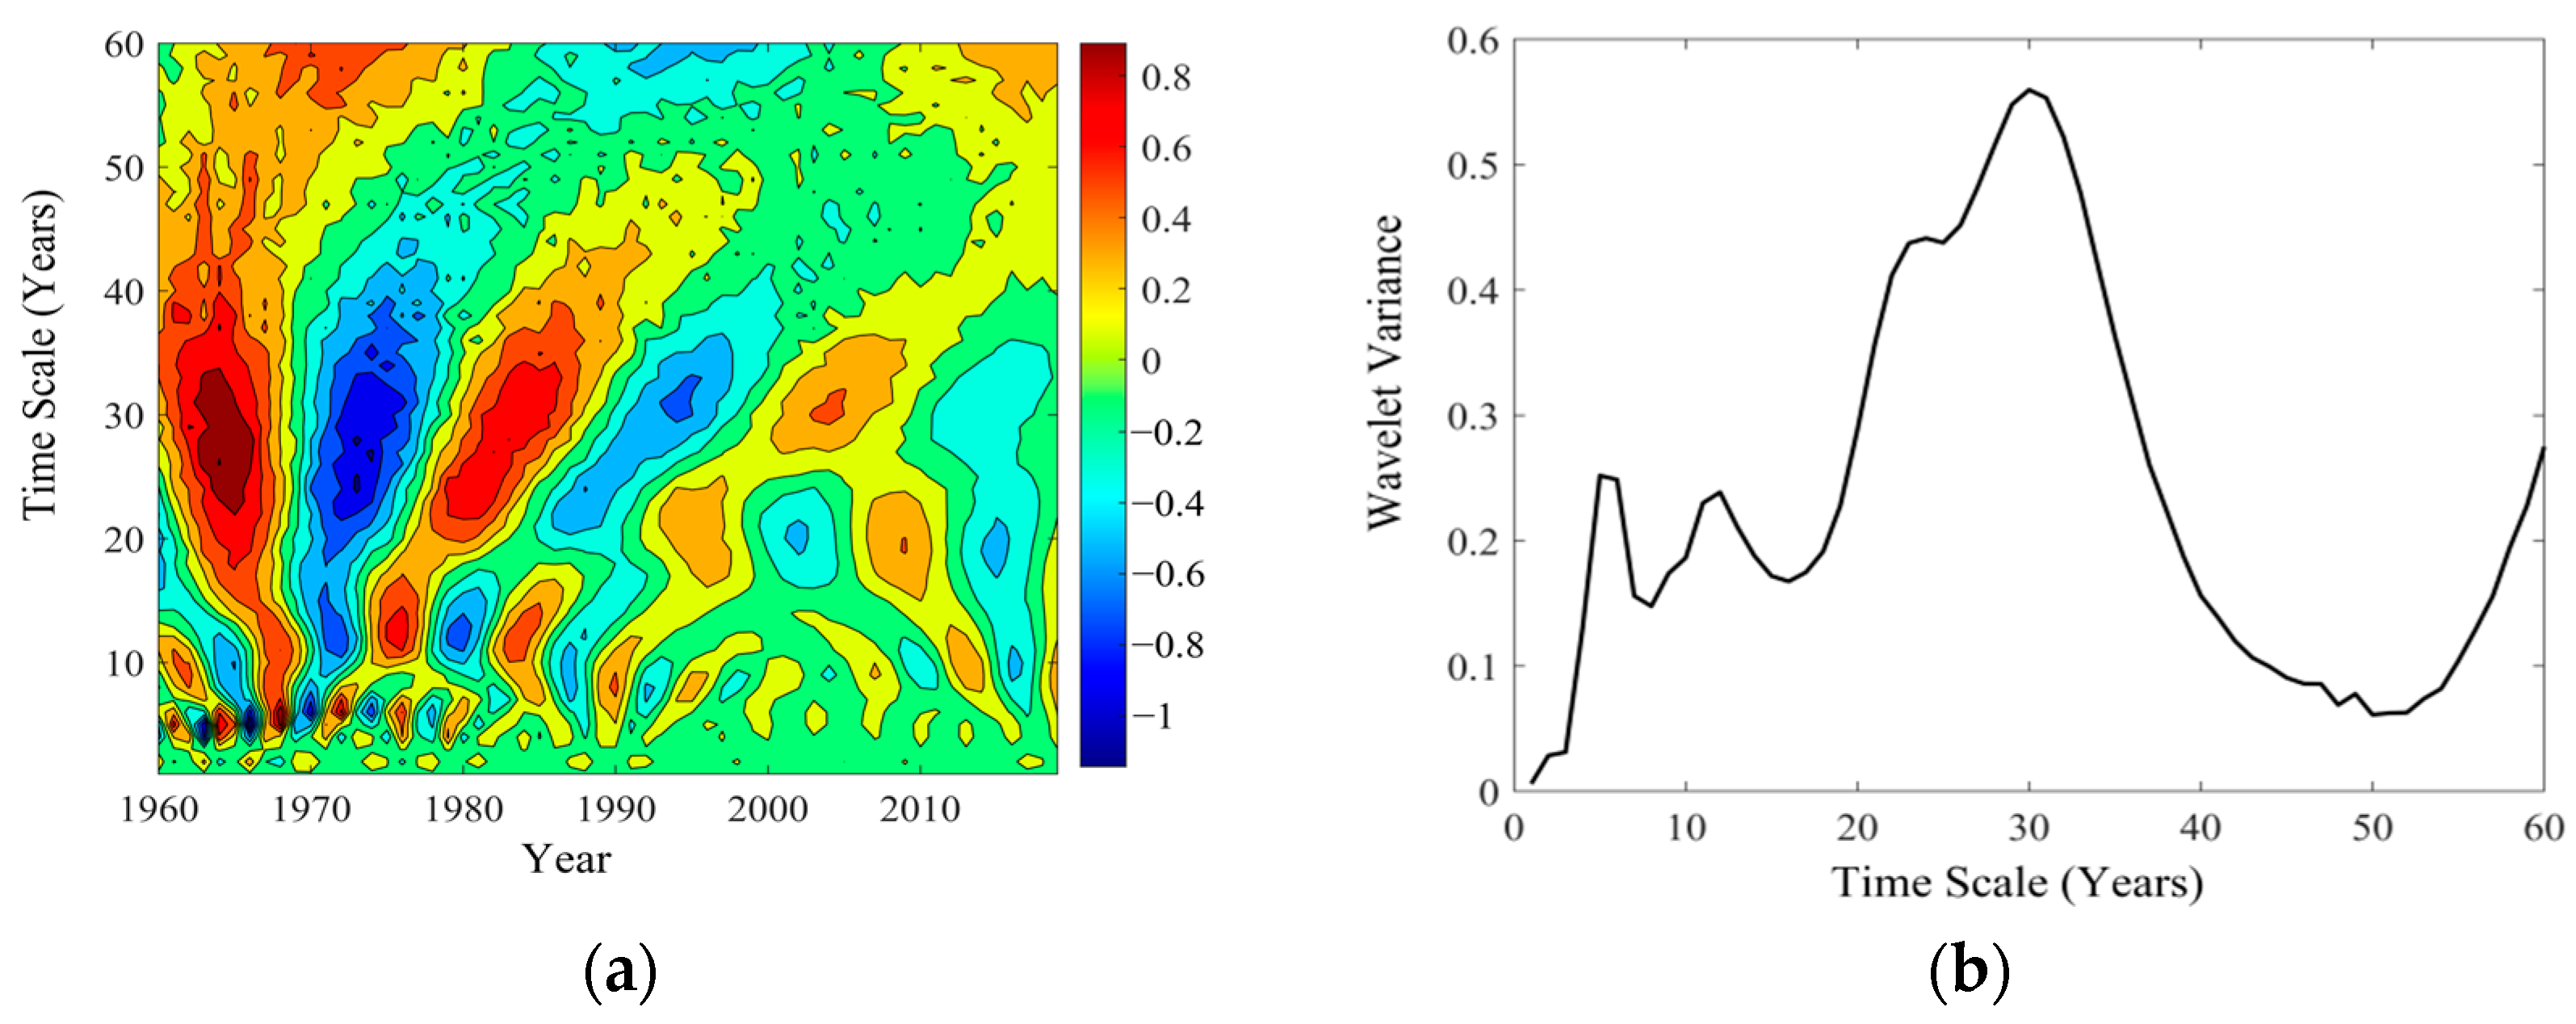
3.3.1. Periodic Analysis of Annual Runoff

The Morlet wavelet transform was applied to the annual runoff data of the Toudaoguai Hydrological Station to calculate the wavelet coefficients, their real parts, and the variance. The periodic variations and dominant cycle strengths at different time scales were derived, as illustrated in Figure 5a. In the contour map of the real parts of the wavelet coefficients, negative values indicate dry periods, while positive values represent wet periods. The contour map of the real parts of the runoff wavelet coefficients reveals distinct multi-time-scale periodic characteristics in the runoff evolution process. The runoff at the Toudaoguai Station exhibits periodic patterns primarily at two time scales: 11–13 years and 22–25 years. Figure 5b presents the wavelet real-part variance in the runoff at Toudaoguai Station. The variance plot reveals two significant peaks, with the secondary peaks corresponding to 12 years and 23 years, respectively. The maximum peak corresponds to a 12-year cycle, indicating that the 12-year periodic oscillation is the strongest and represents the first dominant cycle of runoff evolution. The 23-year cycle is identified as the second dominant cycle of annual runoff variation. The annual runoff experiences alternating cycles of drought and abundance on the first principal cycle, and the periodic changes at this scale are relatively stable throughout the entire analysis period [24]. In addition to using the Morlet wavelet transform method for the periodic analysis of annual runoff, the CEEMDAN method is also commonly used to discuss the periodicity of annual runoff and sediment transport. The fluctuations in the IMF components obtained from the decomposition represent the periodic characteristics of the sequence data at different scales. Ultimately, the runoff has a periodic change of 3–5 years in the short cycle, an 8–10-year periodic change in the medium cycle, and a 22–25-year periodic change in the long cycle [22,23].

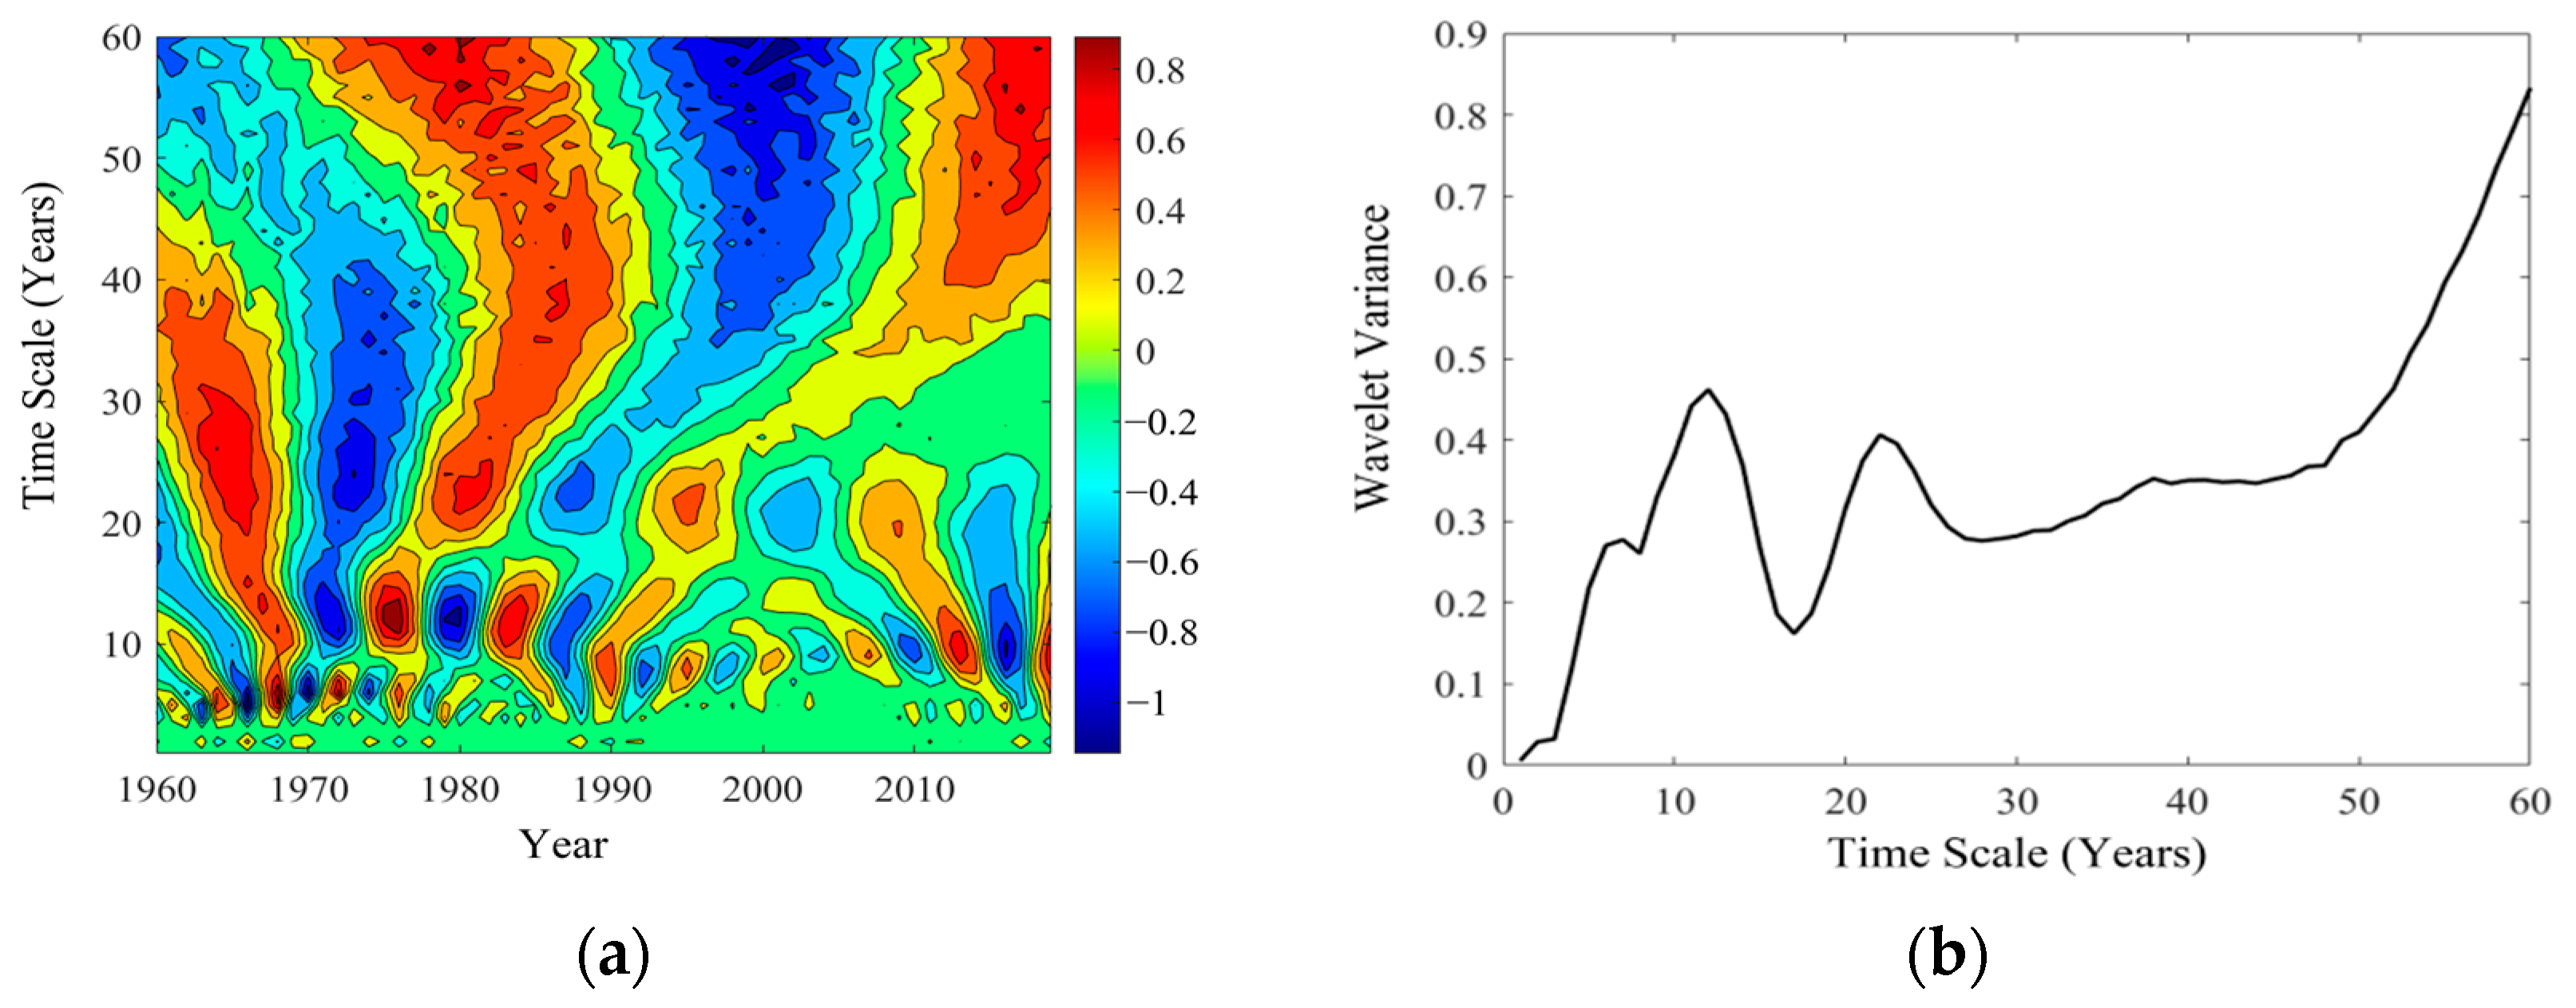
3.3.2. Periodic Analysis of Annual Sediment Load

Figure 6a shows the contour map of the real parts of the wavelet coefficients for annual sediment load. It can be seen that the sediment evolution process exhibits distinct multi-time-scale periodic characteristics. The annual sediment load at the Toudaoguai Hydrological Station primarily demonstrates periodic patterns at four time scales: 3–5 years, 11–13 years, 21–23 years, and 28–33 years. Figure 6b presents the wavelet real-part variance in the annual sediment load. The variance plot reveals three significant peaks, corresponding to 5 years, 11 years, and 31 years, respectively. The maximum peak corresponds to a 31-year cycle, which is identified as the first dominant cycle of sediment load. The 5-year and 11-year cycles represent the second and third dominant cycles, respectively. Wang also pointed out that the periodic changes in the annual sediment transport exist on three interannual scales of 3–7 years, 9–15 years, and 20–32 years, but there are differences on the first principal cycle. The author of the study believed that the change with the 9–15-year cycle is the most significant, and the scale periodic changes also have globality [24]. There is a certain connection between the periodic changes in water and sediment, but there are also certain differences [30].

4. Simulation and Prediction of Water–Sediment Evolution at the Toudaoguai Hydrological Station of the Yellow River

The dataset contains the annual runoff and sediment load from 1960 to 2019. For machine learning models such as BP neural network and ARIMA, due to the limited number of samples, this study appropriately increased the length of the training period to ensure that the models can fully learn the patterns in the data. Meanwhile, according to the previous analysis, there is a certain periodicity in the annual runoff and sediment load. The length of the training period and the validation period should preferably be multiples of an integer number of years. In the runoff and sediment load data after 2012, there are extreme events, such as the extremely low value in 2016 and the extremely high value in 2019. To ensure that these events are reflected in the validation period, the data from 2013 to 2019 were selected as the validation period. Using the measured annual runoff and sediment load data from 1960 to 2012 at the Toudaoguai Station in the Inner Mongolia section of the Yellow River as training samples, an ARIMA model was constructed on the MATLAB platform to simulate the annual runoff and sediment load from 2013 to 2019.

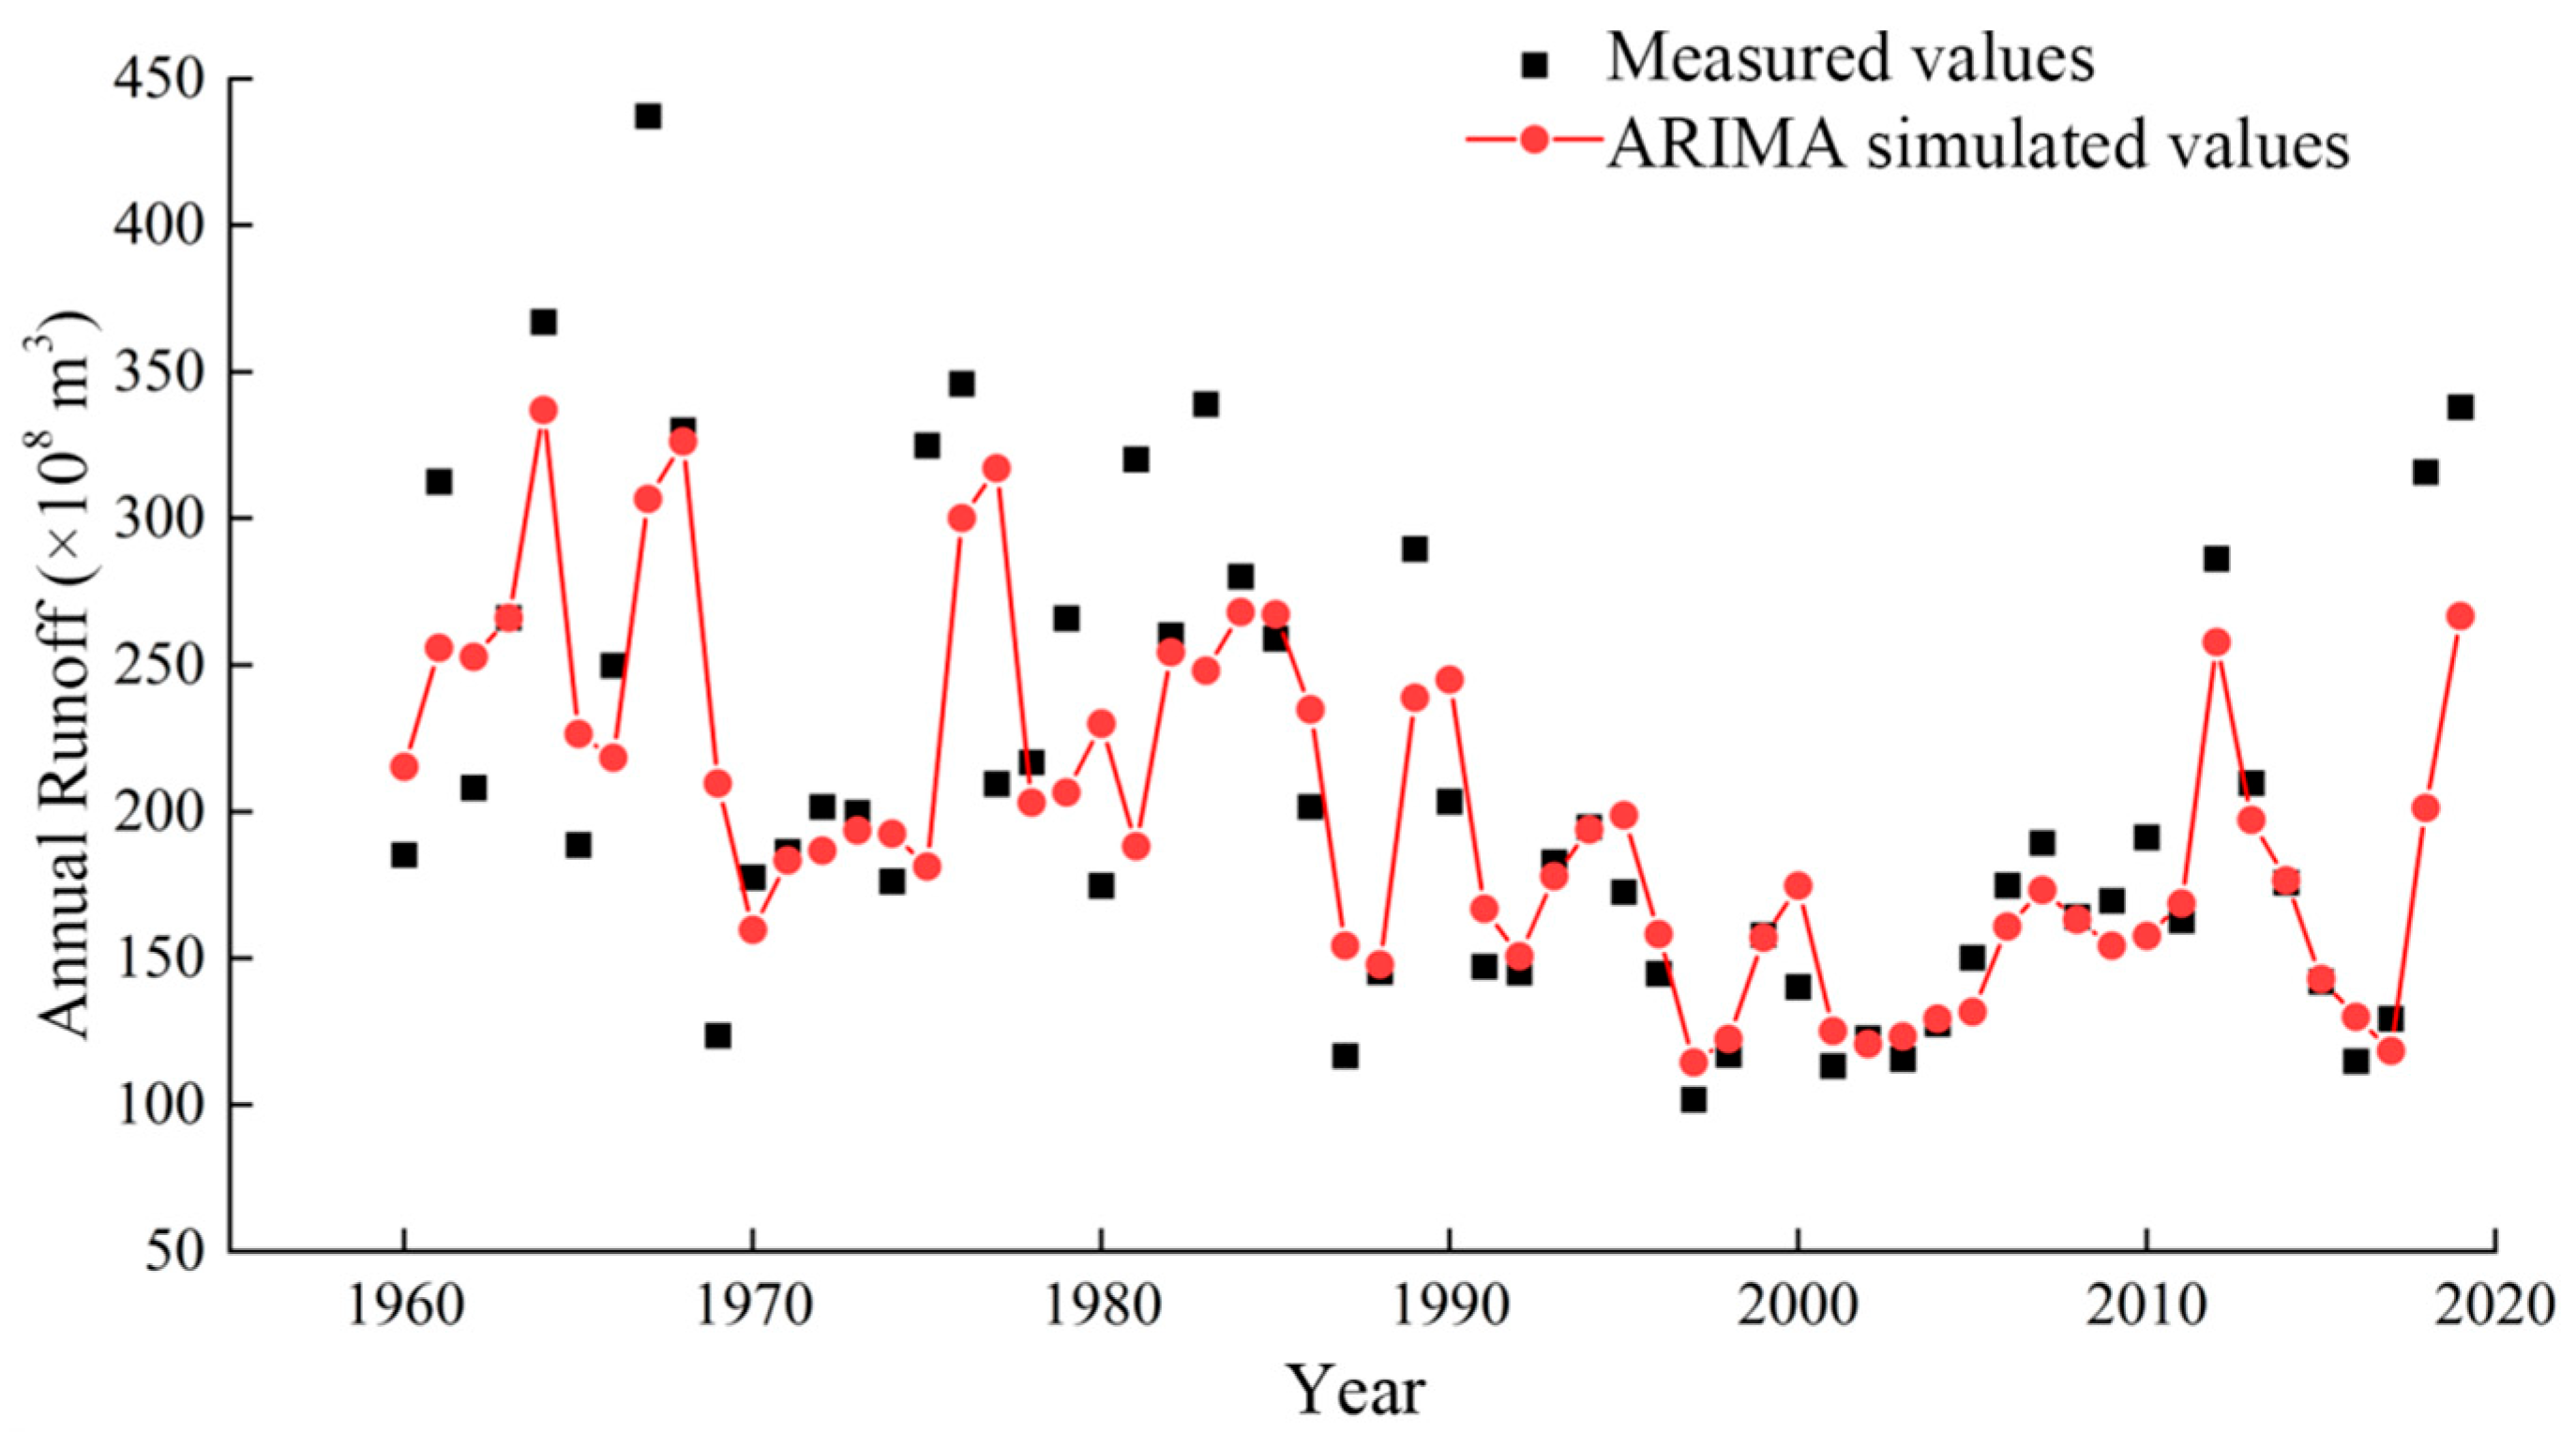
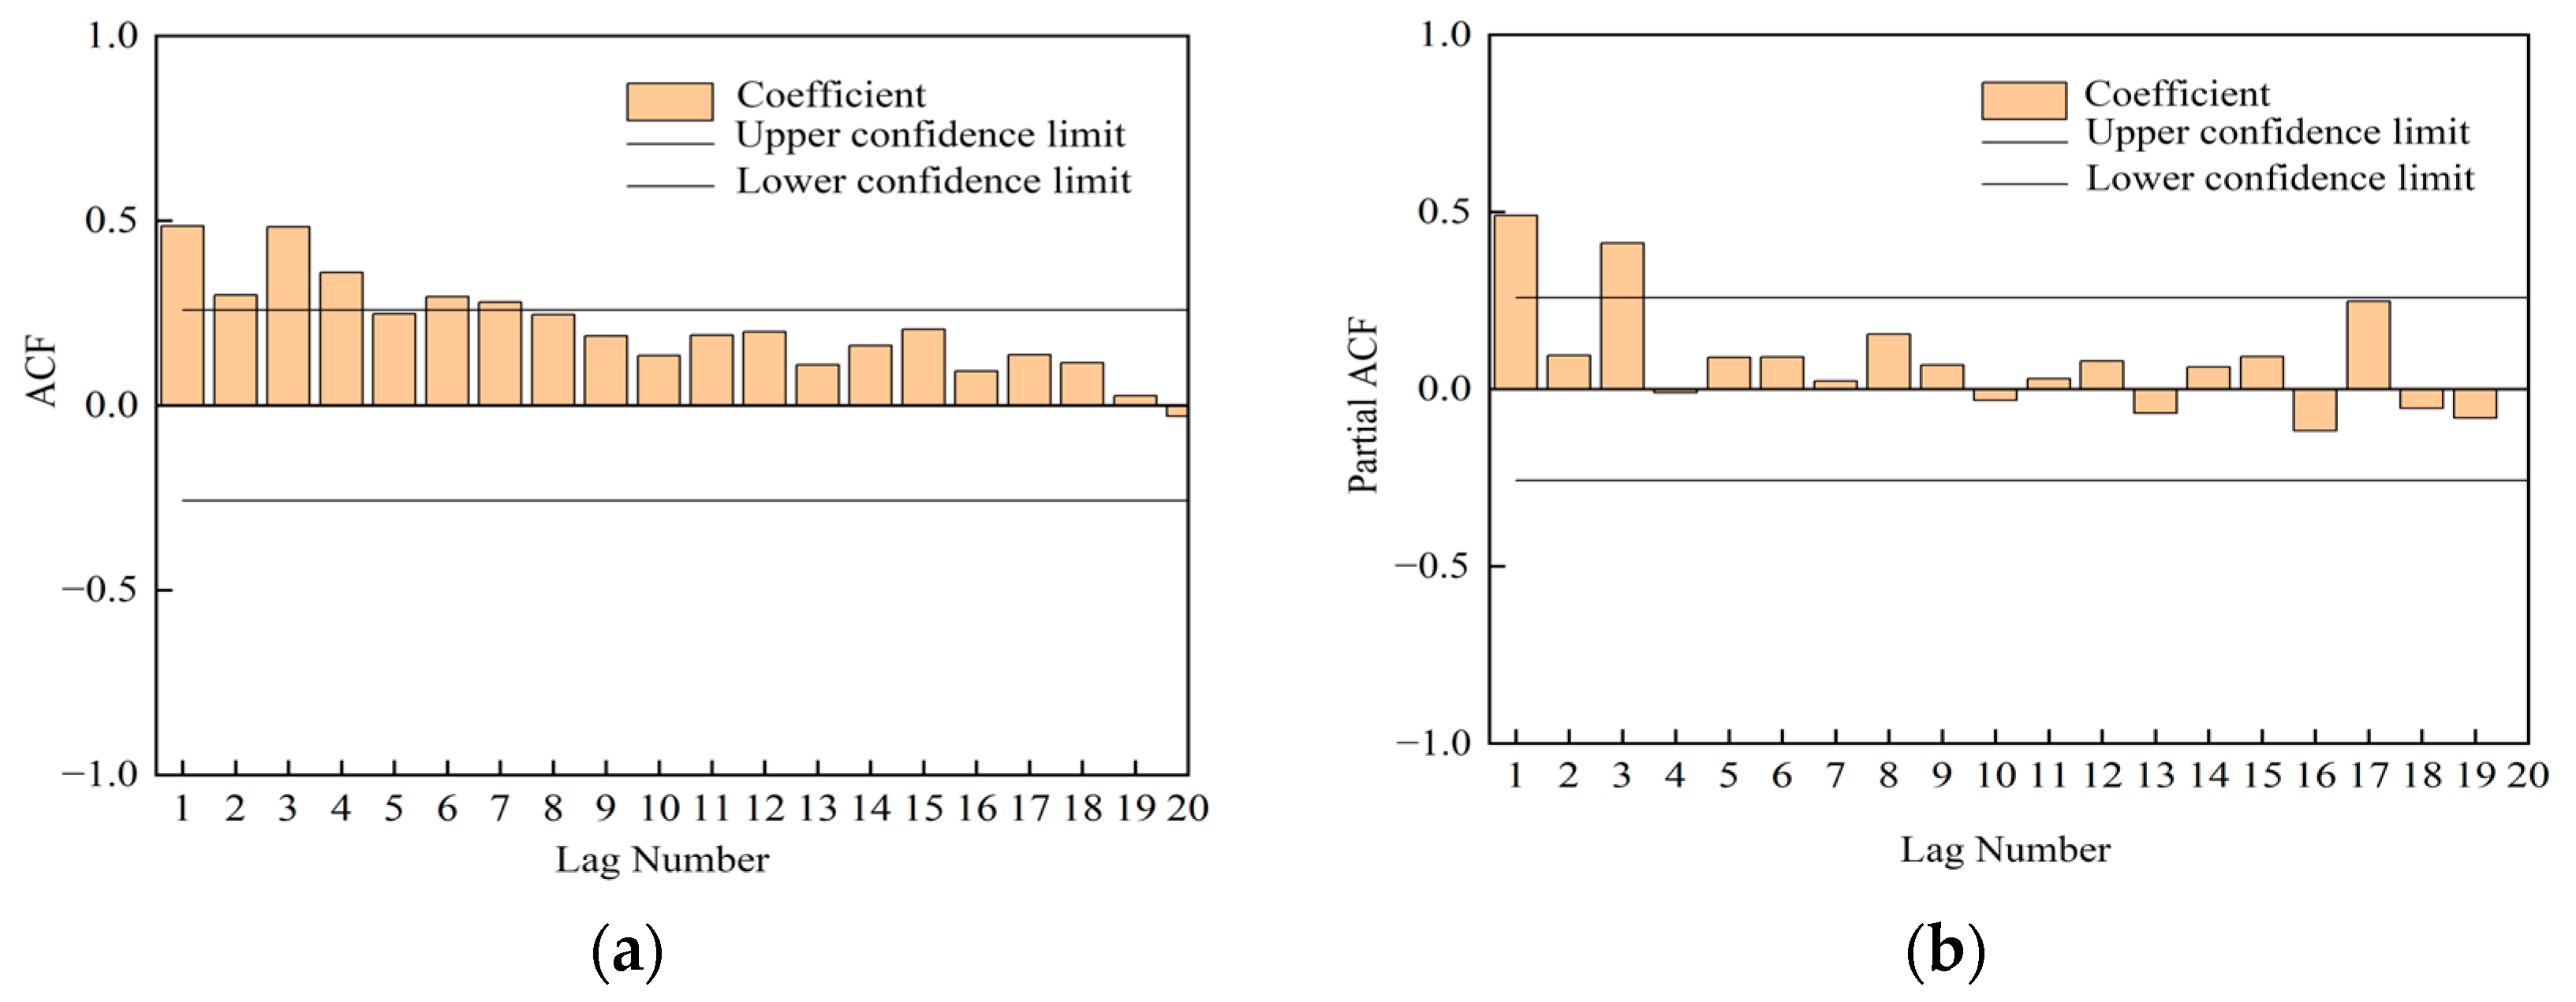
4.1. Simulation of Water–Sediment Evolution Process Based on the ARIMA Model

4.1.1. Simulation of the Evolution Process of Annual Runoff

Given that the annual runoff at the Toudaoguai Hydrological Station exhibits a decreasing trend and lacks stationarity, a first-order differencing process was applied to the series. After differencing, the series data were approximately evenly distributed about the zero axis. Subsequently, the augmented Dickey–Fuller (ADF) unit root test was conducted, where the results indicated that the first-order differenced series was judged as stationary at the 0.05 significance level.
Figure 7 shows the serial correlation plot of the first-order differenced annual runoff series, revealing that the autocorrelation function (ACF) is significant at lag 2, and the partial ACF is significant at lag 5. Initially, the ARIMA model parameters p and q were set to 3 and 1, respectively, resulting in the construction of an ARIMA (3,1,2) model for the annual runoff at the Toudaoguai Station. After multiple rounds of trial calculations and optimization, the ARIMA (2,1,3) model was ultimately determined to be the prediction model with the smallest error. The simulation results of this model for the annual runoff at the Toudaoguai Hydrological Station, along with the measured values, are presented in Figure 8. Table 2 provides the actual observed values, predicted values, and their corresponding errors. According to relevant standards, a simulation is considered qualified if the relative error of the simulated value does not exceed 20%, and the ratio of qualified simulations to the total number of simulations is defined as the qualification rate. The fitting results of the ARIMA model for the 1960–2012 data showed an average absolute error of 3.092 billion m3 and an average relative error of 13.77%. For the 7-year simulation period from 2013 to 2019, the relative errors ranged between 0.60% and 32.64%, with 5 years of predictions meeting the qualification criteria. The average relative error was 12.31%, and the average absolute error was 3.233 billion m3. Therefore, the ARIMA model can reflect the trend in runoff changes, but the overall simulation accuracy is relatively low.

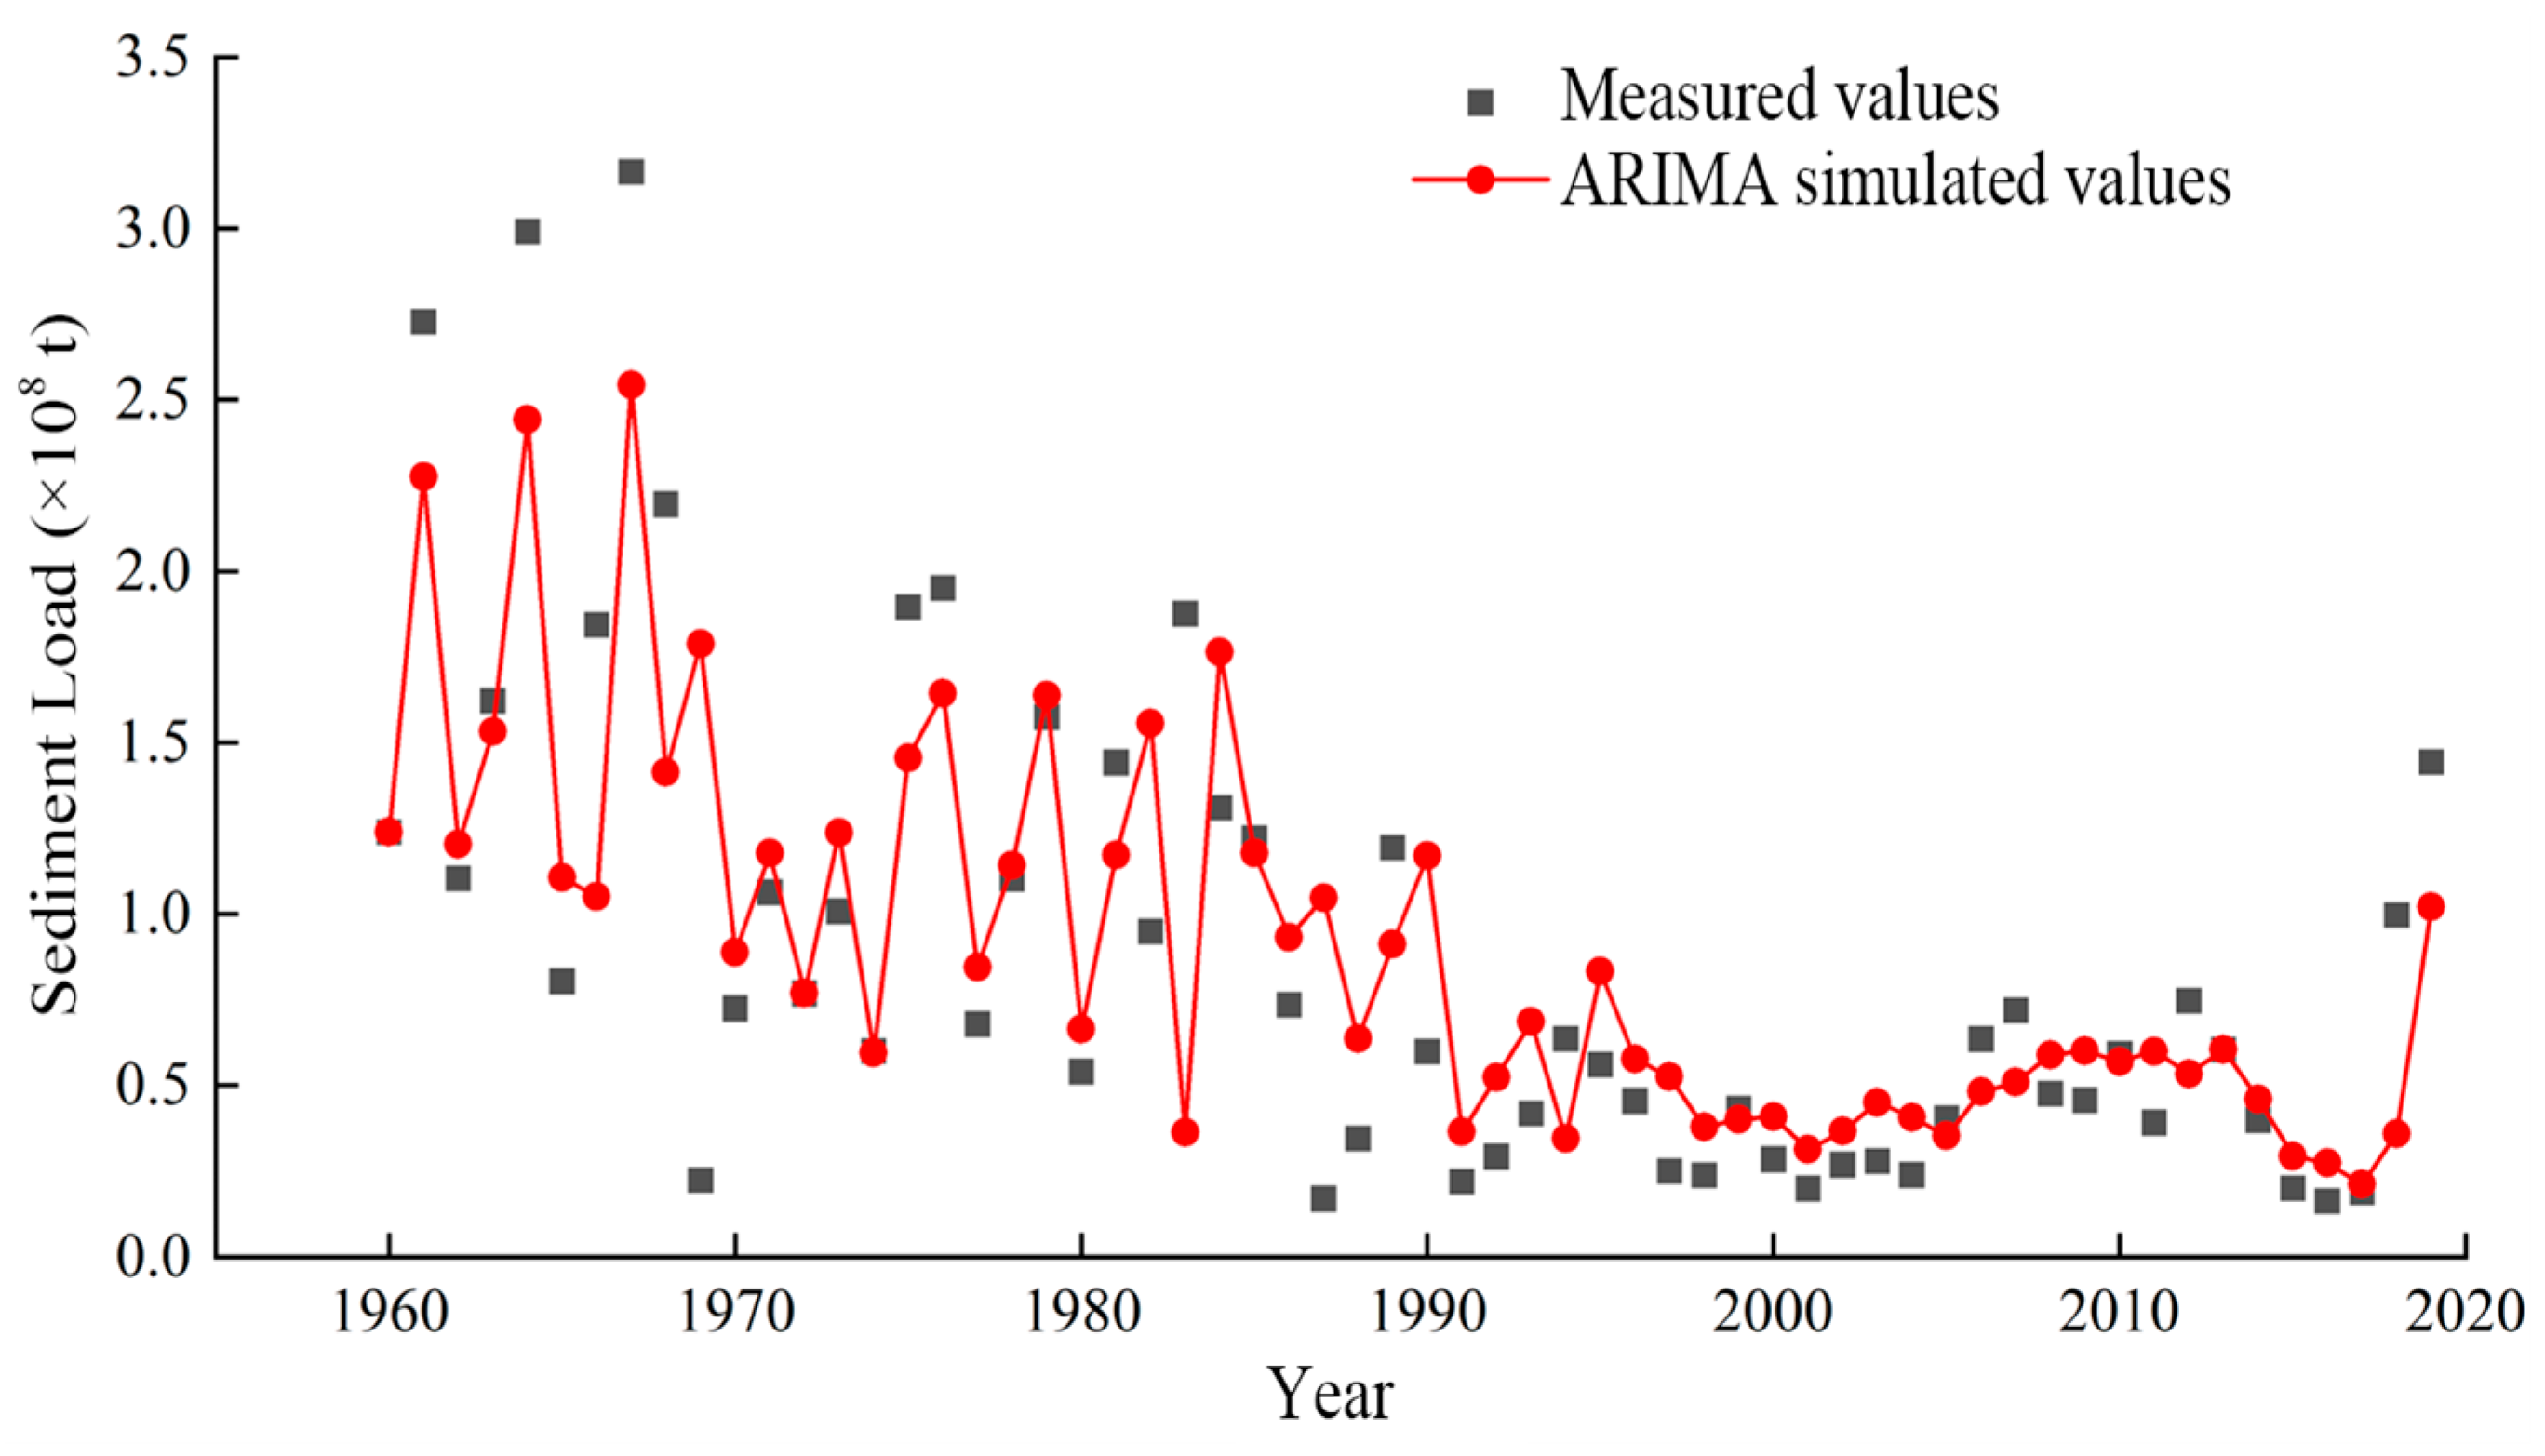
4.1.2. Prediction of Annual Sediment Transport by the ARIMA Model

A natural logarithm transformation was applied to the annual sediment load data of the Toudaoguai Station, followed by a first-order differencing operation to ensure the stationarity of the series. Correlation analysis was conducted on the preprocessed series, and the results are shown in Figure 9. After repeated experiments and residual tests, the optimal ARIMA model for the annual sediment load series was determined to be ARIMA (3,0,3).
The simulated and measured values of the annual sediment load at the Toudaoguai Hydrological Station using the ARIMA model are illustrated in Figure 10, and the errors between the measured and simulated values are presented in Table 3. During the fitting period from 1960 to 2012, the average absolute error was 0.0282 billion tons, and the average relative error reached 53.42%. Among the simulated sediment load values for 2013–2019, only 3 years met the qualification criteria. The 7-year predictions had an average absolute error of 0.0192 billion tons and an average relative error of 33.83%. Therefore, the ARIMA model exhibits low accuracy and relatively large errors in sediment load simulation and prediction, necessitating further refinement and improvement of the model. The main reason is that the ARIMA model is essentially a linear time-series model. The annual runoff and sediment load of the river cross-section are affected by natural conditions and human factors such as rainfall, water withdrawal and use, upstream water and sediment, and comprehensive basin management, and there are complex nonlinear relationships among them. The ARIMA model cannot effectively capture these nonlinear relationships, which leads to an increase in prediction errors. Meanwhile, the ARIMA model requires that the time-series data be stationary, that is, the mean, variance, and covariance in the data remain unchanged over time. However, the heterogeneous characteristics of the Yellow River’s water and sediment often lead to significant non-stationarity and seasonal differences in the time-series data. When applying this model to simulate annual runoff and sediment load, it will result in an inaccurate estimation of the model parameters, thereby affecting the accuracy of the prediction results.

4.2. Simulation of Water and Sediment Evolution Processes Using BP Neural Networks

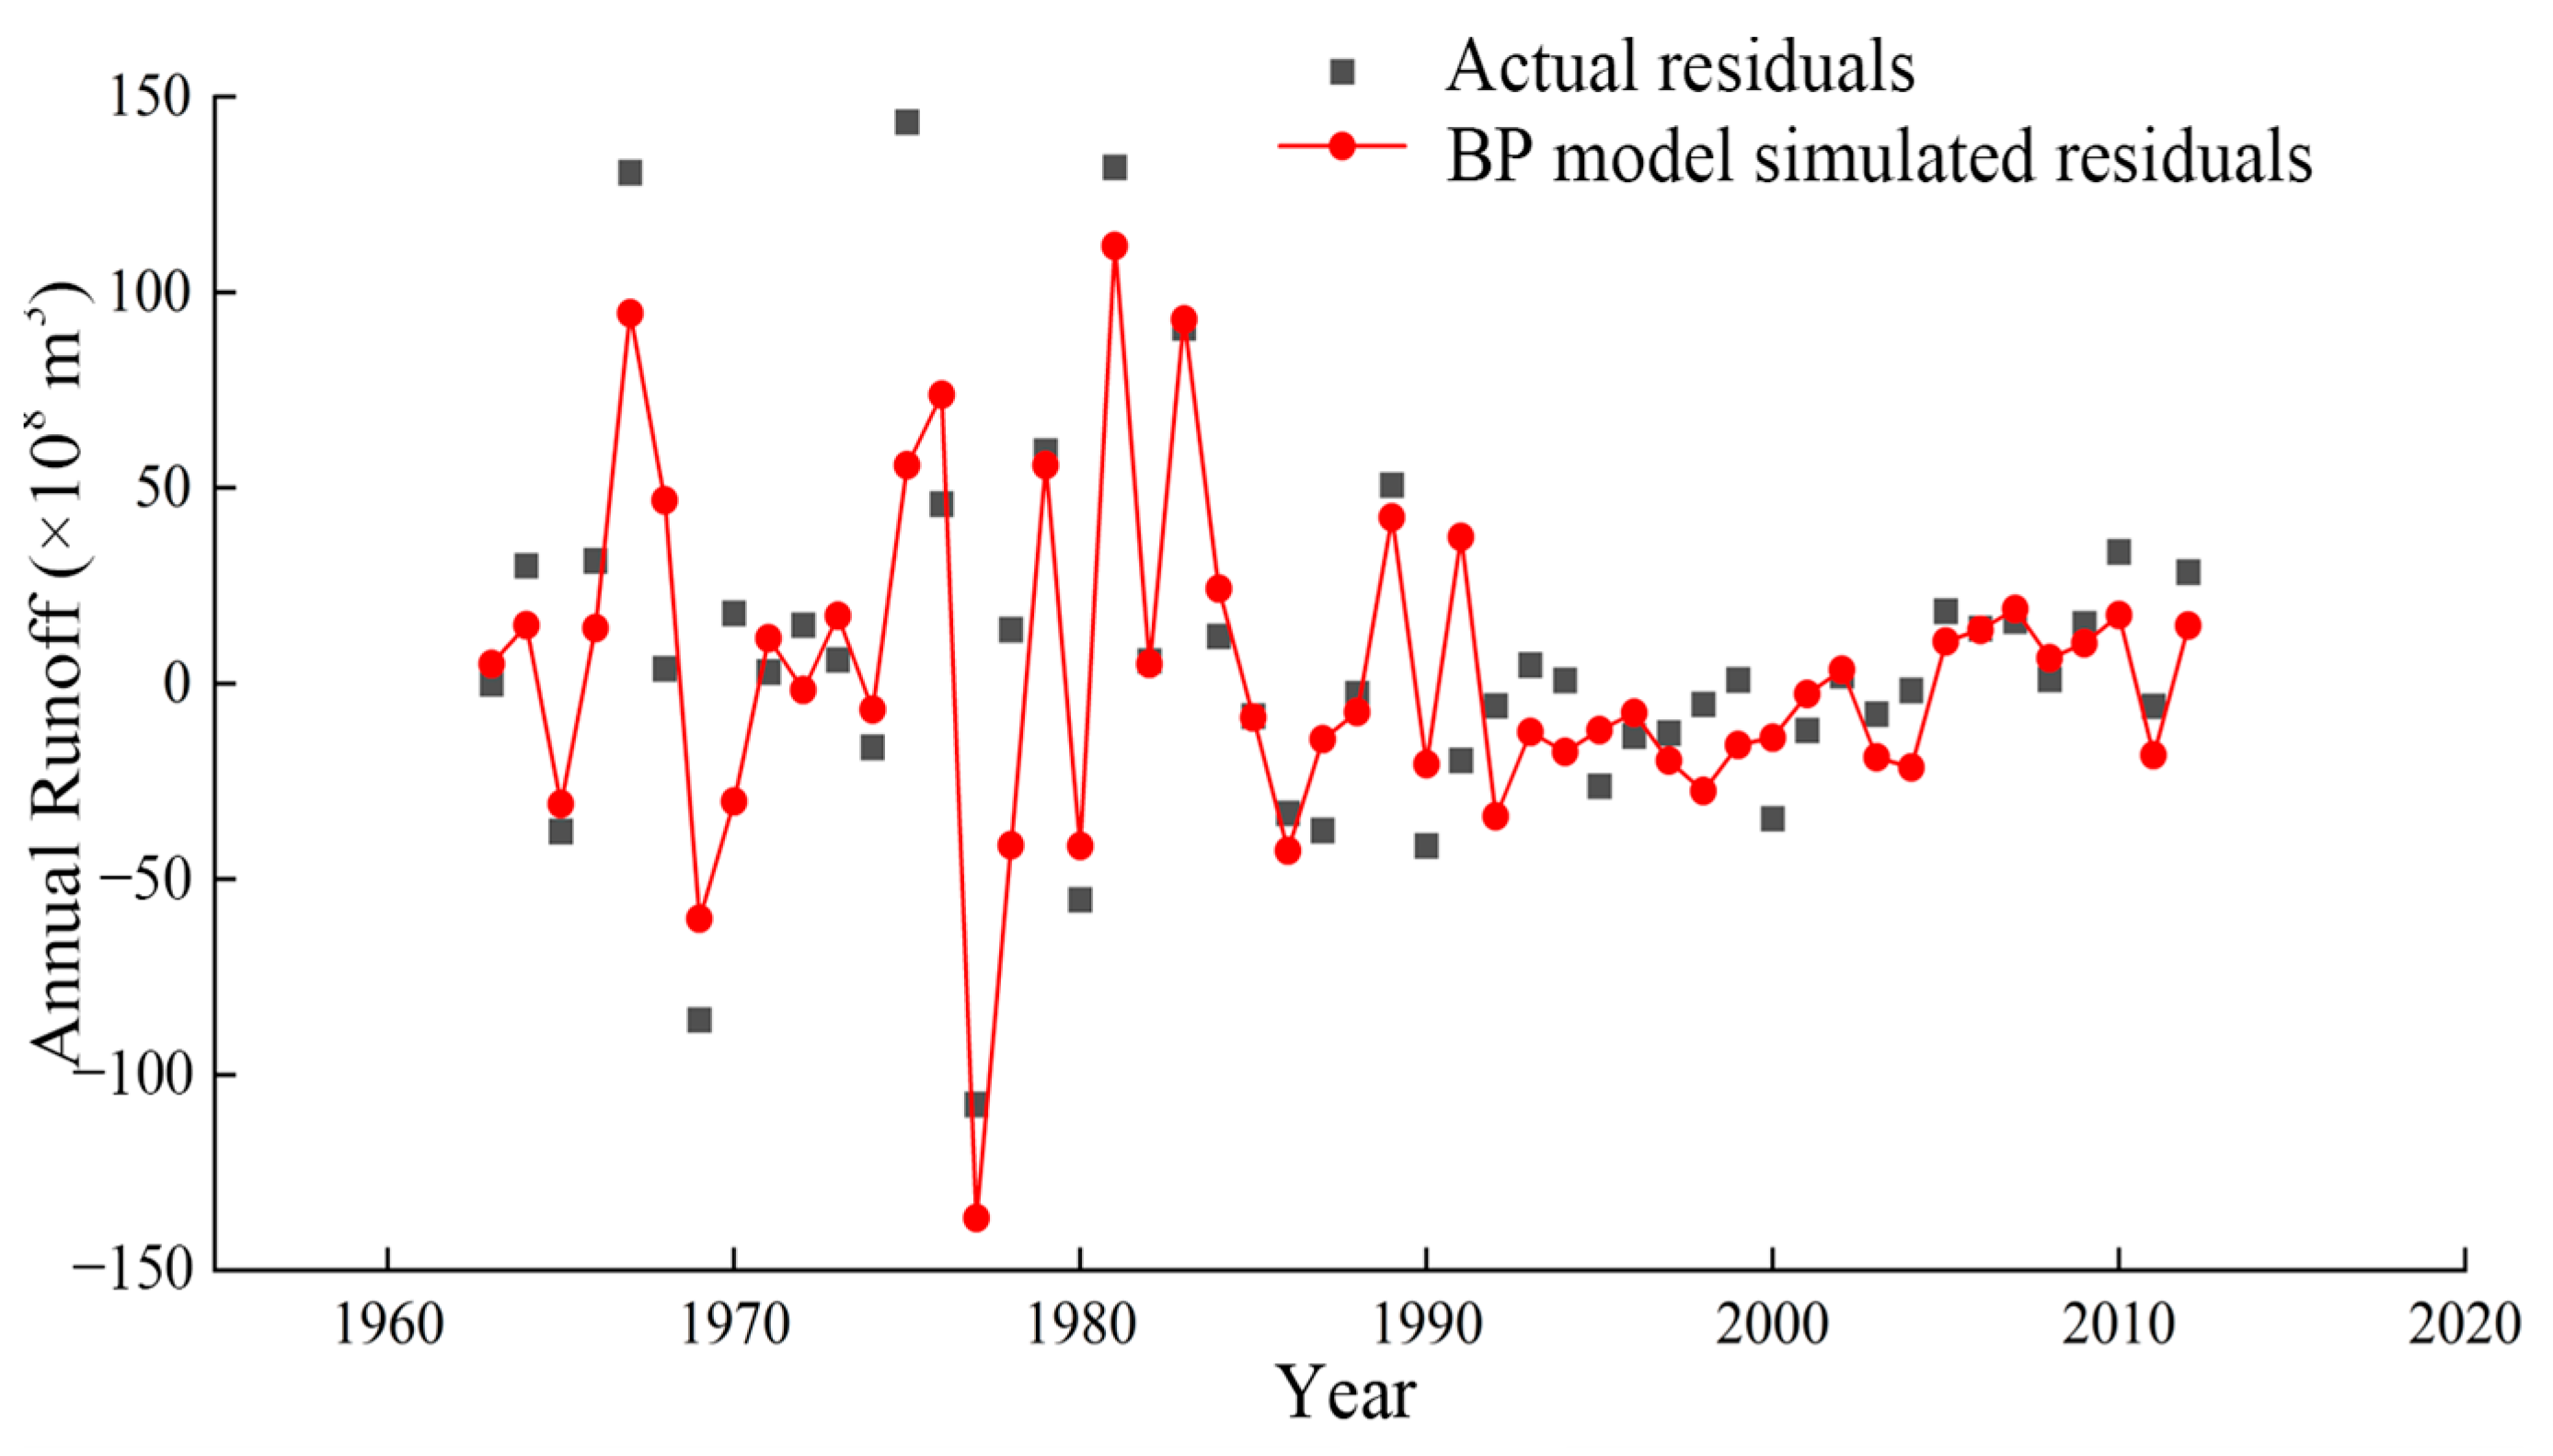
4.2.1. Simulation of Annual Runoff Volume

A BP neural network prediction model was established using MATLAB R2020a software, with the input layer of the training set defined as the runoff data from 1963 to 2012 and the output layer as the runoff data from 2013 to 2019, with one output node. To effectively integrate the ARIMA model with the BP neural network model, the simulation process first determined the residuals, i.e., the differences between the ARIMA model’s simulated values and the measured values. Subsequently, the BP neural network model was used to train and simulate these residuals, which were then compared with the actual residuals. Figure 11 presents a comparison between the simulated residuals of the annual runoff using the BP neural network model and the actual residuals. During the training period from 1963 to 2012, only 8 years had relative errors below 20%, meeting the qualification criteria, while the average relative error for this period was as high as 115.24%. Table 4 provides the residual values and error analysis of the runoff simulated by the BP neural network model during the simulation period from 2013 to 2019. Due to the significant variability and low qualification rate of the BP neural network model during the training period, its variability was even greater during the simulation period. The average absolute error over the 7 years ranged from 0.370 to 6.332 billion m3, with an average relative error as high as 160.73%, with significant differences in relative errors among the years. Therefore, the gap between the simulated values of the BP neural network model and the actual values is substantial, failing to effectively capture the trends in runoff changes. The model exhibits low prediction accuracy and large errors.

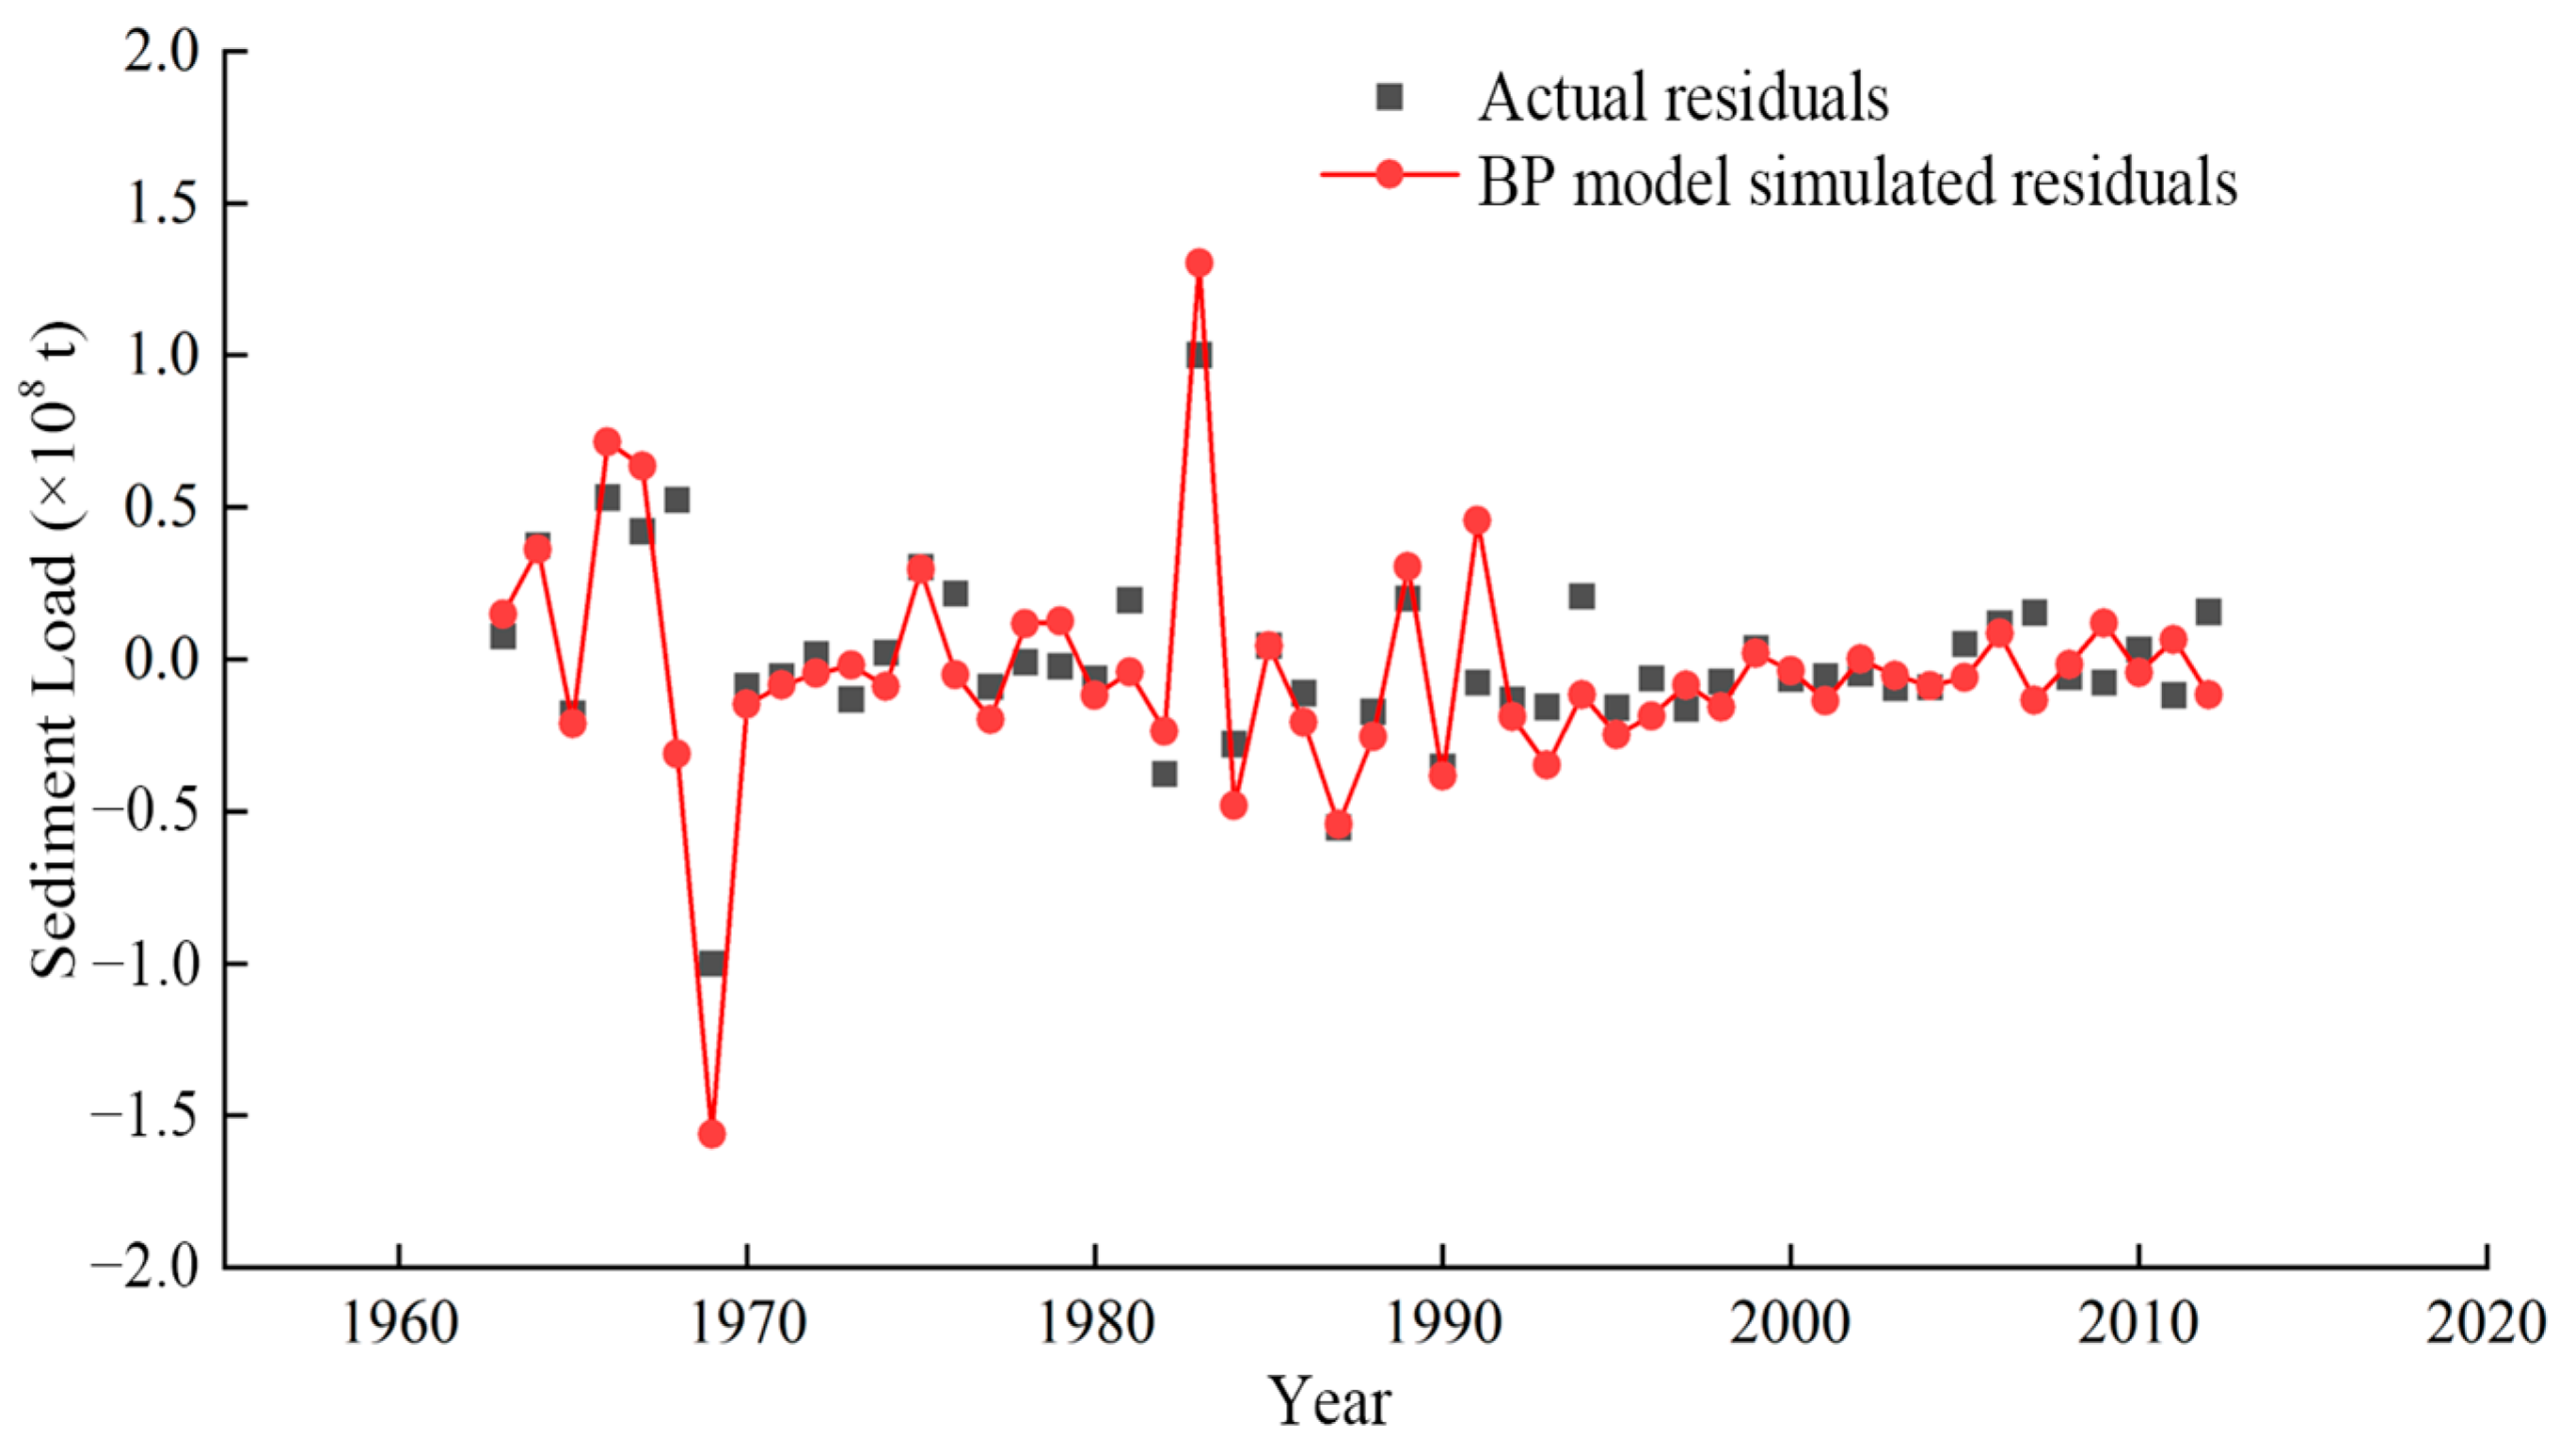
4.2.2. Prediction of Residuals in Annual Sediment Transport Using BP Neural Networks

Similarly, the BP neural network model was employed to train and fit the residual values of annual sediment load at the Toudaoguai Hydrological Station cross-section from 1963 to 2012, and the results were compared with the actual residual values, as illustrated in Figure 12. During the 50-year training and fitting period, only 10 years exhibited errors below 20%, yielding a qualification rate of 20%. Table 5 presents the simulated residuals and error analysis of annual sediment load at the Toudaoguai Hydrological Station cross-section for the period 2013–2019. It can be observed that the mean absolute error over the 7-year simulation period was 0.0946 billion tons, with relative errors ranging from 10.25% to 94.47%. Only one year had a relative error below 20%; therefore, although the BP neural network model can generally capture the trend in annual sediment loads, the large relative errors and low model accuracy indicate that it does not meet the requirements for practical applications.
It can be seen that the BP neural network model has large errors in simulating river runoff and sediment load. The reason is that the BP neural network model finds the global optimal weight parameters through optimization algorithms during the simulation process to minimize the network’s error function. However, since its error function is usually a highly nonlinear and complex function with many local minima, the network is prone to getting trapped in these local minima during training and fails to find the global optimal solution. Moreover, the limited nature of sediment load data and the complexity of sediment transport mechanisms make the BP neural network model susceptible to overfitting. The network may learn the noise in the training data, resulting in large errors on the test data. Therefore, it is necessary to further optimize and improve the existing models to enhance the simulation accuracy.

4.3. Simulation of Water and Sediment Evolution Based on the ARIMA-BP Coupled Model

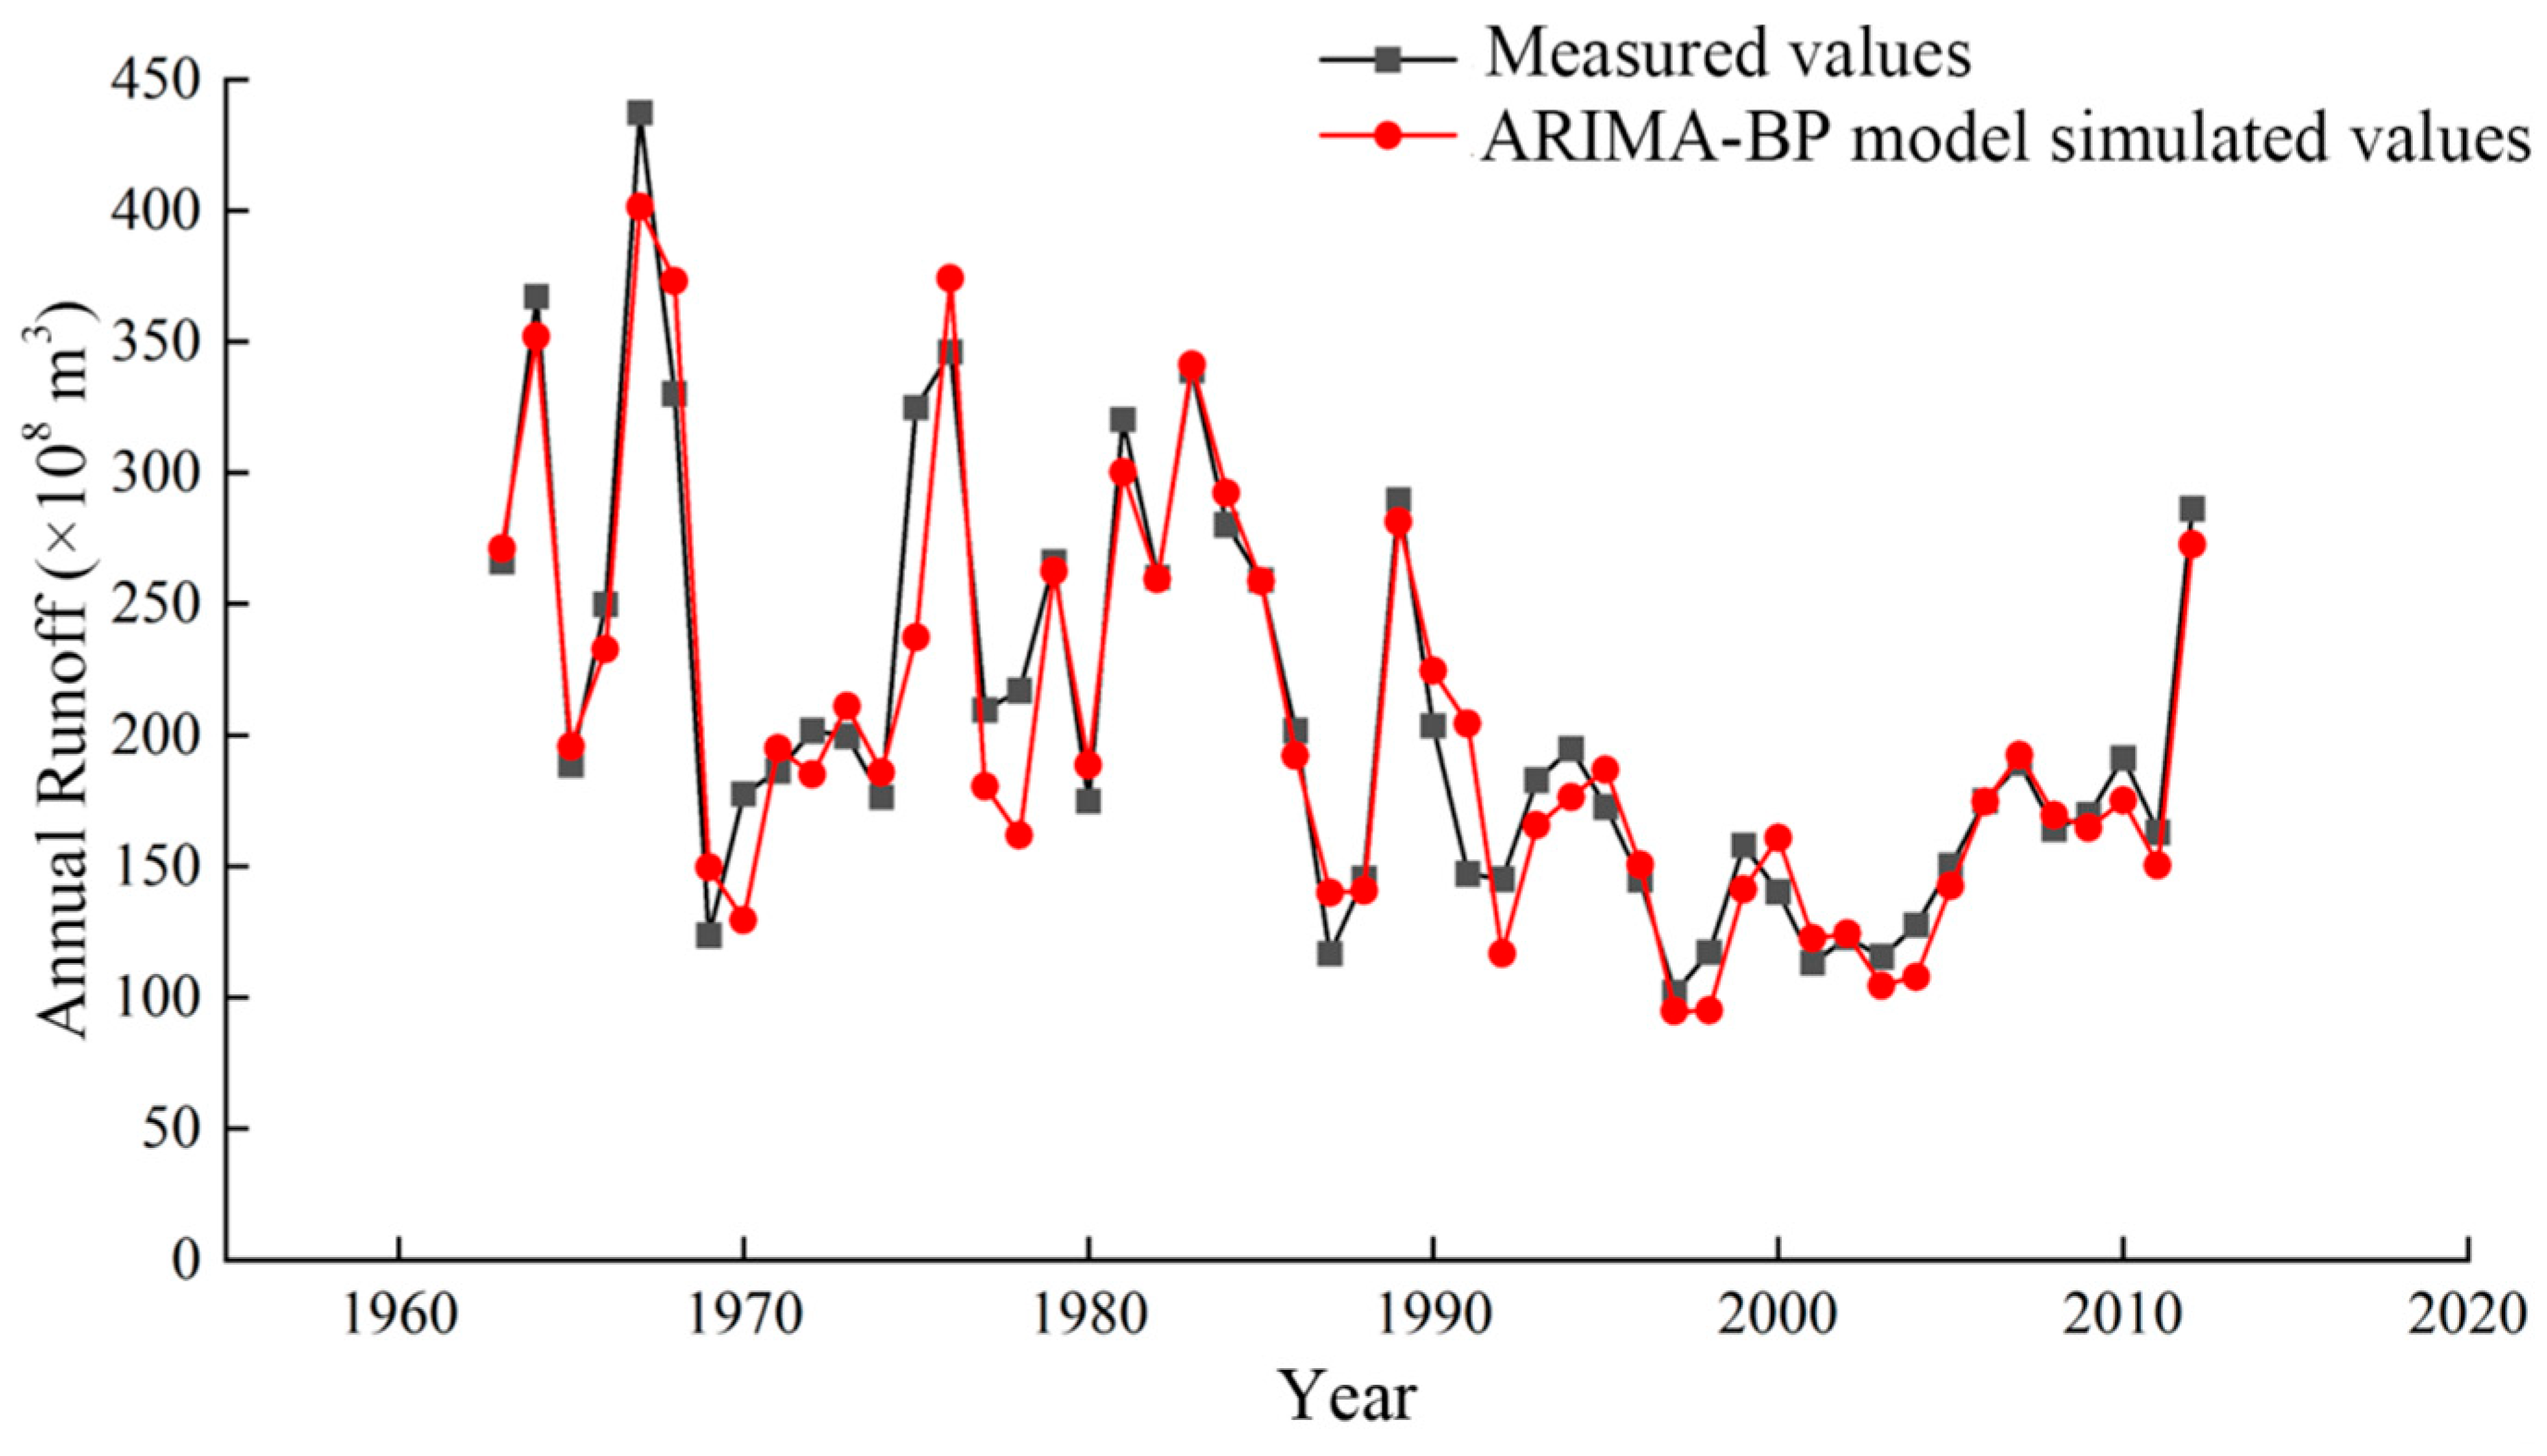
4.3.1. Fitting and Simulation of Annual Runoff

Given the limited accuracy of both the ARIMA model and the BP neural network model in simulating runoff and sediment load, while considering the respective advantages of these two models in water and sediment simulation and prediction, the differences between the measured values of water and sediment and the ARIMA-simulated values were input into the BP neural network for prediction. The final prediction results were obtained by summing the BP neural network predictions with the ARIMA predictions, thereby constructing the ARIMA-BP coupled model. The ARIMA-BP coupled model can integrate the strengths of both models and better handle the linear and nonlinear relationships existing in the time series of runoff and sediment discharge, thereby enhancing the prediction accuracy and interpretability of the model [31]. Meanwhile, as runoff and sediment discharge are influenced by various factors such as meteorological conditions and basin characteristics, their time series often exhibit complex dynamic change characteristics. The ARIMA-BP coupled model can better adapt to these complex changes and maintain good prediction performance even in the presence of noise, outliers, or missing values in the data, thereby enhancing the robustness of the model [32].
Figure 13 presents the training and fitting results of the ARIMA-BP coupled model for runoff from 1963 to 2012, compared with the measured values. It can be observed that the fitting results of this model align well with the measured data, and the simulation accuracy is significantly superior to that of the BP neural network model and the ARIMA model. During the fitting period, the relative errors for 45 years were less than 20%, resulting in a qualification rate of 90%. Table 6 provides the simulated values and error analysis of annual runoff at the Toudaoguai Hydrological Station cross-section for the period 2013–2019. Among the seven simulated years, six years exhibited relative errors below 20%, yielding a qualification rate of 85.7%, with an average relative error of only 5.61%.

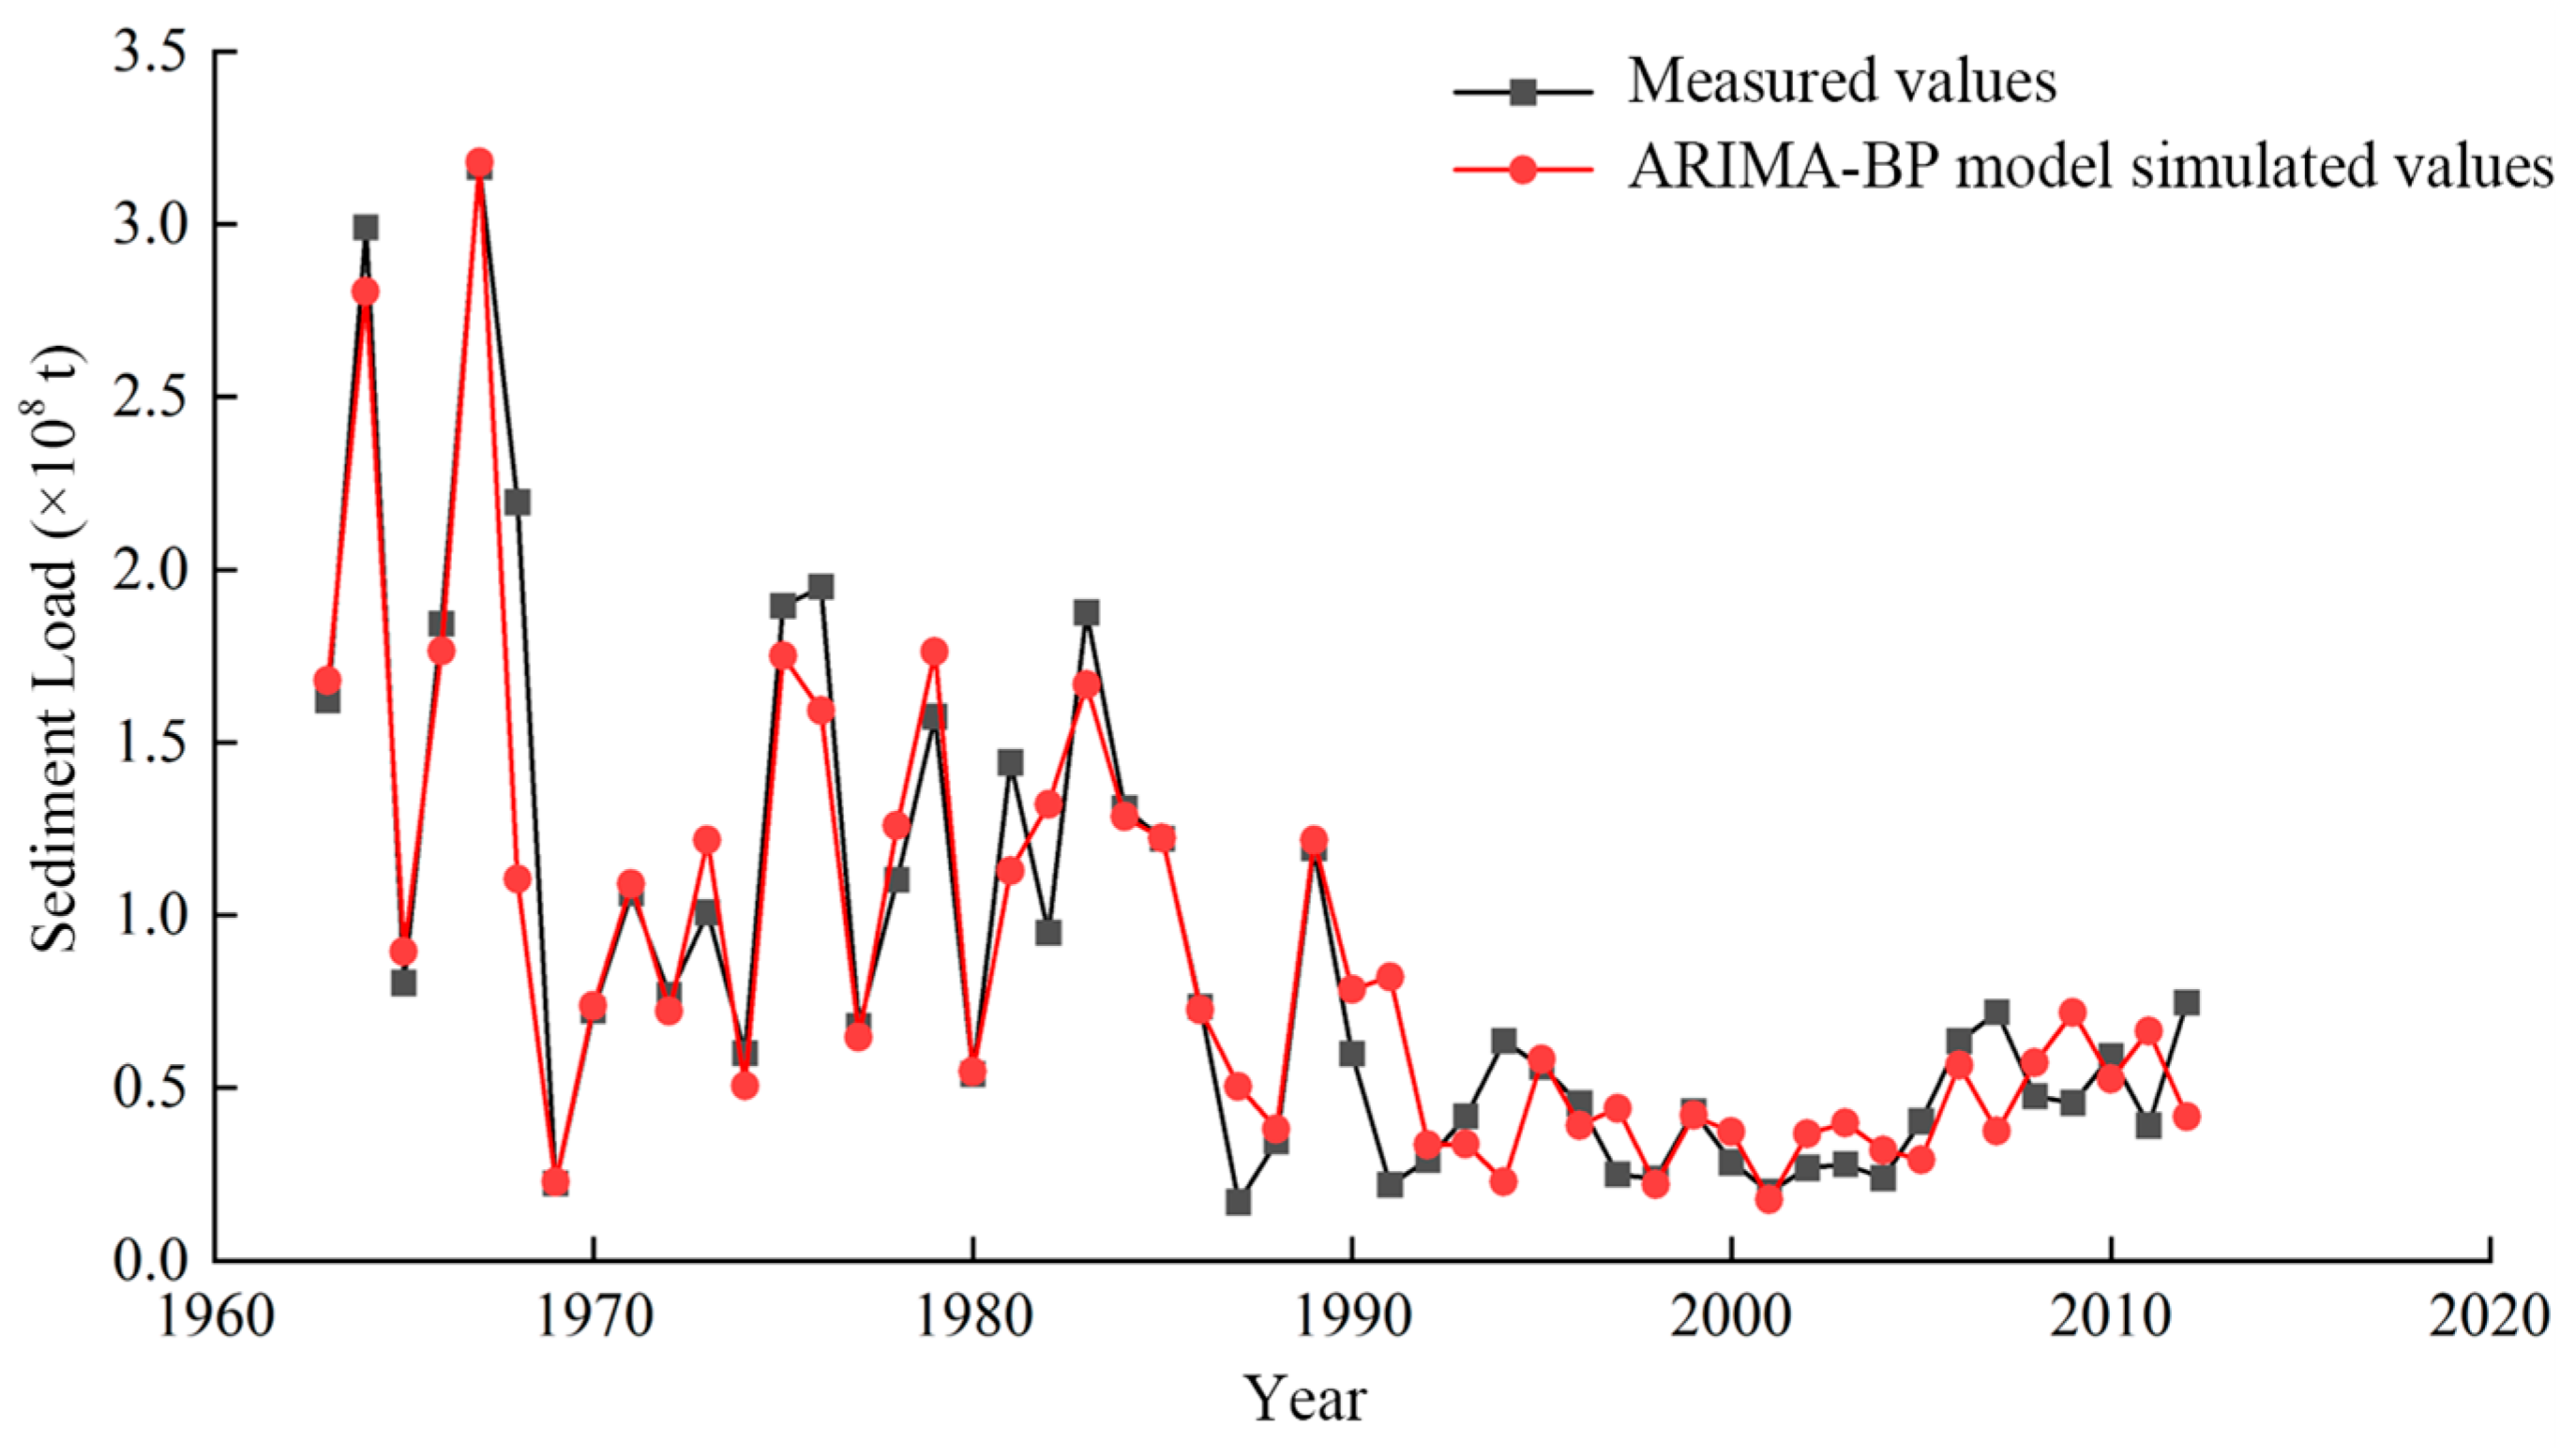
4.3.2. Fitting and Simulation of Annual Sediment Load

Figure 14 presents the fitting results of the ARIMA-BP coupled model for annual sediment load at the Toudaoguai Hydrological Station cross-section from 1963 to 2012, compared with the measured values. It can be seen that the fitting results of this model align well with the measured data, and the accuracy is significantly superior to that of the BP neural network model and the ARIMA model. During the training period, the relative errors for 39 years were below 20%, resulting in a qualification rate of 78%. Table 7 provides the simulated values and relative errors of annual sediment load at the Toudaoguai Hydrological Station cross-section for the period 2013–2019. Among the seven simulated years, five years exhibited relative errors below 20%, yielding a qualification rate of 71.4%, with an average relative error of 18.76%. Therefore, the ARIMA-BP coupled model demonstrates significant advantages in prediction accuracy and is more suitable for simulating and predicting the evolution processes and trends in water and sediment in the Inner Mongolia reach of the Yellow River.

4.4. Comparative Analysis of Simulation Accuracy Among Different Models

In comparison to the BP neural network model and the ARIMA model, the ARIMA-BP coupled model demonstrates significant advantages in simulating runoff and sediment load. Figure 15 presents a comparison of the simulated runoff and sediment load from the three different models with the measured values. It can be seen that the ARIMA model performs slightly better than the BP neural network model in runoff simulation, while the BP neural network model yields slightly better results than the ARIMA model in sediment load simulation. However, the simulation accuracy of both models is lower than that of the ARIMA-BP coupled model. Table 8 and Table 9 provide the evaluation metrics for the simulation accuracy of the three different models, respectively. In comparison to the ARIMA model and the BP neural network model, the ARIMA-BP coupled model exhibits significantly reduced RMSE and MAE values. The R2 values for runoff and sediment load simulations are 0.9137 and 0.8642, respectively, indicating that the ARIMA-BP coupled model achieves smaller errors in predictions. The performance of the ARIMA-BP coupled model on the dataset surpasses that of the ARIMA model or the BP model used individually. This coupled model effectively leverages the strengths of both the ARIMA model and the BP model, enhancing prediction accuracy and interpretability.

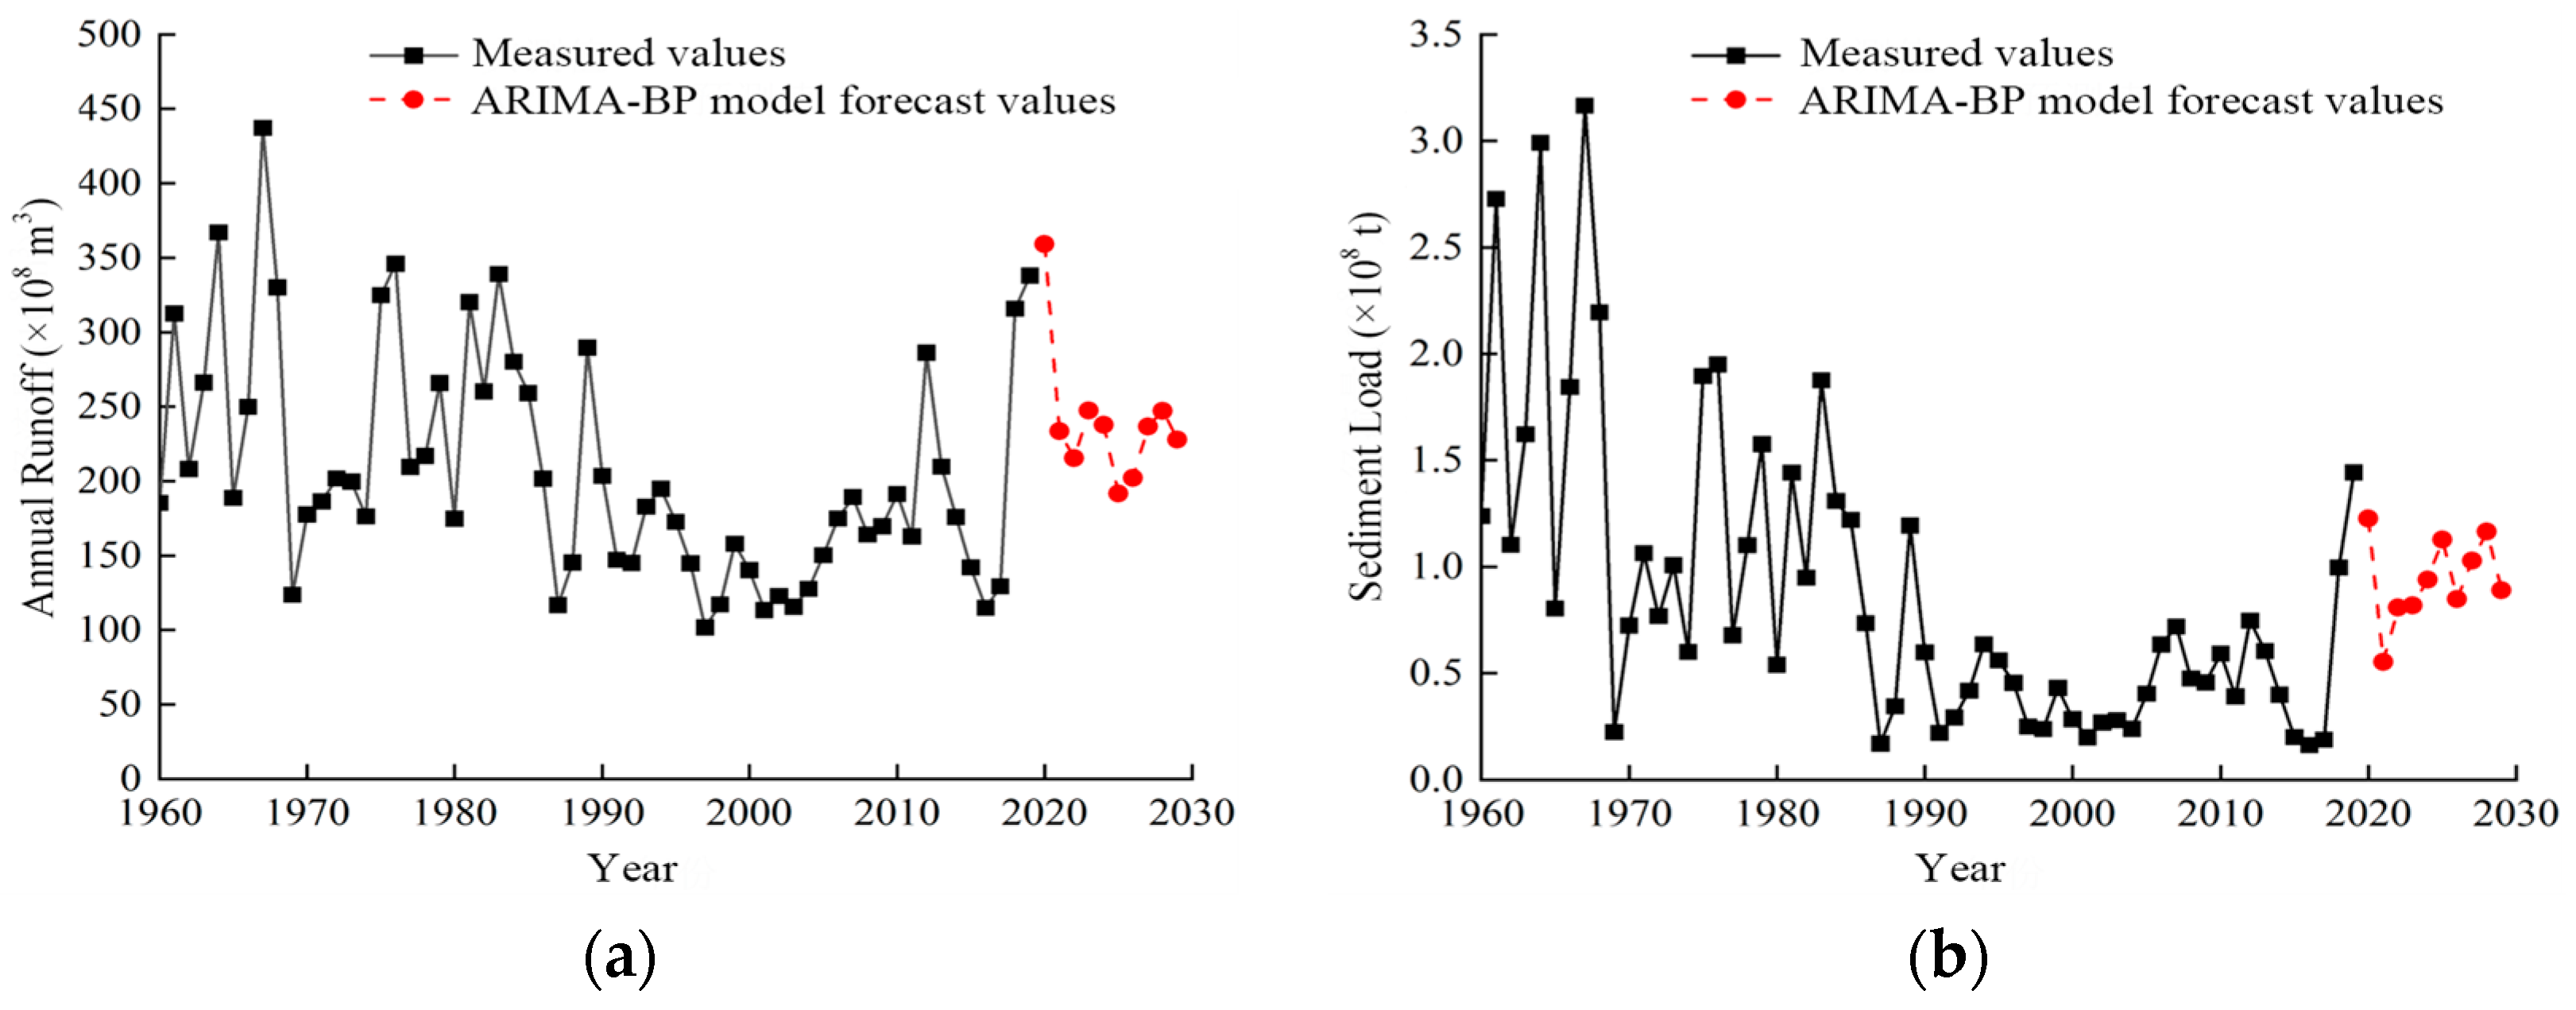
4.5. Prediction of Water and Sediment Variation Trends for the Next Decade

Given the high accuracy of the ARIMA-BP coupled model in simulating runoff and sediment load, this model was employed to simulate and predict the trends in annual runoff and annual sediment load at the Toudaoguai Hydrological Station cross-section for the period 2020–2029 (see Figure 16). It can be observed that although there are fluctuations within a certain range, both the runoff and sediment load at the Toudaoguai Hydrological Station exhibit an overall declining trend from 2020 to 2029. This trend is consistent with the water and sediment evolution patterns observed over the past 60 years (1960–2019) and aligns with the findings of other researchers [33,34].
This study used the ARIMA-BP coupled model to predict the evolution trend in runoff and sediment load at the Toudaoguai hydrological station from 2020 to 2029. By comparing with the existing published data of runoff and sediment load, the runoff at the Toudaoguai hydrological station decreased from 36.98 billion m3 in 2020 to 17.34 billion m3 in 2023, and the sediment load decreased from 141 million tons in 2020 to 23.9 million tons in 2023. The predicted trend basically coincides with the measured results, which verifies the reliability of the model.

5. Analysis of the Causes of the Evolution Process and Trends of Water and Sediment

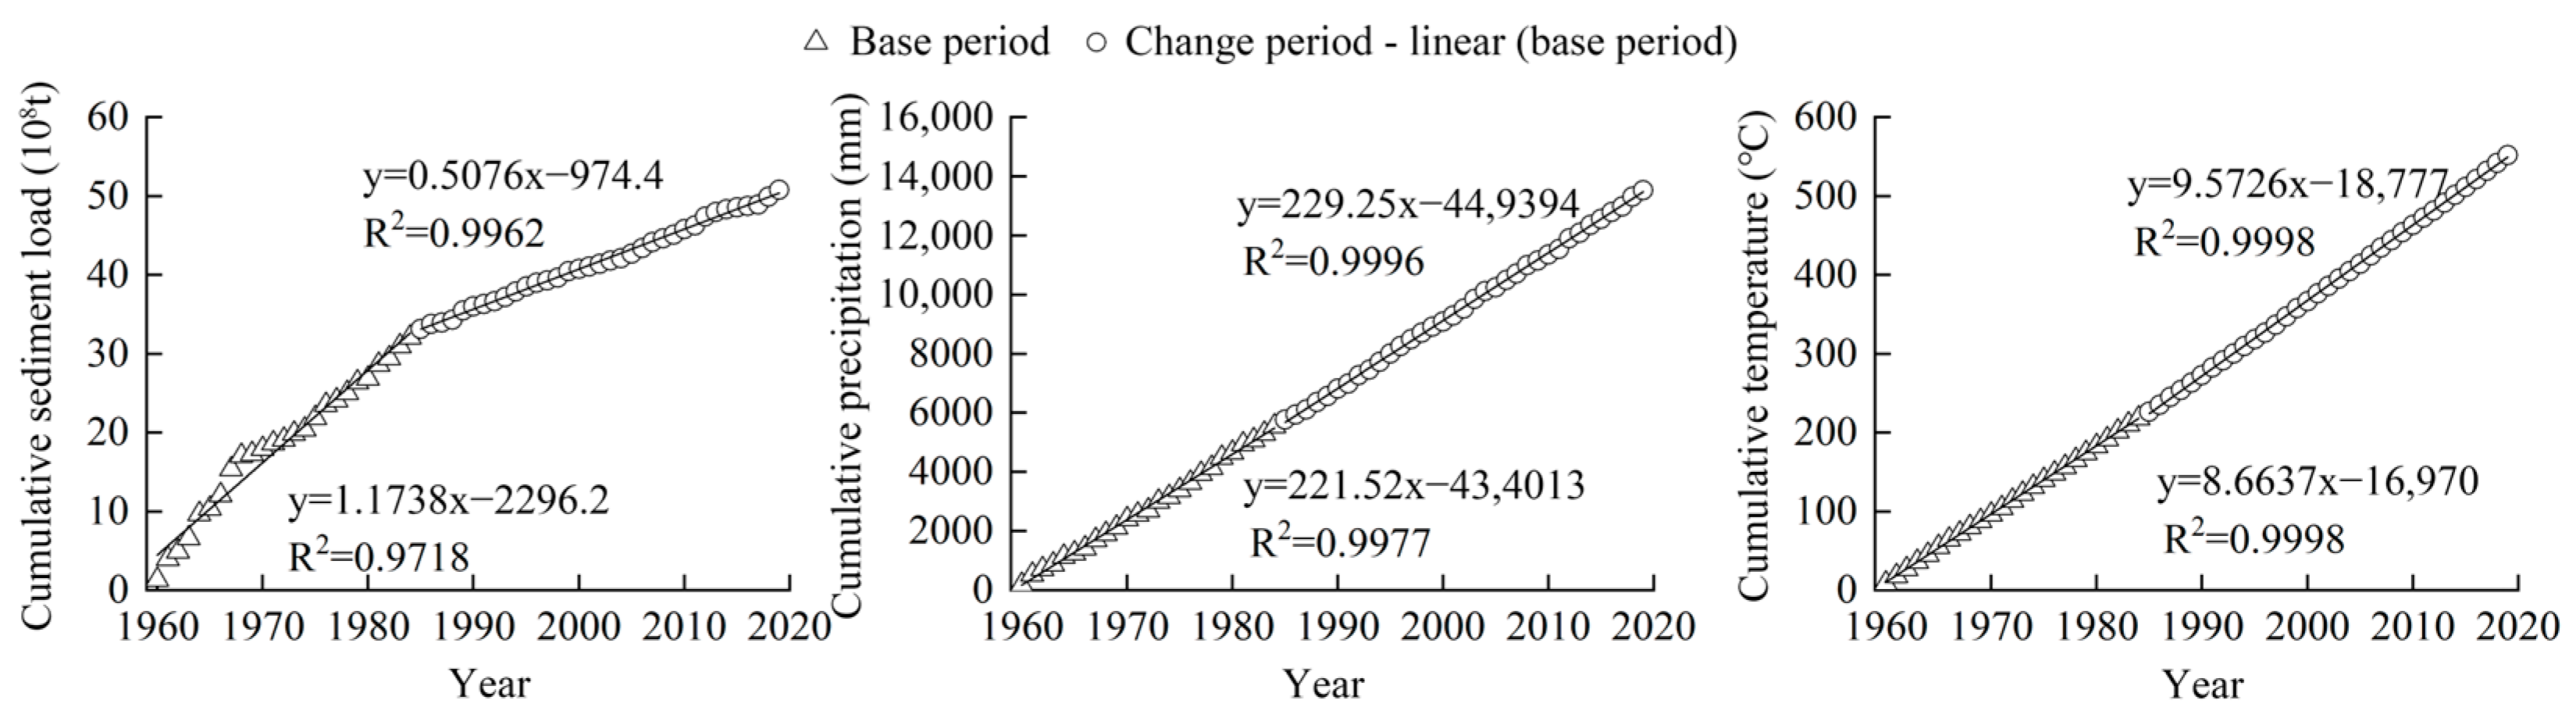
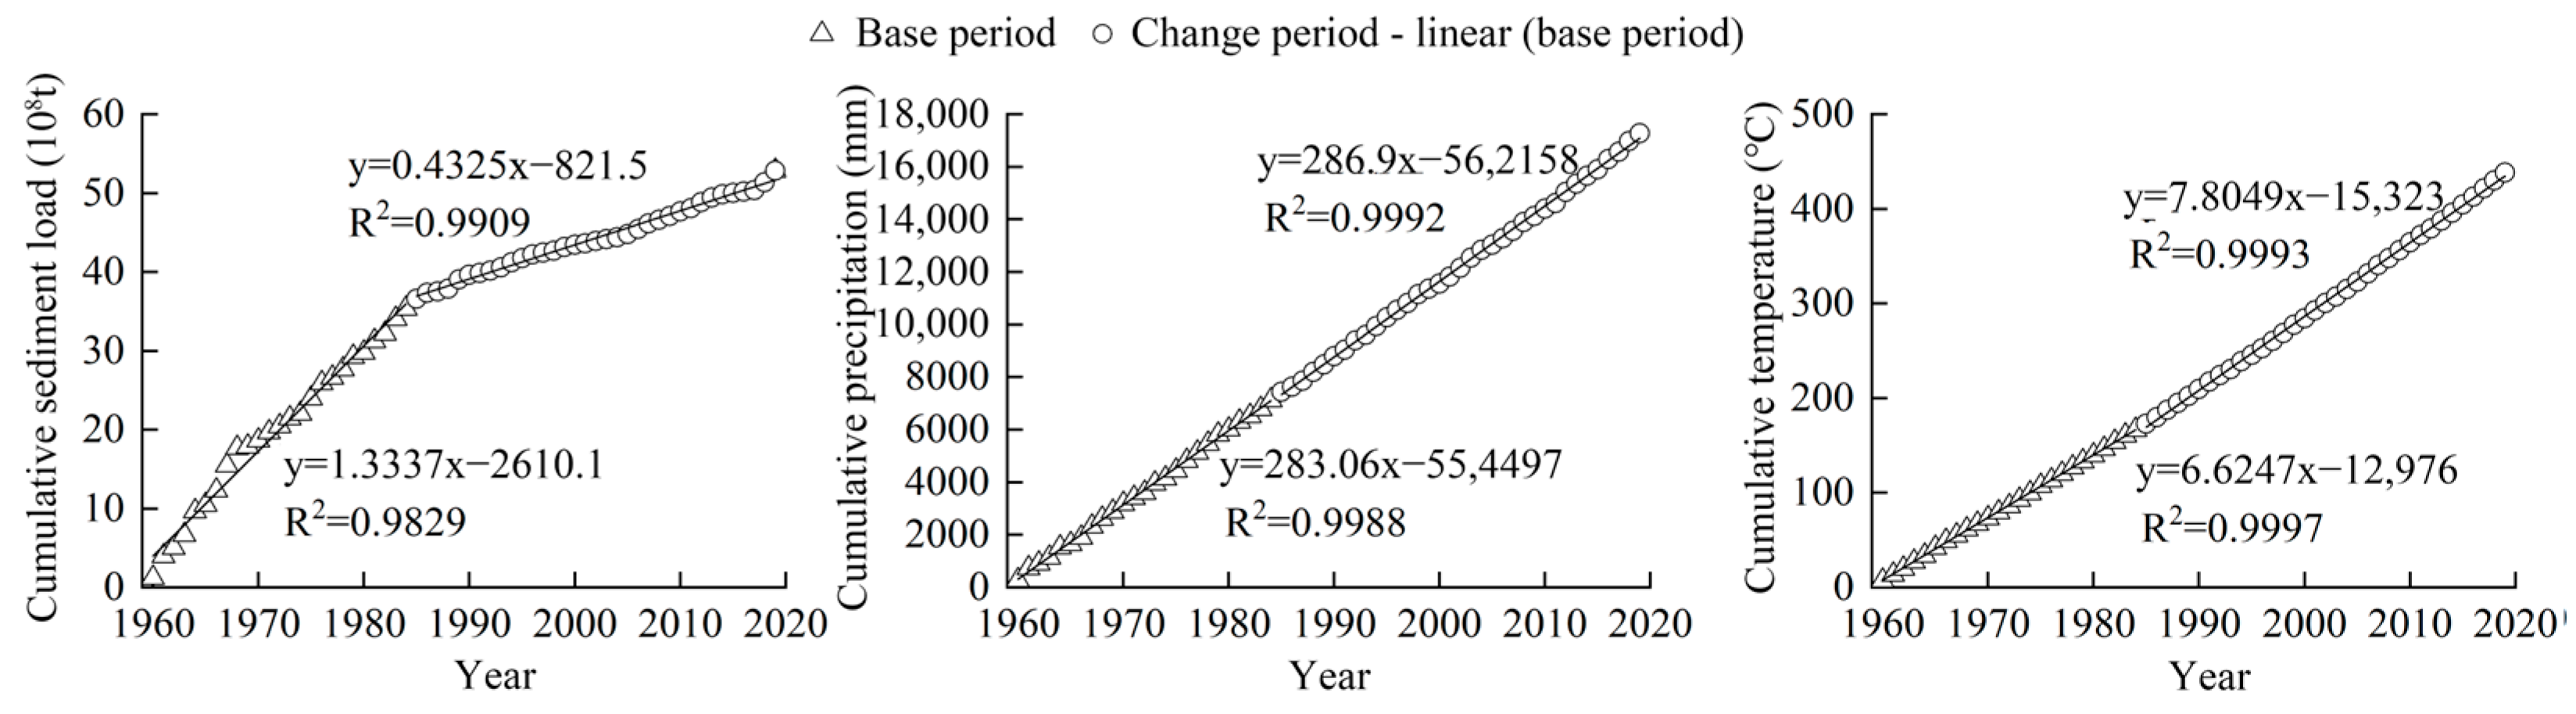
5.1. Discussion of Effect Factors

The existing studies have shown that natural factors and human activities are important reasons for the reduction in runoff and sediment load in the Yellow River [11,35]. Natural factors include a decrease in precipitation and an increase in temperature, while human activity factors mainly include water withdrawal and use in the basin, reservoir regulation, and soil and water conservation. As the most important factor affecting the production and convergence of runoff in the basin, precipitation is closely related to the production of runoff and sediment in the basin, and changes in precipitation affect the runoff and sediment load in the basin. Chen’s analysis pointed out that during the change period, the precipitation in the Yellow River (Inner Mongolia section) basin decreased by 11.5% compared with the base period, which led to a reduction in the production of water and sediment in the river section above this station [26]. The increase in temperature will increase the surface evaporation flux, thereby affecting the runoff and sediment transport in the basin. From 1960 to 2019, the annual average temperature of the Toudaoguai Hydrological Station showed a significant upward trend, with an increase of 2 °C. The rise in temperature has led to changes in the water and sediment processes in the basin.
As mentioned earlier, there are several large-scale irrigation districts in the Yellow River (Inner Mongolia section). Meanwhile, industrial and domestic water use along the way also comes from the Yellow River. Water withdrawal and use in the basin also affect the river runoff and sediment load. After 1986, the water diversion and sediment diversion increased by 8.3% and 12.8%, respectively, compared with the average value of many years. The increase in water withdrawal and use in the basin is also one of the reasons for the reduction in runoff and sediment load. With the completion of water conservancy projects upstream of the Toudaoguai section, especially the completion of the Haibowan Water Conservancy Hub in 2014, the water-storage and sediment-trapping functions of the reservoirs have gradually been reflected. After 1986, during the joint operation of Longyangxia and Liujiaxia reservoirs, it can be seen from the periods divided by the mutation analysis that the runoff and sediment load of the Tou Daoguai station have decreased significantly. The joint operation of the upstream reservoirs has intercepted most of the river sediment. The enhanced sediment-trapping effect of the reservoirs is one of the important influences on the reduction in sediment load at the Tou Daoguai station. The change in the water–sediment relationship is closely related to the implementation of soil and water conservation measures in the basin. Since the 1970s, large-scale soil and water conservation measures have been implemented in the Yellow River (Inner Mongolia section) basin, such as returning farmland to forests and grasslands and silt-retaining dams. In 2015, in the “Ten Major Kongdui” basin of the Yellow River tributaries, the area of cultivated land and unused land decreased by 11.9% compared with that in 1989, while the area of forest and grassland increased by 9.4% [29]. The returning-farmland-to-forests-and-grasslands and soil-and-water conservation measures in the basin have significantly improved the water-source conservation capacity of the basin, reduced soil erosion, and affected the water–sediment process of the main stream of the Yellow River. They will also play an important role in the future.

5.2. Discussion of the Contribution Rates of Influencing Factors to the Evolution of Water and Sediment

In order to discuss the contribution rates of the various influencing factors to the evolution process of runoff and sediment load at the Toudaoguai Hydrological Station, this study employs the improved method of comparing the rates of change in the cumulative quantity slopes to quantitatively analyze the contribution rates of natural factors and human activities [36,37].
If it is assumed that the slopes of the cumulative runoff, cumulative sediment load, cumulative precipitation, and cumulative temperature of the four stations in the Inner Mongolia section of the Yellow River during the base period and the change period are S R a and S R b (billion m3/a), S S a and S S b (billion t/a), S P a and S P b (mm/a), S T a and S T b (°C/a), respectively, and according to the improved method of comparing the rates of change in cumulative quantity slopes, the following are obtained:
R S R = S R b / S R a 1 100
R S S = S S b / S S a 1 100
R S P = S P b / S P a 1 100
R S T = S T b / S T a 1 100
where R S R is the rate of change in the slope of cumulative runoff; R S S is the rate of change in the slope of cumulative sediment load; R S P is the rate of change in the slope of cumulative precipitation; and R S T is the rate of change in the slope of cumulative temperature (%).
Assuming that the total contribution rates of natural factors and human activities to runoff and sediment load are defined as 100, then the following are obtained:
      C P R = R S P / R S R 100
                    C T R = R S T / R S R 100
            C H R = 100 C P R C T R
C P S = R S P / R S S 100
              C T S = R S T / R S S 100
          C H S = 100 C P S C T S
where C P R is the contribution rate of precipitation to runoff; C T R is the contribution rate of temperature to runoff; C H R is the contribution rate of human activities to runoff; C P S is the contribution rate of precipitation to sediment load; C T S is the contribution rate of temperature to sediment load; C H S is the contribution rate of human activities to sediment load (%).
Figure 17 shows the variation in the cumulative runoff, cumulative precipitation, and cumulative temperature with years at the Toudaoguai hydrological station. Figure 18 shows the variation in cumulative sediment load, cumulative precipitation, and cumulative temperature with years. It can be seen that the slope change in the linear equation of the cumulative runoff-year at the Toudaoguai hydrological station is −8.815 billion m3/a, and the slope change rate is −35.3%. The slope change in the linear relationship of cumulative temperature-year is 1.22 °C/a, and the change rate is 18.4%. The slope change in the linear relationship of cumulative precipitation–year is 4.46 mm/a, and the slope change rate is 1.57%. According to formulas 13–15, the contribution rates of natural factors and human activities to runoff are 75.14% and 24.86%, respectively. The slope change in the linear equation of cumulative sediment load–year is −0.9 billion t/a, and the slope change rate is −67.66%; the slope change in the linear relationship of cumulative precipitation-year is 3.84 mm/a, and the slope change rate is 1.3%; the slope change in the linear relationship of cumulative temperature-year is 1.18 °C/a, and the slope change rate is 17.82%. According to formulas 16–18, the contribution rates of natural factors and human activities to sediment load are 24.41% and 75.59%, respectively.

6. Conclusions

The Mann–Kendall test, cumulative anomaly method, and wavelet analysis were employed to analyze the variation characteristics of annual runoff and sediment load at the Toudaoguai Hydrological Station. The simulation results of the ARIMA model and the BP neural network model for runoff and sediment load were compared, and a high-precision ARIMA-BP coupled model was constructed to predict the changes in runoff and sediment load at the Toudaoguai Station from 2020 to 2029. The following conclusions were drawn:
(1)
From 1960 to 2019, both annual runoff and sediment load at the Toudaoguai Station exhibited a declining trend. A significant abrupt change in annual runoff occurred in 1986, while a similar change in annual sediment load occurred in 1984. The first dominant cycle in the evolution of annual runoff was 12 years, and that of annual sediment load was 31 years.
(2)
The simulation accuracy of the ARIMA-BP coupled model was significantly superior to that of the BP neural network model and the ARIMA model. The model predicts that the runoff and sediment load at the Toudaoguai Hydrological Station will continue to follow a decreasing trend from 2020 to 2029.
(3)
The contribution rate of natural factors to the runoff at the Toudaoguai hydrological station is 75.14%, while the impact of human activities on the sediment load is 75.59%.

Author Contributions

Conceptualization, C.L. and X.G.; methodology, J.G. and C.L.; software, J.G.; validation, C.L., J.G. and H.F.; investigation, J.G.; data curation, H.F.; writing—original draft preparation, J.G. and C.L.; writing—review and editing, C.L. and X.G.; supervision, X.G.; funding acquisition, C.L. and X.G. All authors have read and agreed to the published version of the manuscript.

Funding

This research was funded by the Open Research Fund of State Key Laboratory of Simulation and Regulation of Water Cycle in River Basin (China Institute of Water Resources and Hydropower Research), (grant No. IWHR-SKL-KF202113), The National Natural Science Foundation of China—Yellow River Water Science Joint Fund (grant No. U2443205), The Inner Mongolia Autonomous Region Science and Technology Plan Project, (grant No. 2023YFSH0002), The Natural Foundation of Inner Mongolia (grant No. 2023MS05023), and Central Government Guided Local Science and Technology Development Fund Project (grant No. 2024ZY0065).

Data Availability Statement

Datasets including Runoff and Sediment load were derived from public domain resources.

Acknowledgments

Acknowledgements are extended to the State Key Laboratory of Simulation and Regulation of Water Cycle in River Basin and the China Institute of Water Resources and Hydropower Research for their financial support of this research paper.

Conflicts of Interest

The authors declare no conflicts of interest.

References

  1. Jing, E.H. Significant Scientific and Technological Progress and Trend of Sediment Research in the Yellow River. J. Water Resour. Archit. Eng. 2020, 18, 1–9. [Google Scholar] [CrossRef]
  2. Fan, X.L.; Shi, C.X.; Zhou, Y.Y.; Shao, W.W. Sediment rating curves in the Ningxia-Inner Mongolia reaches of the upper Yellow River and their implications. Quat. Int. 2012, 282, 152–162. [Google Scholar] [CrossRef]
  3. Jiong, X. Decreasing trend of sediment transfer function of the Upper Yellow River, China, in response to human ac-tivity and climate change. Hydrol. Sci. J. 2015, 60, 311–325. [Google Scholar] [CrossRef]
  4. Zhang, X.H.; Zheng, Y.S.; Shang, H.X.; Feng, Q. Sedimentation characteristics of the reach from Bayangaole to Toudaoguai of the Yellow River. Hydro-Sci. Eng. 2022, 03, 41–49. [Google Scholar] [CrossRef]
  5. Ran, D.C.; Yao, W.Y.; Shen, Z.Z.; Ni, Y.; Dong, F. Analysis on the contribution rate of driving factors for the annual water and sediment variations at the Toudaoguai hydrological station in the Yellow River. Adv. Water Sci. 2015, 22, 769–778. [Google Scholar] [CrossRef]
  6. Chen, L.H.; Lv, Q.; Wang, Z.G. Processes of bed-forming flow and its driving factors at Toudaoguai Hydrological Station in the main stream of the Yellow River. J. Sediment Res. 2023, 48, 45–51. [Google Scholar] [CrossRef]
  7. Shi, F.X.; Gao, G.M.; Wang, Y.J.; Ma, W.M.; Chen, R.X. Analysis of Inflow and Sediment Change of the Lower Yellow River Based on th-e Degree of Incoordination. Yellow River 2020, 42, 52–55+61. [Google Scholar] [CrossRef]
  8. Zhao, S.X.; Wang, W.J.; Quan, D.; Li, C.; Wu, Y.J.; Quan, Q.; Sun, Z.H. Characteristics and Impacting Factors of Flow-Sediment Movement at Toudao-guai Hydrological Station of the Yellow River. J. Soil Water Conserv. 2021, 35, 125–131. [Google Scholar] [CrossRef]
  9. Shen, G.Q.; Zhang, Y.F.; Shang, H.X.; Li, X.P. Sedimentation and cross-section regulation in different periods in the Low-er Yellow River. J. Sediment Res. 2005, 03, 30–34. [Google Scholar] [CrossRef]
  10. Hu, C.H.; Zhang, X.M.; Zhao, Y. Cause analysis of the centennial trend and recent fluctuation of the Yellow River se-diment load. Adv. Water Sci. 2020, 31, 725–733. [Google Scholar] [CrossRef]
  11. Yao, W.Y.; Ran, D.C.; Chen, J.N. Recent changes in runoff and sediment regimes and future projections in the Yello-w River basin. Adv. Water Sci. 2013, 24, 607–616. [Google Scholar] [CrossRef]
  12. Hu, C.H.; Zhang, X.M. Several key questions in the researches of runoff and sediment changes and trend predictions in the Yellow River. Shui Li Xue Bao 2018, 49, 1028–1039. [Google Scholar] [CrossRef]
  13. Bao, Z.X.; Zhang, J.Y.; Wang, G.Q.; He, R.; Jin, J.; Wang, J.; Wu, H. Quantitative assessment of the attribution of runoff and sediment change ba-sed on hydrologic model and machine learning: A case study of the Kuye River in the Middle Yellow River basin. Adv. Water Sci. 2021, 32, 485–496. [Google Scholar] [CrossRef]
  14. Li, C.Y.; Li, C.; Shi, X.H.; Zhang, S. River Ice Evolution of Yellow River in Inner Mongolia and Its Numerical Simulation; Science Press: Beijing, China, 2018; pp. 9–10. [Google Scholar]
  15. Xiao, Y.; Yang, S.F.; Shao, X.J. Trends of temporal variation of the flow-sediment discharges into the Three Gorges Reservoir. J. Sediment Res. 2017, 42, 22–27. [Google Scholar] [CrossRef]
  16. Qi, F.; Zhang, C.Q.; Liu, X.; Yu, H.P.; Zhao, C.P.; Wu, A.; Jia, M. Spatiotemporal Variation Trend Analysis of Rainfall Erosivity in Yimeng Mountain Region Based on M-K Test and Geostatistical Analysis. Bullentin Soil Water Conserv. 2021, 41, 146–153. [Google Scholar] [CrossRef]
  17. Wei, X.T.; Huang, S.Z.; Huang, Q.; Wang, H.; Li, P.; Liu, D. Quantitative Decomposition of Contributions of Climate Change and Human Activities to Seasonal Runoff Variability. J. Soil Water Conserv. 2019, 33, 182–189. [Google Scholar] [CrossRef]
  18. Xie, Z.B.; Mu, X.M.; Gao, P.; Qiu, D.X. Variation Characteristics of Runoff in the Upper Reaches of Beiluo River Based on R/S and Morlet Wavelet Analysis. J. Soil Water Conserv. 2022, 29, 139–144. [Google Scholar] [CrossRef]
  19. Zhang, X.; Tuo, W.; Song, C. Application of MEEMD-ARIMA combining model for annual runoff prediction in the Lower Yellow River. J. Water Clim. Change 2019, 11, 865–876. [Google Scholar] [CrossRef]
  20. Han, Y.G.; Han, L.; Huang, X.Y.; Gao, Y. Prediction of vapor pressure deficit in Northwest China based on exponential and ARIMA models. Arid Zone Res. 2021, 38, 303–313. [Google Scholar] [CrossRef]
  21. Zhu, Y.J. Application of Composite Single Sand Model for Sediment Monitoring Based on BP Neural Network in Xi-jiang River: A Case Study of Wuzhou Hydrometric Station. J. China Hydrol. 2024, 44, 36–40. [Google Scholar] [CrossRef]
  22. Chen, N.; Cao, Z.; Cui, H.; Xu, L.J.; Zhao, W.J. Evolution of Water and Sediment Situation in the Inner Mongolia Reach of the Yellow River in Recent 60 Years. Yellow River 2021, 43, 46–51. [Google Scholar] [CrossRef]
  23. Chen, H.T.; Mu, X.Y.; Luo, H.C.; Ji, H.L.; Liu, X.M. Analysis and Prediction of Runoff and Sediment Flux Characteristics at the Toudaoguai Hydrological Station of the Yellow River from 1958 to 2022. Res. Soil Water Conserv. 2024, 31, 10–21. [Google Scholar]
  24. Wang, H.X.; Yang, K.F.; Liu, J.H.; Hu, P.F. Evolution and influencing factors analysis of water and sediment evolution in the upper Yellow River in recent 60 years. China Rural Water Hydropower 2022, 03, 86–93. [Google Scholar]
  25. Zhao, Y.; Hu, C.H.; Zhang, X.M.; Wang, Y.S.; Cheng, C.; Yin, X.L.; Xie, M. Analysis on runoff and sediment regimes and its causes of the Yellow River in recent 70 years. Trans. Chin. Soc. Agric. Eng. (Trans. CSAE) 2018, 34, 112–119. [Google Scholar] [CrossRef]
  26. Chen, L.H. Analysis of Influencing Factors of Runoff and Sediment Variation and Riverbed Evolution in Ning-Meng Reach of Upper Yellow River. Master’s Thesis, Hebei University of Engineering, Handan, China, 2022. [Google Scholar]
  27. Zhai, Q.M.; Ning, Y.X.; Liu, S. Analysis of Sediment Change and Its Influence in the Middle and Lower Reaches of the Yellow River. Henan Sci. Technol. 2020, 16, 78–80. [Google Scholar]
  28. Deng, A.J.; Chen, J.G.; Hu, H.H.; Zhang, G.S. Analysis of reservoir siltation in China. J. Hydraul. Eng. 2022, 53, 325–332. [Google Scholar] [CrossRef]
  29. Zhu, J.S.; Li, J.R.; Huang, S.F.; Zang, W.B. Remote Sensing Survey and Analysis of the Spatial Changes in Vegetation Cover in the Last 30 Years in the Ten Major Gullies Basin. Soil Water Conserv. China 2015, 07, 68–70. [Google Scholar] [CrossRef]
  30. Wang, X.; Wu, J.X. Rating curves based on wavelet analyses: A case study at Datong station in the lower Changjiang River. J. Mar. Sci. 2009, 27, 16–22. [Google Scholar]
  31. Li, L.; Gong, H.L.; Guo, L.; Zhu, L.; Chen, B. Research advances on hydrologic time series analysis methods. J. Geo-Inf. Sci. 2024, 26, 927–945. [Google Scholar] [CrossRef]
  32. Du, Y.; Ma, R.Y. Application of Different Improved ARIMA Models in the Prediction of Hydrological Time Series. Water Power 2018, 44, 12–14+28. [Google Scholar]
  33. Liu, X.Y.; Dang, S.Z.; Zhang, H. Possible Incoming Sediment Amount of the Yellow River Under the Extreme Rainfall Scenarios in the Future. Yellow River 2016, 38, 13–17. [Google Scholar] [CrossRef]
  34. Yellow River Conservancy Commission of the Ministry of Water Resources. Comprehensive Plan for the Yellow River Basin (2012–2030); Yellow River Publishing House: Zhengzhou, China, 2013; pp. 11–12. [Google Scholar]
  35. Xu, W.L.; Zhao, G.J.; Mu, C.M.; Gao, P.; Sun, W.Y. Variation of runoff and sediment load in the upper reaches of the Yellow R-iver over the past 60 years. Sci. Soil Water Conserv. 2018, 16, 38–47. [Google Scholar] [CrossRef]
  36. Wang, S.; Yan, Y.; Yan, M.; Zhao, X. Contributions of Precipitation and Human Activities to the Runoff Change of the Huangfuchuan Drainage Basin: Application of Comparative Method of the Slope Changing Ratio of Cumulative Quantity. Acta Geogr. Sin. 2012, 67, 388–397. [Google Scholar]
  37. Wang, S.J.; Li, L.; Yan, M. The contributions of climate change and human activities to the runoff yield changes in the middle Yellow River Basin. Geogr. Res. 2013, 32, 395–402. [Google Scholar]
Figure 1. Geographic location map of the study area.
Hydrology 12 00174 g001
Figure 2. Change process of annual runoff and sediment load. (a) Runoff; (b) sediment load.
Hydrology 12 00174 g002
Figure 3. M-K mutation test of runoff and sediment load at Toudaoguai station. (a) Runoff; (b) sediment load.
Hydrology 12 00174 g003
Figure 4. Cumulative anomaly values of runoff and sediment load at Toudaoguai station.
Hydrology 12 00174 g004
Figure 5. Wavelet contour map of the real part and variance diagram of annual runoff. (a) Contour map; (b) variance diagram.
Hydrology 12 00174 g005
Figure 6. Wavelet contour map of the real part and variance diagram of annual sediment load. (a) Contour map; (b) variance diagram.
Hydrology 12 00174 g006
Figure 7. Runoff first-order difference sequence correlation diagram. (a) ACF; (b) partial ACF.
Hydrology 12 00174 g007
Figure 8. Comparison of simulated runoff by ARIMA model with measured values.
Hydrology 12 00174 g008
Figure 9. Sediment load first-order difference sequence correlation diagram. (a) ACF; (b) partial ACF.
Hydrology 12 00174 g009
Figure 10. Comparison of simulated sediment load by ARIMA model with measured values.
Hydrology 12 00174 g010
Figure 11. Comparison of residual values of simulated runoff by BP model with actual residuals.
Hydrology 12 00174 g011
Figure 12. Comparison of residual values of simulated sediment load by BP model with actual residuals.
Hydrology 12 00174 g012
Figure 13. Comparison of simulated runoff by ARIMA-BP model with measured values.
Hydrology 12 00174 g013
Figure 14. Comparison of simulated sediment load by ARIMA-BP model with measured values.
Hydrology 12 00174 g014
Figure 15. The predicted values of runoff and sediment load of each model are compared with the measured values. (a) Runoff; (b) sediment load.
Hydrology 12 00174 g015
Figure 16. Predicted values of annual runoff and sediment load from 2020 to 2029. (a) Runoff; (b) sediment load.
Hydrology 12 00174 g016
Figure 17. Variation in cumulative runoff, cumulative precipitation, and cumulative temperature with years.
Hydrology 12 00174 g017
Figure 18. Variation in cumulative sediment load, cumulative precipitation, and cumulative temperature with years.
Hydrology 12 00174 g018
Table 1. Results of analyses of inter-annual trends in runoff and sediment load.
CvStatistical
Measure Z
Variation TrendSignificance
Runoff0.35−3.22Decrease0.01
sediment load0.80−4.73Decrease0.01
Table 2. Relative error table of annual runoff prediction values for the ARIMA model.
YearMeasuredPredictedAbsolute ErrorRelative Error
Billion m3Billion m3Billion m3%
2013209.714197.145212.56885.99%
2014175.806174.64401.16200.66%
2015142.058142.91230.85430.60%
2016114.876129.972515.096513.14%
2017129.343118.454810.88828.42%
2018315.807201.3660114.441036.24%
2019337.971266.646971.323121.10%
Mean Value203.653175.877332.333412.31%
Table 3. Relative error table of the predicted annual sediment load of the ARIMA model.
YearMeasured Predicted Absolute ErrorRelative Error
Billion tBillion tBillion t%
20130.6040.6022 0.0022 0.37%
20140.3990.4609 0.0615 15.40%
20150.1990.2942 0.0945 47.31%
20160.1620.2738 0.1109 68.10%
20170.1880.2116 0.0236 12.52%
20180.9960.3601 0.6365 63.87%
20191.4431.0214 0.4216 29.22%
Mean Value0.5710.4610.19233.83%
Table 4. BP residual network runoff relative error table.
YearActual ResidualsPredicted Residuals Absolute ErrorRelative Error
Billion m3Billion m3Billion m3%
201319.41612.5686.84854.48%
20142.93771.1621.775152.82%
20155.687−0.8546.541765.80%
2016−11.395−15.0963.70124.52%
201717.88510.8886.99764.26%
201851.118114.44163.32255.33%
201965.68871.3235.6347.90%
Mean Value21.61927.77613.545160.73
Table 5. BP residual network sediment load relative error table.
YearActual ResidualsPredicted Residuals Absolute ErrorRelative Error
Billion tBillion tBillion t%
20130.0022 0.0004 0.0018 80.96%
2014−0.0615 −0.0907 0.0292 47.41%
2015−0.0945 −0.0848 0.0097 10.25%
2016−0.1109 −0.0061 0.1048 94.47%
2017−0.0236 −0.0365 0.0129 54.95%
20180.6365 0.2199 0.4166 65.45%
20190.4216 0.3338 0.0878 20.83%
Mean Value0.10990.0480.094653.47%
Table 6. ARIMA-BP model runoff relative error table.
YearMeasured Simulated Absolute ErrorRelative Error
Billion m3Billion m3Billion m3%
2013209.714216.5620 6.8480 3.27%
2014175.806177.5817 1.7757 1.01%
2015142.058148.5999 6.5419 4.61%
2016114.876118.5771 3.7011 3.22%
2017129.343136.3402 6.9972 5.41%
2018315.807252.4849 63.3221 20.05%
2019337.97332.3355 5.6345 1.67%
Mean Value203.653197.49713.5455.61%
Table 7. Relative error table of sediment load of ARIMA-BP model.
YearMeasured Simulated Absolute ErrorRelative Error
Billion tBillion tBillion t%
20130.60440.6049 0.0004 0.07%
20140.39930.3702 0.0292 7.30%
20150.19970.2094 0.0097 4.85%
20160.16290.2677 0.1048 64.33%
20170.18800.1751 0.0129 6.88%
20180.99660.5801 0.4166 41.80%
20191.44301.3552 0.0878 6.09%
Mean Value0.5710.5080.094418.76%
Table 8. Comparison of evaluation indexes of different models on runoff test set.
ModelRMSEMAER2
ARIMA51.6724 32.3334 0.6157
BP56.4424 48.1080 0.5414
ARIMA-BP24.4860 13.5458 0.9137
Table 9. Comparison of evaluation indexes of different models on sediment load test set.
ModelRMSEMAER2
ARIMA0.2948 0.1927 0.5725
BP0.2518 0.2222 0.6881
ARIMA-BP0.1662 0.09450.8642
Disclaimer/Publisher’s Note: The statements, opinions and data contained in all publications are solely those of the individual author(s) and contributor(s) and not of MDPI and/or the editor(s). MDPI and/or the editor(s) disclaim responsibility for any injury to people or property resulting from any ideas, methods, instructions or products referred to in the content.

