Article

Reproducibility Limits of the Frequency Equation for Estimating Long-Linear Internal Wave Periods in Lake Biwa

1
Graduate School of Engineering, Kobe University, Kobe City 658-8501, Japan
2
Lake Biwa Environmental Research Institute, Otsu City 520-0022, Japan
3
Port and Airport Research Institute, Yokosuka 239-0826, Japan
*
Author to whom correspondence should be addressed.
Hydrology 2025, 12(7), 190; https://doi.org/10.3390/hydrology12070190
Submission received: 11 June 2025 / Revised: 8 July 2025 / Accepted: 8 July 2025 / Published: 11 July 2025
(This article belongs to the Section Hydrological and Hydrodynamic Processes and Modelling)

Abstract

In a large deep lake, the generation of internal Kelvin waves and internal Poincaré waves due to wind stress on the lake surface is a significant phenomenon. These internal waves play a crucial role in material transport within the lake and have profound effects on its ecosystem and environment. Our study, which investigated the modes of internal waves in Lake Biwa using the vertical temperature distribution from field observations, has yielded important findings. We have demonstrated the applicability of the frequency equation solutions, considering the Coriolis force. The period of the internal Poincaré waves, as observed in the field, was found to match the solutions of the frequency equation. For example, observational data collected in late October revealed excellent agreement with the theoretical solutions derived from the frequency equation, showing periods of 14.7 h, 11.8 h, 8.2 h, and 6.3 h compared to the theoretical values of 14.4 h, 11.7 h, 8.5 h, and 6.1 h, respectively. However, the periods of the internal Kelvin waves in the field observation results were longer than those of the theoretical solutions. The Modified Mathew function uses a series expansion around q i = 0 , making it difficult to estimate the periods of internal Kelvin waves under conditions where q i > 1.0 . Furthermore, in lakes with an elliptical shape, such as Lake Biwa, the elliptical cylinder showed better reproducibility than the circular cylinder. These findings have significant implications for the rapid estimation of internal wave periods using the frequency equation.

1. Introduction

Enclosed water bodies like lakes are highly susceptible to the effects of global warming. The increase in surface water temperature leads to the formation of strong stratification, which quickly reduces the dissolved oxygen concentrations in the hypolimnion. It can cause significant changes in water qualities and ecosystems, and it has been shown that these effects are evident not only in shallow lakes but also in deep lakes [1,2,3]. Recent observations across lake systems in Canada have revealed a declining trend in water levels in many lakes, raising growing concerns about the long-term sustainability of water resources and the resilience of associated ecosystems [4]. Long-term monitoring studies conducted in Dongting Lake, China, have also demonstrated that anthropogenic activities and climate change pose significant threats to lake biodiversity through physical changes such as alterations in water temperature and nutrient cycling [5]. Internal waves play a crucial role in the transport of materials; energy transfer; and the mixing of the epilimnion, metalimnion, and hypolimnion in lakes [6,7,8,9]. For example, internal waves are known to play an important role in the resuspension and transport of particulate matter [10]. High-resolution observations in Lake Erken have shown that suspended particulate matter is resuspended by internal waves [7]. On the other hand, it has been reported that hypoxic water masses formed in the hypolimnion can upwell during strong winds, causing the release of phosphorus accumulated in the lake bottom, leading to algal blooms and affecting the ecosystem [11,12]. In lakes where the scale is larger than the Rossby radius of deformation, the currents in the epilimnion are affected by the Coriolis force, and internal Kelvin waves and internal Poincaré waves could be generated. Therefore, further analysis of the relationship between internal waves and the Coriolis force is required [13,14,15,16]. In large lakes such as Lake Erie, studies have shown that the wind energy input into the lake is substantial, with a portion being transmitted into the lake’s interior and driving mixing through internal waves [17,18]. Additionally, internal Poincaré waves have been shown to play a significant role in vertical mixing within the lake, promoting the vertical transport of dissolved oxygen. Therefore, collaboration in elucidating the behavior of internal Kelvin waves and internal Poincaré waves occurring in deep lakes is crucial.
In Lake Biwa, a representative large and deep lake in Japan, it has been reported that global warming affects the lake overturn in winter [19]. Rising water temperatures may prevent vertical mixing from reaching the lake bottom during winter, leading to incomplete resolution of hypoxic water masses [20]. If vertical mixing does not reach the lake bottom during winter, hypoxic water masses will remain over the lake bottom and transition into stratification in the following spring and summer. Consequently, it has been pointed out that the DO (Dissolved Oxygen) in the hypolimnion may decrease further, raising concerns about severe damage to the ecosystem [21]. On the other hand, in Lake Biwa, the development of the bottom boundary layer in the hypolimnion may lead to the formation of hypoxic water masses. Within this layer, oxygen consumption is driven by the degradation of organic matter settling from the upper layers, the decomposition of lakebed organic matter, the oxidation of reducing substances, and the respiration of benthic organisms. Maruya et al. [22] pointed out that internal waves and internal wave modes affect the dynamics of the hypolimnion under stratified conditions in the lake. Therefore, understanding internal waves under different stratification conditions that change seasonally is an urgent task for improving the lake bottom ecosystem, which necessitates a more detailed investigation to prevent potential damage.
It has been demonstrated that the frequency equation can be theoretically applied by simplifying the topography [23,24]. For brevity, the solutions derived from the frequency equation will be referred to as theoretical solutions. These theoretical solutions are quicker to obtain than numerical simulations and require less data, making it easier to estimate the period of internal waves. However, the lack of studies that have compared field observations with theoretical solutions and the absence of research that has examined the validity of theoretical solutions by solving the frequency equation and comparing them with observation results is a significant gap in the field. A considerable number of studies have been conducted on numerical simulations of Lake Biwa [25,26]. Shimizu et al. [25] approximated Lake Biwa as an ellipse and applied the frequency equation for an elliptic cylinder, but their analysis was limited to the first mode and required assuming a range of elliptical geometries. As a result, their approach was not suitable for investigating seasonal variations in stratification. Yoneda et al. [26] investigated the internal wave periods in October and December of 2018. Their comparison with the solutions using the frequency equation revealed a significant discrepancy—the frequency equation consistently underestimated the period of the internal Kelvin wave. However, the root cause of these discrepancies remains elusive, highlighting the limitations of the current research. Furthermore, the study only covered October and December, leaving the internal wave periods unexplored for the rest of the year. This underscores the need for further investigation into the applicability of the frequency equation and the analysis of internal wave periods across all seasons. Furthermore, there has been insufficient consideration of seasonal changes and examination of the behavior of internal waves under different stratification conditions. In this study, we aim to identify the root cause of the substantial discrepancy between observational results and theoretical solutions in the rapid estimation of internal wave periods using a frequency equation that accounts for seasonal stratification, and to clearly delineate the limitations of its applicability.
In this study, high-resolution vertical profiles of water temperature and dissolved oxygen (DO), along with multi-depth time series data of water temperature, were obtained through field observations in the northern basin of Lake Biwa. Based on these observational data, the surface mixed-layer thickness was estimated while accounting for seasonal variations in the vertical temperature distribution. The lake’s topography was then represented by two elliptical cylinders characteristic of Lake Biwa, and theoretical solutions including higher modes of internal waves were derived by applying the frequency equation for a two-layer fluid. These theoretical solutions were compared with the dominant internal wave modes identified from observations. Furthermore, the limitations of applying the frequency equation to internal Kelvin waves were examined, considering the characteristics of the Modified Mathieu function, and the potential applicability of the frequency equation to lakes other than Lake Biwa was also explored. Through these analyses, this study aims to clarify the dominant modes of internal waves in Lake Biwa and to comprehensively understand both their reproducibility and the limitations of period estimation.

2. Methods

2.1. Field Observations

Lake Biwa, Japan’s largest freshwater lake, with a surface area of 670 km2, is located upstream in the Yodo River system and is divided into northern and southern basins by the Biwako-Ohashi Bridge (Figure 1). The maximum depth of the North Basin is 104 m, with steep terrain on the west side, whereas the South Basin has a relatively flat bottom with a mean depth of 4 m. In the North Basin, distinct stratification forms from spring to autumn, leading to the occurrence of hypoxic water masses in the hypolimnion. In this study, aiming to investigate various modes of internal waves generated by stratification, we conducted two observations to obtain high-resolution measurements of the vertical distribution and time series of the vertical temperature distribution at a depth of approximately 90 m in the North Basin. First, we used a water quality profiler (AAQ, JFE Advantech Co., Ltd., Nishinomiya, Japan) to measure the high-resolution water temperature and DO in vertical distributions at approximately monthly intervals from September 2018 to June 2019. The DO measuring instrument in the water quality profiler is a fast-response fluorescence type, allowing measurements at 0.1 s intervals. Therefore, we set a descent speed of 0.5 m/s, measuring the water temperature and DO at approximately 0.05 m intervals from the surface to the lake bottom. For the time series of the water temperature, we used underwater temperature data loggers (Tidbit Temp, Onset Co., Bourne, MA, USA) to measure at 10 min intervals from 12:00 on 21 September 2018 to 01:30 on 20 July 2019. The vertical intervals for the temperature sensors were set at 17 depths (0 m, 5 m, 10 m, 15 m, 20 m, 25 m, 30 m, 46 m, 62 m, 77 m, 79 m, 81 m, 83 m, 85 m, 87 m, 89 m, 91 m).

2.2. Estimation of Epilimnion Thickness

Using vertical temperature data, we estimated the epilimnion thickness. The depth at which the water temperature decreases by 3 °C from the surface temperature is considered the epilimnion thickness [27,28]. Shimizu et al. [25] conducted an analysis using an elliptical cylinder model that assumes a two-layer stratification in Lake Biwa, while Saggio and Imberger [29] reported that the temperature in the surface mixed layer decreased by approximately 2 °C relative to the surface water temperature on 10 September. To confirm the validity of the water temperature difference method, we conducted a comprehensive comparison with other methods, such as the methods based on the Brunt–Väisälä frequency, the maximum isothermal amplitude, and so on. The water temperature difference method not only agreed with the other methods but also proved to be stable in computing the upper-layer thickness compared to the other methods, instilling confidence in the robustness of our approach. However, in winter, the temperature difference between the epilimnion and the hypolimnion is less than 3 °C, making it impossible to estimate using the previous method. Therefore, we estimated the epilimnion thickness in winter by extracting the inflection points of water temperature and DO distributions. As a result, we found that the average temperature difference between the epilimnion and the hypolimnion in this study was 0.24 °C (standard deviation: 0.20 °C). Therefore, to determine the temperature difference for estimating the epilimnion thickness, we gradually reduced the temperature difference from 3.0 °C to 0.24 °C from 1 December to 26 January (8 weeks). From 26 January to the end of February, the temperature difference was kept constant at 0.24 °C. Then, from 1 March to 26 April (8 weeks), we gradually increased the temperature difference from 0.24 °C to 3.0 °C to estimate the epilimnion thickness.

2.3. Frequency Equation in a Two-Layer Fluid

Given that Lake Biwa has an elliptical shape, it is appropriate to model it as an elliptical cylinder when analyzing the behavior of internal waves. Shimizu et al. [25] discussed the dominant modes of internal waves by considering Lake Biwa as an ellipse and using the frequency equation for an elliptical cylinder [23,24,30]. Shimizu et al. [25] estimated the period of internal waves by considering only the first mode and assuming various elliptical cylinders. However, this method requires selecting an elliptical cylinder that matches the stratification conditions, making it unsuitable for examining seasonal changes in stratification strength. Therefore, this study aims to solve these issues by considering only the elliptical cylinder representing the topography of Lake Biwa and analyzing higher-mode internal waves. First, we determined an elliptical cylinder (Ellipse 1) representing the entire Lake Biwa (Figure 1, Table 1). Given the significant curvature of Lake Biwa, internal waves that progress at the observation site may be trapped in the northern region of Ellipse 1. Therefore, in this study, we defined the northern part of Lake Biwa as an elliptical cylinder (Ellipse 2) and conducted a theoretical analysis (Figure 1, Table 1). Ellipse 2 was primarily defined to account for the pronounced curvature of Lake Biwa. Since internal waves propagating at the observation site may be confined within the northern region of Ellipse 1, which represents the overall lake geometry, this curvature was considered by independently defining Ellipse 2 for the northern basin of Lake Biwa and conducting theoretical analyses accordingly. It should be noted that Yoneda et al. [26] assumed four elliptical cylinders for the frequency equation analysis, showing that two elliptical cylinders are enough to estimate internal wave periods. Also, the definition of the elliptical cylinders by Yoneda et al. [26] was found to need improvement. Therefore, the size and depth of the elliptical cylinders were different from those of Yoneda et al. [26].
In the analysis, we targeted internal waves across all frequency bands, including higher modes, to analyze various internal waves generated by stratification conditions. The frequency equation for a two-layer stratification in an elliptical cylinder is stated as follows [23,31].
q i = 1 ψ 2 / φ 2 4 [ ( σ i 2 1 S B 2 ) ]
σ i 2 C e n ξ 0 , q i S e n ξ 0 , q i C e n ξ 0 , q i S e n ξ 0 , q i = 0
where C e n and S e n are the modified elliptical sine and elliptical cosine Mathieu functions, respectively. For internal Kelvin waves ( q i < 0 ), the Modified Mathieu function follows the approximation by Goldstein [31]. ξ 0 = atanh ψ / φ is the boundary ellipse, φ is the semi-major axis, ψ is the semi-minor axis, ω i is the internal wave frequency, σ i = ω i / f is the dimensionless frequency, f is the internal frequency (Coriolis parameter), and S B is the Burger number. n is the azimuthal mode, and when n = 1, it represents a mode where a sine wave travels around the boundary ellipse. i represents the individual vertical modes. These represent a set of orthogonal solutions that describe the vertical structure of internal waves in a stratified water column, based on the lake’s density profile and boundary conditions. Additionally, the prime denotes differentiation with respect to ξ .
The Burger number S B is defined as follows [32].
S B = g D B L f = c I φ f
c I = ε g h 1 h 2 h 1 + h 2
H = h 1 + h 2
where c I is the nonrotating phase speed for particular vertical modes, D B is the equivalent depth, and L is the horizontal scale. The variables h 1 and h 2 denote the thicknesses of the upper and lower layers, respectively. The parameter ε represents the ratio of the density difference between these two layers, and g denotes the gravity acceleration. Under the stratification conditions at the end of October, the phase speed c1 of the first vertical mode was 0.408 m/s. In contrast, observations by Saggio and Imberger [33] during a 20-day period from 23 August to 13 September 1993, under stronger stratification than that of late October 2018, reported a c1 value of 0.45 m/s.
The area of each elliptical cylinder was determined using the value at a depth of 10 m, where the density interface is located. Additionally, since the actual topography is conical, the representative depth = H for the hypolimnion was stated using the following equation:
H = 1 N k = 1 N h k 2
where h k represents the depth of each mesh in the topographic data, and N is the total number of meshes. Since the wave speed in long waves is proportional to the square root of the depth, Equation (6) is used as the representative hypolimnion thickness.
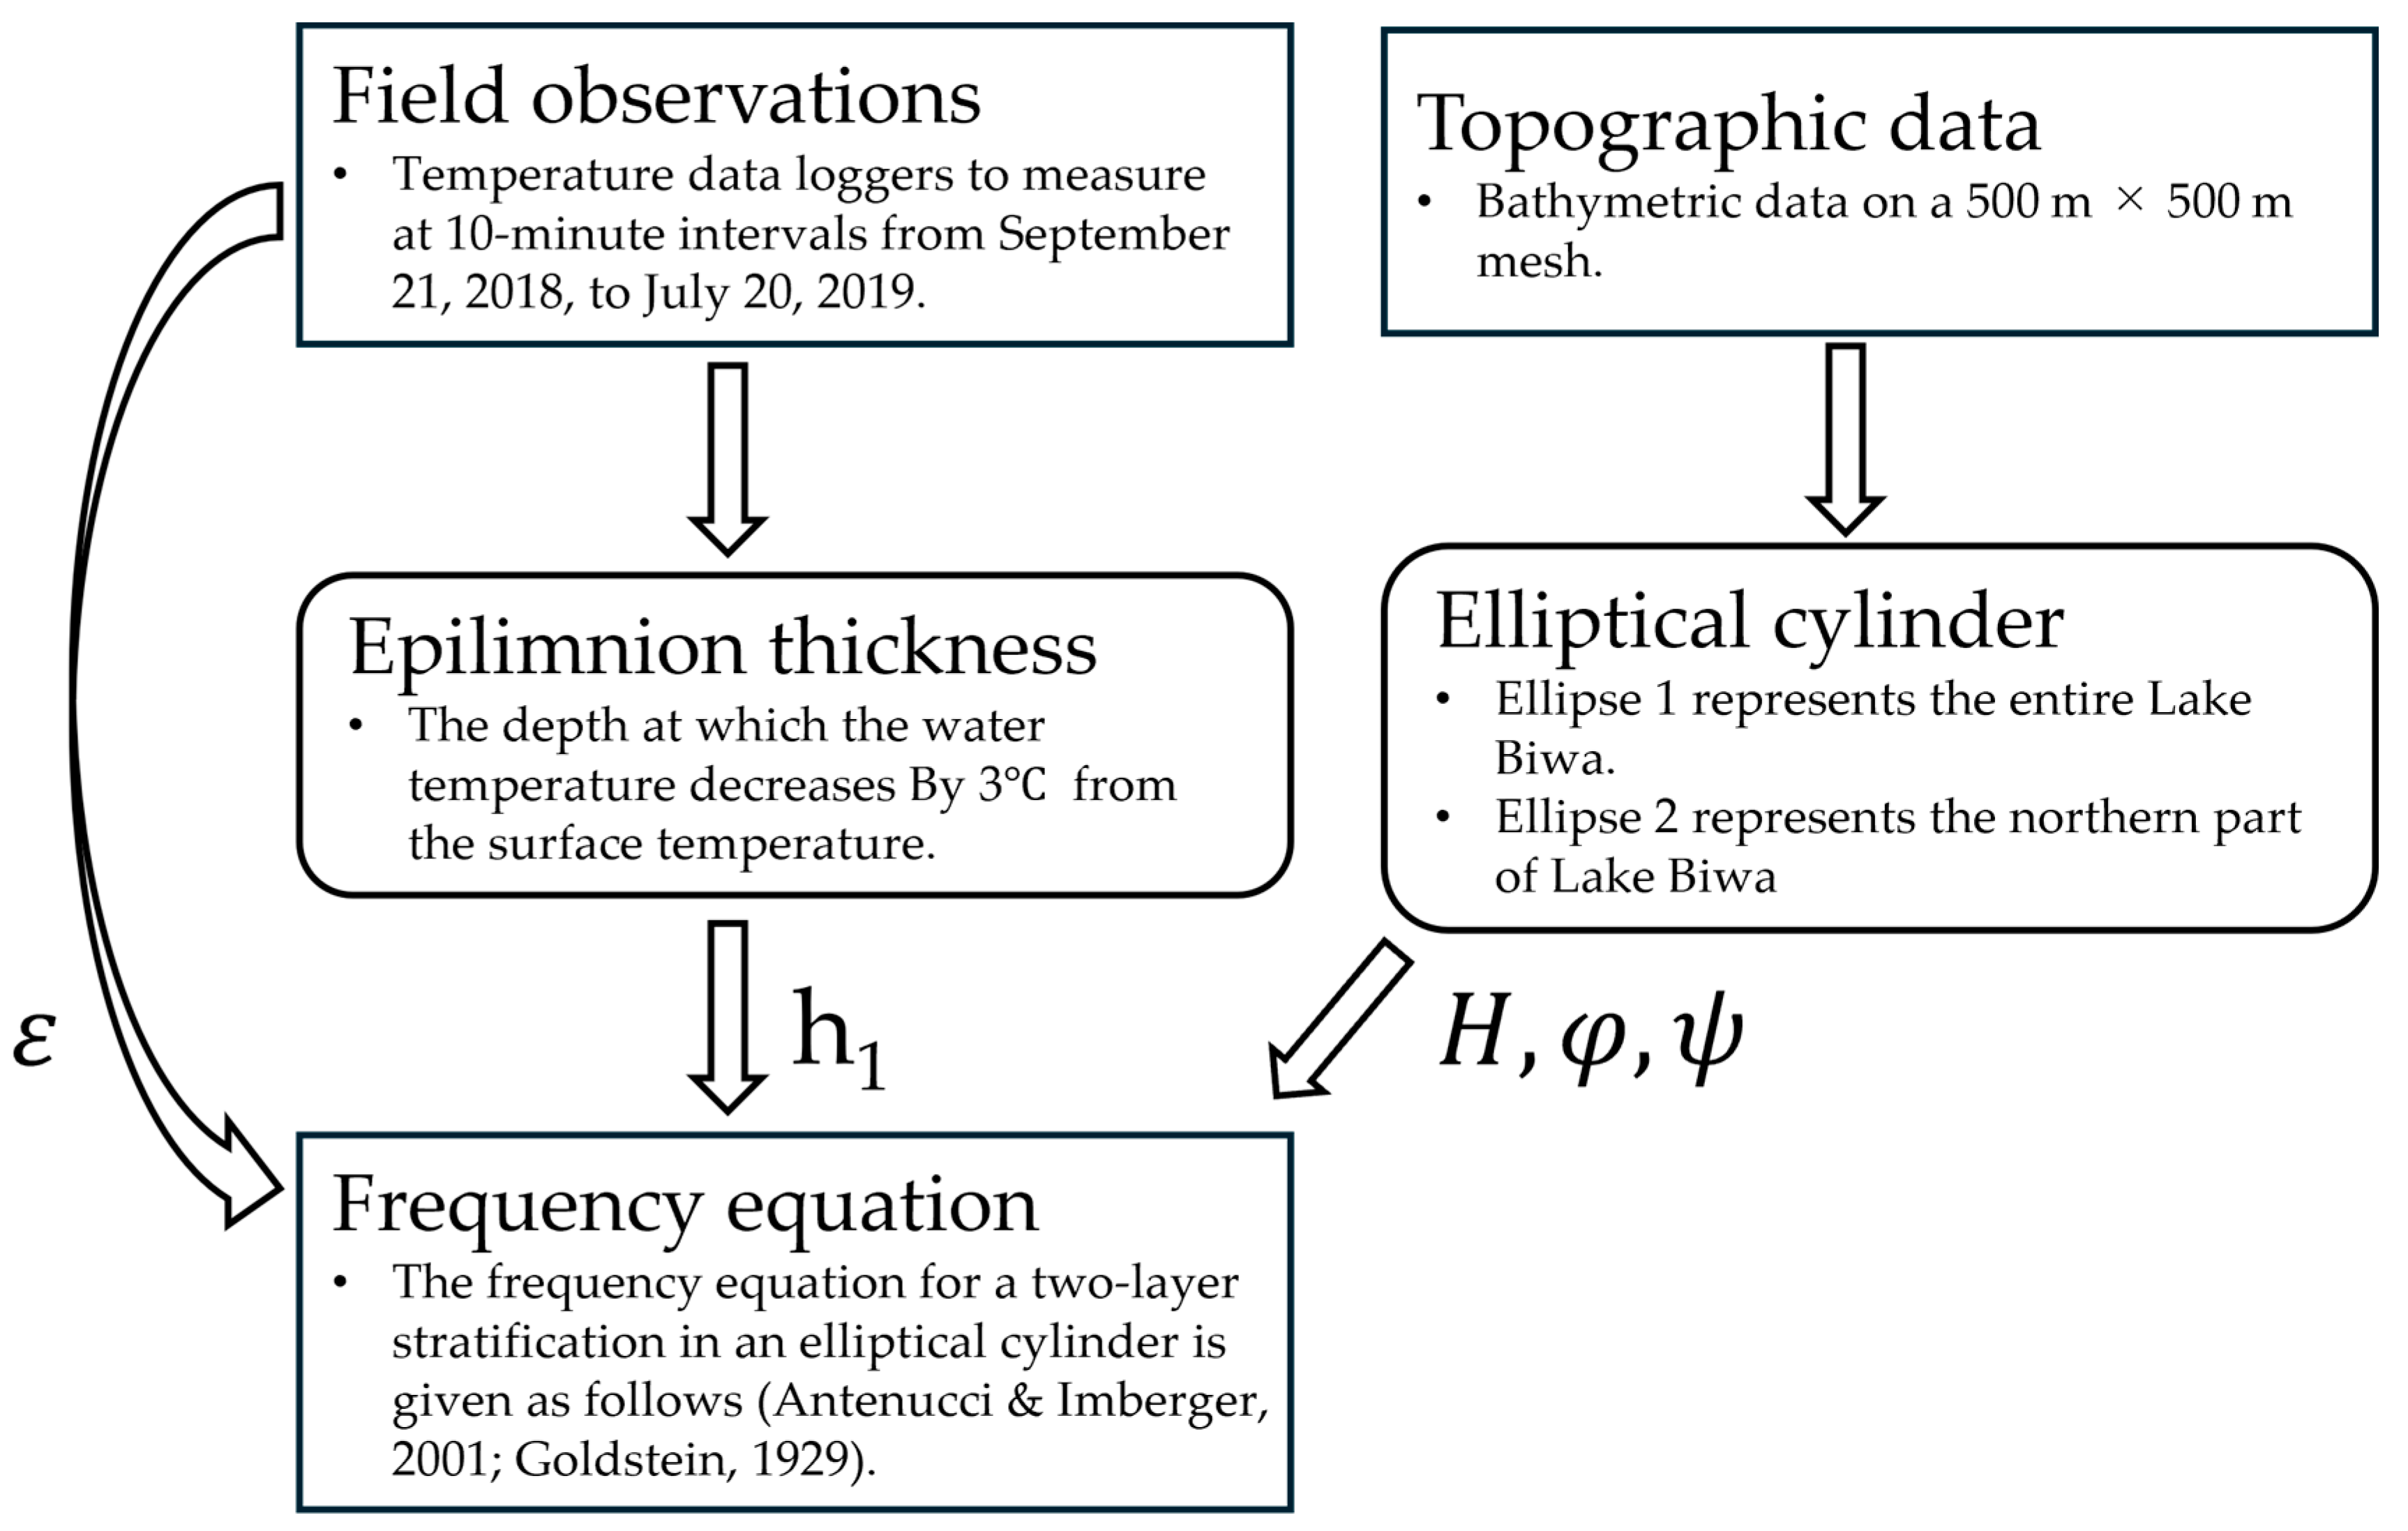
The workflow diagram summarizes the methodology and illustrates the variables required for the calculation of the frequency equation (Figure 2).

3. Results

3.1. Annual Variations in Stratification in Lake Biwa

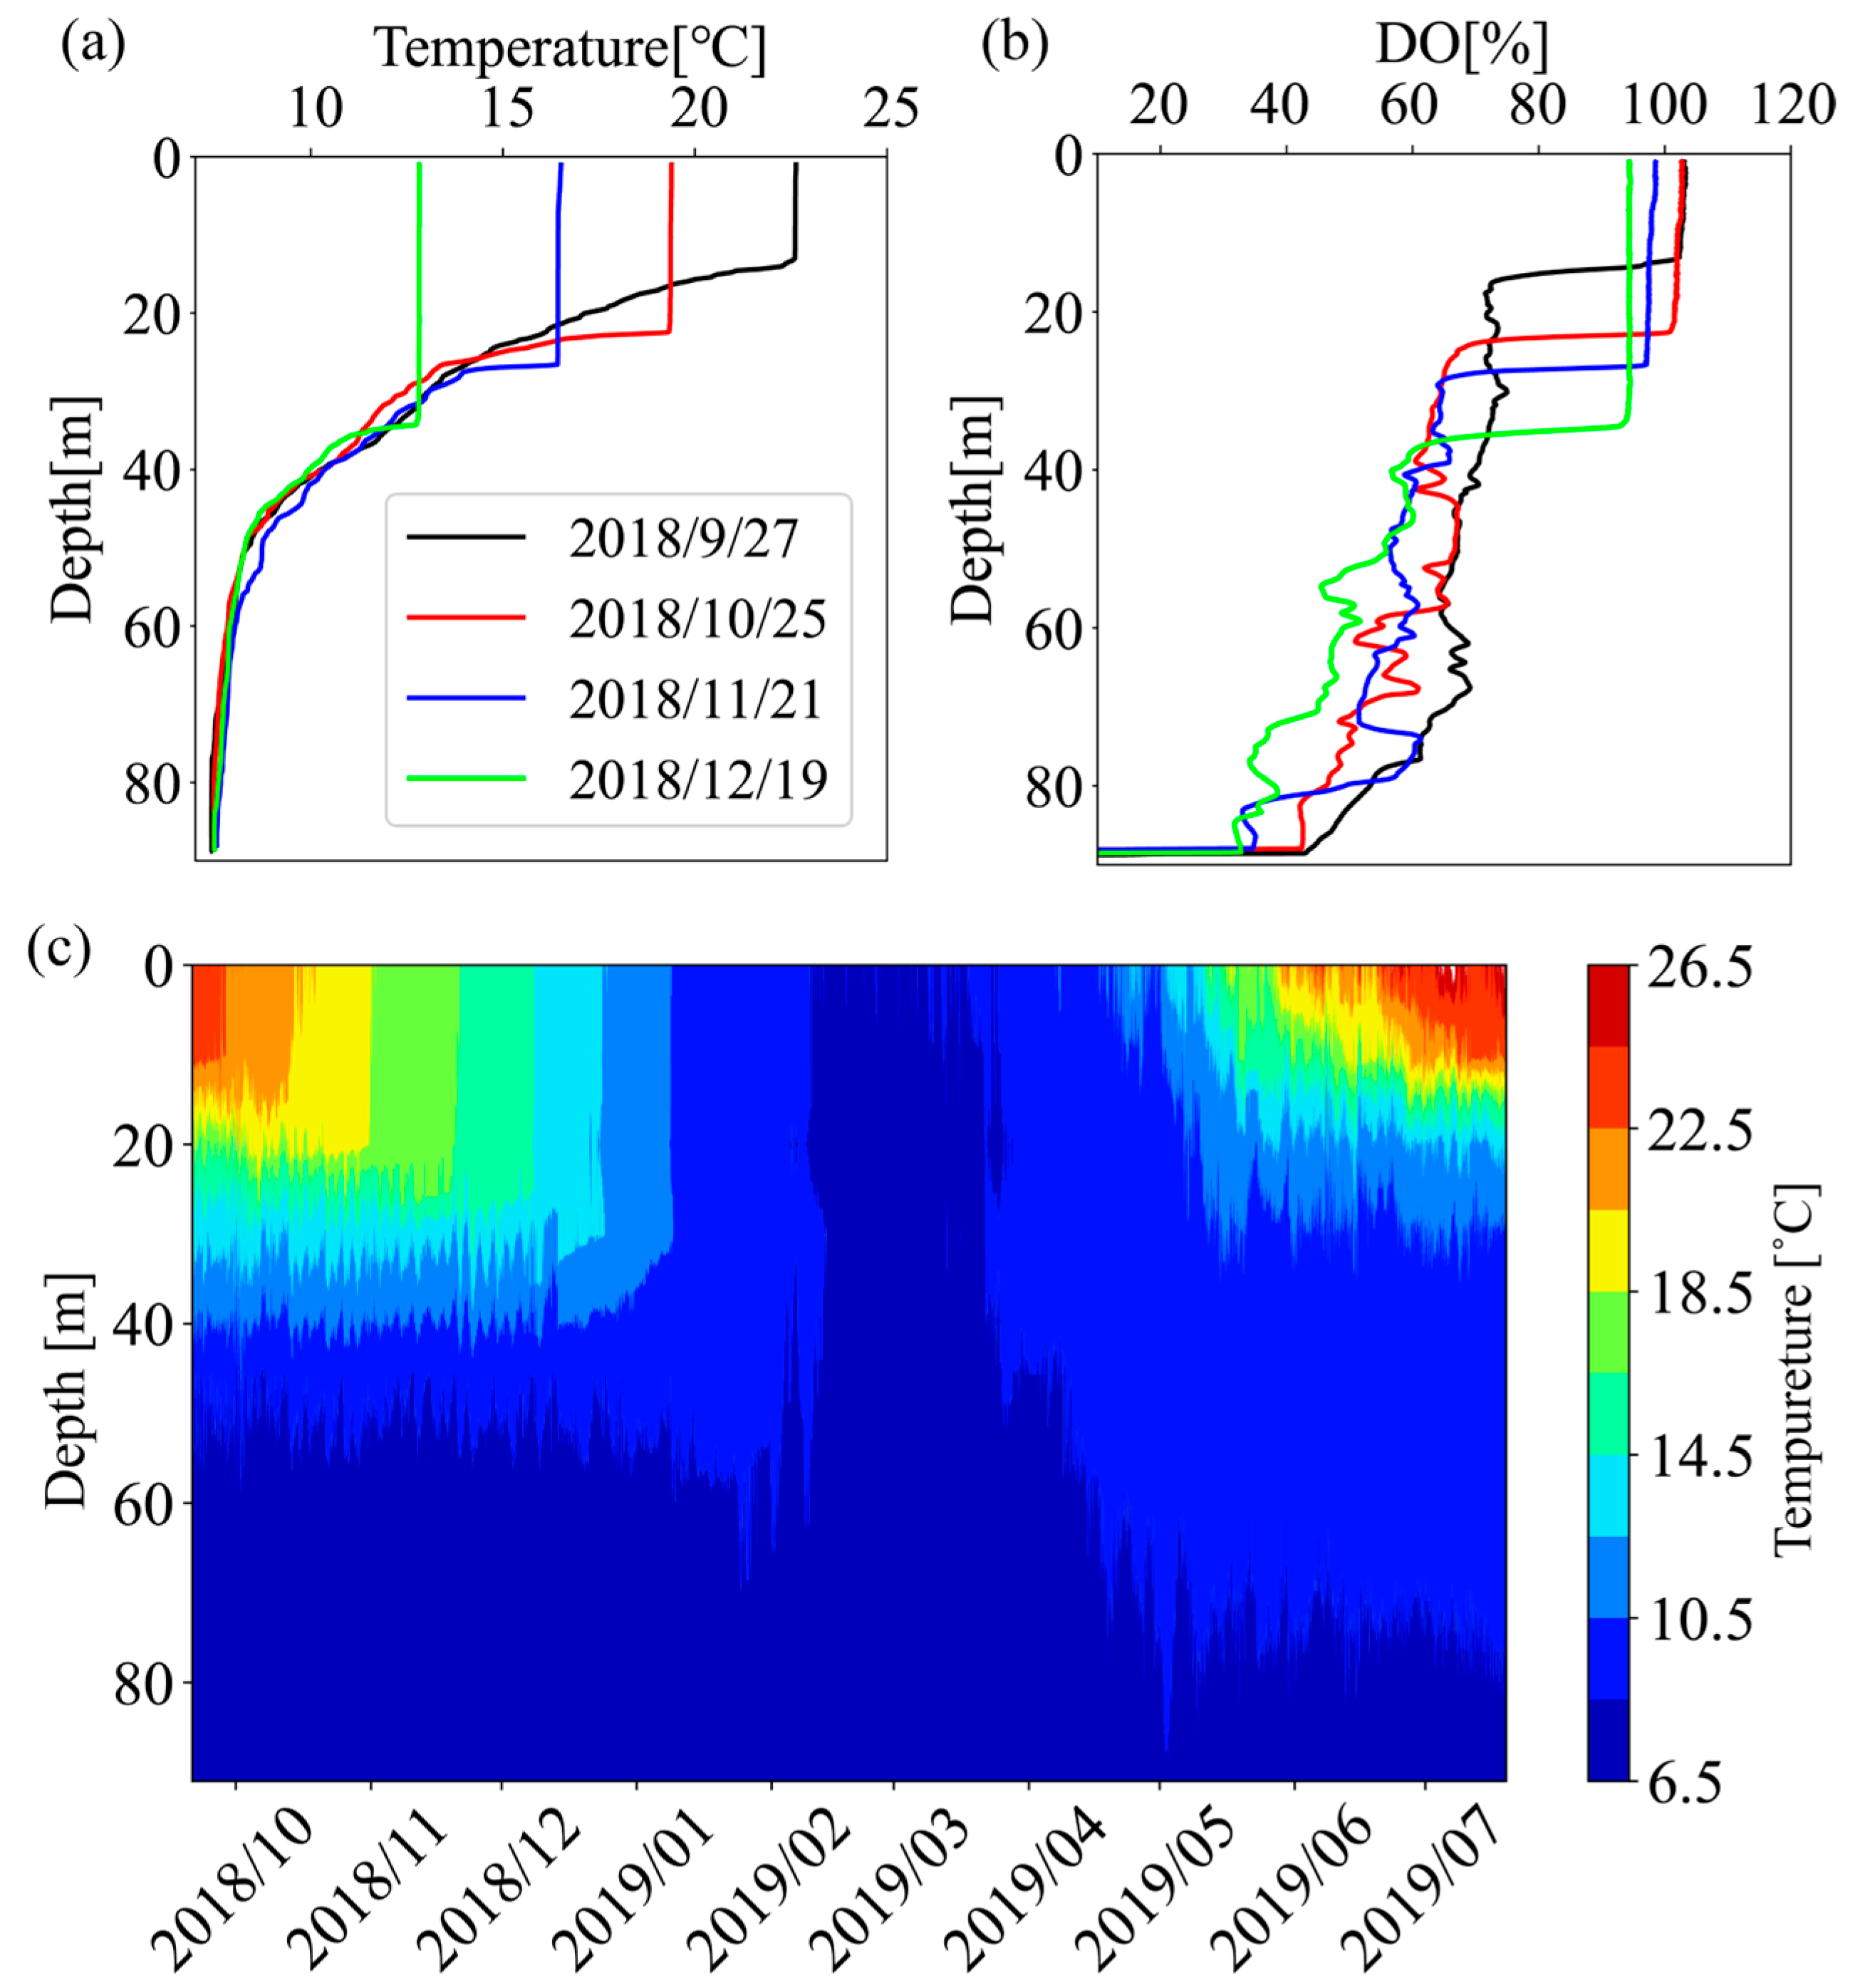
The vertical distribution of the water temperature and DO at the observation site indicated that stratification was stable from late September to December 2018 (Figure 3). The vertical profiles in 2019 and 2018 have been shown in Yoneda et al. [26]. The clear formation of stratification led to a decrease in DO concentrations, such as 2 mg/L, in the lower layers. Furthermore, the time series of the vertical temperature distribution using the thermistor chain provided confident confirmation of the formation and disappearance of a distinct thermocline from January 2019 to March 2019.
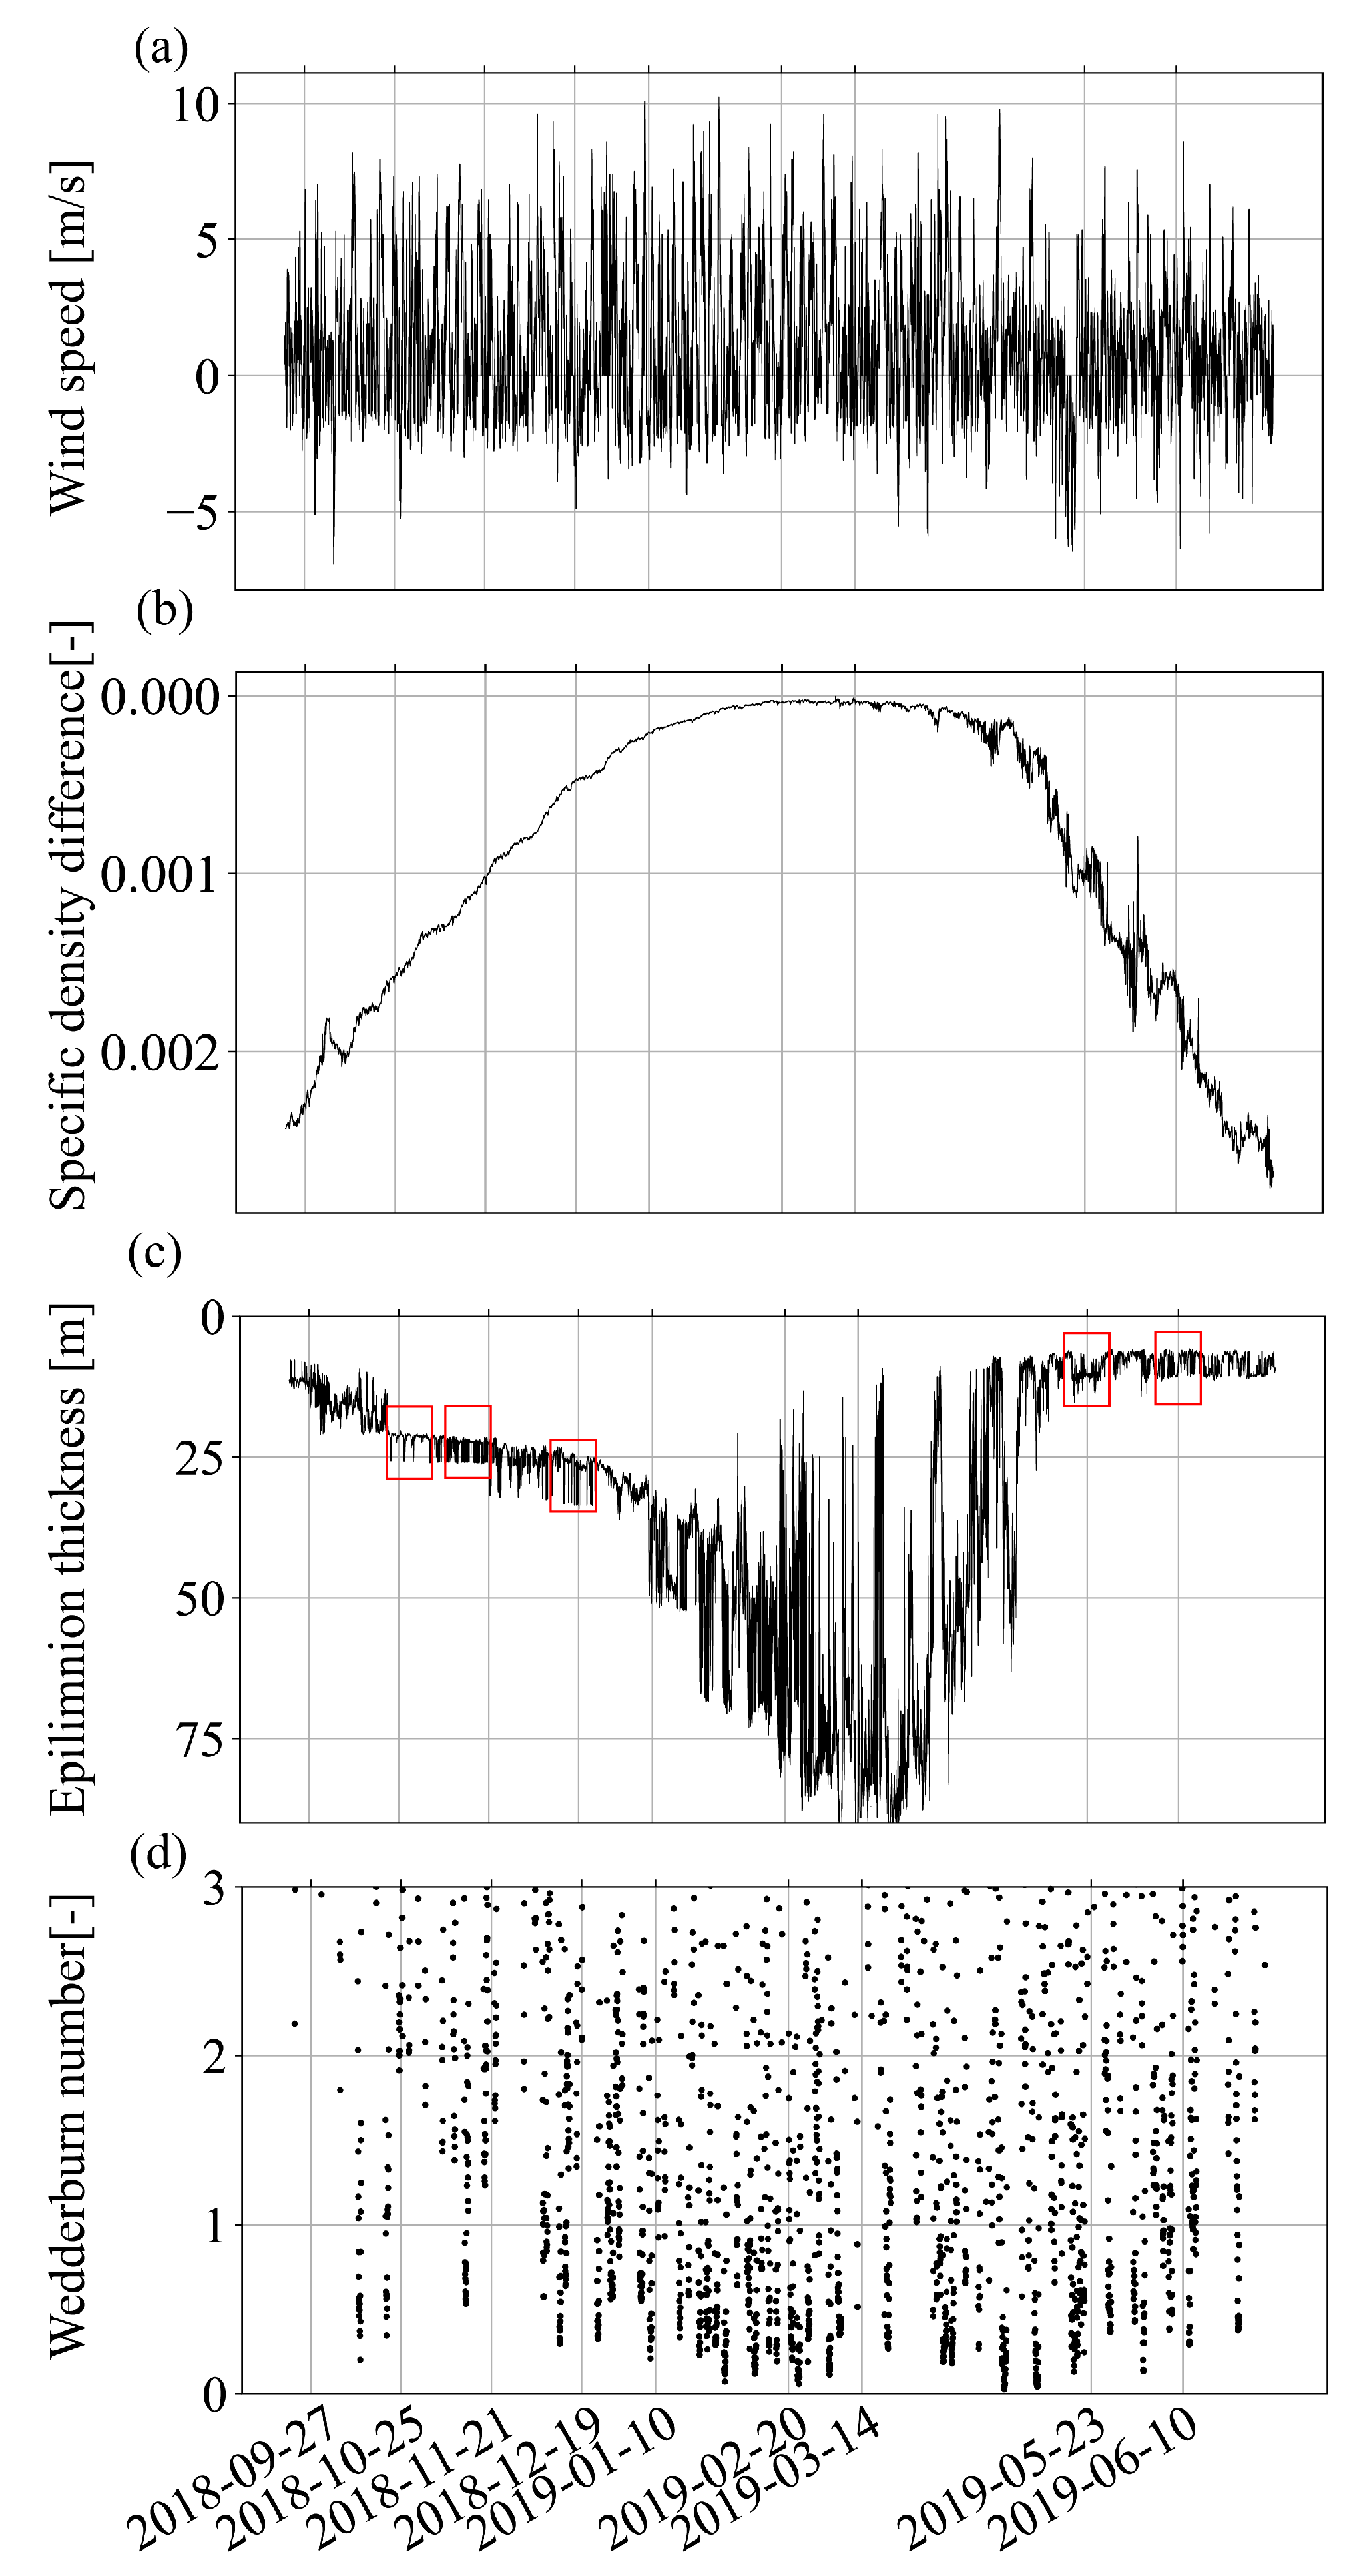
Regarding the wind speed along the major axis, winds reaching up to 10 m/s were observed in winter (Figure 4a). In contrast, the maximum wind speed along the major axis in summer was lower, reaching about 8 m/s (Figure 4a). The specific density difference ratio between the epilimnion and hypolimnion was approximately 0.0025 at its maximum in summer and zero in winter due to the lake overturn (Figure 4b). As the specific density difference increased, the epilimnion thickness decreased, with a thickness of 10 m in summer (Figure 4c). From November 2018 to January 2019, the epilimnion thickness increased, and the lake overturn occurred in winter. Upwelling, which promotes vertical mixing, is considered a factor in increasing the epilimnion thickness [33,34]. Therefore, we calculated the Wedderburn number using the wind speed along the major axis, the density difference ratio, and the surface-layer thickness (Figure 4d).
W N = Δ ρ 12 g h 1 ρ U * 2 h 1 L  
where ρ 1   represents the density of the epilimnion, ρ 2 represents the density of the hypolimnion, U * is the friction velocity, and L is the length along the major axis.
U * 2 = ρ a C d U U d ρ 1
where ρ a represents the density of air, C d is the drag coefficient, U is the absolute wind speed, and U d is the wind speed along the major axis. The drag coefficient was determined with Kondo [35]. It is known that upwelling occurs when the Wedderburn number is less than 0.7 to 1.0 [33]. In Lake Biwa, from January to April 2019, there were many instances where the Wedderburn number was less than 0.7, indicating a high likelihood of upwelling. The epilimnion thickness may have rapidly increased due to upwelling, making it unsuitable for obtaining the dominant period of internal waves from the spectrum of the time series of the epilimnion thickness. Therefore, in this study, we excluded the period from January to April 2019, when the epilimnion thickness rapidly increased due to upwelling, and a distinct epilimnion was not formed (Table 2).

3.2. Linear Internal Wave Periods Obtained from Theoretical Solutions and Field Observations

Using the vertical water temperature measured with the water quality profiler, we estimated the epilimnion thickness. From October to December, when stratification was stable, the water depth at which the water temperature decreased by 3 °C from the water surface temperature was considered the epilimnion thickness (= h 1 ). On 23 May 2019 and 20 June 2019, when stratification was being formed, the vertical water temperature changed gradually. Therefore, we compared the vertical distributions of the water temperature and DO, determining the epilimnion thickness (= h 1 ) to be 15.0 m on 23 May 2019 and 12.5 m on 20 June 2019. Under these conditions, we obtained the solutions of the frequency equation for Ellipse 1 and Ellipse 2 up to Mode 1~4 (Table 3).
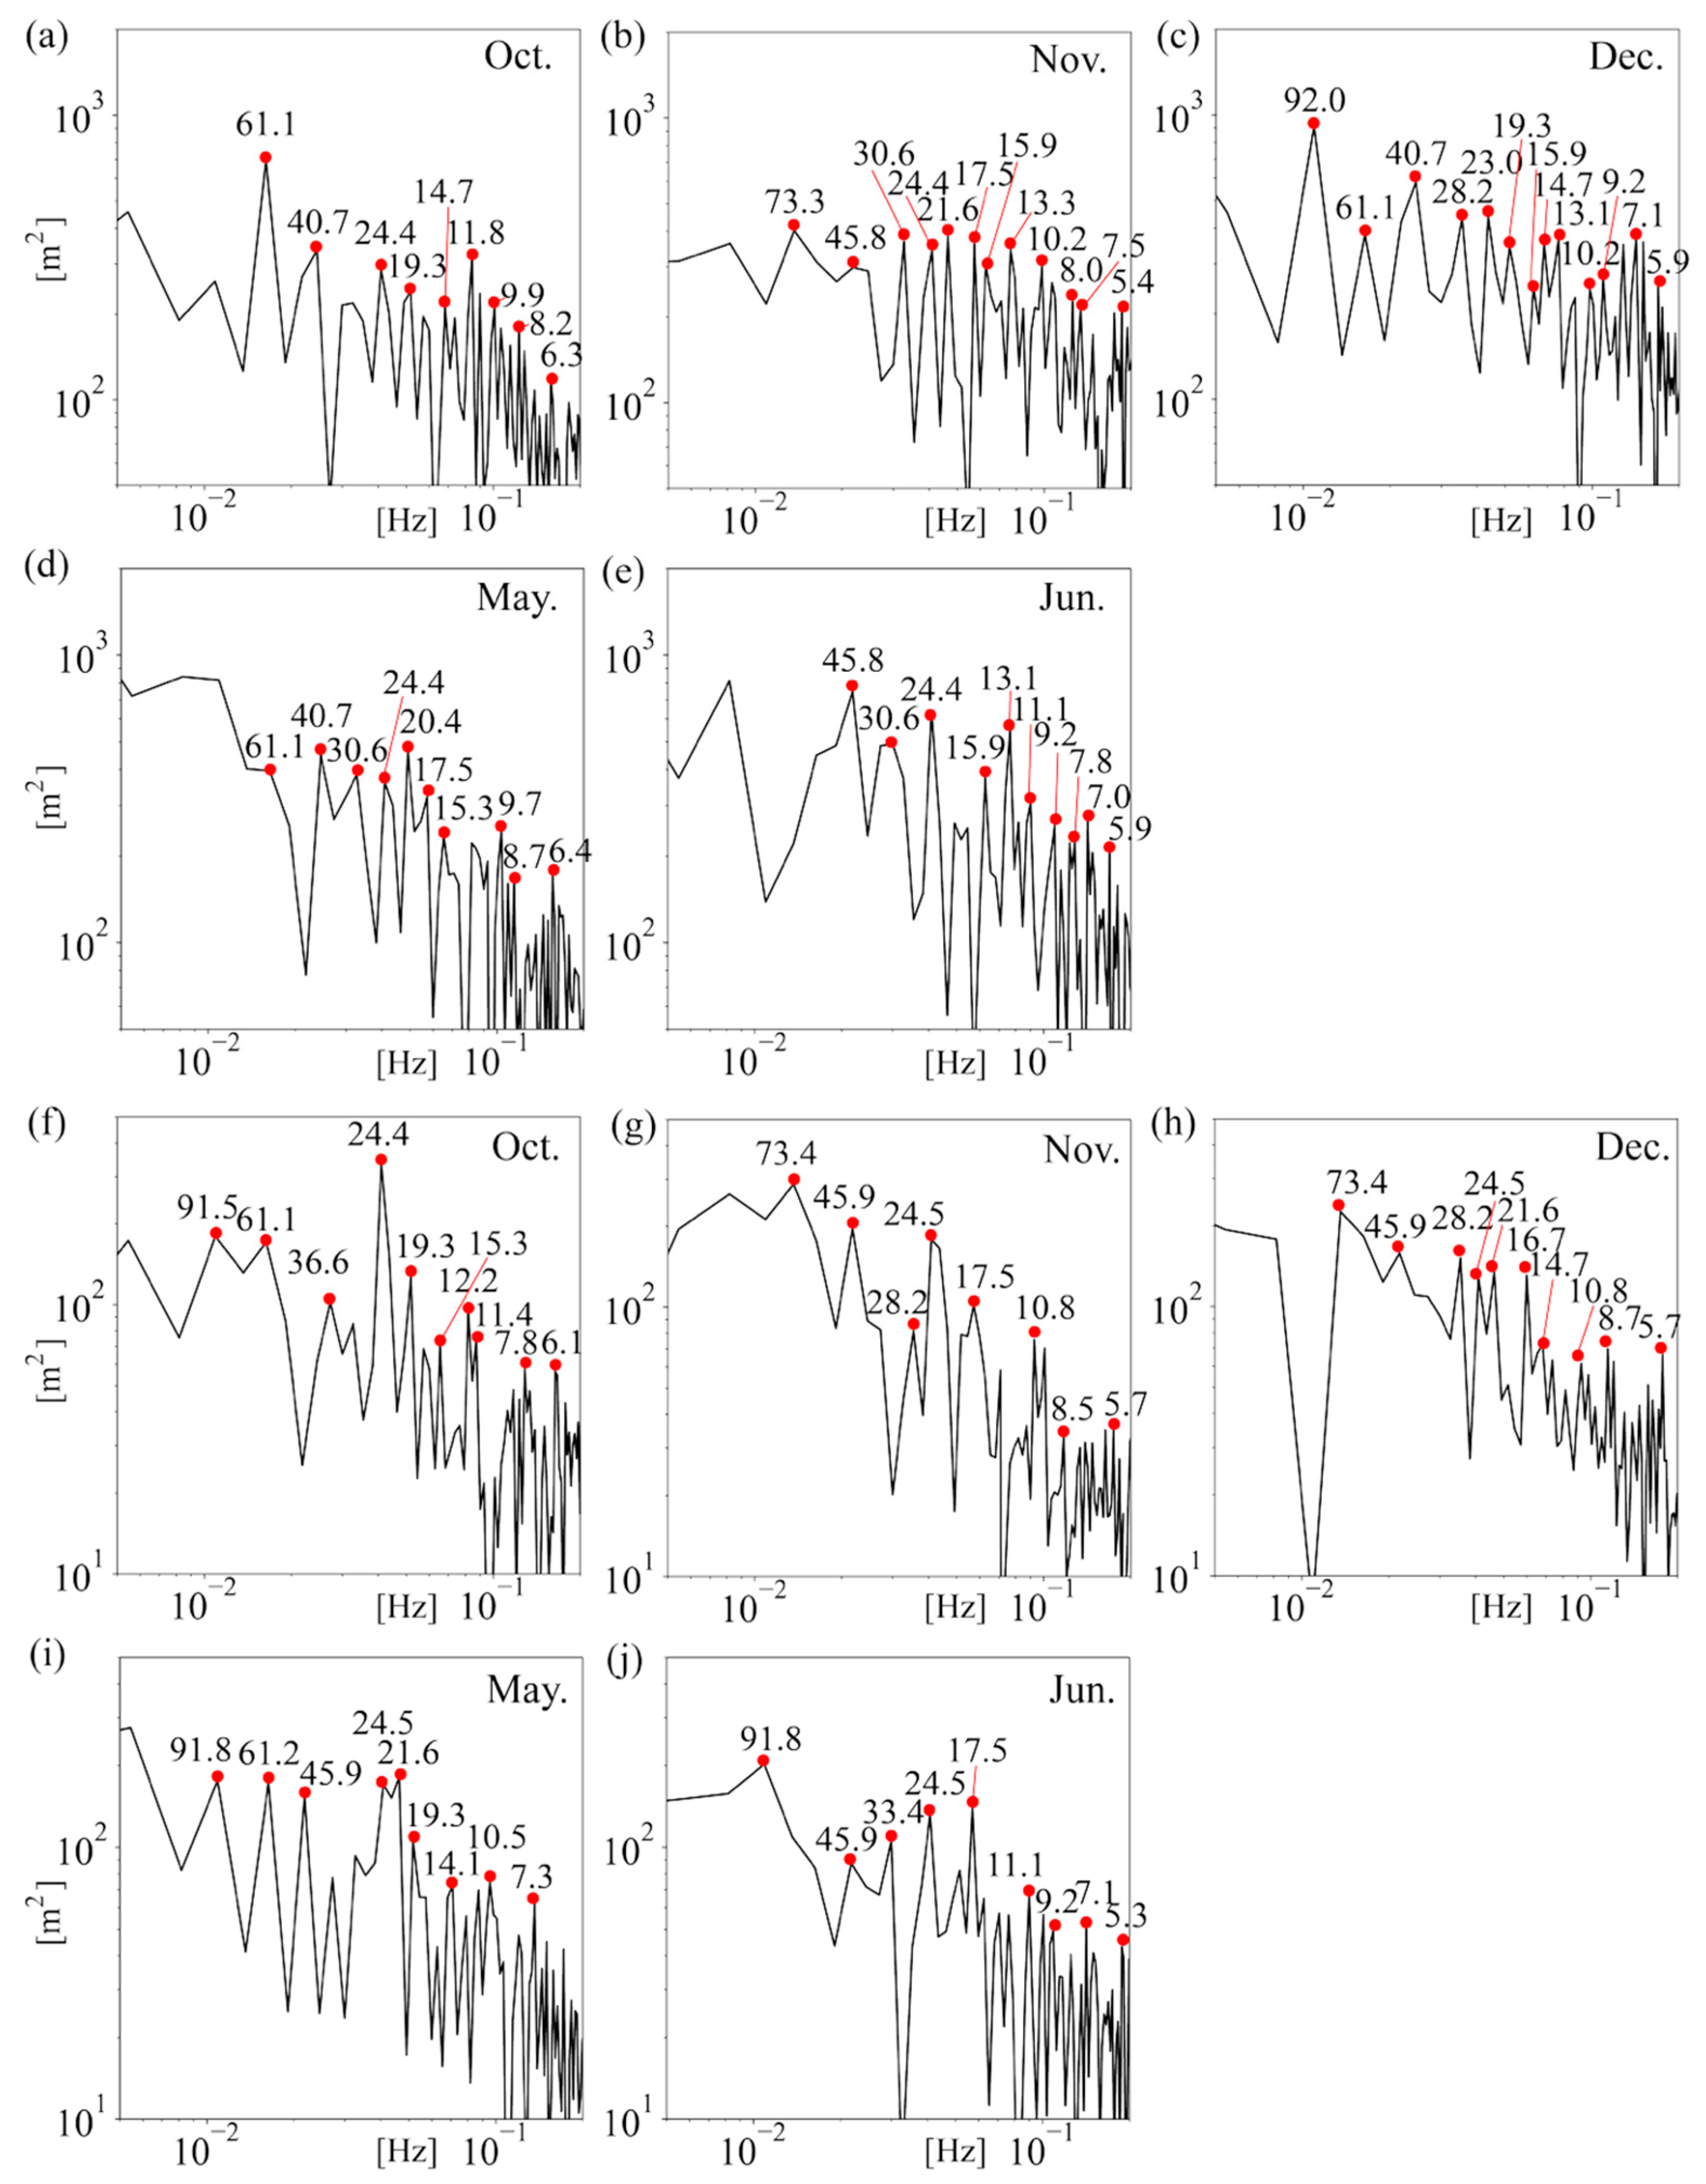
In October 2018, the theoretical solutions for periods below the inertial period were 14.4 h, 11.7 h, 8.5 h, and 6.1 h, which matched the field observations, except for 9.9 h (Table 3 and Figure 5a–e). On the other hand, the theoretical solution for periods above the inertial period was 47.2 h, which underestimated the field observations, 61.1 h (Table 3). We will discuss the differences in the internal Kelvin wave period between the field observation and the theoretical solution in Section 4.1.
In November 2018, the theoretical solutions for periods below the inertial period were 15.9 h, 13.3 h, 10.1 h, and 7.4 h, which matched the field observations (Table 3 and Figure 5a–e). The theoretical solution for periods above the inertial period was 58.1 h, which underestimated the field observations, 73.3 h (Table 3). We will show why the theoretical solutions underestimated the field experiments in Section 3.4 and discuss the limitations of the application of the theoretical solutions in Section 4.2.
In December 2018, the theoretical solutions for periods below the inertial period were 18.1 h, 15.8 h, 13.3 h, and 9.9 h, which matched the field observations (Table 3 and Figure 5a–e). The theoretical solutions for periods above the inertial period were 73.3 h and 51.0 h, which were again shorter than the field observations, 92.0 h and 61.1 h (Table 3). We will discuss this difference in Section 4.2.
In May 2019, the theoretical solutions for periods below the inertial period were 16.1 h, 14.1 h, 10.4 h, 8.5 h, and 6.8 h, which matched the field observations (Table 3 and Figure 5a–e). The theoretical solutions for periods above the inertial period were 59.9 h and 38.8 h, which matched the field observations (Table 3).
In June 2019, the theoretical solutions for periods below the inertial period were 15.2 h, 13.1 h, 9.2 h, 7.5 h, 7.2 h, and 6.1 h, which matched the field observations (Table 3 and Figure 5a–e). The theoretical solutions for periods above the inertial period were 52.3 h and 33.7 h, which agreed well with the field observations (Table 3).
Therefore, the theoretical solutions that reproduced the field observation results corresponded to Modes 1–3 of Ellipse 1 and Ellipse 2 from October to December and to Modes 1–4 of Ellipse 1 and Ellipse 2 from May to June. Summarizing these results for linear internal waves, considering Modes 1–4 of Ellipse 1 and Ellipse 2 throughout the year is sufficient as the corresponding theoretical solutions. However, the theoretical solutions in November and December underestimated the period of the internal Kelvin waves, highlighting the urgent need for investigating the applicability of the theoretical solutions to the internal wave period above the inertial period.
Accuracy evaluation using the mean squared error percentage (MSEP) revealed values of 2.7% for internal Poincaré waves and 49.9% for internal Kelvin waves. These results indicate that the theoretical solutions for internal Poincaré waves closely match the observed values, whereas those for internal Kelvin waves exhibit substantial discrepancies.

3.3. Influence of Winds and Interference of Waves on Internal Wave Periods Using the Field Experiments

From the end of September to October 2018, Typhoons No. 24 and No. 25 affected the epilimnion thickness significantly. Thus, we avoided the duration when the effects of winds, such as typhoons, were prominent (Table 2 and Figure 5a–e). Even after excluding the effects of typhoons, wind variations may appear as a spectrum peak in the epilimnion thickness spectrum analysis. Therefore, we also conducted a spectral analysis of the wind fluctuation effect on the spectrum analysis for the epilimnion thickness (Figure 5f–j). Additionally, as a characteristic of spectral analysis, we removed the fake mode generated by the interference of waves with predominant periods. The period of the internal wave of the fake mode ( = T = 1 / 1 / T 1 1 / T 2 ;   T 1 and T 2 represent two different periods ( T 2 > T 1 )).
During the field observations in October 2018, the predominant periods below the inertial period were 14.7 h, 11.8 h, 9.9 h, 8.2 h, and 6.3 h (Figure 5a). In the mode analysis of Lake Biwa during the summer by Shimizu et al. [25], a wave with a period of 18.6 h was identified as a resonant wave caused by Shiozu Bay, corresponding to the 19.3 h period observed in the field. Therefore, we need to exclude this period. Additionally, in the field observations, a wave with a period of 24.4 h was predominant, but it was excluded, as it corresponded to the wind period (Figure 5f). The predominant period above the inertial period in the field observations was 61.1 h (Figure 5a). In the field observations, the 40.7 h period was also predominant, but it was excluded because it was considered to be an interference of the 61.1 h and 24.4 h waves.
During the field observations in November 2018, the predominant periods below the inertial period were 15.9 h, 13.3 h, 10.2 h, and 7.5 h (Figure 5b). In the field observations, waves with periods of 17.5 h, 8.0 h, and 5.4 h were also predominant, but they were excluded, as they corresponded to the wind periods (Figure 5g). Additionally, the predominant period above the inertial period in the field observations was 73.3 h (Figure 5b). In the field observations, waves with periods of 45.8 h, 30.6 h, and 24.4 h were also predominant, but they were excluded, as they corresponded to the wind periods (Figure 5g). The 21.6 h period was also predominant in the field observations, but it was excluded, as it was close to the inertial period of 20.9 h.
During the field observations in December 2018, the predominant periods below the inertial period were 19.3 h, 15.9 h, 13.1 h, and 9.2 h (Figure 5c). In the field observations, waves with periods of 14.7 h, 10.2 h, 7.1 h, and 5.9 h were also predominant, but they were excluded, as they corresponded to the wind periods (Figure 5h). Additionally, the predominant periods above the inertial period in the field observations were 92.0 h and 61.1 h (Figure 5c). In the field observations, waves with periods of 23.0 h and 28.2 h were also predominant, but they were excluded, as they corresponded to the wind periods (Figure 5h). The 40.7 h period was also predominant in the field observations, but it was excluded because it was considered to be an interference of the 92.0 h and 28.2 h waves.
During the field observations in May 2019, the predominant periods below the inertial period were 17.5 h, 15.3 h, 9.7 h, 8.7 h, and 6.4 h (Figure 5d). A wave with a period of 20.4 h was also predominant, but it was excluded, as it was close to the inertial period. Additionally, the predominant periods above the inertial period in the field observations were 61.1 h and 40.7 h. A wave with a period of 24.4 h was also predominant, but it was excluded, as it corresponded to the wind period (Figure 5d).
During the field observations in June 2019, the predominant periods below the inertial period were 15.9 h, 13.1 h, 9.2 h, 7.8 h, 7.0 h, and 5.9 h (Figure 5e). A wave with a period of 11.1 h was also predominant, but it was excluded, as it corresponded to the wind period (Figure 5j). Additionally, the predominant periods above the inertial period in the field observations were 45.8 h and 30.6 h (Figure 5e). A wave with a period of 24.4 h was also predominant, but it was excluded, as it corresponded to the wind period (Figure 5j).

3.4. Validity of Theoretical Solutions for Internal Kelvin Waves in November and December 2018

For internal Kelvin waves, the theoretical solution for November and December 2018 underestimated the period observed in the field, suggesting the influence of wind variations. However, the wind spectrum for December 2018 did not detect a wind speed peak corresponding to 92.0 h, which suggests that the wind variations may not explain the underestimation of the theoretical solution. The theoretical solution for internal Kelvin waves ( q i < 0 ) is determined by the Modified Mathew function, which is reproduced using a series expansion around q i = 0 [31]. Therefore, when the absolute value of q i becomes greater than zero, the reproducibility of the Modified Mathew function significantly decreases, and the reliability of the theoretical solution also decreases.
Our findings on the function of q i as a determinant of the period of internal Kelvin waves are of significant importance when q i < 0 . q i is a function of φ and ψ , and its value increases as the ellipticity increases and as the Burger number decreases. The Burger number decreases as φ increases when the wave speed ( = c I ) and Coriolis force ( = f ) are constant, increasing q i . Therefore, q i increases as the size and ellipticity increase. The value of q 1 for Ellipse 1 was 9.79 in December 2018, indicating that the approximation was particularly poor, leading to a shorter period in the theoretical solution.

3.5. Year-Round Internal Wave Periods Using the Frequency Equation

From 21 September 2018 to 21 July 2019, we obtained daily theoretical solutions that revealed the significant seasonal fluctuations in the periods of internal waves (Figure 6). This research is crucial, as it allows us to understand how linear internal waves change throughout the year. Notably, the periods of internal Kelvin waves were about twice as long in winter compared to summer. When stratification was formed from May to July, the periods of internal Kelvin waves had significant fluctuations, while the periods of internal Poincaré waves also fluctuated slightly. Antenucci and Imberger [30] used the continuous wavelet transform of the square of the wind speed to investigate the potential of internal wave amplitude amplification due to resonance with the wind. Our work in Lake Biwa, where wind periods of more than 20 h are dominant, suggests a significant amplification potential of internal Kelvin waves (Figure 6). The revelation of about 24 h internal Kelvin waves in Ellipse 2 from July to November and 60 h to 80 h internal Kelvin waves in Ellipse 1 in December and June, resonating with wind stress, has practical implications for understanding and predicting long-linear internal wave behavior in a stratified lake.
Bouffard et al. [17] and Valipour et al. [18] demonstrated that internal Poincaré waves significantly contribute to the vertical mixing of the density interface in deep lakes, providing important insights into the behavior of hypoxic water masses occurring in the hypolimnion. Thus, this study provides significant periods throughout the year that may control mass transport and hypoxia around Lake Biwa. It should be noted that the theoretical solutions for internal Kelvin waves, as mentioned in Section 3.4, tend to underestimate the actual wave periods. This highlights the need for further investigation in this area.

4. Discussion

4.1. Wind Effect on Internal Kelvin Waves

As for the predominant periods of internal Kelvin waves in Lake Biwa during the summer, Shimizu et al. [25] demonstrated a period of 42.1 h from 21 August to 16 September 1993. Additionally, Kanari [36] showed periods of 45.5 h from 5 August to 17 August 1973 and 53.0 h from 25 September to 9 October 1973, which are close to the theoretical solution of 47.3 h obtained in this study. The period of 61.1 h for internal Kelvin waves observed in the field in October 2018 matched the predominant wind period, suggesting that the wind variations play a crucial role in influencing the density interface displacement, resulting in longer periods of internal waves compared to the theoretical solutions. This complex dynamic of internal waves, influenced by wind variations, is a key factor in understanding the behavior of internal Kelvin waves in Lake Biwa.
On the other hand, when it comes to internal Poincaré waves with periods below the inertial period in Lake Biwa, Shimizu et al. [25] indicated predominant periods of 15.3 h, 11.9 h, 10.5 h, 9.6 h, and 8.7 h (excluding resonance caused by Shiozu Bay). Additionally, Saggio and Imberger [29] showed predominant periods of 16 h and 12 h for internal Poincaré waves in Lake Biwa. These values are close to the field observations of 14.7 h, 11.8 h, 8.2 h, and 6.3 h and the theoretical solutions of 14.4 h, 11.7 h, 8.5 h, and 6.1 h obtained in this study (Figure 5a and Table 3). Therefore, it can be concluded that the theoretical solutions can reproduce the field observation results well for the modes of internal waves occurring in Lake Biwa during the summer, except for internal Kelvin waves. This highlights the enlightening influence of wind stresses on internal Kelvin waves, which may be much more influential than on internal Poincaré waves.

4.2. Applicability Limits of the Theoretical Solutions for Internal Kelvin Waves

To examine the applicability limits of the theoretical solution for internal Kelvin waves, we computed ψ / , S B , 1 σ 1 / S B , and q 1 for Ellipse 1 and Ellipse 2 (Table 4). The theoretical solutions underestimated the internal wave periods in Ellipse 1 compared to Ellipse 2. As expected from the Goldstein approximation, q 1 of Ellipse 1 ranged from 2 to 10, whereas q 1 of Ellipse 2 was less than 2. In particular, among Ellipse 1, q 1 in December 2018 was the largest, and the discrepancy between the theoretical solution and field experiment was the most significant. The theoretical estimation error was more than about 10 hours in Ellipse 1, excluding May 2019. Since q 1   is a function of the ellipticity, the larger the ellipticity, the greater the q 1 . Additionally, the smaller the Burger number, the greater the q 1 . This significant influence of q 1   on the theoretical solutions underscores the impact of ellipticity and the Burger number on the period of internal Kelvin waves. It may suggest that q 1 needs to be less than 1.0, highlighting the need for further research in this area. However, the theoretical solution in May 2019 showed good agreement with observation even if q 1 = 4.43 . Therefore, further studies are needed to evaluate the applicability of theoretical solutions.
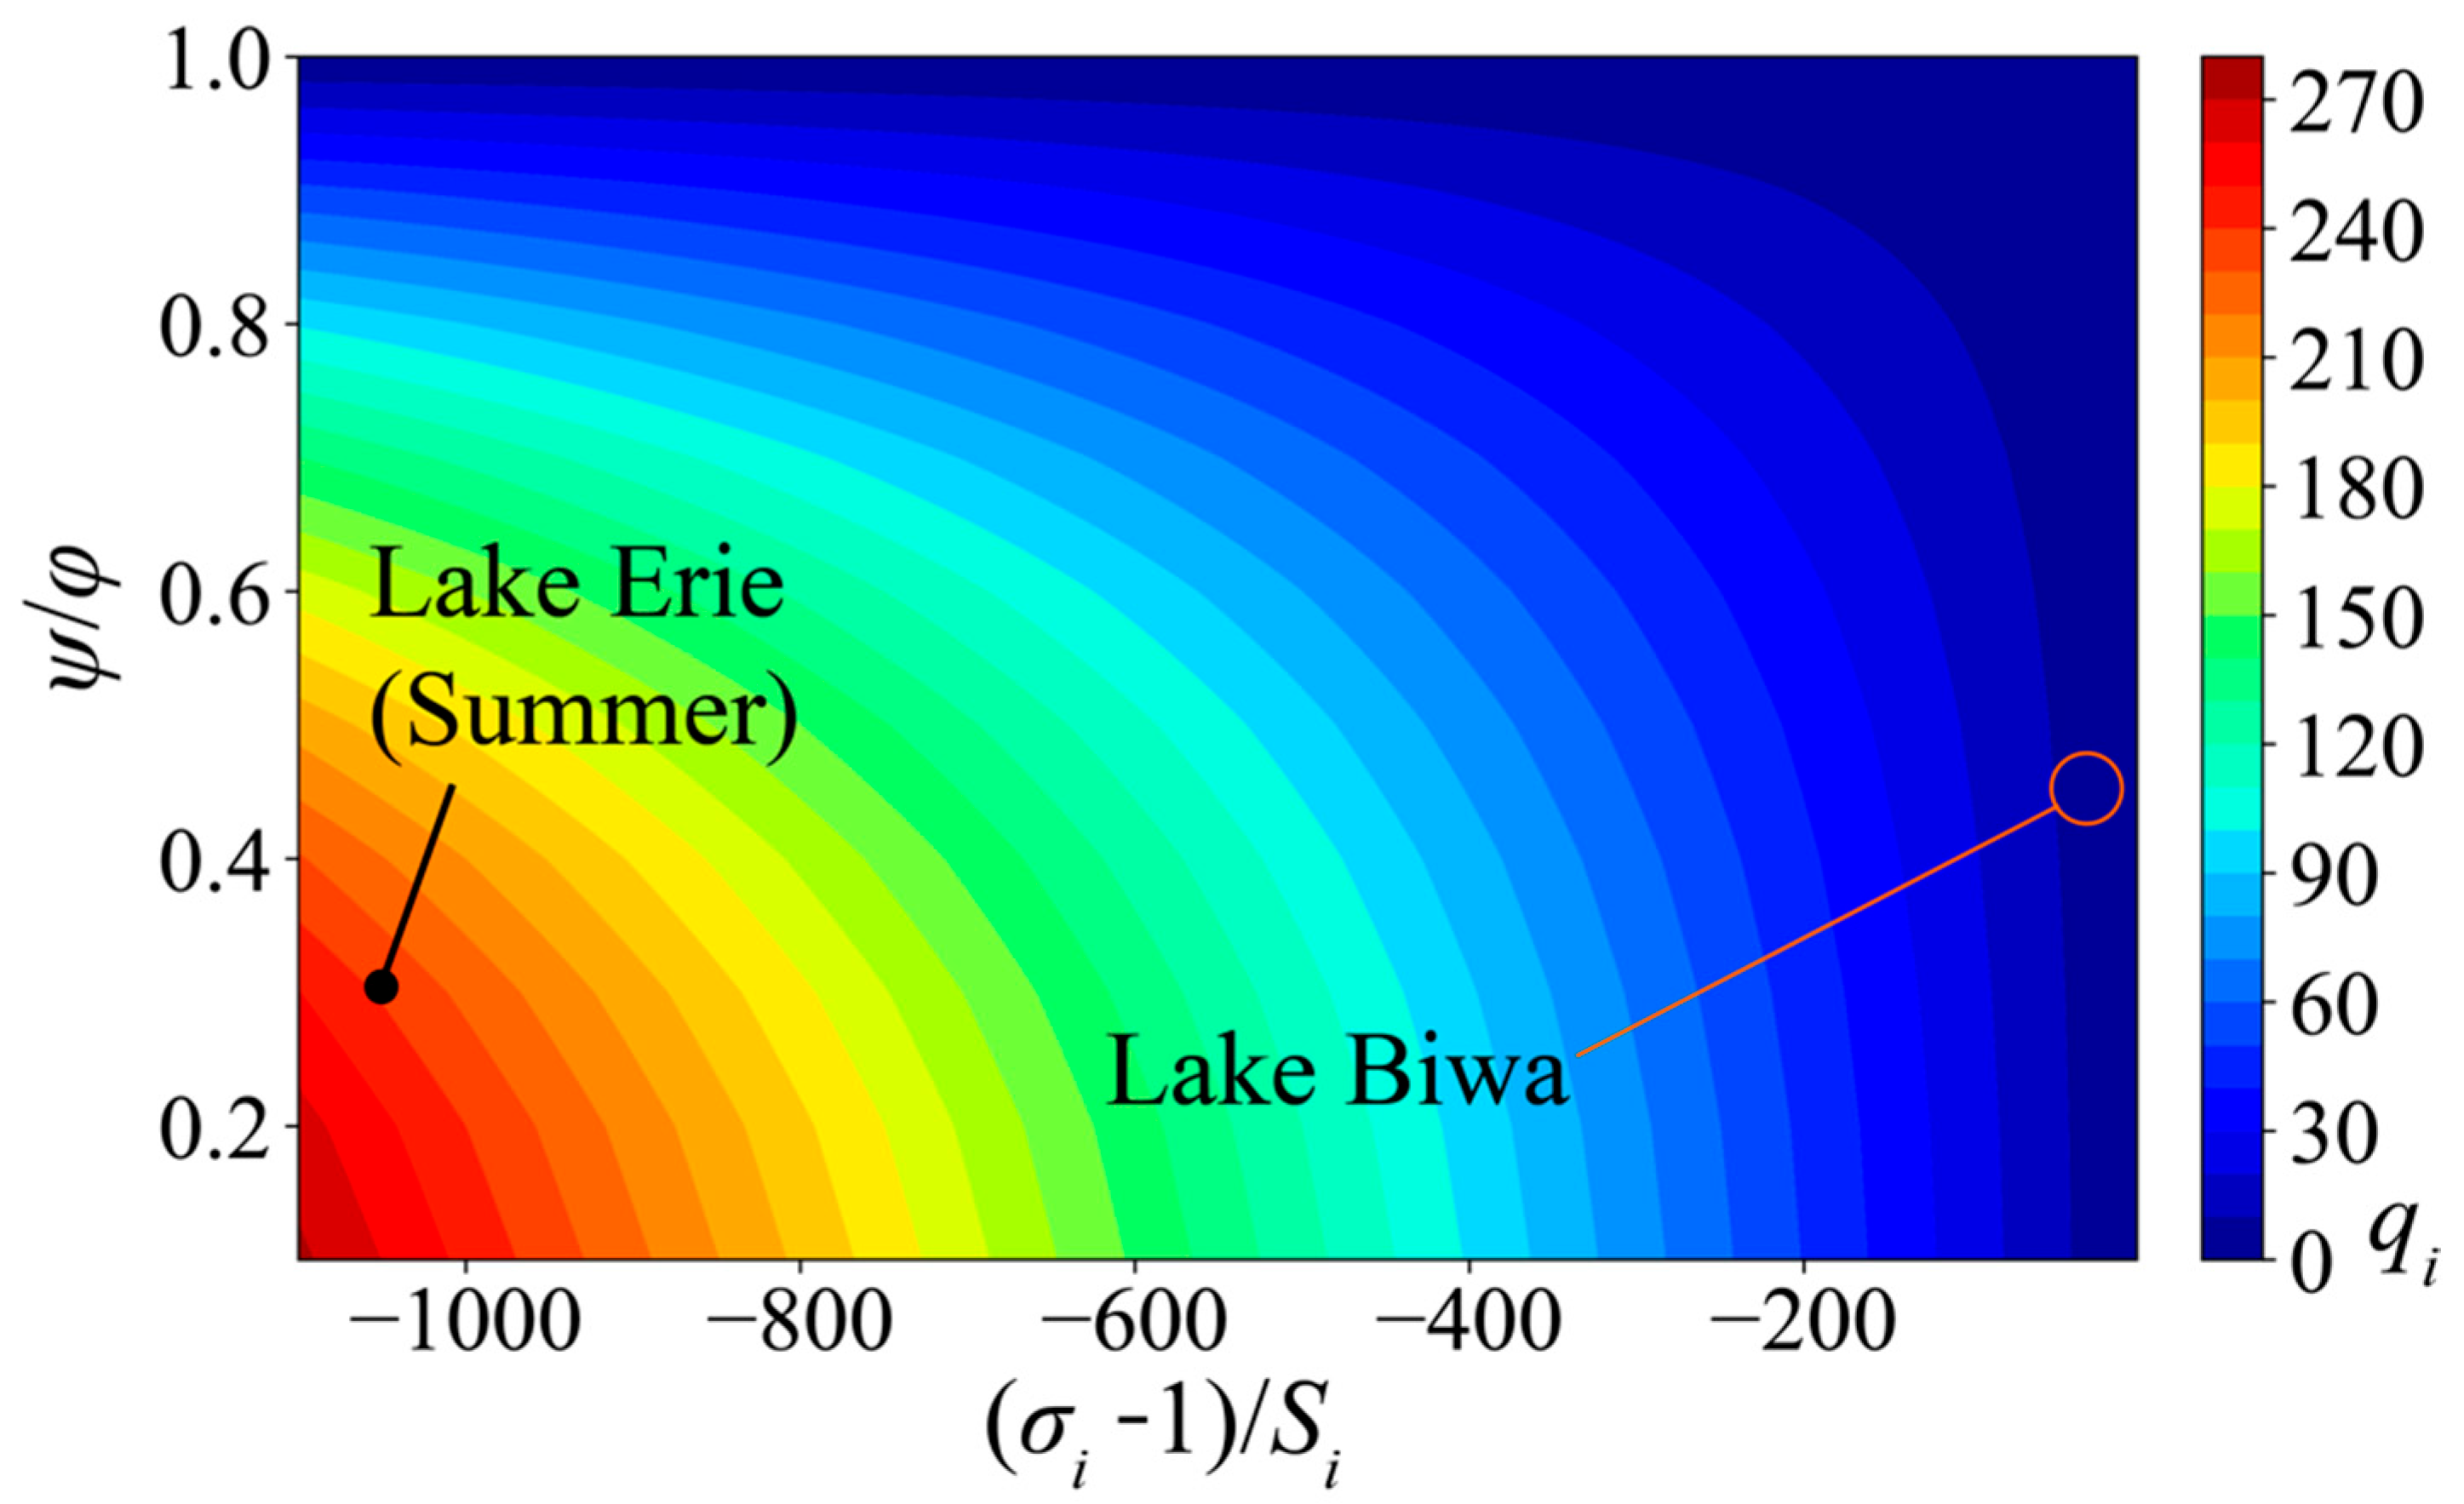
Additionally, we consider Lake Erie, a representative large-scale lake. Based on the observation results of [37], the wave speed in summer is set to c I = 0.345 m/s, φ = 115 , 000 m, and ψ = 35 , 000 m. Given the large size relative to the wave speed, the frequency of internal Kelvin waves (= ω 1 ) is obtained by dividing the wave speed by the circumference, resulting in σ 1 2 being close to zero and q 1 = 238 (Table 4). q 1 is significantly larger compared to Lake Biwa in December (Figure 7). This indicates again that the elliptical frequency equation for internal Kelvin waves cannot be applied to large-scale lakes with small Burger numbers (= S B ) due to the significant change in q i with S B . The recommended applicability limit for internal Kelvin waves is indicated when q i < 1.0 , from results of this study. For shapes close to a circle ( ψ / = 0.9 ), the reproducibility is high if σ i 2 1 / S B 2 > 21 . For example, assuming σ i = 0.5 , the theoretical solution cannot be applied if S B is less than 0.19. On the other hand, for more elliptical shapes ( ψ / = 0.5 ), the applicability limit is σ i 2 1 / S B 2 > 5.3 , and the theoretical solution cannot be applied if S B is less than 0.38, assuming σ i = 0.5 . However, for internal Poincaré waves, the argument q i of the Modified Mathew is positive, and there is no need to use the Goldstein approximation. Therefore, unlike internal Kelvin waves, the reproducibility of internal Poincaré waves does not decrease, and they can be applied to large lakes.
Furthermore, Matsumoto and Nakayama [38] have shown that the internal Kelvin wave period is a function of the lake perimeter and the long-linear internal wave speed when the Burger number is 0.10. Their findings, based on a rectangular lake with a 3:1 ratio, suggest that the larger the lake size, the lower the reproducibility of the frequency equation. They found that the internal Kelvin wave period equals the perimeter divided by the long-linear internal wave speed. Kanari [39] also demonstrated that the internal wave behaved like internal seiches, with Earth’s rotation in a rectangular shape that imitated Lake Biwa. In our study, we observed an internal Kelvin wave period of 61.1 h in October 2018, with major and minor diameters of 38 km and 16.6 km and a long-linear internal wave speed of 0.408 m/s. The perimeter of Lake Biwa is 89,091 m. Following the methodology of Matsumoto and Nakayama [38], we calculated the internal Kelvin wave period to be 60.7 h (89,091 m/0.408 m/s), a value that aligns very well with field observations. This robust alignment underscores the reliability of estimating the internal Kelvin wave period using the perimeter and the long-linear internal wave speed, particularly when the Burger number is significantly less than 1.0, and the absolute value of q i is greater than 1.0.

4.3. Comparisons of the Frequency Equations for a Circular and Elliptical Cylinder

Our thorough examination of the impact of ellipticity on internal wave periods, comparing the frequency equations for ellipses by Goldstein [31] and circles by Csanady [24] and Birchfield [40], instills confidence in the results. For comparisons between different horizontal-shaped basins, the areas were set equal for both cylinders. Comparing the theoretical solutions for October, we found that the elliptical cylinder resulted in longer periods for internal Kelvin waves and shorter periods for internal Poincaré waves compared to the circular cylinder [23] (Table 5). For internal Kelvin waves, 47.2 h in the elliptical theoretical solution and 42.3 h in the circular theoretical solution indicate that the elliptical cylinder had better reproducibility.
The predominant periods observed in October were 14.7 h, 11.8 h, 9.9 h, 8.2 h, and 6.3 h (excluding the 19.3 h period corresponding to resonance caused by Shiozu Bay). The theoretical solutions for Mode 2 of Ellipse 1 and Ellipse 2 were 14.4 h and 11.7 h, which were close to the observational results. In contrast, the theoretical solutions for Mode 2 of Circle 1 and Circle 2 were 15.6 h and 12.4 h, showing a more significant discrepancy with the observational results (Table 5). On the other hand, the theoretical solutions for Mode 3 of Ellipse 1 and Ellipse 2 were 8.5 h and 6.1 h, while those for Mode 3 of Circle 1 and Circle 2 were 9.2 h and 6.2 h, showing a minor discrepancy (Table 5). Antenucci and Imberger [23] also showed that the frequency increases with the increase in the Burger number for both elliptical and circular cylinders, and a similar trend was observed in this study. These results indicate that for lakes with an elliptical shape, like Lake Biwa, the elliptical cylinder provides better reproducibility than the circular cylinder. It should be noted that there is a limitation in the applicability of the frequency equation for estimating internal Kelvin waves, as shown in Section 4.3, that the Burger number must not be significantly less than 1.0, and q i is smaller than 1.0.

5. Conclusions

This study aimed to analyze internal waves from a seasonal perspective based on the vertical distributions of the water temperature and dissolved oxygen (DO) near the deepest part of Lake Biwa, and to evaluate the effectiveness of a frequency equation in reproducing the characteristics of these waves. Spectral analysis was conducted using in situ observational data, and the observed wave periods were compared with theoretical solutions for internal Kelvin and Poincaré waves.
As a result, it was found that, except during periods of a low Wedderburn number, the theoretical solution for internal Poincaré waves closely reproduced the observed periods of linear internal waves. In contrast, the theoretical periods of internal Kelvin waves were consistently shorter than the observed values. This discrepancy is attributed to two main factors: (1) the influence of wind, which tends to prolong the observed periods to match the prevailing wind cycle, and (2) the reduced approximation accuracy of the Modified Mathieu function near q i = 0 , where the series expansion used becomes less reliable under the condition q i > 1.0 .
Furthermore, a comparison between cylindrical and elliptical frequency equations demonstrated that, in elliptical lakes such as Lake Biwa, the elliptical cylinder model provides higher reproducibility. Based on these findings, the frequency equation proves to be a practical tool for rapidly estimating linear internal wave periods in stratified, enclosed water bodies. However, the persistent underestimation of theoretical internal Kelvin wave periods highlights limitations in the applicability of the method. In particular, the reduced reliability of the Modified Mathieu function under conditions of q i > 1.0 suggests that predicting internal Kelvin waves remains challenging in large lakes or environments with low Burger numbers.

Author Contributions

Conceptualization, K.N. and H.Y.; methodology, K.N., H.Y. and H.M.; software, H.Y.; validation, K.N., H.Y. and H.M.; formal analysis, K.N., H.Y. and H.M.; investigation, K.N., H.Y. and H.M.; resources, C.J. and K.H.; data curation, C.J. and K.H.; writing—original draft preparation, K.N. and H.Y.; writing—review and editing, C.J., H.M. and K.H.; visualization, H.Y.; supervision, K.N.; project administration, C.J. and K.H.; funding acquisition, K.N. All authors have read and agreed to the published version of the manuscript.

Funding

This research was supported by the Japan Society for the Promotion of Science (JSPS) [grant numbers 25H00408 and 23K22871].

Data Availability Statement

The raw data supporting the conclusions of this article will be made available by the authors upon reasonable request.

Acknowledgments

We would like to express our gratitude to K. Shimizu for their technical assistance. We are also deeply grateful to Morikawa and all the crew members of the research vessel “Biwakaze” for their longstanding cooperation.

Conflicts of Interest

The authors declare no conflicts of interest.

References

  1. Bartosiewicz, M.; Laurion, I.; Clayer, F.; Maranger, R. Heat-Wave Effects on Oxygen, Nutrients, and Phytoplankton Can Alter Global Warming Potential of Gases Emitted from a Small Shallow Lake. Environ. Sci. Technol. 2016, 50, 6267–6275. [Google Scholar] [CrossRef] [PubMed]
  2. Shinohara, R.; Matsuzaki, S.-I.S.; Watanabe, M.; Nakagawa, M.; Yoshida, H.; Kohzu, A. Heat Waves Can Cause Hypoxia in Shallow Lakes. Geophys. Res. Lett. 2023, 50, e2023GL102967. [Google Scholar] [CrossRef]
  3. Woolway, R.I.; Jennings, E.; Carrea, L. Impact of the 2018 European heatwave on lake surface water temperature. Inland Waters 2020, 10, 322–332. [Google Scholar] [CrossRef]
  4. Kaya, Y. Evaluation of ICESat-2 Laser Altimetry for Inland Water Level Monitoring: A Case Study of Canadian Lakes. Water 2025, 17, 1098. [Google Scholar] [CrossRef]
  5. Xie, H.; Jin, X.; Li, W.; Cai, K.; Yang, G.; Chen, K.; Xu, J.; Johnson, A.C. Identifying Critical Land Use Thresholds for Biodiversity Conservation in China’s Lake Ecosystems. Environ. Sci. Technol. 2025, 59, 5431–5442. [Google Scholar] [CrossRef]
  6. Gloor, M.; Wüest, A.; Münnich, M. Benthic boundary mixing and resuspension induced by internal seiches. Hydrobiologia 1994, 284, 59–68. [Google Scholar] [CrossRef]
  7. Pierson, D.C.; Weyhenmeyer, G.A. High resolution measurements of sediment resuspension above an accumulation bottom in a stratified lake. Hydrobiologia 1994, 284, 43–57. [Google Scholar] [CrossRef]
  8. Shteinman, B.; Eckert, W.; Kaganowsky, S.; Zohary, T. Seiche-Induced Resuspension in Lake Kinneret: A Fluorescent Tracer Experiment. In The Interactions Between Sediments and Water; Evans, R.D., Wisniewski, J., Wisniewski, J.R., Eds.; Springer: Dordrecht, The Netherlands, 1997; pp. 123–131. [Google Scholar] [CrossRef]
  9. Wüest, A.; Lorke, A. Small-scale hydrodynamics in lakes. Annu. Rev. Fluid Mech. 2003, 35, 373–412. [Google Scholar] [CrossRef]
  10. Boegman, L.; Stastna, M. Sediment Resuspension and Transport by Internal Solitary Waves. Annu. Rev. Fluid Mech. 2019, 51, 129–154. [Google Scholar] [CrossRef]
  11. Macintyre, S.; Flynn, K.M.; Jellison, R.; Romero, J.R. Boundary mixing and nutrient fluxes in Mono Lake, California. Limnol. Oceanogr. 1999, 44, 512–529. [Google Scholar] [CrossRef]
  12. Finlay, K.P.; Cyr, H.; Shuter, B.J. Spatial and temporal variability in water temperatures in the littoral zone of a multibasin lake. Can. J. Fish. Aquat. Sci. 2001, 58, 609–619. [Google Scholar] [CrossRef]
  13. Csanady, G.T. The Coastal Boundary Layer in Lake Ontario: Part II. The Summer-Fall Regime. J. Phys. Oceanogr. 1972, 2, 168–176. [Google Scholar] [CrossRef]
  14. Hodges, B.R.; Imberger, J.; Saggio, A.; Winters, K.B. Modeling basin-scale internal waves in a stratified lake. Limnol. Oceanogr. 2000, 45, 1603–1620. [Google Scholar] [CrossRef]
  15. Ito, W.; Nakayama, K.; Shintani, T. Coriolis effects on wind-driven upwelling in enclosed basins. Cont. Shelf Res. 2023, 256, 104956. [Google Scholar] [CrossRef]
  16. Laval, B.; Imberger, J.; Hodges, B.R.; Stocker, R. Modeling circulation in lakes: Spatial and temporal variations. Limnol. Oceanogr. 2003, 48, 983–994. [Google Scholar] [CrossRef]
  17. Bouffard, D.; Boegman, L.; Rao, Y.R. Poincaré wave–induced mixing in a large lake. Limnol. Oceanogr. 2012, 57, 1201–1216. [Google Scholar] [CrossRef]
  18. Valipour, R.; Bouffard, D.; Boegman, L.; Rao, Y.R. Near-inertial waves in Lake Erie. Limnol. Oceanogr. 2015, 60, 1522–1535. [Google Scholar] [CrossRef]
  19. Hayami, Y.; Fujiwara, T. Recent warming of the deep water in Lake Biwa. Res. Sea 1999, 8, 197–202. [Google Scholar] [CrossRef]
  20. Yamada, K.; Yamamoto, H.; Hichiri, S.; Okamoto, T.; Hayakawa, K. First observation of incomplete vertical circulation in Lake Biwa. Limnology 2021, 22, 179–185. [Google Scholar] [CrossRef]
  21. Kumagai, M.; Jiao, C.; Ishikawa, K.; Aota, Y. Chapter 1, climate change and environmental change in Lake Biwa. In Final Report of the Committee for the Investigation of Northern Lakes of Lake Biwa; Lake Biwa Environmental Research Institute: Shiga, Japan, 2005; pp. 1–20. [Google Scholar]
  22. Maruya, Y.; Nakayama, K.; Sasaki, M.; Komai, K. Effect of dissolved oxygen on methane production from bottom sediment in a eutrophic stratified lake. J. Environ. Sci. 2023, 125, 61–72. [Google Scholar] [CrossRef]
  23. Antenucci, J.P.; Imberger, J. Energetics of long internal gravity waves in large lakes. Limnol. Oceanogr. 2001, 46, 1760–1773. [Google Scholar] [CrossRef]
  24. Csanady, G.T. Motions in a model Great Lake due to a suddenly imposed wind. J. Geophys. Res. 1968, 73, 6435–6447. [Google Scholar] [CrossRef]
  25. Shimizu, K.; Imberger, J.; Kumagai, M. Horizontal structure and excitation of primary motions in a strongly stratified lake. Limnol. Oceanogr. 2007, 52, 2641–2655. [Google Scholar] [CrossRef]
  26. Yoneda, H.; Nakayama, K.; Hirami, T.; Hayakawa, K.; Jiao, C. Internal wave mode in Lake Biwa. Jpn. J. JSCE 2025, 81, 24–16084. [Google Scholar] [CrossRef]
  27. Lin, H.C.; Chiu, C.Y.; Tsai, J.W.; Liu, W.C.; Tada, K.; Nakayama, K. Influence of Thermal Stratification on Seasonal Net Ecosystem Production and Dissolved Inorganic Carbon in a Shallow Subtropical Lake. J. Geophys. Res. Biogeosci. 2021, 126, e2020JG005907. [Google Scholar] [CrossRef]
  28. Staehr, P.A.; Sand-Jensen, K. Temporal dynamics and regulation of lake metabolism. Limnol. Oceanogr. 2007, 52, 108–120. [Google Scholar] [CrossRef]
  29. Saggio, A.; Imberger, J. Internal wave weather in a stratified lake. Limnol. Oceanogr. 1998, 43, 1780–1795. [Google Scholar] [CrossRef]
  30. Antenucci, J.P.; Imberger, J. The seasonal evolution of wind/internal wave resonance in Lake Kinneret. Limnol. Oceanogr. 2003, 48, 2055–2061. [Google Scholar] [CrossRef]
  31. Goldstein, S. On the vortex theory of screw propellers. Proc. R. Soc. London. Ser. A Contain. Pap. A Math. Phys. Character 1929, 123, 440–465. [Google Scholar] [CrossRef]
  32. Pedlosky, J. Geophysical Fluid Dynamics, 2nd ed.; Springer Science & Business Media: New York, NY, USA, 1987. [Google Scholar] [CrossRef]
  33. Imberger, J.; Patterson, J.C. Physical Limnology. In Advances in Applied Mechanics; Hutchinson, J.W., Wu, T.Y., Eds.; Elsevier: Amsterdam, The Netherlands, 1989; pp. 303–475. [Google Scholar] [CrossRef]
  34. Stevens, C.; Imberger, J. The initial response of a stratified lake to a surface shear stress. J. Fluid Mech. 1996, 312, 39–66. [Google Scholar] [CrossRef]
  35. Kondo, J. Air-sea bulk transfer coefficients in diabatic conditions. Bound. Layer Meteorol. 1975, 9, 91–112. [Google Scholar] [CrossRef]
  36. Kanari, S. On the Study of Numerical Experiments of Two Layer Lake Biwa. Jpn. Soc. Limnol. 1974, 35, 1–17. [Google Scholar] [CrossRef]
  37. Lin, S.; Boegman, L.; Rao, Y.R. Characterizing spatial and temporal distributions of turbulent mixing and dissipation in Lake Erie. J. Great Lakes Res. 2021, 47, 168–179. [Google Scholar] [CrossRef]
  38. Matsumoto, H.; Nakayama, K. Validity of theoretical solutions for a rotating rectangular basin with two-layer stratification due to a suddenly imposed wind. Phys. Fluids 2025, 37, 036602. [Google Scholar] [CrossRef]
  39. Kanari, S. The long-period internal waves in Lake Biwa. Limnol. Oceanogr. 1975, 20, 544–553. [Google Scholar] [CrossRef]
  40. Birchfield, G.E. Response of a circular model great lake to a suddenly imposed wind stress. J. Geophys. Res. 1969, 74, 5547–5554. [Google Scholar] [CrossRef]
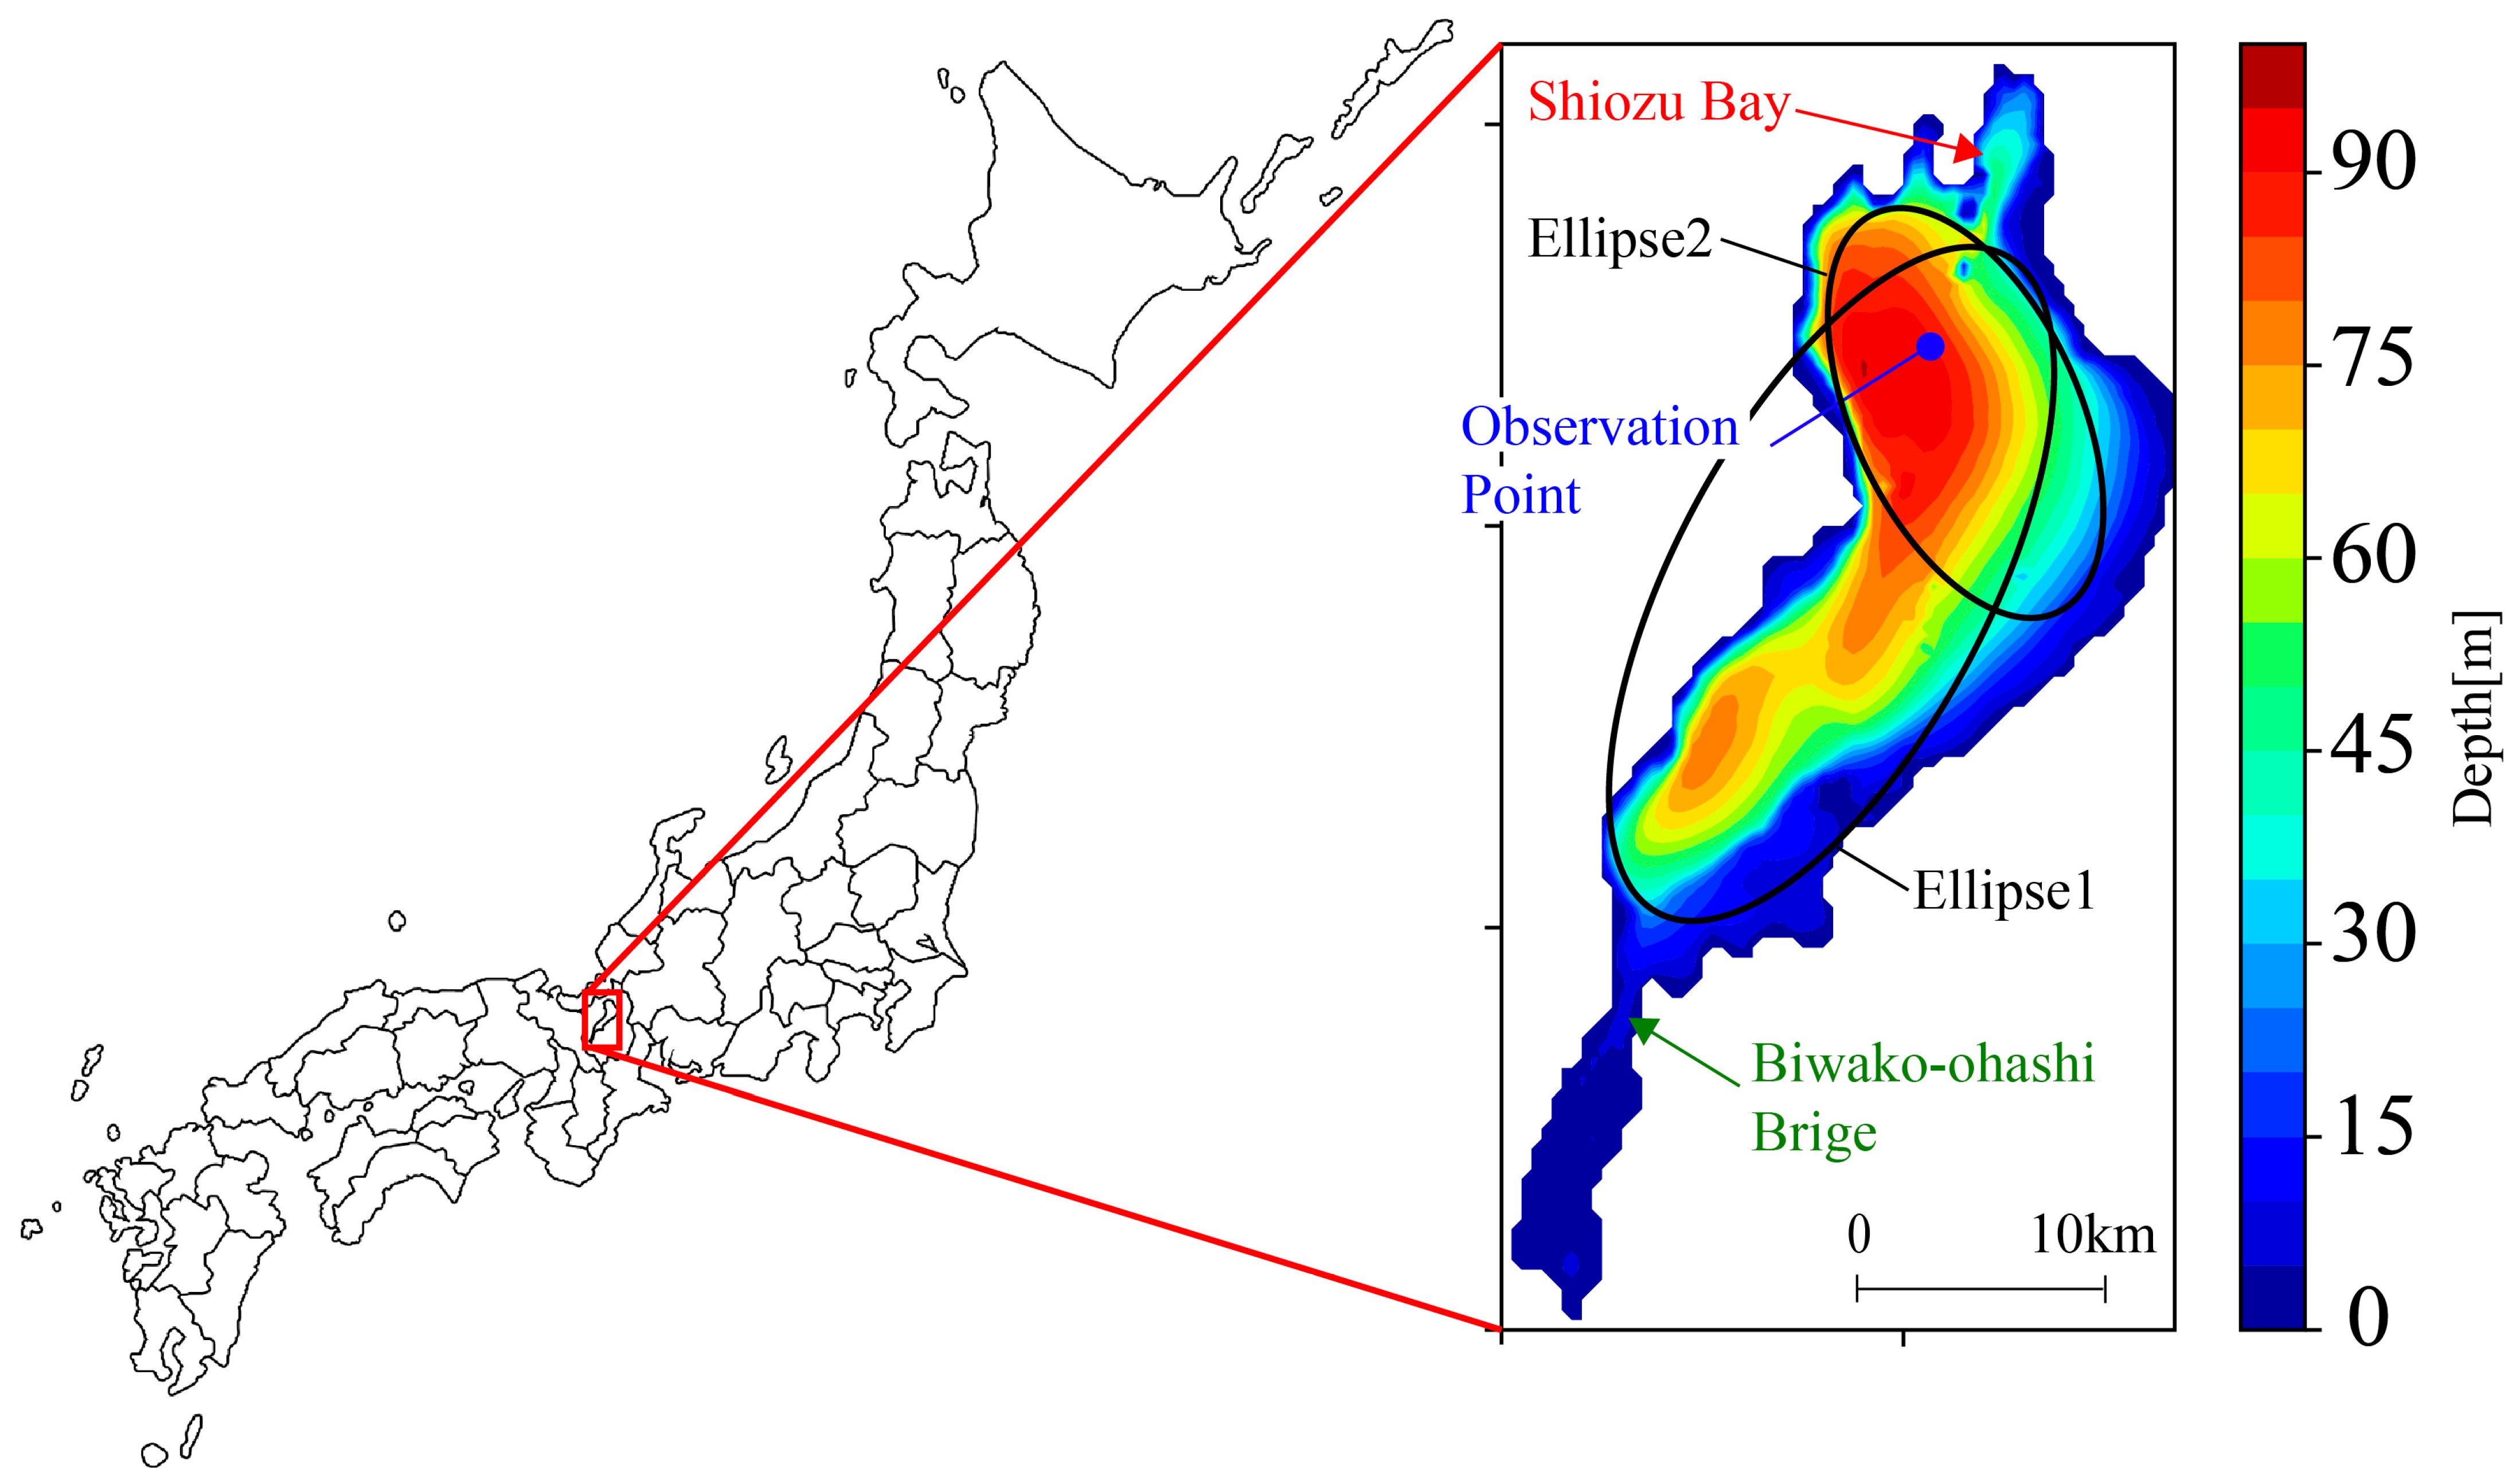
Figure 1. Bathymetry of Lake Biwa and ellipses for the theoretical solutions using a frequency equation. A blue circle indicates the observation.
Hydrology 12 00190 g001
Figure 2. Workflow diagram of the frequency equation [23,31].
Hydrology 12 00190 g002
Figure 3. Vertical profile of (a) water temperature and (b) DO by a water quality profiler from September to December 2018 and of (c) water temperature by a thermistor chain at the observation point from 27 September 2018 to 20 June 2019.
Hydrology 12 00190 g003
Figure 4. Time series of (a) wind speed along the major axis (positive and negative values correspond to the northern and southern wind, respectively), (b) specific density difference between the epilimnion and hypolimnion, (c) epilimnion thickness, and (d) Wedderburn number, from September 2018 to June 2019.
Hydrology 12 00190 g004
Figure 5. Spectrums of epilimnion thickness obtained from field observations in (a) October 2018, (b) November 2018, (c) December 2018, (d) May 2019, and (e) June 2019. Spectrums of wind speed in (f) October 2018, (g) November 2018, (h) December 2018, (i) May 2019, and (j) June 2019.
Hydrology 12 00190 g005
Figure 6. Time series of internal wave mode periods by a frequency equation for Ellipse 1 and Ellipse 2. Gray colors show the continuous wavelet transform of the wind speed.
Hydrology 12 00190 g006
Figure 7. Values of q i for Ellipse 1. The horizontal and vertical axes correspond to σ i 2 1 / S B 2 and ψ / . Black, orange, and green circles indicate Lake Erie in summer; Lake Biwa in December; and Lake Biwa in October, November, May, and June.
Hydrology 12 00190 g007
Table 1. Sizes of elliptical cylinders for Lake Biwa.
φ (=Semi-Major Axis)
(km)
ψ (=Semi-Minor Axis)
(km)
H (=Representative Depth)
(m)
Ellipse119.08.343.4
Ellipse211.97.266.6
Table 2. Observation dates for the water quality profiler and the period of spectral analysis.
Observation DatesSpectrum Analysis Period
27 September 2018(Excluded due to typhoon)
25 October 201822 October 2018–6 November 2018
21 November 20186 November 2018–21 November 2018
19 December 20188 December 2018–23 December 2018
10 January 2019(excluded)
20 February 2019(excluded)
14 March 2019(excluded)
23 May 201915 May 2019–30 May 2019
10 June 20192 June 2019–17 June 2019
Table 3. Solutions of the frequency equation for the elliptical cylinder for each month (values in parentheses are the corresponding field observation results).
DateModeEllipse1Ellipse2
Mode147.2 (61.1)27.6
25 OctoberMode214.4 (14.7)11.7 (11.8)
2018Mode38.5 (8.2)6.1 (6.3)
Mode46.85.1
Mode158.1 (73.3)34.5
21 NovemberMode215.9 (15.9)13.3 (13.3)
2018Mode310.1 (10.2)7.4 (7.5)
Mode48.26.2
Mode173.3 (92.0)51.0 (61.1)
19 DecemberMode218.1 (19.3)15.8 (15.9)
2018Mode313.3 (13.1)9.9 (9.2)
Mode411.38.4
Mode159.9 (61.1)38.8 (40.7)
23 MayMode216.1 (17.5)14.1 (15.3)
2019Mode310.4 (9.7)8.1
Mode48.5 (8.7)6.8 (6.4)
Mode152.3 (45.8)33.7 (30.6)
20 JuneMode215.2 (15.9)13.1 (13.1)
2019Mode39.2 (9.2)7.2 (7.0)
Mode47.5 (7.8)6.1 (5.9)
Table 4. Parameters of the theoretical solutions for Ellipse 1 and Ellipse 2 of Lake Biwa and those for the entire Lake Erie.
25 Oct.
2018
21 Nov.
2018
19 Dec.
2018
23 May
2019
20 June
2019
Lake Erie
Ellipse1 ψ / 0.4380.304
S B 0.2570.2070.1380.2000.2310.031
1 σ 1 S B −12.2−20.3−48.4−21.9−15.7−1051
q 1 −2.47−4.11−9.79−4.43−3.17−238
Ellipse2 ψ / 0.602
S B 0.4740.3870.2730.3480.395
1 σ 1 S B −1.91−4.24−11.2−5.86−3.94
q 1 −0.30−0.68−1.78−0.93−0.63
Table 5. Solutions of the frequency equations for an elliptical and circular cylinder (October).
Ellipse1Circle1Ellipse2Circle2
Mode147.242.327.626.2
Mode214.415.611.712.4
Mode38.59.26.16.2
Mode46.89.05.14.0
Disclaimer/Publisher’s Note: The statements, opinions and data contained in all publications are solely those of the individual author(s) and contributor(s) and not of MDPI and/or the editor(s). MDPI and/or the editor(s) disclaim responsibility for any injury to people or property resulting from any ideas, methods, instructions or products referred to in the content.