Article

A Comparative Analysis of Remotely Sensed and High-Fidelity ArcSWAT Evapotranspiration Estimates Across Various Timescales in the Upper Anthemountas Basin, Greece

1
School of Civil Engineering, Aristotle University of Thessaloniki, 54124 Thessaloniki, Greece
2
Department of Civil Engineering, Democritus University of Thrace, 67100 Xanthi, Greece
*
Author to whom correspondence should be addressed.
Hydrology 2025, 12(7), 171; https://doi.org/10.3390/hydrology12070171
Submission received: 29 April 2025 / Revised: 16 June 2025 / Accepted: 27 June 2025 / Published: 29 June 2025

Abstract

In data-scarce regions and ungauged basins, remotely sensed evapotranspiration (ET) products are increasingly employed to support hydrological model calibration. In this study, a high-resolution hydrological model was developed for the Upper Anthemountas Basin using ArcSWAT, with a focus on comparing simulated ET outputs to three freely available remote sensing-based ET products: the MODIS MOD16 Collection 5, the updated MODIS MOD16A2GF Collection 6.1, and the SSEBop Version 5 dataset. ET estimates derived from the calibrated SWAT model were compared to all remote sensing products at the basin scale, across various temporal scales over the 2002–2014 simulation period. Results indicate that the MOD16 Collection 5 product achieved the closest correspondence with SWAT-simulated ET across all temporal scales. The MOD16A2GF Collection 6.1 product exhibited moderate overall agreement, with improved performance during early summer. The SSEBop Version 5 dataset generally displayed weaker correlation, but demonstrated enhanced alignment during the driest years of the record. Strong correspondence is observed when averaging the ET values from all satellite products. These findings underscore the importance of exercising caution when utilizing remotely sensed ET products as the sole basis for hydrological model calibration, particularly given the variability in performance among different datasets.

1. Introduction

Evapotranspiration (ET) constitutes a principal component of the terrestrial water balance, governing not only the partitioning of incoming precipitation into runoff and subsurface flow but also exerting a fundamental control on soil moisture dynamics and groundwater recharge. An accurate representation of ET is therefore essential in hydrological modeling, as it serves as a critical link among the water, energy, and carbon cycles and regulates surface–atmosphere exchanges at multiple scales [1,2].
In recent years, freely available satellite-derived ET products (e.g., MODIS ET products, GLEAM, WaPOR, ALEXI, TerraClimate, SSEBop) have emerged as vital tools for enhancing the calibration of hydrological models, such as the SWAT (Soil and Water Assessment Tool) model. These products are employed either as supplementary information alongside observed streamflow data or, in the context of fully ungauged basins, as the principal calibration targets. With regard to the former case, Rientjes et al. [3] found that supplementing streamflow data with MODIS ET improved both runoff and soil moisture simulations in a humid tropical catchment. Tobin and Bennett [4] showed that regulating the hydrological model with MOD16 ET tightened parameter ranges and mitigated systematic biases, relative to flow-only calibration. Rajib et al. [5] reported that spatially explicit calibration using remotely sensed ET and biophysical parameters significantly elevated model predictability within a large watershed in the Prairie Pothole Region of the United States. Parajuli et al. [6] demonstrated that SEBAL and MODIS-based ET data effectively captured seasonal ET peaks in semi-arid watersheds when used in calibration, while Herman et al. [7] similarly illustrated that blending multiple ET products (MODIS, SSEBop, GLEAM) lowered forecast errors during high evaporative demand periods. Sirisena et al. [8] applied joint calibration with streamflow and remote sensing ET in a data-poor Australian basin, achieving more realistic hydrograph recession and baseflow dynamics. Dile et al. [9] evaluated SSEBop, MOD16, and GLEAM ET and showed that, after bias correction, SSEBop ET estimates could reliably support water balance closure in data-scarce Ethiopian watersheds.
Moreover, Shah et al. [10] demonstrated that multivariate calibration with both MODIS and ALEXI ET reshaped optimal parameter sets and improved seasonal runoff and ET dynamics, while Sun et al. [11] introduced a two-phase approach, in which calibrating vegetation parameters with ET before adjusting against discharge enhanced parameter identifiability and overall predictive skill. More recently, Bennour et al. [12] achieved robust seasonal water balance simulations in the Lake Chad Basin by assimilating ET and soil moisture observables, while Alemayehu et al. [13] combined streamflow signatures with ET to reduce uncertainty and enhance spatial realism in poorly gauged Ethiopian basins. Parajuli et al. [14] found that, while the model developed using SWAT reproduced seasonal ET variability well, satellite products resolved finer intra-monthly fluctuations, whereas Koltsida and Kallioras [15] confirmed that a multi-variable calibration incorporating ET and discharge improves the model performance in Mediterranean catchments. Finally, Dangol et al. [16] demonstrated that a multivariate framework integrating ET, leaf area index, and surface temperature further tightens parameter uncertainty and elevates model fidelity across diverse land use conditions.
On the contrary, only a limited number of studies utilized satellite-derived ET as the sole criterion for calibrating hydrological models. For example, Immerzeel and Droogers [17] showed that SWAT can be effectively calibrated in data-scarce regions using a time series of MODIS-derived ET. Optimal model performance was achieved by jointly tuning soil, meteorological, and groundwater parameters over an eight-month subbasin ET record. Verma [18] applied SWAT calibration using MODIS ET in the Sirsa River Basin, demonstrating robust reproduction of seasonal hydrographs under Western Himalayan conditions. Odusanya et al. [19] successfully employed ET time series from three satellite products to perform multisite SWAT calibration and validation in southwestern Nigeria, despite sparse gauging networks. Collectively, these studies emphasize the capability of remotely sensed ET products to serve as effective supplements or, in some cases, substitutes for traditional streamflow data in the calibration of hydrological models.
Despite these advances, questions remain regarding the temporal consistency and relative performance of different ET products when aligned against a well-calibrated hydrological model. In the literature, two primary concerns are identified. First, hydrological model calibration often depends on a single streamflow gauge, which may fail to capture spatial variability in ET across heterogeneous land cover and microclimates [8,20,21]. Second, substantial discrepancies among ET products can lead to divergent water balance outcomes, with implications for water allocation, runoff, and drought forecasting and ecosystem management in Mediterranean catchments where evaporative demand is high [1,22].
In this context, the present study aims to quantify the temporal concordance of remotely sensed and high-fidelity ArcSWAT-simulated actual evapotranspiration (AET) (henceforth referred to as evapotranspiration, ET, for simplicity) time series in the Upper Anthemountas Basin, Greece. Specifically, it examines monthly averages, seasonal totals, and annual sums over an 11-year (2004–2014) simulation period. Furthermore, the reliability of this comparison hinges on the use of a detailed, high-resolution SWAT model, which integrates a fine-grained Digital Elevation Model (DEM), a finely stratified soil texture map, and precise land cover classifications. High-precision and fine-resolution input data enhance the representation of watershed characteristics and facilitate a more accurate simulation of local hydrologic responses to topographic complexity, soil heterogeneity, and vegetation dynamics, thus improving the modeling of spatially distributed processes (i.e., runoff generation, nutrient transport) [23,24,25]. Using such data also increases the likelihood of accurate model calibration and reduces predictive uncertainty [23,26,27], thereby providing a robust basis for the comparative assessment of satellite-derived ET estimates. Ultimately, this study seeks to clarify the strengths and limitations of current remote sensing ET products in representing modeled ET dynamics, providing insights for incorporating satellite data into robust hydrological model calibration strategies.

2. Materials and Methods

2.1. Study Area

The Upper Anthemountas Basin is part of the entire Anthemountas Basin, located in Chalkidiki Peninsula, Greece, to the southeast of the city of Thessaloniki (Figure 1). Encompassing an area of approximately 110 km2, it is a semi-mountainous basin that borders to the west with the Lower Anthemountas Basin and to the south with the Nea Moudania Basin. A few notable geomorphological properties of the basin are provided in Table 1.
The study area is a rural region with a varied landscape, primarily composed of mixed forests and cultivated land, which together make up 93% of the total area [25,28]. Agriculture is the dominant economic activity, while livestock activities partially contribute to the economic development of the area as well. Agricultural zones, covering 46% of the total area, exhibit complex patterns of wheat, corn, cotton, alfalfa, and olive cultivation, along with a scarce number of orchard and vegetable parcels [29]. On the other hand, forests largely occupy the north and south side of the basin and consist of various evergreen scrub oak species, such as Kermes oak (Quercus coccifera) and holm oak (Quercus ilex), combined with woody dense shrublands of Mediterranean woundwort (Stachys cretica) and conehead thyme (Thymus capitatus). This particular type of mixed shrubland biome, commonly known as “Maquis”, “Macchia”, or “Macchie”, is distinctively unique and predominantly found in the Mediterranean region. Deciduous trees of Hungarian oak (Quercus frainetto) dominate the western part of the basin. Plane trees (Platanus) are encountered alongside the main channel river banks, while a few chestnut and pine trees are also found scattered within the basin [30]. In total, woody vegetation (forest trees and shrub ecosystems) accounts for the largest proportion of land cover in the study area (47%). Various types of grasslands, comprising only 3% of the total area, are dispersed throughout the watershed, mainly consisting of “Bromus squarrosus”, a species of brome grass. Lastly, a few limited areas (1%) of abandoned magnesite mines are sprinkled within the catchment.
In terms of geology, the region is intricate, featuring a wide array of sediments (clay and marl with intercalated hard-grained materials, such as sands, conglomerates, and sandstones), intermixed with fractured igneous and metamorphic rocks that include epigneisses, greenschists, dunites, and peridotites [25,31]. Soil formation in the study area mirrors the spatial variability of parent materials, reflecting the basin’s complex geology. According to Misopolinos et al. [32], Inceptisols are the predominant soil order, followed by Vertisols, with lesser contributions from Alfisols and Entisols. Regarding soil texture, medium texture soils (loams and sandy clay loams), along with heavier soils (clay loams) dominate the central and southern part of the watershed, while coarser soils (sandy loams) cover, for the most part, the northern part of the basin, but are also found scattered all over the area [30].
The climate of the study area is typically Mediterranean, and the weather pattern is characterized by high temperatures during summer and relatively low annual precipitation (470 mm) [25,31]. Based on various climate indexes that were applied on the reference area (e.g., Pinna, De Martonne, Emberger, Daget), the Upper Anthemountas Basin can be classified, on average, as “Semi-Dry Mediterranean” [30]. From a hydrological perspective, the catchment features a dense and well-developed stream network [25,29], culminating in a fifth-order stream as classified by the Strahler method (Figure 1) [30]. Nevertheless, throughout most of the year, the stream’s flow is minimal, which can be attributed to low precipitation and to the semi-permeable nature of certain upper geological and soil layers. Consequently, noticeable surface outflows on the stream occur only briefly, mainly following periods of intense rainfall [25,29].

2.2. General Methodological Framework

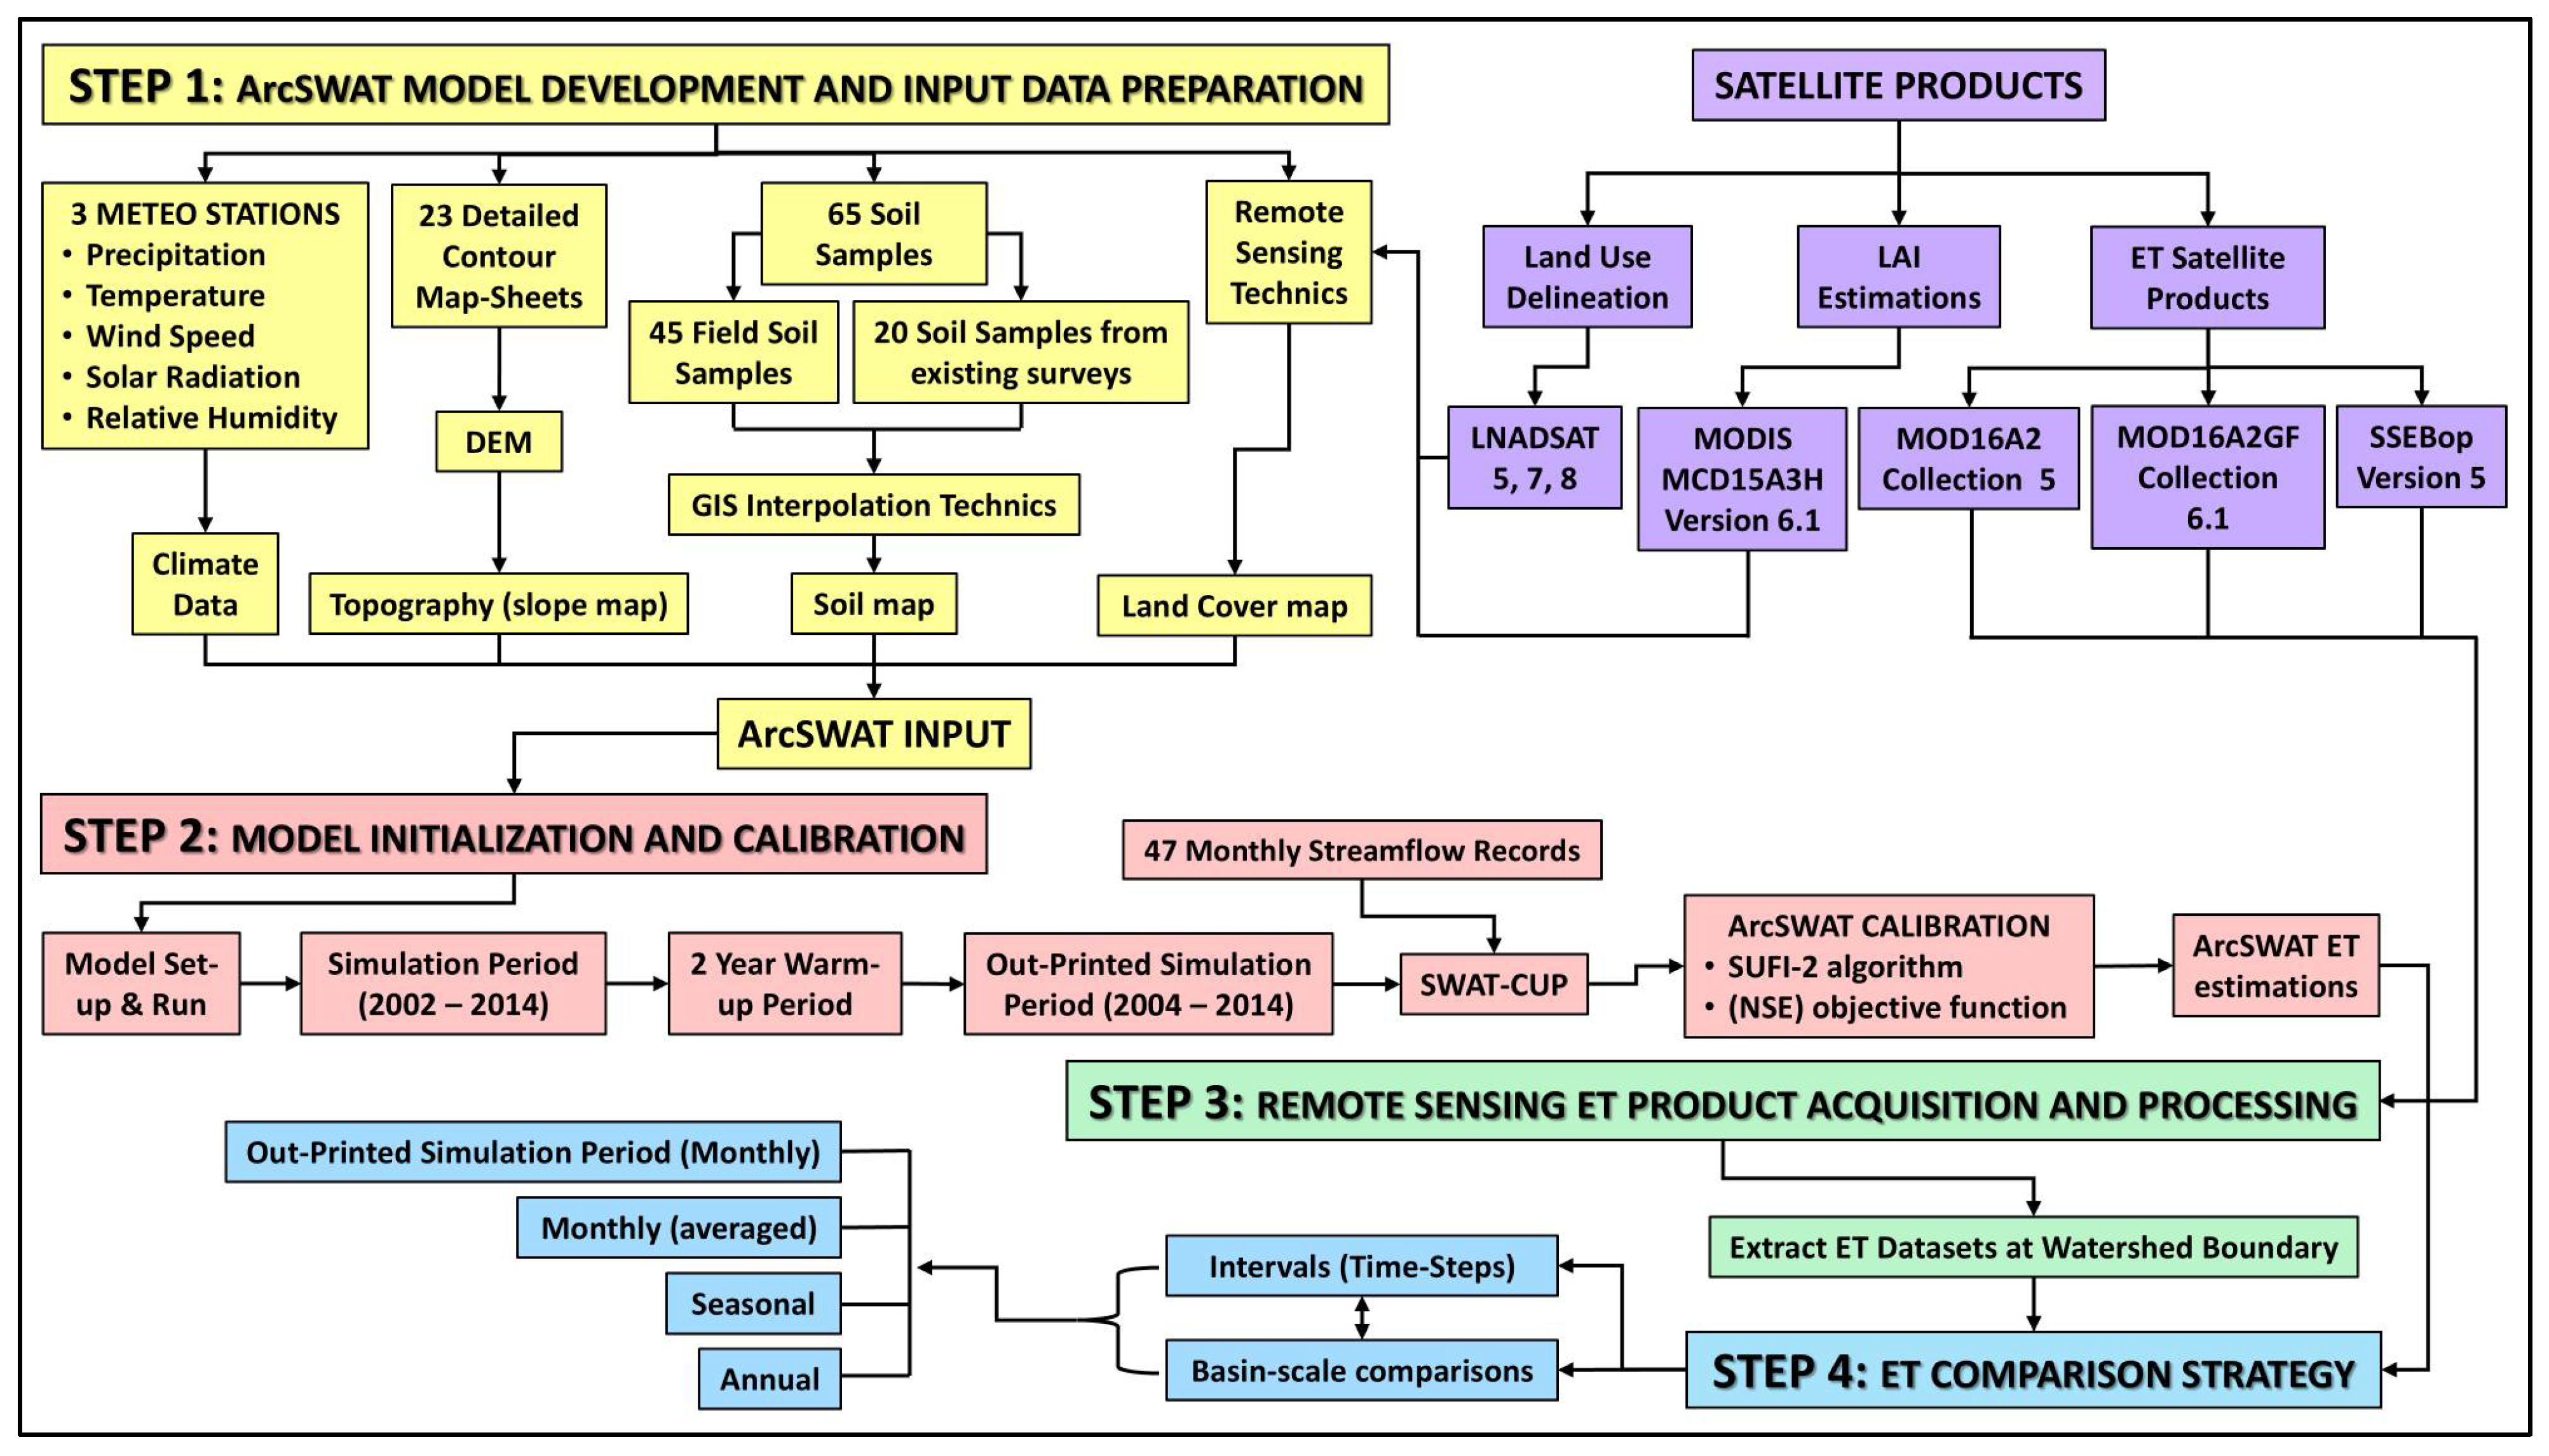
The methodology adopted in this study comprises a sequence of four (4) well-defined and logically structured steps. These steps are designed to support the development and calibration of a robust and transparent hydrological model, as well as to facilitate a systematic comparison between the simulated ET outputs and remotely sensed ET estimates. The complete approach is illustrated in Figure 2 and outlined below.
  • Step 1: Hydrological Model Development and Input Data Preparation.
The hydrological model for the study area was constructed using the SWAT framework and refined through the integration of high-resolution spatial datasets, alongside comprehensive field and laboratory measurements. Specifically, the topographic input includes a DEM derived from detailed contour maps, while climate data were sourced from three (3) local meteorological stations. Soil information was compiled through extensive field sampling and supplemented by existing surveys, with key physical properties measured and interpolated to generate a spatially detailed distributed soil map. Land use classification was achieved through the integration of high-resolution satellite imagery, official forest maps, and remote sensing techniques to refine vegetation-related parameters within the model.
  • Step 2: Model Initialization and Calibration.
A two-year warm-up run established equilibrium conditions for soil moisture and groundwater storage, while the overall simulation period expanded from 2002 to 2014. The calibration process employed forty-seven (47) monthly streamflow records and focused on optimizing key hydrological parameters. Due to the limited number of observations, all available data were used for calibration, and validation was omitted. The SUFI-2 algorithm within SWAT-CUP was utilized, and the Nash–Sutcliffe Efficiency (NSE) criterion was selected as the objective function, thereby ensuring robust capture of the hydrological component.
  • Step 3: Remote Sensing ET Product Acquisition and Processing.
Three (3) gridded freely available ET datasets were selected to be compared against the model outputs: (i) the MOD16A2 Collection 5 product at 1 km resolution; (ii) the MOD16A2GF Collection 6.1 product at 500 m resolution; and (iii) the SSEBop Version 5 product at 1 km resolution. Each product was clipped to the watershed boundary and spatially averaged to derive basin-scale mean ET time series, ensuring consistency with the SWAT aggregation scale. This basin-wide comparison approach was selected for two main reasons: (a) the relatively small watershed size (~110 km2); and (b) the goal of ensuring uniformity and simplifying the analysis, as well as to enhance computational efficiency. By focusing on the watershed boundaries, the analysis was streamlined, ensuring manageable processing times while maintaining the spatial relevance of the results.
  • Step 4: ET Comparison Strategy.
Comparisons between SWAT-simulated ET and satellite-derived products were conducted at monthly (averaged), seasonal, and annual intervals, as well as over the entire simulation period at a monthly time step, in order to capture the overall temporal dynamics of ET.

2.3. Performance Evaluation Metrics

Various statistical efficiency metrics were implemented in this research, including RMSE, R2, bR2, NSE, MNS, SRS, KGE, and PBIAS (Table 2) [33,34,35,36]. Of the aforementioned indices, RMSE was adopted for evaluating the DEM created as an input for the hydrological model, whereas the rest were utilized during the model calibration procedure for assessing its performance.
Moreover, KGE, PBIAS, RMSE, and RSR were employed for analyzing the performance of remotely sensed ET data in relation to SWAT-derived ET estimates. The rationale for applying this set of four (4) metrics is that, collectively, they encompass multiple dimensions of model performance, particularly in the context of ET comparisons, since (a) KGE combines three (3) key evaluation aspects into a single metric, that is, correlation, bias, and variability [37]; (b) PBIAS isolates a model’s tendency to consistently overestimate or underestimate ET [33], and, when applied alongside KGE, aids in identifying whether strong overall performance (e.g., a high KGE value) may obscure systematic errors; (c) RMSE quantifies absolute errors; and, finally, (d) RSR normalizes these errors relative to data variability [33], which is particularly useful when ET values vary widely.

2.4. Hydrological Model Development

2.4.1. Description of the SWAT Model

The Soil and Water Assessment Tool (SWAT) is a hydrologic and water quality model developed by the United States Department of Agriculture, Agricultural Research Service (USDA-ARS) [38]. It is a physically based, semi-distributed model that operates on a continuous time scale with a daily or sub-hourly time step. The primary objective of the model is to forecast the impact of land management practices on water, sediment, and agricultural chemical yield at a river basin scale for various periods of time. In SWAT, the simulation of all hydrologic processes occurring in the basin is established upon the fundamental water balance equation (Equation (1)).
S W t = S W 0 + i = 1 t ( R d a y Q s u r f E T d a y W d a y Q g w )
where t is the simulation period, SWt is the final soil water content (mm), SW0 is the initial soil water content (mm), and Rday, Qsurf, ETday, Wday, and Qgw represent daily values (mm) for precipitation, runoff, evapotranspiration, infiltration, and groundwater flow, respectively.
In terms of spatial analysis, the watershed is partitioned into several subbasins, which are, in turn, subdivided into specific segments named Hydrologic Response Units (HRUs) that are defined by homogeneous soil properties, land use patterns, and slope attributes. Then, the water balance equation is utilized at each HRU and, thus, the water cycle components (i.e., runoff, infiltration, ET) are computed at the HRU level. Finally, results from all HRUs within a subbasin are aggregated to depict the overall water budget of each individual subbasin, before being routed through the entire basin from upstream subbasins to the watershed outlet [39].
SWAT model can be incorporated into a GIS environment, such as QGIS (QSWAT) and ArcGIS (ArcSWAT), thus rendering hydrologic simulations at the watershed scale far more intuitive. In this research, ArcSWAT 2012 (as an ArcGIS extension tool) was applied for delineating the water budget in the Upper Anthemountas Basin.
The model’s requisite spatial and attribute data are classified into four (4) principal categories: (1) topography (DEM); (2) land cover; (3) soil; and (4) climate data. Among these, climate data constitute a vital input parameter, since their precision is paramount for the accurate simulation of the water budget [25,40,41]. The climate data incorporated into the model encompass measurements of precipitation, temperature, relative humidity, wind speed, and solar radiation. Moreover, depending on the accessibility of weather data, users may select from one of three evapotranspiration methods. Those are as follows: (a) the Hargreaves method, which incorporates mean min and max daily temperature; (b) the Priestly–Taylor method, which demands mean min and max daily temperature, mean daily humidity and solar radiation; and (c) the Penman–Monteith method, which requires mean min and max daily temperature, mean daily humidity and solar radiation, as well as mean daily wind speed [42].
With regard to land use, SWAT accommodates a default database that contains an extensive list of predefined land use and land cover categories, which facilitates users in classifying different land types for hydrological modeling [42,43]. This database includes land use codes, descriptions, and associated parameters that affect processes like surface runoff, infiltration, evapotranspiration, and erosion. When users introduce a land cover map, they match the land cover classes to SWAT’s predefined codes. Then, the model assigns hydrological properties based on the default database. In case the default database does not fully represent the land cover observed in the study area, modelers have the option to modify the land use table by altering custom parameter values of existing land use types or even expand the table by adding new land cover types and new parameter values [42].
Finally, the soil data required by the SWAT model represent the most demanding category of input information, as they embody an extensive array of parameters that designate the physical properties of the various soil types that cover the study area. More specifically, the essential soil parameters include the soil texture (expressed as proportions of sand, silt, clay and rock fragments), organic carbon content (OC), bulk density (BD), available water capacity (AWC), saturated hydraulic conductivity (Ks), the soil hydrologic group (HYDGRP), albedo, and the soil erosion factor (USLE-K) [42].

2.4.2. Model Input Data Preparation

For the present study, an exceptionally comprehensive hydrological model was assembled by integrating and implementing high-quality measured data and high spatial resolution data (with grid cells 5 × 5 m) of topography, land cover, and soil features into SWAT. Details concerning the input data information applied to the SWAT model are presented in Table 3.
It should be noted that the generation of detailed soil and land use maps, which serve as inputs for the SWAT model, was a rather exhausting and rigorous process that extends beyond the scope of this research. Consequently, only a brief overview of their production is presented. Moreover, all GIS-based operations (such as digitization, interpolation) and satellite image processing were executed using the appropriate tools within the ArcGIS 10.5 platform.
Climate Data
Climate data presented a considerable challenge due to the limited number of operational meteorological stations within the study area. All available stations with continuous records were incorporated into the model to ensure optimal utilization of the existing climatic observations. In greater detail, two (2) primary weather stations provided the data required for SWAT. Within the study area, only a single station is located (Galatista station) (coordinates, X: 438,375, Y: 4,480,142), which, unfortunately, does not yield a satisfactory time series of recorded data. To be precise, the station effectively operated from 2005 to 2011. However, during this period, the cataloged time series were not continuous and exhibited significant month-long gaps. Notwithstanding, the available data from this station were utilized, as it constitutes the sole station within the basin under study.
Furthermore, another important weather post, the National Agricultural Research Foundation (NAGREF) station, is situated close to the study area, approximately 15 km from the center of the Upper Anthemountas Basin (coordinates, X: 421,897, Y: 4,484,442). The available recorded data from this station were primarily utilized in this study, since the meteorological unit: (a) represents the closest weather observatory to the study area; and (b) produces fairly comprehensive and reliable time series, displaying day-long to, rarely, week-long and month-long gaps. Additionally, a third weather unit maintained by the Aristotle University of Thessaloniki (AUTH station) also offers reliable data, although it is situated somewhat further from the study area (roughly 30 km) (coordinates, X: 410,690, Y: 4,498,110). Ultimately, taking into account all the available weather data, the daily time series employed in the SWAT model spans from 1 January 2002 to 31 December 2014. For this timeframe, data from both the Galatista station and the NAGREF station were combined. Both stations provide data pertaining to precipitation, temperature, relative humidity, wind speed, and solar radiation, parameters that are vital for building the hydrological model. Moreover, any gaps observed in the registered measurements of the aforementioned two (2) stations were supplemented by incorporating data from the AUTH station (primarily solar radiation). In Table 4, values of mean annual precipitation, temperature, relative humidity, wind speed, and solar radiation from 2002 to 2014, as estimated using data from all the aforementioned stations, are provided.
Topography (DEM)
The initial stage of the ArcSWAT model setup involves the incorporation of a DEM, which serves as the basis for watershed delineation. During this process, the model analyzes the terrain to define the watershed boundary, extract the stream network, identify outlet points, and divide the area into subbasins based on flow direction and accumulation patterns. The resulting delineation establishes the spatial foundation upon which all subsequent components of the model are built, including the integration of land use, soil, and slope characteristics in later stages of the setup.
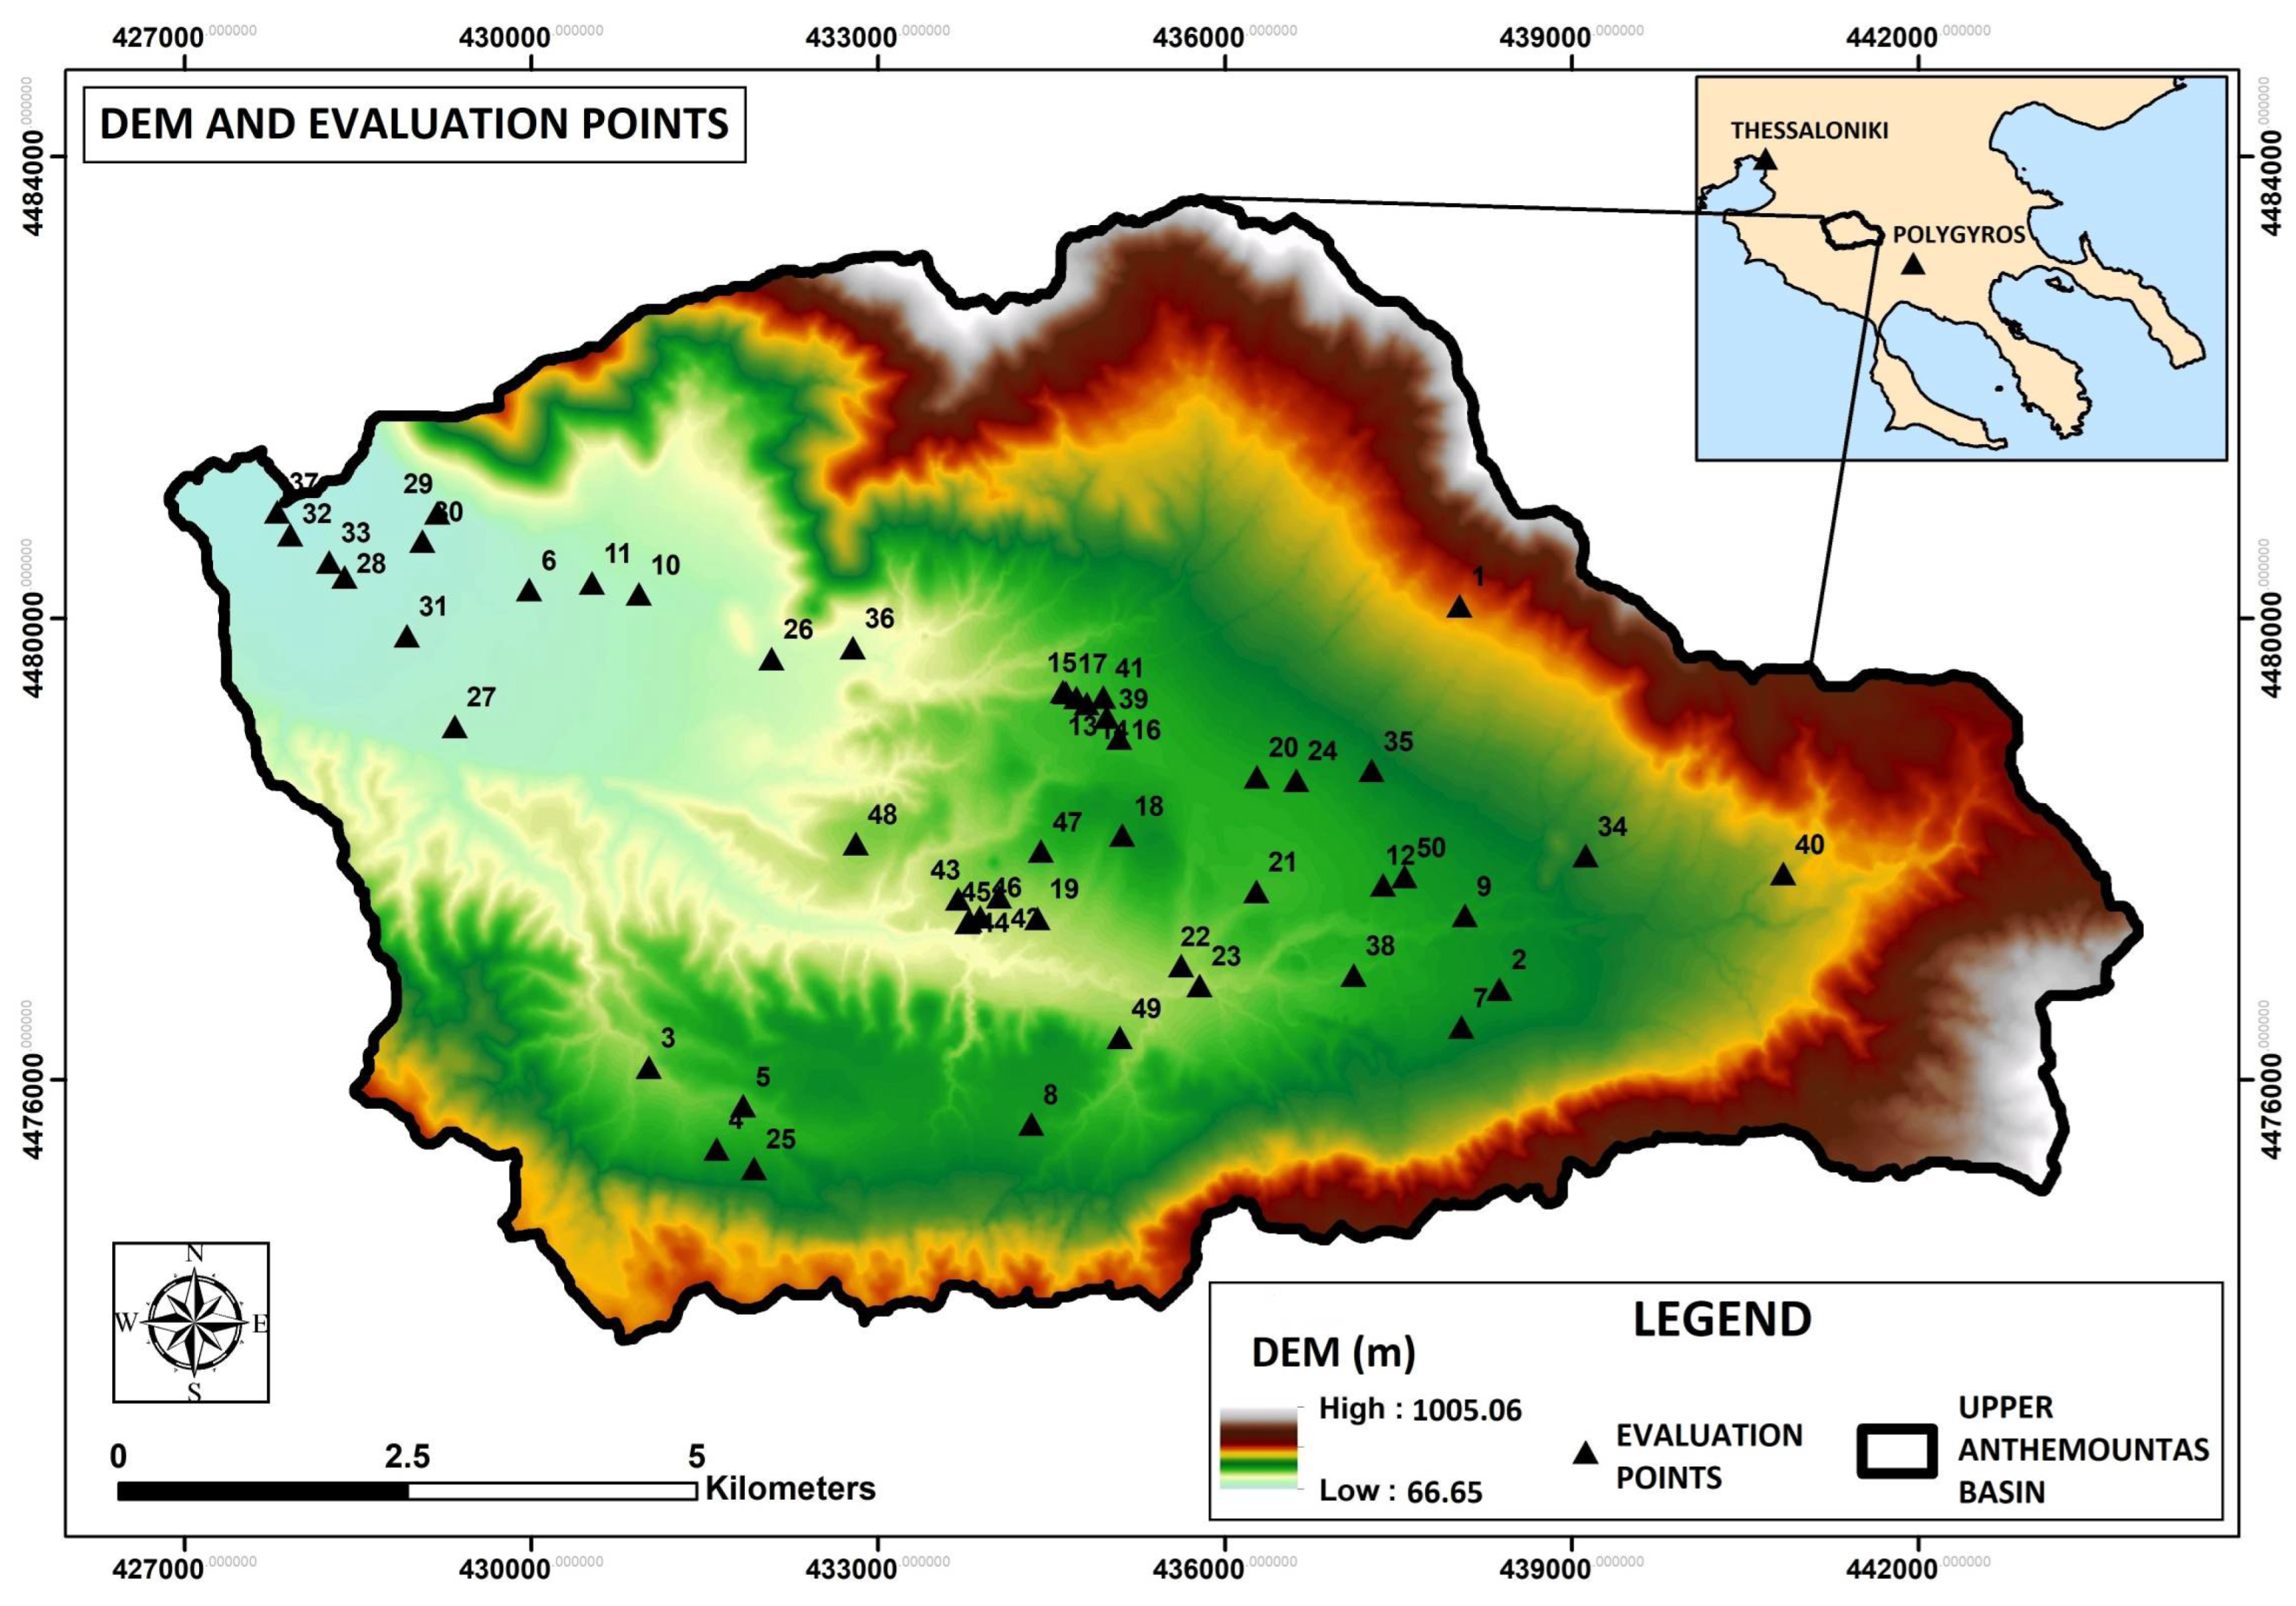
Therefore, in order to create a high-quality DEM as input for the model (Figure 3), the following two (2) steps were taken.
(1) First, a digital mosaic of twenty-three (23) Hellenic Military Geographical Service (HMGS) contour map sheets (scale 1:5000) that cover the entire basin was created. The mosaic was georeferenced in the Greek coordinate system GGRS87.
(2) Then, the contours of this mosaic (4 m interval) were digitized, and a high-quality DEM with a 5 × 5 m cell size grid was produced. For the verification and evaluation of the generated DEM, elevations from fifty (50) points scattered within the study area (Figure 3) were utilized, which were obtained using a high-precision GPS device (STONEX S900A–SE GNSS Receiver). The RMSE was employed as an evaluation statistic metric, since, as attested by Wise [44], “it is the most commonly applied measure of DEM quality and the one published by data suppliers”. A value of RMSE = 0.892 m was obtained, indicating an overall excellent quality of the produced DEM.
Upon the introduction of the DEM into ArcSWAT, the delineation process was conducted, resulting in the subdivision of the watershed into seventeen (17) hydrologically distinct subbasins. Furthermore, the stream network previously illustrated in Figure 1 was generated, while various topographic features of the basin, previously presented in Table 1, were derived from the watershed delineation report.
Land Cover
The development of an accurate land cover map of the study area was a rigorous process and can be briefly summarized in the following three (3) steps:
(1) Initially, all land covers in the study area that are assumed to be constant over time (i.e., forests, residential areas, olive groves, grasslands, barren land, and limited extents of abandoned mines) were delineated.
(2) Then, the irrigated crops were distinguished from the non-irrigated crops within the study area.
(3) Finally, the different types of irrigated crops were discriminated.
Regarding the first step, a high-resolution satellite natural color image with a 0.6 × 0.6 m cell size was acquired. Urban settlements, barren land, and abandoned magnesite mines, along with olive orchards and scattered small-scale grassland sites, were delineated based on this image. These land classes were also identified through multiple on-site inspections. The forested areas were extracted based on the ratified forest maps provided by the Hellenic Cadastre (https://gis.ktimanet.gr/gis/forestfinal, accessed on 31 May 2020).
On the other hand, it is crucial to define the cultivated land in the study area, which includes non-irrigated or partially irrigated crops (mainly wheat) and irrigated crops, involving maize (corn), alfalfa, and cotton. For this purpose, satellite imagery from the year 2008 was utilized. The selection of this particular year was based on the following considerations: (a) satellite data needed to fall within the overall simulation period, which spans from 2002 to 2014; (b) satellite images were required to have less than 10% cloud cover and be sufficient in quantity, particularly during the summer months, when irrigated crops reach peak vegetative development (in contrast to non-irrigated cereals) and are easily distinguishable due to high chlorophyll activity; and (c) satellite images had to be acquired at a sufficient temporal distance from rainfall events to minimize the effects of short-term vegetation responses in rain-fed crops.
Considering all the above, the year 2008 satisfies adequately all the aforementioned conditions concerning the available satellite images. However, although it is relatively easy to distinguish irrigated from non-irrigated crops within the study area, differentiating between various irrigated crops is more challenging and requires the application of remote sensing techniques. Therefore, satellite images from the year 2019 were initially examined, as prior knowledge of specific irrigated crops for that period was available. The objective was to investigate the spectral behavior of these crops and subsequently apply the findings to the year 2008. In this regard, eight (8) Landsat 8 images (Collection 2, Level 2—C2L2) acquired between June and September 2019 were utilized. In comparison, six (6) Landsat 5 images (Collection 1, Level 1—C1L1, and Collection 2, Level 2—C2L2) acquired between July and September 2008, along with two (2) Landsat 7 images (C1L1 and C2L2) from June and July 2008, were also obtained. All images were retrieved through the USGS EarthExplorer platform (https://earthexplorer.usgs.gov/, accessed on 29 July 2020).
The remote sensing methods derived from the literature and applied to differentiate between irrigated and non-irrigated crops, as well as to identify all types of irrigated crops (for both years 2019 and 2008) and for all Landsat 5, 7, and 8 images, are as follows.
(1) Color Composites, which involve the combination of three (3) spectral bands from satellite imagery, assigned to the three (3) primary display colors, that is, Red, Green, and Blue (RGB), so as to generate composite images. Specifically, a false color composite was applied using the band combination RGB of 6,5,4 for Landsat 8 images, while RGB of 5,4,3 was applied for Landsat 5 and 7 images. This configuration is suitable for agricultural studies and vegetation analysis [45,46]. In this composite, healthy vegetation appears in shades of green, while bare soils (or plowed crops) are typically represented in magenta tones.
(2) The Tasseled Cap Transformation (TCT), which produces three (3) primary components [47]: the Brightness index, associated with soil reflectance, the Greenness index, related to vegetation vigor (chlorophyll content), and the Wetness index, indicative of soil and vegetation moisture. In essence, the TCT is an orthogonal transformation that computes these three (3) components by applying specific linear equations to a combination of six (6) Landsat bands. The coefficients used in the TCT differ for each of the components as well as for each Landsat satellite and its product versions (Collections and Levels). Further details can be found in Crist and Kauth [48] for Landsat 5, Huang et al. [49] for Landsat 7, and Baig et al. [47] for Landsat 8.
(3) A composite image was also generated from TCT components, with RGB of Brightness, Greenness, Wetness, in order to distinguish the highest content of water and the lowest soil moisture [50].
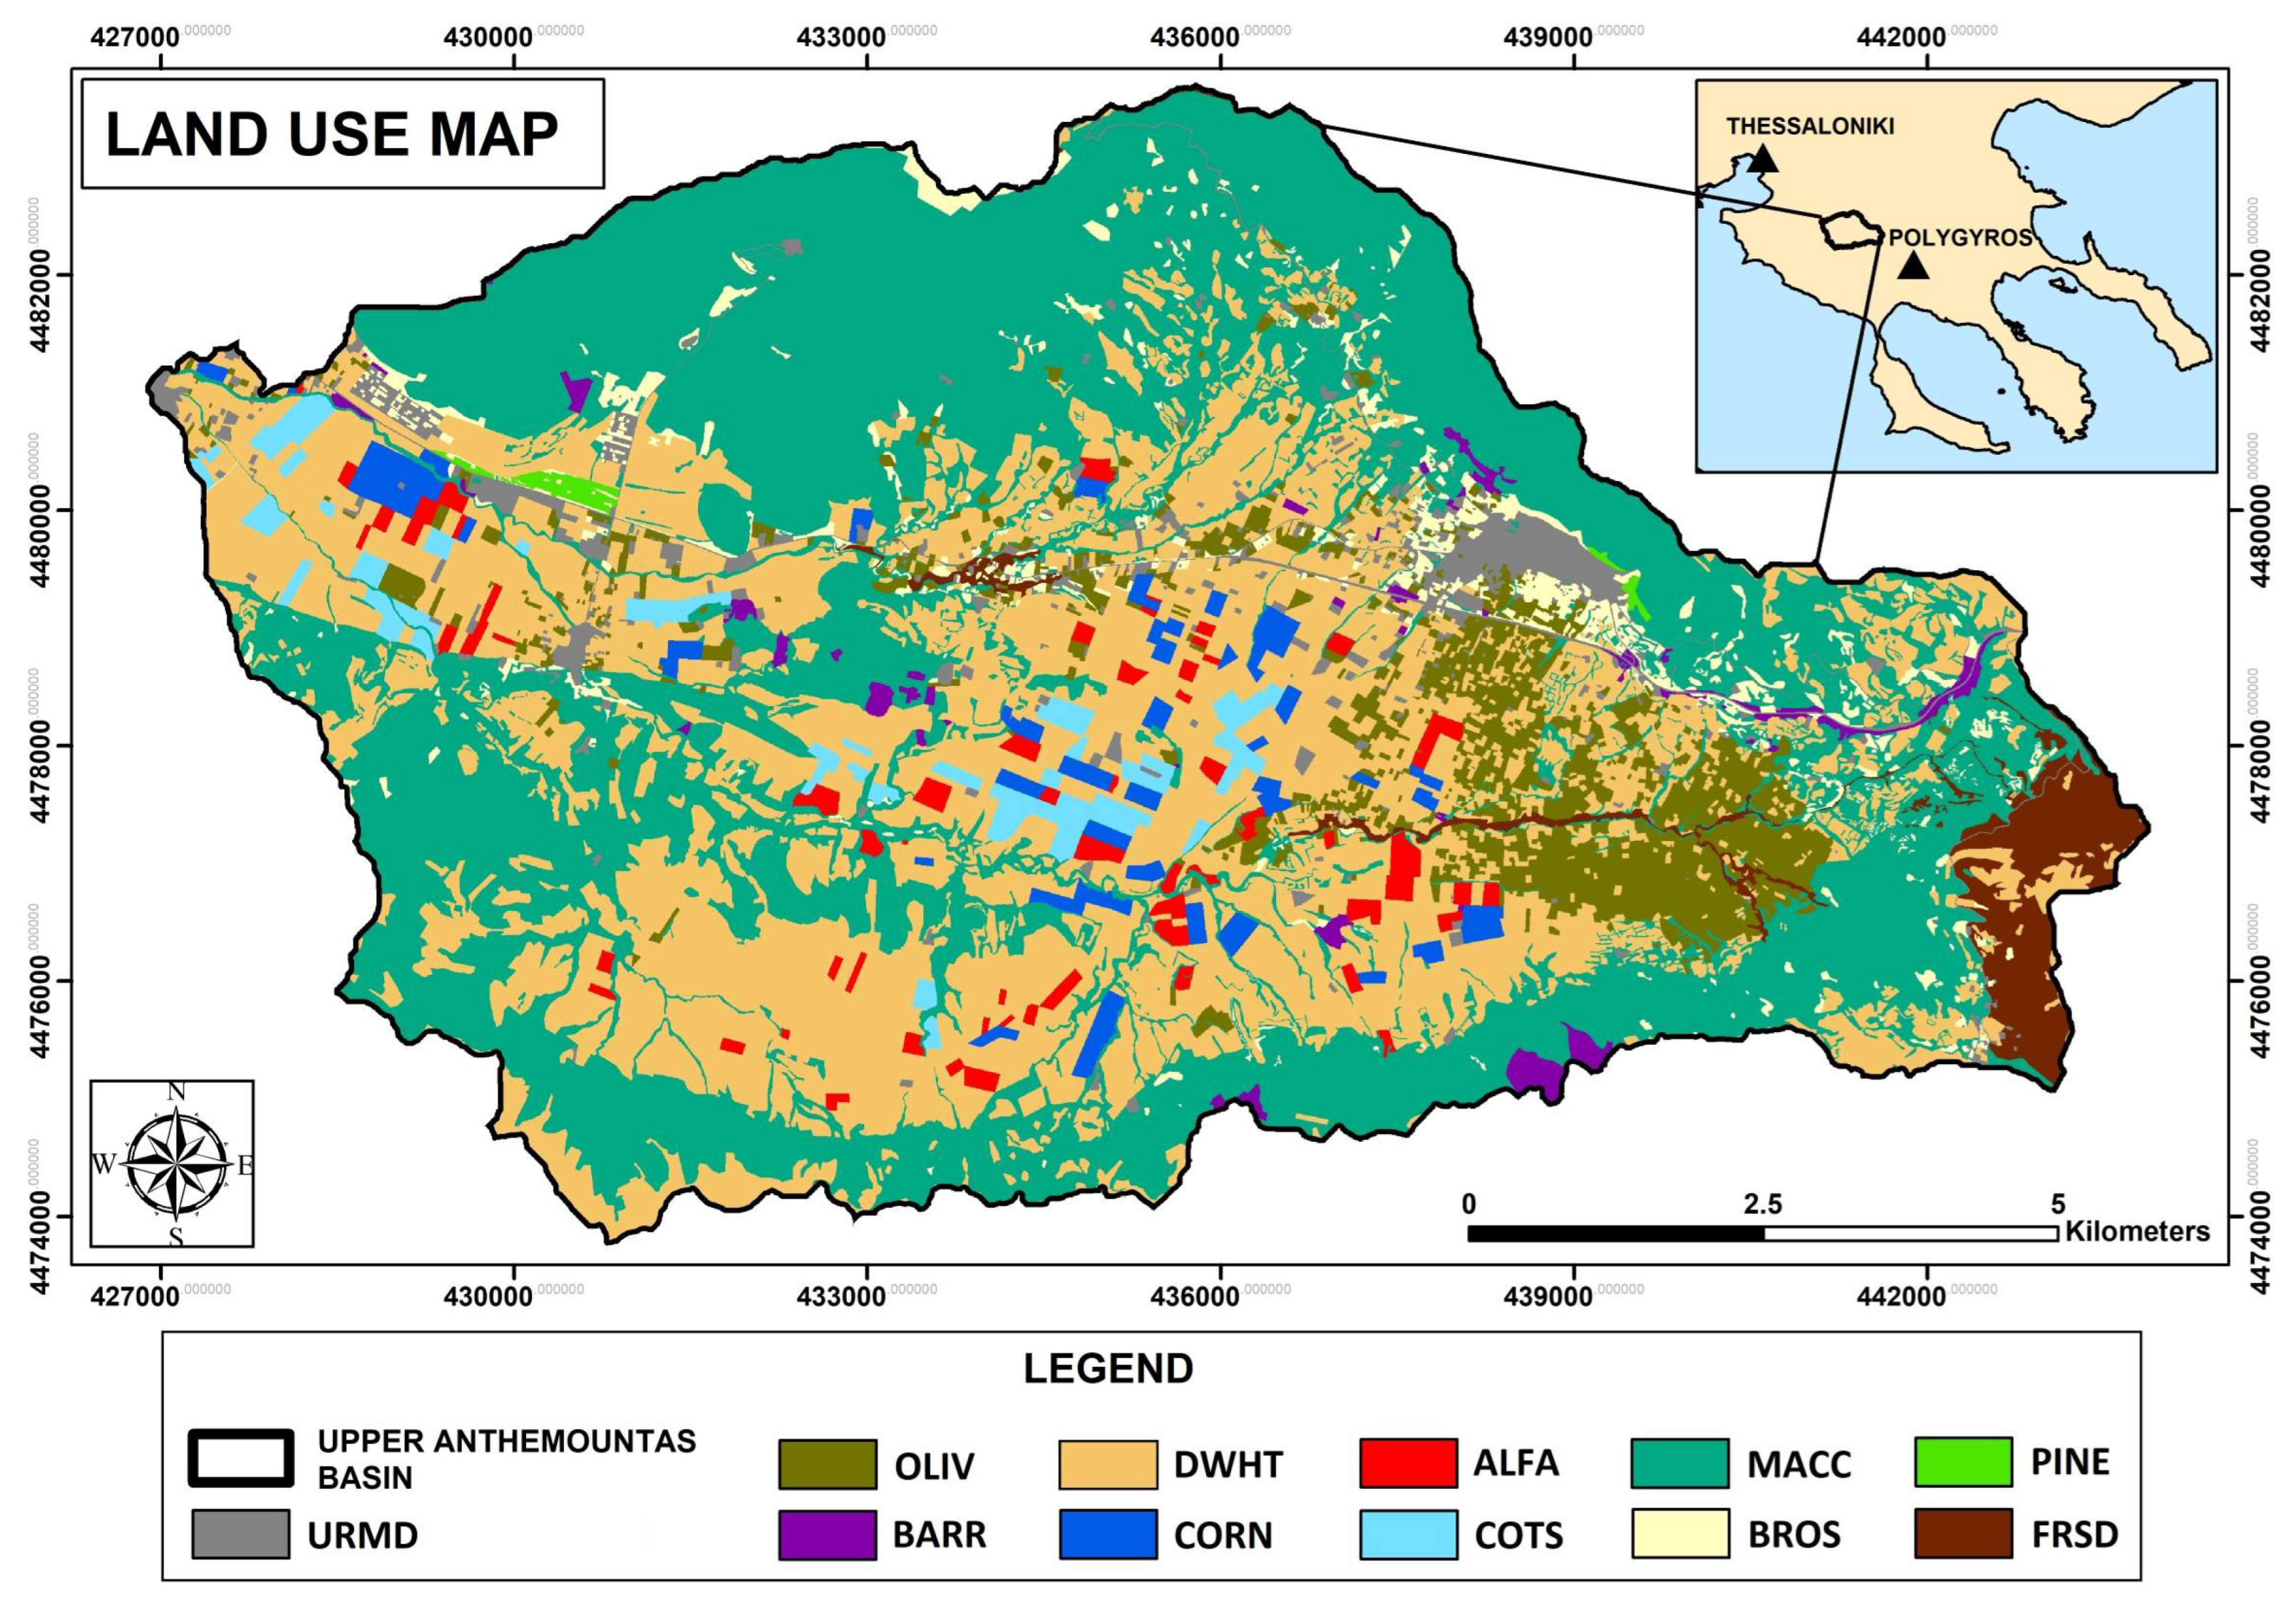
Ultimately, the conclusions drawn from the visual interpretation of satellite imagery regarding crop behavior in the study area during the summer months (June through September) are summarized as follows: (a) non-irrigated crops (wheats) are easily identifiable, as their color tones in the satellite images do not exhibit significant variations throughout the summer period; (b) maize, which is intensively irrigated, becomes distinguishable from mid-June, with harvesting typically occurring between late August and mid-September; (c) cotton becomes identifiable from late July, with harvest taking place around late September; and, finally, (d) alfalfa is also easily recognized due to its recurring harvest cycle, which occurs approximately every 30 to 35 days. Figure 4 shows the detailed land cover map developed using the aforementioned procedure and incorporated into the SWAT model.
Furthermore, as previously mentioned, the evergreen forest–shrub vegetation (“Maquis”) accounts for the largest proportion of land use in the study area. However, this specific land use category was not directly available in the SWAT database. Instead, the database contained a very similar land use (labeled as “GRAR”), which refers to a comparable hard-leaved Mediterranean shrubland known as “Garrigue”, primarily found in southern France and other Mediterranean regions. Essentially, this category pertains to formations of scattered, low (0.2 to 2 m) bushy shrubs and pseudo-maquis [51,52].
Based on the foregoing, a new land cover category was created in the SWAT database named “Macchia-Maquis shrubland” (“MACC”). The values for the physical parameters of this new land use were largely adopted from the corresponding and pre-existing “GRAR” classification. However, certain key physical parameters were refined, either based on the literature or through remote sensing methods, to better represent the natural environment of the maquis in the study area. These parameters include ‘BLAI’ (maximum leaf area index), ‘ALAI_MIN’ (minimum leaf area index), ‘T_OPT’ (optimal temperature for plant growth), and ‘T_BASE’ (minimum temperature for plant growth). It should be noted that improving the accuracy of LAI representation contributes to more reliable hydrological modeling [13,53]. Moreover, the assimilation of LAI data has proven effective in enhancing the estimation of key processes, including ET and biomass accumulation [53,54].
In this context, remote sensing products were employed to determine both the minimum leaf area index (ALAI_MIN) and the maximum leaf area index (BLAI) for the maquis scrubland biome. Specifically, LAI data were obtained from the MODIS MCD15A3H Version 6.1 product [55], which provides 4-day composite time series at 500-m resolution. The dataset (920 images) spans the period 2003–2012 and was accessed via the USGS EARTHDATA platform (https://lpdaac.usgs.gov/products/mcd15a3hv061/, accessed on 6 September 2020). Following Daneshvar et al. [56], by focusing on locations predominantly occupied by maquis, average minimum and maximum annual LAI cycles were generated (from 2003 to 2012), from which the ALAI_MIN and BLAI values were subsequently derived. The updated values for “MACC” classification, incorporated in the SWAT land use database, are presented in Table 5.
Soil
Developing an accurate digital soil map, alongside its corresponding attribute database, proved challenging and was executed in two (2) primary phases. In the first stage, all required soil physicochemical parameters for SWAT input were determined. These parameters were subsequently integrated into the model through a database that is associated with the spatial characteristics of the input soil map. To this task, forty-five (45) soil samples were systematically collected across the basin to ascertain the prevailing soil types and their physical properties. Samples were retrieved from depths of 0–30 cm and 30–60 cm (where feasible), while a limited number of cores were acquired from deeper soil layers (60–100 cm). In addition to these samples, another twenty (20) specimens and their physical characteristics were obtained from the research conducted by Misopolinos et al. [32].
Determination of particle size distribution (proportions of rock fragments > 2 mm, sand < 2000–50 μm, silt < 50–2 μm, and clay < 2 μm) was accomplished in two (2) stages. At first, Sieve Analysis was employed to separate coarse fragments exceeding 2 mm, followed by a hydrometer-based sedimentation process for the finer materials. Soil textural classes were subsequently categorized in accordance with the U.S. Department of Agriculture (USDA) soil textural triangle. Organic matter content was quantified using the Loss on Ignition (LOI) method as outlined by Nelson et al. [58], while the carbon content was derived from the conversion factor described by Pribyl [59] (Equation (2)).
Organic Carbon (%) = Organic Matter (%)/2
In situ measurements of saturated hydraulic conductivity were performed using a single-ring infiltrometer technique suggested by Bagarello et al. [60]. Soil albedo values for each sample were assigned according to the surveys conducted by Penning De Vries et al. [61] and ten Berge [62]. Moreover, bulk density and available water capacity were determined using the Soil Water Characteristic–Hydraulic Properties Calculator (SWC-HPC) Model developed by Saxton and Willey [63]. Finally, the erosion factor (soil erodibility K factor) was calculated applying the equations of Williams [64]. Rock layers, representing fractured bedrock in the study area, were classified as “rock outcrop”, a soil class that exists in the default soil database of the model.
Next, a GIS-based digital soil map was generated following a well-structured procedure. Initially, soil particle-size fractions (sand, silt, and clay fractions) were interpolated for each soil depth layer (0–30 cm, 30–60 cm, and 60–100 cm) through a three-step process:
(1) First, a centered log-ratio (CLR) transformation was applied to the fractions in each layer to eliminate the “closure effect” inherent in compositional data [65,66]. The CLR is expressed as follows [67,68]:
C L R i = ln Z i i = 1 i = D Z i D
where z = compositional data (particle-size fractions) and i = 1, 2, …, D, D = 3 (the number of soil particle-size categories).
(2) Next, spline interpolation was conducted on the transformed sand, silt, and clay values to produce maps of their spatial distribution.
(3) Then, the interpolated values were back-transformed to recover the soil particle-size fractions (sand, silt, and clay). The inverse transformation equation is expressed as follows [65,66]:
Z i = e C L R i i = 1 i = D e C L R i
where CLRi are the transformed values produced from Equation (3).
(4) The back-transformed fractions were used in order to assign soil textural classes for each layer (0–30 cm, 30–60 cm, and 60–100 cm). In addition, the soil cover thickness of the study area was determined based on two (2) connected and digitized land capability map sheets [69].
Ultimately, all the above-produced maps, comprising the three (3) soil texture stratification maps and the soil cover thickness map, were subsequently overlaid. In total, twenty-five (25) soil profiles of 1 m depth were created and imported into SWAT along with their corresponding attribute database. Each soil profile represents a unique combination of three (3) soil units corresponding to the depths of 0–30 cm, 30–60 cm, and 60–100 cm, with attribute values derived from the averaged measurements of each soil textural class. The detailed soil map produced in SWAT is depicted in Figure 5.

2.4.3. Set up and Initial Model Run

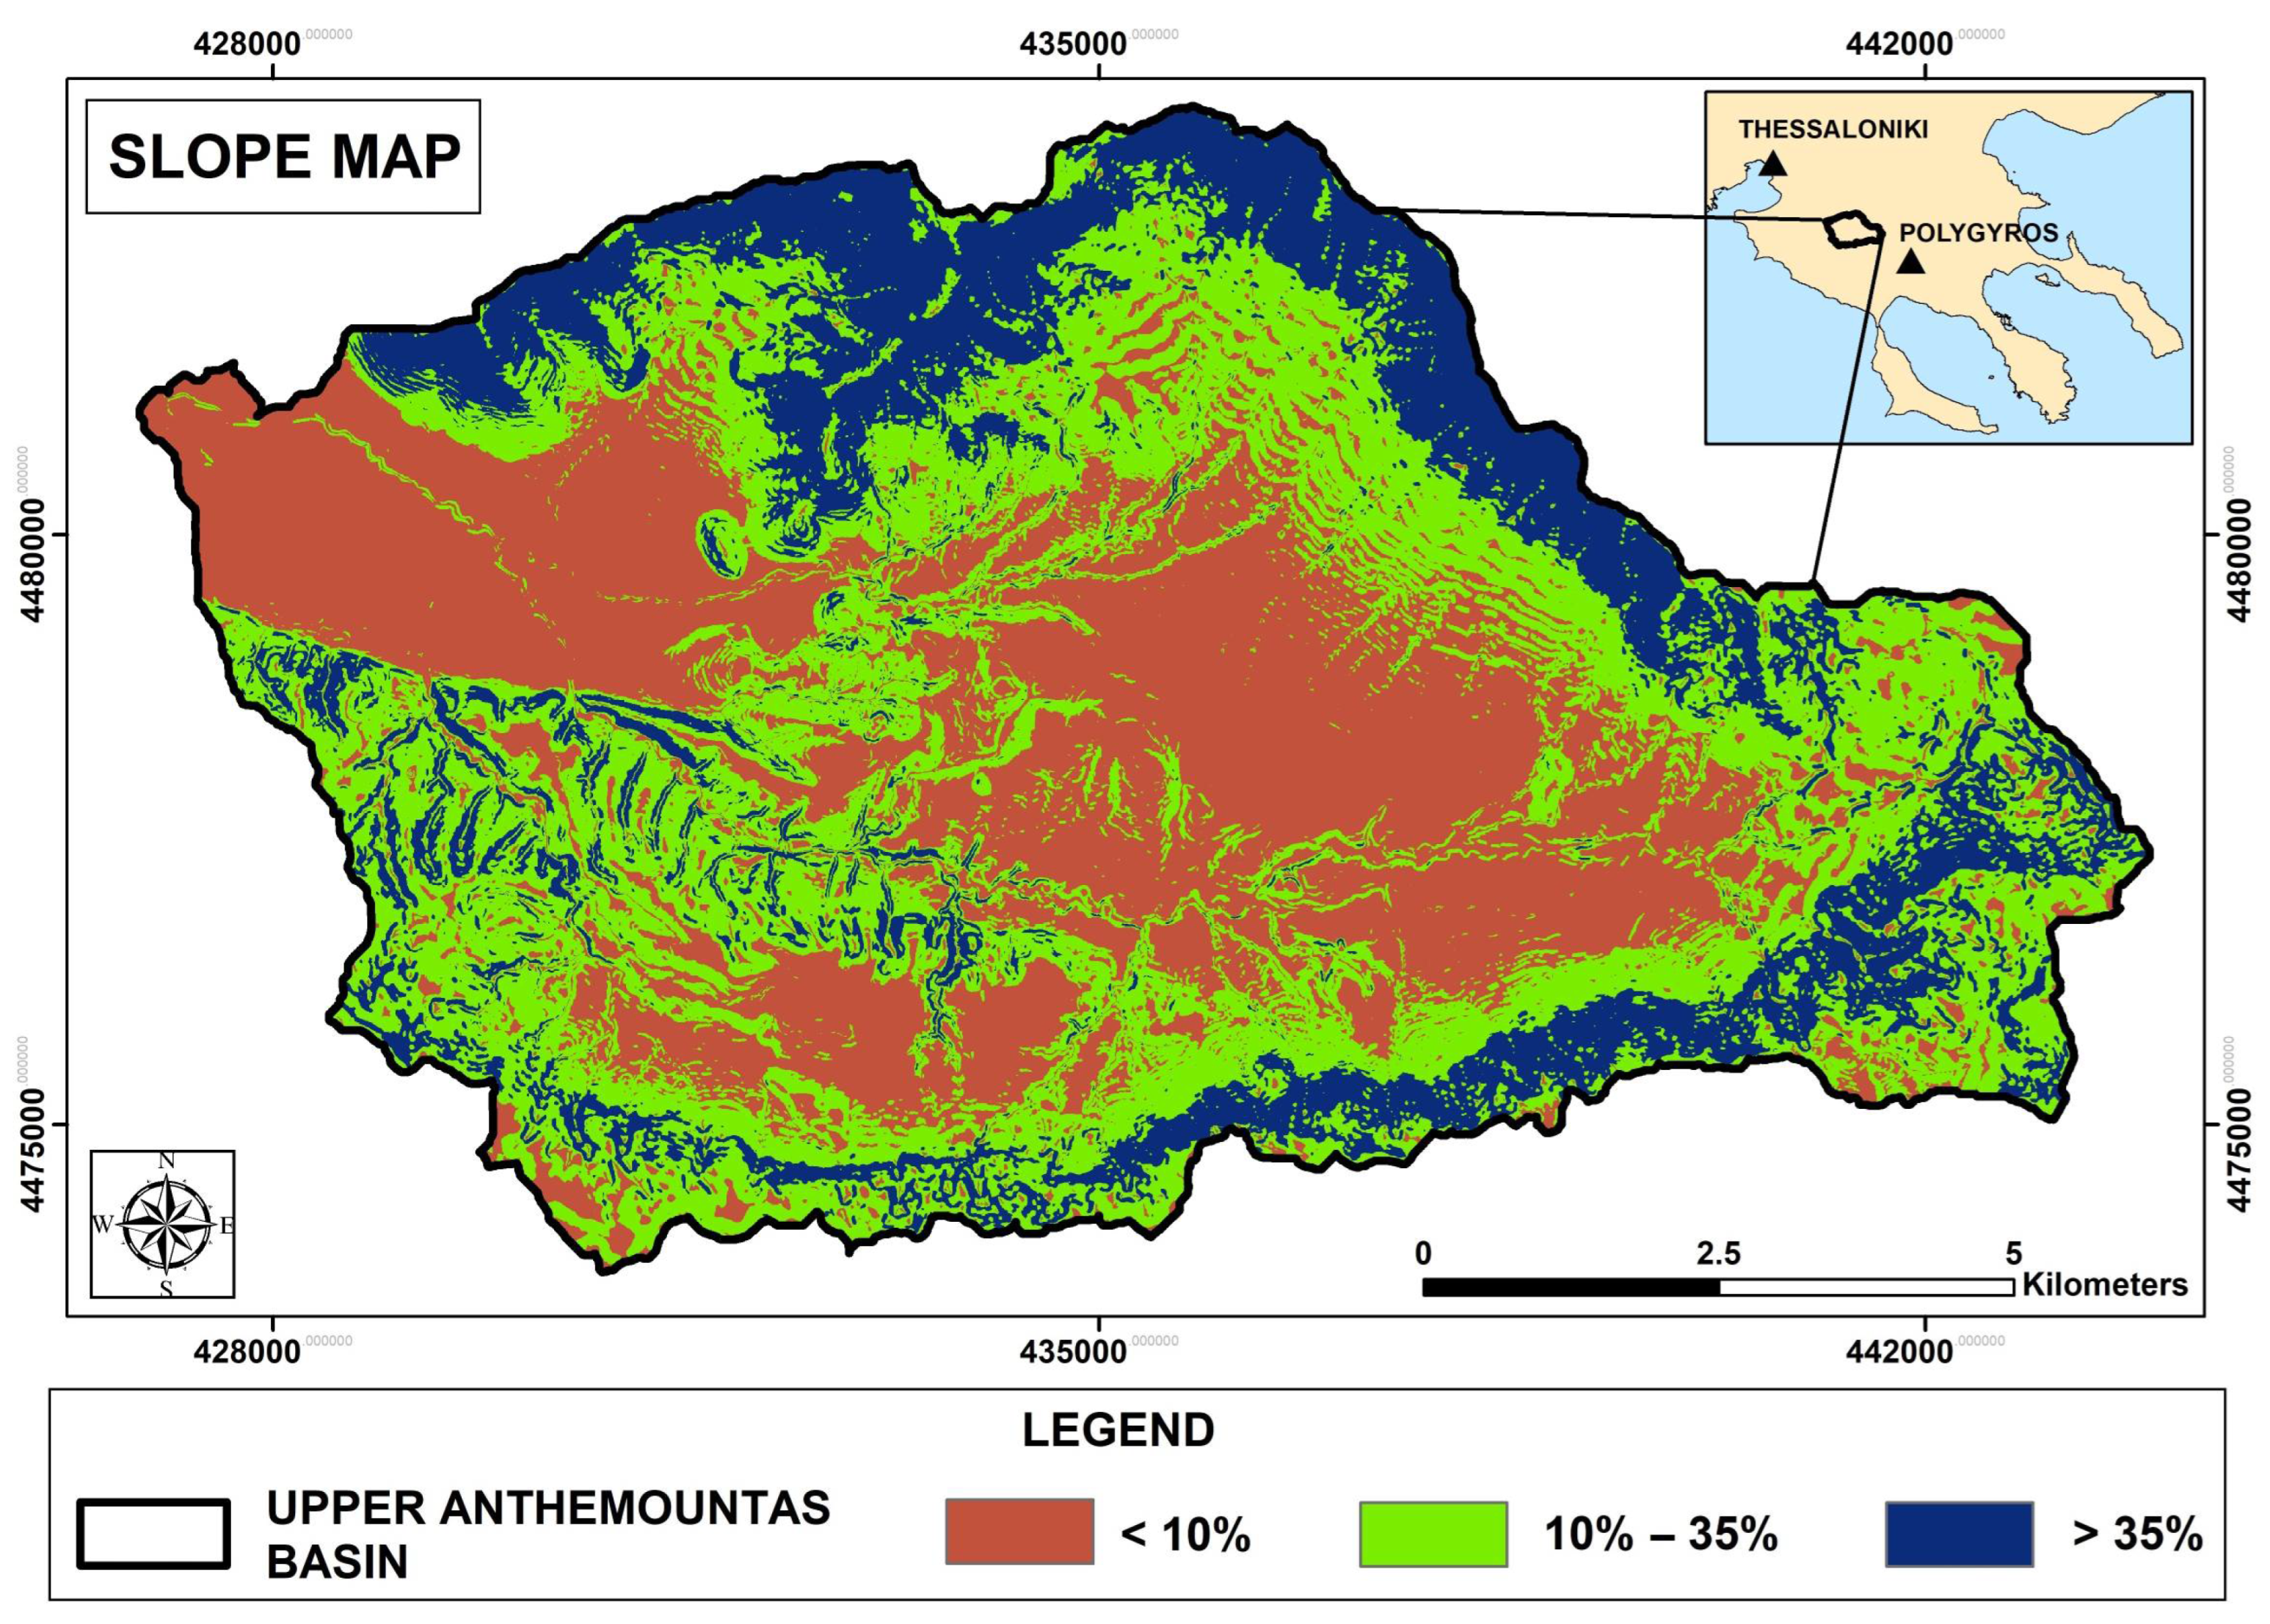
At this stage, the final configuration of the model is established. Essential spatial and attribute data, including slope, land use, and soil maps with accompanying feature tables, were imported into SWAT to ensure accurate representation of runoff and infiltration processes. In this analysis, three (3) slope thresholds (classes) were selected: (i) <10%; (ii) 10% to 35%; and (iii) >35% (Figure 6). This classification was derived from the literature, as it is considered that these threshold slopes may affect both the surface runoff and infiltration of water [70,71,72]. Furthermore, although practitioners may apply HRU thresholds (e.g., default land use 20%, soil 10%, slope 20%) to exclude minor areas, reduce model complexity, and focus on dominant classes [39], no such thresholds were applied in this study, resulting in a total of 1441 HRUs for the Upper Anthemountas Basin.
Climate inputs and simulation parameters were subsequently defined for the period spanning 1 January 2002 to 31 December 2014, with a monthly timestep, while the Penman–Monteith method was selected for evapotranspiration estimation. The simulation period was determined based on the following: (a) the availability of high-quality weather data series acquired from climate stations; and (b) the availability of measured streamflow data, which are crucial for the calibration of the model.
Finally, assigning a “warm-up” period (NYSKIP) in SWAT is vital, as it enables the model to stabilize key hydrological components, such as soil moisture and baseflow, before generating meaningful simulation outputs. In the present study, since the total simulation period is not considerably long (spanning 13 years), a two-year warm-up period was adopted, in accordance with practices recommended in the literature [73,74].

2.4.4. Model Calibration Procedure

The traditional approach to calibrating hydrological models such as SWAT relies on discharge measurements at hydrometric stations. To this task, model calibration was performed using forty-seven (47) available measured monthly streamflow values (from 2004 to 2013), observed on the main channel of the Upper Anthemountas Basin. The main strategy adopted for the calibration of the model is described in the following steps:
(1) The calibration of the SWAT model was performed using the semi-automated multisite and inverse modeling algorithm SUFI-2 in the SWAT-CUP software package [75]. The SUFI-2 algorithm was implemented, as it is recognized for its high efficiency and effectiveness [23,76], while simultaneously yielding more reasonable and well-balanced calibration results [77]. The Nash–Sutcliffe Efficiency (NSE) criterion was selected as the objective function, given its widespread use and reliability [77].
(2) The parameters pre-selected to be calibrated (about 30 parameters) were designated based on a thorough and exhausting literature review [78,79,80,81,82,83,84,85,86,87,88,89,90,91,92,93,94,95,96,97,98].
(3) Prior to their utilization in SWAT-CUP, many parameters were systematically grouped based on their impact on the water cycle, following the guidelines suggested by Abbaspour et al. [23]. Subsequently, the grouped parameters were analyzed and calibrated in a step-by-step procedure. The number of simulations (model runs) conducted at each iteration (step) was set to 500, in accordance with the recommendations of Abbaspour et al. [23]. Parameters that did not significantly affect the model’s behavior were excluded from further consideration during the calibration process.
(4) During calibration, all adjusted parameter values retained consistency with the watershed hydrological behavior, thereby ensuring that the parameterization remained representative of actual field conditions.
(5) The quantitative performance of the ArcSWAT model was attained by employing seven (7) statistical criteria and score classification for a monthly time step, pursuant to the recommendations of Kouchi et al. [34] and Sao et al. [35].

2.5. Satellite-Derived ET Datasets

In this study, remotely sensed ET products were employed, and their performance was evaluated against ET estimates simulated by the ArcSWAT model. Selection of the ET data was governed by specific criteria: (a) data must be freely accessible (open access); (b) data must span ArcSWAT model’s simulation period (from 2002 to 2014); (c) data must be purely remotely sensed; (d) spatial resolution of the data must be sufficiently high, given that the study area is a relatively small watershed; and, finally, (e) data must (spatially) engulf the study area.
Consequently, several widely recognized ET products, such as GLEAM, WaPOR (FAO), ALEXI, and TerraClimate, were excluded from this research, since they fail to meet one of the aforementioned criteria. In this study, three (3) globally recognized ET products (Table 6) that utilize satellite-derived inputs coupled with hybrid energy balance modeling approaches were used: (a) the “MOD16A2_MONTHLY.MERRA_GMAO_1kmALB” dataset (Collection 5); (b) the “MOD16A2GF” product (Collection 6.1); and (c) the “SSEBop” product (Version 5).
The MOD16A2_MONTHLY.MERRA_GMAO_1kmALB (MOD16A2 Collection 5, named as MOD16A2-C5) dataset is a value-added, monthly global ET product developed by the Numerical Terradynamic Simulation Group (NTSG) at the University of Montana. It is derived from the MODIS MOD16A2 Collection 5 algorithm, which estimates terrestrial ET using the Penman–Monteith approach based on satellite-observed land surface variables [99]. In this enhanced version, the standard meteorological inputs have been replaced with data from the Modern-Era Retrospective Analysis for Research and Applications (MERRA), a reanalysis dataset produced by NASA’s Global Modeling and Assimilation Office (GMAO). The product also incorporates a 1 km spatial albedo correction to refine surface energy balance calculations. These modifications improve the accuracy and consistency of evapotranspiration, latent heat flux, and gross primary productivity (GPP) estimates under varying surface and atmospheric conditions [100].
The MOD16A2GF Collection 6.1 (named as MOD16A2GF-C6.1) dataset is a gap-filled version of NASA’s MODIS-based evapotranspiration product, providing 8-day global ET estimates at 500-m resolution. It is based on the Penman–Monteith energy balance algorithm, incorporating MODIS land surface variables such as LAI, FPAR, albedo, and surface temperature. The gap-filling procedure improves data continuity in cloudy regions [101].
The SSEBop (Simplified Surface Energy Balance Operational Product) version 5 dataset (named as SSEBop-V5) is a global, operational ET dataset developed by the USGS. It estimates actual ET by scaling reference ET with satellite-derived land surface temperature (LST), using a simplified energy balance framework. SSEBop is designed for large-scale monitoring applications, such as drought assessment, agricultural water use, and hydrologic modeling [102].

3. Results and Discussion

3.1. Hydrological Model Results

3.1.1. Model Calibration and Evaluation

The results of the SWAT model calibration are presented and analyzed in this section. Following calibration, the model exhibits performance levels ranging from satisfactory to very good, as depicted in Table 7. Specifically, based on the statistical indicators of R2 (0.89), NSE (0.79), and RSR (0.46), the model is deemed very good, while evaluation using bR2 (0.80), MNS (0.50), KGE (0.69), and PBIAS (−23) suggests a satisfactory performance.
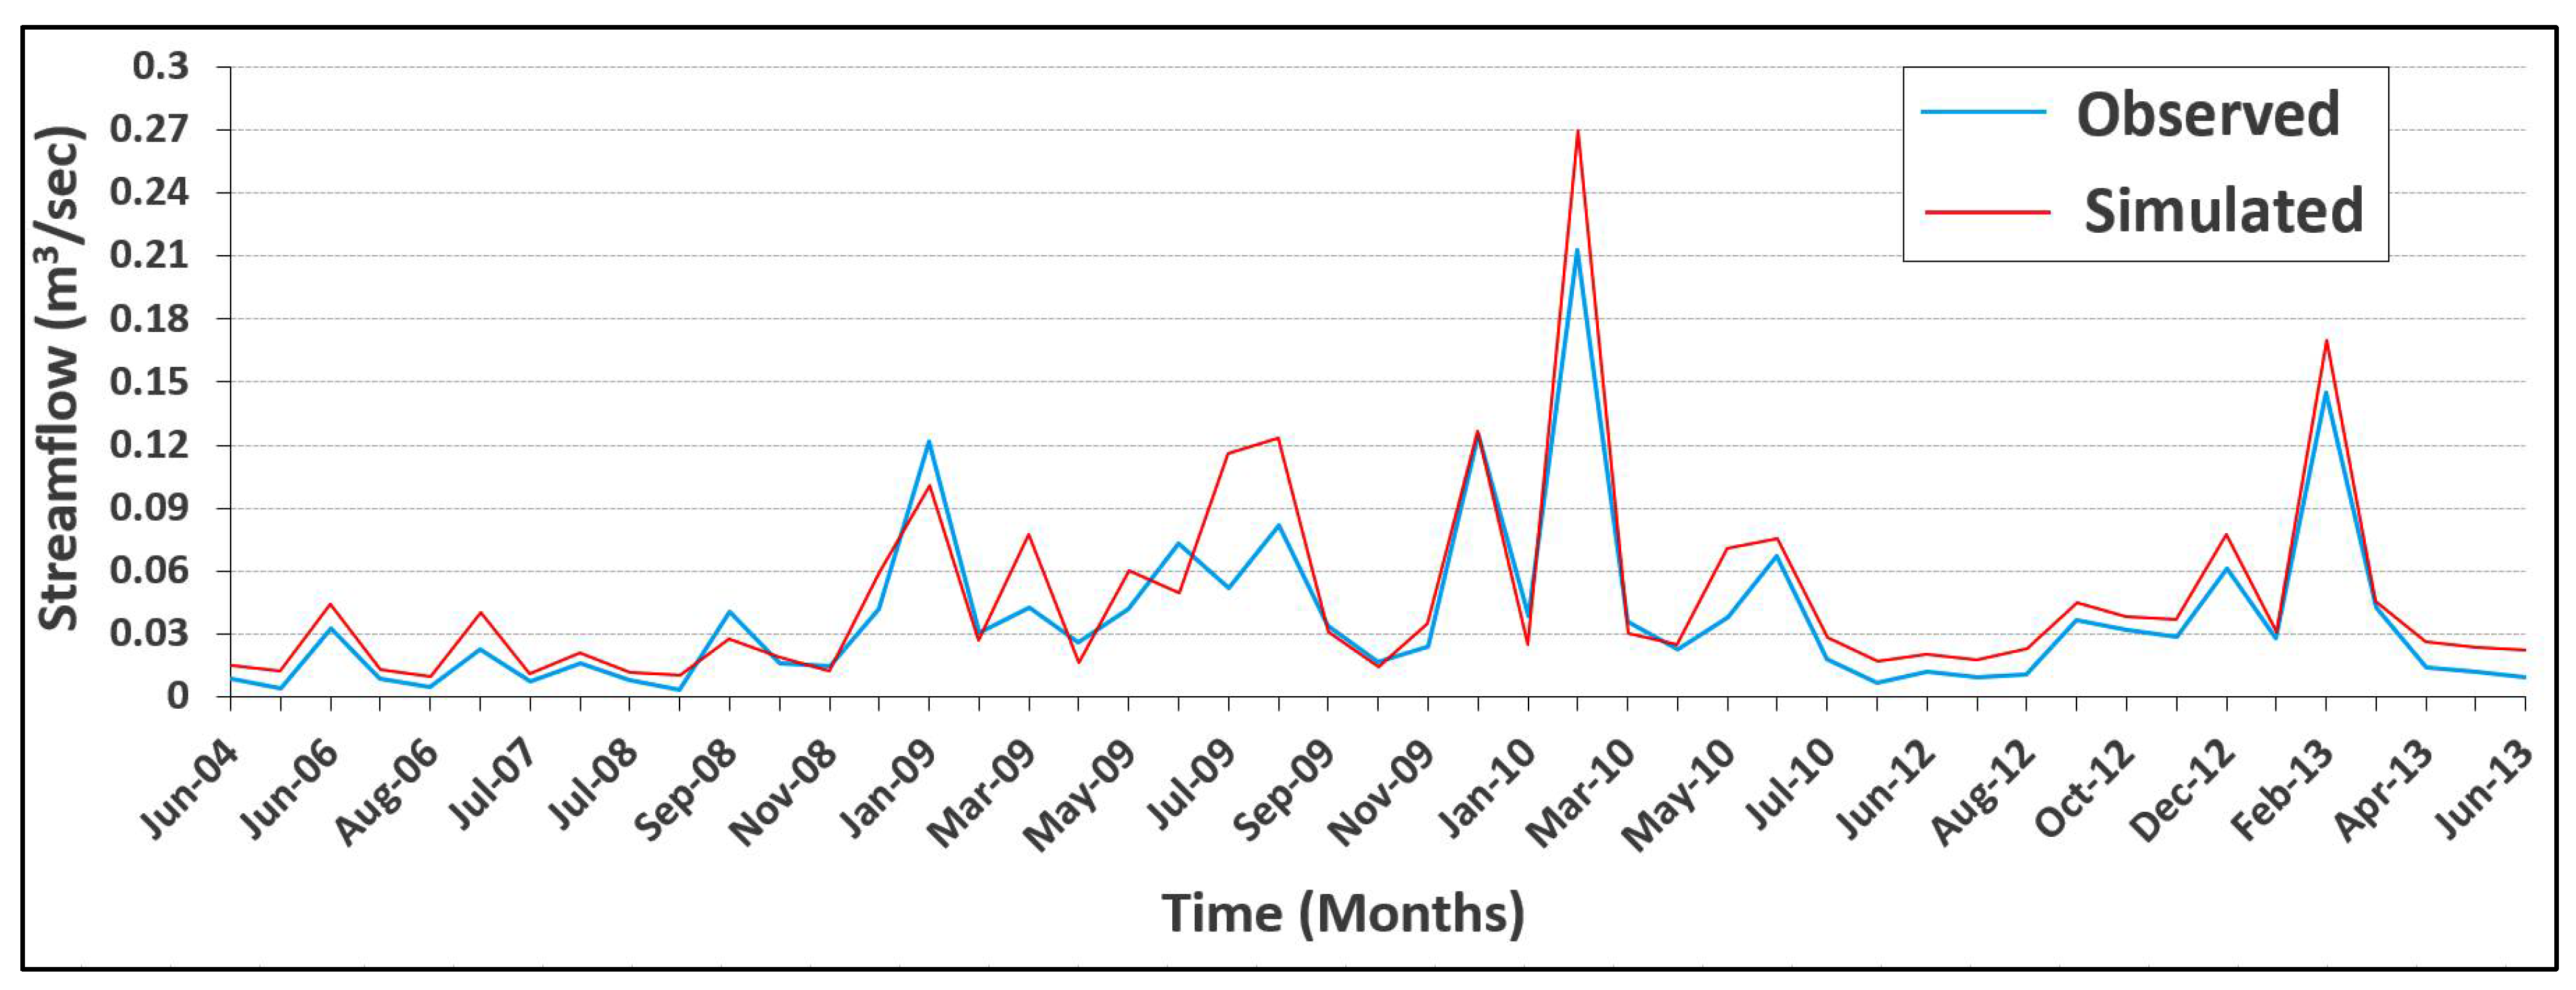
Figure 7 illustrates the comparison between observed and simulated river streamflow values after model calibration. Overall, there is a strong agreement between measured and simulated data. The model displays a tendency to slightly overestimate monthly baseflow, while its performance in capturing extreme discharge events is generally satisfactory. An exception is noted during the summer months of 2009, where a discrepancy between observed and simulated values is evident. A similar, though less prominent, deviation is also observed in the spring of 2010.
As thoroughly discussed earlier, the Upper Anthemountas Basin is characterized by a semi-arid climate and a non-perennial river system, with flow occurring intermittently rather than consistently throughout the year. Additionally, the catchment is extensively covered by forest vegetation, which exerts a significant influence on hydrological processes. Based on the aforementioned considerations, various water losses are expected across all components of the hydrological cycle, providing a consistent rationale for the calibrated values. These water losses are parameterized through key variables listed in Table 8, and include: (a) subsurface flow from the river to the aquifer, as indicated with a high CH_K2 value; (b) deep-layer evapotranspiration (particularly intensified during the summer months), as reflected with lower ESCO rates; and (c) reduced surface runoff due to vegetation cover and land use patterns, as outlined with a higher OV_N value. Notably, higher values of GWQMN and GW_REVAP are associated with reduced baseflow and streamflow [89,103], a pattern observed both in the present analysis and consistently reported in other studies of Mediterranean semi-arid watersheds [104].
With respect to Runoff Curve Number (CN2), calibration resulted in reductions ranging from approximately 3% to 6% (with an average decrease of 5%) across all land cover classes, while remaining within hydrologically and physically plausible bounds for the study area. In other words, the adjusted values (Table 8) continued to reflect the actual land use/cover and hydrological characteristics of the study area.
Notably, the maximum leaf area index (BLAI), as determined through model calibration, falls well within the range estimated from MODIS satellite imagery. Minor deviations were observed in the values of the T_BASE and T_OPT parameters for the maquis land cover class (“MACC”), compared to those reported in the literature [57].

3.1.2. Water Balance Components and Discharge Hydrograph

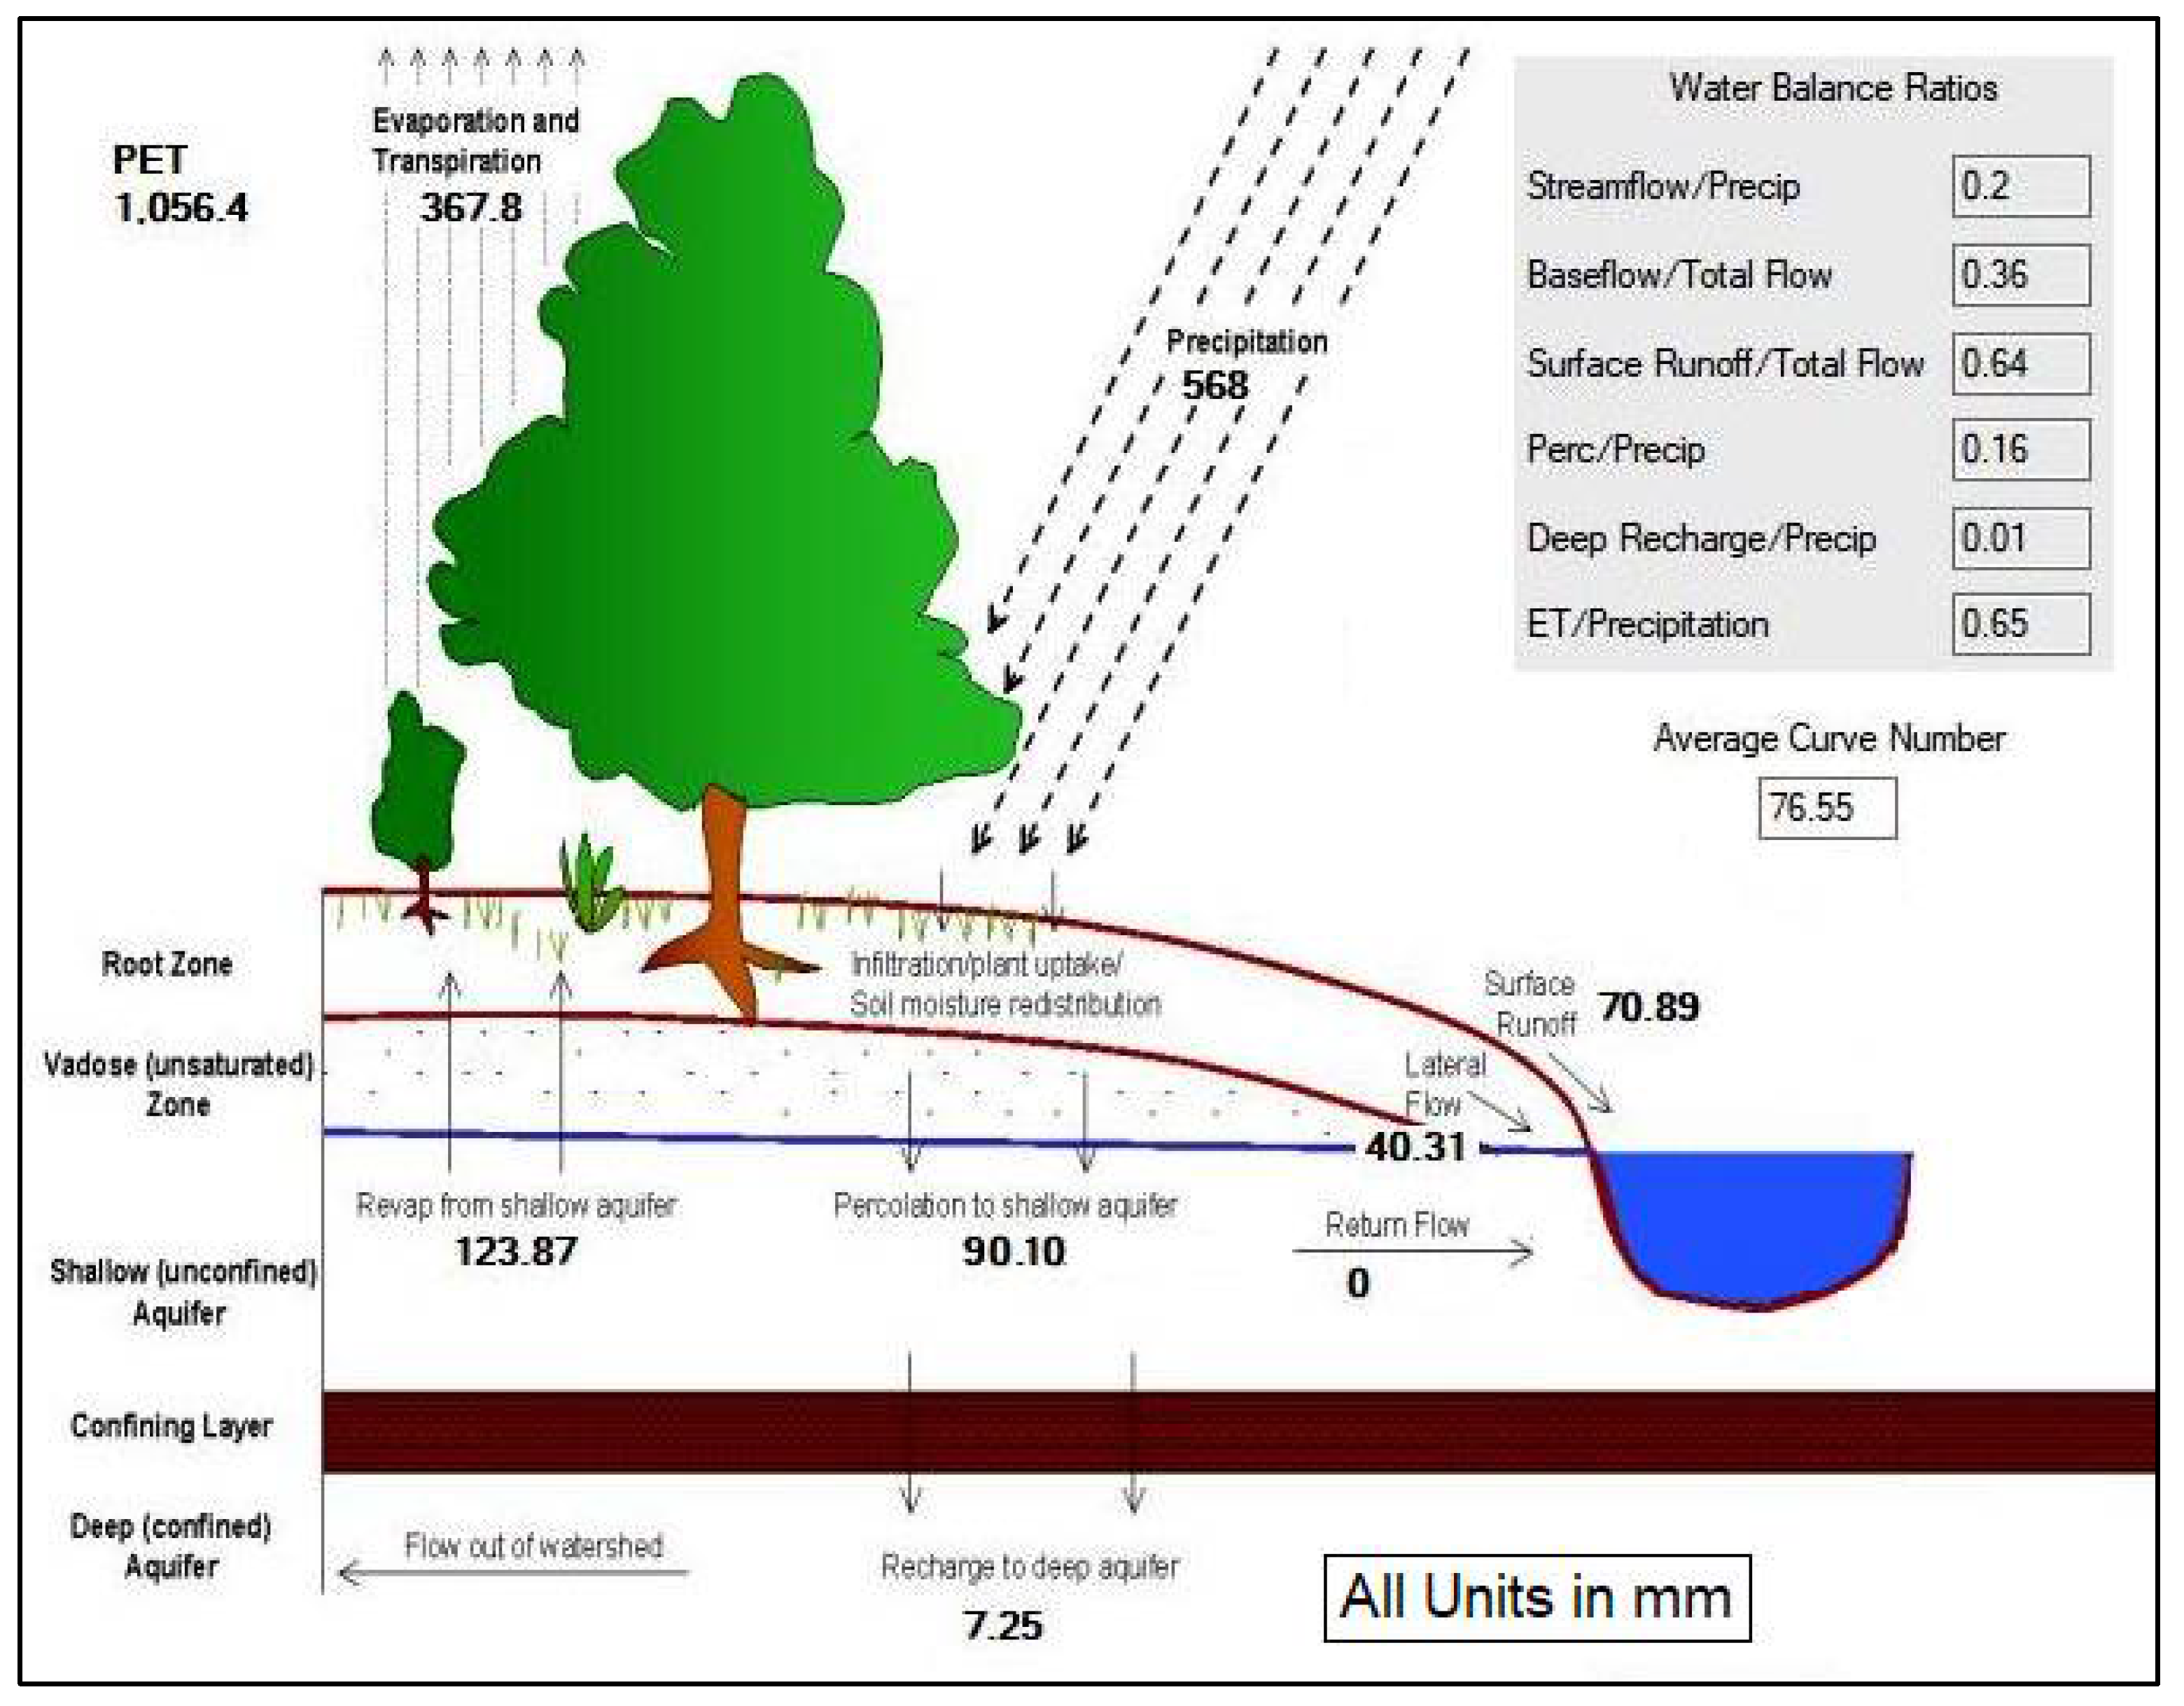
Following the calibration of the hydrological model, the average monthly water balance of the Upper Anthemountas Basin was established for the out-printed simulation period 2004–2014. The simulated hydrological behavior demonstrates strong alignment with the geomorphological, climatic, and hydrological attributes of the catchment, as these were outlined in prior sections. During the simulation period, mean precipitation was estimated at 568 mm, while mean actual evapotranspiration reached 367.8 mm. Percolation averaged 90.1 mm, surface runoff was calculated at 70.89 mm, and lateral flow contributed the smallest portion, averaging 40.31 mm. Overall, the runoff coefficient for the basin was determined to be 0.20, whereas the infiltration coefficient was 0.16. Notably, actual evapotranspiration emerged as the most significant component of the water balance, accounting for approximately 65% of total precipitation. The resulting water balance components are displayed in Figure 8.
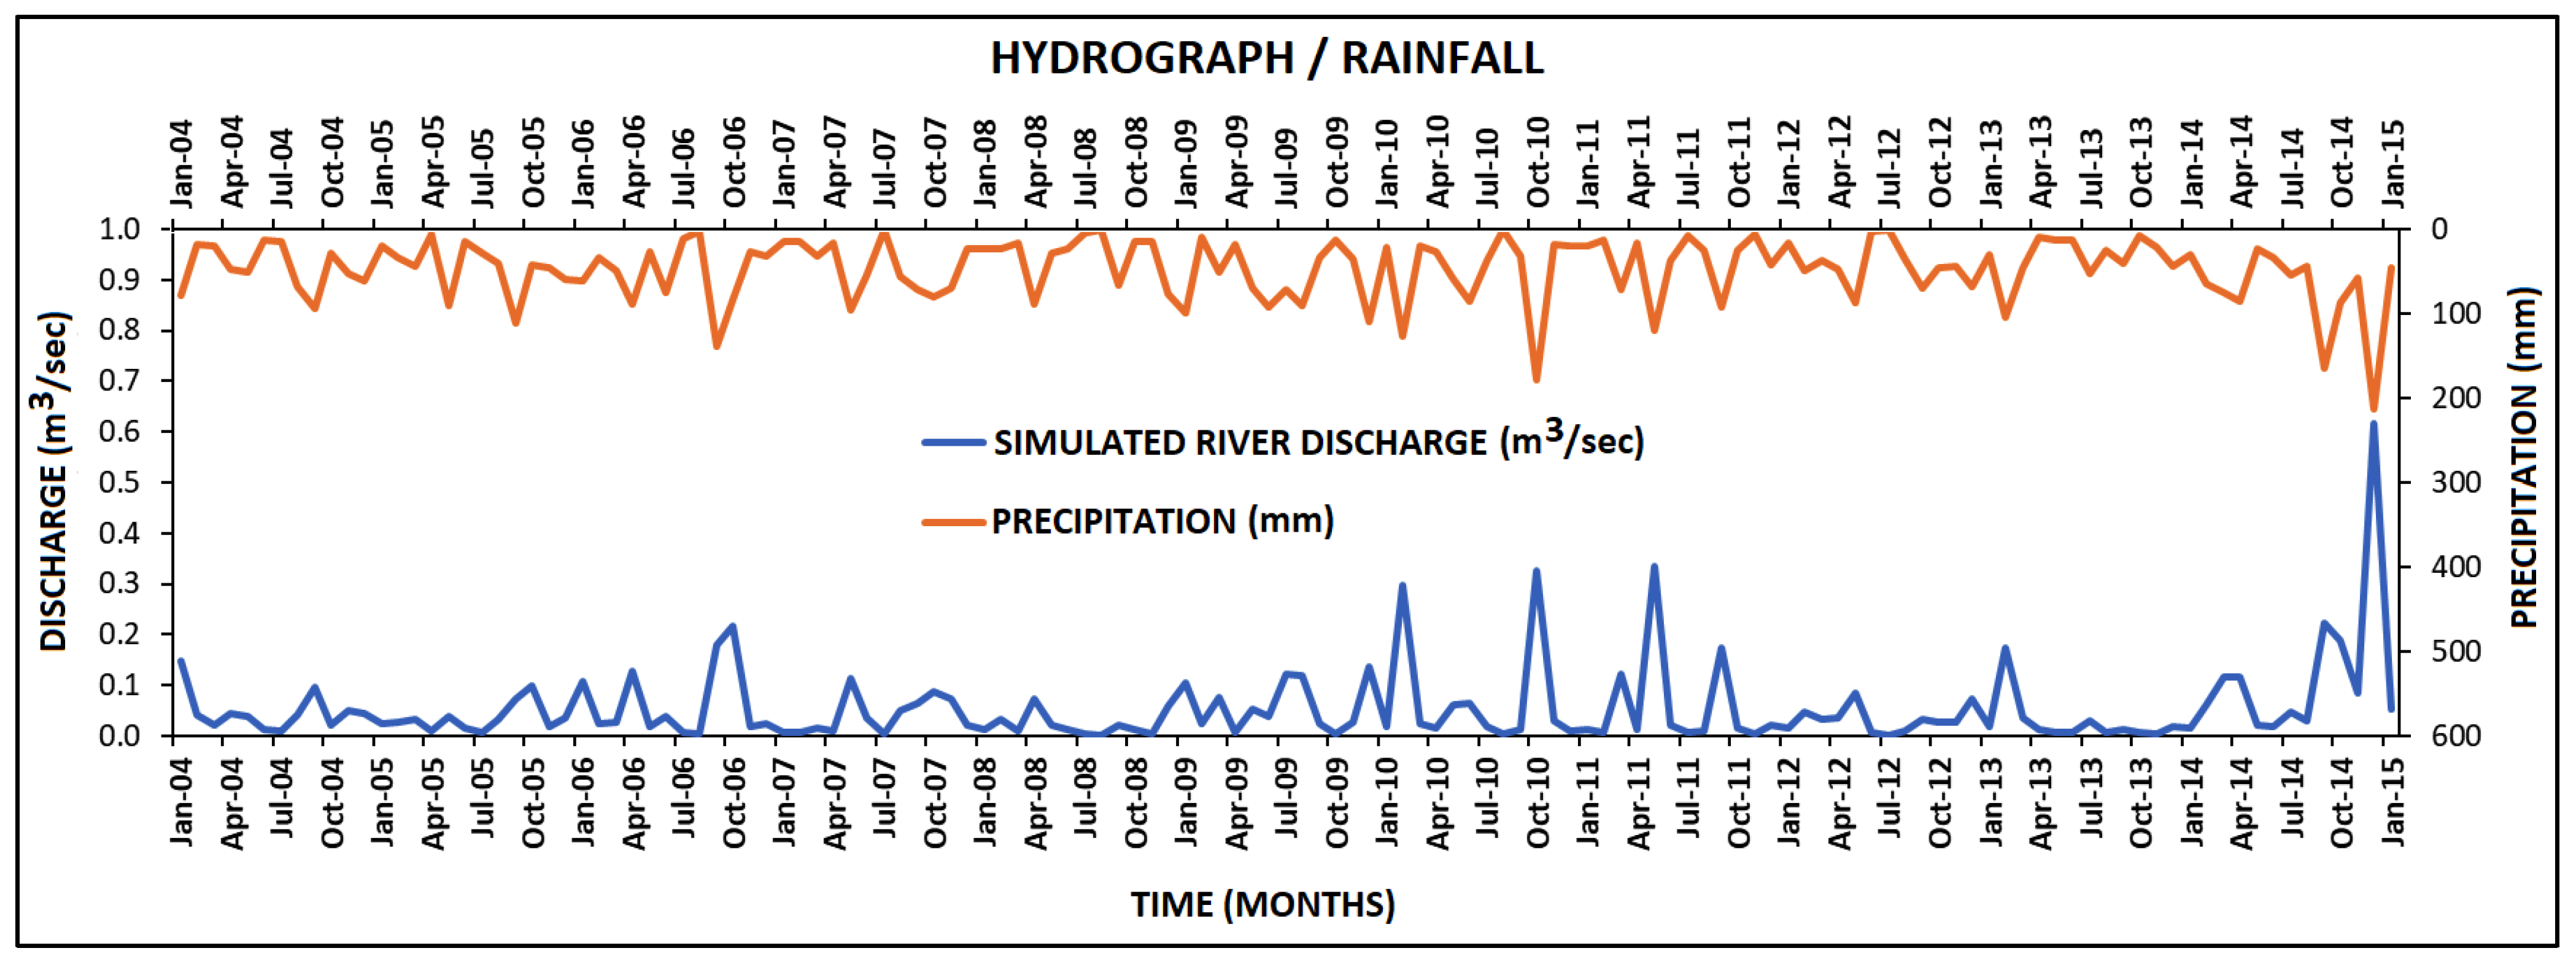
Furthermore, Figure 9 shows the simulated hydrograph alongside precipitation data. The temporal correspondence between rainfall and discharge clearly indicates that the river follows an ephemeral flow regime, with runoff confined to short periods immediately following precipitation and an absence of flow for the majority of the hydrological year.

3.2. Performance Analysis Between ArcSWAT-Simulated and Remotely Sensed ET Products

3.2.1. Overall Monthly Evolution of ET

The overall temporal pattern of monthly ET simulated by the calibrated ArcSWAT model, alongside the corresponding estimates from three (3) remote sensing-derived products (MOD16A2-C5, MOD16A2GF-C6.1, and SSEBop-V5) over the period 2004–2014, is illustrated in Figure 10. In addition, Table 9 summarizes the comparative performance metrics for each satellite product against the ArcSWAT baseline.
The results clearly indicate that the MOD16A2-C5 product shows the closest agreement with the calibrated SWAT estimates, achieving a KGE of 0.536, a PBIAS of 9.95%, a RMSE of 13.33 mm, and an RSR value of 0.741. The MOD16A2GF-C6.1 follows closely, with similar KGE, RMSE, and RSR values; however, its substantially higher PBIAS indicates a consistent overestimation of ET across the catchment. This result is somewhat unexpected, given the methodological enhancements introduced in the Collection 6.1 product. Conversely, the SSEBop Version 5 product delivers the poorest overall performance, demonstrating limited ability to reproduce observed ET dynamics.

3.2.2. Averaged Monthly ET Comparisons

The mean monthly ET of all dataset sources for the period 2004–2014 is provided in Table 10. In general, the calibrated SWAT model yielded a mean monthly ET of 30.65 mm. The corresponding averages derived from satellite products were 33.70 mm for MOD16A2-C5, 39.90 mm for MOD16A2GF-C6.1, and 25.50 mm for SSEBop-V5, indicating that MOD16A2-C5 outperforms the others in terms of mean monthly ET. Furthermore, a multi-product average of the satellite-derived ET estimates was calculated, which demonstrated an overall notable alignment with the ArcSWAT-simulated ET.
More specifically, a detailed month-by-month comparison reveals that MOD16A2-C5 displays strong agreement with SWAT estimates during the months of May, August, and September. Satisfactory alignment is observed in February, July, and October, while November and December exhibit somewhat moderate consistency. The most pronounced discrepancy between the two (2) datasets occurs in June. The MOD16A2GF-C6.1 product follows a similar pattern, generally exhibiting partial to satisfactory agreement with the SWAT-derived ET, with the exception of April, where a significant deviation is observed. Notably, this product achieves near-exact alignment with the SWAT outputs in June. By contrast, SSEBop-V5 shows poor overall alignment with the calibrated model, offering values that differ substantially from those simulated by SWAT throughout most of the year. The sole exception occurs during mid to late spring (April and May), when a very close agreement is observed. On the other hand, the multi-product average of the satellite-derived ET estimates shows excellent agreement with the ArcSWAT-simulated ET, particularly during January, February, March, and October. For the remaining months, the consistency is predominantly satisfactory, with the exception of April, which displays a noticeable deviation.

3.2.3. Seasonal ET Comparisons

Seasonal ET values for the 2004–2014 period, derived from all datasets, are summarized in Table 11. The results demonstrate appreciable discrepancies between the calibrated SWAT model outputs and the satellite-derived ET estimates. Among the remote sensing products, MOD16A2-C5 presents the closest correspondence with SWAT-simulated ET, especially throughout the autumn months. The MOD16A2GF-C6.1 product attains moderate concordance with the model across most seasons, yet it surpasses all other products in replicating early summer (June) ET dynamics. In contrast, while the SSEBop-V5 product shows weak overall alignment with the SWAT simulations, it delivers relatively improved agreement during the spring season (April and May), where it outperforms all other satellite products in capturing the modeled ET. Strikingly, the averaged ET from all satellite products exhibits substantial correspondence with the SWAT-simulated ET, particularly during winter and fall, where the consistency between the datasets is especially apparent.

3.2.4. Annual ET Comparisons

Annual ET totals for the 2004–2014 interval, derived from each dataset, are presented in Table 12. Consistent with the preceding analyses, the MOD16A2-C5 product reveals strong concurrence with SWAT-derived annual ET estimates throughout most of the simulation period. However, this agreement weakened in the years 2008 and 2013, which are characterized by diminished precipitation (Table 4). Conversely, the SSEBop-V5 product for the most part fails to reproduce the SWAT-simulated annual ET, with the notable exceptions of 2008 and 2011, when its estimates align more closely with the model. A reasonable agreement is also evident in 2006 and 2010, though less distinct. On the other hand, the MOD16A2GF-C6.1 dataset demonstrates only moderate to poor correspondence with the SWAT outputs, tending predominantly to overestimate annual ET dynamics. By way of comparison, exceptional alignment between the averaged satellite-derived ET and the SWAT estimates is observed in 2007 and 2012, whereas the years 2004, 2009, and 2014 show substantial agreement. For the remaining years of the simulation period, the consistency is, as a rule, satisfactory, with the exception of 2008 and 2013, where pronounced discrepancies are noticed.

3.2.5. Insights into Model–Satellite ET Agreement

The comparative analysis between SWAT-simulated ET and three (3) satellite-derived ET products revealed distinct performance patterns that can be largely attributed to technical differences in their underlying algorithms. Among the tested datasets, MOD16A2-C5 demonstrated the highest consistency with SWAT outputs, possibly due to its robust Penman–Monteith formulation and mature biome-specific parameterization [99]. Its reduced agreement during the driest years of the simulation period likely reflects challenges in accurately capturing water-stressed vegetation dynamics under moisture-limited conditions [105].
In contrast, the SSEBop-V5 product, while typically presenting weaker alignment with the modeled ET, displayed improved correspondence during these dry years. This is likely attributable to its thermal-based approach, which leverages land surface temperature to infer ET, especially under arid or semi-arid regimes [102]. The MOD16A2GF-C6.1 product, although more recent, showed moderate overall agreement, with a tendency to overestimate ET across most years. However, it surpassed all other products in capturing early summer ET dynamics, likely due to algorithmic refinements such as enhanced gap-filling and updated land cover inputs [1,105].
Significantly, averaging the values of all three (3) satellite-derived ET products results in a consistently strong alignment with the calibrated ArcSWAT-simulated ET, across all temporal scales. This agreement may be attributed to the compensatory effect of combining multiple products. As each satellite dataset is based on distinct algorithms and inputs, their errors may partially cancel out when averaged, producing a more balanced estimate. While this ensemble-like approach is thought to improve consistency, further research is needed to confirm its effectiveness in ET estimation.
Nevertheless, it is worth highlighting that the SWAT model employed in this comparison was calibrated focusing on streamflow (the hydrological component). As a result, the simulated ET was not directly calibrated against observed ET values. Although MODIS-derived LAI data were incorporated into the model’s database, improving its representation of vegetation phenology and transpiration dynamics, they do not eliminate the potential for direct ET calibration. This may partially explain some of the discrepancies with satellite-based ET estimates, highlighting a common challenge in hydrological modeling studies where ET is assessed indirectly [106,107]. Nonetheless, the observed agreements and divergences provide valuable insights into the strengths and limitations of both modeling and remote sensing approaches, and suggest that bias-correction techniques or ensemble ET products could enhance consistency in future applications [1].
On the other hand, beyond serving as a benchmark for comparison, remote sensing-derived ET data play an active role nowadays in refining the SWAT model itself [14]. Incorporating satellite ET products into the calibration process has been demonstrated to improve the model’s performance by enhancing not only streamflow simulations but also the overall accuracy of the water and energy balance components [5,6]. However, exclusive reliance on remotely sensed ET data for hydrological model calibration should be approached with considerable caution, as it carries the risk of producing inaccurate or misleading results.

3.2.6. Comparison of SWAT-Simulated and Satellite-Derived Evapotranspiration: Insights and Literature Context

The comparison between SWAT-simulated and satellite-derived ET revealed patterns of agreement and divergence, some of which align with findings from previous studies, while others reflect context-specific differences. Specifically, Herman et al. [108] compared ET results derived from the SWAT model with remotely sensed ET datasets, aiming to assess their differences and quantify the level of agreement between modeled and observed ET. The remote sensing datasets used for comparison included, among others, the MOD16A2 at 1 km resolution, the MOD16A2 at 500 m resolution, and the SSEBop dataset. The results indicated that, at the watershed scale, SWAT-derived ET exhibited stronger agreement with MOD16A2 (1 km) during the spring and summer seasons, while better alignment was observed with MOD16A2 (500 m) in the fall. In contrast, the SSEBop dataset showed higher agreement with SWAT ET during the winter months.
Chun et al. [109] evaluated ET estimates produced by the SWAT model in an arid region by comparing them with remotely sensed ET products, including SSEBop and MOD16. Their analysis demonstrated that the SWAT model had a stronger correlation with the MOD16 dataset compared to the SSEBop product. Abiodun et al. [110] compared ET estimates from the MOD16 dataset with those generated by the SWAT model across multiple spatial resolutions, focusing on a catchment characterized by complex topography in a semi-arid climate. The findings indicated a strong correspondence between the two ET sources at the catchment scale, with SWAT reproducing annual ET values within 6% of those reported by MOD16.
Furthermore, Parajuli et al. [14] conducted a comparative analysis of SWAT-simulated ET and MODIS-derived ET estimates. The study found that the SWAT model more accurately represented seasonal dynamics, particularly during the growing and dormant periods. However, MODIS-based ET was deemed sufficiently reliable when evaluated over an annual timescale. Consistently, Nguyen and Kappas [111] assessed ET outputs from the SWAT model against satellite-based estimates from the MODIS MOD16 product at 1 km resolution. Their results suggested that SWAT-derived ET may offer greater accuracy. Nonetheless, they acknowledged the value of MODIS ET data in supporting the validation of finer-scale ET assessments generated by both approaches. It is important to note that their findings were based on analyses conducted within a tropical watershed.
In contrast, Fathian et al. [112] conducted a performance comparison between the SWAT-derived ET estimates and those from the MOD16 product within a semi-arid basin. Their analysis indicated that the MODIS dataset tended to overstate ET values at both monthly and annual scales relative to the SWAT simulations. Additionally, Morsy et al. [113] applied the SWAT model to simulate ET and compared the results with the SSEBop and MOD16A2 products, in two different climatic zones (Mediterranean and hyper-arid climate conditions). Their findings revealed that SWAT-derived ET values frequently lay between those of the two satellite datasets, with the SSEBop product demonstrating marginally superior performance overall.

4. Conclusions

In this study, a high-resolution, well-developed SWAT model was implemented for the Upper Anthemountas Basin, with the primary objective of comparing simulated evapotranspiration outputs from the calibrated model to three (3) widely recognized remote sensing-based ET products. These products—the MODIS MOD16 Collection 5, the updated MODIS MOD16A2GF Collection 6.1, and the SSEBop Version 5 dataset—present several key advantages, such as open access availability, sufficient spatial resolution for basin-scale analysis, and use of the well-established Penman–Monteith method for evapotranspiration estimation. Both interval-based comparisons (monthly averages, seasonal, and annual) and continuous time series comparisons at a monthly time step were conducted between SWAT-simulated ET and satellite-derived products over the simulation period (2004–2014). Key features derived from the present study can be summarized as follows:
  • The hydrological model was calibrated using observed monthly streamflow records spanning 2004 to 2013, and the resulting performance was classified as satisfactory to very good, based on multiple established statistical evaluation metrics.
  • Over the simulation period, mean actual evapotranspiration was estimated, on average, at 367.8 mm and emerged as the most significant component of the water balance, accounting for approximately 65% of total precipitation.
  • Of all remote sensing-based ET datasets, MOD16A2-C5 exhibited the greatest agreement with the SWAT model outputs.
  • MOD16A2GF-C6.1 demonstrated moderate overall agreement and tended to overestimate ET in most years, yet it outperformed all other products in representing early summer ET dynamics.
  • The SSEBop-V5 product, while generally indicating weaker alignment with the modeled ET, displayed improved correspondence during the driest years of the simulation period.
  • Across all temporal ET comparisons, averaging the values of all satellite-derived products yields a consistently strong agreement with the calibrated SWAT-simulated ET.
These findings emphasize the importance of critical evaluation when using remotely sensed ET products as calibration data for hydrological models. While such datasets offer valuable insights, their variable performance underscores the importance of careful selection and context-specific interpretation. This consideration is particularly critical in model development and water resource planning for studies conducted over relatively small spatial domains, such as the one considered in the study.

Author Contributions

Conceptualization, S.S.; methodology, S.S. and I.S.; software, S.S.; validation, S.S.; formal analysis, S.S. and I.S.; investigation, S.S.; resources, S.S.; writing—original draft preparation, S.S.; writing—review and editing, S.S., I.S. and Z.M.; visualization, S.S. and I.S.; supervision, Z.M. All authors have read and agreed to the published version of the manuscript.

Funding

This research received no external funding.

Data Availability Statement

The data used in this study are contained within the article. Additional data are available upon request from the corresponding author.

Acknowledgments

Part of the research was conducted by Stefanos Sevastas at the School of Civil Engineering, Aristotle University of Thessaloniki, Thessaloniki, Greece. The authors would like to thank Grigorios Sevastas for providing a high-resolution satellite natural color image covering the entire study area.

Conflicts of Interest

The authors declare no conflicts of interest.

References

  1. Pan, S.; Pan, N.; Tian, H.; Friedlingstein, P.; Sitch, S.; Shi, H.; Arora, V.K.; Haverd, V.; Jain, A.K.; Kato, E.; et al. Evaluation of global terrestrial evapotranspiration using state-of-the-art approaches in remote sensing, machine learning and land surface modeling. Hydrol. Earth Syst. Sci. 2020, 24, 1485–1509. [Google Scholar] [CrossRef]
  2. Ghiat, I.; Mackey, H.R.; Al-Ansari, T. A review of evapotranspiration measurement models, techniques and methods for open and closed agricultural field applications. Water 2021, 13, 2523. [Google Scholar] [CrossRef]
  3. Rientjes, T.H.M.; Muthuwatta, L.P.; Bos, M.G.; Booij, M.J.; Bhatti, H.A. Multi-variable calibration of a semi-distributed hydrological model using streamflow data and satellite-based evapotranspiration. J. Hydrol. 2013, 505, 276–290. [Google Scholar] [CrossRef]
  4. Tobin, K.J.; Bennett, M.E. Constraining SWAT calibration with remotely sensed evapotranspiration data. JAWRA J. Am. Water Resour. Assoc. 2017, 53, 593–604. [Google Scholar] [CrossRef]
  5. Rajib, A.; Evenson, G.R.; Golden, H.E.; Lane, C.R. Hydrologic model predictability improves with spatially explicit calibration using remotely sensed evapotranspiration and biophysical parameters. J. Hydrol. 2018, 567, 668–683. [Google Scholar] [CrossRef]
  6. Parajuli, P.B.; Jayakody, P.; Ouyang, Y. Evaluation of using remote sensing evapotranspiration data in SWAT. Water Resour. Manag. 2018, 32, 985–996. [Google Scholar] [CrossRef]
  7. Herman, M.R.; Nejadhashemi, A.P.; Abouali, M.; Hernandez-Suarez, J.S.; Daneshvar, F.; Zhang, Z.; Anderson, M.C.; Sadeghi, A.M.; Hain, C.R.; Sharifi, A. Evaluating the role of evapotranspiration remote sensing data in improving hydrological modeling predictability. J. Hydrol. 2018, 556, 39–49. [Google Scholar] [CrossRef]
  8. Sirisena, T.J.G.; Maskey, S.; Ranasinghe, R. Hydrological model calibration with streamflow and remote sensing based evapotranspiration data in a data poor basin. Remote Sens. 2020, 12, 3768. [Google Scholar] [CrossRef]
  9. Dile, Y.T.; Ayana, E.K.; Worqlul, A.W.; Xie, H.; Srinivasan, R.; Lefore, N.; Dile, Y.T.; Ayana, E.K.; Worqlul, A.W.; Xie, H.; et al. Evaluating satellite-based evapotranspiration estimates for hydrological applications in data-scarce regions: A case in Ethiopia. Sci. Total Environ. 2020, 743s, 140702. [Google Scholar] [CrossRef]
  10. Shah, S.; Duan, Z.; Song, X.; Li, R.; Mao, H.; Liu, J.; Ma, T.; Wang, M. Evaluating the added value of multi-variable calibration of SWAT with remotely sensed evapotranspiration data for improving hydrological modeling. J. Hydrol. 2021, 603, 127046. [Google Scholar] [CrossRef]
  11. Sun, Z.; Lotz, T.; Huang, Q. An ET-based two-phase method for the calibration and application of distributed hydrological models. Water Resour. Manag. 2021, 35, 1065–1077. [Google Scholar] [CrossRef]
  12. Bennour, A.; Jia, L.; Menenti, M.; Zheng, C.; Zeng, Y.; Asenso Barnieh, B.; Jiang, M. Calibration and validation of SWAT model by using hydrological remote sensing observables in the Lake Chad Basin. Remote Sens. 2022, 14, 1511. [Google Scholar] [CrossRef]
  13. Alemayehu, T.; van Griensven, A.; Woldegiorgis, B.T.; Bauwens, W. An improved SWAT vegetation growth module and its evaluation for four tropical ecosystems. Hydrol. Earth Syst. Sci. 2017, 21, 4449. [Google Scholar] [CrossRef]
  14. Parajuli, P.B.; Risal, A.; Ouyang, Y.; Thompson, A. Comparison of SWAT and MODIS evapotranspiration data for multiple timescales. Hydrology 2022, 9, 103. [Google Scholar] [CrossRef]
  15. Koltsida, E.; Kallioras, A. Multi-variable SWAT model calibration using satellite-based evapotranspiration data and streamflow. Hydrology 2022, 9, 112. [Google Scholar] [CrossRef]
  16. Dangol, S.; Zhang, X.; Liang, X.Z.; Anderson, M.; Crow, W.; Lee, S.; Moglen, G.E.; McCarty, G.W. Multivariate calibration of the SWAT model using remotely sensed datasets. Remote Sens. 2023, 15, 2417. [Google Scholar] [CrossRef]
  17. Immerzeel, W.A.; Droogers, P. Calibration of a distributed hydrological model based on satellite evapotranspiration. J. Hydrol. 2008, 349, 411–424. [Google Scholar] [CrossRef]
  18. Verma, N. Simulation of hydrologic processes through SWAT and Modis ET for Sirsa River Basin in Western Himalaya. Int. J. Water Resour. Arid Environ. 2018, 7, 21–35. [Google Scholar]
  19. Odusanya, A.E.; Mehdi, B.; Schürz, C.; Oke, A.O.; Awokola, O.S.; Awomeso, J.A.; Adejuwon, J.O.; Schulz, K. Multi-site calibration and validation of SWAT with satellite-based evapotranspiration in a data-sparse catchment in southwestern Nigeria. Hydrol. Earth Syst. Sci. 2019, 23, 1113–1144. [Google Scholar] [CrossRef]
  20. Bárdossy, A.; Huang, Y.; Wagener, T. Simultaneous calibration of hydrological models in geographical space. Hydrol. Earth Syst. Sci. 2016, 20, 2913–2928. [Google Scholar] [CrossRef]
  21. Oliveira, A.M.; Fleischmann, A.S.; Paiva, R.C.D. On the contribution of remote sensing-based calibration to model hydrological and hydraulic processes in tropical regions. J. Hydrol. 2021, 597, 126184. [Google Scholar] [CrossRef]
  22. Michailovsky, C.I.; Coerver, B.; Mul, M.; Jewitt, G. Investigating sources of variability in closing the terrestrial water balance with remote sensing. Hydrol. Earth Syst. Sci. 2023, 27, 4335–4354. [Google Scholar] [CrossRef]
  23. Abbaspour, K.C.; Rouholahnejad, E.; Vaghefi, S.; Srinivasan, R.; Yang, H.; Klove, B. A continental scale hydrology and water quality model for Europe: Calibration and uncertainty of a high-resolution large-scale SWAT model. J. Hydrol. 2015, 524, 733–752. [Google Scholar] [CrossRef]
  24. Singh, G.; Kumar, E. Input data scale impacts on modeling output results: A review. J. Spat. Hydrol. 2017, 13, Article 4. [Google Scholar]
  25. Sevastas, S.; Siarkos, I.; Theodossiou, N.; Ifadis, I. Evaluating the use of measured and/or open access data in watershed modeling through an integrated modeling procedure. Desalination Water Treat. 2018, 133, 268–282. [Google Scholar] [CrossRef]
  26. Kumar, S.; Merwade, V. Impact of watershed subdivision and soil data resolution on SWAT model calibration and parameter uncertainty. JAWRA J. Am. Water Resour. Assoc. 2009, 45, 1179–1196. [Google Scholar] [CrossRef]
  27. Gregar, J.; Petrů, J.; Novotná, J. Evaluation of the SWAT model as an integrated management tool in the Švihov drinking water supply catchment. Soil Water Res. 2019, 14, 76–83. [Google Scholar] [CrossRef]
  28. Sevastas, S.; Siarkos, I.; Theodossiou, N.; Ifadis, I. Establishing wellhead protection areas and managing point and non-point pollution sources to support groundwater protection in the aquifer of Upper Anthemountas, Greece. Water Util. J. 2017, 16, 81–95. [Google Scholar]
  29. Sevastas, S.; Siarkos, I.; Theodossiou, N.; Ifadis, I.; Kaffas, K. Comparing hydrological models built upon open access and/or measured data in a GIS environment. In Proceedings of the 6th International Conference on Environmental Management, Engineering, Planning and Economics (CEMEPE) and SECOTOX Conference, Thessaloniki, Greece, 25–30 June 2017; pp. 377–386. [Google Scholar]
  30. Sevastas, S. Applying Geo-Information Systems, Numerical Models and Genetic Algorithms in Optimizing Groundwater Risk Assessment: A Case Study from the Upper Anthemountas River Basin. Ph.D. Thesis, Aristotle University of Thessaloniki, Thessaloniki, Greece, 2023. (In Greek). [Google Scholar]
  31. Sevastas, S.; Gasparatos, D.; Botsis, D.; Siarkos, I.; Diamantaras, K.I.; Bilas, G. Predicting bulk density using pedotransfer functions for soils in the Upper Anthemountas basin, Greece. Geoderma Reg. 2018, 14, e00169. [Google Scholar] [CrossRef]
  32. Misopolinos, N.; Silleos, N.; Kosmas, K.; Bilas, G.; Karapetsas, N.; Dionisiou, N. Development of an Integrated System for Soil Geographic Data and Delineation of Agricultural Zones in Greece; Payment and Control Agency for Guidance and Guarantee Community Aid (OPEKEPE) of the Greek Ministry of Agricultural Development and Food: Athens, Greece, 2015.
  33. Moriasi, D.N.; Arnold, J.G.; Van Liew, M.W.; Bingner, R.L.; Harmel, R.D.; Veith, T.L. Model evaluation guidelines for systematic quantification of accuracy in watershed simulations. Trans. ASABE 2007, 50, 885–900. [Google Scholar] [CrossRef]
  34. Kouchi, D.H.; Esmaili, K.; Faridhosseini, A.; Sanaeinejad, S.H.; Khalili, D.; Abbaspour, K.C. Sensitivity of calibrated parameters and water resource estimates on different objective functions and optimization algorithms. Water 2017, 9, 384. [Google Scholar] [CrossRef]
  35. Sao, D.; Kato, T.; Tu, L.H.; Thouk, P.; Fitriyah, A.; Oeurng, C. Evaluation of different objective functions used in the SUFI-2 calibration process of SWAT-CUP on water balance analysis: A case study of the Pursat river basin, Cambodia. Water 2020, 12, 2901. [Google Scholar] [CrossRef]
  36. Verma, S.; Verma, M.K.; Prasad, A.D.; Mehta, D.J.; Islam, M.N. Modeling of uncertainty in the estimation of hydrograph components in conjunction with the SUFI-2 optimization algorithm by using multiple objective functions. Model. Earth Syst. Environ. 2024, 10, 61–79. [Google Scholar] [CrossRef]
  37. Gupta, H.V.; Kling, H.; Yilmaz, K.K.; Martinez, G.F. Decomposition of the Mean Squared Error and NSE performance criteria: Implications for improving hydrological modelling. J. Hydrol. 2009, 377, 80–91. [Google Scholar] [CrossRef]
  38. Arnold, J.G.; Srinivasan, R.; Muttiah, R.S.; Williams, J.R. Large area hydrologic modeling and assessment part I: Model development. JAWRA J. Am. Water Resour. Assoc. 1998, 34, 73–89. [Google Scholar] [CrossRef]
  39. Winchell, M.; Srinivasan, R.; Di Luzio, M.; Arnold, J.G. Arcswat Interface for SWAT2012: User’s Guide; Blackland Research Center, Texas AgriLife Research: College Station, TX, USA, 2013; pp. 1–464.
  40. Monteiro, J.A.; Strauch, M.; Srinivasan, R.; Abbaspour, K.; Gücker, B. Accuracy of grid precipitation data for Brazil: Application in river discharge modelling of the Tocantins catchment. Hydrol. Process. 2016, 30, 1419–1430. [Google Scholar] [CrossRef]
  41. Roth, V.; Lemann, T. Comparing CFSR and conventional weather data for discharge and soil loss modelling with SWAT in small catchments in the Ethiopian Highlands. Hydrol. Earth Syst. Sci. 2016, 20, 921–934. [Google Scholar] [CrossRef]
  42. Arnold, J.G.; Kiniry, J.R.; Srinivasan, R.; Williams, J.R.; Haney, E.B.; Neitsch, S.L. SWAT Input/Output Documentation Version 2012; Texas Water Resources Institute: College Station, TX, USA, 2012; p. 654.
  43. Abbaspour, K.C.; Vaghefi, S.A.; Yang, H.; Srinivasan, R. Global soil, landuse, evapotranspiration, historical and future weather databases for SWAT Applications. Sci. Data 2019, 6, 263. [Google Scholar] [CrossRef]
  44. Wise, S. Cross-validation as a means of investigating DEM interpolation error. Comput. Geosci. 2011, 37, 978–991. [Google Scholar] [CrossRef]
  45. Acharya, T.D.; Yang, I. Exploring Landsat 8. Int. J. IT Eng. Appl. Sci. Res. (IJIEASR) 2015, 4, 4–10. [Google Scholar]
  46. Wang, D.; Zhan, Y.; Yu, T.; Liu, Y.; Jin, X.; Ren, X.; Chen, X.; Liu, Q. Improving meteorological input for surface energy balance system utilizing mesoscale weather research and forecasting model for estimating daily actual evapotranspiration. Water 2019, 12, 9. [Google Scholar] [CrossRef]
  47. Baig, M.H.A.; Zhang, L.; Shuai, T.; Tong, Q. Derivation of a tasselled cap transformation based on Landsat 8 at-satellite reflectance. Remote Sens. Lett. 2014, 5, 423–431. [Google Scholar] [CrossRef]
  48. Crist, E.P.; Kauth, R.J. The tasseled cap de-mystified. Photogramm. Eng. Remote Sens. 1986, 52, 81–86. [Google Scholar]
  49. Huang, C.; Wylie, B.; Yang, L.; Homer, C.; Zylstra, G. Derivation of a tasselled cap transformation based on Landsat 7 at-satellite reflectance. Int. J. Remote Sens. 2002, 23, 1741–1748. [Google Scholar] [CrossRef]
  50. Ghazali, M.F.; Susantoro, T.M.; Wikantika, K.; Harto, A.B.; Nurtyawan, R. Soil moisture mapping at paddy field in Indramayu Residence using Landsat 8 OLI/TIRS. HAYATI J. Biosci. 2020, 27, 71–81. [Google Scholar] [CrossRef]
  51. Aliaume, C.; Bodini, A.; Bondavalli, C.; Carreño, F.; Chapelle, A.; Duarte, P.; Esteve-Selma, M.A.; Falco, M.; Fiandrino, A.; Giordani, G.; et al. Model Benchmarks for Coastal Lagoons; EUR 22216EN.; European Commission, Joint Research Centre: Ispra, Italy, 2006; p. 82. [Google Scholar]
  52. Plus, M.; La Jeunesse, I.; Bouraoui, F.; Zaldívar, J.M.; Chapelle, A.; Lazure, P. Modelling water discharges and nitrogen inputs into a Mediterranean lagoon: Impact on the primary production. Ecol. Model. 2006, 193, 69–89. [Google Scholar] [CrossRef]
  53. Igder, O.M.; Alizadeh, H.; Mojaradi, B.; Bayat, M. Multivariate assimilation of satellite-based leaf area index and ground-based river streamflow for hydrological modelling of irrigated watersheds using SWAT+. J. Hydrol. 2022, 610, 128012. [Google Scholar] [CrossRef]
  54. Ma, T.; Duan, Z.; Li, R.; Song, X. Enhancing SWAT with remotely sensed LAI for improved modelling of ecohydrological process in subtropics. J. Hydrol. 2019, 570, 802–815. [Google Scholar] [CrossRef]
  55. Myneni, R.; Knyazikhin, Y.; Park, T. MODIS/Terra+ Aqua Leaf Area Index/FPAR 4-Day L4 Global 500 m SIN Grid V061; The Land Processes Distributed Active Archive Center (LP DAAC): Sioux Falls, SD, USA, 2021.
  56. Daneshvar, F.; Frankenberger, J.R.; Bowling, L.C.; Cherkauer, K.A.; de Lima Moraes, A.G. Development of strategy for SWAT hydrologic modeling in data-scarce regions of Peru. J. Hydrol. Eng. 2021, 26, 05021016. [Google Scholar] [CrossRef]
  57. Emberson, L.D. Development and Application of Methods for Modeling and Mapping Ozone Deposition and Stomatal Flux; Final Report; Department of Environment, Food and Regional Affairs: London, UK, 2003.
  58. Nelson, D.W.; Sommers, L.E. Total carbon, organic carbon, and organic matter. In Methods of Soil Analysis–Part 3 Chemical Methods; Sparks, D.L., Ed.; Soil Science Society of America: Fitchburg, MA, USA, 1996; pp. 961–1010. [Google Scholar]
  59. Pribyl, D.W. A critical review of the conventional SOC to SOM conversion factor. Geoderma 2010, 156, 75–83. [Google Scholar] [CrossRef]
  60. Bagarello, V.; Di Prima, S.; Iovino, M.; Provenzano, G. Estimating field-saturated soil hydraulic conductivity by a simplified Beerkan infiltration experiment. Hydrol. Process. 2014, 28, 1095–1103. [Google Scholar] [CrossRef]
  61. Penning de Vries, F.W.T.; Jansen, D.M.; ten Berge, H.F.M.; Bakema, A. Simulation of Ecophysiological Processes of GROWTH in Several Annual Crops; Centre for Agricultural Publishing and Documentation (Pudoc): Wageningen, The Netherlands, 1989. [Google Scholar]
  62. ten Berge, H.F.M. Heat and Water Transfer in Bare Topsoil and the Lower Atmosphere; Centre for Agricultural Publishing and Documentation (Pudoc): Wageningen, The Netherlands, 1996. [Google Scholar]
  63. Saxton, K.E.; Willey, P.H. The SPAW model for agricultural field and pond hydrologic simulation. In Watershed Models; Singh, V.P., Frevert, D.K., Eds.; CRC Press: Boca Raton, FL, USA, 2009; pp. 401–435. [Google Scholar]
  64. Williams, J.R. Chapter 25: The EPIC model. In Computer Models of Watershed Hydrology; Singh, V.P., Ed.; Resources Publications: Highlands Ranch, CO, USA, 1995; pp. 909–1000. [Google Scholar]
  65. Sheng, J.; Ma, L.; Jiang, P.A.; Li, B.; Huang, F.; Wu, H. Digital soil mapping to enable classification of the salt-affected soils in desert agro-ecological zones. Agric. Water Manag. 2010, 97, 1944–1951. [Google Scholar] [CrossRef]
  66. Akpa, S.I.; Odeh, I.O.; Bishop, T.F.; Hartemink, A.E. Digital mapping of soil particle-size fractions for Nigeria. Soil Sci. Soc. Am. J. 2014, 78, 1953–1966. [Google Scholar] [CrossRef]
  67. Boente, C.; Albuquerque, M.T.D.; Fernández-Braña, A.; Gerassis, S.; Sierra, C.; Gallego, J.R. Combining raw and compositional data to determine the spatial patterns of potentially toxic elements in soils. Sci. Total Environ. 2018, 631, 1117–1126. [Google Scholar] [CrossRef]
  68. Li, J.; Wan, H.; Shang, S. Comparison of interpolation methods for mapping layered soil particle-size fractions and texture in an arid oasis. Catena 2020, 190, 104514. [Google Scholar] [CrossRef]
  69. Lakaphossi, A.; Ziangas, E.; Nakos, G. Soil Map of Greece, Scale 1:50000; Forest Service Publications, Ministry of Agriculture: Athens, Greece, 1992.
  70. Danacova, M.; Vyleta, R.; Valent, P.; Hlavcova, K. The impact of slope gradients on the generation of surface runoff in laboratory conditions. In Proceedings of the 17th International Multidisciplinary Scientific GeoConference SGEM2017, Water Resources, Forest, Marine and Ocean Ecosystems, Vienna, Austria, 27–29 November 2017; pp. 677–684. [Google Scholar]
  71. Komatsu, Y.; Kato, H.; Zhu, B.; Wang, T.; Yang, F.; Rakwal, R.; Onda, Y. Effects of slope gradient on runoff from bare-fallow purple soil in China under natural rainfall conditions. J. Mt. Sci. 2018, 15, 738–751. [Google Scholar] [CrossRef]
  72. Zhang, X.; Zhu, Q.; Sang, J.; Ding, X. Effects of rainfall and the slope gradient on the soil and water loss in a purple soil area. Soil Water Res. 2022, 17, 232–242. [Google Scholar] [CrossRef]
  73. Yacoub, C.; Foguet, A.P. Slope effects on SWAT modeling in a mountainous basin. J. Hydrol. Eng. 2013, 18, 1663–1673. [Google Scholar] [CrossRef]
  74. Daggupati, P.; Pai, N.; Ale, S.; Douglas-Mankin, K.R.; Zeckoski, R.W.; Jeong, J.; Parajuli, P.B.; Saraswat, D.; Youssef, M.A. A recommended calibration and validation strategy for hydrologic and water quality models. Trans. ASABE 2015, 58, 1705–1719. [Google Scholar]
  75. Abbaspour, K.C.; Yang, J.; Maximov, I.; Siber, R.; Bogner, K.; Mieleitner, J.; Zobrist, J.; Srinivasan, R. Modelling hydrology and water quality in the pre-alpine/alpine Thur watershed using SWAT. J. Hydrol. 2007, 333, 413–430. [Google Scholar] [CrossRef]
  76. Yang, J.; Reichert, P.; Abbaspour, K.C.; Xia, J.; Yang, H. Comparing uncertainty analysis techniques for a SWAT application to the Chaohe Basin in China. J. Hydrol. 2008, 358, 1–23. [Google Scholar] [CrossRef]
  77. Wu, H.; Chen, B. Evaluating uncertainty estimates in distributed hydrological modeling for the Wenjing River watershed in China by GLUE, SUFI-2, and ParaSol methods. Ecol. Eng. 2015, 76, 110–121. [Google Scholar] [CrossRef]
  78. Niraula, R.; Norman, L.M.; Meixner, T.; Callegary, J.B. Multi-gauge calibration for modeling the semi-arid Santa Cruz Watershed in Arizona-Mexico border area using SWAT. Air Soil Water Res. 2012, 5, ASWR-S9410. [Google Scholar] [CrossRef]
  79. Xie, H.; Longuevergne, L.; Ringler, C.; Scanlon, B.R. Calibration and evaluation of a semi-distributed watershed model of Sub-Saharan Africa using GRACE data. Hydrol. Earth Syst. Sci. 2012, 16, 3083–3099. [Google Scholar] [CrossRef]
  80. Me, W.; Abell, J.M.; Hamilton, D.P. Effects of hydrologic conditions on SWAT model performance and parameter sensitivity for a small, mixed land use catchment in New Zealand. Hydrol. Earth Syst. Sci. 2015, 19, 4127–4147. [Google Scholar] [CrossRef]
  81. Ramos, M.C.; Martínez-Casasnovas, J.A. Climate change influence on runoff and soil losses in a rainfed basin with Mediterranean climate. Nat. Hazards 2015, 78, 1065–1089. [Google Scholar] [CrossRef]
  82. Zuo, D.; Xu, Z.; Peng, D.; Song, J.; Cheng, L.; Wei, S.; Abbaspour, K.C.; Yang, H. Simulating spatiotemporal variability of blue and green water resources availability with uncertainty analysis. Hydrol. Process. 2015, 29, 1942–1955. [Google Scholar] [CrossRef]
  83. Gholami, A.; Roshan, M.H.; Shahedi, K.; Vafakhah, M.; Solaymani, K. Hydrological stream flow modeling in the Talar catchment (central section of the Alborz Mountains, north of Iran): Parameterization and uncertainty analysis using SWAT-CUP. J. Water Land Dev. 2016, 30, 57. [Google Scholar] [CrossRef]
  84. Jung, C.G.; Lee, D.R.; Moon, J.W. Comparison of the Penman-Monteith method and regional calibration of the Hargreaves equation for actual evapotranspiration using SWAT-simulated results in the Seolma-cheon basin, South Korea. Hydrol. Sci. J. 2016, 61, 793–800. [Google Scholar] [CrossRef]
  85. Leta, O.T.; Van Griensven, A.; Bauwens, W. Effect of single and multisite calibration techniques on the parameter estimation, performance, and output of a SWAT model of a spatially heterogeneous catchment. J. Hydrol. Eng. 2017, 22, 05016036. [Google Scholar] [CrossRef]
  86. Romagnoli, M.; Portapila, M.; Rigalli, A.; Maydana, G.; Burgués, M.; García, C.M. Assessment of the SWAT model to simulate a watershed with limited available data in the Pampas region, Argentina. Sci. Total Environ. 2017, 596, 437–450. [Google Scholar] [CrossRef] [PubMed]
  87. Shannak, S. Calibration and validation of SWAT for sub-hourly time steps using SWAT-CUP. Int. J. Sustain. Water Environ. Syst. 2017, 9, 21–27. [Google Scholar]
  88. Kumar, N.; Singh, S.K.; Srivastava, P.K.; Narsimlu, B. SWAT Model calibration and uncertainty analysis for streamflow prediction of the Tons River Basin, India, using Sequential Uncertainty Fitting (SUFI-2) algorithm. Model. Earth Syst. Environ. 2017, 3, 1–13. [Google Scholar] [CrossRef]
  89. Chilkoti, V.; Bolisetti, T.; Balachandar, R. Multi-objective autocalibration of SWAT model for improved low flow performance for a small snowfed catchment. Hydrol. Sci. J. 2018, 63, 1482–1501. [Google Scholar] [CrossRef]
  90. Dash, P. Simulation of hydrologic processes through calibration of SWAT model with MODIS evapotranspiration data for an ungauged basin in Western Himalaya, India. In Geospatial Applications for Natural Resources Management; Singh, C.K., Ed.; CRC Press: Boca Raton, FL, USA, 2018; pp. 223–241. [Google Scholar]
  91. Nkiaka, E.; Nawaz, N.R.; Lovett, J.C. Effect of single and multi-site calibration techniques on hydrological model performance, parameter estimation and predictive uncertainty: A case study in the Logone catchment, Lake Chad basin. Stoch. Environ. Res. Risk Assess. 2018, 32, 1665–1682. [Google Scholar] [CrossRef]
  92. Kannan, N.; Santhi, C.; White, M.J.; Mehan, S.; Arnold, J.G.; Gassman, P.W. Some challenges in hydrologic model calibration for large-scale studies: A case study of SWAT model application to Mississippi-Atchafalaya River Basin. Hydrology 2019, 6, 17. [Google Scholar] [CrossRef]
  93. Dawit, M.; Olika, B.D.; Muluneh, F.B.; Leta, O.T.; Dinka, M.O. Assessment of surface irrigation potential of the Dhidhessa River Basin, Ethiopia. Hydrology 2020, 7, 68. [Google Scholar] [CrossRef]
  94. Pérez-Sánchez, J.; Senent-Aparicio, J.; Martínez Santa-María, C.; López-Ballesteros, A. Assessment of ecological and hydro-geomorphological alterations under climate change using SWAT and IAHRIS in the Eo River in Northern Spain. Water 2020, 12, 1745. [Google Scholar] [CrossRef]
  95. Duan, Y.; Luo, M.; Guo, X.; Cai, P.; Li, F. Study on the relationship between snowmelt runoff for different latitudes and vegetation growth based on an improved SWAT model in Xinjiang, China. Sustainability 2021, 13, 1189. [Google Scholar] [CrossRef]
  96. Musyoka, F.K.; Strauss, P.; Zhao, G.; Srinivasan, R.; Klik, A. Multi-step calibration approach for SWAT model using soil moisture and crop yields in a small agricultural catchment. Water 2021, 13, 2238. [Google Scholar] [CrossRef]
  97. Saade, J.; Atieh, M.; Ghanimeh, S.; Golmohammadi, G. Modeling impact of climate change on surface water availability using SWAT model in a semi-arid basin: Case of El Kalb River, Lebanon. Hydrology 2021, 8, 134. [Google Scholar] [CrossRef]
  98. Soulis, K.X.; Generali, K.A.; Papadaki, C.; Theodoropoulos, C.; Psomiadis, E. Hydrological response of natural mediterranean watersheds to forest fires. Hydrology 2021, 8, 15. [Google Scholar] [CrossRef]
  99. Mu, Q.; Zhao, M.; Running, S.W. Improvements to a MODIS global terrestrial evapotranspiration algorithm. Remote Sens. Environ. 2011, 115, 1781–1800. [Google Scholar] [CrossRef]
  100. Mu, Q.; Zhao, M.; Running, S.W. MODIS Global Terrestrial Evapotranspiration (ET) Product (NASA MOD16A2/A3). Algorithm Theoretical Basis Document, Collection, 5; Numerical Terradynamic Simulation Group Publications: Missoula, MT, USA, 2013; pp. 381–394. [Google Scholar]
  101. Running, S.W.; Mu, Q.; Zhao, M.; Moreno, A. MODIS/Terra Net Evapotranspiration Gap-Filled 8-Day L4 Global 500m SIN Grid V061. 2021, by NASA EOSDIS Land Processes DAAC; NASA Land Processes Distributed Active Archive Center: Sioux Falls, SD, USA, 2021. [CrossRef]
  102. Senay, G.B.; Parrish, G.E.; Schauer, M.; Friedrichs, M.; Khand, K.; Boiko, O.; Kagone, S.; Dittmeier, R.; Arab, S.; Ji, L. Improving the operational simplified surface energy balance evapotranspiration model using the forcing and normalizing operation. Remote Sens. 2023, 15, 260. [Google Scholar] [CrossRef]
  103. Kannan, N.; White, S.M.; Worrall, F.; Whelan, M.J. Sensitivity analysis and identification of the best evapotranspiration and runoff options for hydrological modelling in SWAT-2000. J. Hydrol. 2007, 332, 456–466. [Google Scholar] [CrossRef]
  104. Jimeno-Sáez, P.; Senent-Aparicio, J.; Pérez-Sánchez, J.; Pulido-Velazquez, D. A comparison of SWAT and ANN models for daily runoff simulation in different climatic zones of peninsular Spain. Water 2018, 10, 192. [Google Scholar] [CrossRef]
  105. Zhang, K.; Zhu, G.; Ma, J.; Yang, Y.; Shang, S.; Gu, C. Parameter analysis and estimates for the MODIS evapotranspiration algorithm and multiscale verification. Water Resour. Res. 2019, 55, 2211–2231. [Google Scholar] [CrossRef]
  106. Fisher, J.B.; Tu, K.; Baldocchi, D.D. Global Estimates of the Land–Atmosphere Water Flux Based on Monthly AVHRR and ISLSCP-II Data, Validated at 16 FLUXNET Sites. Remote Sens. Environ. 2008, 112, 901–919. [Google Scholar] [CrossRef]
  107. Piani, C.; Weedon, G.P.; Best, M.; Gomes, S.M.; Viterbo, P.; Hagemann, S.; Haerter, J.O. Statistical bias correction of global simulated daily precipitation and temperature for the application of hydrological models. J. Hydrol. 2010, 395, 199–215. [Google Scholar] [CrossRef]
  108. Herman, M.R.; Nejadhashemi, A.P.; Hernandez-Suarez, J.S.; Sadeghi, A.M. Analyzing the variability of remote sensing and hydrologic model evapotranspiration products in a watershed in Michigan. JAWRA J. Am. Water Resour. Assoc. 2020, 56, 738–755. [Google Scholar] [CrossRef]
  109. Chun, J.A.; Baik, J.; Kim, D.; Choi, M. A comparative assessment of SWAT-model-based evapotranspiration against regional-scale estimates. Ecol. Eng. 2018, 122, 1–9. [Google Scholar] [CrossRef]
  110. Abiodun, O.O.; Guan, H.; Post, V.E.; Batelaan, O. Comparison of MODIS and SWAT evapotranspiration over a complex terrain at different spatial scales. Hydrol. Earth Syst. Sci. 2018, 22, 2775–2794. [Google Scholar] [CrossRef]
  111. Nguyen, H.Q.; Kappas, M. Modeling surface runoff and evapotranspiration using SWAT and beach for a tropical watershed in North Vietnam, compared to MODIS products. Int. J. Adv. Remote Sens. GIS 2015, 4, 1367–1384. [Google Scholar] [CrossRef]
  112. Fathian, F.; Ahmadzadeh, H.; Bagheri Harooni, M.H. Comparison of evapotranspiration estimation methods based on remote sensing technique and SWAT model. Irrig. Water Eng. 2024, 15, 163–182. [Google Scholar]
  113. Morsy, M.; Sayad, T.; Abdou, M.I.; Aboelkhair, H. Comparative study of evapotranspiration from the SWAT model and MODIS-derived remote-sensing data in two climatic zones in Egypt. J. Water Clim. Change 2024, 15, 5219–5241. [Google Scholar] [CrossRef]
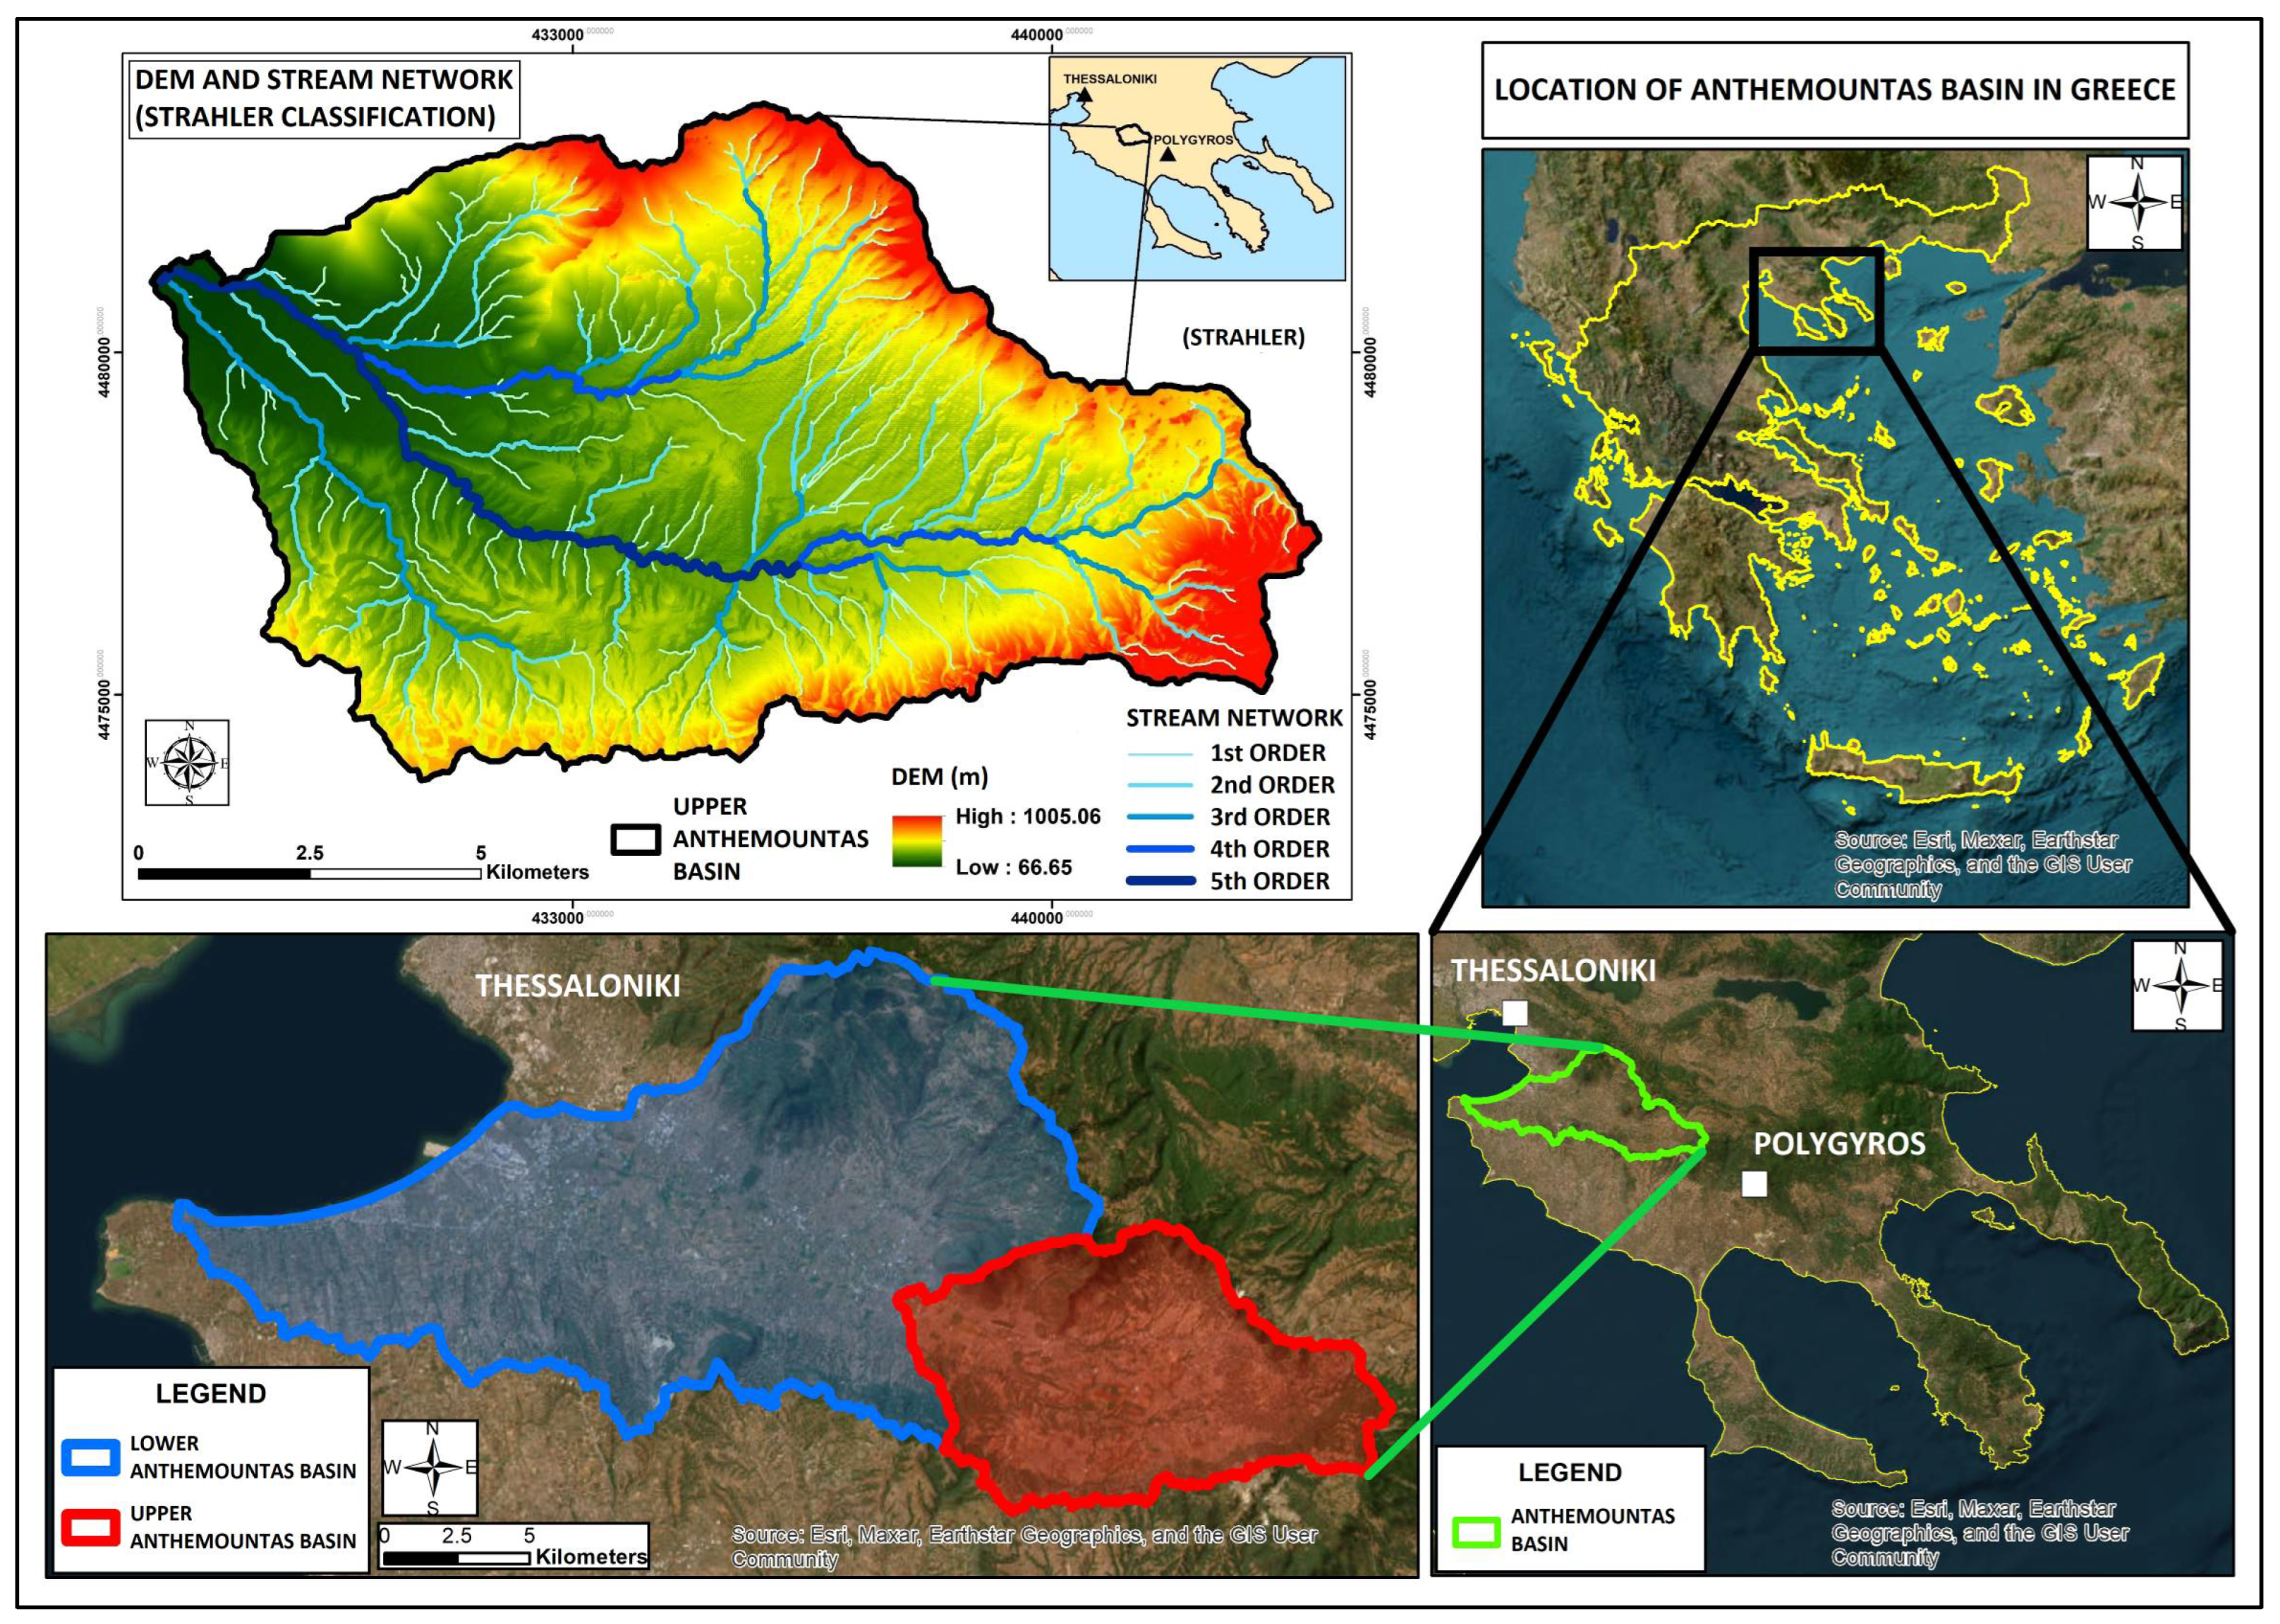
Figure 1. The geographical location, boundaries, and segmentation (Lower and Upper) of the Anthemountas Basin, along with boundaries, elevation data, and stream network of the Upper Anthemountas Basin, which serves as the study area.
Hydrology 12 00171 g001
Figure 2. Schematic representation of the methodological framework developed in the present study.
Hydrology 12 00171 g002
Figure 3. The Digital Elevation Model (DEM) of the study area (used as input in the SWAT model), along with the corresponding DEM evaluation points.
Hydrology 12 00171 g003
Figure 4. Land cover classification map of the study area (used as input in the SWAT model), where OLIV = olive trees, DWHT = durum wheat fields, CORN = corn fields, ALFA = alfalfa fields, COTS = cotton fields, MACC = Maquis forests, BROS = grasslands (brome grass), PINE = pine trees, FRSD = deciduous forests (Hungarian oak), BARR = barren land and abandoned magnesite mines, URMD = residential area.
Hydrology 12 00171 g004
Figure 5. Soil map classification of the study area (used as input in the SWAT model), where CT = coarse texture soils, ΜΤ = medium texture soils, FT = fine texture soils, ROCK = rocks, while numbers 1, 2, 3 represent soil depth layers, with 1 = from 0 to 30 cm depth, 2 = from 30 to 60 cm depth and 3 = from 60 to 100 cm depth.
Hydrology 12 00171 g005
Figure 6. Slope classification map of the study area.
Hydrology 12 00171 g006
Figure 7. Observed vs. simulated monthly streamflow after model calibration.
Hydrology 12 00171 g007
Figure 8. Water balance components and ratios for the study area as derived from the calibrated model across the out-printed simulation period (2004–2014).
Hydrology 12 00171 g008
Figure 9. Hydrograph of the simulated streamflow vs. rainfall for the out-printed simulation period (2004–2014).
Hydrology 12 00171 g009
Figure 10. Comparison of ET between calibrated SWAT and remotely sensed products over the out-printed simulation period (2004–2014).
Hydrology 12 00171 g010
Table 1. Basic geomorphological features of the Upper Anthemountas Basin.
Mean Elevation (m)Min Elevation (m)Max Elevation (m)Mean Slope (%)Perimeter (km)Area (km2)
352.366.71005.120.865.9106.5
Table 2. Performance evaluation metrics utilized in the study.
Statistical Metrics (Indices)Formula *Value RangeOptimal
Value
Root Mean Square Error
(RMSE)
R M S E = i = 1 n ( x i y i ) 2 n [0,+∞)0 (Lower is better)
Coefficient of Determination
(R2)
R 2 = i = 1 n x i x ¯ ( y i y ¯ ) i = 1 n ( x i x ¯ ) 2 i = 1 n ( y i y ¯ ) 2 2 [0,1]1 (Higher is better)
Modified Coefficient of
Determination (bR2)
b R 2 = y ¯   x ¯ R 2 ,   i f   y ¯ x ¯ x ¯ y ¯ R 2 ,   i f   y ¯ > x ¯ [0,1]1 (Higher is better)
Nash–Sutcliffe Efficiency
(NSE)
N S E = 1 i = 1 n x i y i 2 i = 1 n x i x ¯ 2 (−∞,1]1 (Higher is better)
Modified Nash–Sutcliffe Efficiency
(MNS)
M N S = 1 i = 1 n x i y i j i = 1 n x i x ¯ j   ( w h e r e   j N ) (−∞,1]1 (Higher is better)
Ratio of the Standard Deviation of Observations to the Root Mean Square Error
(RSR)
R S R = i = 1 n ( x i y i ) 2 i = 1 n ( x i x ¯ ) 2 [0,+∞)0 (Lower is better)
Kling–Gupta Efficiency
(KGE)
K G E = 1 r 1 2 + S D y S D x 1 2 + y ¯ x ¯ 1 2 (−∞,1]1 (Higher is better)
Percent Bias
(PBIAS)
P B I A S = 100 i = 1 n ( x i y i ) i = 1 n ( x i ) (−∞,+∞)0 (Lower absolute value is better)
* where n = total number of observations, x i = observed data, y i = simulated data, x ¯ = mean value of observed data, y ¯ = mean value of simulated data, j = 1 (proposed value in the literature), SDx = standard deviation of the observed data, SDy = standard deviation of the simulated data, r = correlation coefficient between observed and simulated data.
Table 3. Overview of input data sources acquired for applying the SWAT model in the Upper Anthemountas Basin.
Input Data in the SWAT ModelData Source
TopographyDigitizing and editing twenty-three (23) Hellenic Military Geographical Service (HMGS) elevation map sheets (4 m interval, 1:5000 scale) by using GIS techniques
Land CoverApplying various remote sensing techniques on satellite images (Landsat 5, 7, 8, and MODIS)
Soil
  • Collecting soil samples (45) from the study area
  • Performing field and laboratory measurements of key soil properties
  • Acquiring additional soil information from existing soil surveys (e.g., Misopolinos et al. [32])
  • Applying GIS techniques
ClimateData acquired from three (3) stations:
(1)
National Agricultural Research Foundation (NAGREF) station
(2)
Galatista station
(3)
Aristotle University of Thessaloniki (AUTH) station
Table 4. Mean annual climate data input for the SWAT model, where Prec = precipitation, Temp = temperature, MIN = minimum, MAX = maximum, RH = relative humidity, WS = wind speed, and SR = solar radiation.
Mean Annual Weather Data
YearPrec (mm)Temp (°C)MIN Temp (°C)MAX Temp (°C)RH (%)WS (m/s)SR (MJ/m2)
2002730.415.810.321.266.121.1111.55
2003784.315.59.921.070.091.0713.21
200454415.29.421.068.291.1215.64
2005533.114.78.820.668.071.9915.44
2006630.214.28.220.271.912.3515.11
200752515.38.921.667.732.3215.52
2008383.415.79.521.969.501.6514.29
2009693.215.49.321.573.481.7614.40
2010623.615.79.821.573.701.0614.87
2011475.415.09.021.074.391.2314.83
2012504.416.210.422.068.971.6415.46
2013404.616.09.822.272.761.5613.95
2014931.615.910.521.376.601.3014.65
Mean597.1715.429.5321.3070.891.5514.53
Table 5. Updated values for the parameters utilized in the SWAT database model with regard to maquis classification (“MACC”) scrubland.
SWAT Parameters for “MACC” ClassificationDescriptionValue RangeSelected ValueSource
BLAIMaximum Leaf Area Index2.4–3.12.8Analyzing/Editing
time series of
MODIS LAI
images
ALAI_MINMinimum Leaf Area Index0.24–0.350.3
T_OPT (°C)Optimal Temperature for Plant Growth-20[57]
T_BASE (°C)Minimum Temperature for Plant Growth-4
Table 6. Satellite-derived ET datasets used in the study.
Dataset NameDatasetSpatial
Resolution
Temporal
Resolution
Data
Source
Moderate Resolution Imaging Spectroradiometer (MODIS) Global Terrestrial
Evapotranspiration
MOD16A2 (Collection 5)1 kmMonthlyhttp://files.ntsg.umt.edu/data/NTSG_Products/MOD16/MOD16A2_MONTHLY.MERRA_GMAO_1kmALB/ (accessed on 3 January 2023)
MOD16A2GF (Collection 6.1)0.5 km8-dayhttps://appeears.earthdatacloud.nasa.gov (accessed on 7 January 2023)
Operational Simplified Surface Energy BalanceSSEBop
(Version 5)
1 kmMonthlyhttps://app.climateengine.org/climateEngine (accessed on 18 January 2023)
Table 7. Model performance evaluation for monthly discharge simulation.
IndexEvaluation Performance CriteriaModel Performance ResultsModel Performance Evaluation
Very GoodGoodSatisfactoryUnsatisfactory
R20.75 < R2 ≤ 10.65 < R2 ≤ 0.750.5 < R2 ≤ 0.65R2 ≤ 0.50.89Very Good
bR2--bR2 ≥ 0.4bR2 < 0.40.8Satisfactory
NSE0.75 < NSE ≤ 10.65 < NSE ≤ 0.750.5 < NSE ≤ 0.65NSE ≤ 0.50.79Very Good
MNS--MNS ≥ 0.4MNS < 0.40.50Satisfactory
RSR0 ≤ RSR ≤ 0.50.5 < RSR ≤ 0.60.6 < RSR ≤ 0.7RSR > 0.70.46Very Good
KGE0.9 ≤ KGE ≤ 10.75 ≤ KGE < 0.90.5 ≤ KGE < 0.75KGE < 0.50.69Satisfactory
PBIASPBIAS < ±10±10 ≤ PBIAS < ±15±15 ≤ PBIAS < ±25PBIAS ≥ ±25−23Satisfactory
Table 8. Values of several SWAT model parameters as adjusted after calibration.
ParameterUnitsDescription of the ParameterValue RangeFitted Value
MinMax
ALPHA_BFDaysBaseflow alpha factor010.5
ALPHA_BNKDaysBaseflow alpha factor for bank storage010.000167
GWQMNmmThreshold depth of water in the shallow aquifer required for return flow to occur050002383.33
REVAPMNmmThreshold depth of water in the shallow aquifer for “revap” to occur0500433.67
RCHRG_DP-Deep aquifer percolation fraction010.08
GW_REVAP-Groundwater “revap” coefficient0.020.20.19
OV_N-Manning’s “n” value for overland flow0.0110.342
CH_N2-Manning’s “n” value for the main channel00.30.213
CH_K2mm/hEffective hydraulic conductivity in main channel alluvium0500357.5
GW_DELAYDaysGroundwater delay time050049–192 *
ESCO-Soil evaporation compensation factor010.7–0.91 *
EPCO-Plant uptake compensation factor010.21–0.8 *
SOL_ZmmDepth from soil surface to bottom of layer030,0001500
BLAI (MACC)(kg/ha)/
(MJ/m2)
Maximum potential leaf area index0.5102.55
T_BASE (MACC)°CMinimum (base) temperature for plant growth0183
T_OPT (MACC)°COptimal temperature for plant growth113824
CN2-Runoff Curve Number3098(~−5%) **
* Varies with slope; ** varies with land use/land cover classes and hydrologic soil groups.
Table 9. Performance evaluation of remote sensing-derived ET products compared to simulated ET obtained by SWAT over the out-printed simulation period (2004–2014).
IndexRemote Sensing-Derived ET Products
MOD16A2-C5MOD16A2GF-C6.1SSEBop-V5
KGE0.5360.4820.171
PBIAS9.9530.18−16.81
RMSE13.3314.616.98
RSR0.7410.8120.944
Table 10. Mean monthly ET estimations of all dataset sources over the out-printed simulation period (2004–2014).
MonthMean Monthly ET (mm) of All Dataset SourcesAverage ET (mm) of All Remote Sensing Products
SWATMOD16A2-C5MOD16A2GF-C6.1SSEBop-V5
Jan16.9224.4824.187.0318.56
Feb20.0224.8526.316.5019.22
Mar30.3238.0040.8210.8829.90
Apr35.6753.1758.5733.9748.57
May60.8359.7270.9961.6164.11
Jun58.5438.9253.9673.7255.53
Jul34.0528.8842.9446.8239.55
Aug29.1327.3441.1940.0036.18
Sep28.9828.8634.9810.6824.84
Oct23.5329.4933.946.1823.20
Nov15.8225.7826.705.1019.19
Dec14.0124.9424.263.5217.58
Mean30.6533.7039.9025.5033.04
Table 11. Seasonal ET estimations of all dataset sources over the out-printed simulation period (2004–2014).
SeasonSeasonal ET (mm) of All Dataset SourcesAverage ET (mm) of All Remote Sensing Products
SWATMOD16A2-C5MOD16A2GF-C6.1SSEBop-V5
Winter49.9672.2372.5616.6153.80
Spring126.82150.90170.38106.46142.58
Summer121.7295.13138.09160.54131.26
Fall68.3384.1395.6321.9667.24
Table 12. Annual ET estimations of all dataset sources over the out-printed simulation period (2004–2014).
YearAnnual ET (mm) of All Dataset SourcesAverage ET (mm) of All Remote Sensing Products
SWATMOD16A2-C5MOD16A2GF-C6.1SSEBop-V5
2004385.88395.30460.10258.71371.37
2005403.80397.44460.30217.58358.44
2006399.12444.92510.64361.54439.03
2007387.37395.89461.24293.25383.46
2008298.90391.13476.54317.13394.94
2009445.84421.19499.46371.29430.65
2010366.71432.50511.20396.10446.60
2011308.20390.17481.72322.47398.12
2012344.75362.77434.38258.22351.79
2013304.54384.35459.85257.66367.29
2014401.02433.21511.91312.11419.07
Mean367.83404.44478.85306.00396.43
Disclaimer/Publisher’s Note: The statements, opinions and data contained in all publications are solely those of the individual author(s) and contributor(s) and not of MDPI and/or the editor(s). MDPI and/or the editor(s) disclaim responsibility for any injury to people or property resulting from any ideas, methods, instructions or products referred to in the content.