
Comprehensive Assessment of Water Quality of China’s Largest Freshwater Lake Under the Impact of Extreme Floods and Droughts


Abstract
1. Introduction
2. Materials and Methods
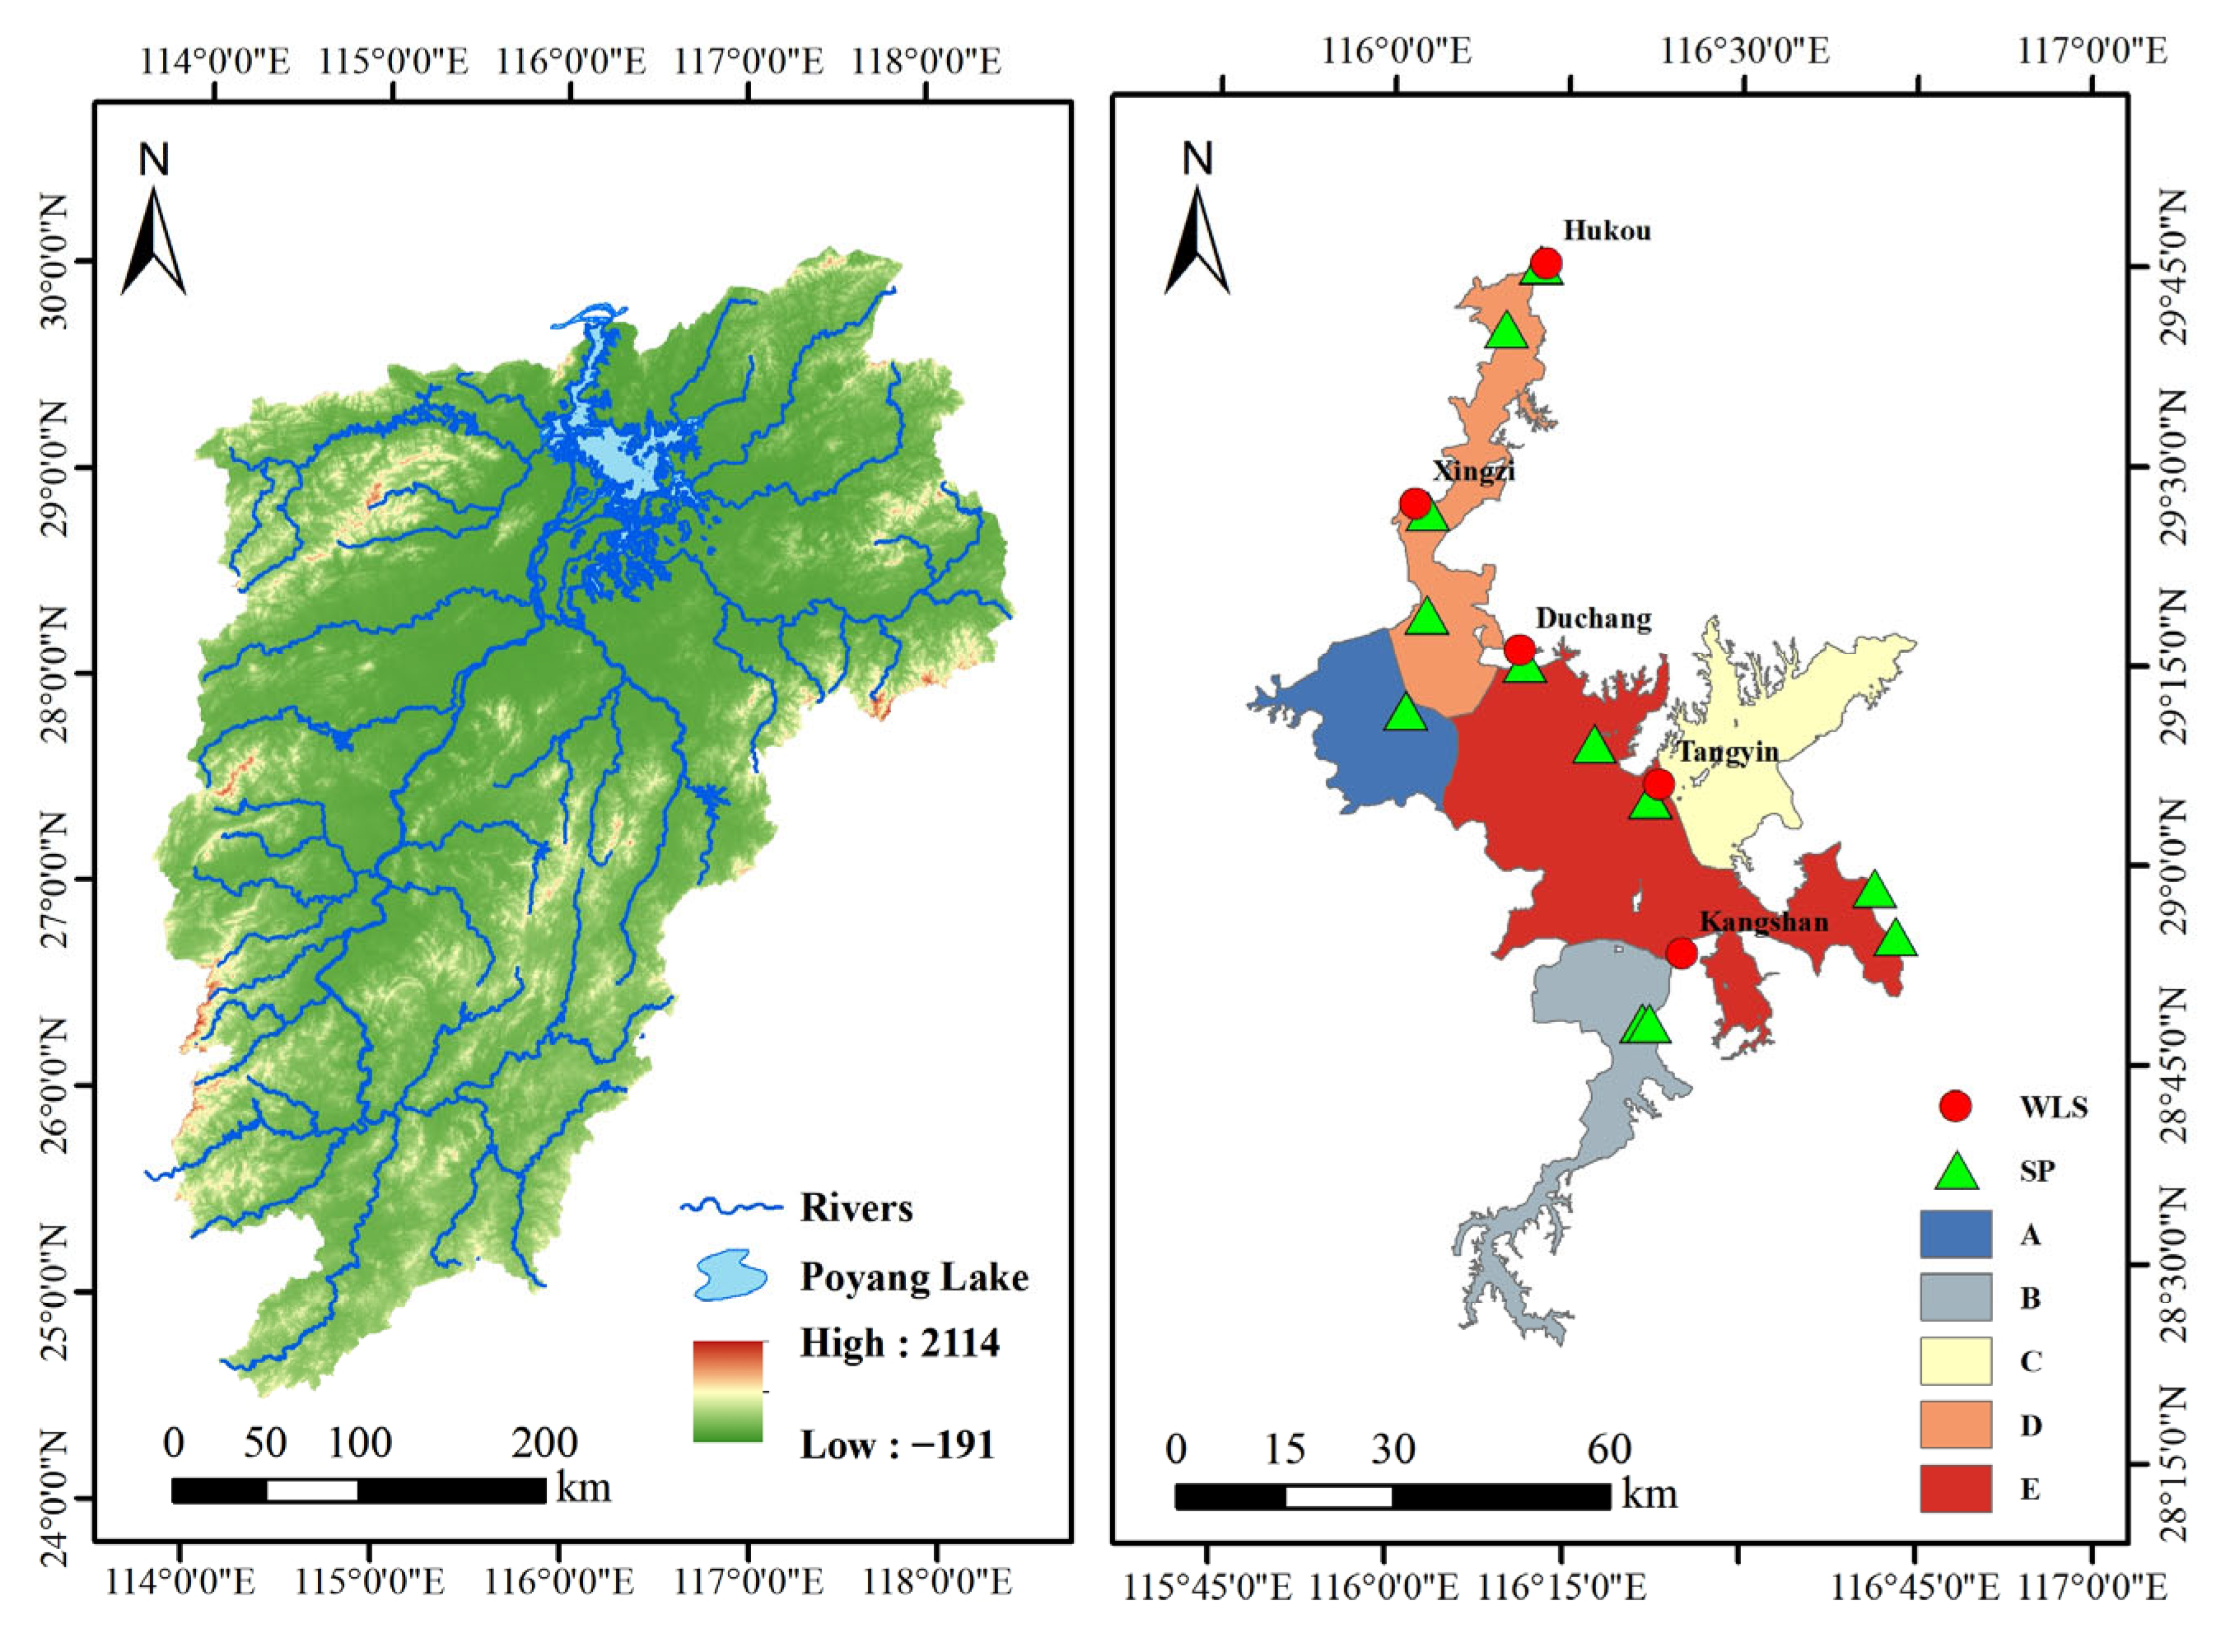
2.1. Study Area
2.2. Data Sources
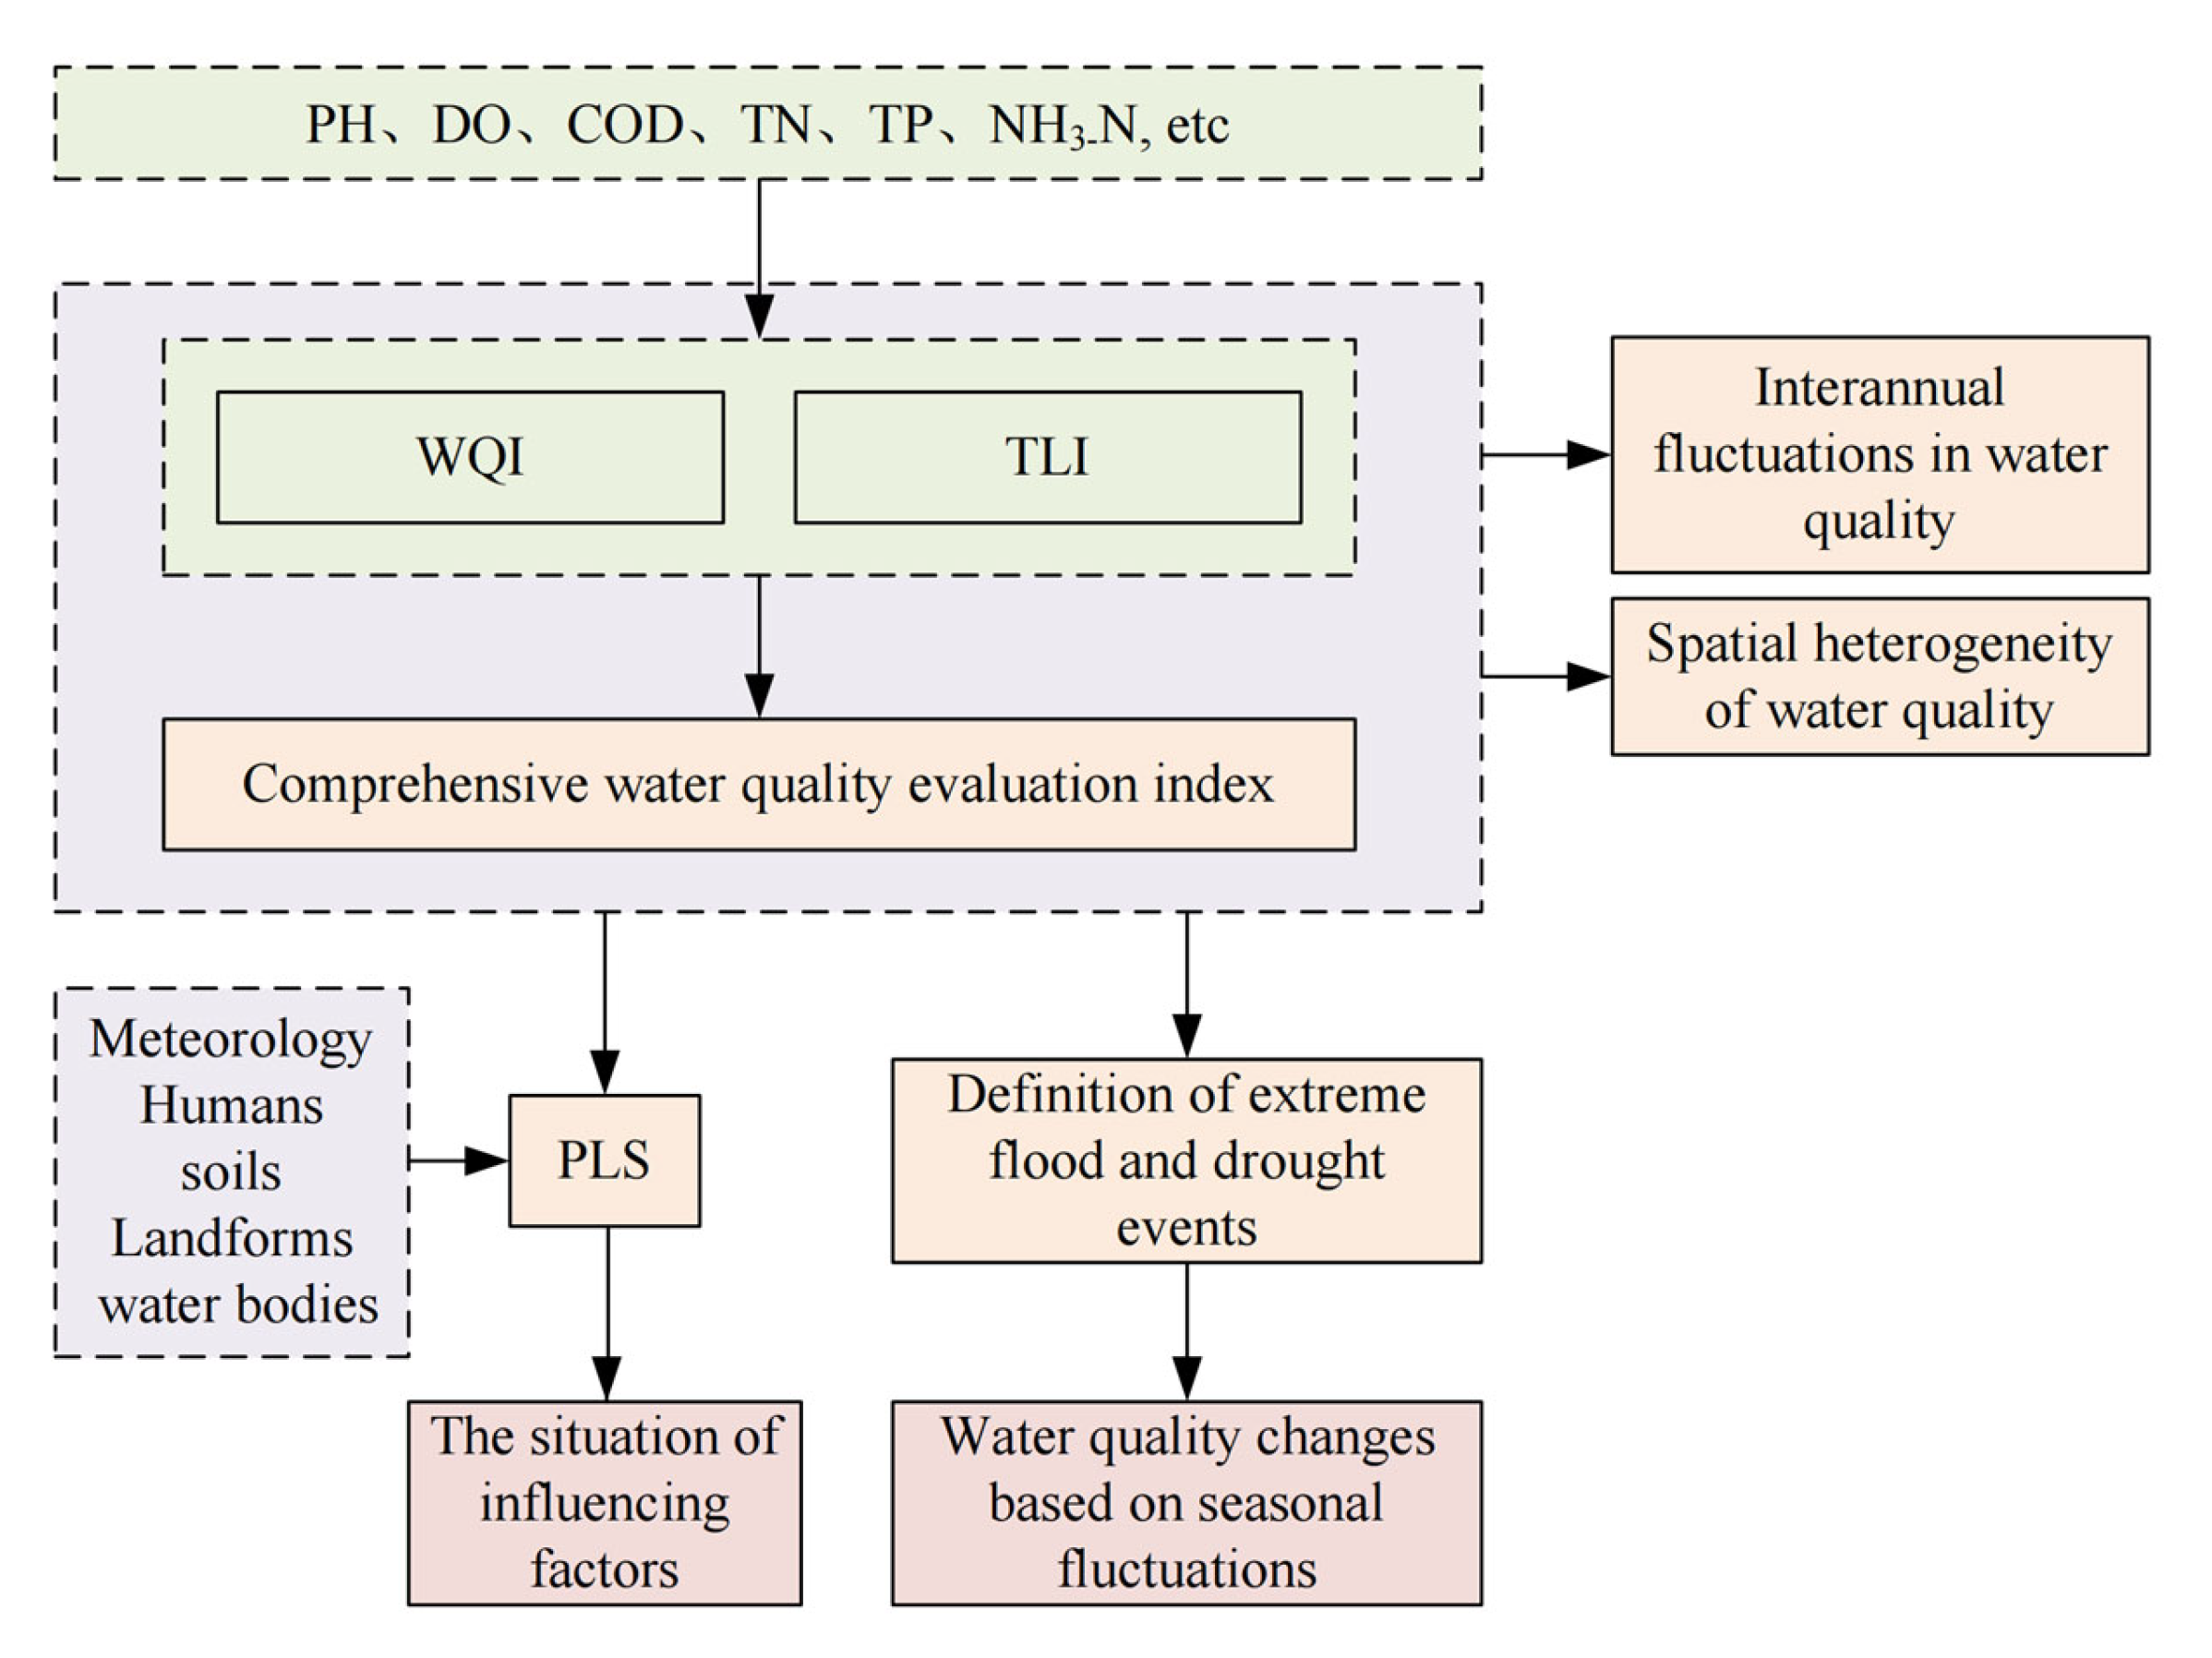
2.3. Method
2.3.1. Water Quality Evaluation Method
2.3.2. Definition of Extreme Flood and Drought Events
2.3.3. Partial Least Squares
3. Results
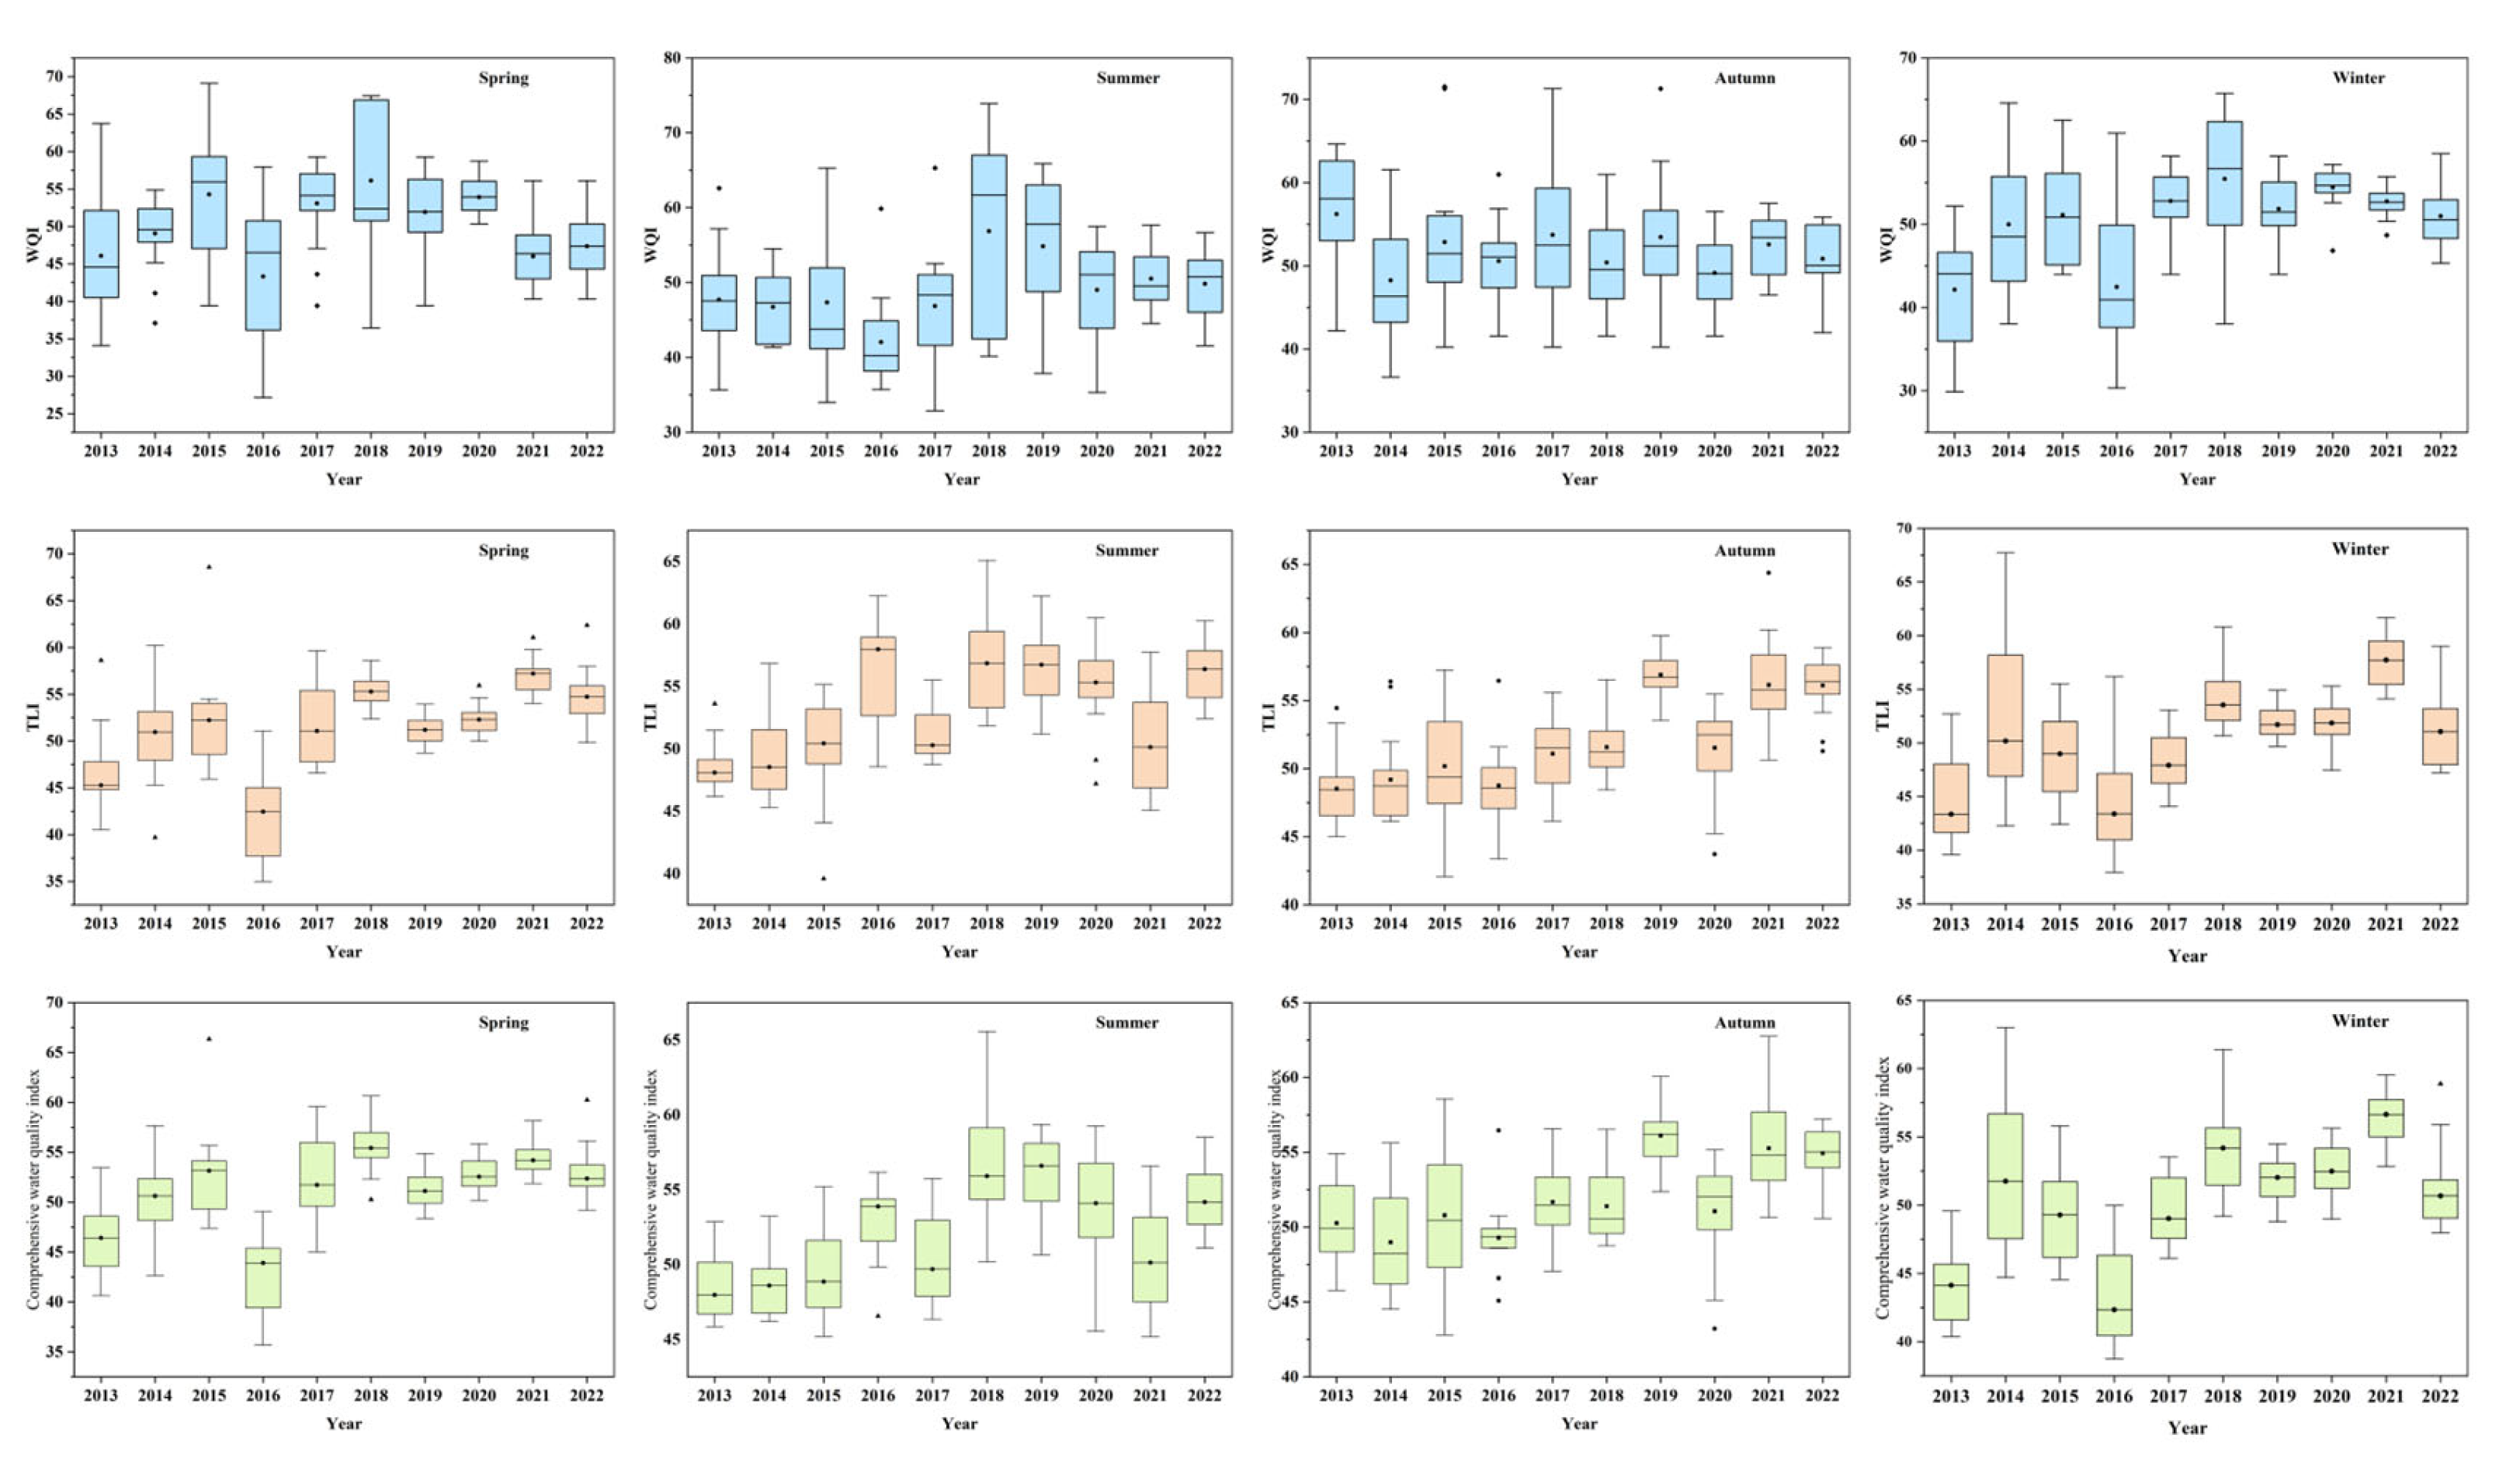
3.1. Interannual Variation of Water Quality
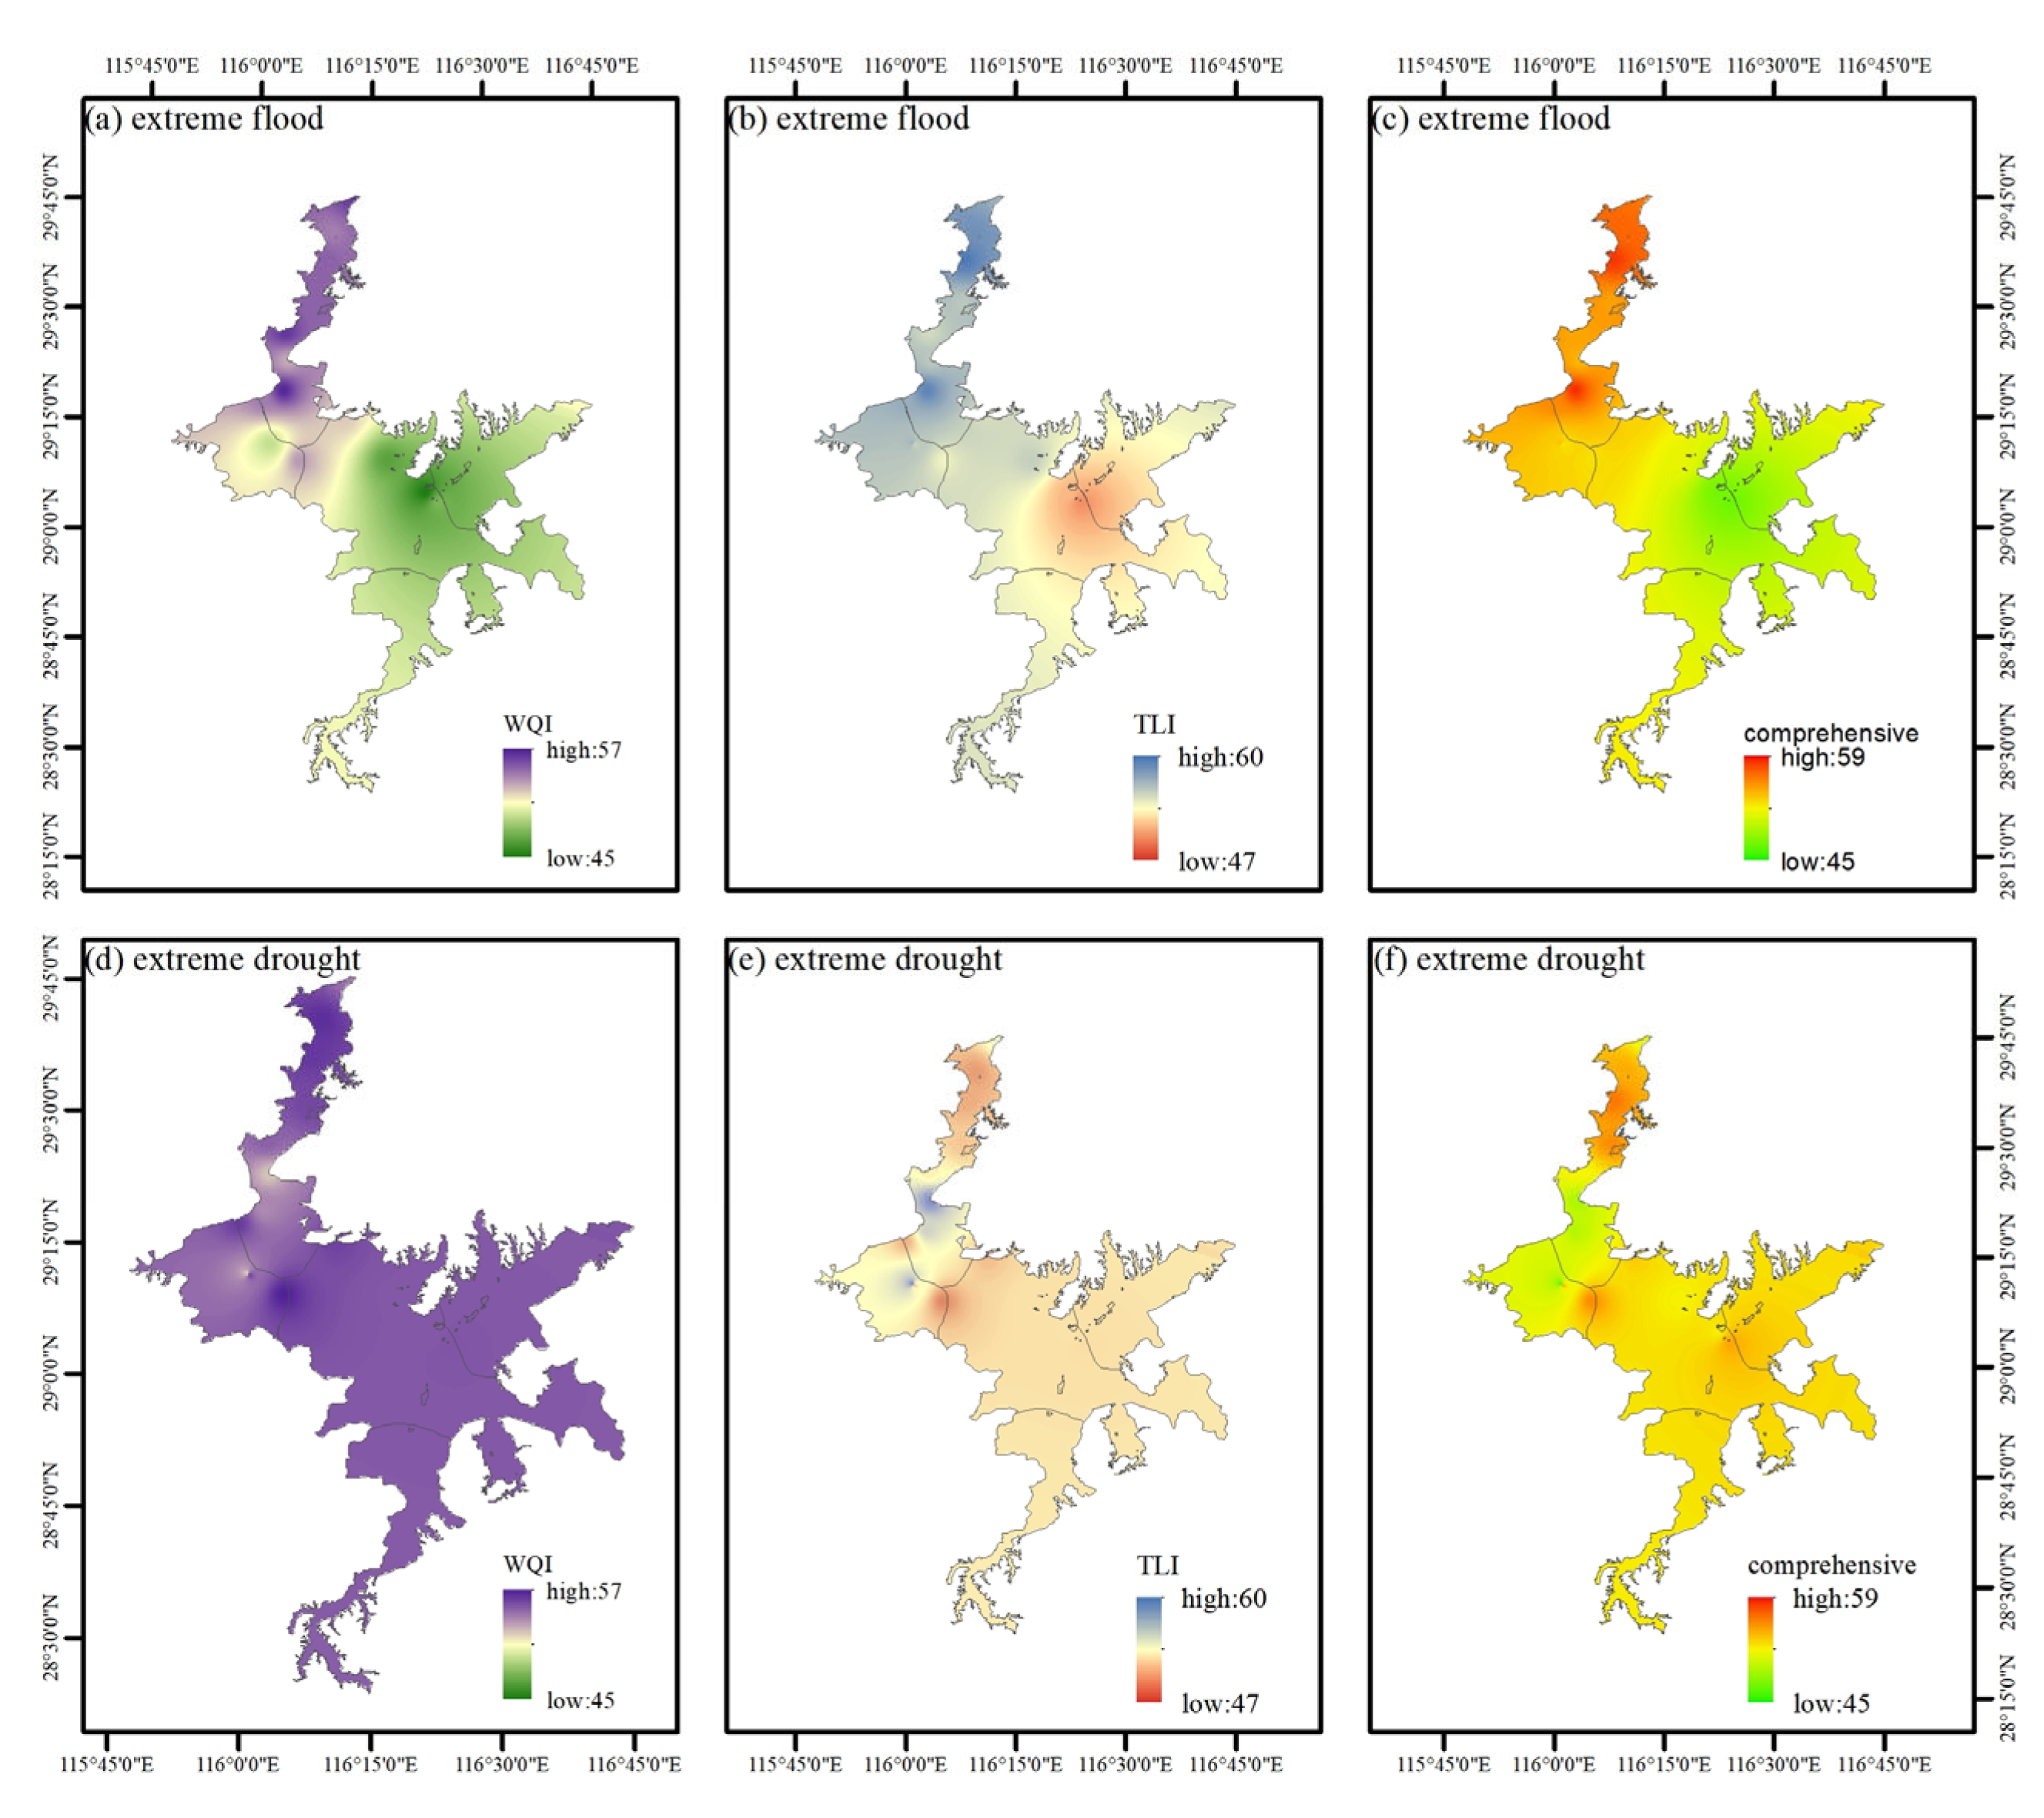
3.2. Analysis of Spatial Variations of Several Water Quality Evaluation Methods Under Extreme Flood and Drought Conditions
3.2.1. Spatial Variation of WQI
3.2.2. Spatial Variation of TLI
3.2.3. Spatial Variation of Comprehensive Evaluation
3.3. The Driving Mechanism of Water Quality Changes
3.4. Discussion
4. Conclusions
- (1)
- The water quality of Poyang Lake was slightly worse in summer and autumn than in spring and winter. Each water quality index reflects the different states of the water environment of Poyang Lake, among which the WQI of Poyang Lake from 2013 to 2022 was in the “medium” level, the TLI was in the “medium” and “eutrophic” state and the comprehensive water quality was in the “healthy” and “sub-healthy” state.
- (2)
- Each water quality evaluation index showed different response states to the influencing factors. SH, CA and AA had the most obvious influence on WQI. ADV, WR and WL had the greatest influence on TLI. The influence of WR and ADV on the comprehensive evaluation index was relatively large.
- (3)
- Extreme flood and drought events had significant effects on the water environment of Poyang Lake and have obvious spatial heterogeneity. WQI had an obvious positive response to flood, while TLI had both positive and negative responses to flood. Drought had a negative effect on the water quality evaluation index.
Supplementary Materials
Author Contributions
Funding
Data Availability Statement
Conflicts of Interest
References
- Liu, D.; Zhang, C.; Yan, N.; Yan, Y.; Duan, H. Eutrophication exacerbated organic pollution in lakes across China during the 1980s–2010s. Water Res. 2025, 268, 122782. [Google Scholar] [CrossRef] [PubMed]
- Xu, B.; Yuan, Z.; Sun, K.K.; Lin, Y.R. Evolution characteristics research on summer-autumn consistent drought of Poyang Lake based on the copula in the changing environment. IOP Conf. Ser. Earth Environ. Sci. 2020, 612, 012024. [Google Scholar] [CrossRef]
- Woolway, R.I.; Kraemer, B.M.; Lenters, J.D.; Merchant, C.J.; O’Reilly, C.M.; Sharma, S. Global lake responses to climate change. Nat. Rev. Earth Environ. 2020, 1, 388–403. [Google Scholar] [CrossRef]
- Xue, F.; Zhang, Q.; Melack, J.M.; Tang, H.; Yuan, S.; Jia, Y.; Xue, C.; Song, Y. Floodplain lakes: Linking hydrology to ecology and conservation. Earth-Sci. Rev. 2024, 258, 104967. [Google Scholar] [CrossRef]
- Li, H.; Sun, J.; Zhou, Q.; Sojka, M.; Ptak, M.; Luo, Y.; Wu, S.; Zhu, S.; Tóth, V.R. 150-year daily data (1870–2021) in lakes and rivers reveals intensifying surface water warming and heatwaves in the Pannonian Ecoregion (Hungary). J. Hydrol. Reg. Stud. 2024, 56, 101985. [Google Scholar] [CrossRef]
- Peng, J.; Chen, J.; Liu, S.; Liu, T.; Deng, F.; Fan, Y.; De Maeyer, P. Dynamics of the risk of algal blooms induced by surface water temperature in an alpine eutrophic lake under climate warming: Insights from Lake Dianchi. J. Hydrol. 2024, 643, 131949. [Google Scholar] [CrossRef]
- Zhang, L.; Ma, Q.; Zhao, Y.; Chen, H.; Hu, Y.; Ma, H. China’s strictest water policy: Reversing water use trends and alleviating water stress. J. Environ. Manag. 2023, 345, 118867. [Google Scholar] [CrossRef]
- Qin, B.; Zhang, Y.; Zhu, G.; Gao, G. Eutrophication control of large shallow lakes in China. Sci. Total Environ. 2023, 881, 163494. [Google Scholar] [CrossRef]
- Fan, Y.; Ni, Z.; Dong, Y.; Wang, S.; Zhang, J. Watershed sustainable phosphorus management involving the resilience assessment: Framework and application. Resour. Conserv. Recycl. 2025, 212, 107907. [Google Scholar] [CrossRef]
- Githaiga, K.B.; Njuguna, S.M.; Gituru, R.W.; Yan, X. Water quality assessment, multivariate analysis and human health risks of heavy metals in eight major lakes in Kenya. J. Environ. Manag. 2021, 297, 113410. [Google Scholar] [CrossRef]
- Song, Y.; Li, X.; Zheng, Y.; Zhang, G. Quantitative prediction of water quality in Dongjiang Lake watershed based on LUCC. Ecotoxicol. Environ. Saf. 2024, 284, 117005. [Google Scholar] [CrossRef] [PubMed]
- Zhang, F.; Tang, H.; Jin, G.; Zhu, Y.; Zhang, H.; Stewart, R.A.; Bertone, E.; Yuan, S. Evaluating nutrient distribution and eutrophication pattern in a shallow impounded lake: Exploring the influence of floods. Int. J. Sediment Res. 2024, 39, 375–385. [Google Scholar] [CrossRef]
- Wei, Z.; Wei, L.; Yang, H.; Wang, Z.; Xiao, Z.; Li, Z.; Yang, Y.; Xu, G. Water Quality Grade Identification for Lakes in Middle Reaches of Yangtze River Using Landsat-8 Data with Deep Neural Networks (DNN) Model. Remote Sens. 2022, 14, 6238. [Google Scholar] [CrossRef]
- Ariyan, T.N.; Quraishi, S.B.; Nur, E.A.M.; Khan, M.S.R.; Faria, F.F.; Kabir, A. Comprehensive analysis and human health risk assessment of tap water quality in Dhaka City, Bangladesh: Integrating source identification, index-based evaluation, and heavy metal assessment. J. Hazard. Mater. 2024, 485, 136837. [Google Scholar] [CrossRef]
- Lei, C. Evaluating coupled influences of slope class and land use change on water quality using single and composite indices in an agricultural basin. Catena 2025, 248, 108584. [Google Scholar] [CrossRef]
- Liu, Z.; Liu, L.; Li, Y.; Li, X. Influence of urban green space landscape pattern on river water quality in a highly urbanized river network of Hangzhou city. J. Hydrol. 2023, 621, 129602. [Google Scholar] [CrossRef]
- Zhu, H.; Tong, G.; Duan, N.; Ma, H.; Song, Q.; Wang, J.; Luo, Y.; Zhang, Q.; Yu, X.; Jin, S.-Q. Analysis of the complex correlations between land use and water quality using the PLS-SEM method combined with fluorescence fingerprinting data. J. Environ. Manag. 2025, 373, 123688. [Google Scholar] [CrossRef]
- He, N.; Guo, W.; Lan, J.; Yu, Z.; Wang, H. The impact of human activities and climate change on the eco-hydrological processes in the Yangtze River basin. J. Hydrol. Reg. Stud. 2024, 53, 101753. [Google Scholar] [CrossRef]
- Chen, Y.; Duo, L.; Zhao, D.; Zeng, Y.; Guo, X. The response of ecosystem vulnerability to climate change and human activities in the Poyang lake city group, China. Environ. Res. 2023, 233, 116473. [Google Scholar] [CrossRef]
- Kumar Goyal, M.; Poonia, V.; Jain, V. Three decadal urban drought variability risk assessment for Indian smart cities. J. Hydrol. 2023, 625, 130056. [Google Scholar] [CrossRef]
- Lai, X.; Zeng, H.; Zhao, X.; Shao, Y.; Guo, X. Impact of Extreme Drought on Vegetation Greenness in Poyang Lake Wetland. Forests 2024, 15, 1756. [Google Scholar] [CrossRef]
- Ding, Y.; Zhao, J.; Peng, W.; Zhang, J.; Chen, Q.; Fu, Y.; Duan, M. Stochastic trophic level index model: A new method for evaluating eutrophication state. J. Environ. Manag. 2021, 280, 111826. [Google Scholar] [CrossRef] [PubMed]
- Quevedo-Castro, A.; Bustos-Terrones, Y.A.; Bandala, E.R.; Loaiza, J.G.; Rangel-Peraza, J.G. Modeling the effect of climate change scenarios on water quality for tropical reservoirs. J. Environ. Manag. 2022, 322, 116137. [Google Scholar] [CrossRef] [PubMed]
- Kumar, D.; Kumar, R.; Sharma, M.; Awasthi, A.; Kumar, M. Global water quality indices: Development, implications, and limitations. Total Environ. Adv. 2024, 9, 200095. [Google Scholar] [CrossRef]
- Luong, H.A.; Rohlfs, A.M.; Facey, J.A.; Colville, A.; Mitrovic, S.M. Long-term study of phytoplankton dynamics in a supply reservoir reveals signs of trophic state shift linked to changes in hydrodynamics associated with flow management and extreme events. Water Res. 2024, 256, 121547. [Google Scholar] [CrossRef]
- Wang, W.; Liu, C.; Zhang, F.; Leong, T.; Shi, J.; Zhang, Z.; Xin, H. Evaluation of impacts of environmental factors and land use on seasonal surface water quality in arid and humid regions using structural equation models. Ecol. Indic. 2022, 144, 109546. [Google Scholar] [CrossRef]
- An, S.; Song, Y.; Fu, Q.; Qi, R.; Wu, Z.; Ge, F.; Lu, X.; An, W.; Han, W. Reclaimed water use improved polluted water’s self-purification capacity—Evidenced by water quality factors and bacterial community structure. J. Clean. Prod. 2023, 386, 135736. [Google Scholar] [CrossRef]
- Qin, B.; Deng, J.; Shi, K.; Wang, J.; Brookes, J.; Zhou, J.; Zhang, Y.; Zhu, G.; Paerl, H.W.; Wu, L. Extreme Climate Anomalies Enhancing Cyanobacterial Blooms in Eutrophic Lake Taihu, China. Water Resour. Res. 2021, 57, e2020WR029371. [Google Scholar] [CrossRef]
- Salomon, K.Y.; Brahima, S.; Maxime, K.N.g. Impacts of Anthropogenic Activities on Water Quality of Ouangolodougou Dam, Côte d’Ivoire. Int. J. Environ. Clim. Change 2024, 14, 64–81. [Google Scholar] [CrossRef]
- Huang, S.; Xia, J.; Wang, Y.; Wang, G.; She, D.; Lei, J. Pollution loads in the middle-lower Yangtze river by coupling water quality models with machine learning. Water Res. 2024, 263, 122191. [Google Scholar] [CrossRef]
- You, R.; Wang, S.; Wan, L.; Dong, F. Towards the development of a ‘land-river-lake’ two-stage deep learning model for water quality prediction and its application in a large plateau lake. J. Hydrol. 2024, 645, 132173. [Google Scholar] [CrossRef]
- Peng, S.; Wu, P.; Lu, Y.; Chen, L.; Wang, Z.; Lu, Y. Influence of river structure and hydrodynamics on water quality in the upper Taihu Basin, China. J. Clean. Prod. 2024, 453, 142262. [Google Scholar] [CrossRef]
- Li, B.; Wan, R.; Yang, G.; Wang, S.; Wagner, P.D. Exploring the spatiotemporal water quality variations and their influencing factors in a large floodplain lake in China. Ecol. Indic. 2020, 115, 106454. [Google Scholar] [CrossRef]
- Van Vliet, M.T.H.; Thorslund, J.; Strokal, M.; Hofstra, N.; Flörke, M.; Ehalt Macedo, H.; Nkwasa, A.; Tang, T.; Kaushal, S.S.; Kumar, R.; et al. Global river water quality under climate change and hydroclimatic extremes. Nat. Rev. Earth Environ. 2023, 4, 687–702. [Google Scholar] [CrossRef]
- Wang, X.; Ding, L.; Wu, Y.; Bol, R. Combined effects of flood, drought and land use dominate water quality and nutrient exports in Jialing River basin, SW China. Sci. Total Environ. 2024, 954, 176733. [Google Scholar] [CrossRef]
- Li, B.; Yang, G.; Wan, R. Multidecadal water quality deterioration in the largest freshwater lake in China (Poyang Lake): Implications on eutrophication management. Environ. Pollut. 2020, 260, 114033. [Google Scholar] [CrossRef]
- Wang, W.; Yang, P.; Xia, J.; Zhang, S.; Hu, S. Changes in the water environment and its major driving factors in Poyang Lake from 2016 to 2019, China. Environ. Sci. Pollut. Res. Int. 2022, 30, 3182–3196. [Google Scholar] [CrossRef]
- Zhu, Z.; Zhang, S.; Zhang, Y.; Lu, H.; Feng, X.; Jin, H.; Gao, Y. Flood risk transfer analysis based on the “Source-Sink” theory and its impact on ecological environment: A case study of the Poyang Lake Basin, China. Sci. Total Environ. 2024, 921, 171064. [Google Scholar] [CrossRef]
- Lin, Y.-I.; Pan, S.-Y.; Chang, H.-H.; Yu, M.-S.; Lin, W.-L. Will extreme drought impact the reservoir water quality? A 30-year observational study. Agric. Water Manag. 2023, 289, 108574. [Google Scholar] [CrossRef]
- Yin, Y.; Xia, R.; Chen, Y.; Jia, R.; Zhong, N.; Yan, C.; Hu, Q.; Li, X.; Zhang, H. Non-steady state fluctuations in water levels exacerbate long-term and seasonal degradation of water quality in river-connected lakes. Water Res. 2023, 242, 120247. [Google Scholar] [CrossRef]
- Chen, H.; Jin, G.; Tang, H.; Wu, J.; Wang, Y.-G.; Zhang, Z.; Deng, Y.; Zhang, S. Spatiotemporal variations of water levels and river-lake interaction in the Poyang Lake basin under the extreme drought. J. Hydrol. Reg. Stud. 2025, 57, 102165. [Google Scholar] [CrossRef]


Disclaimer/Publisher’s Note: The statements, opinions and data contained in all publications are solely those of the individual author(s) and contributor(s) and not of MDPI and/or the editor(s). MDPI and/or the editor(s) disclaim responsibility for any injury to people or property resulting from any ideas, methods, instructions or products referred to in the content. |
© 2025 by the authors. Licensee MDPI, Basel, Switzerland. This article is an open access article distributed under the terms and conditions of the Creative Commons Attribution (CC BY) license (https://creativecommons.org/licenses/by/4.0/).
Share and Cite
Mao, Z.; Cheng, J.; Xu, L.; Jiang, M.; You, H. Comprehensive Assessment of Water Quality of China’s Largest Freshwater Lake Under the Impact of Extreme Floods and Droughts. Hydrology 2025, 12, 192. https://doi.org/10.3390/hydrology12070192
Mao Z, Cheng J, Xu L, Jiang M, You H. Comprehensive Assessment of Water Quality of China’s Largest Freshwater Lake Under the Impact of Extreme Floods and Droughts. Hydrology. 2025; 12(7):192. https://doi.org/10.3390/hydrology12070192
Chicago/Turabian StyleMao, Zhiyu, Junxiang Cheng, Ligang Xu, Mingliang Jiang, and Hailin You. 2025. "Comprehensive Assessment of Water Quality of China’s Largest Freshwater Lake Under the Impact of Extreme Floods and Droughts" Hydrology 12, no. 7: 192. https://doi.org/10.3390/hydrology12070192
APA StyleMao, Z., Cheng, J., Xu, L., Jiang, M., & You, H. (2025). Comprehensive Assessment of Water Quality of China’s Largest Freshwater Lake Under the Impact of Extreme Floods and Droughts. Hydrology, 12(7), 192. https://doi.org/10.3390/hydrology12070192