Article

Experimental Study on Influence of Height of Full-Width Plate Weirs on Flow Behavior, Discharge, and Energy Dissipation

by
Ali Mahdian Khalili
1,*,
Hossein Sohrabzadeh Anzani
2,
Mehdi Hamidi
1 and
Sameh Ahmed Kantoush
2
1
Faculty of Civil Engineering, Babol Noshirvani University of Technology, Shariati Avenue, Babol 4714871167, Iran
2
Water Resources Research Center, Disaster Prevention Research Institute, Kyoto University, Uji 6110011, Japan
*
Author to whom correspondence should be addressed.
Hydrology 2025, 12(7), 176; https://doi.org/10.3390/hydrology12070176
Submission received: 15 January 2025 / Revised: 22 March 2025 / Accepted: 23 March 2025 / Published: 1 July 2025
(This article belongs to the Section Hydrological and Hydrodynamic Processes and Modelling)

Abstract

The role of weirs in flow regulation in water resources infrastructure and flood control is well known. In the meantime, the study of full-width plate weirs (FWPW), due to their wide application and lacking findings, is of great importance. In this study, experimental models were conducted at Babol Noshirvani University of Technology to investigate flow passing through FWPWs with five different heights (p = 0.07, 0.09, 0.11, and 0.15 m) under eight discharge conditions (Q = 1.4 to 6.3 L/s). The experiments were carried out in a flume measuring 4 m in length, 0.6 m in width, and 0.2 m in height. The discharges were measured with a calibrated flowmeter, and the water depths upstream of the weir (h) and the tailwater depths (h1) were measured with a point gauge with an accuracy of 0.1 mm. For each test, the discharge coefficient (Cd), relative residual energy (E1/E0), and relative energy dissipation ((E0E1)/E0) were computed. The proposed equation for calculating discharge achieved good accuracy with RMSE = 0.0002, MAE=0.0002, and R2 = 0.997. Results show a reducing trend of Cd by increasing h/P, which is compatible with previous results. It was observed that at a constant discharge, relative residual energy reduces by an average of 47% by increasing weir height, and at a constant P, increasing flow discharge increases it a little. A novel accurate equation for relative energy dissipation in FWPW was proposed based on h/P that provided specific constant coefficients for each p value.

1. Introduction

In recent decades, global warming and population growth have intensified climate change, influencing watersheds and water resources [1,2,3,4,5,6,7]. This matter, along with the increasing water needs of human societies, increases the requirement for the correct water distribution for sustainable development [8,9,10]. Additionally, inefficient irrigation and water distribution infrastructure due to the limited capacity of dams and maintenance requirements influence water resources management works [11,12]. Weirs could assist in reaching this aim through water level regulation and flood control in water distribution and conveyance networks in downstream regions [13,14]. Furthermore, weir safety in flood performance is of high importance [15]. Weirs can be classified based on specific characteristics, including cross-sectional shape, plan view, or crest length. From the point of view of cross-sectional shape, rectangular, triangular, parabolic, elliptic, and circular weirs are common types [16]. Investigating the discharge capacity of a weir crest length is an essential factor [17,
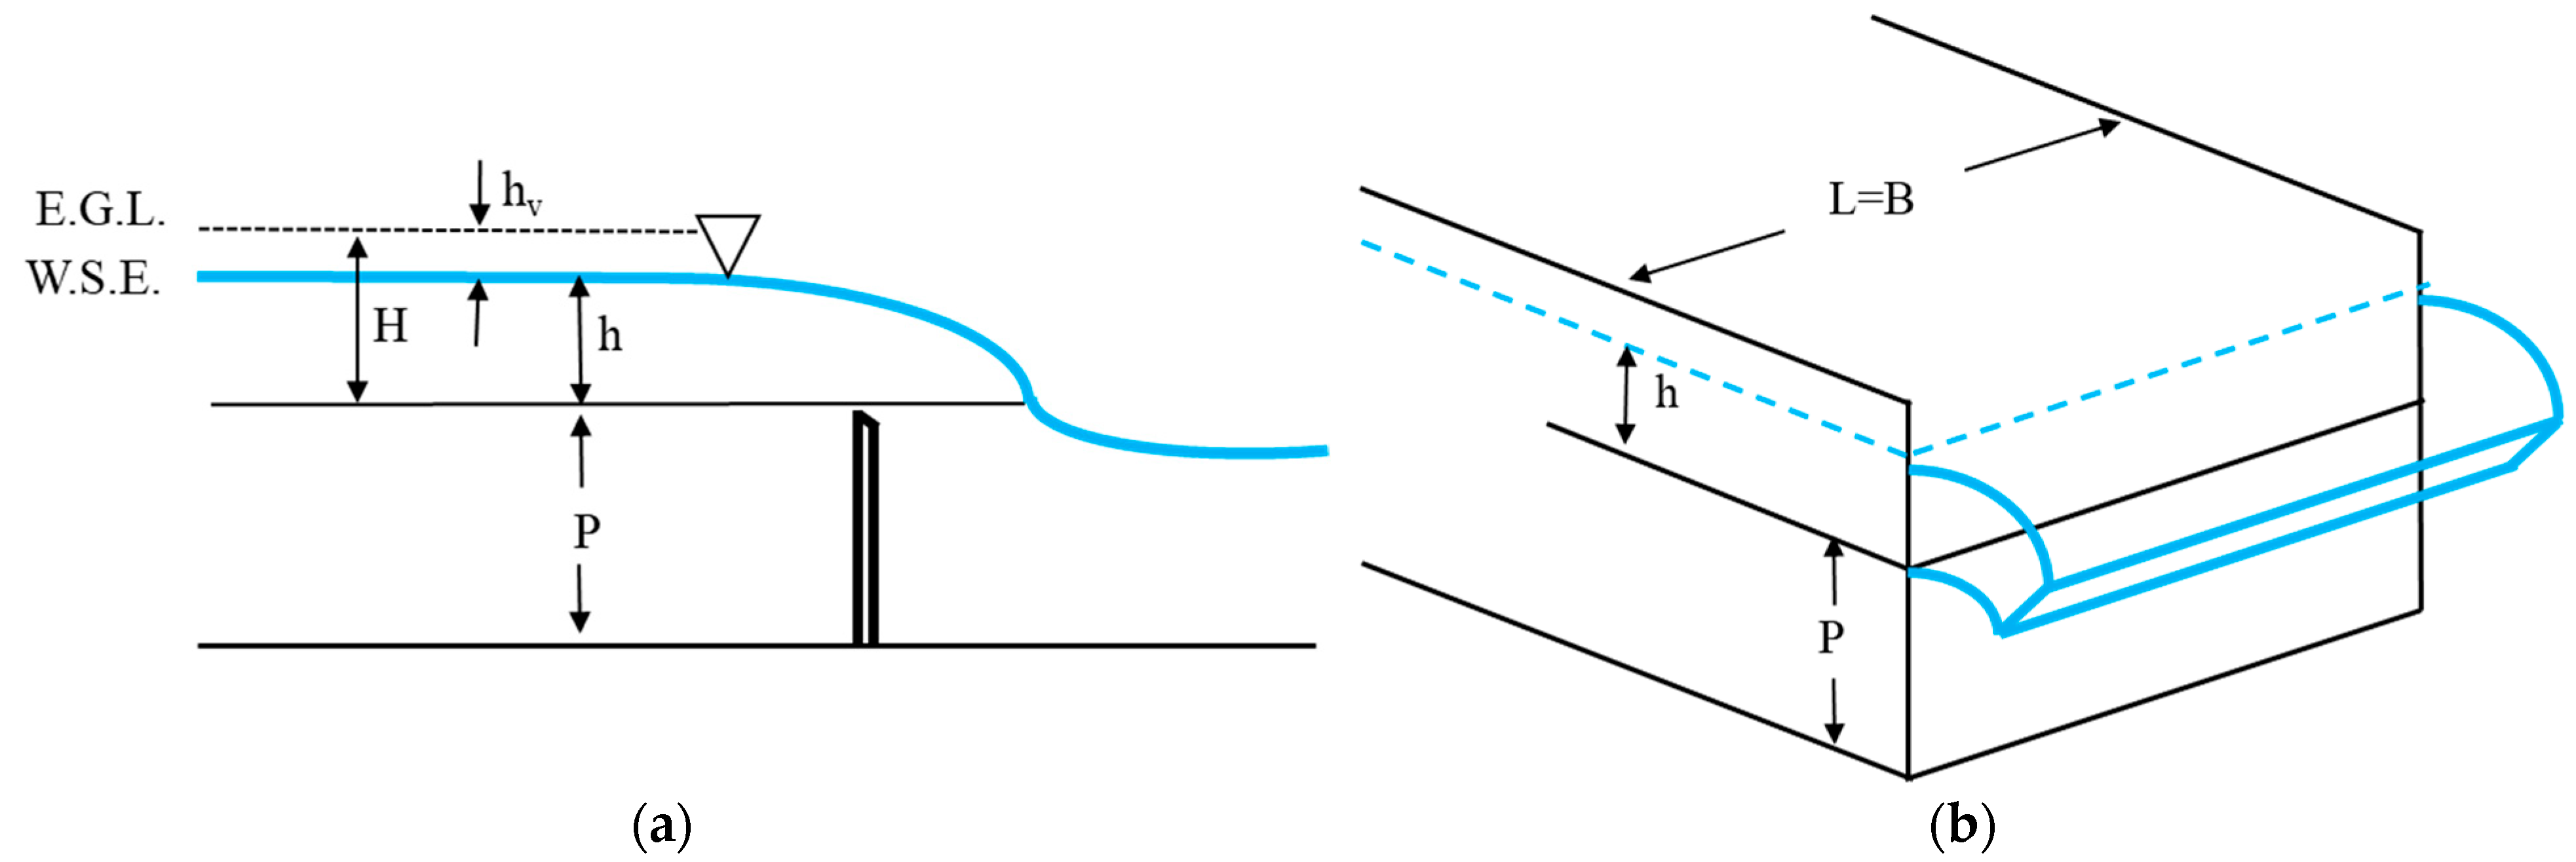
18]. Hence, the importance of investigating weir design on the flow behavior over them, the flow discharge, and the flow characteristics downstream are apparent. Among weirs, full-width plate weirs (FWPW) are used in flow measurements and drainage purposes, as well as wastewater plants [19,20,21]. These weirs are plate structures perpendicular to the flow direction, providing conditions for the water flow to pass through the whole width of the weir crest (Figure 1).
The flow discharge passing through weirs can be calculated as follows [22,23,24,25,26,27]:
Q = 2/3 (Cd L) (2g)0.5 (h)1.5
In Equation (1), Q is the discharge flow to the weir; L is the length of the weir, which equals channel width (B) in FWPW; h is the head on the weir; g is gravitational acceleration; and Cd is the discharge coefficient.
By increasing Cd, L, and h, it is evident that discharge passing through the weir increases. When the plate is in an oblique condition (with an α angle compared with the flow direction), L increases, and more flow passes through the weir with the same channel width (B) and water head (h) [28,29].
Investigating the flow behavior and measuring the flow discharge through the plate have been studied in several studies. Rajaratnam and Muralidhar [30] examined the pressure and velocity field for flow over the crest of a plate weir with h/P = 0.2~8.5 to develop the theory for curvilinear in open channel flows.
The discharge coefficient of plate weirs can be defined as a function of the geometric ratios that describe the weir and the channel [31]. The weir discharge coefficient depends on the ratio of the weir height (P) to the head on the weir (h). To measure the water head on the weir, a horizontal distance equal to 3 to 4 times h should be assigned from the weir crest to neglect the influence of the curvature of the flow upon the water level [32]. Sarginson [33], by measuring low-level nappe profiles at low heads over plate weirs, provided an equation of the discharge coefficient. This equation considers the effect of surface tension on flow, and it has a lesser impact at h > 0.05 m, but it is essential at low heads. It was observed that the effective coefficient values of weirs with different heights at very low h/P had 1.0 to 1.5% differences while generally varying less than 0.5% [21]. Ramamurthy et al. [34] proposed a formula between Cd and h/P by investigating the flow over a plate weir at the end of a horizontal rectangular channel. Afzalimehr and Bagheri [35], using the theory of complex variables, proposed an equation to estimate the Cd of plate weirs with the theory of potential flow and showed that Cd depends on a power equation of h/P. Arvanaghi and Oskuei [36], using an experimental and numerical approach, investigated the effects of h/P, Froude number, and Reynolds number on Cd of FWPW. They concluded that it tends to a constant value of 0.7. Experimental observations on a 20 mm thick round crested plate weir indicated that the rounded upstream corner can increase the discharge coefficient [37]. At a constant discharge, changing bed slope has a negligible influence on hb (brink depth or water head exactly on the weir crest), but it affects h [38].
However, these studies mainly focus on specific conditions, and the variations in discharge coefficients for wider ranges of weir heights and discharge rates remain less explored. Some studies, such as those by Afzalimehr and Bagheri [35] and Arvanaghi and Oskuei [36], have provided insights into the effects of geometric parameters, but comparative analyses across diverse weir height configurations and discharge scenarios have not been fully addressed. This gap highlights the need for more comprehensive investigations into the discharge coefficient variations across different operational conditions.
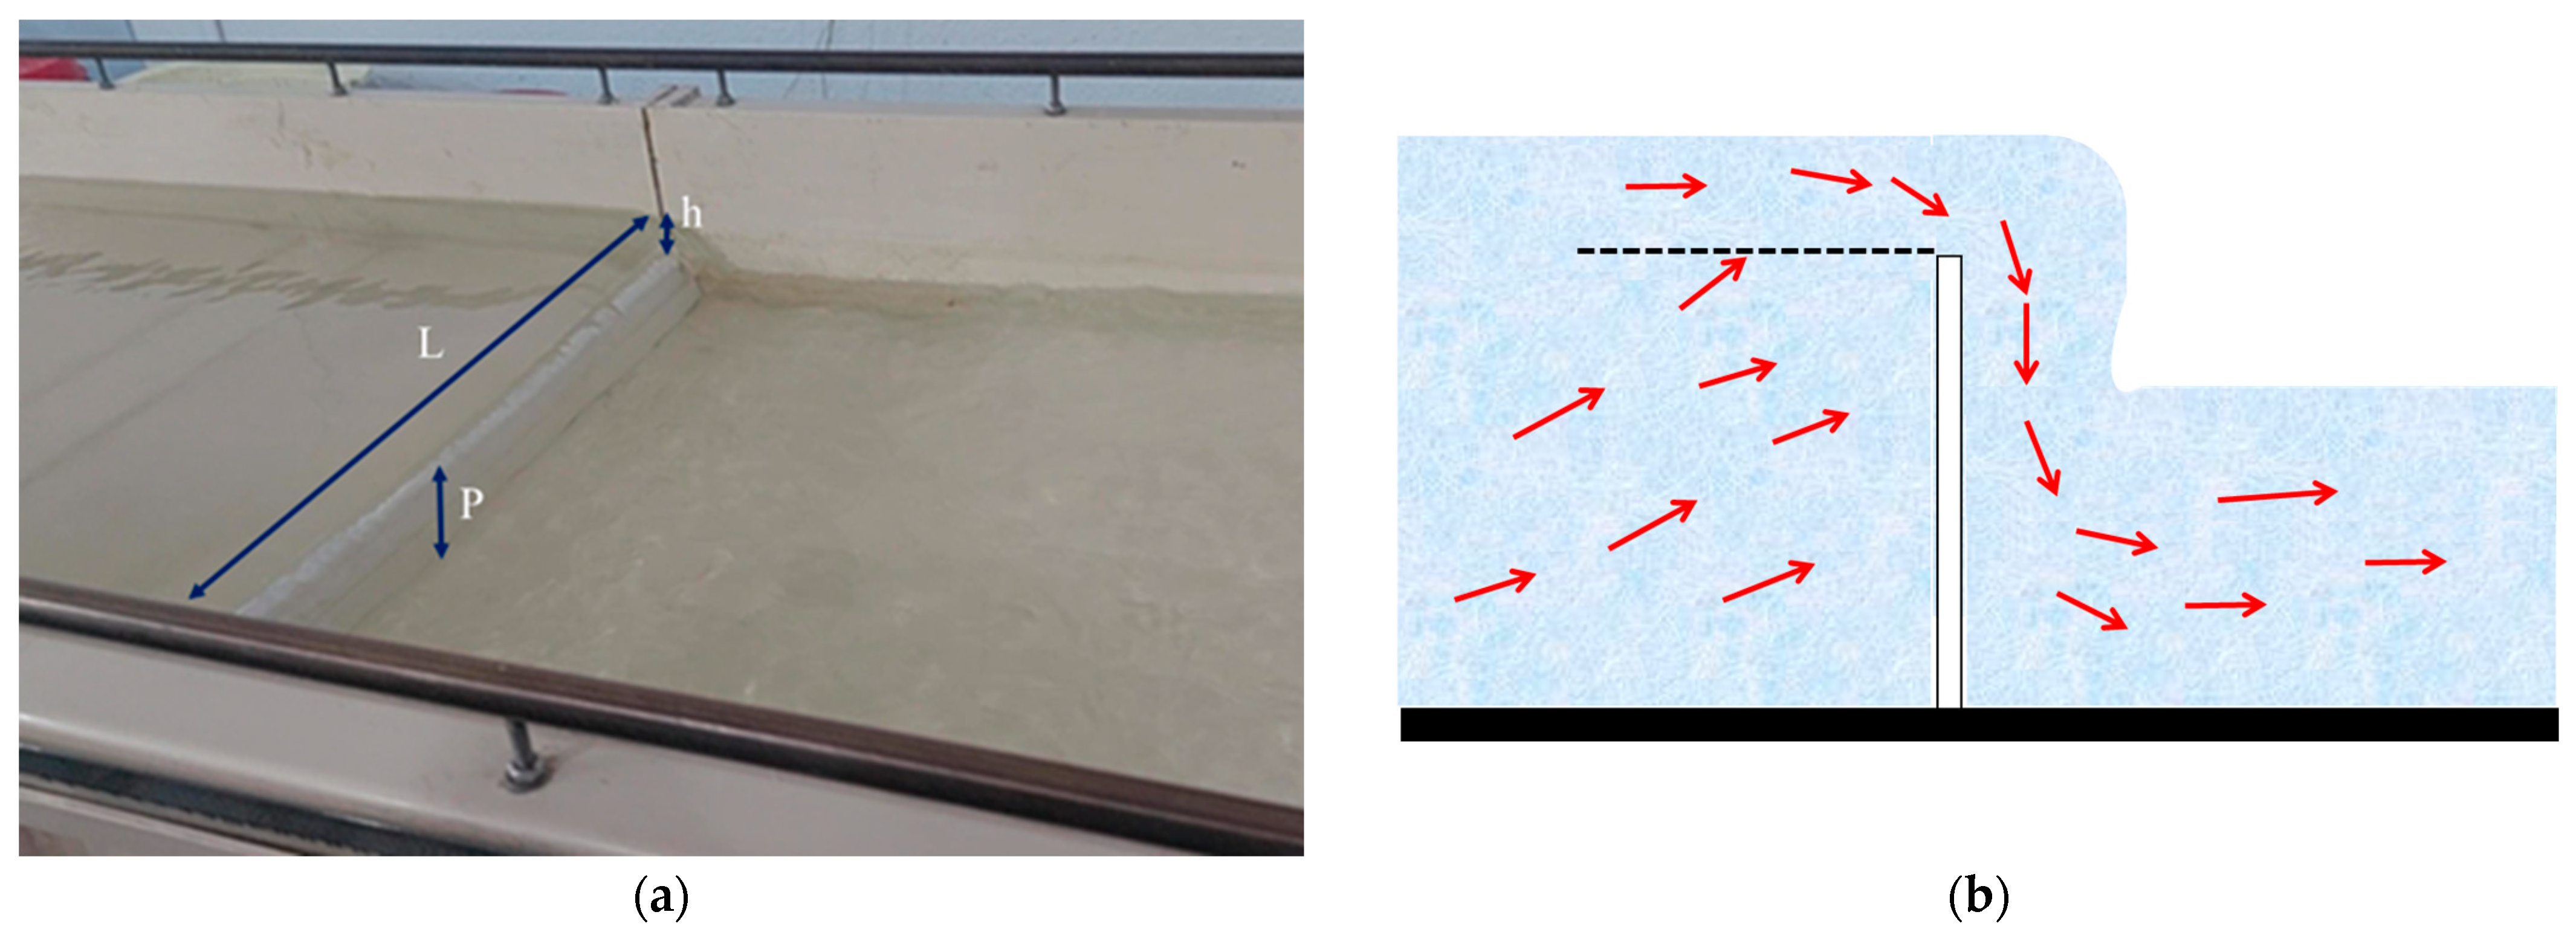
Experimental results on flow behavior and energy dissipation downstream of FWPW are lacking; only some studies are available for a rectangular contracted sharp-crested weir. It was reported by computing the energy loss for sharp-crested weirs that a hydraulic jump forms on the falling nappe at a low head that the main energy loss is attributed to a combination during the jump by increasing the tailwater depth [39]. At the above phase of the impinging jet primary, energy dissipates in supercritical flow [40]. Then, the high-velocity flow leads to considerable turbulence and energy loss as the flow converts to the subcritical state [39]. In submerged flow, it is different, and the energy dissipation is minimal [40]. This result occurs because the water flow stays constant and less turbulent, permitting better energy transport with decreased loss.
A review of previous studies indicates that some prediction equations were proposed for calculating the flow discharge (Q) and discharge coefficient (Cd) of the flow passing through the FWPW. Furthermore, (I) there is a lack of comprehensive analysis of the flow in FWPW, especially on downstream flow characteristics. (II) There are no findings on the energy dissipation in these types and prediction equations for calculating it in the literature. (III) There is a necessity to update the discharge coefficient equation of these weirs at low discharges, which are more sensitive to weir height variations. Therefore, the present study was conducted to fill the mentioned gaps. Since the ratio of h/P is the main effective parameter in discharge computations based on dimensional analysis, the present study investigated five varied weir heights (P = 7, 9, 11, 13, 15 cm) under eight different flow discharges. While investigating the flow behavior on the weir, the calculation of the discharge coefficient, the presentation of the modified equations, and the comparison with the available ones are also discussed. Also, the energy dissipation of the FWPW was investigated for the first time, and approximately accurate prediction equations were presented based on the experimental data. All the presented equations were validated with available equations and data, and the error values were given according to the frequency range. This study is novel, based on providing a new equation for the computation of the discharge coefficient of FWPW and the prediction of relative energy dissipation downstream of it.
The findings from this study aim to cover the gap in the topic literature by providing a comparative analysis of the discharge coefficients and energy dissipation downstream of FWPW via changing weir heights and discharge conditions. Due to the focus on the low-discharge range, where the weir’s performance is more sensitive, this study further contributes to the accuracy and application of the discharge coefficient and energy dissipation equations for the practical weir design of FWPWs.

2. Materials and Methods

2.1. Dimensional Analysis

In experimental hydraulic models, determining effective parameters is essential. Parameters that influence the hydraulic characteristics of FWPW are given:
f1 (Cd, b, B, P, h, t, g, S0, ρ, σ, ν) = 0
where S0 is the channel slope, ρ is the specific mass of water, σ is the surface tension, and ν is the kinematic viscosity. Using dimensional analysis and applying Π Buckingham theory could help to simplify Equation (2). Based on this theorem, some parameters could be combined or simplified as Equation (3):
f2 (Cd, b/B, h/P, t/b, g, S0, W, Re) = 0
In Equation (3), W is Weber number (W = ρV2b/σ), which includes surface tension [41], and Re is Reynolds number (Re = Vb/ν), which contains kinematic viscosity. S0 and t/b effects are insignificant, and they are constant in the present study, so they could be given up. Since, in FWPW, b = B, and b/B = 1, this parameter could be omitted in dimensional analysis. In turbulent flow for Re > 25,000, the effect of the Reynolds number could be neglected in the results [42]. Also, where the weir head is more than 0.02 m, the effect of surface tension is negligible [43], and the smooth design of the plate weir can significantly reduce the viscous effects so that the Weber number can be removed from Equation (3). According to the mentioned description, Equation (2) can be simplified as Equation (4):
Cd = f3 (h/P)
Equation (4) represents the illustration for the dimensional analysis of the discharge coefficient in FWPW. This equation shows that by simplifying the various parameters, h/P is the most significant factor for investigating the discharge of the flow passing through FWPW. This hypothesis forms the main basis of the methodology and results of this study.

2.2. Laboratory Model Configuration

Laboratory models were examined in a hydraulic flume of Babol Noshirvani University of Technology (BNUT) with 4 m length, 0.6 m width, and 0.2 m height. This apparatus has been applied in experimental investigations to model hydraulic physical problems [44,45,46,47,48,49]. The apparatus comprises an upstream tank, a channel, a downstream tank, a pump, a flowmeter, and a tailgate (Figure 2). The body of the flume is made of PVC, with a smooth bottom and side walls that stand on metal pedestals. For conducting tests, the upstream and downstream tanks should be filled with water. When the pump is on, the water comes from the downstream tank to the upstream one via plastic pipes, and it enters the channel after passing a curved bed and mesh plate. Then, the flow reaches the installed model, passes the tailgate and falls to the downstream tank. This cyclic process will continue until the pump is on. The tailgate has an adjustable radial arm and can provide any desired flow depth in headwater or tailwater. Flow discharges were measured by a magnetic flowmeter connected to the pump that was calibrated with accuracy ±2% and a resolution measurement of 2.5 m3/hr (about 0.0007 m3/s) and can supply discharge up to about 0.0083 m3/s. Reaching the entrance flow of the channel with the lowest disturbance is a crucial issue. A mesh plate installed in the channel’s inlet and the entrance curvature bed upstream could ascertain a steady flow with minimum disturbance to discharges in the channel section. Additionally, mesh plate uniforms the flow to achieve the developed state earlier. To attain an approximately fully developed flow, the developing flow length (l) was computed at about 1.8 m based on the equation suggested by Kirkgöz and Ardiçlioğlu [50] in open channel flow (l/y = 76 − 0.0001 Re/Fr), where y is the approaching flow depth, Re is Reynolds number, and Fr is Froude number. Hence, the plate weir was installed 2 m away from the channel start point. Weir thickness in thin plate weirs is 1 to 2 mm in the crest, based on Herschy [20]. Therefore, considering that in this study, full-width plate weirs are investigated, weirs were made from PVC plates with a constant thickness of 3 mm and different heights. Forty experimental tests were conducted on FWPW with five heights (P = 7, 9, 11, 13, and 15 cm) under eight flow discharges from 1.4 to 6.3 L/s. The geometric and hydraulic parameters were selected considering (1) laboratory flume limitations (flume height and maximum discharge) and (2) ranges in the previous study (P = 0.1 to 0.2 m [36]). A movable point gauge was applied to measure water levels and flow depths with a resolution of 0.1 mm, like Wang et al. [51]. The head over the weir (h) was read 30 cm upstream of the weir to prevent oscillated water levels [52].
Since the weir height is an important parameter in the present study, and it emphasizes the weir height effect on results, five values of 7, 9, 11, 13, and 15 cm were selected for plate weir height in the experimental model of the present study. These values were selected based on two factors: (I) the channel height limitations (20 cm) and (II) compatibility with previous experimental studies to verify the results and proposed equations. Accordingly, the study by Arvanaghi and Oskuei [36], which used full-width plate weirs like this study, had weir heights of 10 to 20 cm, which has an acceptable compatibility with the weir heights selected in this study. Also, the flow discharges were selected based on the limitations of the flume pump (maximum flow discharge of 8.3 L/s) with eight values of 1.4, 2.1, 2.8, 3.5, 4.2, 4.9, 5.6, and 6.3 L/s. Table 1 defined the values of weir height and the hydraulic parameters for each test. Tests A1 to A8 consist of a plate weir with a height of 0.07 m; tests B1 to B8 refers to a 0.09 m plate weir; tests C1 to C8 were defined for P = 0.11 m; tests D1 to D8 and F1 to F8 are applied for plate weirs with heights equal to 0.13 and 0.15 m, respectively. Flume widths are usually selected due to the experimental conditions in flow measurement studies, which often range from 0.1 to 1.0 m for laboratory purposes. Previous models applied different flume widths; however, no strict criteria are available for selecting flume width. In the case of plate weirs, scale effects can be compensated for by reducing the b by 0.0009 m while simultaneously increasing the P by 0.001 m [53]. Tian et al. [54] studied the effect of flume width on flow dynamics under five different flow discharges and five flume widths (0.05–0.30 m, with an interval of 0.05 m). They concluded that narrow flumes had a significant influence on flow acceleration when the slope length increased [54]. For the present study, since the plate weir is full width, a flume with a width of 0.6 m was chosen, which has the same width as the weir in the models. Investigations indicated that the selected flume width is greater than the value in similar experimental models like Arvanaghi and Oskuei [36], which b= 0.25 m. This criterion avoids the impacts of low flume width on the flow measurement results.
The scale effect could influence results in experimental hydraulic models when the prototype parameters are not scaled correctly [55,56]. In weir hydraulics, the flow nappe may cause some changes in the performance of models and prototypes due to fluid viscosity and surface tension [57]. It was declared by Erpicum et al. [58] that the surface tension effect could be ignored in most prototypes. The experimental model in the present study investigated hydraulic models of FWPW with a constant width and varied height. The weir heights were selected due to the previous experimental models, and weir width was fixed by channel width. It could be mentioned that the scale effect has not been considered, and the analyses, results, and equations are acceptable under the hydraulic conditions of the experimental setup [59,60,61].

2.3. Flow Behavior

It was observed from experimental tests that for all weir heights (P = 0.07, 0.09, 0.11, 0.13, 0.15 m) when P is constant, the head over the weir increases in higher flow discharges. Also, the flow nappe forms on the weir at a low head over the FWPW (Figure 3). When the flow discharge increases, deeper tailwater forms, and then the nappe transitions toward a compressed form, as reported by Rao [62] and Chanson [63]. These findings are consistent with Chanson’s [63] explanation that higher discharge increases downstream tailwater pressure, which interacts with the nappe flow, compressing it and altering its aeration dynamics. Similarly, Rao [62] noted that compressed nappes occur due to the higher kinetic energy of the flow as discharge increases, a phenomenon that aligns with the behavior observed in the current experiments.
In constant discharge, as the height of the weir increases, the upstream head on the weir decreases, and the nappe may not stick to the surface of the weir and far from it. However, there is a greater chance that the nape will stick to the weir surface at the constant discharge and reducing weir height. This observation complements Chanson’s [63] study, which demonstrated that the nappe adherence depends significantly on the upstream head and flow velocity. The current results expand this understanding by providing empirical evidence that shorter weir heights enhance flow velocity and thus increase nappe adherence, corroborating earlier theoretical predictions.

3. Results

3.1. Variations of Head over Weir with Discharge (Q-h)

In all weirs, the flow discharge depends on the head on the weir, which, according to Equation (1), is the FWPW, which also follows this criterion. Figure 4 presents the results of water head variations measured upstream of the weir (with a distance of 30 cm from the weir) with flow discharge (measured by the flowmeter). It can be observed that in all weirs with different heights, the relationship between Q and h is approximately linear, consistent with previous research results [64]. Also, in constant discharge, with the increase of P, the weir head decreases slightly. These findings are in agreement with Chen et al.’s [65] study, where a similar linear relationship between flow discharge and head was observed for various weir heights. Additionally, Chanson [63] also reported that increasing the weir height leads to a slight decrease in the head at constant discharge, which aligns with the observations from the current study.
Table 2 provides the percentages of h variations for each test compared with P = 0.07 m and measured discharge. It can be observed that increasing weir height reduced the weir head up to 11.40% in the lowest discharge (Q = 1.4 L/s) and reduced h up to 3.42% at the highest discharge measured (Q = 6.3 L/s). This observation further corroborates Ali and Uijttewaal’s [66] conclusion, where the reduction in the head was attributed to the increased flow resistance caused by the higher weir height.

3.2. Variations of Discharge Coefficients with h/P

The discharge coefficient is one of the effective hydraulic parameters in the design of plate weirs. According to Equation (4), the most effective factor is h/P. Figure 5 shows the results of Cd with h/P changes for P = 0.07, 0.09, 0.11, 0.13, and 0.15 m. Discharge coefficients were calculated from Equation (1) by determining the measured flow discharge, weir head, weir length, and g. Observations indicate that the discharge coefficient of the FWPW has a decreasing nonlinear trend with the increase of h/P. This nonlinear decrease in Cd can be attributed to the fact that, as h/P increases, the flow over the weir becomes more turbulent, leading to a more significant amount of energy dissipation and reduced flow efficiency. At higher h/P values, the flow experiences a more considerable depth, which increases resistance and decreases the effective energy conversion, resulting in a lower discharge coefficient. This nonlinear trend observed in the current experiments is consistent with the findings of Arvanaghi and Oskuei [36], who observed similar behavior in their tests with varying h/P values. Additionally, Nouri and Hemmati [67] identified a decrease in discharge coefficient with increasing h/P, which is further validated by the data presented in this study.
Table 3 presents the Cd values in all tests. The average values of Cd were obtained as 0.5763, 0.5833, 0.5947, 0.6161, and 0.6277; the minimum values were 0.5343, 0.5495, 0.5549, 0.5647, and 0.5697, and the maximum values were 0.6492, 0.6849, 0.6944, 0.7559, and 0.7785 for P = 0.07, 0.09, 0.11, 0.13, and 0.15 m, respectively. It was concluded from the results that by increasing the weir height, the discharge coefficient increases and reaches from 0.5763 to 0.6277. Also, the minimum value of Cd was achieved in test A5 (P = 0.07 m), equal to 0.5343, and the maximum value of Cd was obtained in test F1 (P = 0.15 m) with a value of 0.7785. These results further support Arvanaghi and Oskuei’s [36] observations, where an increase in weir height led to a rise in the discharge coefficient. This increase in Cd with higher weir heights can be explained by the fact that more considerable weir heights allow for more flow to pass over the weir, reducing flow separation and turbulence at the weir crest, which leads to higher efficiency in the energy conversion process. Nouri and Hemmati [67] also highlighted similar trends in their studies, confirming that higher weir heights generally lead to higher discharge coefficients.

3.3. Energy Dissipation

Energy dissipation downstream of FWPW was investigated based on computing energy upstream of the weir (E0) and energy in tailwater (E1). E0 and E1 can be defined as Equations (5) and (6), respectively, as follows [68,69,70]:
E0 = P + h + (V0)2/2g
E1 = h1 + (V1)2/2g
V0 is the upstream flow velocity; h1 is the tailwater depth; and V1 is the tailwater velocity. Relative residual energy is E1/E0, and relative energy dissipation (ΔEr) equals (E0E1)/E0. These two parameters were calculated for experimental data on FWPW.

3.3.1. Variations of Relative Residual Energy with q and h/P

Figure 6 presents the variations of E1/E0 to the flow discharge per channel width (q). It could be observed that at a constant discharge, relative residual energy reduces in a higher weir (greater P). This reduction can be attributed to increased energy dissipation due to greater vertical drops, enhanced hydraulic jumps, and more pronounced flow contraction and turbulence. The higher weir height also promotes better mixing and flow reattachment, effectively lowering the downstream energy (E1) compared with the upstream energy (E0). These factors collectively contribute to a decrease in E1/E0 as weir height increases. Moreover, it could be realized that more flow discharge slightly increases the relative residual energy. The average values of E1/E0 for P = 0.07, 0.11, 0.13, 0.15 m were 0.7973, 0.6558, 0.5559, 0.4792, and 0.4217, respectively, showing the mentioned results.
Table 4 shows the relative residual energy values. The minimum values of E1/E0 were 0.7843, 0.6403, 0.5342, 0.4572, and 0.3977; the maximum values were 0.8095, 0.6813, 0.5845, 0.5064, and 0.4484; and the average values were 0.7973, 0.6558, 0.5559, 0.4792, and 0.4217 for P = 0.07, 0.09, 0.11, 0.13, and 0.15 m, respectively. It was observed that at a constant discharge, relative residual energy reduces an average of 47%.
Variations of the calculated E1/E0 to the ratio of h/P are shown in Figure 7. The trend observed in this graph is similar to the relationship between E1/E0 and q, where relative residual energy decreases as weir height increases at a constant discharge. This reduction in relative residual energy with increasing weir height can be attributed to several hydraulic mechanisms, including enhanced turbulence, greater flow depth, and more effective energy conversion as the flow interacts with the weir. As the weir height increases, the flow accelerates, which induces higher turbulence levels in the downstream region. This increased turbulence results in greater energy dissipation within the flow, leading to a reduction in the relative residual energy (E1/E0) downstream of the weir. The higher weir height forces the flow to dissipate more energy through mechanisms such as eddy formation and increased frictional losses, which reduce the energy retained in the tailwater [71].
Additionally, the results presented in Figure 7 suggest that for a given weir height, flows with higher discharge produce higher values of relative residual energy. This indicates that the energy dissipation mechanisms are more prominent in higher discharge scenarios. In higher discharge flows, there is a greater volume of water with increased kinetic energy, which translates into more substantial turbulence and more intense interactions with the weir surface. This intensified turbulence facilitates more efficient energy conversion, transforming kinetic energy into thermal and mechanical energy, thus increasing the energy dissipation downstream. As a result, the relative residual energy (E1/E0) increases with higher discharge, reflecting the substantial increase in energy loss due to these enhanced hydraulic effects.

3.3.2. Variations of Relative Energy Dissipation with q and h/P

Figure 8 provided the variations of (E0E1)/E0 with q changes. At a constant q, relative residual energy increases by increasing weir height. It could be observed that for flows with higher discharges, relative energy dissipation decreases with a slight slope. Average values of (E0E1)/E0 were 0.2027, 0.3442, 0.4441, 0.5208, and 0.5783 for P = 0.07, 0.11, 0.13, and 0.15 m, respectively.
In Figure 9, the comparison between different values of calculated (E0E1)/E0 to h/P is provided. It is observed that the values of (E0E1)/E0 increase by increasing P in a constant discharge. Also, it could be concluded that for all weir heights at a defined P, relative energy dissipation reduces slightly by increasing discharge.
The minimum, average, and maximum values of relative energy dissipation are presented in Table 5. Minimum values of (E0E1)/E0 for P = 0.07, 0.09, 0.11, 0.13, and 0.15 m were 0.1915, 0.3187, 0.4155, 0.4936, and 0.5516, and maximum values were 0.2157, 0.3597, 0.4658, 0.5428, and 0.6023. It was computed that relative energy dissipation increases by more than 180% at a constant discharge by increasing weir height.

4. Prediction Equations

4.1. Flow Discharge

Equation (7) was suggested to calculate the flow discharge in FWPW [72].
Q = (0.564 + 0.0846 (h/P)) Lg0.5h1.5
Based on the experimental data of this research, Equation (7) has been modified as calibrated Equation (8):
Q = (0.5256 + 0.0341 (h/P)) Lg0.5h1.5
This equation is valid for the range 0.08 < h/P < 0.53. To compare Equation (7) and the modified equation, Figure 10 presents the values of the calculated flow discharge (Qc) resulting from these two equations versus the measured flow discharge (Qm). Similar comparative analyses have been conducted in previous studies [73,74,75,76,77,78,79,80,81,82], emphasizing the importance of validating predictive equations against experimental data.
Statistical indexes like RMSE, MAE, and R2 could be applied to investigate the accuracy of prediction [83]. The experimental results have an error of RMSE = 0.0005, 0.0002, R2 = 0.996, 0.997, and MAE = 0.0004, 0.0002, respectively, for Equation (7) and the modified equation.
Figure 11 shows the frequency occurrence of errors for computed flow discharge from Equation (7) and the proposed equation with values observed in the experiments. For the proposed equation, the error ranges from −28% to 6.95%, and it ranges from −22.4% to 18.95% for Equation (7). As it is comprehended from the values of R2, RMSE, and MAE in Figure 10, both equations have calculated the values of flow discharge passing through the weir with the acceptable error. It can be observed from Figure 11 that the frequency occurrence of the errors in the proposed equation is less than in Equation (7). This finding is compatible with the values of R2, RMSE, and MAE in Figure 10 and confirms that the proposed equation is more efficient and reaches fewer errors compared with the previous equation. It means the proposed equation (Equation (8)) can predict the observed discharge better than Equation (7).

4.2. Discharge Coefficient

To determine the precise assessment of the trend of variations in Cd with h/P, the experimental data results were compared with those adopted from Arvanaghi and Oskuei [36] in Figure 12. The power equation trends the data of the present study, and Arvanaghi and Oskuei [36] indicate the compatible trend of the results of these studies, at the same time the Cd values in reference [36] were more significant than those in the present study.
Table 6 presents the minimum, average, and maximum values of Cd and corresponding h/P for the present study and Arvanaghi and Oskuei [36]. Minimum values of Cd in the present study for P = 0.07, 0.09, 0.11, 0.13, and 0.15 m were 0.5343, 0.5495, 0.5549, 0.5647, 0.5697 and maximum values were 0.6492, 0.6849, 0.6944, 0.7559, 0.7785. Also, minimum values of Cd in Arvanaghi and Oskuei [36] for P = 0.10, 0.15, and 0.20 m were 0.69, 0.69, 0.68 and maximum values were 1.01, 1.06, 1.06. Differences in Cd results, while the trend is similar, are related to the difference in the ranges of parameters in the experimental model and channel geometry (Sohrabzadeh Anzani and Ghodsian [64]). Table 7 confirms this, where in Arvanaghi and Oskuei [36], the channel width is less than half of the present model, and the weir head and h/P ratios are much larger than the values in this study. As can be observed from Figure 12, Cd values decrease with increasing h/P in Arvanaghi and Oskuei [36] and reach 0.7, and in this study, the decreasing trend of Cd reaches 0.54.

4.3. Relative Energy Dissipation

Equation (9) is defined based on experimental, which is a polynomial of order 2 of parameter h/P, to calculate relative energy dissipation. In the following equation, a1, a2, and a3 are the constant values for each weir height in Table 8. The results of computed R2 show the best correlation for P = 0.13, and 0.15 m equals 0.99.
(E0E1)/E0 = a1 (h/P)2 + a2 (h/P) + a3

4.4. Uncertainty Analysis

To ensure the reliability of the experimental results and evaluate the precision of the measured parameters, an uncertainty analysis was conducted for both the discharge coefficient (Cd) and energy dissipation (ΔEr) values. The uncertainty in each measurement was propagated using the standard method outlined by Moffat [84], which accounts for the individual uncertainties in each measured variable and their influence on the overall result.
For the discharge coefficient (Cd), the uncertainty was primarily associated with the flow discharge (Q), which was measured using a calibrated magnetic flowmeter, and the uncertainty in Q was determined to be approximately ±0.0007 m3/s. The head over the weir (h) was measured with a point gauge with an accuracy of 0.1 mm, contributing an uncertainty of roughly ±0.1 mm. The combined uncertainty in the discharge coefficient was calculated to be ±0.03.
For the energy dissipation (ΔEr), the uncertainties were associated with the upstream energy head (E0) and downstream energy head (E1) measurements. The propagated uncertainty for ΔEr was between ±0.027 and ±0.038, depending on the specific experimental conditions.

5. Discussion

Full-width plate weirs (FWPW) are pivotal in accurately measuring flow in irrigation channels, wastewater treatment plants, and various hydraulic systems. Over the years, multiple studies have been conducted to evaluate the flow discharge passing through these weirs, investigate the flow profile, and compute the discharge coefficient. However, many of these studies have focused mainly on either flow discharge or energy dissipation behavior without providing a holistic knowledge of the weir’s behavior under various hydraulic conditions. This study provides a fundamental contribution to the understanding of full-width plate weirs with different heights (P = 7, 9, 11, 13, 15 cm), filling gaps in both experimental and theoretical frameworks. By advancing knowledge on energy dissipation and discharge behavior, this research offers practical tools for optimizing hydraulic system designs across various fields, ensuring sustainability and efficiency in water resource management. Furthermore, this work provides valuable insights into the performance of FWPWs across different flow conditions, emphasizing the influence of weir geometry, head-to-height ratio, and discharge on flow behavior. In particular, the study addresses gaps in the understanding of energy dissipation and discharge behavior, offering a more comprehensive view of FWPW performance under varied conditions.
Dimensional analysis and previous results have indicated that the ratio of the weir head to the weir height (h/P) is the most critical parameter affecting the results of hydraulic parameters in this weir. Given the complexity of flow behavior downstream of the weirs, including energy dissipation and flow separation, this study fills a critical gap by addressing these phenomena and updating the discharge and discharge coefficient results based on real-world experimental data. This approach directly links the findings to the research objectives, which include addressing the gaps in flow analysis, energy dissipation equations, and discharge coefficient modeling for low discharge conditions. The objectives of this study are to provide a comprehensive flow analysis, develop a prediction equation for energy dissipation, and update the discharge coefficient equation for low discharges, especially where the weir’s performance is more sensitive. To achieve this, five varied weir heights (P = 7, 9, 11, 13, 15 cm) under eight different flow discharges were investigated. This study focuses on the laboratory investigation of the FWPW with varying heights under different discharge conditions, offering insights into their performance across a broad range of practical scenarios.
The results indicate that additional investigation is needed in the field of FWPW and other types of plate weirs. The methodology and findings of the present study could be further developed in future studies focusing on flow behavior, downstream flow characteristics, and energy dissipation. For this purpose, an accurate CFD model could be applied to investigate a wider range of hydraulic conditions than those observed in this study, which were constrained by the limitations of the experimental model. Furthermore, based on the available findings and data, developing the results of the discharge coefficient and modifying existing equations through the collection of suitable datasets featuring varied configurations with high discharge and water head, using advanced techniques such as AI, can create robust research platforms.
The findings of this study extend beyond laboratory experiments, offering significant implications for real-world applications. In irrigation systems, insights into discharge behavior and energy dissipation can enhance water distribution efficiency, minimize losses, and ensure equitable channel flow. Similarly, in wastewater management, accurate discharge estimation and energy dissipation data can enhance flow control in treatment facilities, optimizing their operational performance. For flood control, understanding downstream energy dissipation enables better structural designs to manage high-flow events and mitigate erosion risks. Additionally, in hydropower systems, enhanced knowledge of flow behavior around FWPWs can increase the efficiency of small-scale hydropower projects, particularly in low-head conditions where precise flow management is crucial.
For future research, employing computational fluid dynamics (CFD) techniques is recommended to validate and expand these experimental results, enabling exploration of a broader range of hydraulic conditions and weir geometries. Machine learning techniques could be utilized to refine predictions of discharge coefficients and energy dissipation, leveraging large datasets to develop more robust models. Field studies are additionally essential for validating laboratory findings under diverse environmental and operational conditions, ensuring the applicability of findings in practical scenarios. Furthermore, detailed investigations into downstream flow dynamics, including flow patterns and turbulence, could optimize weir designs for specific applications, such as sediment transport management and ecological conservation. These efforts will enhance the functionality and reliability of FWPWs across various hydraulic systems.

6. Conclusions

The following findings were concluded in this research:
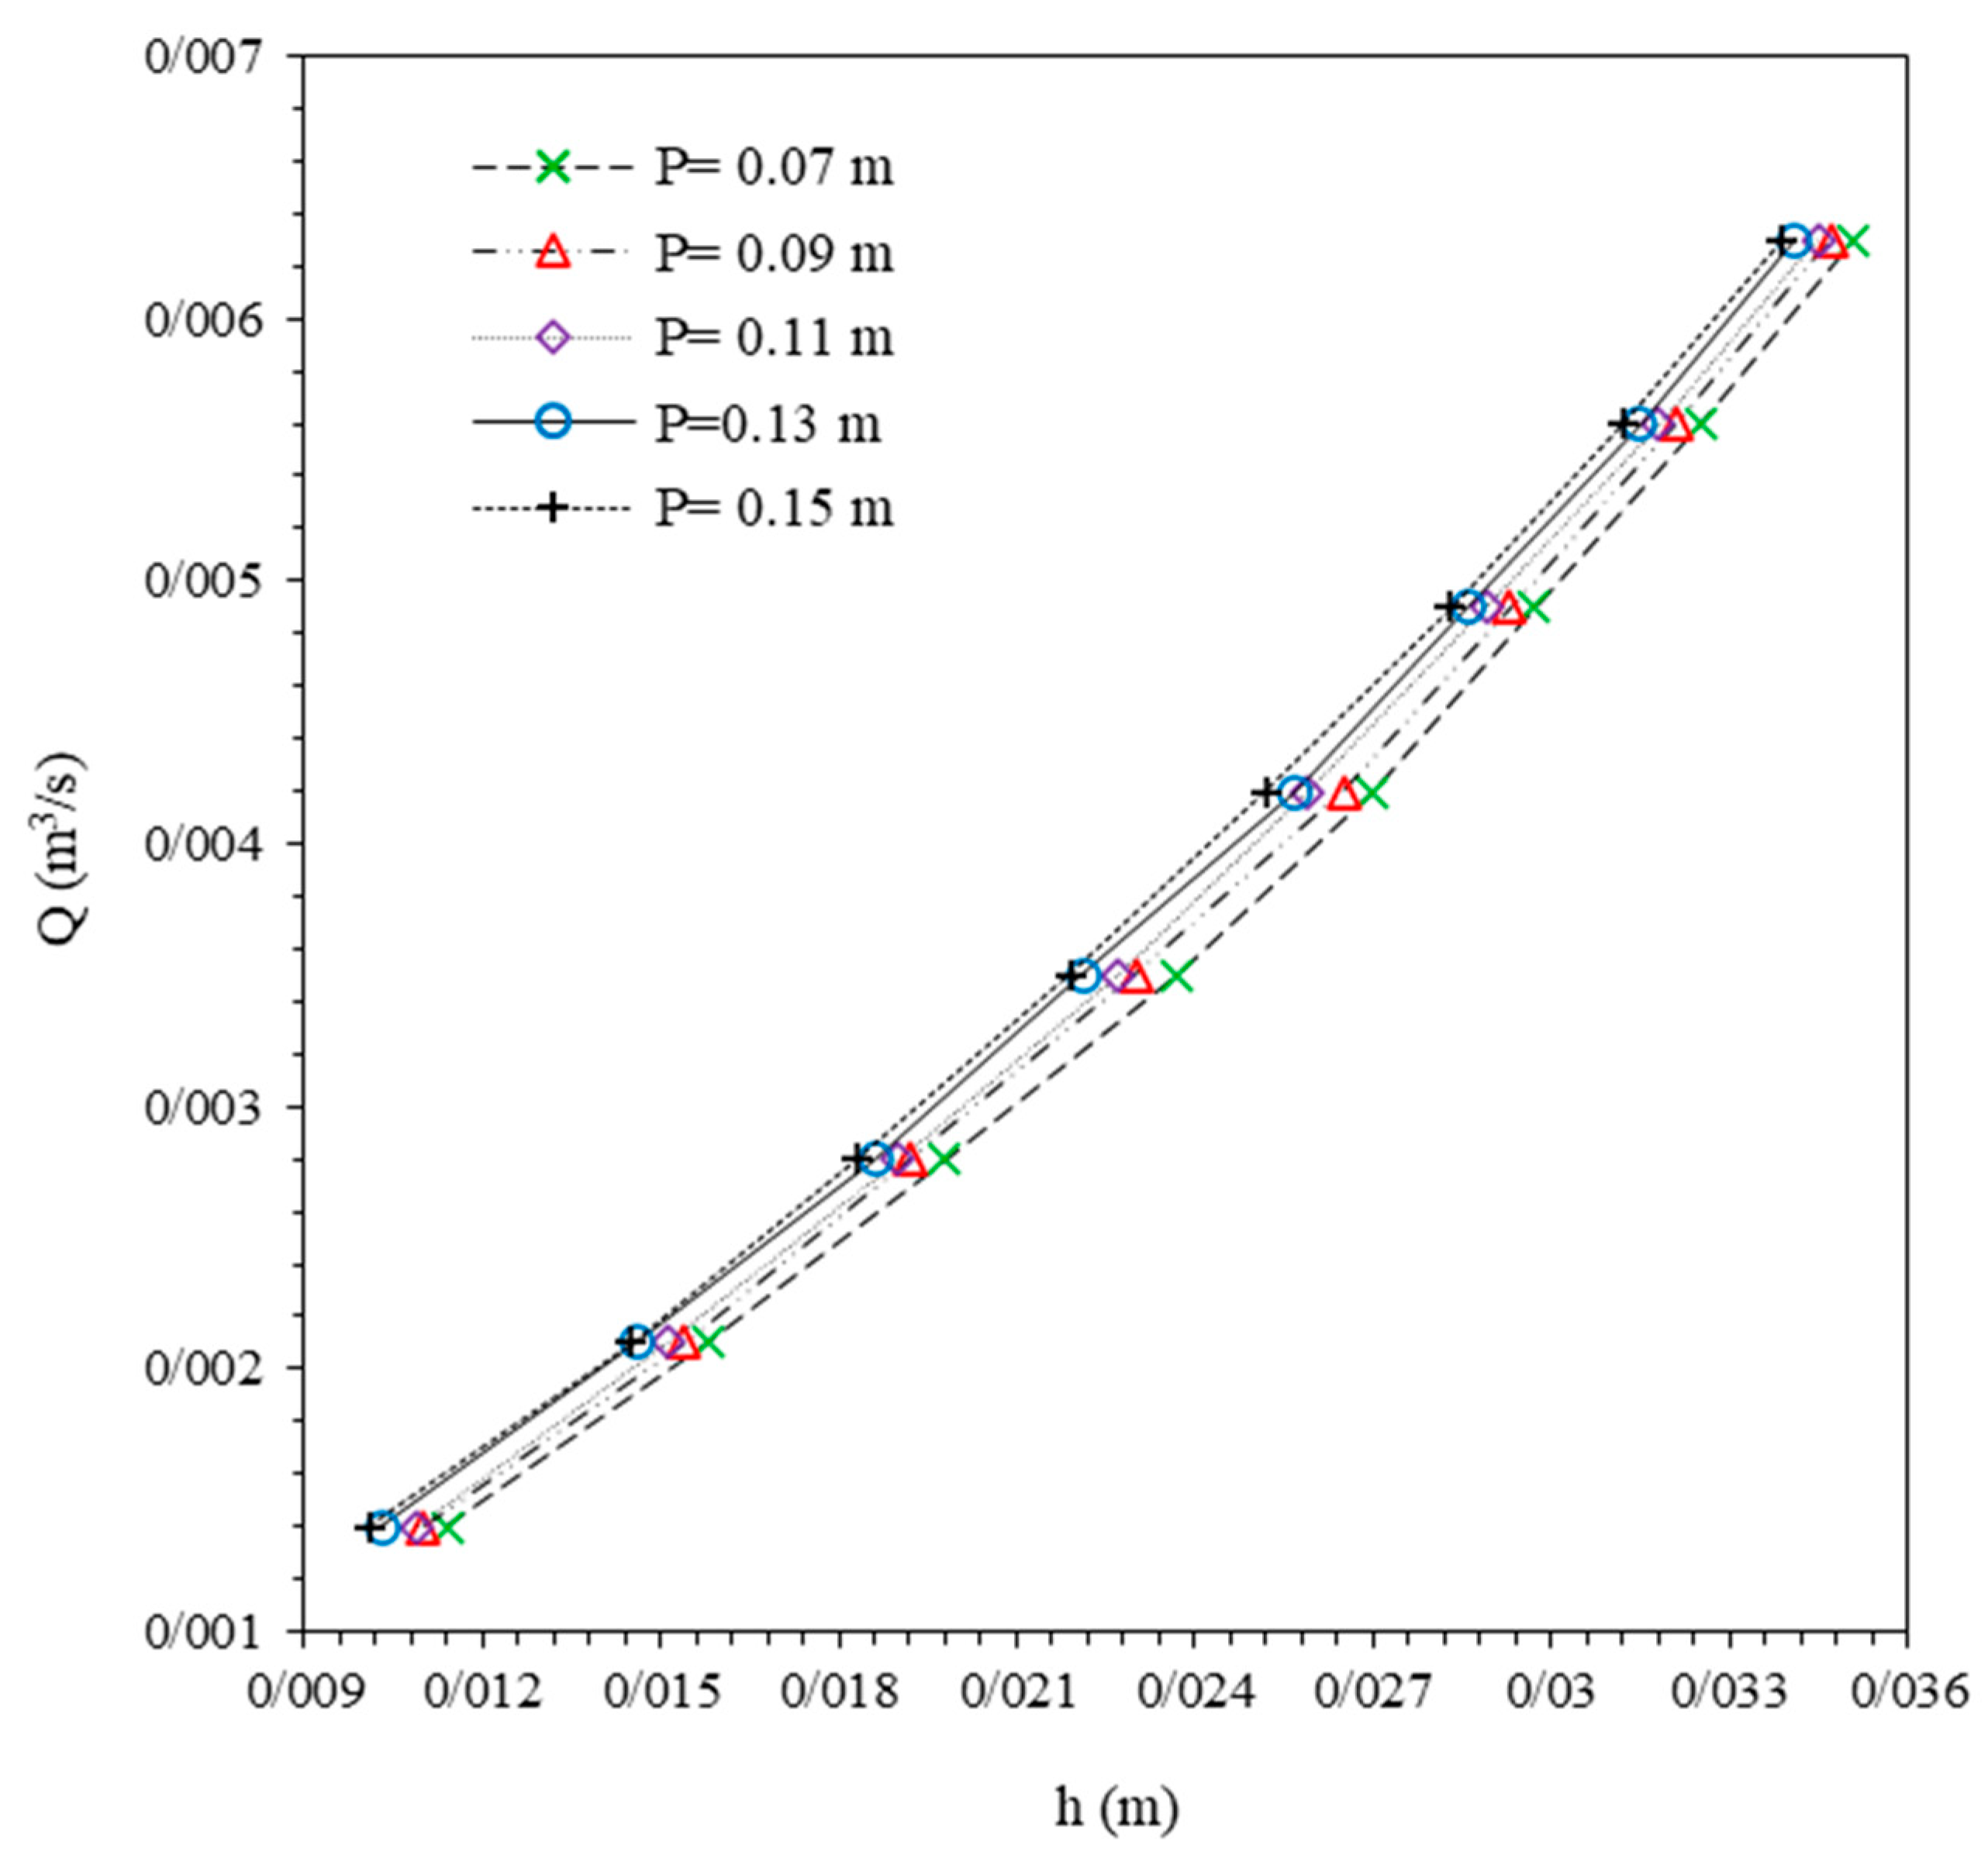
Discharge (Q) and head over the weir (h) exhibit a linear relationship consistent with the results reported in the previous studies. Furthermore, for a constant discharge, increasing the weir height slightly reduces the weir head. This linear behavior enhances the predictability of flow rates, making FWPWs reliable for applications in irrigation systems and wastewater management, where accurate and consistent flow measurement is essential.
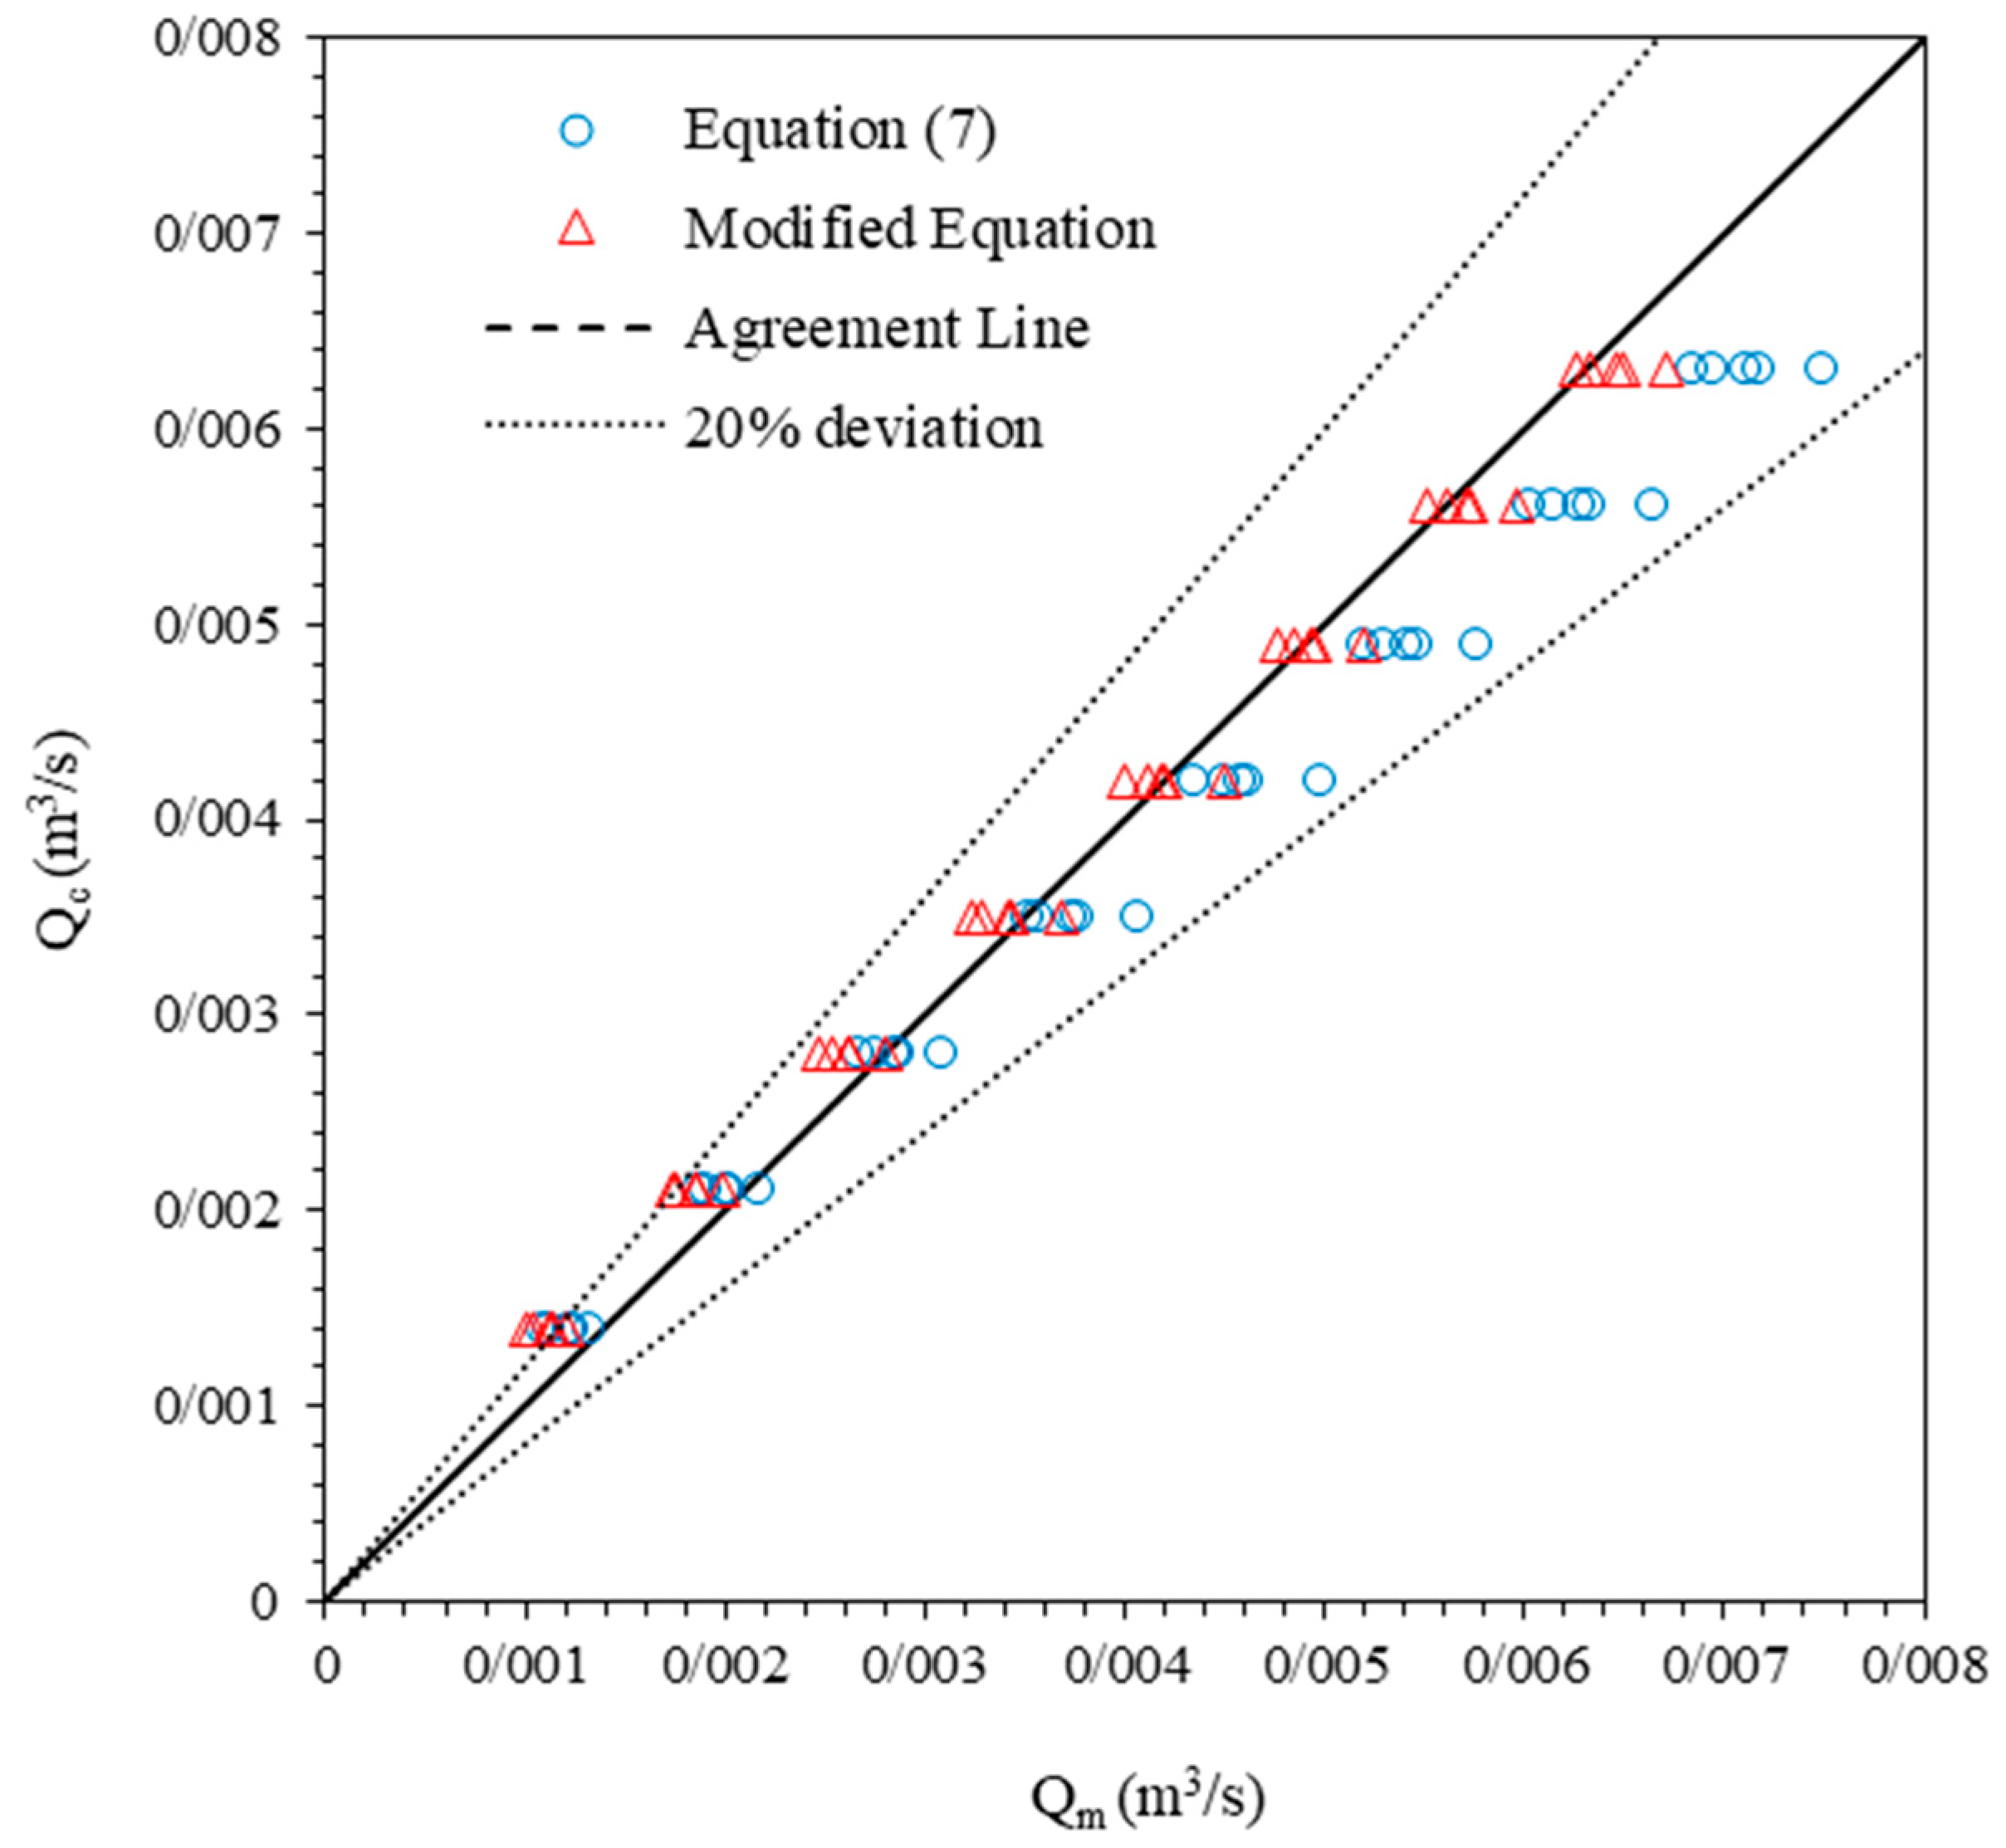
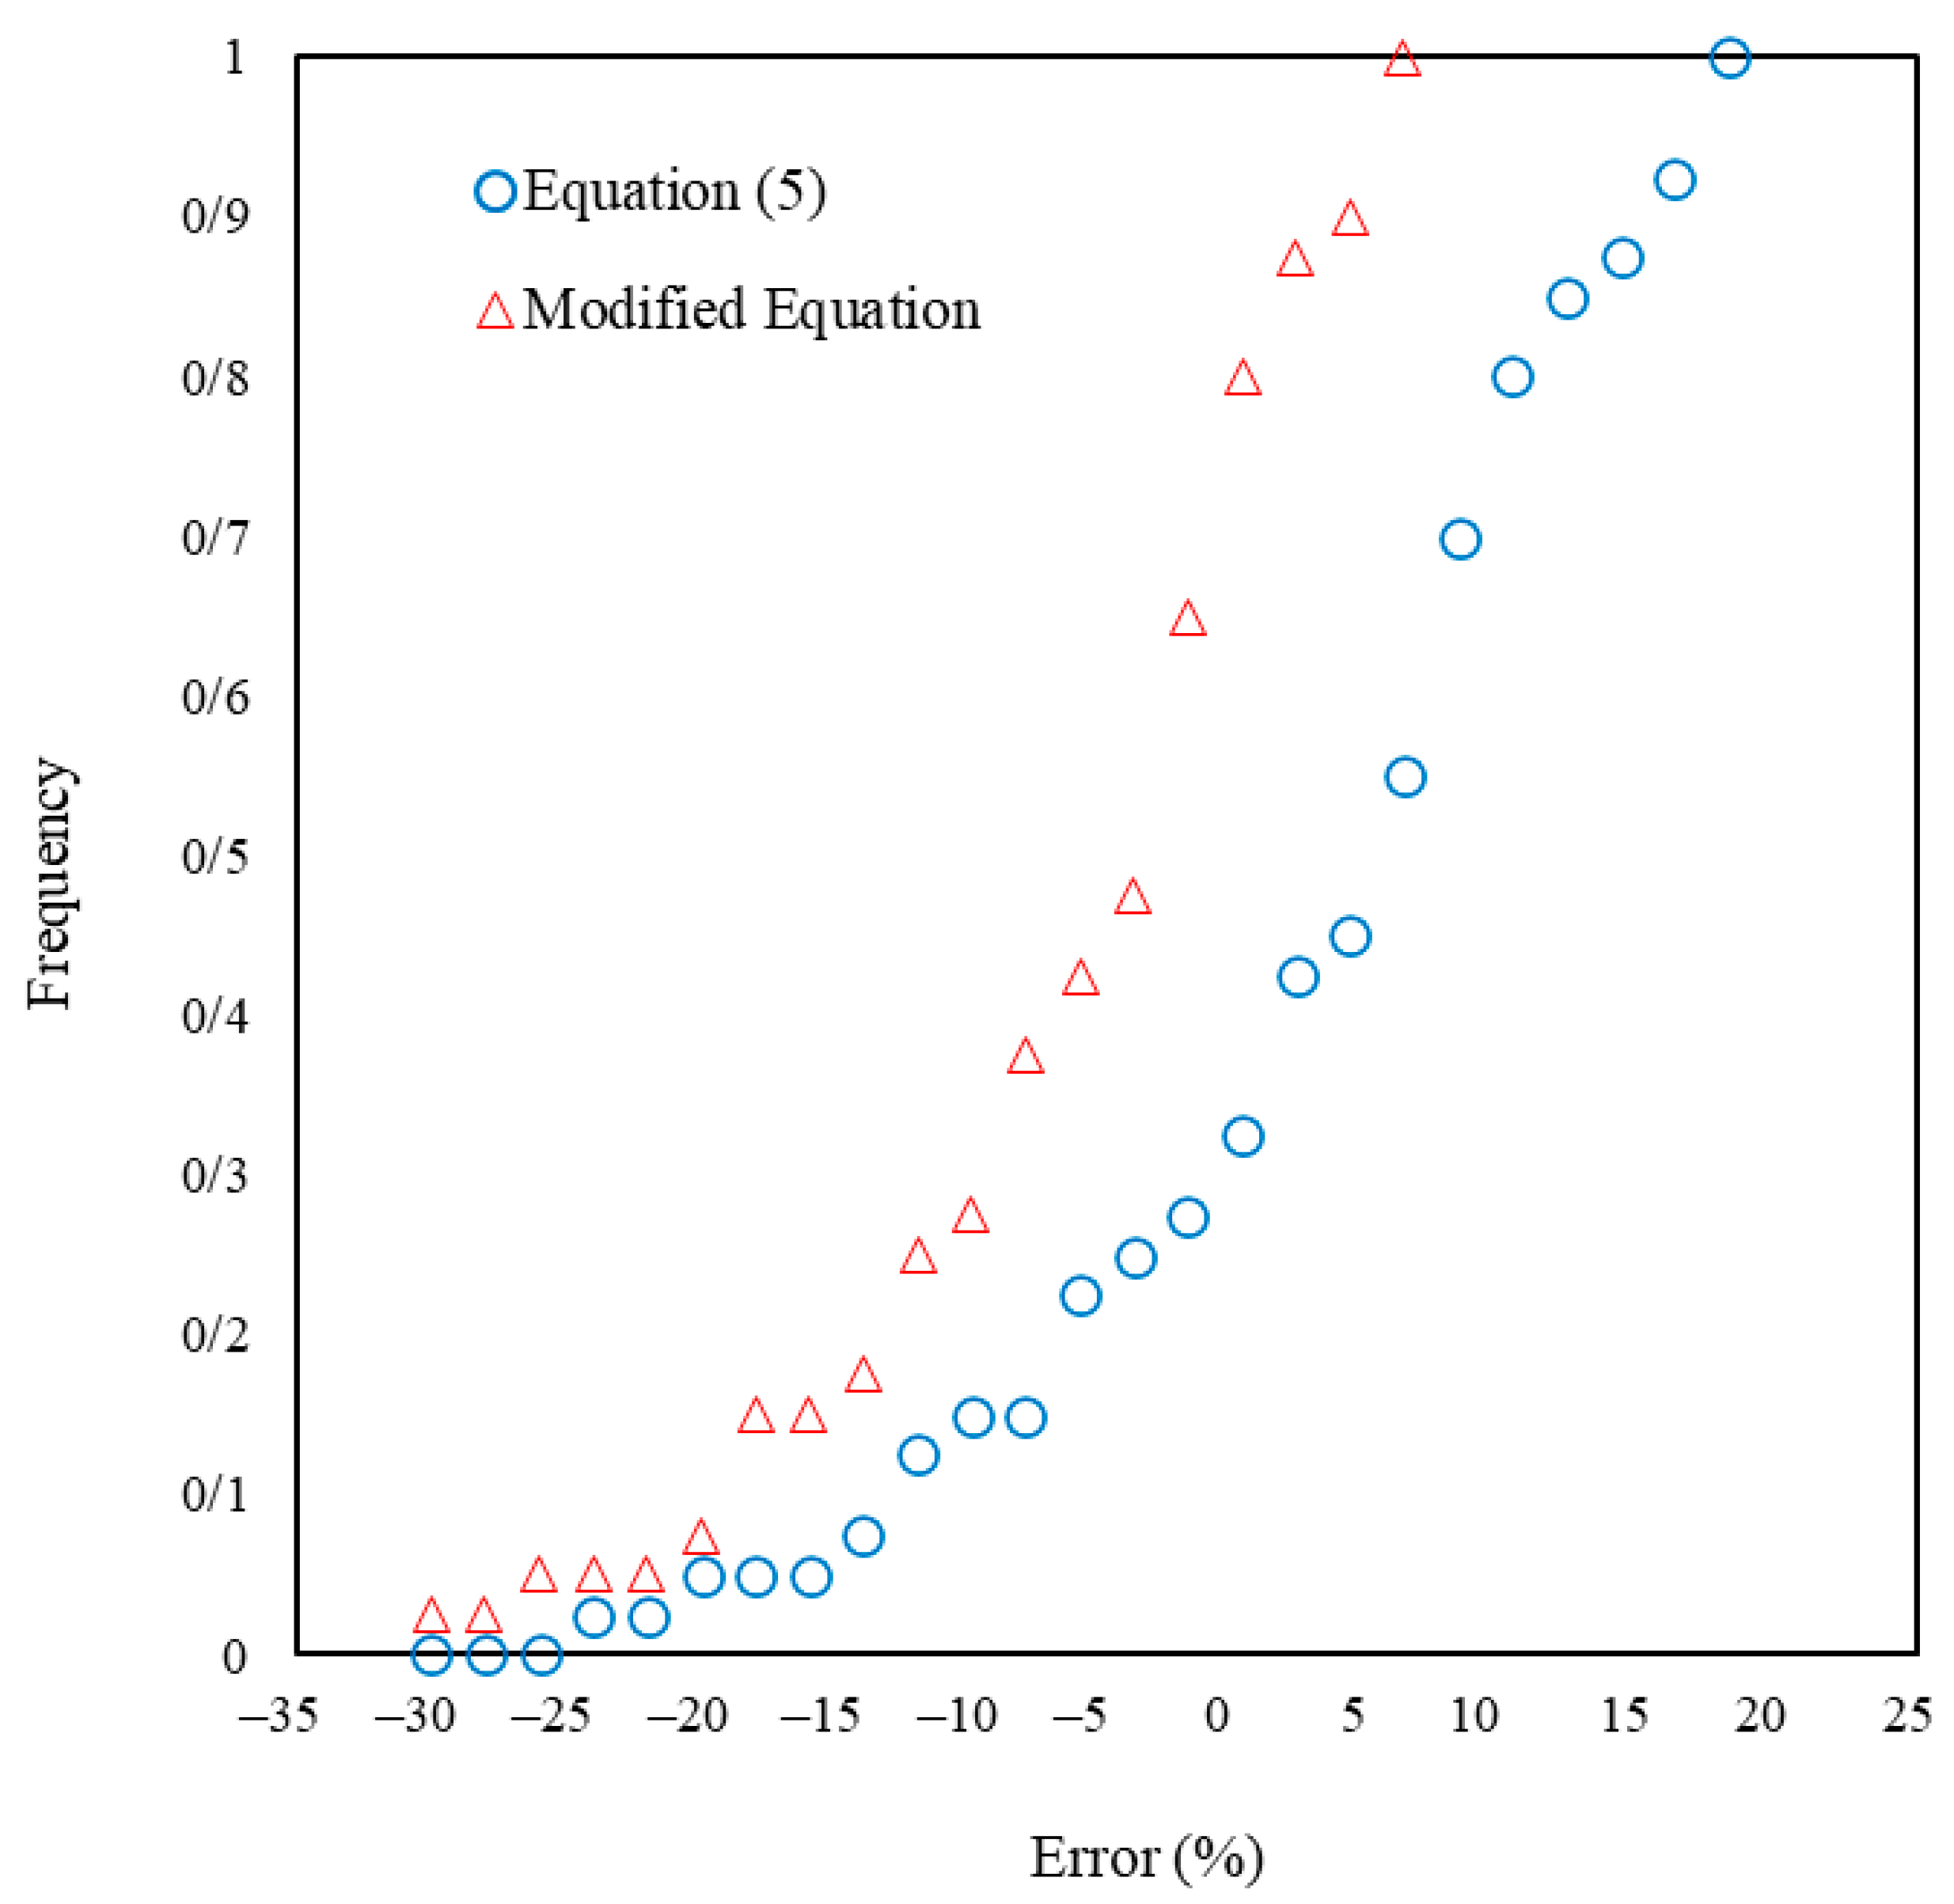
A modified equation was suggested only based on variations of parameter h/P for calculating discharge, which reduces RMSE from 0.0005 to 0.0002, MAE from 0.0004 to 0.0002, and increases R2 from 0.996 to 0.997. This equation is valid for the range 0.08 < h/P < 0.53. Also, results of the frequency distribution of the errors for computed flow discharge (Qm) for the modified equation with experimental data present acceptable accuracy of the suggested equation. The statistical results confirm that the proposed equation is more suitable for engineering purposes. The reduced error metrics support its applicability for engineering purposes, particularly in designing systems that require precise discharge estimation. This improved accuracy ensures better flow regulation, minimizes wastage, and optimizes resource allocation in hydraulic projects.
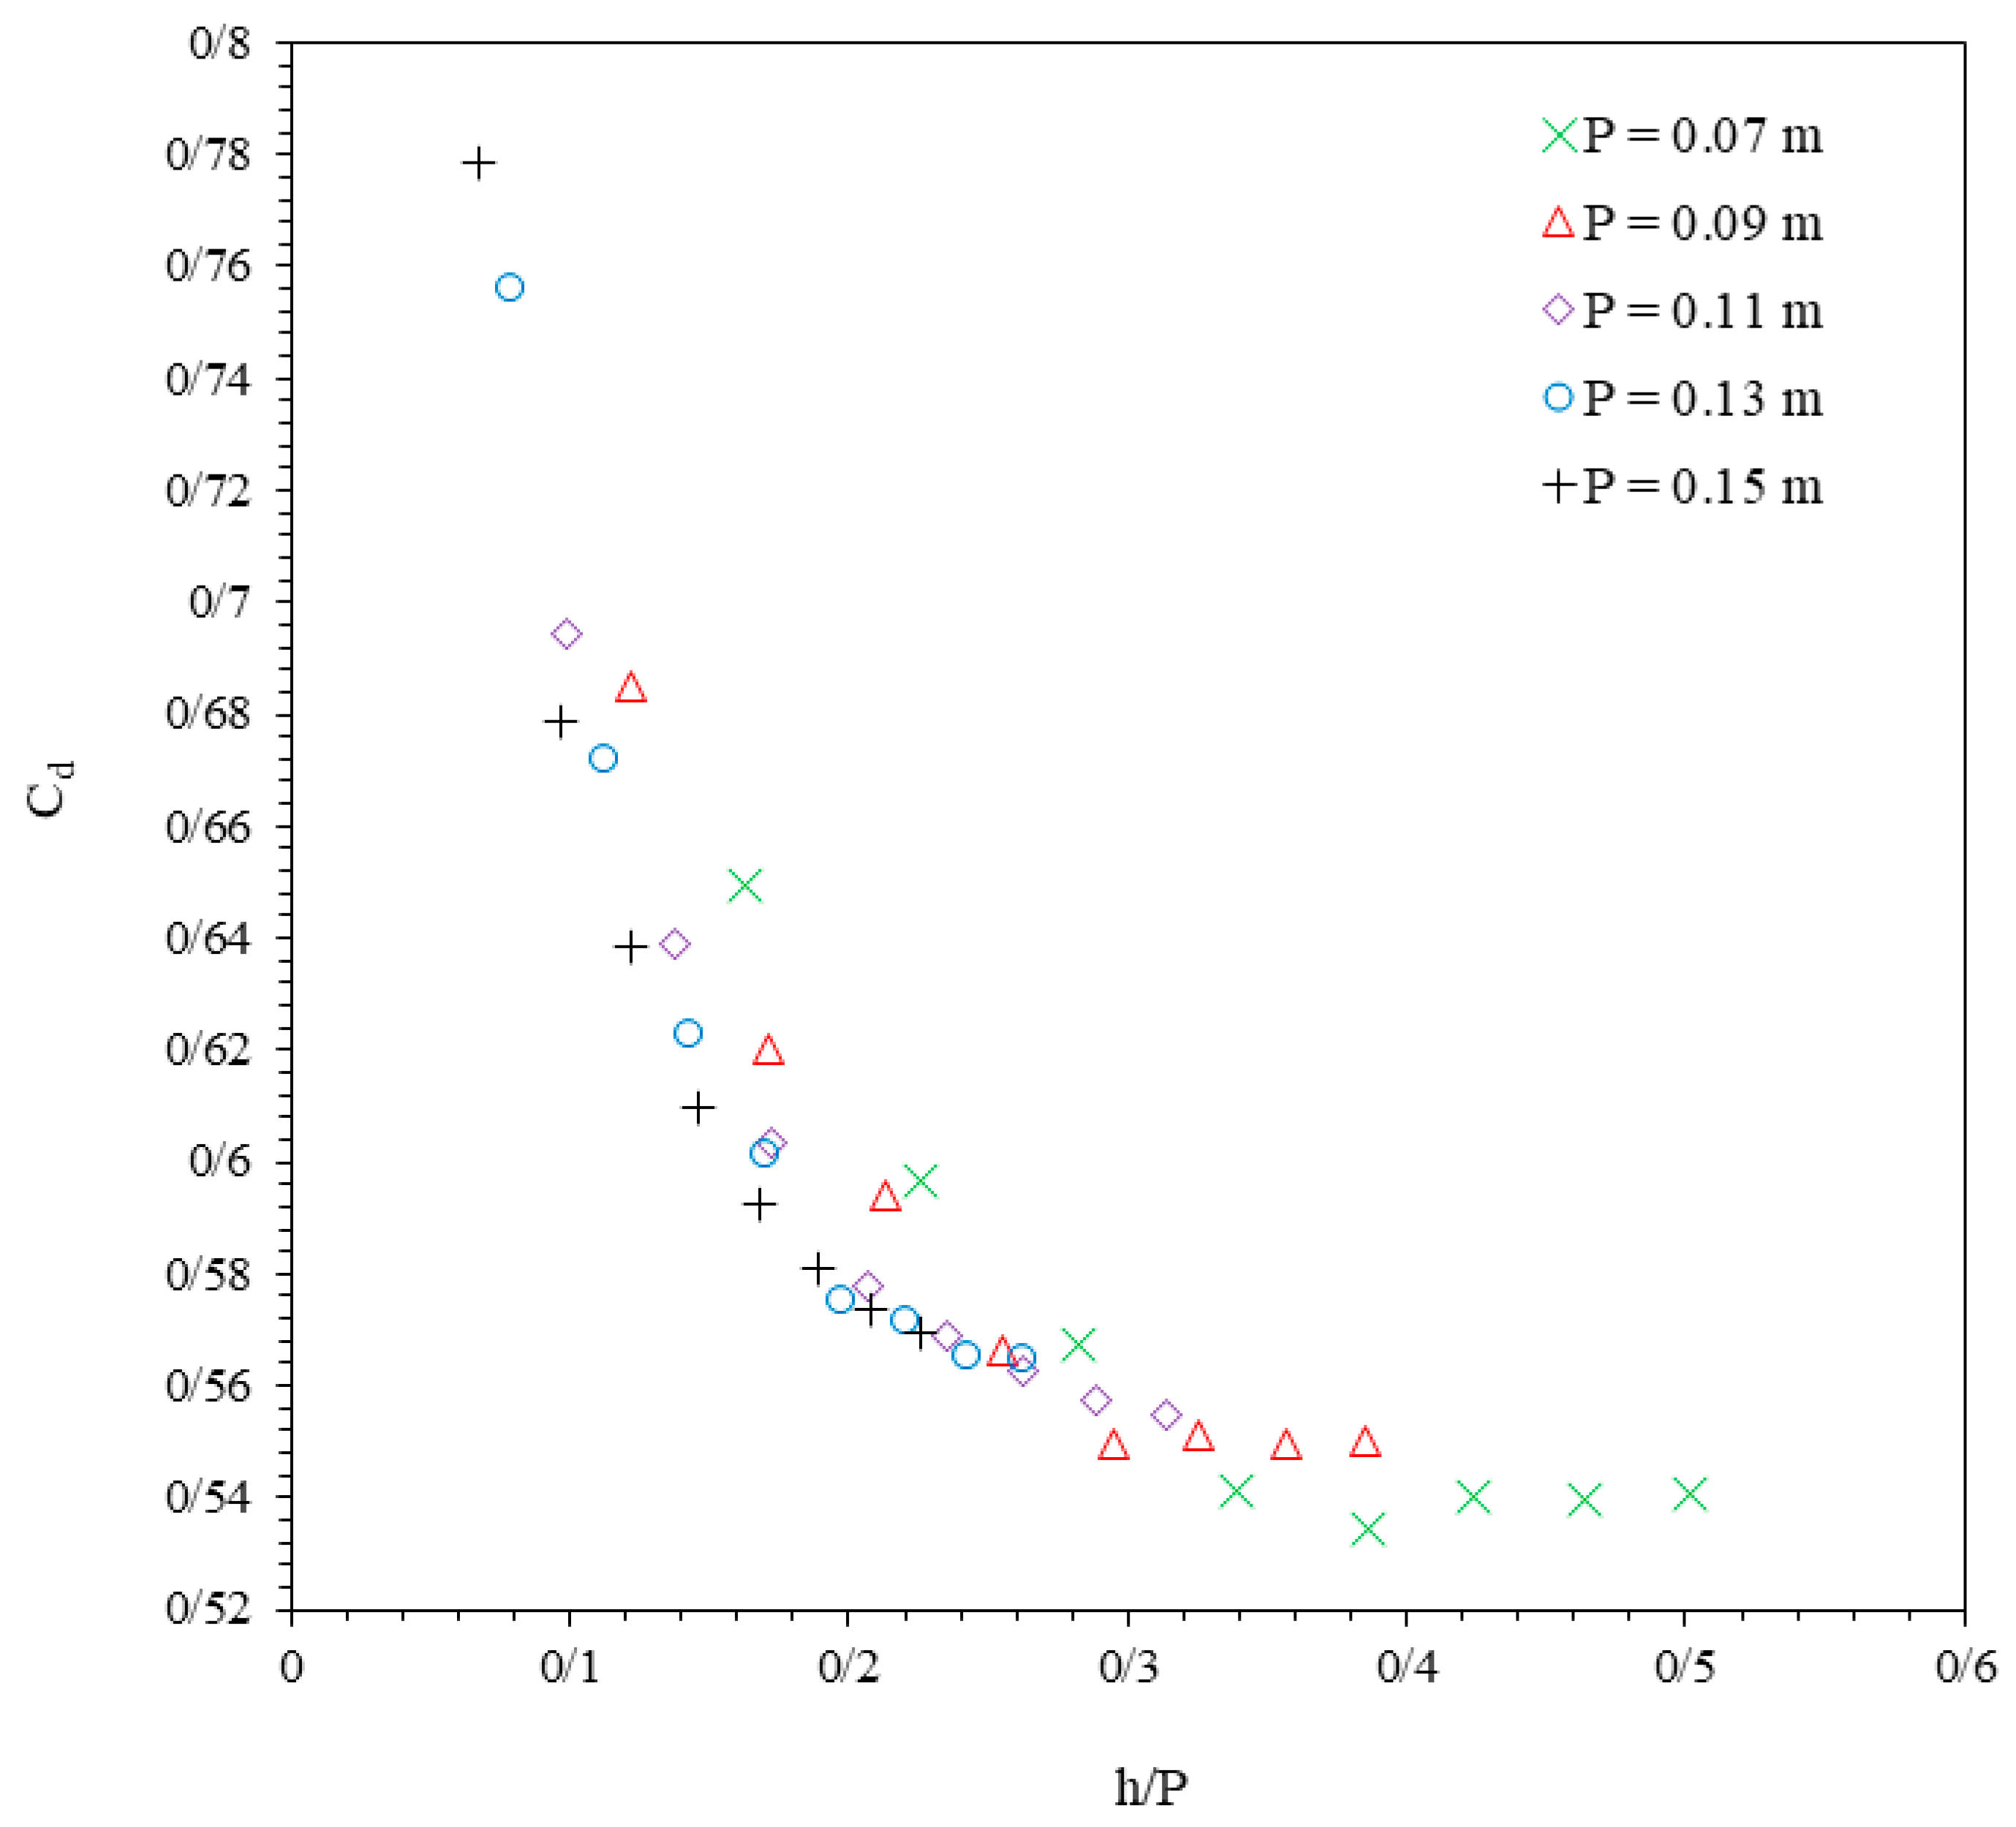
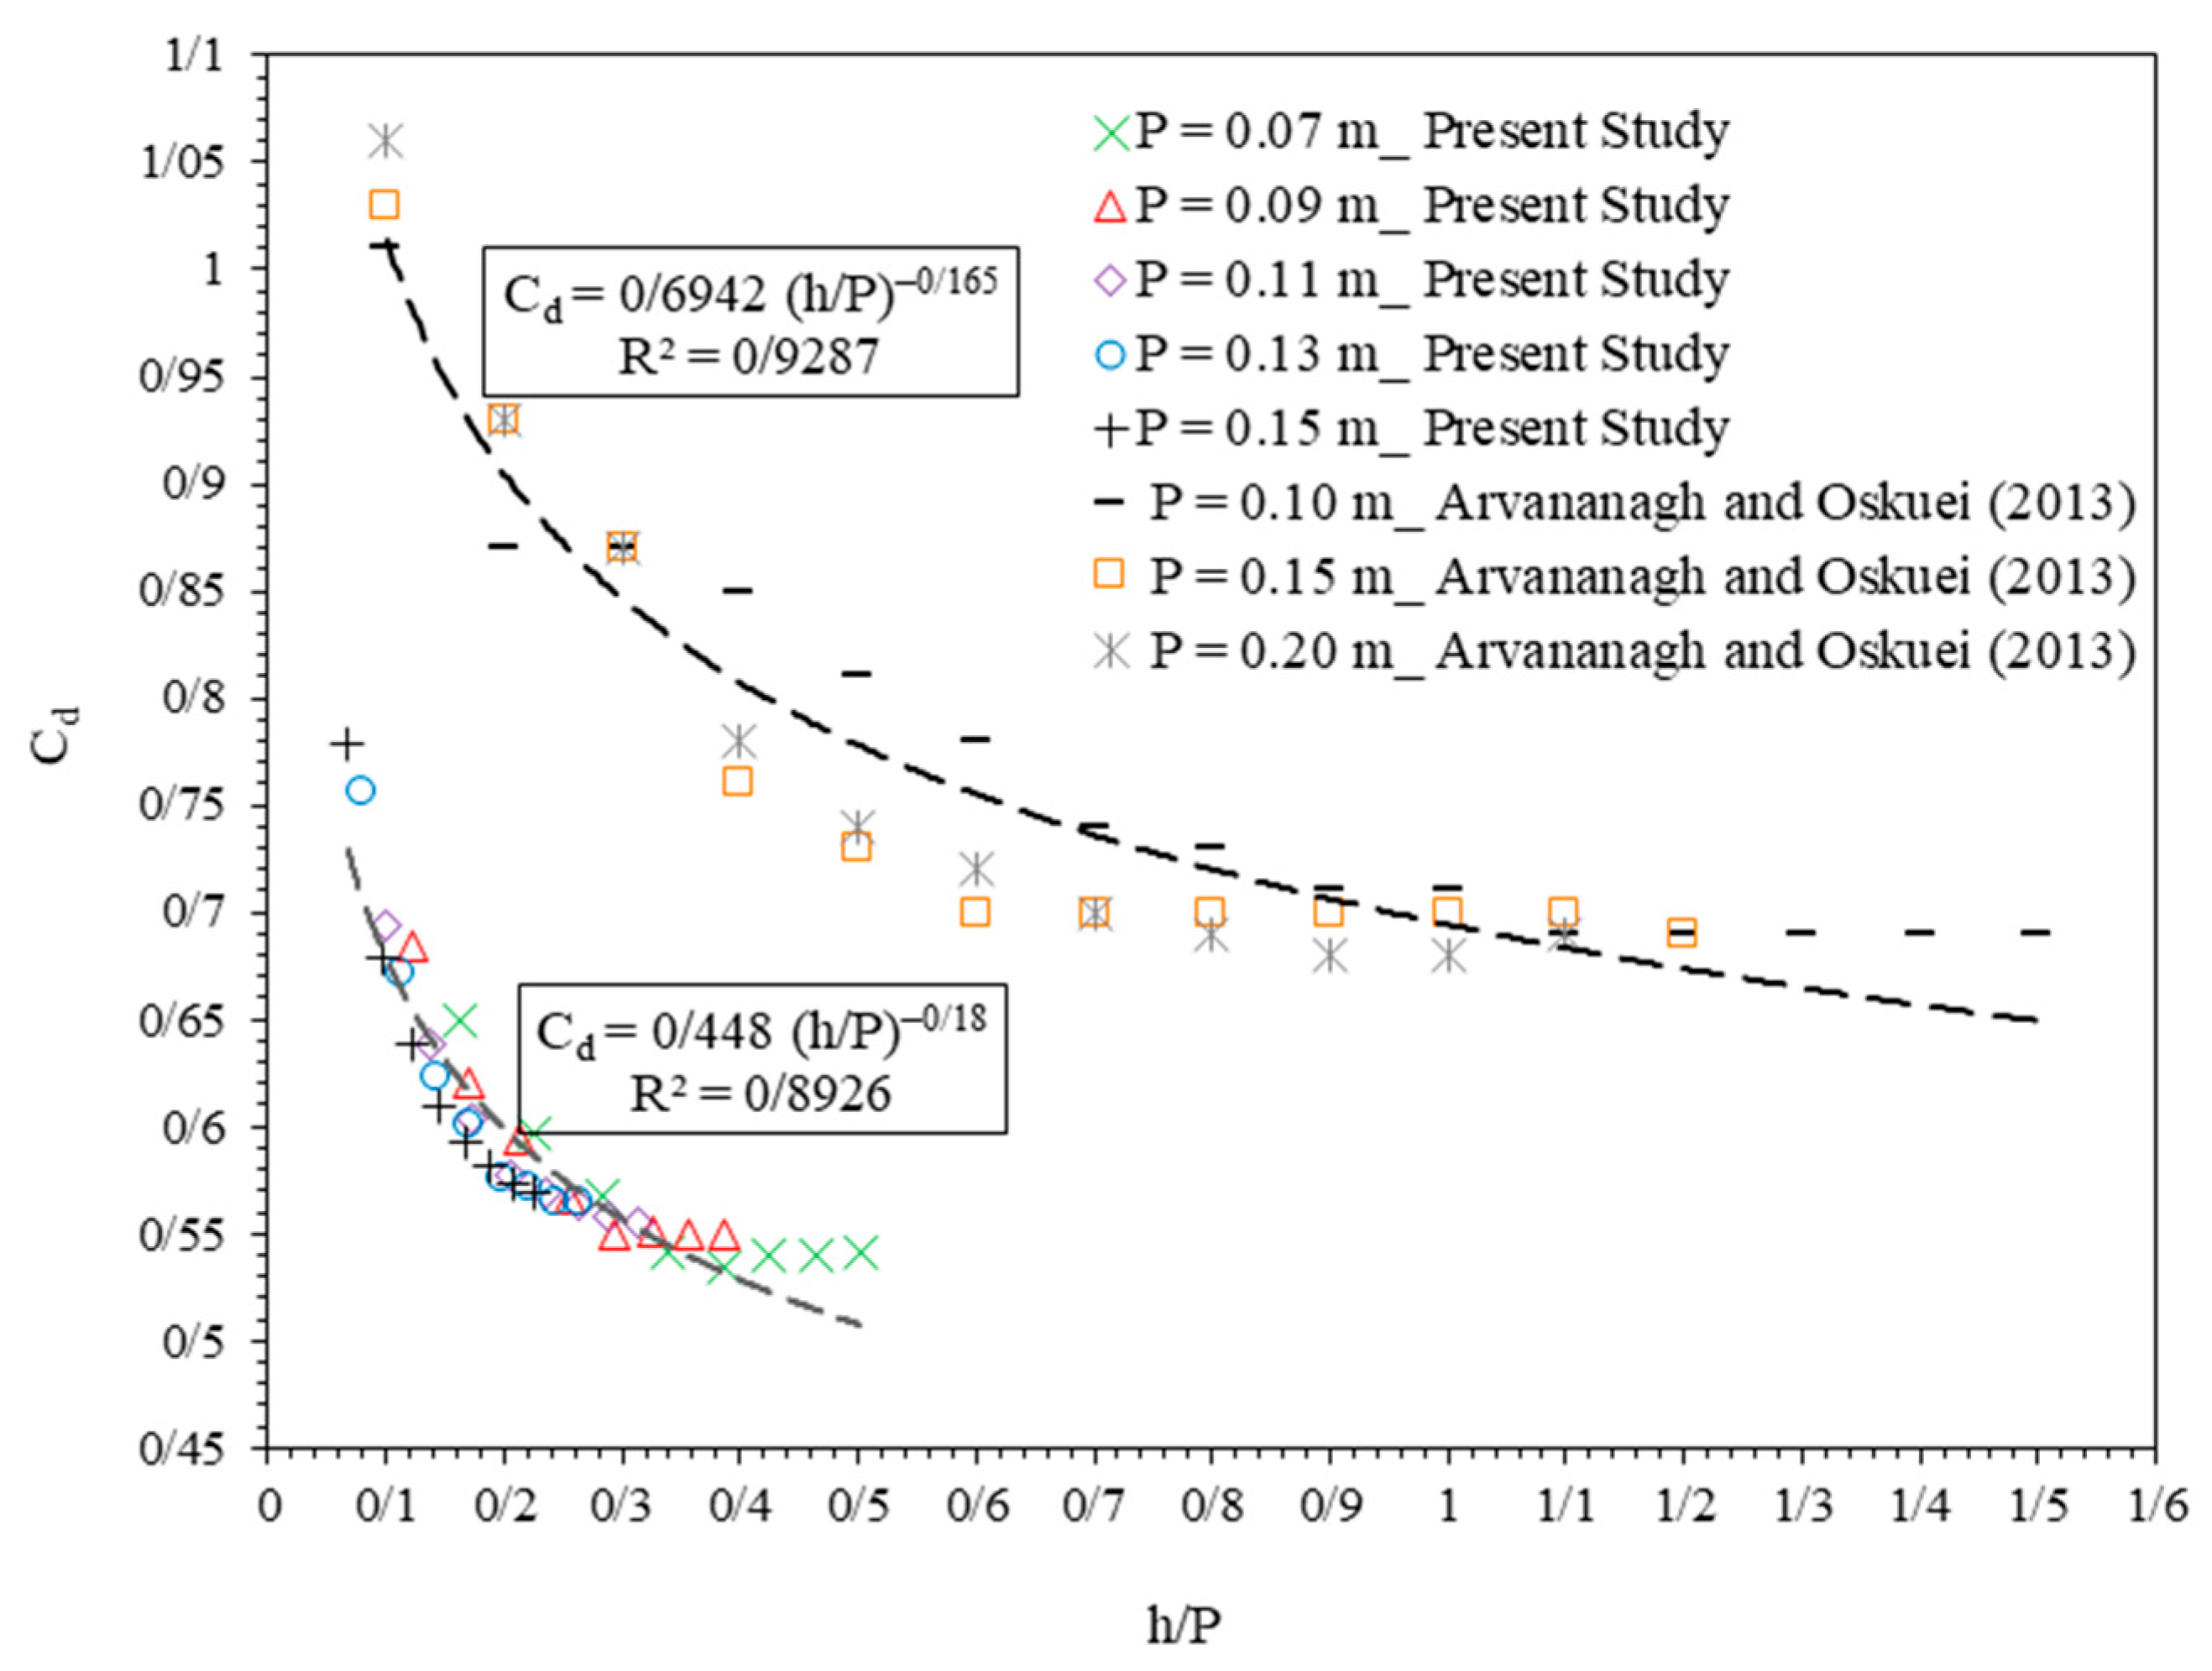
Laboratory models’ results indicate that the discharge coefficient of the FWPW decreases as h/P increases. The average Cd values for P = 0.07, 0.09, 0.11, 0.13, and 0.15 m were obtained: 0.5763, 0.5833, 0.5947, 0.6161, and 0.6277, respectively. The lowest and highest Cd values were 0.5343 (test A5) and 0.7785 (test F1), respectively. The comparison between the present data and results adapted from Arvanaghi and Oskuei [36] confirms the compatible trend of the Cd results with power. Notably, Cd values in Arvanaghi and Oskuei [36] are greater than in the present study. This difference in Cd results can result from differences in the parameter range in the experimental model and channel geometry. The channel width in Arvanaghi and Oskuei [36] is about 42% of the present model, and h and h/P values are much larger than those in this study. Consequently, Cd values in both datasets decrease as h/P increases; through in Arvanaghi and Oskuei [36], they reach 0.7, whereas the present study recorded 0.54. These results offer valuable insights for designing tailored FWPWs that meet specific site conditions and operational requirements. The findings emphasize the importance of accounting for geometric variations and hydraulic conditions when adapting designs for field applications.
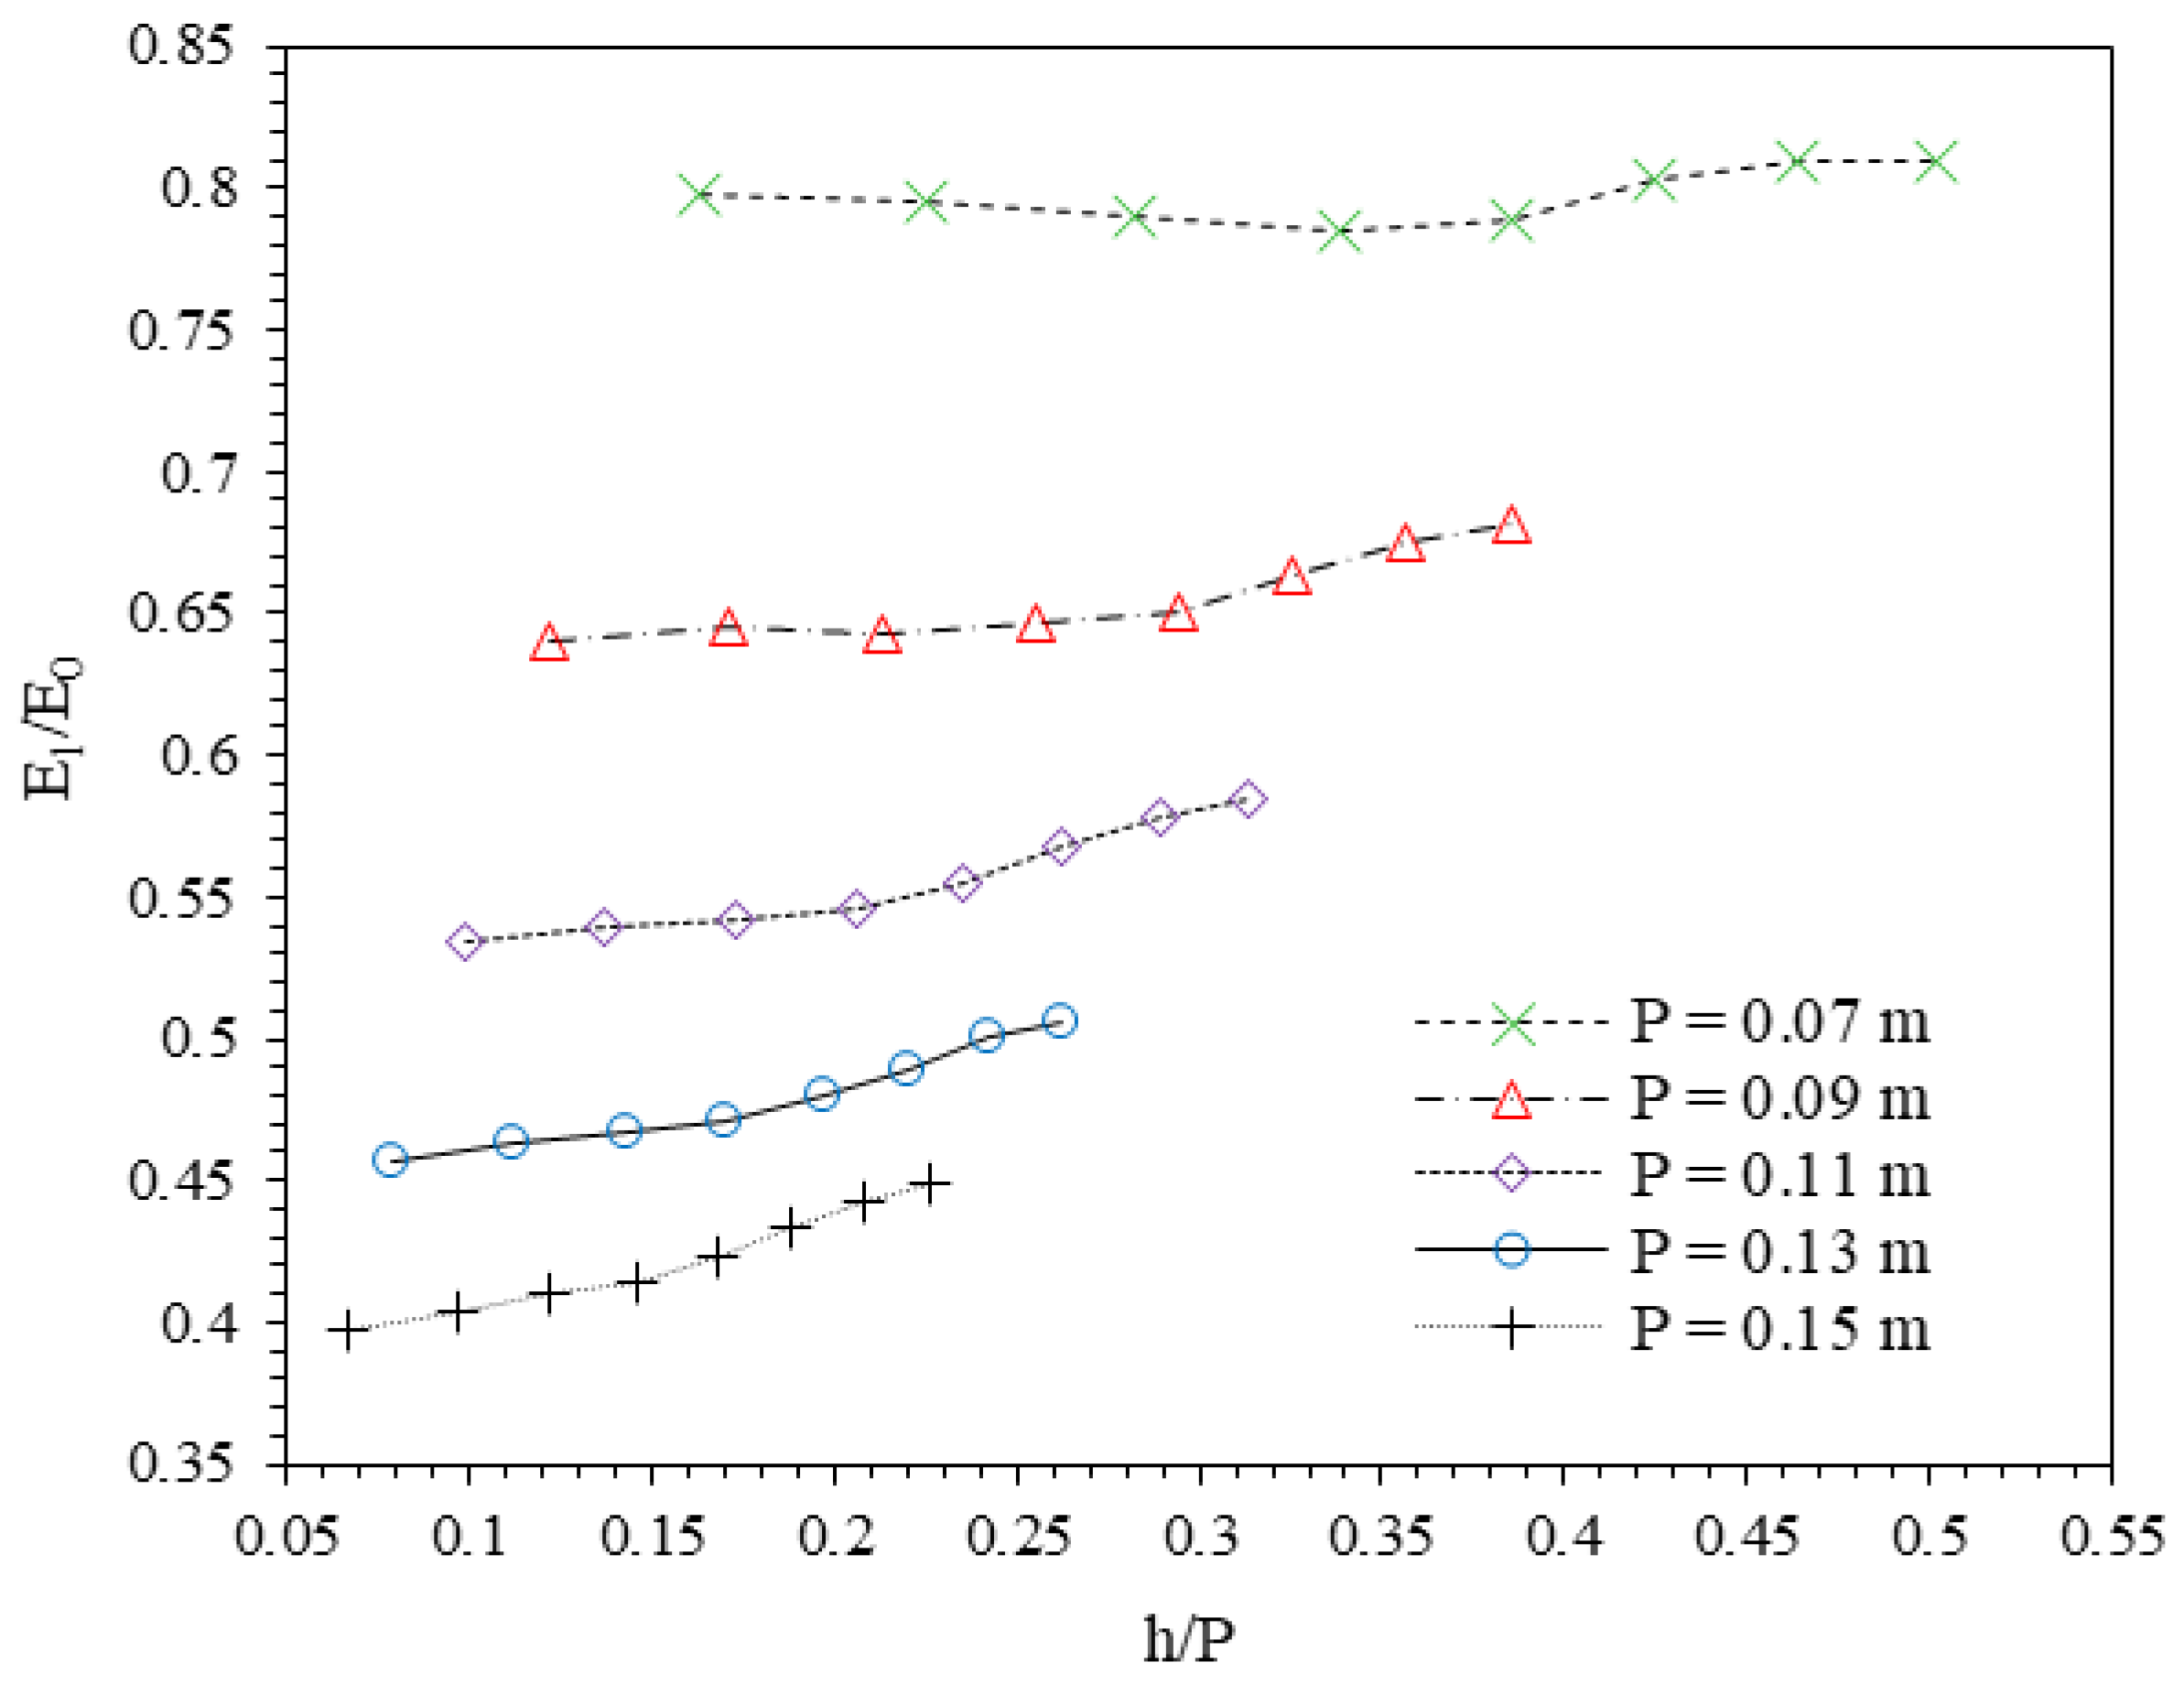
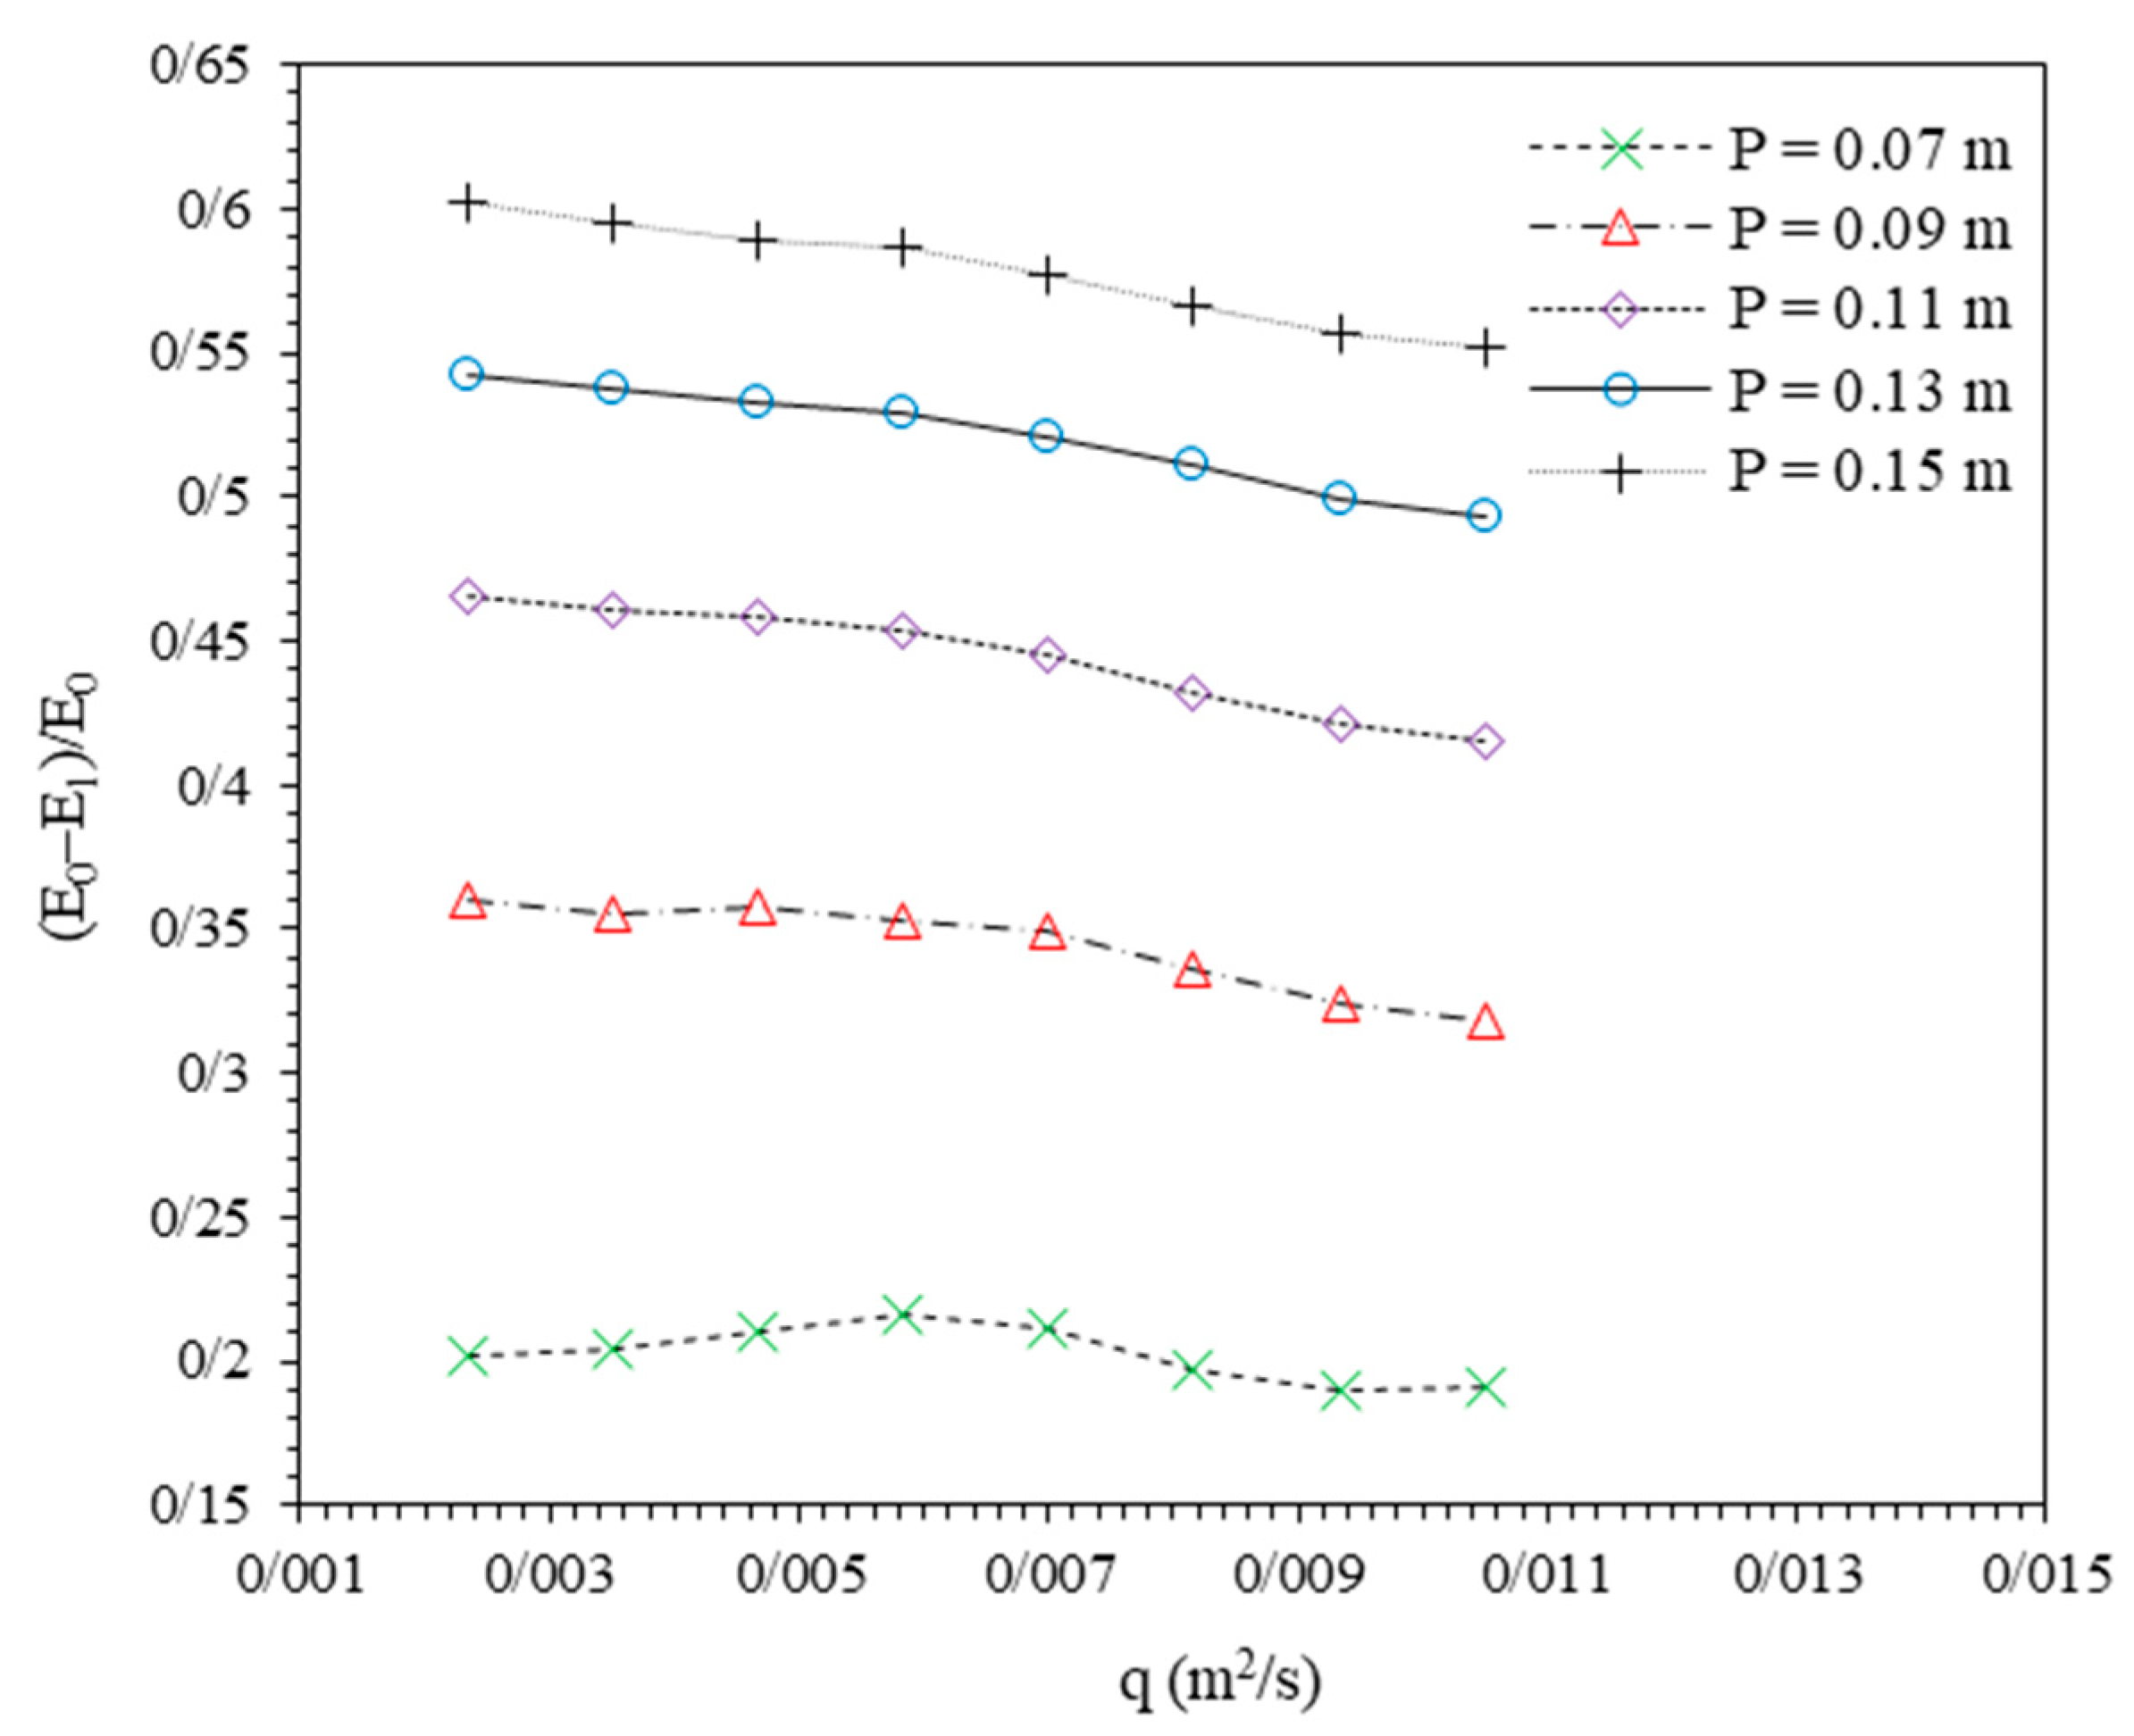
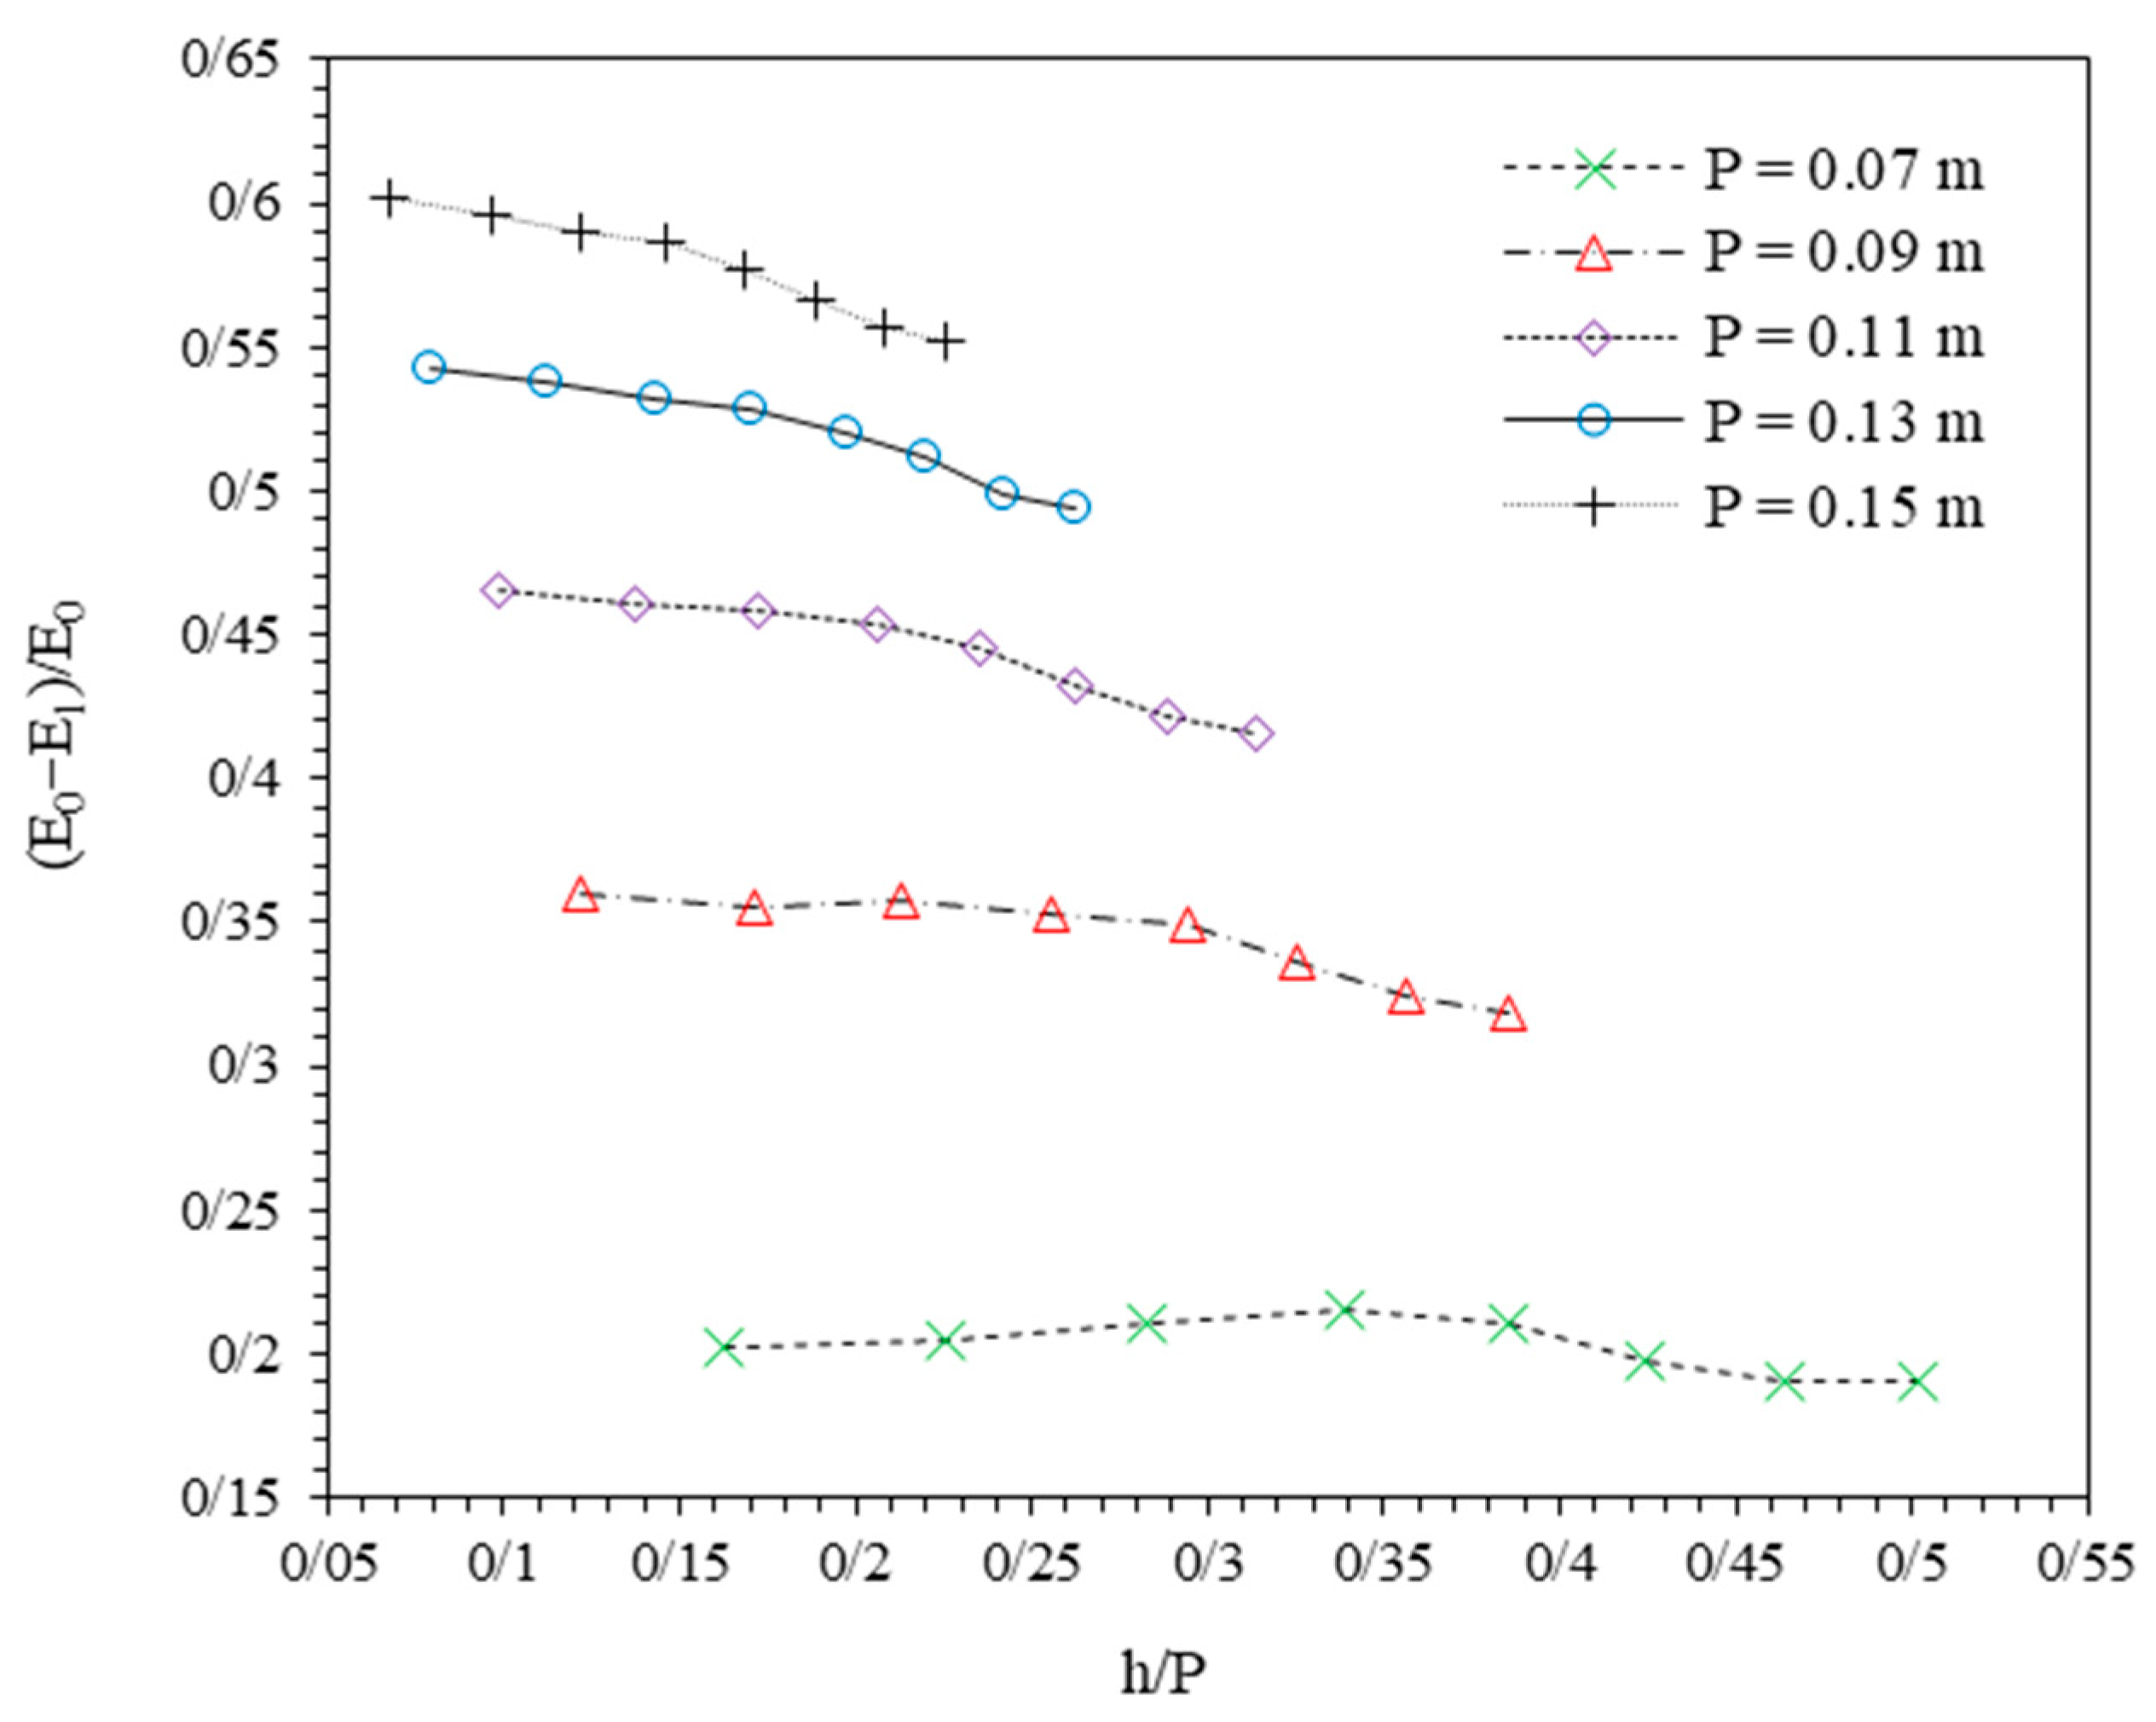
Average values of relative residual energy (E1/E0) for P = 0.07, 0.11, 0.13, and 0.15 m were 0.7973, 0.6558, 0.5559, 0.4792, and 0.4217, respectively. Also, average values of relative energy dissipation ((E0E1)/E0) were 0.2027, 0.3442, 0.4441, 0.5208, 0.5783 for P = 0.07, 0.11, 0.13, 0.15 m, respectively. At a constant discharge, E1/E0 decreases by increasing weir height, and in a constant P, increasing flow discharge increases E1/E0 slightly. It concluded that at a constant q, (E0E1)/E0 increases as weir height increases, and at a constant P, flows with higher discharges result in slightly lower relative energy dissipation. These results demonstrate that increasing weir height enhances energy dissipation, which is critical for mitigating downstream erosion and maintaining structural integrity. Practical applications include optimizing energy dissipation in irrigation channels to prevent soil erosion and downstream sedimentation. These findings can also guide the design of weirs in hydropower and flood control systems, where efficient energy management is essential.
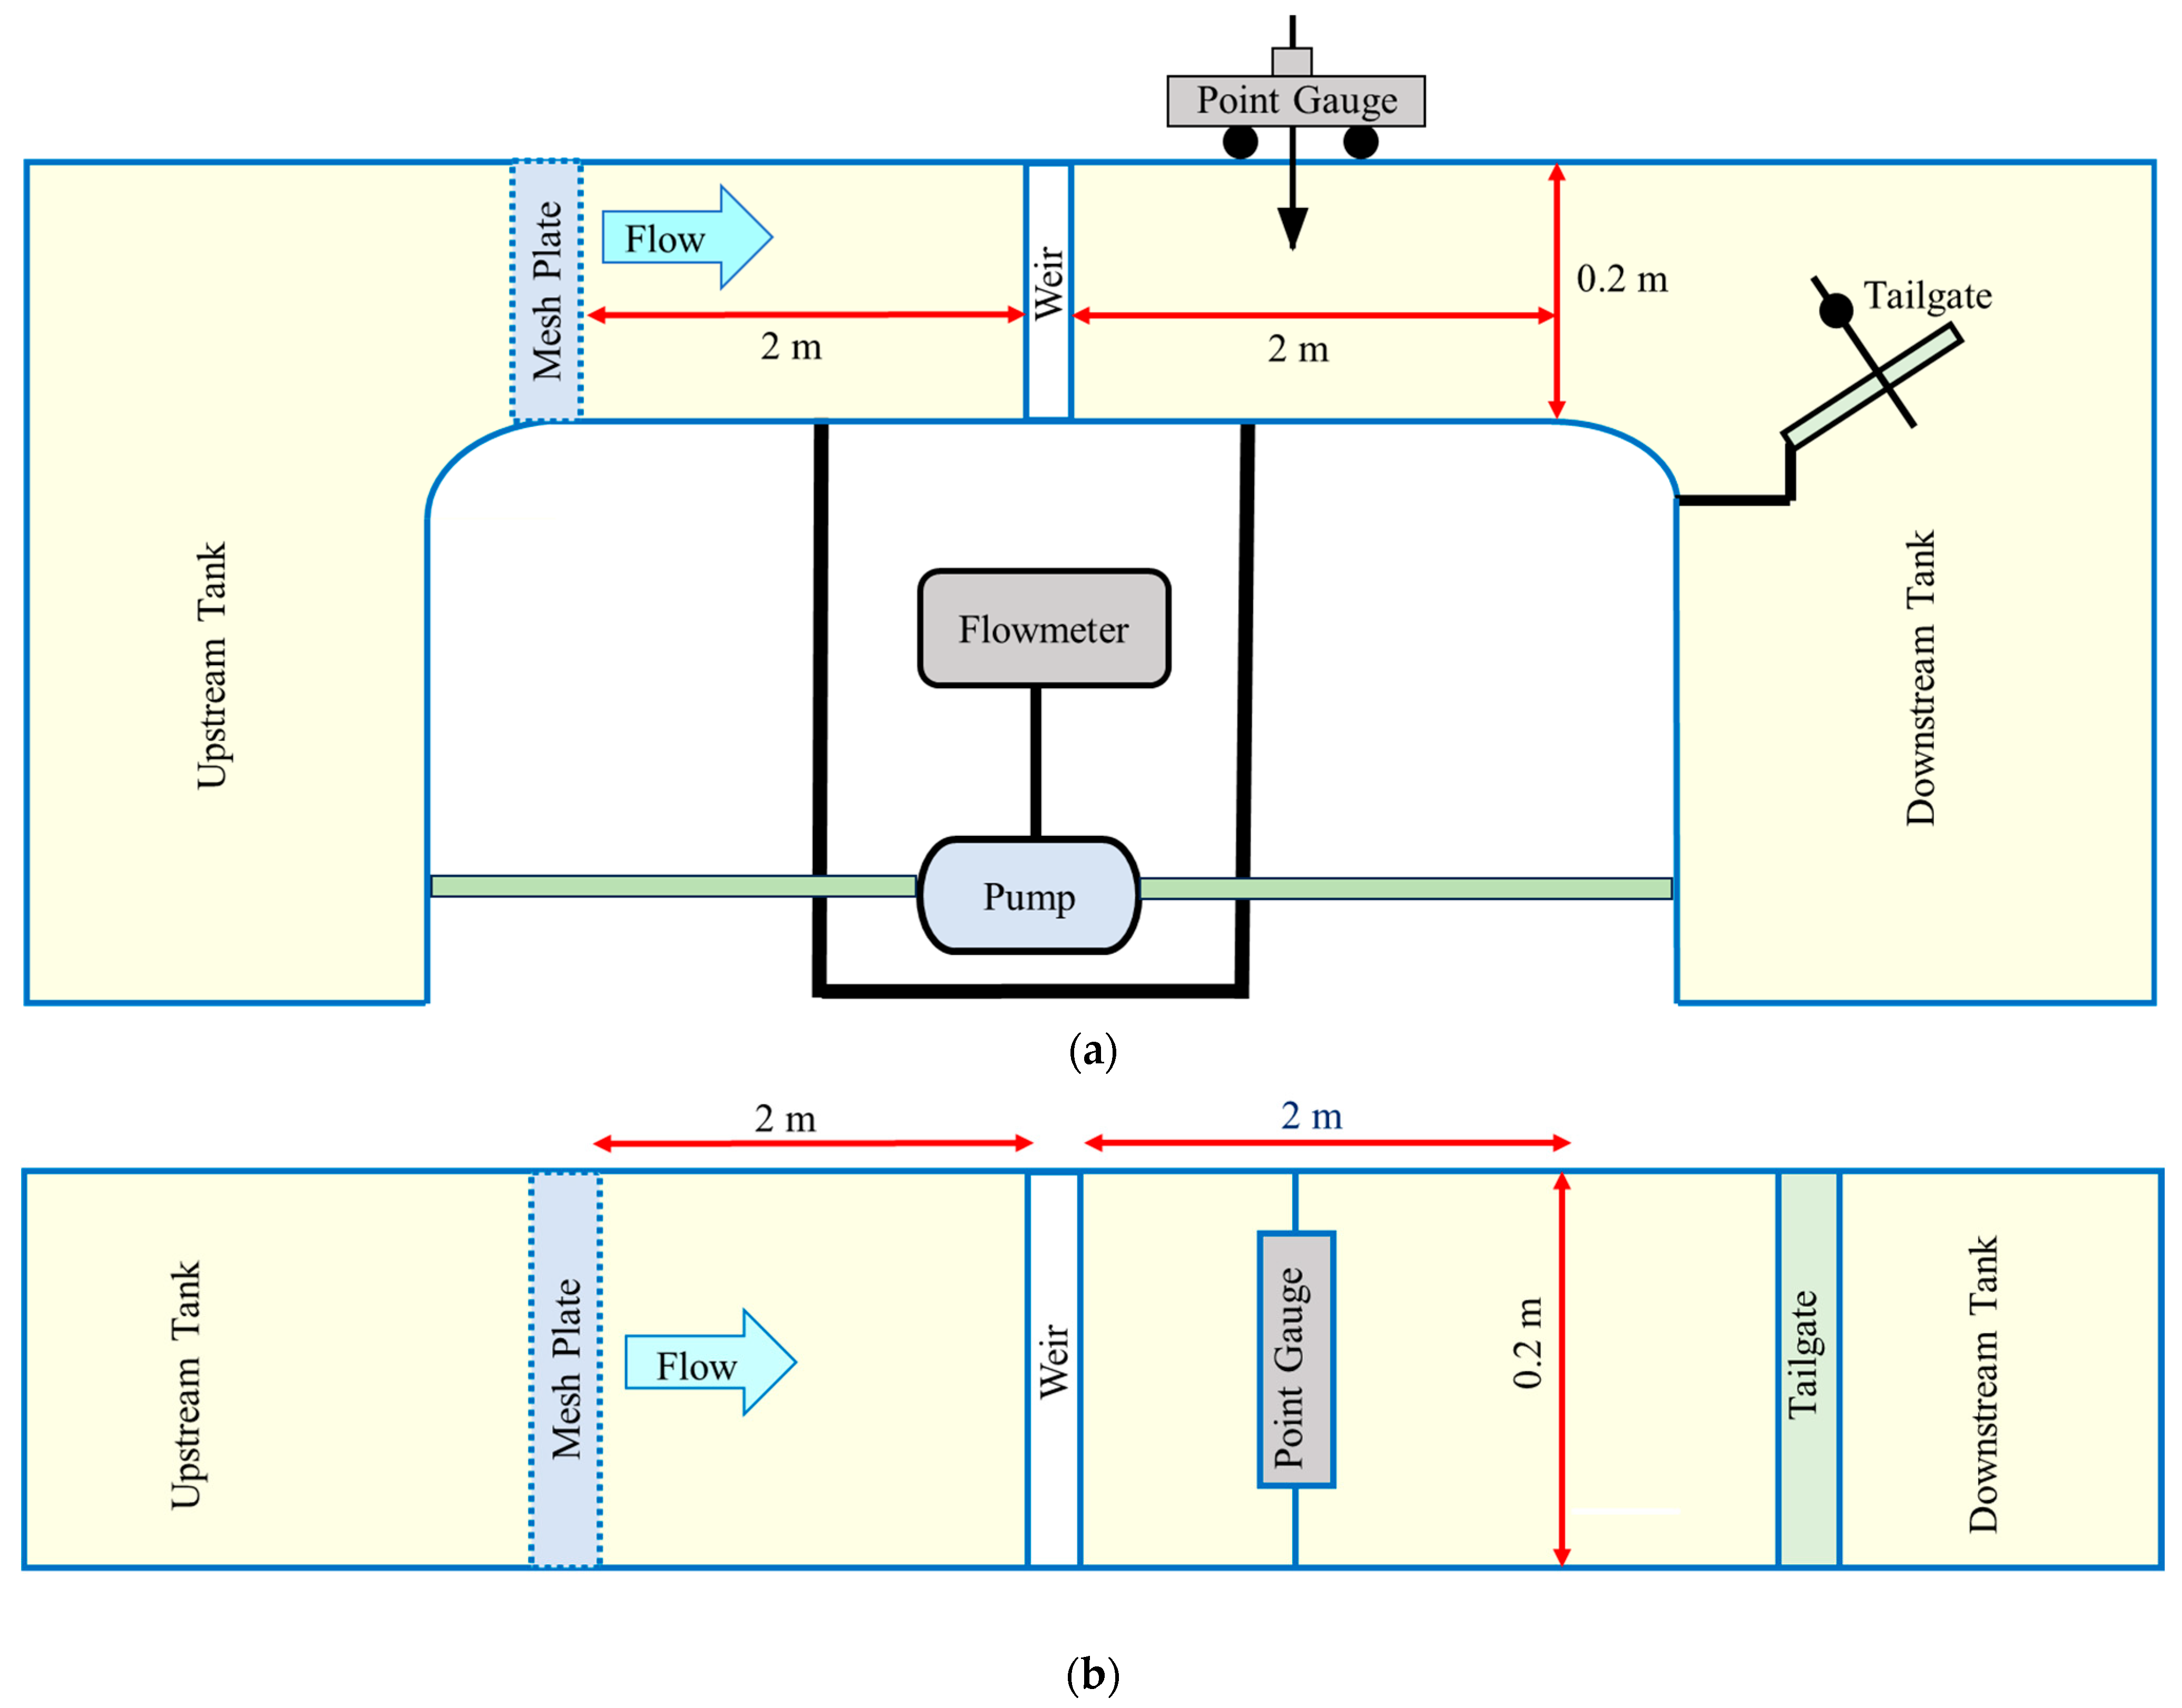
This research investigated the hydraulic model of a full-width plate weirs in a laboratory and like other experimental studies, is subject to limitations and uncertainties. However, efforts have been made to minimize their effects on the results through the approximate application of suitable model design and implementation. One limitation is the measurement Process, which, as mentioned in the experimental setup section, incorporates water depth and discharge measurement criteria consistent with those of previous studies. Another is the limited range of parameters due to the low height of the channel and its small scale, which could have affected the weir height. Nevertheless, the weir height remains within a reasonable range compared with other studies [36], as presented in Table 7.

Author Contributions

Conceptualization, A.M.K., H.S.A. and M.H.; validation, A.M.K. and H.S.A.; formal analysis, A.M.K. and H.S.A.; investigation, A.M.K., H.S.A., M.H. and S.A.K.; resources, A.M.K.; data curation, A.M.K.; writing—original draft preparation. A.M.K. and H.S.A.; writing—review and editing, A.M.K., H.S.A. and S.A.K.; visualization; A.M.K.; supervision; M.H. and S.A.K.; project administration, A.M.K. All authors have read and agreed to the published version of the manuscript.

Funding

This research received no external funding.

Data Availability Statement

The data presented in this study are available on request from the corresponding author.

Acknowledgments

Corresponding author acknowledges the Babol Noshirvani University of Technology (BNUT). The data used in the research are adopted from the experiments performed in the research project “Experimental Investigation of Discharge Coefficient of Rectangular Sharp-crested Weirs with Fully Contracted (Slit) and Partially Contracted in Small Scale Channels” at BNUT.

Conflicts of Interest

The authors declare no conflicts of interest. The funders had no role in the design of the study; in the collection, analyses, or interpretation of data; in the writing of the manuscript; or in the decision to publish the results.

References

  1. Lee, C.H.; Yeh, H.F. Impact of Climate Change and Human Activities on Streamflow Variations Based on the Budyko Framework. Water 2019, 11, 2001. [Google Scholar] [CrossRef]
  2. Mehrazar, A.; Massah Bavani, A.R.; Gohari, A.; Mashal, M.; Rahimikhoob, H. Adaptation of water resources system to water scarcity and climate change in the suburb area of megacities. Water Resour. Manag. 2020, 34, 3855–3877. [Google Scholar] [CrossRef]
  3. Foroumandi, E.; Nourani, V.; Kantoush, S.A. Investigating the main reasons for the tragedy of large saline lakes: Drought, climate change, or anthropogenic activities? A call to action. J. Arid Environ. 2022, 196, 104652. [Google Scholar] [CrossRef]
  4. Idrissou, M.; Diekkrüger, B.; Tischbein, B.; Op de Hipt, F.; Näschen, K.; Poméon, T.; Yira, Y.; Ibrahim, B. Modeling the Impact of Climate and Land Use/Land Cover Change on Water Availability in an Inland Valley Catchment in Burkina Faso. Hydrology 2022, 9, 12. [Google Scholar] [CrossRef]
  5. Viloria, J.A.; Olivares, B.O.; García, P.; Paredes-Trejo, F.; Rosales, A. Mapping Projected Variations of Temperature and Precipitation Due to Climate Change in Venezuela. Hydrology 2023, 10, 96. [Google Scholar] [CrossRef]
  6. Lyra, A.; Loukas, A.; Sidiropoulos, P.; Mylopoulos, N. Climatic Modeling of Seawater Intrusion in Coastal Aquifers: Understanding the Climate Change Impacts. Hydrology 2024, 11, 49. [Google Scholar] [CrossRef]
  7. Tariq, Z.H.; Willis, H.H. Examining Trends in the Food–Energy–Water Security Nexus and Its Relationships with Human Development, Population Growth, and Conflict. Sustainability 2024, 16, 8255. [Google Scholar] [CrossRef]
  8. Daus, M.; Koberger, K.; Koca, K.; Beckers, F.; Encinas Fernández, J.; Weisbrod, B.; Dietrich, D.; Gerbersdorf, S.U.; Glaser, R.; Haun, S.; et al. Interdisciplinary Reservoir Management—A Tool for Sustainable Water Resources Management. Sustainability 2021, 13, 4498. [Google Scholar] [CrossRef]
  9. Mishra, B.K.; Kumar, P.; Saraswat, C.; Chakraborty, S.; Gautam, A. Water Security in a Changing Environment: Concept, Challenges and Solutions. Water 2021, 13, 490. [Google Scholar] [CrossRef]
  10. Angelakis, A.N.; Baba, A.; Valipour, M.; Dietrich, J.; Fallah-Mehdipour, E.; Krasilnikoff, J.; Bilgic, E.; Passchier, C.; Tzanakakis, V.A.; Kumar, R.; et al. Water Dams: From Ancient to Present Times and into the Future. Water 2024, 16, 1889. [Google Scholar] [CrossRef]
  11. Ullah, S.; Ali, U.; Rashid, M.; Kisi, O.; Vishwakarma, D.K.; Raza, A.; Alataway, A.; Dewidar, A.Z.; Mattar, M.A. Evaluating land use and climate change impacts on Ravi river flows using GIS and hydrological modeling approach. Sci. Rep. 2024, 14, 22080. [Google Scholar] [CrossRef] [PubMed]
  12. Ullah, M.Z.; Mughal, H.-U.-R.; Yaseen, N.; Khan, N.M.; Varra, G.; Cozzolino, L.; Della Morte, R. Operativity of the Taunsa Barrage, Pakistan: Experimental Investigation on the Subsidiary Weir. Hydrology 2025, 12, 1. [Google Scholar] [CrossRef]
  13. Drobot, R.; Draghia, A.F.; Dinu, C.; Sîrbu, N.; Chendeș, V.; Mazilu, P. Adaptive Operating Rules for Flood Control of a Multi-Purpose Reservoir. Hydrology 2024, 11, 147. [Google Scholar] [CrossRef]
  14. Li, Z.; Yang, F.; Han, C.; Fan, Z.; Yu, K.; Han, K.; Wu, J. Investigating the Energy Dissipation Mechanism of Piano Key Weir: An Integrated Approach Using Physical and Numerical Modeling. Water 2024, 16, 2620. [Google Scholar] [CrossRef]
  15. Yang, J.; Li, S. Piano Key Weir (PKW)—Improvement in Conventional Geometry for Augmented Discharge Capacity. Water 2024, 16, 3375. [Google Scholar] [CrossRef]
  16. Bijankhan, M.; Ferro, V. Dimensional analysis and stage-discharge relationship for weirs: A review. J. Agric. Eng. 2017, 48, 1–11. [Google Scholar] [CrossRef]
  17. Kumar, M.; Sihag, P.; Tiwari, N.; Ranjan, S. Experimental study and modelling discharge coefficient of trapezoidal and rectangular piano key weirs. Appl. Water Sci. 2020, 10, 1–9. [Google Scholar] [CrossRef]
  18. Behroozi, A.M.; Vaghefi, M. Experimental and numerical study of the effect of zigzag crests with various geometries on the performance of A-type piano key weirs. Water Resour. Manag. 2022, 36, 4517–4533. [Google Scholar] [CrossRef]
  19. White, W.R. Thin plate weirs. Proc. Inst. Civ. Eng. 1977, 63, 255–269. [Google Scholar] [CrossRef]
  20. Herschy, R. General purpose flow measurement equations for flumes and thin plate weirs. Flow Meas. Instrum. 1995, 6, 283–293. [Google Scholar] [CrossRef]
  21. Napierała, M. Application of Simple Crested Weirs to Control Outflows from Tiles Drainage. Water 2023, 15, 3248. [Google Scholar] [CrossRef]
  22. Bos, M.G. Discharge Measurement Structures; International Institute for Land Reclamation and Improvement: Wageningen, The Netherlands, 1989. [Google Scholar]
  23. Vatankhah, A.R. Stage-discharge relationship for sharp-crested rectangular slit weirs. J. Irrig. Drain. Eng. 2019, 145, 06019006. [Google Scholar] [CrossRef]
  24. Yousif, O.S.Q.; Abdulrahman, K.Z.; Qadir, W.; Ali, A.S.; Karakouzian, M. Characteristics of Flow over Rectangular Labyrinth Weirs with Round Corners. Hydrology 2021, 8, 158. [Google Scholar] [CrossRef]
  25. Li, J.; Han, J. Experimental study of discharge formulas for rectangular sharp-crested weirs under free flow condition. Flow Meas. Instrum. 2022, 84, 102115. [Google Scholar] [CrossRef]
  26. Zaffar, M.W.; Haasan, I.; Ghumman, A.R. Performance Evaluation of Different Stilling Basins Downstream of Barrage Using FLOW-3D Scour Models. Hydrology 2023, 10, 223. [Google Scholar] [CrossRef]
  27. Sohrabzadeh Anzani, H.; Mahdian Khalili, A.; Kantoush, S.A.; Hamidi, M. Assessing the Influence of Opening Ratio on Sharp-crested Weir Performance. In Proceedings of the 5th IAHR Young Professionals Congress, Online, 27–29 November 2024. [Google Scholar]
  28. Borghei, S.M.; Vatannia, Z.; Ghodsian, M.; Jalili, M.R. Oblique rectangular sharp-crested weir. Proc. Inst. Civ. Eng.-Water Marit. Eng. 2003, 156, 185–191. [Google Scholar] [CrossRef]
  29. Kabiri-Samani, A.; Ansari, A.; Borghei, S.M. Hydraulic behaviour of flow over an oblique weir. J. Hydraul. Res. 2010, 48, 669–673. [Google Scholar] [CrossRef]
  30. Rajaratnam, N.; Muralidhar, D. Flow below deeply submerged rectangular weirs. J. Hydraul. Res. 1969, 7, 355–374. [Google Scholar] [CrossRef]
  31. Kindsvater, C.E.; Carter, R.W. Discharge characteristics of rectangular thin-plate weirs. Trans. Am. Soc. Civ. Eng. 1959, 124, 772–801. [Google Scholar] [CrossRef]
  32. Kandaswamy, P.K.; Rouse, H. Characteristics of flow over terminal weirs and sills. J. Hydraul. Div. 1957, 83, 1345-1. [Google Scholar] [CrossRef]
  33. Sarginson, E.J. The influence of surface tension on weir flow. J. Hydraul. Res. 1972, 10, 431–446. [Google Scholar] [CrossRef]
  34. Ramamurthy, A.S.; Tim, U.S.; Rao, M.V.J. Flow over sharp-crested plate weirs. J. Irrig. Drain. Eng. 1987, 113, 163–172. [Google Scholar] [CrossRef]
  35. Afzalimehr, H.; Bagheri, S. Discharge coefficient of sharp-crested weirs using potential flow. J. Hydraul. Res. 2009, 47, 820–823. [Google Scholar] [CrossRef]
  36. Arvanaghi, H.; Oskuei, N.N. Sharp-crested weir discharge coefficient. J. Civ. Eng. Urban. 2013, 3, 87–91. [Google Scholar]
  37. Gong, J.; Deng, J.; Wei, W. Discharge Coefficient of a Round-Crested Weir. Water 2019, 11, 1206. [Google Scholar] [CrossRef]
  38. Alomari, N.K.; Khaleel, M.S.; Mohammed, A.Y.; Juma, I.A. Discharge formula based on brink depth over sharp-crested weirs. Water Supply 2024, 24, 615–624. [Google Scholar] [CrossRef]
  39. Amin, M.R.; Rajaratnam, N.; Zhu, D. Energy loss below rectangular sharp-crested weirs for free flows. In Proceedings of the 38th IAHR World Congress, Panama City, Panama, 1–6 September 2019. [Google Scholar] [CrossRef]
  40. Amin, M.R.; Rajaratnam, N.; Zhu, D.Z. Flow and Energy Loss Downstream of Rectangular Sharp-Crested Weirs for Free and Submerged Flows. J. Fluids Eng. 2022, 144, 031201. [Google Scholar] [CrossRef]
  41. Meshkati, E.; Kantoush, S.A.; Sumi, T.; Quang Binh, N.; Sohrabzadeh Anzani, H. Experiments to classify In-Ground Stilling Basins and Determine the Factors Affecting the Optimization of Flood Mitigation Dams. Results Eng. 2025, 25, 104368. [Google Scholar] [CrossRef]
  42. Haghnazar, H.; Saneie, M. Impacts of pit distance and location on river sand mining management. Model. Earth Syst. Environ. 2019, 5, 1463–1472. [Google Scholar] [CrossRef]
  43. Gharahjeh, S.; Aydin, I.; Altan-Sakarya, A.B. Weir velocity formulation for sharp-crested rectangular weirs. Flow Meas. Instrum. 2015, 41, 50–56. [Google Scholar] [CrossRef]
  44. Akbari Dadamahalleh, P.; Hamidi, M.; Mahdian Khalili, A. Experimental prediction of the bed profile with the full-submerged and semi-submerged debris accumulation upstream of the cylindrical bridge pier. J. Water Soil Conserv. 2022, 29, 95–114. [Google Scholar] [CrossRef]
  45. Dadamahalleh, P.A.; Hamidi, M.; Khalili, A.M. Bed sill effect on bridge pier scour with debris obstruction: An experimental investigation. Innov. Infrastruct. Solut. 2024, 9, 142. [Google Scholar] [CrossRef]
  46. Hamidi, M.; Koohsari, A.; Khalili, A.M. Numerical investigation of mining pit effects on maximum scour depth around bridge pier with different shape. Model. Earth Syst. Environ. 2024, 10, 5189–5203. [Google Scholar] [CrossRef]
  47. Khalili, A.M.; Hamidi, M.; Dadamahalleh, P.A. Experimental study of the effect of rectangular debris blockage on the scour hole development around a cylindrical bridge pier. Water Pract. Technol. 2024, 19, 1878–1892. [Google Scholar] [CrossRef]
  48. Mahdian Khalili, A.; Akbari Dadamahalleh, P.; Hamidi, M. Experimental evaluation of dune formation downstream of pier scour hole with upstream debris accumulation. J. Hydraul. Struct. 2024, 10, 13–28. [Google Scholar] [CrossRef]
  49. Sohrabzadeh Anzani, H.; Kantoush, S.A.; Mahdian Khalili, A.; Hamidi, M. Experimental investigation of slit weir discharge. ISH J. Hydraul. Eng. 2024, 30, 645–654. [Google Scholar] [CrossRef]
  50. Kirkgöz, M.S.; Ardiçlioğlu, M. Velocity profiles of developing and developed open channel flow. J. Hydraul. Eng. 1997, 123, 1099–1105. [Google Scholar] [CrossRef]
  51. Wang, Z.; Gui, L.; Zhang, J.; Li, Y. Research on the Influence of Siltation Height of Check Dams the on Discharge Coefficient of Broad-Crested Weirs. Water 2023, 15, 510. [Google Scholar] [CrossRef]
  52. Sohrabzadeh Anzani, H.; Kantoush, S.A.; Mahdian Khalili, A.; Hamidi, M. Energy Dissipation Assessment in Flow Downstream of Rectangular Sharp-Crested Weirs. Water 2024, 16, 3371. [Google Scholar] [CrossRef]
  53. Swamee, P.K. Generalized rectangular weir equations. J. Hydraul. Eng. 1988, 114, 945–949. [Google Scholar] [CrossRef]
  54. Tian, Y.; Xu, Y.; Yang, M.; Jiang, F.; Zhang, Y.; Huang, Y.; Lin, J. Effect of Flume Width on the Hydraulic Properties of Overland Flow from Laboratory Observation. Water 2023, 15, 3416. [Google Scholar] [CrossRef]
  55. Daneshfaraz, R.; Norouzi, R.; Ebadzadeh, P.; Di Francesco, S.; Abraham, J.P. Experimental study of geometric shape and size of sill effects on the hydraulic performance of sluice gates. Water 2023, 15, 314. [Google Scholar] [CrossRef]
  56. Heller, V. Scale effects in physical hydraulic engineering models. J. Hydraul. Res. 2011, 49, 293–306. [Google Scholar] [CrossRef]
  57. Mirhoseini, S.A.; Kabiri-Samani, A.; Keihanpour, M.; Izadinia, E. Parametric study of flow at circular piano-key inlets over the vertical shaft spillways. J. Hydraul. Res. 2024, 62, 125–143. [Google Scholar] [CrossRef]
  58. Erpicum, S.; Silvestri, A.; Dewals, B.; Archambeau, P.; Pirotton, M.; Colombié, M.; Faramond, L. Escouloubre Piano Key weir: Prototype versus scale models. In Labyrinth and Piano Key Weirs II; CRC Press: London, UK, 2013; pp. 65–72. [Google Scholar]
  59. Raju, R. Scale Effects in Analysis of Discharge Characteristics of Weir and Sluice Gates; Kobus: Esslingen am Neckar, Germany, 1984. [Google Scholar]
  60. Madadi, M.R.; Dalir, A.H.; Farsadizadeh, D. Investigation of flow characteristics above trapezoidal broad-crested weirs. Flow Meas. Instrum. 2014, 38, 139–148. [Google Scholar] [CrossRef]
  61. Lauria, A.; Calomino, F.; Alfonsi, G.; D’Ippolito, A. Discharge coefficients for sluice gates set in weirs at different upstream wall inclinations. Water 2020, 12, 245. [Google Scholar] [CrossRef]
  62. Rao, N.S.L. Theory of weirs. Adv. Hydrosci. 1975, 10, 309–406. [Google Scholar]
  63. Chanson, H. Half-Round Circular Crested Weir: On Hysteresis, Instabilities, and Head–Discharge Relationship. J. Irrig. Drain. Eng. 2020, 146, 04020008. [Google Scholar] [CrossRef]
  64. Sohrabzadeh Anzani, H.; Ghodsian, M. Experimental study of flow over piano key weirs with different plan shapes. ISH J. Hydraul. Eng. 2024, 30, 185–195. [Google Scholar] [CrossRef]
  65. Chen, Y.; Fu, Z.; Chen, Q.; Cui, Z. Discharge Coefficient of Rectangular Short-Crested Weir with Varying Slope Coefficients. Water 2018, 10, 204. [Google Scholar] [CrossRef]
  66. Ali, S.; Uijttewaal, W.S. Flow resistance of vegetated weirlike obstacles during high water stages. J. Hydraul. Eng. 2013, 139, 325–330. [Google Scholar] [CrossRef]
  67. Nouri, M.; Hemmati, M. Discharge coefficient in the combined weir-gate structure. Flow Meas. Instrum. 2020, 75, 101780. [Google Scholar] [CrossRef]
  68. Eslinger, R.K.; Crookston, B.M. Energy Dissipation of Type a Piano Key Weirs. Water 2020, 12, 1253. [Google Scholar] [CrossRef]
  69. Haghiabi, A.H.; Nou, M.R.G.; Parsaie, A. The energy dissipation of flow over the labyrinth weirs. Alex. Eng. J. 2022, 61, 3729–3733. [Google Scholar] [CrossRef]
  70. Singh, U.K.; Roy, P. Energy dissipation in hydraulic jumps using triple screen layers. Appl. Water Sci. 2023, 13, 17. [Google Scholar] [CrossRef]
  71. Kiraga, M.; Chyliński, F.; Fornal-Pieniak, B.; Ollik, M.; Staar, A. The Water Flow Regime in the Weir Area for Vascular and Rush Plant Species Composition. Water 2023, 15, 3189. [Google Scholar] [CrossRef]
  72. White, F.M. Fluid Mechanics, 7th ed.; McGraw-Hill, Inc.: New York, NY, USA, 2011; pp. 737–738. [Google Scholar]
  73. Sohrabzadeh Anzani, H.; Ghodsian, M. Energy dissipation of triangular piano key weir. J. Hydraul. 2023, 18, 35–44. [Google Scholar] [CrossRef]
  74. Eltoukhy, M.A.R.; Alsaydalani, M.O. Prediction of the discharge coefficient for the rectangular notch with different hydraulic and geometric properties. Water Pract. Technol. 2023, 18, 320–331. [Google Scholar] [CrossRef]
  75. Bashiri, H.; Dewals, B.; Pirotton, M.; Archambeau, P.; Erpicum, S. Towards a New Design Equation for Piano Key Weirs Discharge Capacity. In Hydraulic Structures and Water System Management, Proceedings of the 6th IAHR International Symposium on Hydraulic Structures, Portland 2016, Portland, OR, USA, 27–30 June 2016; IAHR: Portland, OR, USA, 2016; pp. 40–49. [Google Scholar] [CrossRef]
  76. Ghodsian, M.; Sohrabzadeh Anzani, H. Experimental study on flow over rectangular Piano key weirs with slopped side crests. Modares Civ. Eng. J. 2023, 23, 167–175. [Google Scholar] [CrossRef]
  77. Hussain, S. Discharge Characteristics of Piano Key Side Weirs. In Proceedings of the 10th International Symposium on Hydraulic Structures (ISHS) 2024, Zurich, Switzerland, 17–19 June 2024. [Google Scholar] [CrossRef]
  78. Sangsefidi, Y.; Tavakol-Davani, H.; Ghodsian, M.; Mehraein, M.; Zarei, R. Hydrodynamics and free-flow characteristics of piano key weirs with different plan shapes. Water 2021, 13, 2108. [Google Scholar] [CrossRef]
  79. Kabiri-Samani, A.; Javaheri, A. Discharge coefficients for free and submerged flow over Piano Key weirs. J. Hydraul. Res. 2012, 50, 114–120. [Google Scholar] [CrossRef]
  80. Chen, W.; Sharifrazi, D.; Liang, G.; Band, S.S.; Chau, K.W.; Mosavi, A. Accurate discharge coefficient prediction of streamlined weirs by coupling linear regression and deep convolutional gated recurrent unit. Eng. Appl. Comput. Fluid Mech. 2022, 16, 965–976. [Google Scholar] [CrossRef]
  81. Sohrabzadeh Anzani, H.; Ghodsian, M. Energy dissipation of rectangular and trapezoidal piano key weir. Irrig. Drain. Struct. Eng. Res. 2023, 24, 17–32. [Google Scholar] [CrossRef]
  82. Le, A.T.; Hiramatsu, K. Hydraulic investigation of piano key weir. Rev. Agric. Sci. 2020, 8, 310–322. [Google Scholar] [CrossRef]
  83. Alizadeh Sanami, F.; Ghaderi, A.; Alizadeh Sanami, F.; Mirkhorli, P.; Di Francesco, S. Laboratory Study of the Hydraulic Performance of the A-Type Triangular Piano Key Weir. Water 2023, 15, 2124. [Google Scholar] [CrossRef]
  84. Moffat, R.J. Describing the uncertainties in experimental results. Exp. Therm. Fluid Sci. 1988, 1, 3–17. [Google Scholar] [CrossRef]
Figure 1. Full-width plate weir (a) Side view; (b) 3D sketch.
Hydrology 12 00176 g001
Figure 2. Laboratory model configuration: (a) side view; (b) plan.
Hydrology 12 00176 g002
Figure 3. Nappe flow over FWPW: (a) experimental model; (b) side view schematic.
Hydrology 12 00176 g003
Figure 4. Head over weir versus discharge variations.
Hydrology 12 00176 g004
Figure 5. Results of discharge coefficients versus h/P.
Hydrology 12 00176 g005
Figure 6. Variations of relative residual energy (E1/E0) versus q.
Hydrology 12 00176 g006
Figure 7. Variations of E1/E0 versus h/P.
Hydrology 12 00176 g007
Figure 8. Variations of (E0E1)/E0 versus q.
Hydrology 12 00176 g008
Figure 9. Variations of relative energy dissipation ((E0E1)/E0) versus h/P.
Hydrology 12 00176 g009
Figure 10. Comparison of calculated discharge (Qc) from Equation (7) and modified equation.
Hydrology 12 00176 g010
Figure 11. Comparison of frequency distributions of errors in calculating discharge for Equation (7) and modified equation.
Hydrology 12 00176 g011
Figure 12. The trend of Cd variations via h/P for the present study and Arvanaghi and Oskuei [36] with different P.
Hydrology 12 00176 g012
Table 1. Experimental setup including test number, discharge (Q), weir width (L), weir height (P).
TestQ (m3/s)L = B (m)P (m)TestQ (m3/s)L = B (m)P (m)
A10.00140.60.07C50.00420.60.11
A20.00210.60.07C60.00490.60.11
A30.00280.60.07C70.00560.60.11
A40.00350.60.07C80.00630.60.11
A50.00420.60.07D10.00140.60.13
A60.00490.60.07D20.00210.60.13
A70.00560.60.07D30.00280.60.13
A80.00630.60.07D40.00350.60.13
B10.00140.60.09D50.00420.60.13
B20.00210.60.09D60.00490.60.13
B30.00280.60.09D70.00560.60.13
B40.00350.60.09D80.00630.60.13
B50.00420.60.09F10.00140.60.15
B60.00490.60.09F20.00210.60.15
B70.00560.60.09F30.00280.60.15
B80.00630.60.09F40.00350.60.15
C10.00140.60.11F50.00420.60.15
C20.00210.60.11F60.00490.60.15
C30.00280.60.11F70.00560.60.15
C40.00350.60.11F80.00630.60.15
Table 2. Variation percentages of h for each test compared with P = 0.07 m and the same discharge.
Q (m3/s)P = 0.09 mP = 0.11 mP = 0.13 mP = 0.15 m
0.0014−3.51%−4.38%−9.65%−11.40%
0.0021−2.53%−4.43%−7.60%−8.23%
0.0028−3.03%−4.04%−6.06%−7.58%
0.0035−2.95%−4.22%−6.75%−7.60%
0.0042−1.85%−4/074%−4.82%−6.67%
0.0049−1.35%−2.69%−3.70%−4.71%
0.0056−1.23%−2.15%−3.08%−4.00%
0.0063−1.14%−1.71%−2.85%−3.42%
Table 3. The values of Cd for different weir heights.
TestP (m)CdTestP (m)Cd
A10.070.6492C50.110.5687
A20.070.5968C60.110.5629
A30.070.5672C70.110.5574
A40.070.5414C80.110.5549
A50.070.5343D10.130.7559
A60.070.5403D20.130.6719
A70.070.5395D30.130.6230
A80.070.5407D40.130.6013
B10.090.6849D50.130.5754
B20.090.6202D60.130.5718
B30.090.5940D70.130.5653
B40.090.5663D80.130.5647
B50.090.5495F10.150.7785
B60.090.5514F20.150.6788
B70.090.5496F30.150.6384
B80.090.5501F40.150.6095
C10.110.6944F50.150.5926
C20.110.6388F60.150.5809
C30.110.6034F70.150.5735
C40.110.5776F80.150.5697
Table 4. Minimum, average, and maximum values of relative residual energy.
P (m)MinimumAverageMaximum
0.070.78430.79730.8095
0.090.64030.65580.6813
0.110.53420.55590.5845
0.130.45720.47920.5064
0.150.39770.42170.4484
Table 5. Minimum, average, and maximum values of relative energy dissipation.
P (m)MinimumAverageMaximum
0.070.19050.20270.2157
0.090.31870.34420.3597
0.110.41550.44410.4658
0.130.49360.52080.5428
0.150.55160.57830.6023
Table 6. Minimum, average, and maximum values of Cd and corresponding h/P for the present study and Arvanaghi and Oskuei [36].
DataP (m)MinimumAverageMaximum
Cdh/PCdCdh/P
Present Study0.070.53430.46430.56370.64920.1629
Present Study0.090.54950.29440.58330.68490.1222
Present Study0.110.55490.31360.59470.69440.0991
Present Study0.130.56470.26230.61610.75590.0792
Present Study0.150.56970.22600.62770.77850.0673
Arvanaghi and Oskuei [36]0.100.691.500.76871.010.10
Arvanaghi and Oskuei [36]0.150.691.200.80471.060.10
Arvanaghi and Oskuei [36]0.200.681.000.77641.060.10
Table 7. Parameters range in the present study and Arvanaghi and Oskuei [36].
Datab (m)P (m)h (m)
Present Study0.600.07–0.150.01–0.035
Arvanaghi and Oskuei [36]0.250.10–0.200.01–0.22
Table 8. Values of parameters in Equation (9) for calculating relative energy dissipation.
ParameterP = 0.07 mP = 0.09 mP = 0.11 mP = 0.13 mP = 0.15 m
a1−0.59−0.8743−1.0691−1.2010−1.2179
a20.35490.29210.19970.14070.0332
a30.15840.33480.45570.53820.6050
R20.800.970.980.990.99
Disclaimer/Publisher’s Note: The statements, opinions and data contained in all publications are solely those of the individual author(s) and contributor(s) and not of MDPI and/or the editor(s). MDPI and/or the editor(s) disclaim responsibility for any injury to people or property resulting from any ideas, methods, instructions or products referred to in the content.

