Article

Weathering Records from an Early Cretaceous Syn-Rift Lake

1
State Key Laboratory of Shale Oil and Gas Enrichment Mechanisms and Effective Development, Beijing 100083, China
2
Oil and Gas Survey, China Geological Survey, Beijing 100083, China
3
Department of Earth, Ocean and Ecological Sciences, University of Liverpool, Liverpool L69 3GP, UK
*
Authors to whom correspondence should be addressed.
Hydrology 2025, 12(7), 179; https://doi.org/10.3390/hydrology12070179
Submission received: 18 May 2025 / Revised: 21 June 2025 / Accepted: 28 June 2025 / Published: 3 July 2025
(This article belongs to the Special Issue Lakes as Sensitive Indicators of Hydrology, Environment, and Climate)

Abstract

The Aptian–Albian interval represents a significant cooling phase within the Cretaceous “hothouse” climate, marked by dynamic climatic fluctuations. High-resolution continental records are essential for reconstructing terrestrial climate and ecosystem evolution during this period. This study examines a lacustrine-dominated succession of the Shahezi Formation (Lishu Rift Depression, Songliao Basin, NE Asia) to access paleo-weathering intensity and paleoclimate variability between the Middle Aptian and Early Albian (c. 118.2–112.3 Ma). Multiple geochemical proxies, including the Chemical Index of Alteration (CIA), were applied within a sequence stratigraphic framework covering four stages of lake evolution. Our results indicate that a hot and humid subtropical climate predominated in the Lishu paleo-lake, punctuated by transient cooling and drying events. Periods of lake expansion corresponded to episodes of intense chemical weathering, while two distinct intervals of aridity and cooling coincided with phases of a reduced lake level and fan delta progradation. To address the impact of potassium enrichment on CIA values, we introduced a rectangular coordinate system on A(Al2O3)-CN(CaO* + Na2O)-K(K2O) ternary diagrams, enabling more accurate weathering trends and CIA corrections (CIAcorr). Uncertainties in CIA correction were evaluated by integrating geochemical and petrographic evidence from deposits affected by hydrothermal fluids and external potassium addition. Importantly, our results show that metasomatic potassium addition cannot be reliably inferred solely from deviations in A-CN-K diagrams or the presence of authigenic illite and altered plagioclase. Calculations of “excess K2O” and CIAcorr values should only be made when supported by robust geochemical and petrographic evidence for external potassium enrichment. This work advances lacustrine paleoclimate reconstruction methodology and highlights the need for careful interpretation of weathering proxies in complex sedimentary systems.

1. Introduction

The Cretaceous period from the Aptian to the Santonian (ca. 125–80 Ma), known as the “hothouse Earth” period, represents the most extreme greenhouse period over the last 150 Ma, characterized by elevated land surface temperatures and a significantly lower latitudinal temperature gradient compared to the present day [1,2,3,4]. Nevertheless, many studies have suggested the occurrence of transient cooling events during the Early Cretaceous [5,6,7,8,9]. Short-term fluctuations in atmospheric CO2 concentrations imply that paleoclimate evolution has exhibited periodic variability [10,11]. Large igneous province (LIP) eruptions may have reinforced greenhouse conditions through the release of volcanic CO2 [8], thereby initiating and regulating global warming events [12]. Additional geological evidence, such as the intensification of global weathering [13], the Oceanic Anoxic Events (OAEs) [14,15], the occurrence of Cretaceous Oceanic Red Beds (CORBs) [16,17], and the presence of giant glendonites [9], also reflects pronounced paleoclimatic changes during this time. These contrasting records suggest that the Early Cretaceous climate was highly dynamic and subject to a variety of environmental drivers [11,18].
Prior investigations into the Cretaceous paleoclimate have predominantly focused on marine deposits [19,20], given their globally correlatable sea level changes, minimal terrestrial sediment influence, and compositional homogeneity. In contrast, continental sequences are generally less continuous due to extensive erosion and depositional hiatuses, complicating precise stratigraphic correlations and restricting their application in paleoclimate reconstruction. Consequently, the reconstruction of terrestrial paleoclimate change from continental records remains limited. Nevertheless, continuous continental successions can provide higher-resolution reconstructions of terrestrial climate change and ecosystem evolution [21,22]. Compared to oceans, lakes have relatively smaller volumes of sediment and water, leading to their higher sensitivity to subtle environmental shifts, such as changes in land surface temperature, humidity, and hydrological cycles [23,24]. The geological history preserved in lacustrine sediments is, therefore, crucial for building comprehensive global paleoclimate models and understanding the mechanisms driving environmental change [25,26,27]. Moreover, continental weathering regimes control the flux of nutrients and terrestrial organic matter delivered to marine systems via runoff [28]. Thus, systematic studies of continental environments, particularly the intensity of chemical weathering driven by paleoclimate variability, are also essential for interpretations of marine bioproductivity and organic carbon cycling [29,30].
As one of the world’s largest, long-lived inland lake basins, the Songliao Basin provides an exceptionally complete sedimentary archive of Cretaceous terrestrial paleoclimate evolution [22,31]. A sequence stratigraphic framework and depositional pattern of syn-rift lake basins have been established based on the investigation of the Lower Cretaceous Shahezi Formation in the southeastern Songliao Basin [32]. The origins of terrigenous organic matter in the lacustrine deposits have been interpreted through direct correlation between depositional facies, chemical weathering conditions, and organic geochemical characteristics [33]. These studies demonstrate that the lacustrine deposition recorded in the Shahezi Formation can serve as a natural laboratory for reconstructing the Early Cretaceous paleoclimate conditions. In the present study, additional mudstone cores from the Shahezi Formation were analyzed to address the following specific questions:
  • What were the tectonic setting and sedimentary provenance of the Lishu paleo-lake during the deposition of the Shahezi Formation in the Songliao Basin, NE Asia?
  • How can chemical weathering conditions be reconstructed while accounting for external controls and potential uncertainties?
  • What were the prevailing paleoclimate conditions in the Lishu paleo-lake watershed during the Early Cretaceous?
To address these questions, major and trace element concentrations were analyzed to reconstruct paleo-weathering intensity and interpret paleoclimatic conditions. Multiple external factors that may influence interpretations of chemical weathering intensity, such as protolith (parent rock) composition, sediment recycling, and post-depositional alteration, were assessed using mineralogical and petrographic results. To illustrate the petrographic expressions of potassium metasomatism and its impact on bulk-rock geochemistry, Shahezi Formation mudstones were compared with Lower Silurian Longmaxi (or Lungmachi) Formation mudstones (Sichuan Basin, southwestern China), which have been demonstrated to be affected by low-temperature hydrothermal fluids and associated metasomatism in prior studies [34,35]. Finally, a chemical weathering profile of the Shahezi Formation was constructed within a sequence stratigraphic framework. Potential uncertainties associated with diagenetic alteration and calculation methodologies were also discussed in this study. These findings may contribute to a better practice of paleo-weathering reconstruction in future research and have important implications for understanding the Early Cretaceous paleoclimate in continental environments.

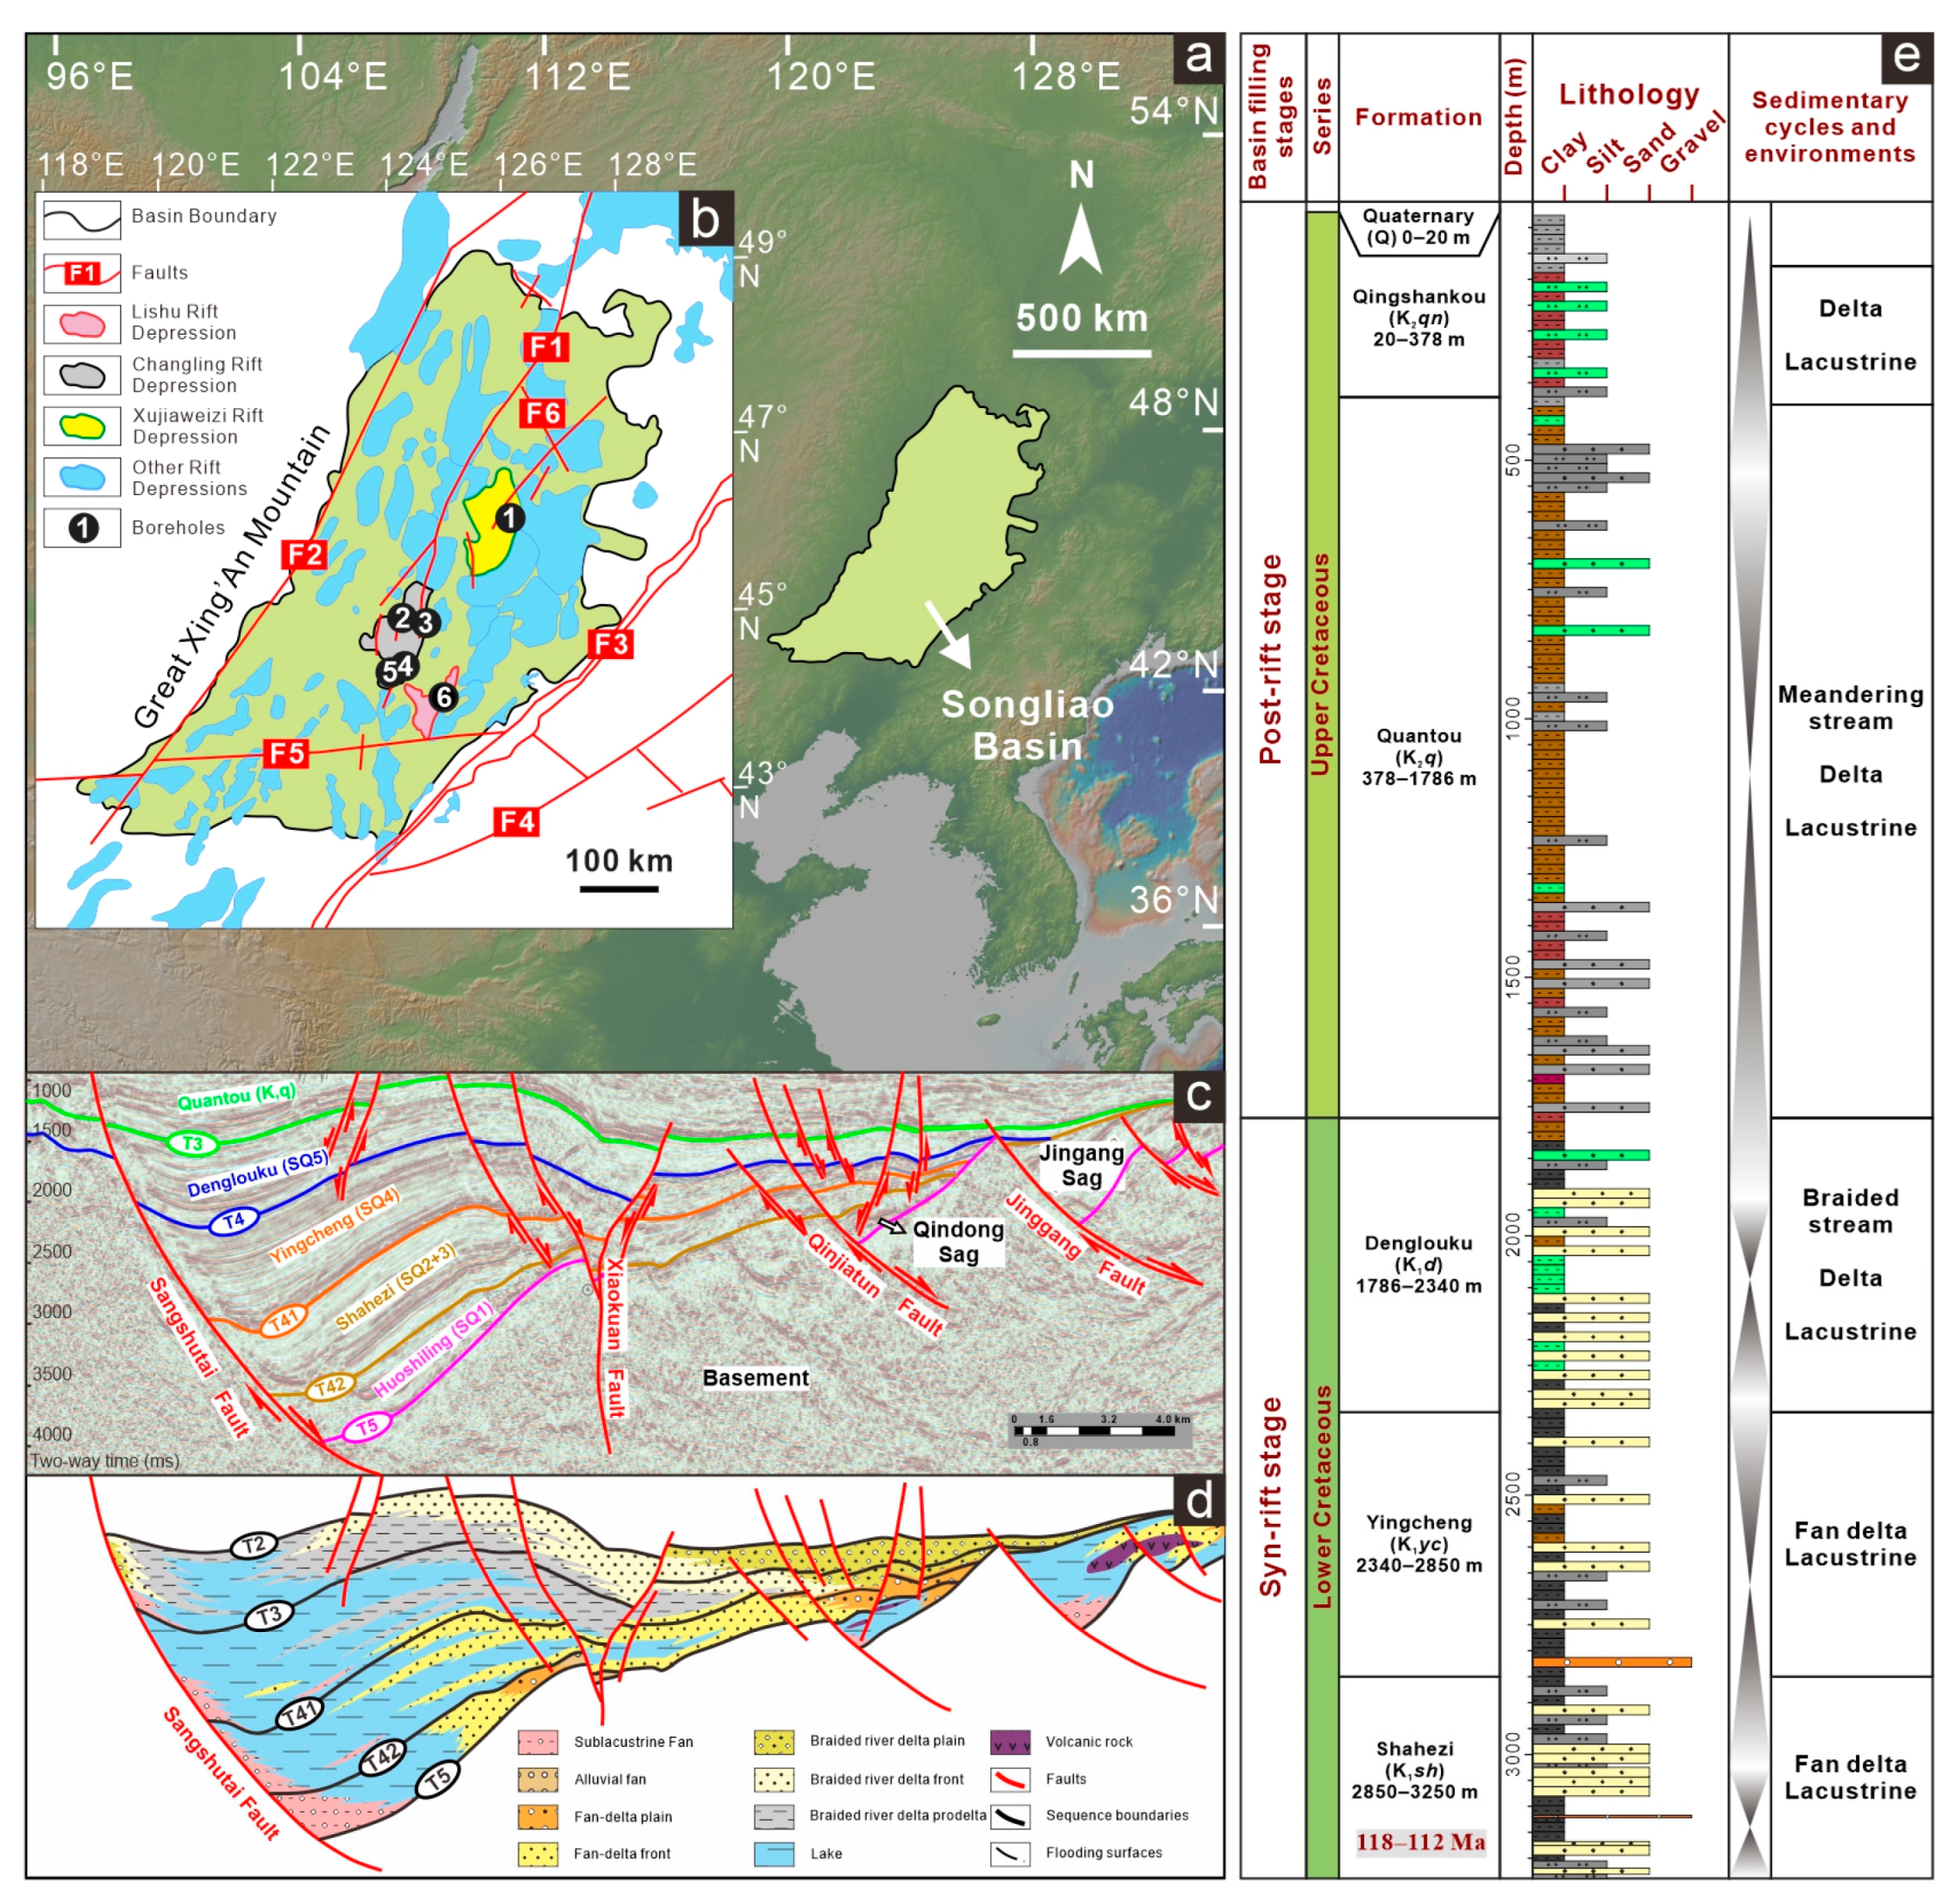
2. Geological Settings

The Songliao Basin is a Mesozoic rift basin located in northeastern Asia (Figure 1a). Its stratigraphy is predominantly composed of Jurassic–Cretaceous strata, overlain by minor Cenozoic deposits [31]. During the Cretaceous, the Songliao Basin was positioned at mid- to high-paleolatitudes within the boreotropical climate zone (approximately 40° N to 50° N) [36]. The Lishu Rift Depression is an asymmetric half-graben, located in the southeastern part of the Songliao Basin (Figure 1b) [37]. Its stratigraphic architecture and basin configuration have been significantly influenced by several faults (Figure 1c,d). The Sangshutai Fault, which extends from the Mesozoic basement to the pre-Quaternary deposits, acts as the basin-bounding master fault along the western margin of the Lishu Rift Depression. The tectono-stratigraphic profile of the Lishu Rift Depression is subdivided into two phases: syn-rift and post-rift. The syn-rift succession, comprising the Upper Jurassic–Lower Cretaceous Huoshiling, Shahezi, Yingcheng, and Denglouku Formations, can be further divided into three stages: rift initiation, rift climax, and rift deceleration [32,37,38,39]. The Shahezi Formation, which is the focus of this study, represents the phase of the most intense rifting, with a subsidence rate up to 385 m/Ma [37,39].
The Shahezi Formation represents fan-deltaic and lacustrine deposits, consisting of interbedded conglomerates, coarse- to fine-grained sandstones, siltstones, and mudstones. Its chronology is constrained by the presence of volcanic tuff layers, including sedimentary tuff (113.9 ± 0.9 Ma, 117.9 ± 1.6 Ma) and rhyolitic crystal tuff (118.2 ± 1.5 Ma) [40,41], obtained from the SK-2e borehole drilled by the International Continental Scientific Drilling Program (ICDP) (Figure 1b). Based on zircon U-Pb ages from these tuff layers, a floating astronomical timescale has been established for the SK-2e borehole, indicating that the Shahezi Formation was developed during the Middle Aptian to Early Albian (118.2–112.3 Ma) period, spanning approximately 5.92 Ma [42].
This study focuses on a 90-m-thick, lacustrine-dominated interval of the Shahezi Formation, recovered by the JLYY1 borehole in the Lishu Rift Depression (Figure 2) [43]. A sedimentological log, presented by Wang et al. (2025), provides a detail description of the high-resolution changes in lithology, organic richness, mineralogical composition, and depositional systems tracts within this interval [32,33,44]. Their research identified several facies associations that reflect lake base-level fluctuations: subaqueous channel fills (FA2-1), pro-fan delta (FA3), nearshore and offshore lacustrine (FA5 and FA6), and sublacustrine fan (FA7) (Figure 2). The pro-fan delta deposits, characterized by co-sets of flaser, wavy, and lenticular beddings, represent the distal and subaqueous portions of fan-delta systems [32]. Nearshore and offshore lacustrine are further subdivided into four sub-facies associations: lake beach and shoreface (FA5-1), littoral (FA5-2), sublittoral (FA6-1), and profundal (FA6-2), corresponding to four distinct lake zones that redefined by the annual minimum water level, fair-weather wave base, and storm wave base [23,45,46,47,48,49]. The lake beach and shoreface comprises mud-to-silt-sized deposits characterized by ripple cross-lamination, hummocky cross-stratification, and upward-thinning bedsets, which are indicative of shallow, energetic environments that were influenced by oscillatory wave action, longshore currents, and storm currents [32,33]. The littoral facies is composed of thick successions of massive argillaceous mudstones with minor intercalation of silty laminae, reflecting substantial terrestrial siliciclastic inputs in long-lasting shallow lake environments, occasionally punctuated by low-density gravity flows [32,33]. Compared to the littoral deposits, sublittoral mudstones were deposited in deeper, relatively poorly oxygenated water settings, as indicated by higher organic matter and pyrite framboid contents, as well as abundant woody clasts and biogenic fragments [32,33]. Profundal facies, representing periods of the highest lake levels and pronounced shoreline transgression, are distinguished by high TOC (total organic carbon) contents, fine laminations, abundant pyrite aggregates, and a paucity of woody detritus and fossils [32,33]. Sublacustrine fan deposits, predominantly consisting of massive mud-rich conglomerates and sand- to pebble-bearing mudstones, are interpreted to be the results of cohesive mud-rich debris flow within deep lake settings, likely triggered by fault activity [32,33].
Figure 1. (a) The geographical position of the Songliao Basin in northeastern Asia; (b) the tectonic units, fault development, and distribution of rift depressions within the Songliao Basin [31]. The faults are the basin central faults (F1 and F6), Nenjiang–Balihan Fault (F2), Jiamusi–Yitong Fault (F3), Dunhua–Mishan Fault (F4), and Xilamulun River–Yanji Suture Zone (F5). The locations of six boreholes analyzed in this study are highlighted, which were drilled in the Xujiaweizi (borehole 1: SK-2e), Changling (borehole 2: YS3, borehole 3: SL2, borehole 4: S103, and borehole 5: B2), and Lishu (borehole 6: JLYY1) rift depressions; (c,d) interpreted seismic reflection profiles of the Lishu Rift Depression, illustrating basin geometry, major faults, sequence stratigraphic framework, and depositional facies distribution during the sedimentation period spanning the Huoshiling to Denglouku formations [39]. The T2 to T5 surfaces represent seismic reflectors serving as the boundaries between different formations. (e) A lithostratigraphic and sedimentological section from the JLYY1 borehole in the Lishu Rift Depression, showing the rifting stages, formations, lithologies, sedimentary cycles, and depositional environments. The dating of the Shahezi Formation is referenced from Ma et al. (2023) [42]. The stratigraphic column lacks the Jurassic Huoshiling Formation and the Paleozoic basement, as these strata were not drilled by the JLYY1 borehole.
Hydrology 12 00179 g001
Based on the interpretation of depositional environments, sequence boundaries and flooding surfaces were identified to construct a sequence stratigraphic framework for the lacustrine-dominated interval. This interval overlies subaqueous channel sandstones, marked by a sharp and distinct contact interpreted as a flooding surface at 3167.6 m (Figure 2). The upper boundary, characterized by rip-up clasts and lag deposits, forms a sharp erosive surface (sequence boundary 2, 3077.85 m, Figure 2), where subaqueous channel sandstones abruptly overlie littoral lacustrine mudstones. Sequence boundary 1 (3122.05 m, Figure 2) is represented by an upward transition from littoral mudstones to mud-rich conglomerates within a sublacustrine fan setting. Flooding surfaces within this interval are defined by lithological transitions from underlying pro-fan delta, lake shore, and littoral siltstones and mudstones to overlying sublittoral and profundal mudstones. The maximum flooding surface (MFS, 3140.9 m, Figure 2), indicating the peak of shoreline transgression, is marked by horizontally stratified, finely laminated, and argillaceous siliceous mudstones of the profundal lacustrine facies. Based on these surfaces, this interval has been subdivided into four genetically related parasequence sets, representing four stages of lacustrine evolution (TST-1, HST-1, HST-2, and HST-3) (Figure 2) [32,33].
The Shahezi Formation mudstones analyzed in this study were compared with the Longmaxi Formation mudstones to illustrate the petrographic signatures and geochemical alterations associated with potassium metasomatism. The Lower Silurian Longmaxi Formation (444.43–438.13 Ma) was deposited in a semi-silled epicontinental sea or shelf environment, known as the Yangtze Shelf Sea [50]. This shelf sea formed as a result of the accretion of the Cathaysian Block to the Yangtze Block along the northwestern margin of Gondwana, during the transition from the Late Ordovician to the Early Silurian period [51,52]. During this period, thick marine successions, primarily composed of fine-grained, siliciclastic-dominant rocks (black shales), were widely distributed across the Sichuan Basin, including the Wufeng Formation, Kuanyinchiao Bed (or Guanyinqiao Bed, distinguished by its Hirnantian fauna shell layers), and the Longmaxi Formation [51,53,54,55].

3. Data and Methods

3.1. Sample Preparation

The Shahezi Formation mudstone samples were collected from the JLYY1 and SK-2e boreholes and subsequently processed for experiments. Small core chips were crushed into silt-sized powder using a tungsten disk mill (Retsch RS 200, Retsch Ltd., Haan, Germany) at 1000 rpm for 5 s. The resulting powders were further ground using a Retsch Planetary Ball Mill PM 100 in an 80 mL agate pot, with 20 mL of powder and 5 agate balls for 20 min at 400 rpm, yielding a grain size of less than 10 µm. The homogenized powders were then split into three aliquots for the determination of TOC contents, as well as major and trace element concentrations. Large pieces of the samples were cut perpendicular to the sedimentary bedding and further polished for optical and electron microscopy. One mudstone sample from the Longmaxi Formation was collected from the He201 borehole that was located in the southwestern Sichuan Basin for electron microscopy.

3.2. TOC Measurement, Optical and Electron Microscopy

Bulk-rock TOC contents were measured for 62 samples using a LECO CS230 C/S Determinator (LECO Co., Ltd., St. Joseph, MI, USA) at the Petroleum Geology Laboratory, China University of Petroleum (Beijing, China). Sixty-eight standard petrographic thin sections, prepared from fifty samples, were photographed and analyzed using an Olympus BX51 transmitted light microscope equipped with cellSens Imaging Software (Version 1.12, Olympus Corporation, Tokyo, Japan) at the University of Liverpool. SEM-EDS (scanning electron microscope and energy-dispersive X-ray spectroscopy) analyses were conducted on 23 samples to examine microscale rock fabrics and mineral types using a Zeiss GeminiSEM 450 equipped with an X-Max 50 mm2 EDS (Carl Zeiss Ltd., Jena, Germany) at the SEM Shared Research Facility, University of Liverpool. Backscattered electron (BSE) images were acquired using a 20 kV and 1 nA beam with a work distance of 10 mm. Detailed information on the samples’ preparation and analytical procedures can be found in Wang et al. (2025) [32].

3.3. X-Ray Fluorescence Spectrometry (XRF)

Major element concentrations were determined for 93 mudstone samples collected from the JLYY1 and SK-2e boreholes using X-ray fluorescence spectrometry at the Environmental Laboratory, Central Teaching Labs, University of Liverpool. Pressed pellets were prepared by mixing 6.0 g of sample powder with 1.5 g of cellulose-based binder (CEREOX BM-0002-1, FLUXANA Ltd., Bedburg-Hau, Germany) using an FLUXANA XRF Mixer at 3000 rpm for 60 s. The mixture was then pressed into pellets with a diameter of 40 mm and a height of 3.4 mm using an Atlas Manual Hydraulic Press 15T (Specac Ltd., Orpington, UK), applying approximately 10 tons of pressure for 2 min of dwell time, followed by a 1 min release. The pellets were subsequently loaded into holders and scanned for 20 min using a Rigaku Supermini 200 WD XRF instrument (Rigaku Corporation, Tokyo, Japan). A glass pellet of NIST standards (National Institute of Standards and Technology) was analyzed along with each batch of 11 samples for data calibration. Concentrations of 11 major elements (Na, Mg, Al, Si, P, S, K, Ca, Ti, Mn, and Fe) were reported as oxides, with the total Fe contents expressed as Fe2O3. Analytical precision, evaluated by replicate analyses, was better than ±5% (2σ) of the reported values.

3.4. Inductively Coupled Plasma-Mass Spectrometry (ICP-MS)

Trace element concentrations were determined for 34 mudstone samples obtained from the JLYY1 borehole using an Agilent 7500 ICP-MS (Agilent Technologies, Inc., Santa Clara, CA, USA) at the Wuxi Research Institute of Petroleum Geology of SINOPEC (Wuxi, China). For each sample, 0.05 g of powder was dissolved in ultrapure water within a polytetrafluoroethylene crucible. To remove silicon, the solutions were treated with 1 mL of HF and heated to dryness at 150 °C. The residues were then sealed in a steel jar and subjected to digestion with a mixture of 1 mL of HF and 0.6 mL of HNO3 in an oven at 190 °C for over 96 h. The resulting solution was evaporated to remove excess HF. Next, the sample was treated with 1 mL of concentrated HNO3 and heated until the solution appeared as emulsion droplets. This step was repeated twice. After that, 1.6 mL of HNO3 was added to the solution, which was heated at 140 °C for 3–5 h. After cooling, the solution was diluted to 50 mL with ultrapure water and 1 mL of reference solution containing 500 ng/g Rb. The final solution was analyzed, with the analytical uncertainties being better than ±5% (2σ) for most elements and 5–10% for other elements at low concentrations. Data quality was monitored using Chinese national standard materials.

3.5. Geochemical Proxies

3.5.1. Chemical Index of Alteration (CIA)

The Chemical Index of Alteration (CIA) is a commonly utilized proxy for assessing paleo-weathering conditions, calculated based on the molar proportions of the relatively immobile element (Al3+) in comparison to three more labile cations (i.e., Ca2+, Na+, and K+) within the silicate fraction of deposits [56].
CIA = Al2O3/(Al2O3 + CaO* + Na2O + K2O) × 100
where all oxides are measured in molar concentrations (mol/100 g), and CaO* specifically denotes the CaO content derived from the silicate fraction, thereby excluding contributions from carbonate minerals (calcite and dolomite) and phosphates (apatite) [56,57].
CaO* = CaOCO2 (calcite) − 0.5 CO2 (dolomite) − 10/3 × P2O5 (apatite)
where the coefficients 0.5 and 10/3 indicate the molar concentrations of Ca in dolomite and apatite, respectively [58]. In the present study, CaO* was determined using the approach proposed by McLennan (1993), where CaO* is the lesser of (CaO − 10/3 × P2O5) and Na2O [59].

3.5.2. Plagioclase Index of Alteration (PIA)

The Plagioclase Index of Alteration (PIA) was introduced by Fedo et al. (1995) to account for the effects of potassium metasomatism on CIA values [58]. Compared to the CIA, the PIA formula excludes K2O from both the numerator and the denominator (Equation (3)), thereby removing the influence of the Al2O3 associated with K-feldspar. The PIA is suitable for assessing the weathering intensity of provenance areas where the feldspar component is dominated by plagioclase.
PIA = (Al2O3K2O)/(Al2O3 + CaO* + Na2OK2O) × 100

3.5.3. Index of Compositional Variability (ICV)

The Index of Compositional Variability (ICV) quantifies the concentration of Al2O3 relative to other major oxides in rocks (Equation (4)) [60]. SiO2 was excluded from the ICV formula to avoid the effects of quartz dilution. Since the ICV value is related to the composition of minerals with varying resistance to weathering, it serves as an indicator of rock compositional maturity and can provide insights into tectonic setting and sediment recycling [60,61].
ICV = (Fe2O3 + K2O + Na2O + CaO* + MgO + MnO + TiO2)/Al2O3
where all variables represent the molar concentrations of oxides (mol/100 g), and CaO* is the same as that used in the CIA calculation.

3.5.4. Ln(Al2O3/Na2O) and Total Carbonate Content

The presence of carbonate minerals in varying concentrations may complicate the application of CIA for reconstructing paleo-weathering history [62,63]. Hence, the Ln(Al2O3/Na2O) index and total carbonate content (calcite and dolomite) were employed as supplementary indicators [62,63,64]. The mineral composition data of the Shahezi Formation mudstones were obtained from Wang et al. (2025) [32].

3.5.5. Weathering Index of Parker (WIP)

The Weathering Index of Parker (WIP) was proposed to quantify the molecular proportions of mobile alkali and alkaline earth metals, i.e., Na+, Mg2+, K+, and Ca2+ (Equation (5)) [65].
WIP = (CaO*/0.7 + 2 × Na2O/0.35 + 2 × K2O/0.25 + MgO/0.9) × 100
Lower WIP values correspond to more significant chemical weathering, which contrasts with the trend observed in CIA values. Since the WIP only reflects the concentrations of labile elements, it may be influenced by the dilution effect of quartz and thus tends to overestimate the degree of weathering in SiO2-rich rocks [66].

3.5.6. Rubidium-to-Strontium (Rb/Sr) Ratio

The ratio of Rb to Sr has been widely used as an indicator of paleo-weathering intensity due to the distinct geochemical behaviors of these elements [67,68]. During the chemical weathering of feldspars, Sr is preferentially leached into solution, while Rb tends to be retained by illite, resulting in weathered rocks that are enriched in Rb and depleted in Sr [69]. Low Rb/Sr ratios in marine or lacustrine sediments suggest substantial Sr input from source areas that experienced intense chemical weathering [69,70,71]. Similarly, the strontium-to-copper (Sr/Cu) ratio has also been employed to infer paleo-weathering conditions [68,72]. However, in this study, copper in the Shahezi Formation mudstones may have been derived from volcanic ashfall into the lake system [73], as supported by the frequent occurrence of tuffaceous mudstones and tuff layers (Figure 2). Consequently, Sr/Cu is not considered a reliable proxy for reconstructing the paleo-weathering intensity in the Shahezi Formation and is, therefore, excluded from this analysis.

3.6. Major Element Concentrations of the Longmaxi Formation Mudstones

The major element geochemical data for the Longmaxi Formation mudstones were adapted from Wang (2021) [74]. In that study, 139 mudstone samples collected from HD-1 and XD-1 boreholes were analyzed using ICP-OES (Inductively Coupled Plasma-Mass Spectrometry). Concentrations of nine major elements (Fe, Al, K, Na, Mg, Ti, Ca, Si, and Mn) were reported as oxides, while the total phosphorus content was expressed as elemental P (ppm). Based on these data, CIA values for the Longmaxi Formation were calculated in the present study.

3.7. Data Treatment

The z-score, quantifying the deviation of a data point from the mean, was calculated to identify outliers in the element concentrations. A threshold z-score of ±2.5 was employed to determine the outliers. Additionally, elemental concentrations were normalized to the reference values to identify distribution patterns and potential anomalies. In this study, the elemental concentrations of Post-Archaean Australian Shale (PAAS), as reported by Taylor and McLennan (1985), were selected as the reference standard to calculate the enrichment factors for major-element oxides (Equation (6)) [75,76]. Major-element oxide X is considered enriched with respect to PAAS when EFx exceeds 1, and depleted when EFx is less than 1.
EFx = (X/Al) sample/(X/Al)PAAS
Rare earth element (REE) concentrations were divided by their values in chondrite, reported by Boynton (1984), for normalization [77]. Since Eu exhibits a significant fractionation relative to other REEs, its anomaly was calculated to infer protolith characteristics in the provenance area (Equation (7)) [78].
Eu/Eu* = EuN/(SmN × GdN)0.5
where EuN, SmN, and GdN represent the chondrite-normalized concentrations of Eu, Sm, and Gd, respectively. Values greater than 1 indicate a positive Eu anomaly, while values less than 1 indicate a negative anomaly.

4. Results

4.1. Bulk TOC Concentrations and Mineral Composition (Shahezi Formation)

The TOC concentrations vary across the four lacustrine depositional sequences of the Shahezi Formation (Figure 2). The organic-rich TST-1 interval exhibits TOC contents ranging from 0.63% to 3.86%, with an average of 2.09%. These values are slightly lower than those found in the HST-1 deposits, where the TOC values ranged from 0.3% to 4.05%, averaging 2.21%. In contrast, the HST-2 and HST-3 intervals are characterized by relatively low organic carbon contents, with average TOC concentrations of 0.78%, and individual values ranging from 0.49% to 1.91%.
The Shahezi Formation mudstones have a mixed mineralogical composition, dominated by clay minerals (averaging 51.7%) and non-clay mineral silicates (averaging 35.1%), with lower proportions of carbonates (averaging 10.4%), pyrite (averaging 1.3%), and other minerals (averaging 1.5%, including barite, siderite, gypsum, anhydrite, and augite). The clay mineral fraction consists mainly of interstratified illite/smectite, illite, and chlorite (Figure 3). Non-clay mineral silicates primarily occur as detrital and authigenic quartz, ranging in size from silt to clay, with minimal feldspar particles (Figure 3). The carbonate minerals are predominantly calcite, comprising between 0.2% and 48.5% of the total, and averaging 9.9%, while dolomite is below 8.5%. Carbonate minerals occurred as cryptocrystalline laminae, fibrous sparry bands, and shell fragments (Figure 3). Carbonate content exhibits a marked upward increase in the lower part of the lacustrine interval, rising from generally 0.5%–16.4% in TST-1 to 9.5%–48.9% in HST-1 (Figure 2). At the base of HST-1, near the maximum flooding surface, the carbonate content increases sharply from 10% to 48.9%, followed by a general decrease toward values of 0.6–2.8% at the top of HST-3. The HST-1 deposits are distinguished by considerably higher carbonate contents compared to the other three depositional intervals (Figure 2).

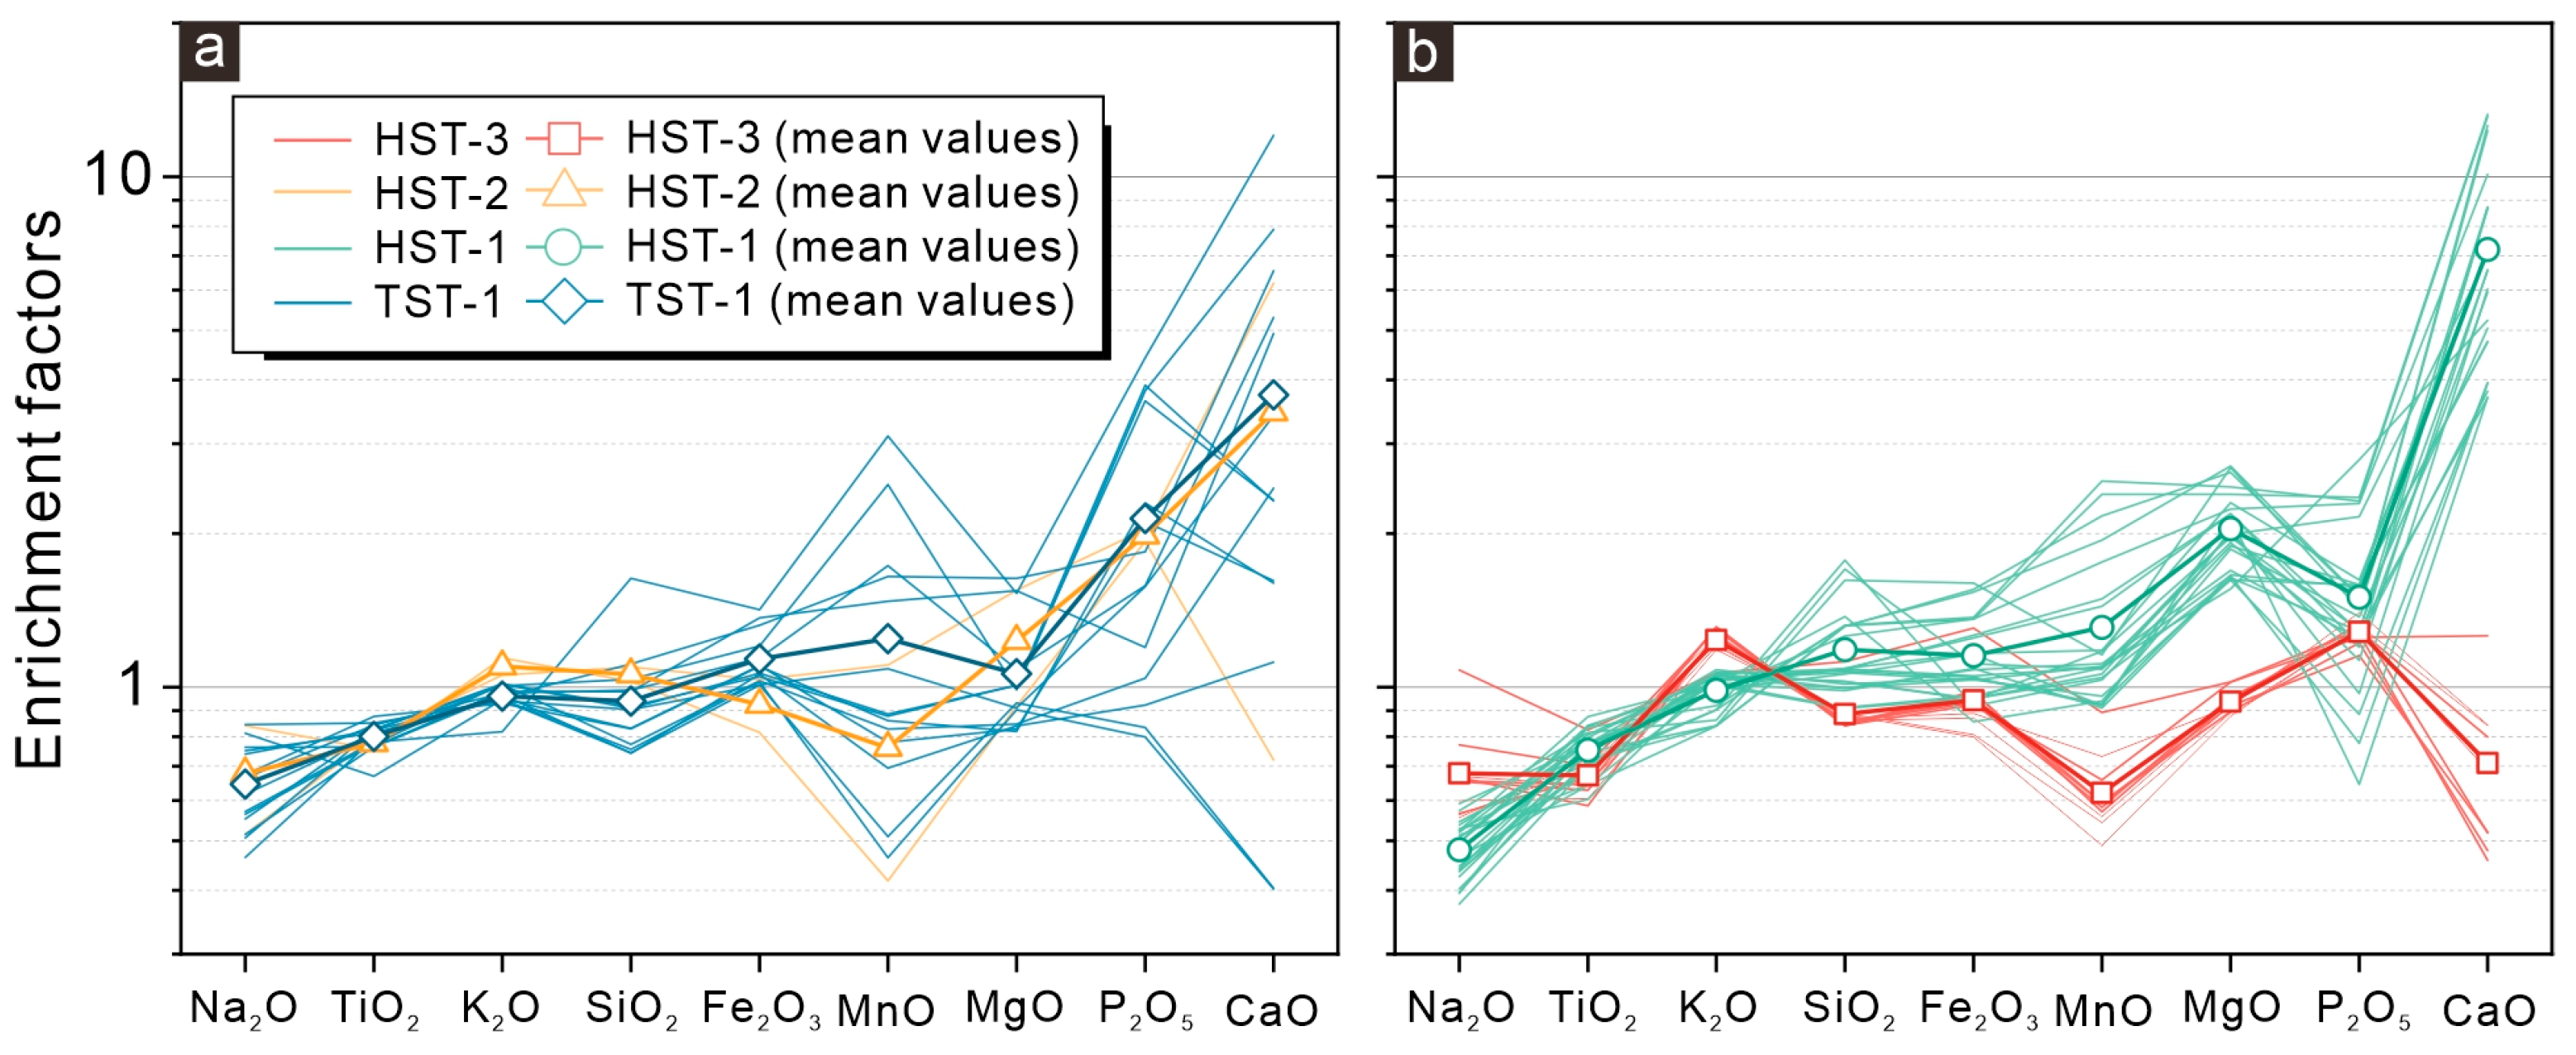
4.2. Major Element Geochemistry (Shahezi Formation)

The concentrations of all major elements are presented as enrichment factors (EFs) relative to the PAAS to minimize uncertainties associated with the measurements. As illustrated in Figure 4, the enrichment factors vary in terms of their oxide types and depositional periods. The enrichment factors of Na2O, TiO2, K2O, SiO2, and Fe2O3 exhibit minor changes across the four periods. The samples are depleted in Na2O and TiO2 (EFs < 1), whereas the enrichment factors for K2O, SiO2, and Fe2O3 fluctuate around 1 from TST-1 to HST-3. In contrast, the MnO, MgO, P2O5, and CaO show pronounced stratigraphic variation. The lower section of the lacustrine interval (TST-1 and HST-1) is characterized by a relatively higher MnO content compared to the upper section (HST-2 and HST-3). The relative abundance of P2O5 peaks in TST-1 and HST-2, followed by lower values in HST-1 and HST-3. The TST-1 to HST-2 deposits are enriched in MgO and CaO (EFs > 1), whereas HST-3 is the only interval depleted in MgO and CaO. Notably, the enrichment factors values of CaO in HST-2 vary significantly between the two samples analyzed in this study, and the results may be influenced by the limited sample size. Overall, the average enrichment factors of the nine major oxides in the Shahezi Formation mudstones can be ranked as follows: Na2O < TiO2 < K2O < SiO2 < Fe2O3 < MnO < MgO < P2O5 < CaO.

4.3. Rare Earth Element (REE) Geochemistry (Shahezi Formation)

The total content of the light rare earth elements (LREE: La to Eu) averages 185.50 ppm and varies from 136.02 ppm to 235.21 ppm. In comparison, the total contents of heavy rare earth elements (HREE: Gd to Lu) average 20.58 ppm, with a range of 14.80 to 30.79 ppm. The LREEs are enriched relative to the HREEs, as indicated by the LREE/HREE ratios ranging from 7.64 to 10.83, with an average of 9.05. The REE distribution patterns display significantly steeper LREE curves compared to the HREE curves, with pronounced troughs at Eu, which is indicative of negative Eu anomalies (Figure 5). The calculated values of Eu/Eu* range from 0.43 to 0.79, with an average of 0.54.

4.4. Chemical Weathering Proxies (Shahezi Formation)

The chemical weathering indices (CIA, WIP, Ln(Al2O3/Na2O), PIA, and Rb/Sr) were combined with the compositional variation proxy (ICV) to determine the chemical weathering conditions of provenance and access paleoclimate evolution during the Shahezi Formation period. The z-scores were calculated to compare different chemical weathering indices with different ranges of values and to summarize a general vertical trend of weathering intensity within the sequence stratigraphic framework. As shown in Figure 6, the chemical weathering intensity of the Shahezi Formation exhibits a gradual increase from TST-1 to HST-1, followed by a general decrease from HST-1 to HST-3. All proxies suggest that the chemical weathering intensity reached its maximum during HST-1 (3124.52–3131.22 m), with CIA ranging from 75.01 to 79.23. The transition from HST-1 to HST-2 marks a dramatic shift in chemical weathering intensity, with CIA decreasing from 76.73 to 72.44. The HST-3 is characterized by the weakest weathering conditions (with CIA values approaching 70). Additionally, the upper portion of HST-3 (3089.19–3091.69 m) records a short-time enhancement of chemical weathering, as evidenced by Ln(Al2O3/Na2O) and PIA values.

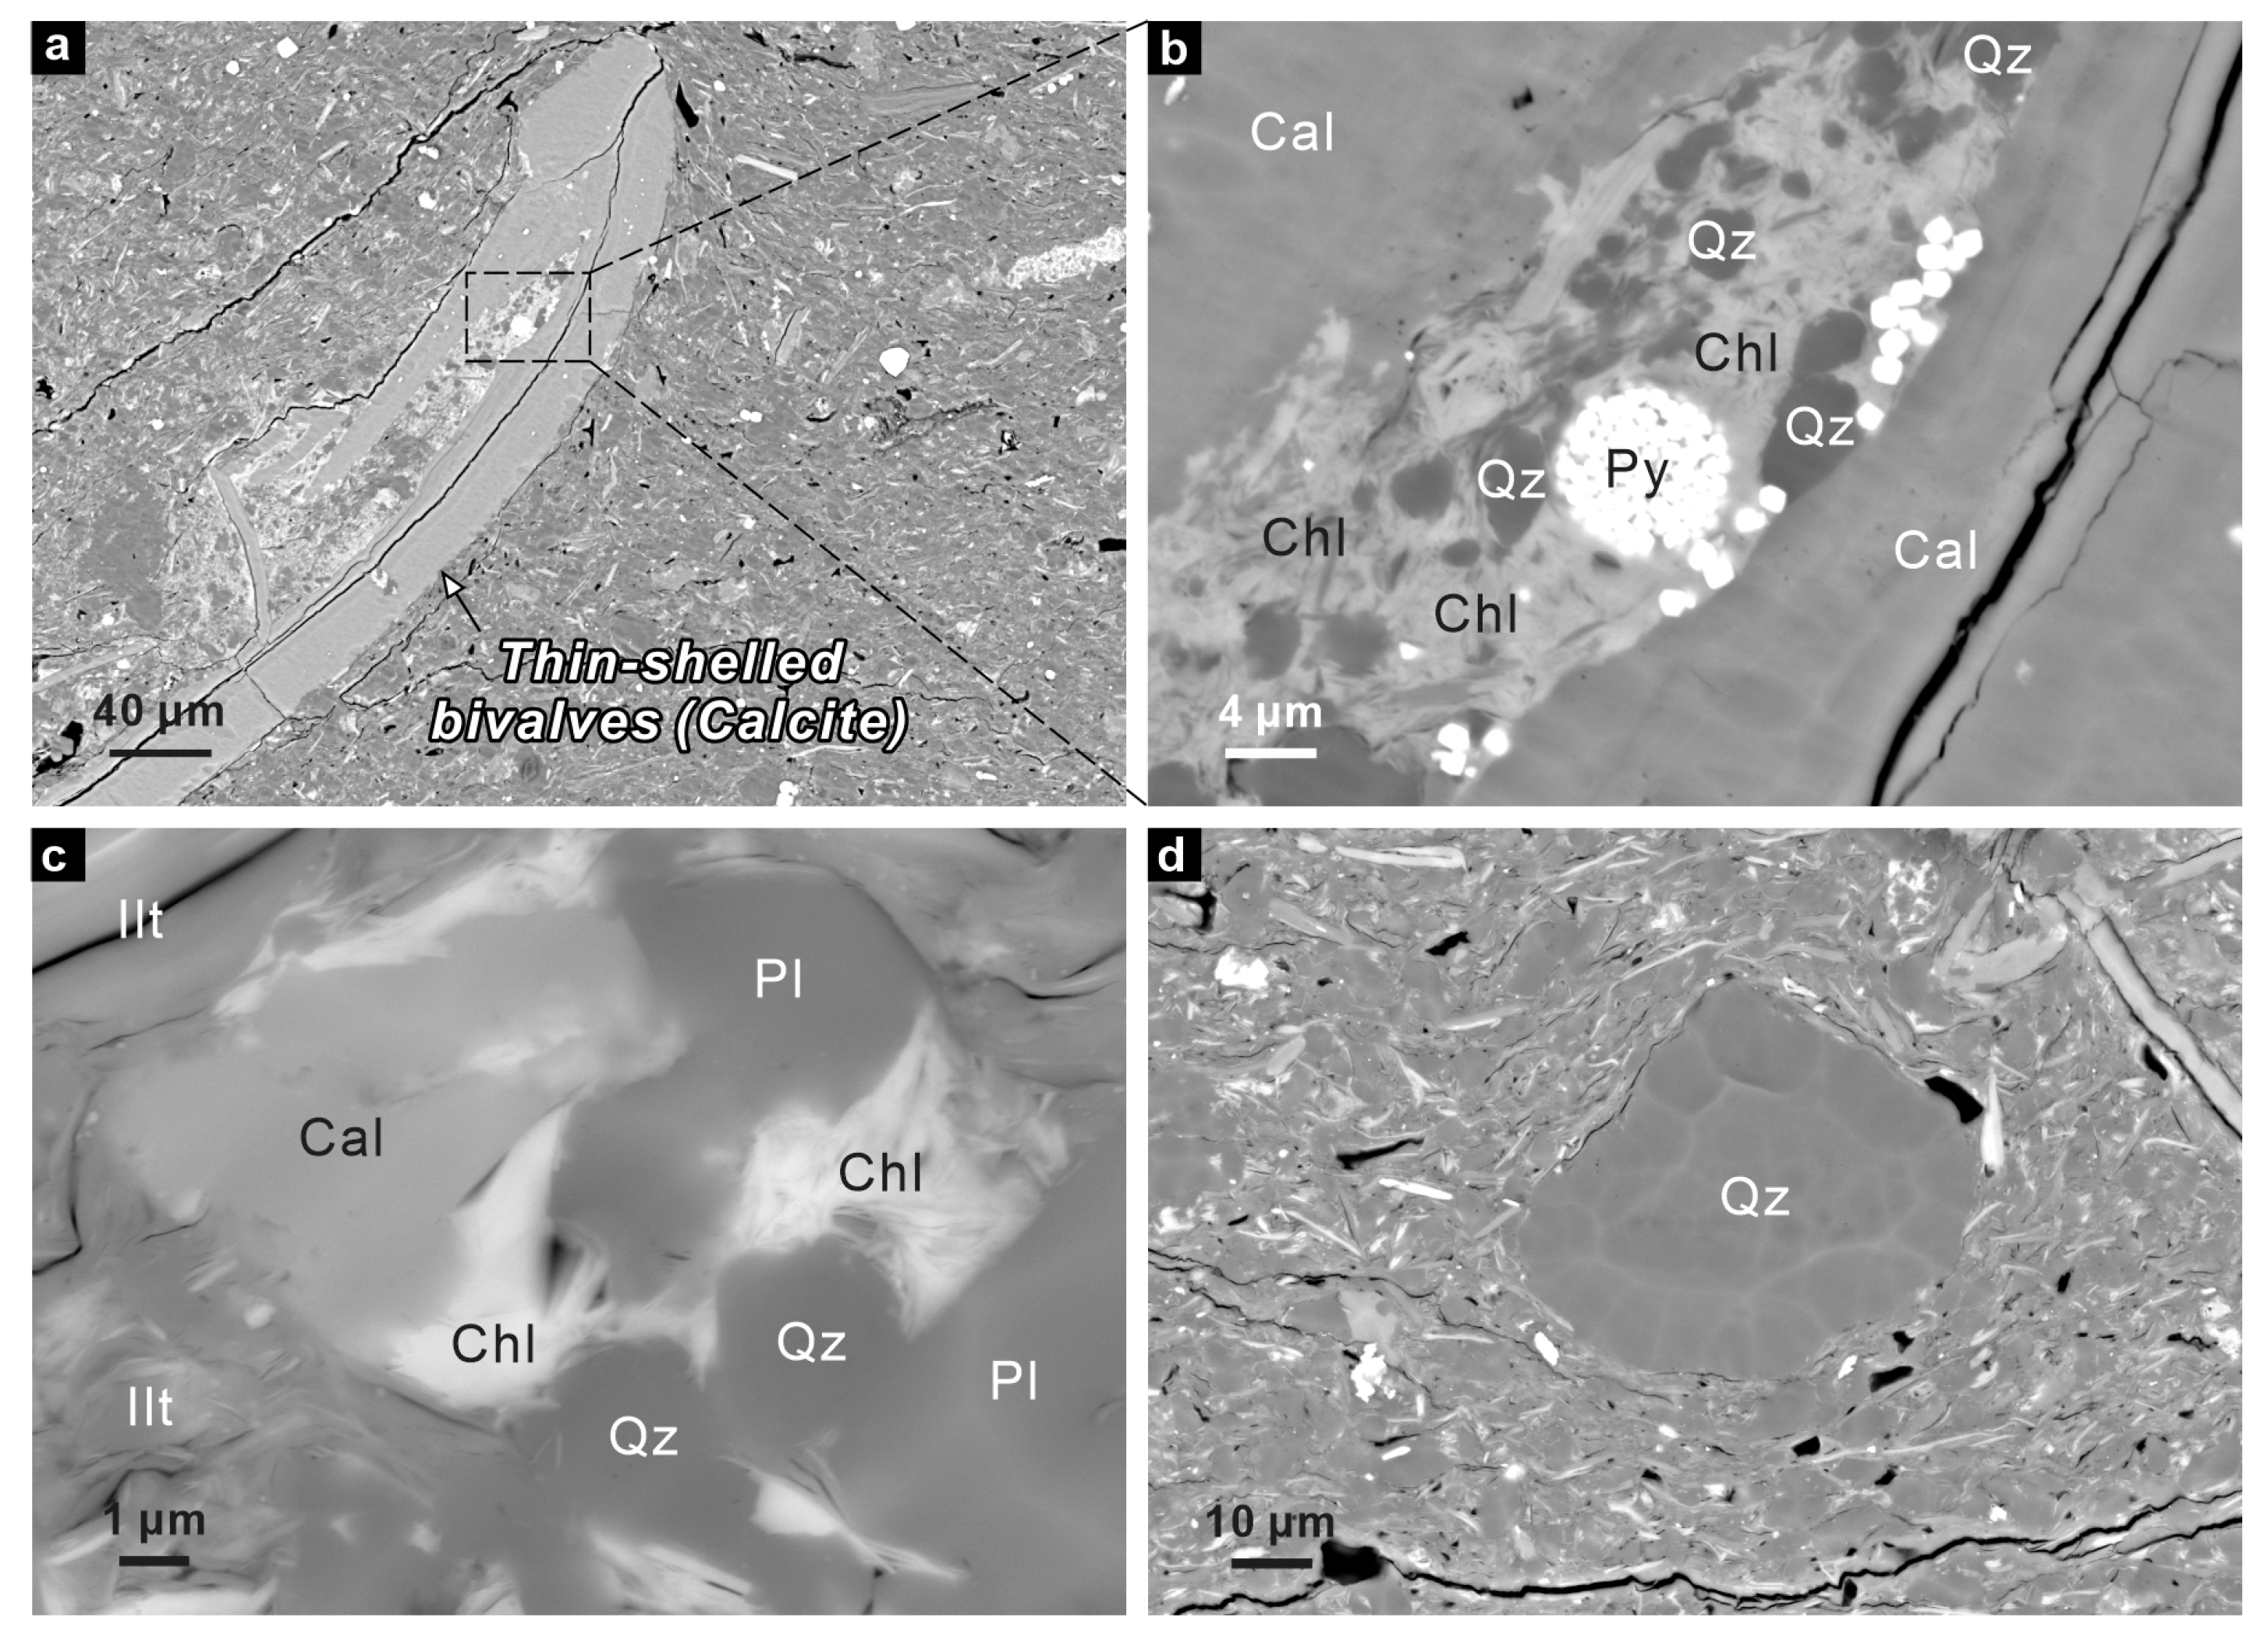
4.5. Microscopic Occurrence of (Na, K, Ba) Feldspar (Longmaxi Formation)

The microscopic relationships and elemental compositions of albite, K-feldspar, and barium feldspar in the Longmaxi Formation mudstones were characterized using SEM-EDS. As shown in Figure 7, albite grains are partially replaced by K-feldspar, while the original morphologies of the albite particles were preserved. Anhedral K-feldspar is commonly rimmed or in contact with barium feldspar, which may also extend into the interior of the K-feldspar grains along cleavage planes. The K-rich barium feldspar has been identified as hyalophane, as evidenced by EDS spectra.

5. Discussion

5.1. Tectonic Settings of the Lishu Rift Depression

Siliciclastic rocks, generated through the weathering, transport, and deposition of protoliths in various tectonic settings, exhibit distinct sedimentary geochemical signatures [59,79]. As shown by the La-Th-Sc and Th-Sc-Zr/10 diagrams (Figure 5a,b), most samples plot within the domain of the continental island arc, with a few indicating active or passive continental margin settings. During the Early Cretaceous, the Songliao Basin was developed between two active continental margins: the eastern Sikhote-Alin and the northeastern Mongol-Okhotsk orogenic belts (Figure 1a). The Sikhote-Alin Belt resulted from the subduction of the paleo-Pacific plate beneath the Paleo-Asian continent [82], while the Mongol-Okhotsk Belt was generated following the closure of the Mongol-Okhotsk Ocean, which was driven by the northwestward subduction of oceanic crust beneath the Siberia Block and the subsequent collision between the Siberia Block and the Mongolia–North China continent [83,84,85,86]. These tectonic processes, and specifically, the subduction of the paleo-Pacific plate, triggered a backarc extension and gravitational collapse [87,88], resulting in the initiation of rifting within the Songliao Basin [31,89]. Thus, the Lishu Rift Depression was developed within an extensional tectonic regime of a continental island arc during the Shahezi Formation period.

5.2. Sedimentary Provenance

REE concentrations and Al2O3/TiO2 ratios are widely applied as indicators of sedimentary provenance and protolith characteristics. Due to their relative geochemical stability and low mobility during weathering, deposition, and diagenesis, REE abundances and chondrite-normalized patterns are considered to be reliable proxies for reconstructing sediment source and protolith types [59,75,79,90,91]. According to Hayashi et al. (1997), Al2O3/TiO2 ratios typically range from 3 to 8 for mafic igneous rocks and from 21 to 70 for felsic igneous rocks [92]. Furthermore, mafic igneous rocks are typically characterized by an absence of Eu anomalies and low LREE/HREE ratios, whereas felsic igneous rocks show pronounced negative Eu anomalies and high LREE/HREE ratios [61,75].
In this study, the Shahezi Formation mudstones exhibit similar chondrite-normalized REE patterns (Figure 5d), suggesting a uniform sediment provenance [61,75]. These REE distribution curves closely resemble those of the upper continental crust (Figure 5d), and most samples plot within the acidic arc source domain on the La/Th versus Hf diagram (Figure 5c) [80]. Therefore, the protolith of the Shahezi Formation mudstones is suggested to be predominantly derived from upper continental crustal igneous rocks. Additionally, the high LREE/HREE ratios (ranging from 7.64 to 10.83, with an average of 9.05), pronounced negative Eu anomalies (Eu/Eu* values < 0.79 and distinct troughs at Eu in the REE patterns), and elevated Al2O3/TiO2 ratios, collectively indicate that the Shahezi Formation mudstones mainly originated from felsic igneous sources (Figure 5d and Figure 8a).

5.3. Chemical Weathering Intensity Reconstructed by CIA Values

5.3.1. Controls on CIA Indicator: Protolith Composition

As many factors, including the protolith composition, CaO contents in non-silicate fractions, sediment recycling, and diagenetic alteration, may have influences on the CIA values, the application of CIA as an indicator to link chemical weathering intensity with climate conditions must be approached with caution [56,58,59,93,94,95]. The A-CN-K ternary diagram, representing the molecular proportions of Al2O3, CaO* + Na2O, and K2O, is particularly useful for differentiating the compositional variations caused by weathering from those resulting from sediment provenance [58,96]. An estimate of provenance composition can be obtained by drawing a best-fit line through the linear array of sample points on the ternary diagram [94]. The best-fit line (the solid arrow in Figure 8b), representing the actual weathering trend, has an intersection point P with the Pl–Kfs line. A point P is expected to represent the original composition of unweathered rocks because the low CIA value of 50 corresponds to incipient chemical weathering [58,94].
Figure 8. Geochemical diagrams of the Shahezi Formation mudstones from the JLYY1 borehole, Lishu Rift Depression, showing the protolith characteristics and chemical weathering conditions during four depositional periods (TST-1 to HST-3). (a) Al2O3 versus TiO2 plot for protolith discrimination, with the threshold values for igneous rock types referenced from Hayashi et al. (1997) [92]. (b) Ternary A-CN-K diagram, highlighting the CIA and CIAcorr values as well as weathering trends. The solid gray points represent the Shahezi Formation data from the SK-2e borehole in this study and four additional boreholes from Yang (2019) [97]. The black circles denote compositions of Post-Archean Australia Shale (PAAS), global average shale (AS), and various unweathered rocks and minerals (data from Wedepohl, 1971; Taylor and McLennan, 1985; Fedo et al., 1995) [58,75,98]. The solid arrow indicates the actual chemical weathering trend, while the dashed arrow represents the predicted progressive chemical weathering trend. Mineral abbreviations: clinopyroxene (Cpx), hornblende (Hbl), plagioclase (Pl), K-feldspar (Kfs), biotite (Bt), muscovite (Mu), illite (Ill), smectite (Sm), gibbsite (Gi), chlorite (Chl), and kaolinite (Ka). (c) The weathering trend is defined by an approximately linear relationship between CIA and WIP. UCC = upper continental crust. (d) Th/Sc versus Zr/Sc diagram, with a base map referenced from McLennan et al. (2003) [99]. The TTG (tonalite–trondhjemite–granodiorite) suite represents an association of rocks comprising the majority of the Archean continental crust.
Hydrology 12 00179 g008
In this study, the distribution of sample points derived from the JLYY1 borehole in the ternary diagram was too limited to generate a reasonable best-fit line. Therefore, additional data from other boreholes (i.e., SK-2e, SL2, B2, S103, and YS3) were incorporated as supplementary evidence (gray points in Figure 8b). Furthermore, a rectangular coordinate system was established to conduct a linear regression analysis of the data points (see Appendix A for more details). In this way, the oxide compositions (Ki, Ai, CNi) of the samples were transformed to their respective orthogonal coordinates (Xi, Yi), which allows for a robust determination of the best-fit line and the intersection point P (Kp, Ap, CNp) based on the least squares method. As shown in Figure 8b, the best-fit line was derived for 118 samples from the Shahezi Formation mudstones. A strong correlation between Xi and Yi (R2 = 0.82, p-value < 0.001) indicates a well-defined actual weathering trend and suggests a similar protolith composition among samples from four boreholes. The intersection point P is located near tonalite (plagioclase/K-feldspar = 5.3), indicating the felsic origin of the Shahezi Formation mudstones examined in this study.

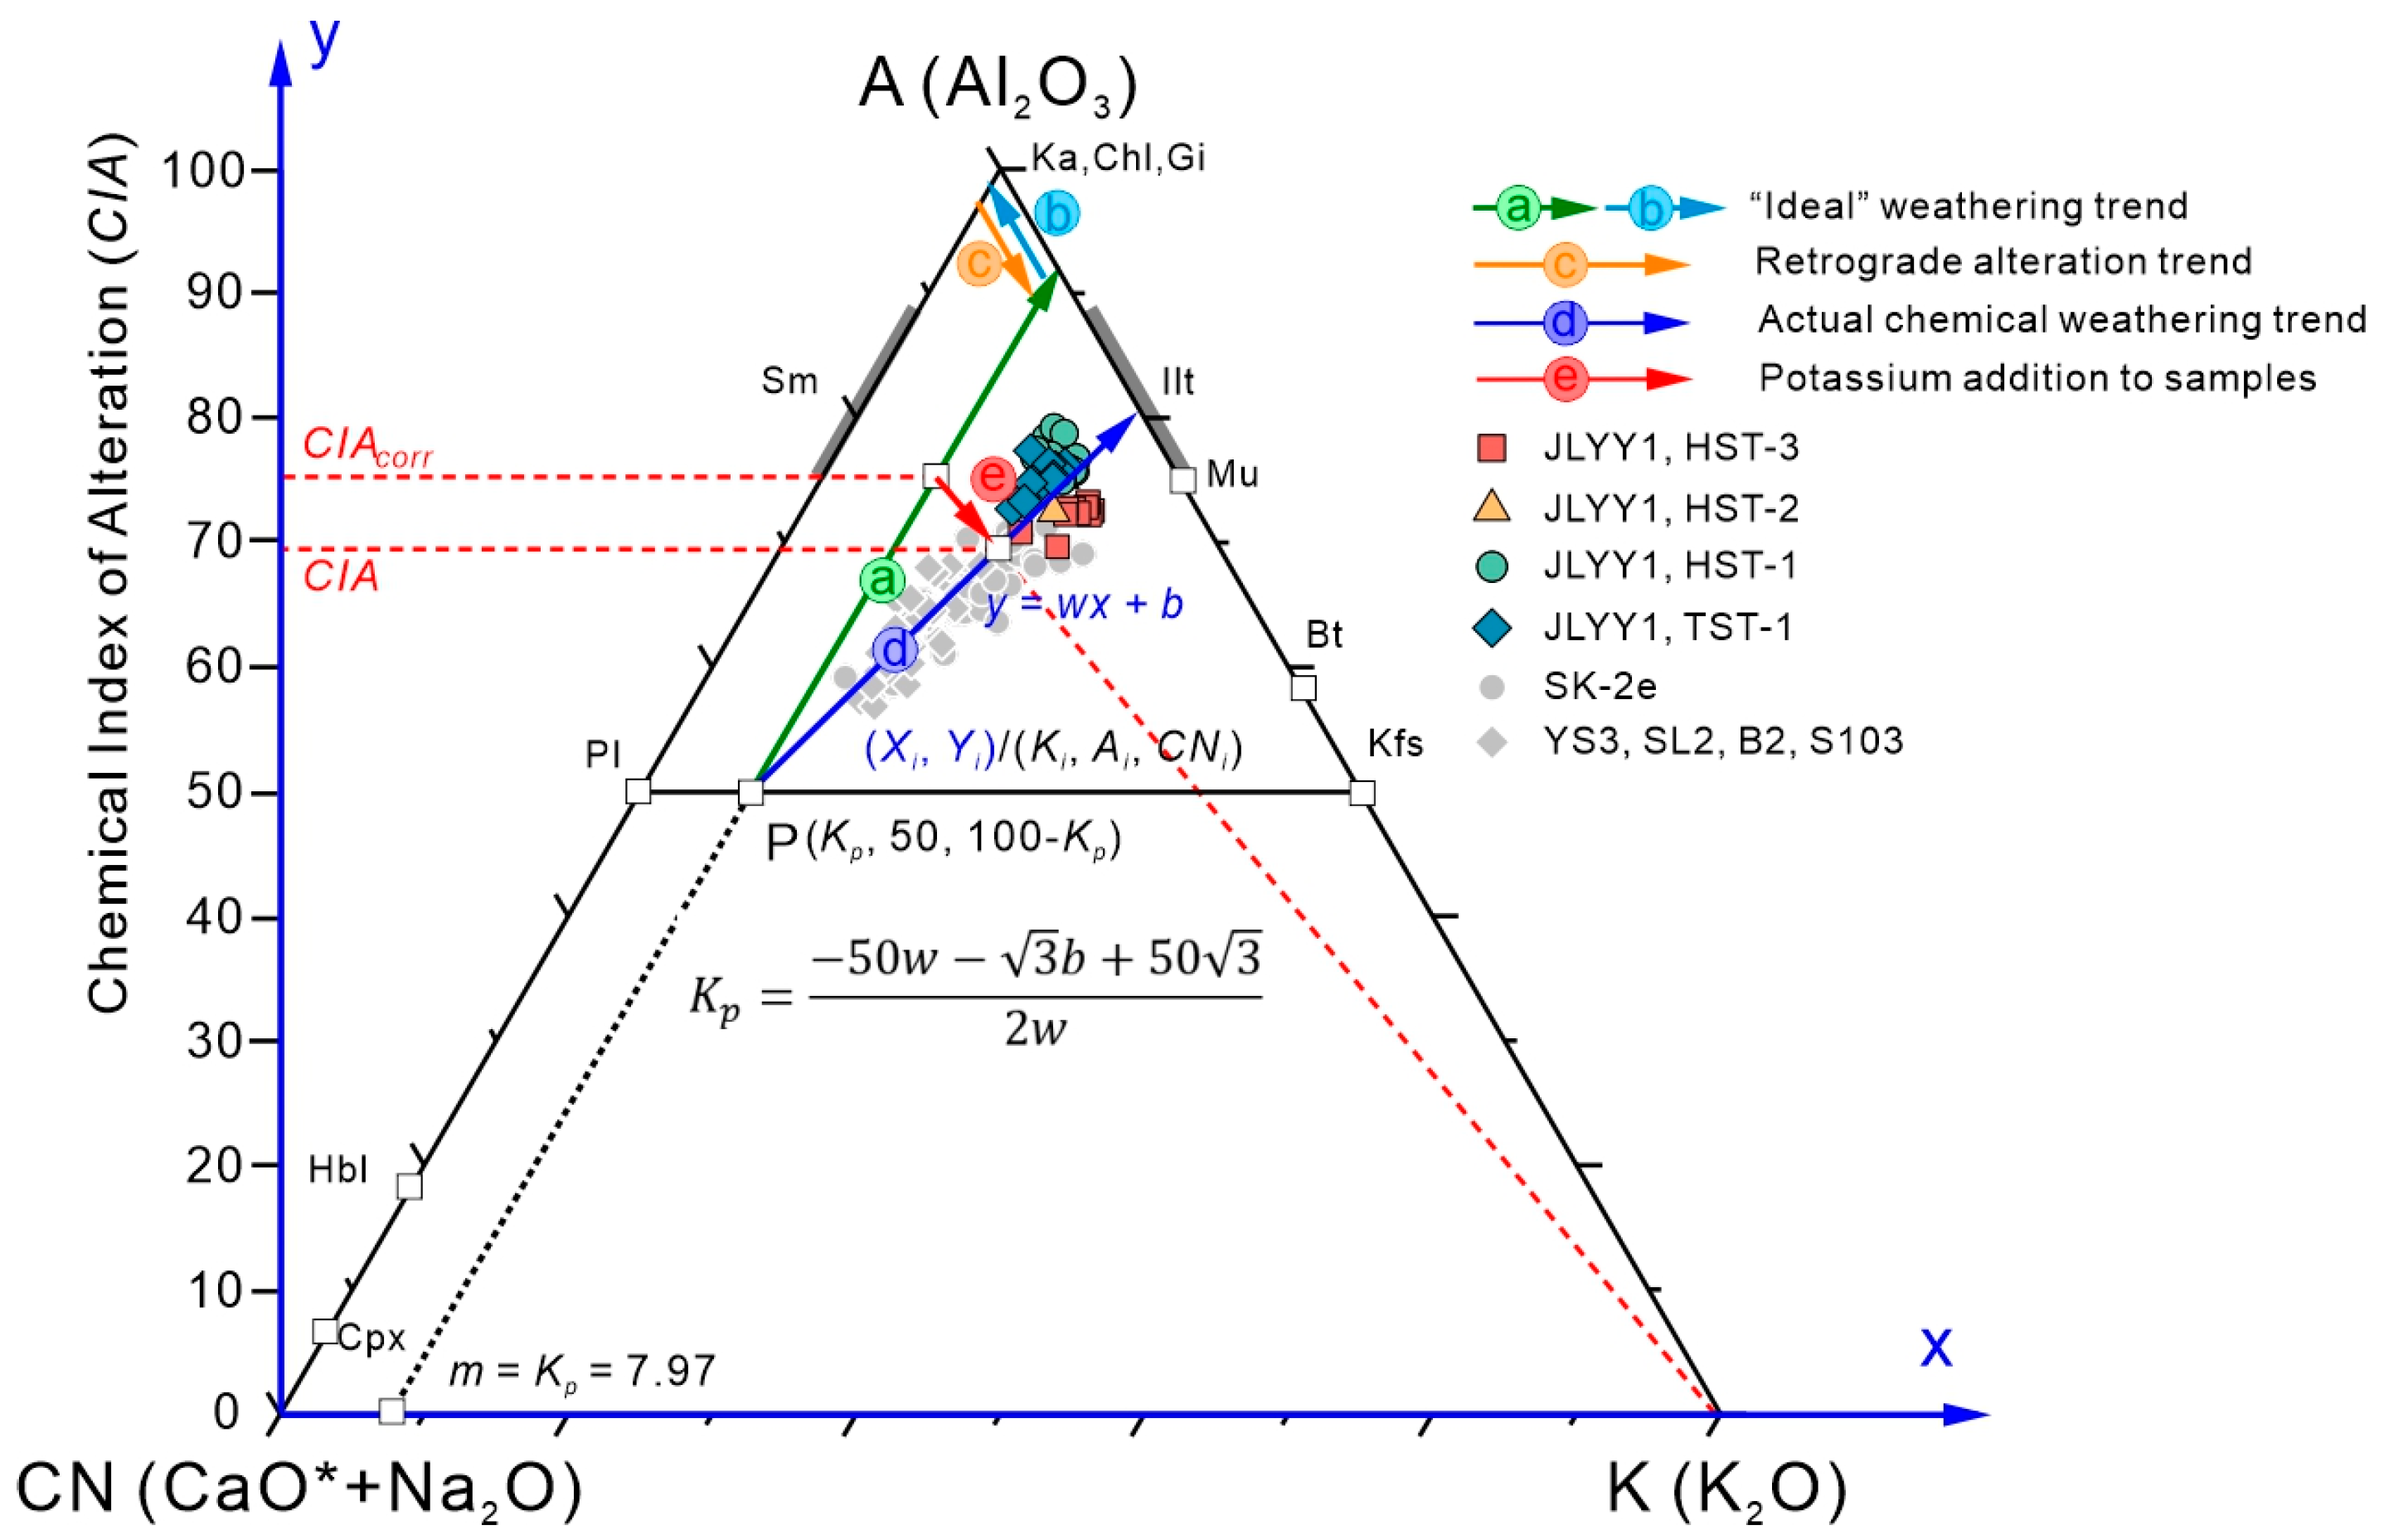
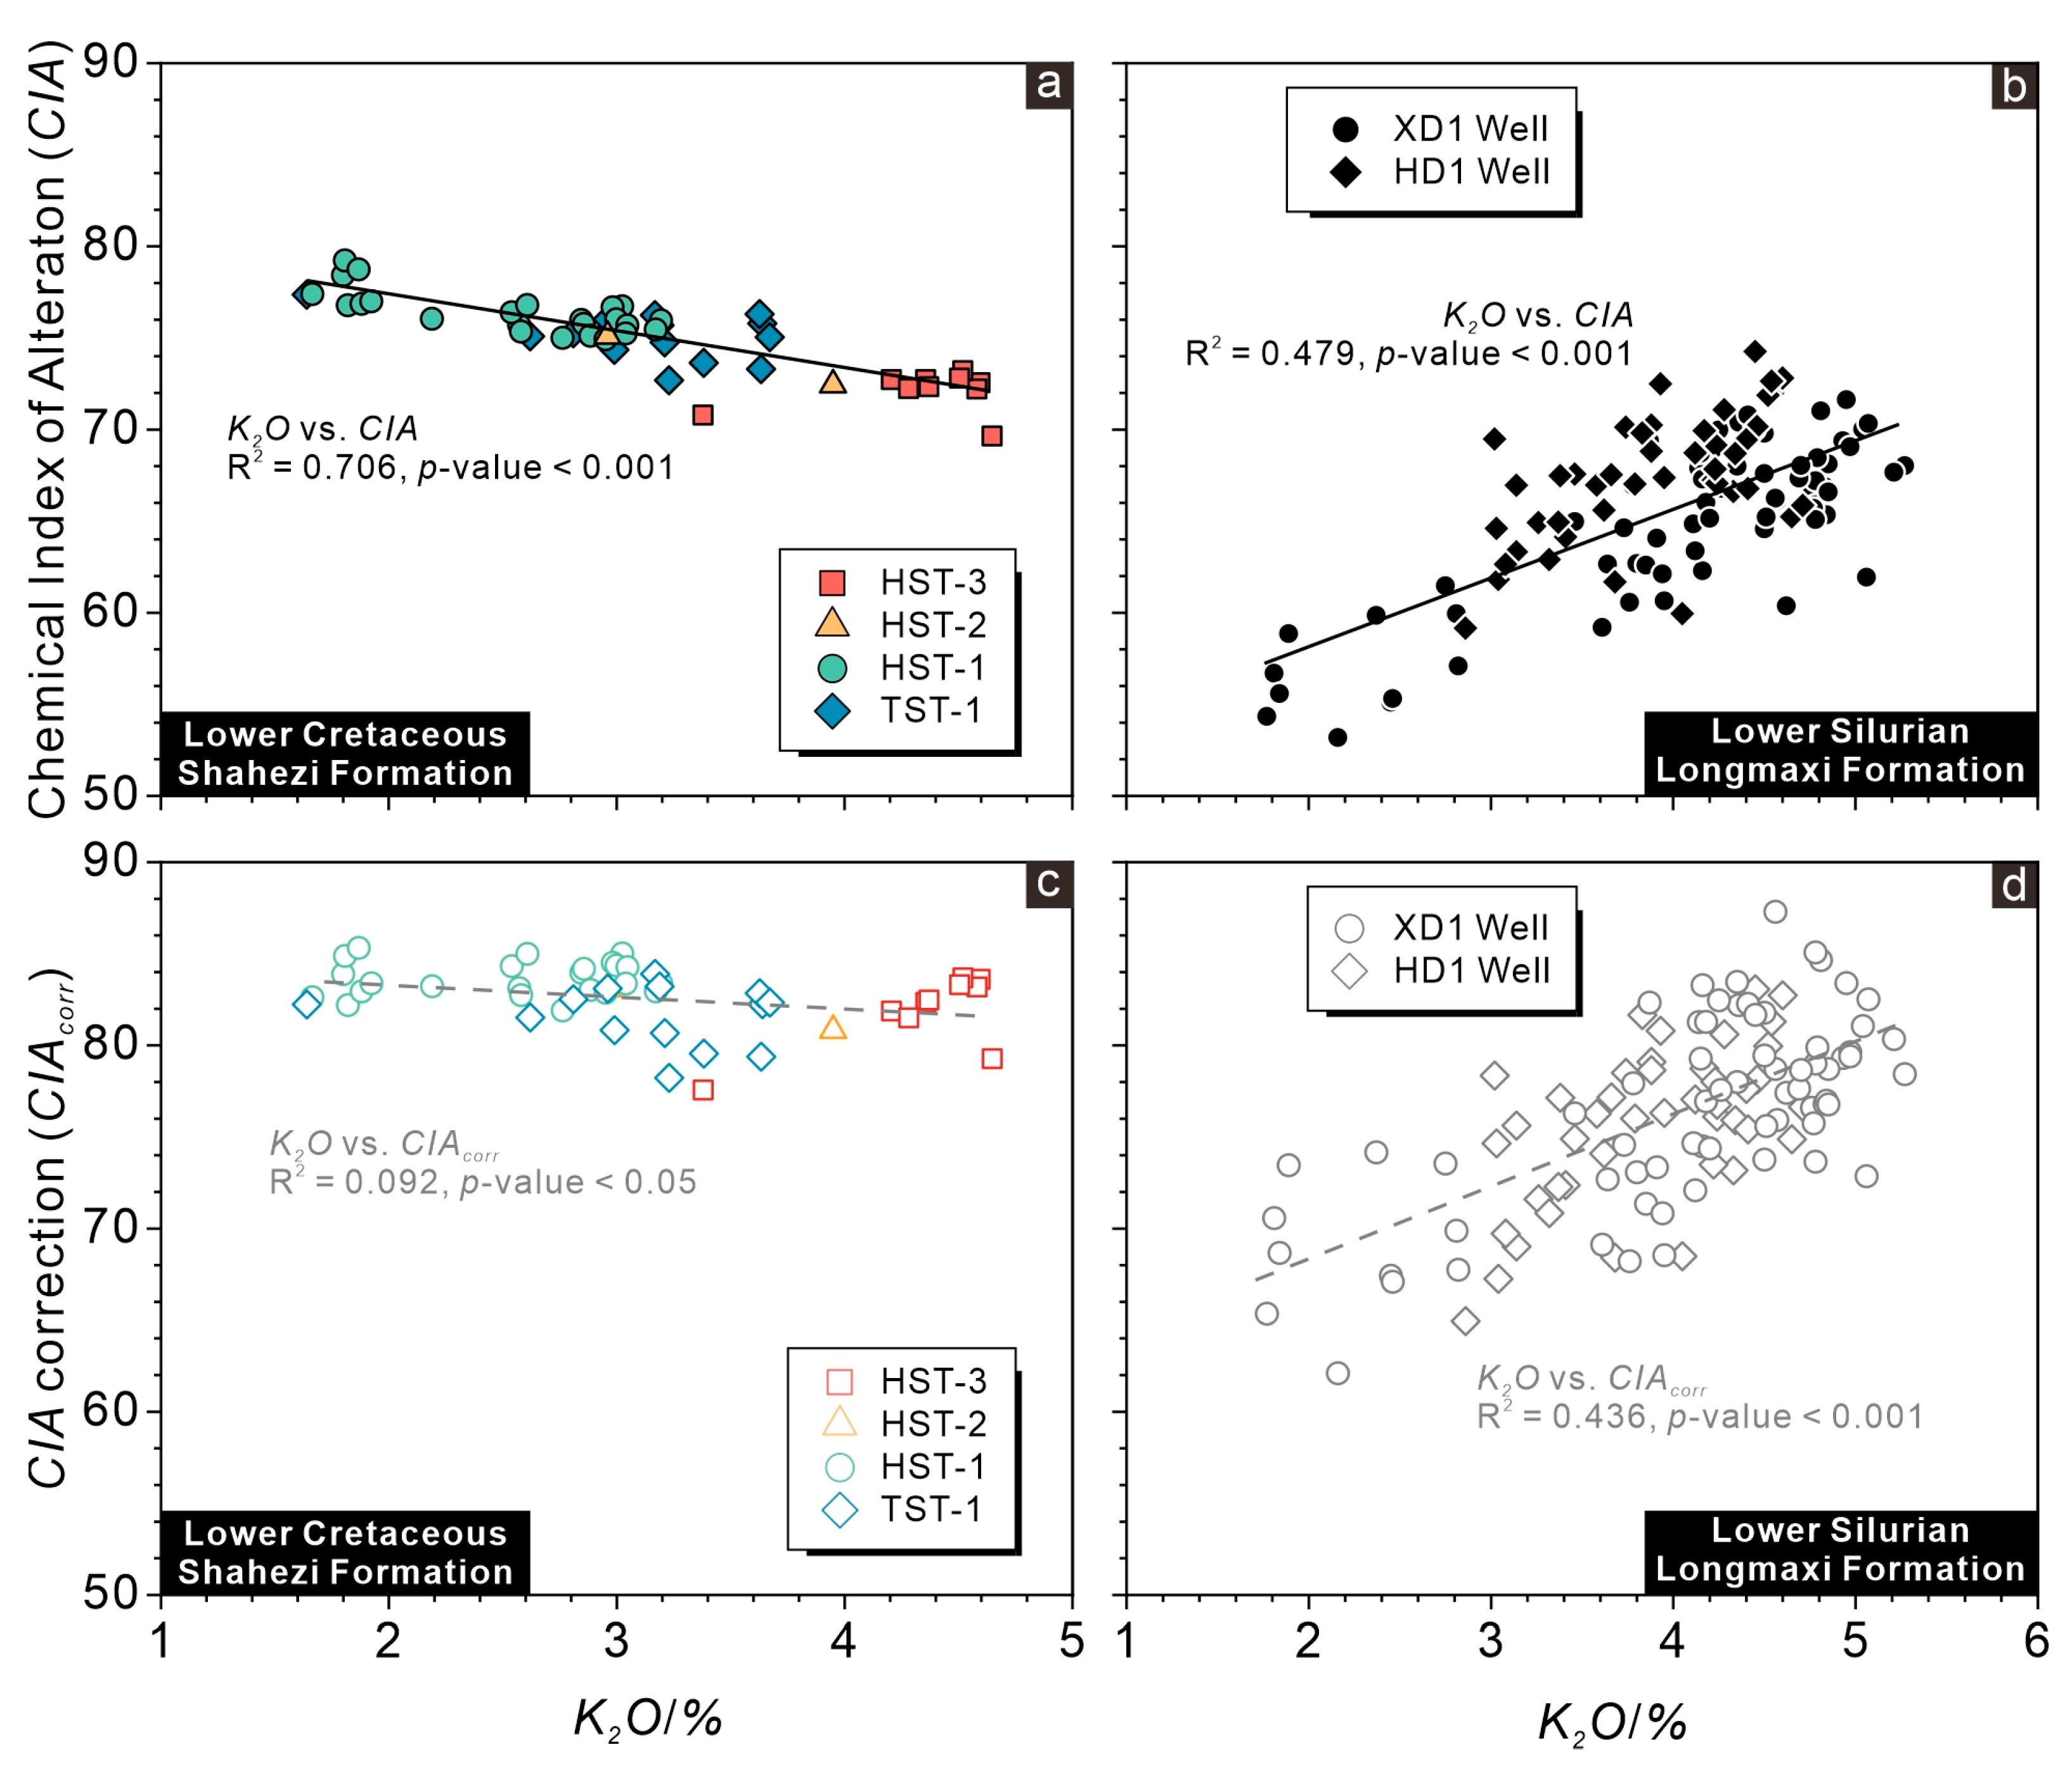
5.3.2. Controls on CIA Indicator: Potassium Metasomatism

Potassium metasomatism results in an increase in K2O concentration of rocks when K-bearing fluids are available, which commonly occurs in siliciclastic rocks [58]. Its petrographic expression is the transformation or creation of K-bearing minerals, e.g., the reconstitution of detrital plagioclase or K-feldspar by low-temperature phases (authigenic adularia) or the transformation of aluminous clay minerals (smectite and kaolinite as mineral matrix) to illite [58,100]. Such mass-transport-related diagenetic alteration can decrease the CIA values and lead to a deviation of the linear array of sample points in a A-CN-K diagram. As indicated by the dashed arrow in Figure 8b, the predicted progressive chemical weathering trend is a straight line that originates from the intersection point P and is parallel to the A-CN sideline. Under the effects of K metasomatism, the actual chemical weathering trend (the solid arrow) deviates from the “idealized” trends, which leads to an underestimation of CIA values. To correct the excess potassium, the CIA values were corrected to CIAcorr by calculating the “pre-alteration” K2O contents (K2Ocorr) [95].
K2Ocorr = [mAl2O3 + m(CaO* + Na2O)]/(1 − m)
where m represents the molecular fraction of the K2O for the protolith sample; in the present study, m can be determined from the intersection point P, which represents the composition of protolith rocks before the chemical weathering process (m = Kp, see Appendix A for the detailed calculation).
For the Shahezi Formation mudstones, the CIAcorr values range from 77.6 to 85.3, with an average of 82.7, which are higher than the CIA values (69.6 to 79.2, averaging 75.0). In addition, the CIAcorr values exhibit a similar stratigraphic variation trend with the CIA values (Figure 6 and Figure 9a), which is supported by their positive correlation (R2 = 0.45, p-value < 0.001). Since K-feldspar constitutes only a minor proportion in all samples, never exceeding 25% of the total feldspar content [32], it is appropriate to use PIA proxies to correct for the effects of potassium metasomatism by excluding K-feldspar from the relevant equations. In this study, CIAcorr and PIA exhibit a strong positive correlation (R2 = 0.97, p-value < 0.001), which is notably higher than the correlation between CIA and PIA (R2 = 0.62, p-value < 0.001). The strong correlation between CIAcorr and PIA demonstrates that the influence of potassium metasomatism can be effectively minimized when using the two proxies.

5.3.3. Controls on CIA Indicator: Sediment Recycling

Multiple events of sedimentation and weathering tend to generate compositionally mature rocks that are rich in clay minerals such as kaolinite and chlorite, and have high CIA values [60]. CIA values calculated from the recycled sediments may overestimate the paleo-weathering intensity [33,101]. The clay minerals contain a higher fraction of Al2O3 than non-clay mineral silicates, relative to other oxides; therefore, they are characterized by lower ICV values. Based on this, the mudstones with ICV < 1 are interpreted as compositionally mature rocks that have probably undergone sediment recycling [60,61], which may not be suitable for the reconstruction of chemical weathering history.
In this study, the Shahezi Formation mudstone samples exhibit ICV values ranging from 0.88 to 1.54, with an average of 1.11 (Figure 2). Most samples have ICV values higher than 1, indicating their immature composition and first-cycle origin. In comparison, some samples from TST-1 and HST-3 are characterized by relatively lower ICV values, generally 0.88 to 0.99. Thus, the TST-1 and HST-3 may have been affected by greater sediment recycling than HST-1 and HST-2. However, despite the potential increase of CIA values by sediment recycling, the CIA values of the HST-3 samples are still lower than HST-1 and HST-2. Hence, the influence of sediment recycling does not change the decreasing trend of CIA from HST-1 to HST-3. Some samples of TST-1 have higher CIA values. However, their ICV values are higher than the values of clay minerals (0.03 to 0.78) and feldspars (0.54 to 0.87), and the correlation between ICV and CIA is weak (R2 = 0.13, p-value = 0.149). It suggests that sediment recycling is not the dominant factor controlling the CIA trend. Weak sediment recycling controls, as indicated by the poor correlation between ICV and CIA, have also been documented in other Middle Permian and Early Cretaceous deposits [33,101].

5.3.4. Controls on CIA Indicator: Carbonate Abundance

The determination of CaO* in the CIAcorr formula makes corrections for the occurrence of Ca in phosphates and carbonates [59]. However, some samples from the Shahezi Formation contain substantial amounts of Ca in non-silicate minerals, such as sublittoral argillaceous mudstones rich in bivalve (calcite) and skeletal fragments (fluorapatite), as well as profundal calcareous mudstones and horizontally stratified calcite beds (see Figure 7, Figure 8 and Figure 12 in Wang et al. (2025)) [32]. Thus, the application of CIAcorr to these samples may introduce uncertainties in assessing chemical weathering intensity. To address this, the index Ln(Al2O3/Na2O) was calculated to provide supplementary evidence (Figure 6) [64]. A significantly positive relationship between Ln(Al2O3/Na2O) and CIAcorr occurs is measured across the entire Shahezi Formation mudstone succession (R2 = 0.78, p-value < 0.001), indicating that the presence of Ca in non-silicate minerals has no substantial influence on the stratigraphic trends in CIAcorr values.

5.4. Paleoclimate Variation Recorded in the Lishu Syn-Rift Paleo-Lake

5.4.1. Chemical Weathering Proxies

Chemical weathering proxies are highly sensitive to climate change. During the chemical weathering of silicate minerals, labile constituents (e.g., Ca2+, Na+, K+, and Sr2+) are preferentially removed relative to more stable residual cations such as Al3+, Ti4+, and Si4+ [56,58,69,94]. As a result, the WIP and Rb/Sr values of the lacustrine sediments decrease, and other proxies increase as chemical weathering progresses. The intensity of chemical weathering is primarily controlled by both humidity and land surface temperature, with weathering rates increasing as these variables rise [102,103]. This is largely because weathering intensity is driven by the amount of humic and associated acids percolating through the weathering profile, which is regulated by rainfall [56,57,96,104]. Accordingly, high CIA values (>80) are interpreted to reflect hot and humid conditions with intense paleo-weathering conditions; medium CIA values ranging from 60 to 80 indicate warm and humid climates with moderate weathering intensity; and low CIA values (<60) correspond to cold and/or dry environments with a near absence of chemical alteration [58].
According to the relationship among CIA values, paleo-weathering intensities, and paleoclimate conditions, the high CIAcorr values of the Shahezi Formation mudstones indicate a hot and humid climate (Figure 6 and Figure 8b). For the stratigraphical changes, TST-1 and HST-1 are characterized by higher CIA values (72.7 to 79.2, averaging 75.9) than those of HST-2 and HST-3 (69.6 to 75.1, averaging 72.4), indicating intense chemical weathering during the lake expansion stage. The gradual decrease of CIA in HST-2 and the sharp decrease of CIA in the late period of HST-3 represent two transient arid and cooling events, which correspond to low lake levels and fan delta deposition. Overall, during the Early Cretaceous (Middle Aptian–Early Albian), the climate conditions were hot and humid with intermittent cooling and drying climate fluctuations in the watersheds of the Lishu paleo-lake, which is consistent with the paleoclimatic interpretations in previous studies [11,105,106].

5.4.2. Sedimentological and Palynological Evidence

The multi-scale evolution of lakes, driven by alternating wet and dry climatic cycles, can be recorded in the long-term stratigraphic variations among deltaic, siliciclastic/carbonate lacustrine shoreline, and nearshore/offshore lacustrine deposits. Furthermore, fluctuations in terrestrial vegetation exhibit a sensitive response to climate changes, making the analysis of facies associations and palynomorph assemblages a widely utilized approach for reconstructing paleoclimate conditions [107,108].
During the Shahezi Formation period, the Lishu paleo-lake deposition was characterized by siliciclastic shoreline strata, consisting of alternating siltstones and mudstones within pro-fan delta, lake beach, and shoreface settings [32]. The dominance of siliciclastics, coupled with the absence of dolomite in shoreline facies, indicates that continental runoff and fluvial input were sufficient to continuously deliver silt and clay to hydrologically open lakes, thereby maintaining low water salinity [32,108]. In a similar example, Wiggins and Harris (1994) identified two contrasting lithofacies assemblages and associated climate conditions based on the long-term lake evolution recorded in the Lower Green River Formation, southwestern Uinta Basin: a “wet-climate model” and a “dry-climate model” [108]. The siliciclastic-dominated shoreline deposits and high fluvial discharge in the Lishu Rift Depression suggest that its development occurred primarily under wet climatic conditions.
Some studies have investigated the Cretaceous climate of the Songliao Basin using palynomorph assemblages from the lacustrine mudstones of the Shahezi Formation. Yan et al. (2017) inferred a mid-subtropical climate based on algae, ostracods, and palynomorph data obtained from the LS1 and SW110 boreholes in the Lishu Rift Depression [109]. The vegetation during the Shahezi Formation period was reported to be mainly composed of herbaceous (~43%) and coniferous (~31.6%) plants. Similarly, Zhang et al. (2024) reported a comparable palynomorph assemblage in the Shahezi Formation through analysis of the SK-2e borehole in the Xujiaweizi Rift Depression [110]. Their study concluded that the vegetation consisted mainly of coniferous (~37.9%), evergreen broad-leaved (~26.1%), and herbaceous (~25.6%) plants, suggesting a predominantly temperate climate with a subtropical climate being subordinate. Overall, the wet, subtropical climatic conditions inferred from sedimentological and palynological data are consistent with the hot and humid climate indicated by the geochemical proxies in this study. Therefore, it can be confirmed that a hot and humid subtropical climate prevailed in the Songliao Basin, NE Asia, during the Middle Aptian to Early Albian.

5.5. Uncertainty Analysis

5.5.1. Inaccurate Assessment of “Excess K2O” and Pre-Metasomatic CIA Values: Insights from the Longmaxi Formation Mudstones Affected by Hydrothermal Fluids

The metasomatic addition of potassium into sedimentary rocks has received considerable attention, as it can alter the primary bulk geochemistry, decrease the CIA values of affected strata, and consequently result in erroneous reconstructions of paleo-weathering conditions [57,58]. This diagenetic modification can be petrographically expressed by the illitization of kaolinite (Equation (9)) and the replacement of plagioclase with low-temperature phases of K-feldspar (e.g., adularia, Equations (10) and (11)) [58,100,111,112,113].
3Al2Si2O5(OH)4 + 2K+ = 2KAl3Si3O10(OH)2 + 2H+ + 3H2O
NaAlSi3O8 + K+ = KAlSi3O8 + Na+
CaAl2Si2O8 + 2K+ + 4SiO2 = 2KAlSi3O8 + Ca2+
Given these considerations, as discussed in Section 5.3.2, a method for correcting excess K2O in the CIA calculation was initially proposed graphically by Fedo et al. (1995) and later formalized mathematically by Panahi et al. (2000) [58,95]. However, the application of this correction introduces several issues. Algeo et al. (2025) systematically examined the underlying assumptions of this approach, specifically: (1) that the weathering trajectories of pre-metasomatized rocks follow a path parallel to the A-CN axis; (2) that deviations from the ideal weathering trend can be attributed to metasomatic K addition; and (3) that the potassium addition can be corrected by projecting data points away from the K apex on the A-CN-K diagrams [93]. As demonstrated by Algeo et al. (2025), these assumptions may not always be valid for all modern weathering profiles, and thus, potentially may lead to unnecessary or even erroneous CIA corrections [93].
In fact, beyond these assumptions, this approach has been suggested to be applicable only for correcting the K addition introduced by the illitization of kaolinite [58,111]. In previous studies, the transformation of altered plagioclase into K-feldspar is usually ignored when correcting the K addition [114,115,116], as it has been assumed to occur predominantly in the sand-sized fractions of siliciclastic sediments, with no effects on the CIA values [58,111]. However, increasing petrographic evidence indicates that the transformation of plagioclase into K-feldspar can also take place in silt-sized grains within mudstones [35,117,118,119]. As shown in Figure 7, albite particles in the Longmaxi Formation mudstones are partly replaced by K-feldspar and further rimmed by hyalophane. During this diagenetic process, the molar ratios of replaced CaO + Na2O to added K2O can vary widely, owing to differences in mineral solubility, diffusion rates, and the composition of fluids interacting with plagioclase of variable anorthite content [111,120]. Consequently, the resulting K-addition vectors may have different orientations in A-CN-K diagrams, which cannot be simply corrected by projection away from the K apex [93]. Therefore, if plagioclase grains in the Shahezi Formation mudstones have undergone alteration to low-temperature phases, a diagenetic process that has yet to be confirmed, the application of Panahi et al. (2000)’s approach may result in inaccurate estimates of pre-metasomatized CIA values [95]. This issue is usually overlooked in previous studies reconstructing paleo-weathering conditions [114,115,116].
The transformation of kaolinite to illite cannot be regarded as petrographic evidence of potassium metasomatism without a deliberate evaluation of the potassium source. In the Longmaxi Formation mudstones, hyalophane occurring in a grain-coating and pore-filling phase suggests hydrothermal activity (Figure 7), which can be supported by geochemical signatures (e.g., positive Eu anomalies, elevated excess Ba values, and 87Sr/86Sr ratios) and typical mineral assemblages (e.g., barite, anhydrite, and microcrystalline silica) [34,35,121,122]. In general, Ba-rich and K-rich hydrothermal fluids can provide an external source of potassium for plagioclase alteration [34,122]. Consequently, metasomatic introduction of K into plagioclase results in an overall increase in bulk-rock K2O contents and K/Al ratios, both of which exhibit positive correlations with CIA and CIAcorr values (Figure 9b,d). In contrast, for the Shahezi Formation, the data array in the A-CN-K diagrams trends towards the illite pole (Figure 8b). The abundant occurrence of authigenic illite plates (Figure 10a–c) and pervasively altered plagioclase grains (Figure 10a,c,d) cannot be considered to be definitive evidence of potassium metasomatism. This is because authigenic illite may form via the transformation of smectite or kaolinite under increasing temperature and pressure [123,124,125], with the required potassium potentially sourced from the breakdown of detrital K-feldspar [126], as supported by the low K-feldspar content in the samples (less than 0.9%, averaging 0.2%) [32]. In such cases, intraformational addition of K to kaolinite does not necessarily result in an overall increase in bulk-rock K2O. Both bulk-rock K2O content and K/Al ratios in the Shahezi Formation display negative or insignificant correlations with the CIA and CIAcorr values (Figure 9a,c), in contrast to the positive correlations that are typically indicative of K metasomatism [93,100]. Therefore, only potassium addition from external sources, such as hydrothermal alteration or brine circulation [127], should be regarded as evidence for potassium metasomatism. In the absence of geochemical or petrographic evidence for such an external K addition, calculating “excess K2O” and applying CIA corrections may be unwarranted and could potentially introduce significant errors in paleo-weathering intensity assessments.

5.5.2. Problems with Corrections to CaO Contents and CIA Corrections

In this study, CaO was corrected for phosphate content by subtracting 10/3 × P2O5 from the total CaO content [59]. For the majority of the Shahezi Formation samples (40 out of 50), the remainder of the CaO content was higher than the molar concentrations of Na2O, so the Na2O values were used to represent the CaO content within the silicate fraction [59]. In the remaining ten samples, where the corrected CaO was less than the Na2O concentration, the corrected CaO value was utilized instead [59]. This method is effective for sediments derived predominantly from felsic sources and does not require any pre-chemical leaching procedures [93]. However, compared to sodium, calcium tends to be more susceptible to chemical weathering due to its larger ionic radius and weaker bonding within the plagioclase lattice [59]. Therefore, calculating CaO* likely results in an underestimation of CIA values [59]. On the other hand, a K2O correction decreases the CIA discrepancy of the sample points. In the A-CN-K diagram (Figure 8b), the data points, located on the same line projecting backward away from the K2O apex, have the same CIAcorr values, even though their original CIA values differ. Consequently, the use of CIAcorr may obscure stratigraphic variations in chemical weathering intensity.

6. Conclusions

In this study, the lacustrine-dominated interval of the Shahezi Formation (JLYY1 borehole, Lishu Rift Depression, southeastern Songliao Basin) was examined to reconstruct paleo-weathering intensity and paleoclimate conditions during the Early Cretaceous. Multiple chemical weathering indices, including CIA, WIP, Ln(Al2O3/Na2O), PIA, and Rb/Sr, were integrated with the compositional variation proxy (ICV), alongside sedimentological and palynological evidence, to elucidate paleoclimate variations within a stratigraphic framework encompassing four stages of lake evolution, from TST-1 to HST-3.
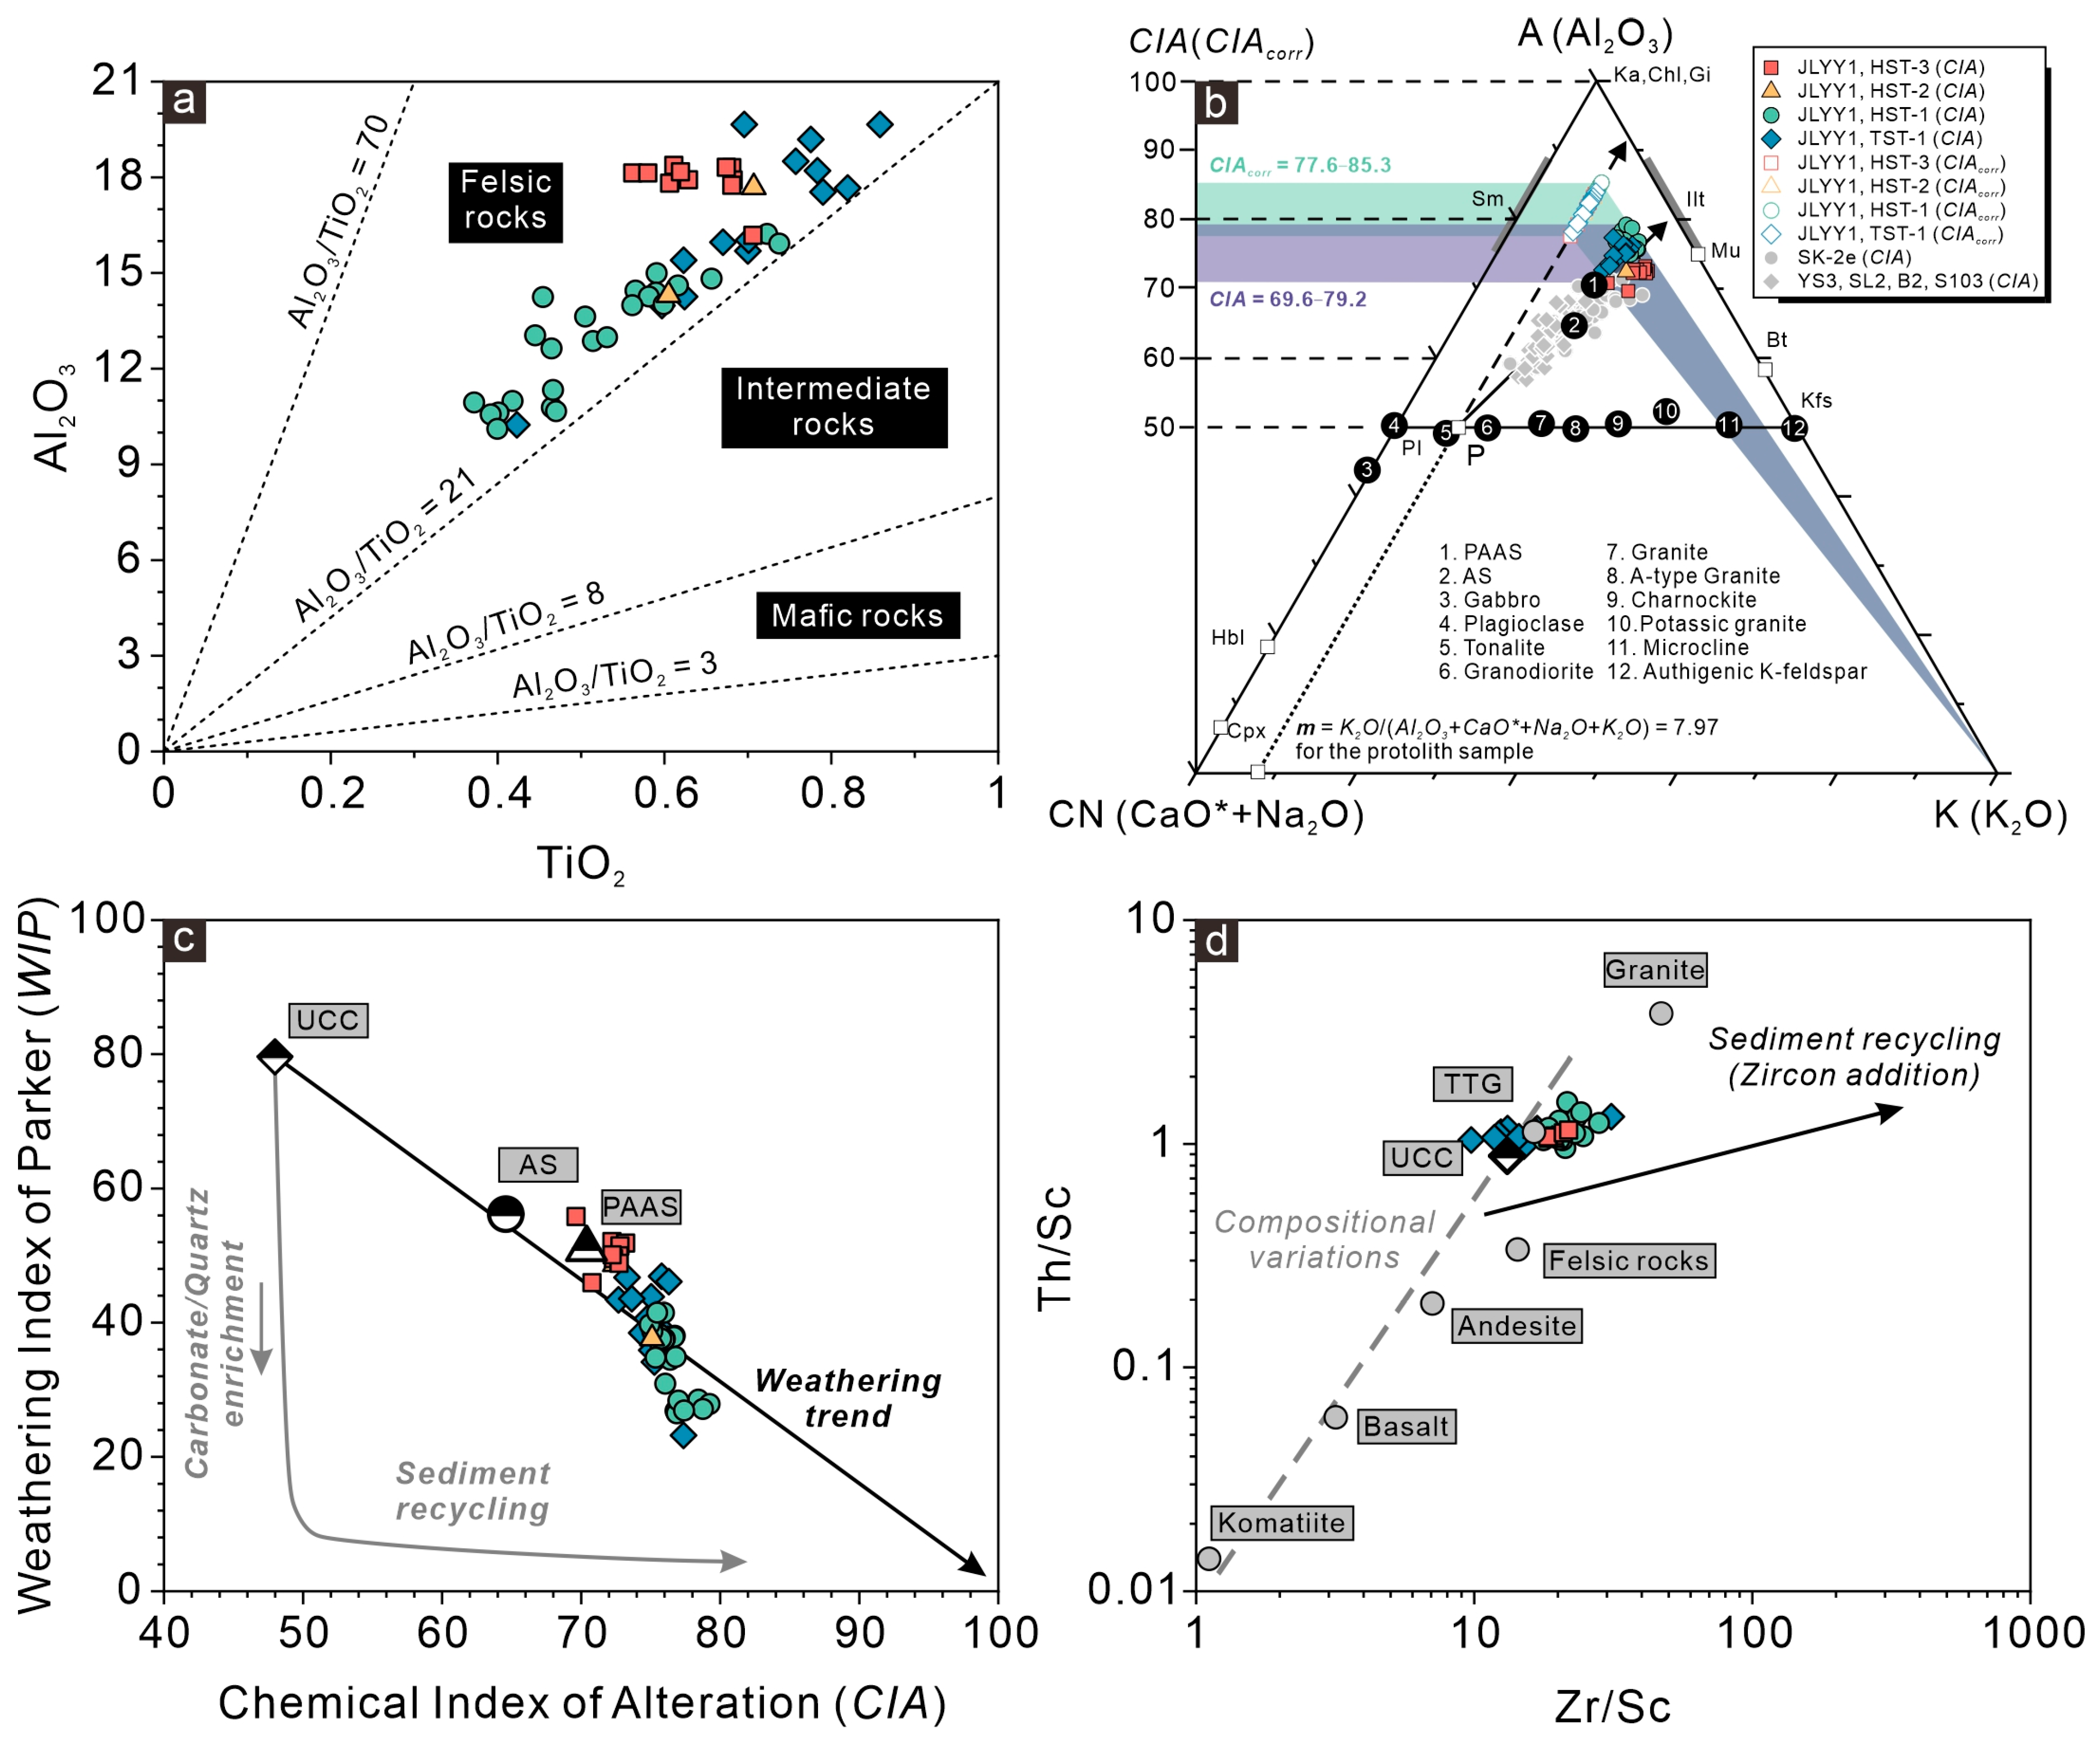
  • Tectonic background and sedimentary provenance. The Lishu paleo-lake developed within a tectonic regime of a continental island arc. The closure of the Mongol-Okhotsk Ocean and the subduction of the paleo-Pacific plate beneath the Paleo-Asian continent, during the Early Cretaceous, induced backarc extension and gravitational collapse, initiating the rifting of the Songliao Basin. REE signatures and Al2O3/TiO2 ratios indicate that the Shahezi Formation deposits have a uniform provenance, primarily derived from felsic igneous sources.
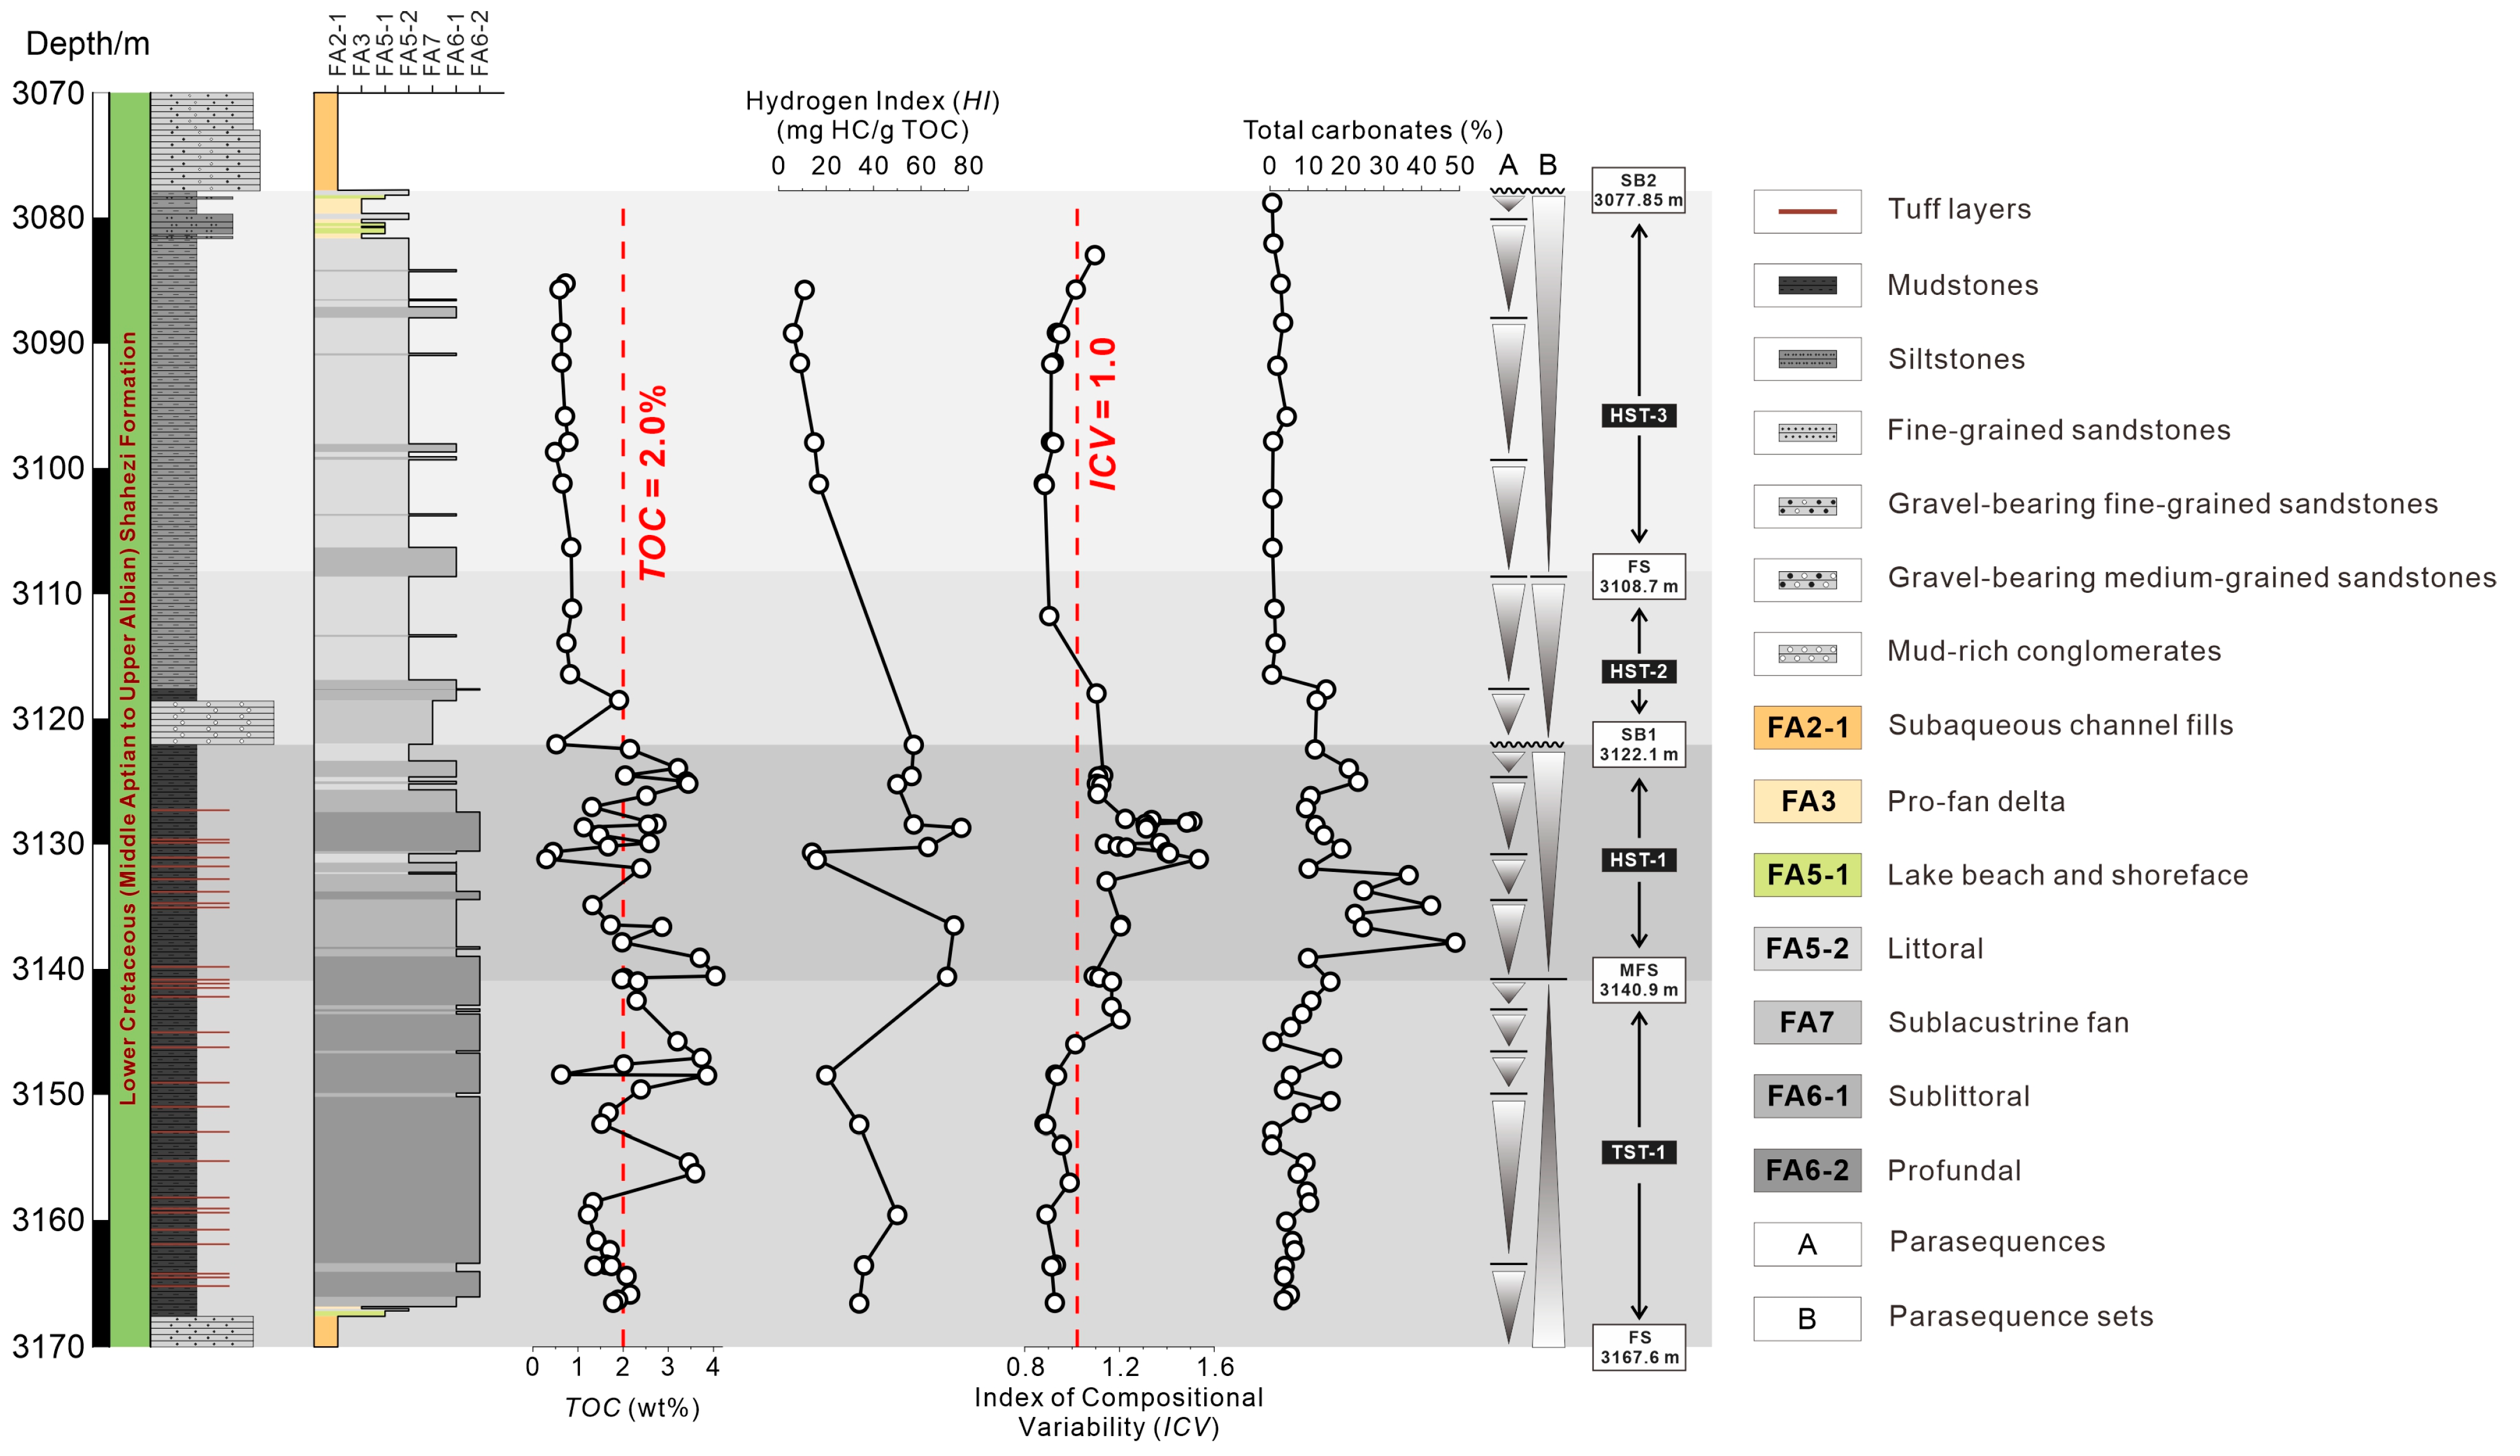
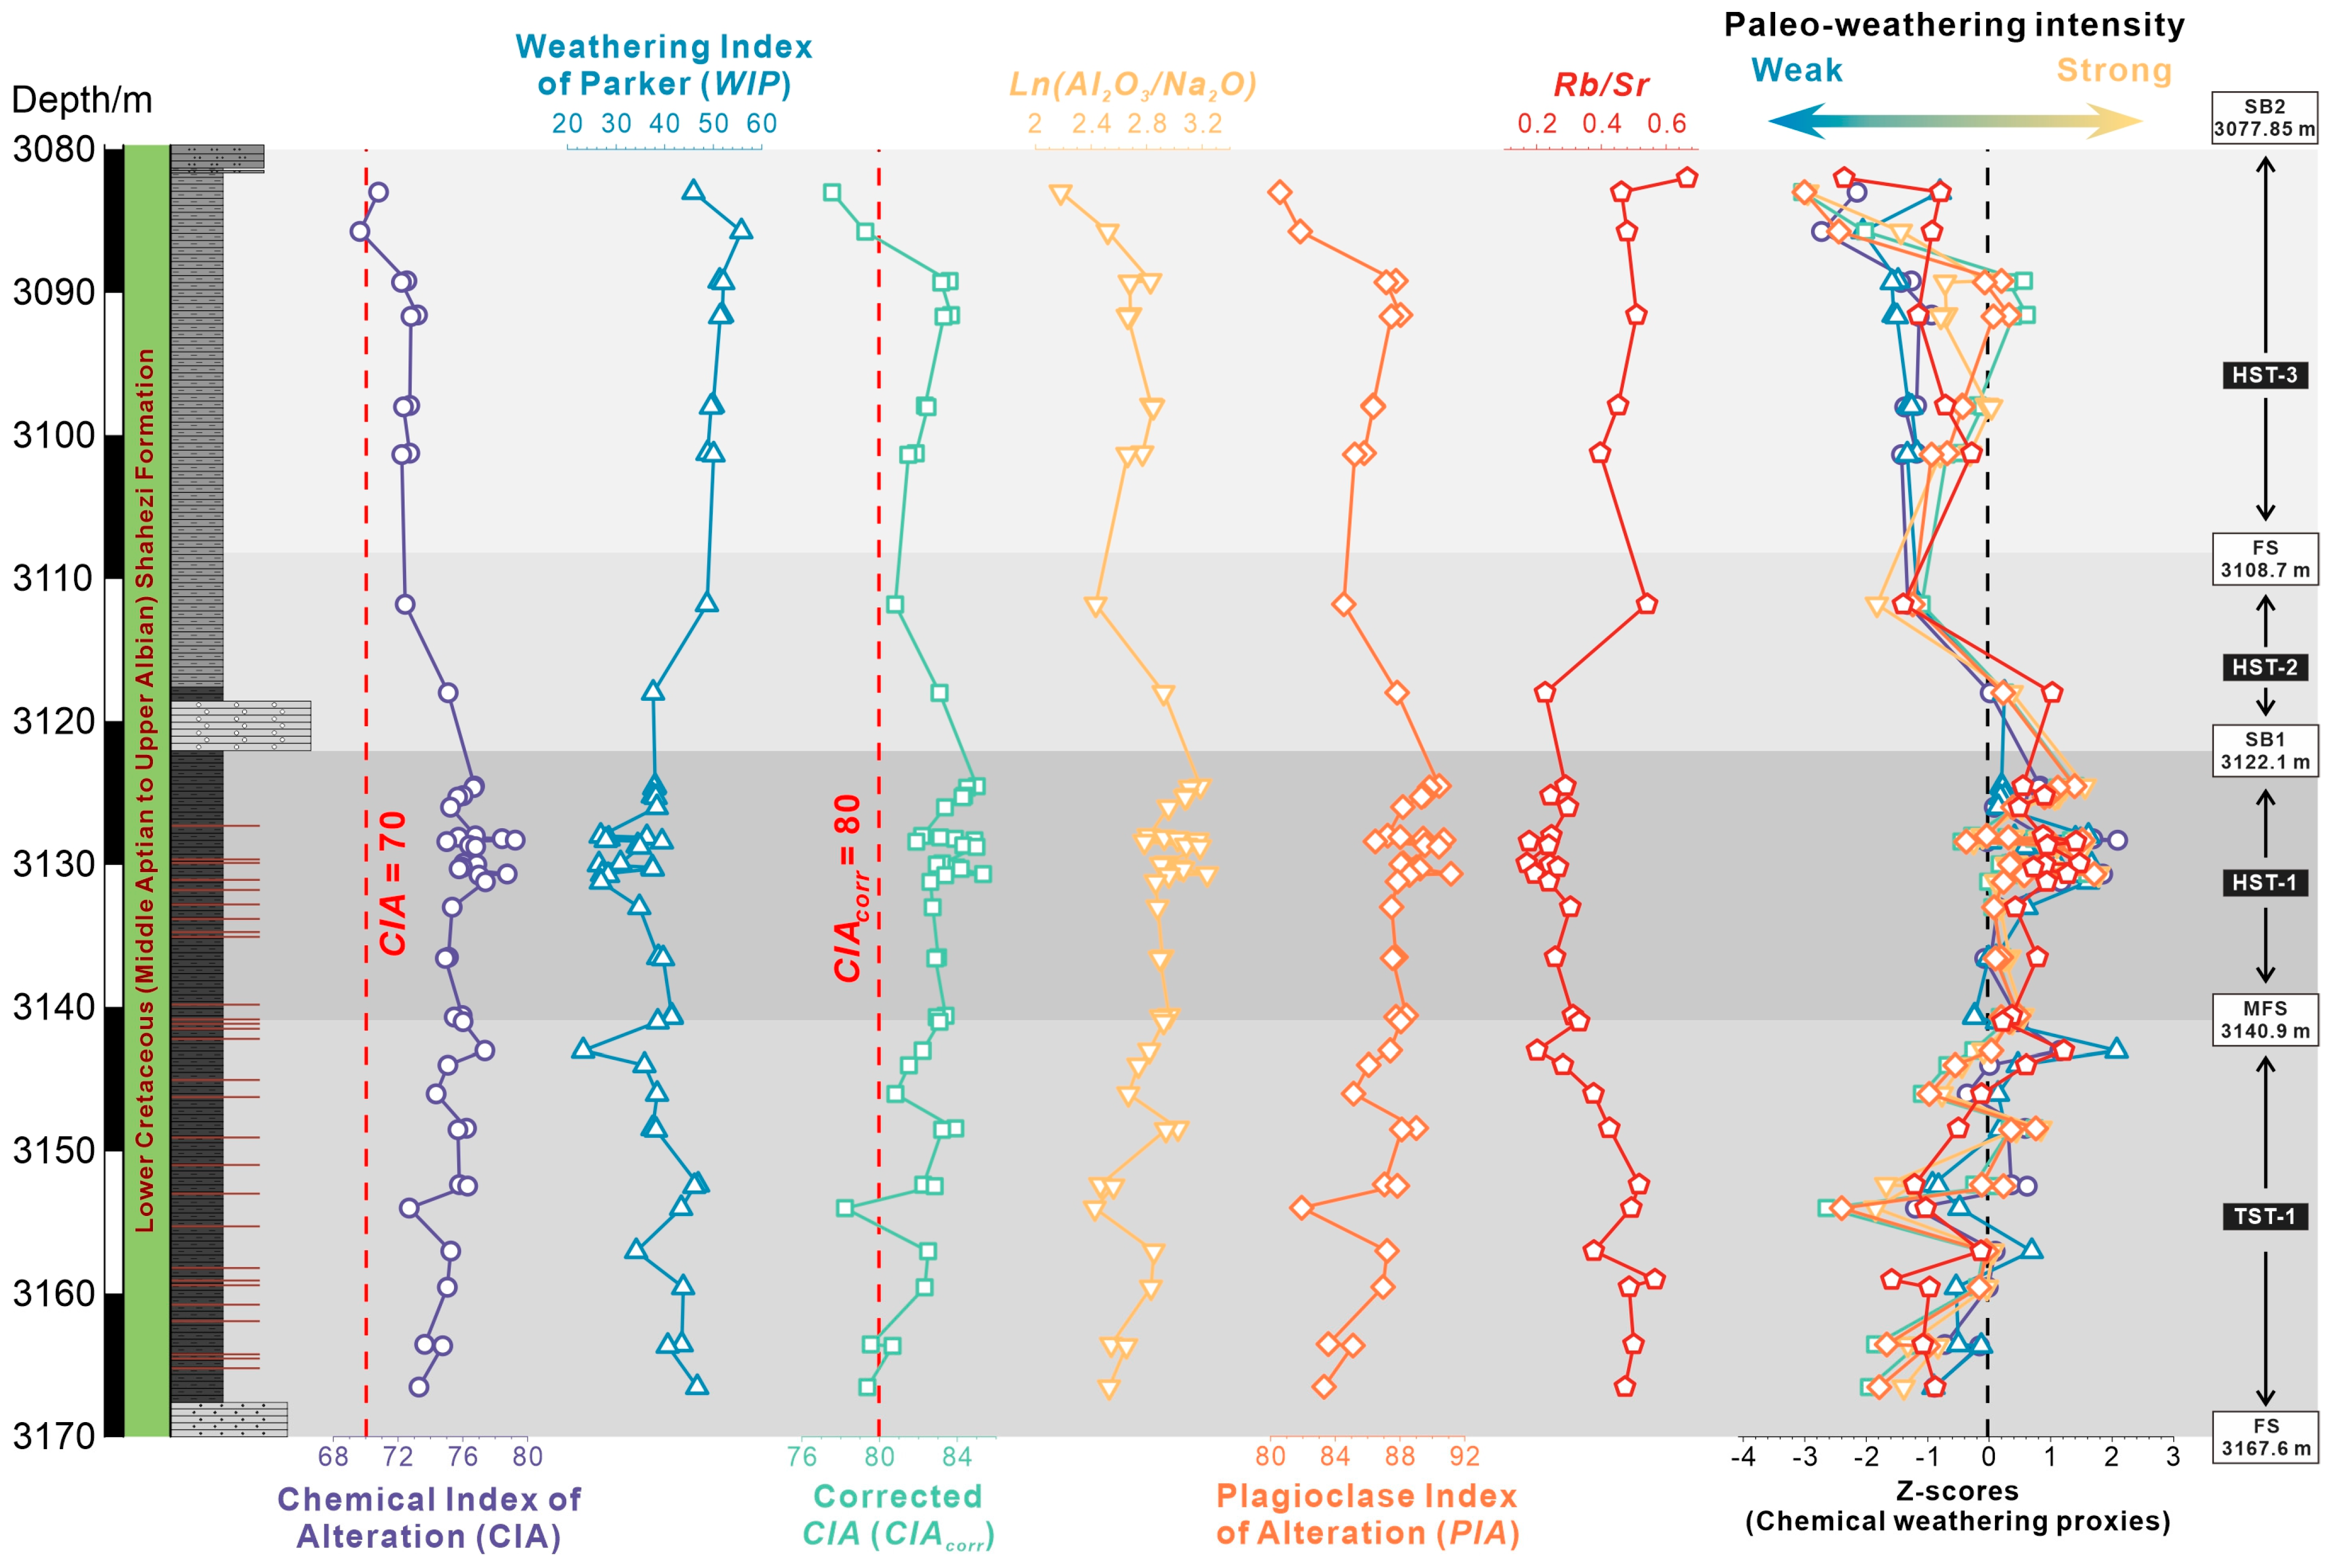
  • Chemical weathering intensity. A comprehensive dataset of the Shahezi Formation mudstones, collected from six boreholes across three rift depressions, was analyzed using a rectangular coordinate system and the least squares method to estimate the actual weathering trend, protolith composition, and pre-metasomatized CIA values on A-CN-K diagrams. The results indicate a dominantly tonalitic protolith (plagioclase/K-feldspar = 5.3). The CIAcorr values range from 77.6 to 85.3, with an average of 82.7, these are higher than the CIA values (69.6 to 79.2, averaging 75.0), and indicate a hot and humid paleoclimate. Furthermore, all weathering proxies exhibited stratigraphic variations from the transgressive systems tract (TST-1) to the highstand systems tract (HST-1 to HST-3). Intense chemical weathering occurred during periods of lake expansion, while two transient arid and cooling events, recorded in HST-2 and HST-3, correspond to phases of low lake levels and the rapid progradation of fan deltas.
  • Paleoclimate conditions. Sedimentological and palynological analyses provide additional support for paleoclimate assessment. The predominance of siliciclastic materials and the absence of dolomite in shoreline strata of the Shahezi Formation suggest that the Lishu paleo-lake developed under wet climatic conditions. Assemblages of algae, ostracods, and palynomorphs further indicate a mid-tropical environment. Overall, a hot and humid subtropical climate, intermittently interrupted by episodes of cooling and aridity, prevailed in the Songliao Basin (NE Asia) during the Early Cretaceous (Middle Aptian–Early Albian).
  • Uncertainty analysis. The method of calculating silicate CaO content, proposed by McLennan (1993), may result in an underestimation of CIA values [59]. Additionally, the K2O correction approach, suggested by Fedo et al. (1995) and Panahi et al. (2000), could reduce the original CIA differences for certain data points [58,95]. Importantly, this correction method is specifically applicable to K addition resulting from the illitization of kaolinite; potassium enrichment derived from the replacement of plagioclase and/or K-feldspar cannot be ignored or adequately corrected using this method. Furthermore, metasomatic K2O addition cannot be simply inferred from deviations of data arrays from the “ideal weathering trend” on A-CN-K diagrams, nor from the presence of abundant authigenic illite and altered plagioclase grains. The decomposition of intraformational detrital K-feldspar can also supply the potassium required for the transformation of smectite or kaolinite to illite, and this process does not necessarily correspond to increases in bulk-rock K2O contents. Therefore, in the absence of robust evidence for external potassium addition, the calculation of “excess K2O” and pre-metasomatized CIA (i.e., CIAcorr) values may be unjustified and could introduce significant errors in the assessment of paleo-weathering intensity.

Author Contributions

Conceptualization, Q.W.; methodology, Q.W.; formal analysis, Q.W. and Y.L.; investigation, Q.W. and Y.L.; data curation, Q.W. and Y.L.; writing—original draft preparation, Q.W.; writing—review and editing, Q.W. and R.H.W.; visualization, Q.W. and Y.L.; supervision, R.H.W.; funding acquisition, Q.W., Y.L. and R.H.W. All authors have read and agreed to the published version of the manuscript.

Funding

This research was financially supported by the National Natural Science Foundation of China (grant numbers 42202179 and U2244207), State Key Laboratory of Shale Oil and Gas Enrichment Mechanisms and Effective Development, State Key Laboratory of Petroleum Resources and Prospecting, China University of Petroleum (grant number PRP/open-2217), China Geological Survey (grant numbers DD20190115 and DD20240201002), the University of Liverpool and China Scholarship Council Awards (grant number 202009110097), and the American Association of Petroleum Geologists Foundation Grants-in-Aid awards.

Data Availability Statement

The data presented in this study are openly available in Mendeley Data: http://dx.doi.org/10.17632/66fr3d2457 (accessed on 20 May 2025).

Acknowledgments

We gratefully acknowledge the Scanning Electron Microscopy Shared Research Facility (SEM-SRF) at the University of Liverpool for supporting this research.

Conflicts of Interest

The authors declare no conflicts of interest.

Appendix A

As shown in Figure A1, the position of the ith sample point in the A-CN-K diagram (Ki, Ai, CNi) can be transformed to its respective orthogonal coordinate (Xi, Yi) using Equation (A1).
X i = 3 3 2 K i + A i Y i = A i
Figure A1. A rectangular coordinate system is established on the A-CN-K ternary diagram to conduct linear regression analysis of the data points. The CN-K axis was assigned as the x-axis with the CN apex set as the origin. The y-axis has the same scale as the A-K axis, corresponding to CIA values. Consequently, the oxide compositions (Ki, Ai, CNi) of the samples can be transformed to their respective orthogonal coordinates (Xi, Yi). This approach allows for a robust determination of the best-fit line and the intersection point P (Kp, Ap, CNp), based on the least squares method.
Hydrology 12 00179 g0a1
According to the principle of the least squares method, the equation of the best-fit line y = wx + b can be determined as follows:
w = i = 1 n X i X ¯ Y i Y ¯ i = 1 n X i X ¯ 2 b = Y ¯ w X ¯
where X ¯ and Y ¯ represent the average values of all Xi and Yi values. A combination of Equations (A1) and (A2) gives an expression of the K2O concentration for the intersection point P:
K p = 3 X p Y p 2 = 1 2 50 b 3 w 50 = 50 w 3 b + 50 3 2 w
The Kp equals the m values proposed by Panahi et al. (2000) [95].

References

  1. Blok, C.N.; Ineson, J.; Anderskouv, K.; Fantasia, A.; Sheldon, E.; Thibault, N.; Jelby, M.E.; Adatte, T.; Bodin, S. Latitude-dependant climate changes across the Aptian Oceanic Anoxic Event 1a. Palaeogeo Palaeoclim. Palaeoecol. 2022, 601, 111085. [Google Scholar] [CrossRef]
  2. Huber, B.T.; Norris, R.D.; MacLeod, K.G. Deep-sea paleotemperature record of extreme warmth during the Cretaceous. Geology 2002, 30, 123–126. [Google Scholar] [CrossRef]
  3. Keller, G. Cretaceous climate, volcanism, impacts, and biotic effects. Cretac. Res. 2008, 29, 754–771. [Google Scholar] [CrossRef]
  4. Wang, Y.; Huang, C.; Sun, B.; Quan, C.; Wu, J.; Lin, Z. Paleo-CO2 variation trends and the Cretaceous greenhouse climate. Earth Sci. Rev. 2014, 129, 136–147. [Google Scholar] [CrossRef]
  5. Amiot, R.; Wang, X.; Zhou, Z.; Wang, X.; Buffetaut, E.; Lécuyer, C.; Ding, Z.; Fluteau, F.; Hibino, T.; Kusuhashi, N.; et al. Oxygen isotopes of East Asian dinosaurs reveal exceptionally cold Early Cretaceous climates. Proc. Natl. Acad. Sci. USA 2011, 108, 5179–5183. [Google Scholar] [CrossRef]
  6. Cavalheiro, L.; Wagner, T.; Steinig, S.; Bottini, C.; Dummann, W.; Esegbue, O.; Gambacorta, G.; Giraldo-Gómez, V.; Farnsworth, A.; Flögel, S.; et al. Impact of global cooling on Early Cretaceous high pCO2 world during the Weissert Event. Nat. Commun. 2021, 12, 5411. [Google Scholar] [CrossRef] [PubMed]
  7. Jenkyns, H.C. Transient cooling episodes during Cretaceous Oceanic Anoxic Events with special reference to OAE 1a (Early Aptian). Philos. Trans. R. Soc. A Math. Phys. Eng. Sci. 2018, 376, 20170073. [Google Scholar] [CrossRef] [PubMed]
  8. Nordt, L.; Breecker, D.; White, J. The early Cretaceous was cold but punctuated by warm snaps resulting from episodic volcanism. Commun. Earth Environ. 2024, 5, 223. [Google Scholar] [CrossRef]
  9. Vickers, M.L.; Jelby, M.E.; Blok, C.N.; Price, G.D.; Jerrett, R.M.; Jensen, M.A.; Jones, M.T. Early Cretaceous giant glendonites: A record of (sub-)millennial-scale cooling? Palaeogeo Palaeoclim. Palaeoecol. 2025, 661, 112739. [Google Scholar] [CrossRef]
  10. Barral, A.; Gomez, B.; Fourel, F.; Daviero-Gomez, V.; Lécuyer, C. CO2 and temperature decoupling at the million-year scale during the Cretaceous Greenhouse. Sci. Rep. 2017, 7, 8310. [Google Scholar] [CrossRef]
  11. Huber, B.T.; MacLeod, K.G.; Watkins, D.K.; Coffin, M.F. The rise and fall of the Cretaceous Hot Greenhouse climate. Glob. Planet. Change 2018, 167, 1–23. [Google Scholar] [CrossRef]
  12. Bodin, S.; Meissner, P.; Janssen, N.M.M.; Steuber, T.; Mutterlose, J. Large igneous provinces and organic carbon burial: Controls on global temperature and continental weathering during the Early Cretaceous. Glob. Planet. Change 2015, 133, 238–253. [Google Scholar] [CrossRef]
  13. Blattler, C.L.; Jenkyns, H.C.; Reynard, L.M.; Henderson, G.M. Significant increases in global weathering during Oceanic Anoxic Events 1a and 2 indicated by calcium isotopes. Earth Planet. Sci. Lett. 2011, 309, 77–88. [Google Scholar] [CrossRef]
  14. Jenkyns, H.C. Cretaceous anoxic events: From continents to oceans. J. Geol. Soc. 1980, 137, 171–188. [Google Scholar] [CrossRef]
  15. Jenkyns, H.C. Geochemistry of oceanic anoxic events. Geochem. Geophys. Geosyst. 2010, 11, 1–30. [Google Scholar] [CrossRef]
  16. Hu, X.; Scott, R.W.; Cai, Y.; Wang, C.; Melinte-Dobrinescu, M.C. Cretaceous oceanic red beds (CORBs): Different time scales and models of origin. Earth Sci. Rev. 2012, 115, 217–248. [Google Scholar] [CrossRef]
  17. Wang, C.; Hu, X.; Huang, Y.; Wagreich, M.; Scott, R.; Hay, W. Cretaceous oceanic red beds as possible consequence of oceanic anoxic events. Sediment. Geol. 2011, 235, 27–37. [Google Scholar] [CrossRef]
  18. He, S.; Wang, T.; Spicer, R.A.; Farnsworth, A.; Mulch, A.; Widdowson, M.; Zhang, Q.; Cai, F.; Valdes, P.J.; Wang, C.; et al. Back to an ice-free future: Early Cretaceous seasonal cycles of sea surface temperature and glacier ice. Sci. Adv. 2025, 11, eadr9417. [Google Scholar] [CrossRef]
  19. Dummann, W.; Steinig, S.; Hofmann, P.; Flögel, S.; Osborne, A.H.; Frank, M.; Herrle, J.O.; Bretschneider, L.; Sheward, R.M.; Wagner, T. The impact of Early Cretaceous gateway evolution on ocean circulation and organic carbon burial in the emerging South Atlantic and Southern Ocean basins. Earth Planet. Sci. Lett. 2020, 530, 115890. [Google Scholar] [CrossRef]
  20. Dummann, W.; Steinig, S.; Hofmann, P.; Lenz, M.; Kusch, S.; Flögel, S.; Herrle, J.O.; Hallmann, C.; Rethemeyer, J.; Kasper, H.U.; et al. Driving mechanisms of organic carbon burial in the Early Cretaceous South Atlantic Cape Basin (DSDP Site 361). Clim. Past 2021, 17, 469–490. [Google Scholar] [CrossRef]
  21. Sun, M.-D.; Lin, Q.; Ramezani, J.; Liu, J.-S.; Lu, Z.-A.; Yang, H.-Q.; Bai, J.-H.; Cai, S.-X.; Chen, J.-C.; Chen, X.-Y.; et al. Terrestrial ecosystem response to Early Cretaceous global environmental change: A calibrated, high-resolution Aptian record from Northeast China. Earth Planet. Sci. Lett. 2025, 653, 119206. [Google Scholar] [CrossRef]
  22. Wang, C.; Gao, Y.; Wang, P.; Wu, H.; Lv, Q.; Zhu, Y.; Wan, X.; Zou, C.; Huang, Y.; Gao, Y.; et al. International continental scientific drilling project of the Songliao Basin: Terrestrial geological records of the Cretaceous dinosaur age. Earth Sci. Front. 2024, 31, 511–534. [Google Scholar]
  23. Bohacs, K.M. Contrasting expressions of depositional sequences in mudrocks from marine to non marine environs. In Shales and Mudstones I. Basin Studies, Sedimentology and Paleontology; Schieber, J., Zimmerle, W., Sethi, P.S., Eds.; Schweizerbart’sche Verlagsbuchhandlung: Stuttgart, Germany, 1998; pp. 32–77. [Google Scholar]
  24. Bohacs, K.M.; Carroll, A.R.; Neal, J.E.; Mankiewicz, P.J.; Gierlowski-Kordesch, E.H.; Kelts, K.R. Lake-basin type, source potential, and hydrocarbon character: An integrated sequence-stratigraphic–geochemical framework. In Lake Basins Through Space and Time; Gierlowski-Kordesch, E.H., Kelts, K.R., Eds.; American Association of Petroleum Geologists: Tulsa, OK, USA, 2000; Volume 46, pp. 3–33. [Google Scholar]
  25. Cardoso, A.R.; Nogueira, A.C.R.; Rabelo, C.E.N. Lake cyclicity as response to thermal subsidence: A post-CAMP scenario in the Parnaíba Basin, NE Brazil. Sediment. Geol. 2019, 385, 96–109. [Google Scholar] [CrossRef]
  26. Cardoso, A.R.; Romero, G.R.; Osés, G.L.; Nogueira, A.C.R. Taphonomy of lacustrine fish fossils of the Parnaíba Basin, northeastern Brazil: Spatial and causative relations of Konservat Lagerstätten in West Gondwana during Jurassic-Cretaceous. Palaeogeo Palaeoclim. Palaeoecol. 2020, 542, 109602. [Google Scholar] [CrossRef]
  27. Haggart, J.W.; Matsukawa, M.; Ito, M. Paleogeographic and paleoclimatic setting of Lower Cretaceous basins of East Asia and western North America, with reference to the nonmarine strata. Cretac. Res. 2006, 27, 149–167. [Google Scholar] [CrossRef]
  28. Xu, Q.-H.; Wang, L.; Liu, J.; Deloule, E.; Hanski, E.; Gu, X.-Y.; Chen, H.; Xia, Q.-K. Linking the Jehol Biota evolution to the Early Cretaceous volcanism during the North China Craton destruction: Insights From F, Cl, S, and P. J. Geophys. Res. Solid Earth 2022, 127, e2022JB024388. [Google Scholar] [CrossRef]
  29. Kuypers, M.M.M.; Pancost, R.D.; Nijenhuis, I.A.; Sinninghe Damsté, J.S. Enhanced productivity led to increased organic carbon burial in the euxinic North Atlantic basin during the late Cenomanian oceanic anoxic event. Paleoceanography 2002, 17, 1051. [Google Scholar] [CrossRef]
  30. Leckie, R.M.; Bralower, T.J.; Cashman, R. Oceanic anoxic events and plankton evolution: Biotic response to tectonic forcing during the mid-Cretaceous. Paleoceanography 2002, 17, 13-11–13-29. [Google Scholar] [CrossRef]
  31. Wang, P.-J.; Mattern, F.; Didenko, N.A.; Zhu, D.-F.; Singer, B.; Sun, X.-M. Tectonics and cycle system of the Cretaceous Songliao Basin: An inverted active continental margin basin. Earth Sci. Rev. 2016, 159, 82–102. [Google Scholar] [CrossRef]
  32. Wang, Q.; Li, Y.; Sanei, H.; Gardner, J.; Rudra, A.; Utley, J.E.P.; Worden, R.H. Lacustrine and fan-delta sediments in syn-rift lake basins. Depos. Rec. 2025, 11, 857–892. [Google Scholar] [CrossRef]
  33. Wang, Q.; Li, Y.; Utley, J.E.P.; Gardner, J.; Liu, B.; Hu, J.; Shao, L.; Wang, X.; Gao, F.; Liu, D.; et al. Terrestrial dominance of organic carbon in an Early Cretaceous syn-rift lake and its correlation with depositional sequences and paleoclimate. Sediment. Geol. 2023, 455, 106472. [Google Scholar] [CrossRef]
  34. Xiao, B.; Xiong, L.; Zhao, Z.; Fu, X.; Zhao, Z.; Hou, H.; Liu, S. Late Ordovician-Early Silurian extension of the northern margin of the Upper Yangtze Platform (South China) and its impact on organic matter accumulation. J. Petrol. Sci. Eng. 2023, 220, 111238. [Google Scholar] [CrossRef]
  35. Zhou, T.; Cai, J.; Mou, S.; Zhao, Q.; Shi, Z.; Sun, S.; Guo, W.; Gao, J.; Cheng, F.; Wang, H.; et al. Influence of low-temperature hydrothermal events and basement fault system on low-resistivity shale reservoirs: A case study from the Upper Ordovician to Lower Silurian in the Sichuan Basin, SW China. Minerals 2023, 13, 720. [Google Scholar] [CrossRef]
  36. Fang, D.; Wang, Z.; Jin, G.; Gao, R.; Ye, D.; Xie, J. Cretaceous magnetostratigraphy in the Songliao Basin, China. Sci. China Ser. B-Chem. Life Sci. Earth Sci. 1990, 33, 246–256. [Google Scholar]
  37. Wang, H.; Li, R.; Zhu, J.; Yang, X. Origin and evolution of unconformities in a continental rift basin: A case study from the Lishu Depression in Songliao Basin, China. Can. J. Earth Sci. 2021, 58, 1085–1102. [Google Scholar] [CrossRef]
  38. Wang, H.; Fan, T.; Wu, Y. The subsurface structure and stratigraphic architecture of rift-related units in the Lishu Depression of the Songliao Basin, China. J. Asian Earth Sci. 2015, 99, 13–29. [Google Scholar] [CrossRef]
  39. Yang, X.; Wang, H.; Li, Z.; Guan, C.; Wang, X. Tectonic-sedimentary evolution of a continental rift basin: A case study of the Early Cretaceous Changling and Lishu fault depressions, southern Songliao Basin, China. Mar. Petrol. Geol. 2021, 128, 105068. [Google Scholar] [CrossRef]
  40. Liu, H.; Wang, P.; Gao, Y.; Hou, H.; Yin, Y.; Li, H.; Feng, Y. New data from ICDP borehole SK2 and its constraint on the beginning of the Lower Cretaceous Shahezi Formation in the Songliao Basin, NE China. Sci. Bull. 2021, 66, 411–413. [Google Scholar] [CrossRef]
  41. Yu, Z.; He, H.; Deng, C.; Lu, K.; Shen, Z.; Li, Q. New SIMS U-Pb geochronology for the Shahezi Formation from CCSD-SK-IIe borehole in the Songliao Basin, NE China. Sci. Bull. 2020, 65, 1049–1051. [Google Scholar] [CrossRef]
  42. Ma, X.; Li, S.; Chu, R.; Fang, Q.; Shi, M.; Wu, H. An astronomical time scale for the Early Cretaceous continental strata in the Songliao Basin, Northeastern China. Quat. Sci. 2023, 43, 1573–1583, (In Chinese with English abstract). [Google Scholar]
  43. Wang, Q.; Yang, W.; Li, Y.; Jiang, Z.; Wen, M.; Zuo, R.; Wang, X.; Xue, Z.; Wang, Y. In-situ fluid phase variation along the thermal maturation gradient in shale petroleum systems and its impact on well production performance. J. Earth Sci. 2023, 34, 985–1001. [Google Scholar] [CrossRef]
  44. Wang, Q.; Li, Y.; Sanei, H.; Rudra, A.; Yuan, M.; Wang, Y.; Huang, Y.; Worden, R.H. Restoration of buried organic carbon for catagenesis-affected rocks using Rock-Eval thermal analysis: Assumptions, performance, and uncertainty analysis. Earth Sci. Rev. 2025, 267, 105155. [Google Scholar] [CrossRef]
  45. Cohen, A.S. Paleolimnology: The History and Evolution of Lake Systems; Oxford University Press: Oxford, UK, 2003; p. 528. [Google Scholar]
  46. Kelts, K. Environments of deposition of lacustrine petroleum source rocks: An introduction. Geol. Soc. Lond. Spec. Publ. 1988, 40, 3–26. [Google Scholar] [CrossRef]
  47. Pietras, J.T.; Carroll, A.R. High-resolution stratigraphy of an underfilled lake basin: Wilkins Peak Member, Eocene Green River Formation, Wyoming, U.S.A. J. Sediment. Res. 2006, 76, 1197–1214. [Google Scholar] [CrossRef]
  48. Renaut, R.W.; Gierlowski-Kordesch, E.H. Lakes. In Facies Models 4; James, N.P., Dalrymple, R.W., Eds.; Geological Association of Canada: St. John’s, NL, Canada, 2010; pp. 541–575. [Google Scholar]
  49. Vallati, M.; Tomás, S.; Galli, C.; Winterleitner, G.; Mutti, M. Depositional controls in an ancient, closed lake system: A high-resolution and multi-scalar case study from the Yacoraite Formation (Salta Basin, Argentina). Sediment. Geol. 2023, 454, 106456. [Google Scholar] [CrossRef]
  50. Chen, X.; Fan, J.-x.; Zhang, Y.-d.; Wang, H.-y.; Chen, Q.; Wang, W.-h.; Liang, F.; Guo, W.; Zhao, Q.; Nie, H.-k.; et al. Subdivision and delineation of the Wufeng and Lungmachi black shales in the subsurface areas of the Yangtze Platform. J. Stratigr. 2015, 39, 351–358, (In Chinese with English abstract). [Google Scholar]
  51. Chen, X.; Rong, J.-y.; Li, Y.; Boucot, A.J. Facies patterns and geography of the Yangtze region, South China, through the Ordovician and Silurian transition. Palaeogeo Palaeoclim. Palaeoecol. 2004, 204, 353–372. [Google Scholar]
  52. Chen, X.; Zhang, Y.; Li, Y.; Fan, J. Geological Setting of the Ordovician and Silurian Strata of the Yangtze Platform. In Latest Ordovician to Early Silurian Shale Gas Strata of the Yangtze Region, China; Chen, X., Wang, H., Goldman, D., Eds.; Springer Nature: Singapore, 2023; pp. 7–17. [Google Scholar]
  53. Fan, J.; Melchin, M.J.; Chen, X.; Wang, Y.; Zhang, Y.; Chen, Q.; Chi, Z.; Chen, F. Biostratigraphy and geography of the Ordovician-Silurian Lungmachi black shales in South China. Sci. China Earth Sci. 2011, 54, 1854–1863. [Google Scholar] [CrossRef]
  54. Hu, X.; Müller, I.A.; Zhao, A.; Ziegler, M.; Chen, Q.; Han, L.; Shi, Z. Clumped isotope thermometry reveals diagenetic origin of the dolomite layer within late Ordovician black shale of the Guanyinqiao Bed (SW China). Chem. Geol. 2022, 588, 120641. [Google Scholar] [CrossRef]
  55. Zou, C.; Qiu, Z.; Poulton, S.W.; Dong, D.; Wang, H.; Chen, D.; Lu, B.; Shi, Z.; Tao, H. Ocean euxinia and climate change “double whammy” drove the Late Ordovician mass extinction. Geology 2018, 46, 535–538. [Google Scholar] [CrossRef]
  56. Nesbitt, H.W.; Young, G.M. Early Proterozoic climates and plate motions inferred from major element chemistry of lutites. Nature 1982, 299, 715–717. [Google Scholar] [CrossRef]
  57. Nesbitt, H.W.; Young, G.M. Formation and diagenesis of weathering profiles. J. Geol. 1989, 97, 129–147. [Google Scholar] [CrossRef]
  58. Fedo, C.M.; Wayne Nesbitt, H.; Young, G.M. Unraveling the effects of potassium metasomatism in sedimentary rocks and paleosols, with implications for paleoweathering conditions and provenance. Geology 1995, 23, 921–924. [Google Scholar] [CrossRef]
  59. McLennan, S.M. Weathering and global denudation. J. Geol. 1993, 101, 295–303. [Google Scholar] [CrossRef]
  60. Cox, R.; Lowe, D.R.; Cullers, R.L. The influence of sediment recycling and basement composition on evolution of mudrock chemistry in the southwestern United States. Geochim. Cosmo Acta 1995, 59, 2919–2940. [Google Scholar] [CrossRef]
  61. Cullers, R.L.; Podkovyrov, V.N. Geochemistry of the Mesoproterozoic Lakhanda shales in southeastern Yakutia, Russia: Implications for mineralogical and provenance control, and recycling. Precambrian Res. 2000, 104, 77–93. [Google Scholar] [CrossRef]
  62. Ma, Y.; Fan, M.; Lu, Y.; Liu, H.; Hao, Y.; Xie, Z.; Liu, Z.; Peng, L.; Du, X.; Hu, H. Climate-driven paleolimnological change controls lacustrine mudstone depositional process and organic matter accumulation: Constraints from lithofacies and geochemical studies in the Zhanhua Depression, eastern China. Int. J. Coal Geol. 2016, 167, 103–118. [Google Scholar] [CrossRef]
  63. Montero-Serrano, J.-C.; Föllmi, K.B.; Adatte, T.; Spangenberg, J.E.; Tribovillard, N.; Fantasia, A.; Suan, G. Continental weathering and redox conditions during the early Toarcian Oceanic Anoxic Event in the northwestern Tethys: Insight from the Posidonia Shale section in the Swiss Jura Mountains. Palaeogeo Palaeoclim. Palaeoecol. 2015, 429, 83–99. [Google Scholar] [CrossRef]
  64. von Eynatten, H.; Barceló-Vidal, C.; Pawlowsky-Glahn, V. Modelling compositional change: The example of chemical weathering of granitoid rocks. Math. Geol. 2003, 35, 231–251. [Google Scholar] [CrossRef]
  65. Parker, A. An index of weathering for silicate rocks. Geol. Mag. 1970, 107, 501–504. [Google Scholar] [CrossRef]
  66. Garzanti, E.; Padoan, M.; Setti, M.; Najman, Y.; Peruta, L.; Villa, I.M. Weathering geochemistry and Sr-Nd fingerprints of equatorial upper Nile and Congo muds. Geochem. Geophys. Geosyst. 2013, 14, 292–316. [Google Scholar] [CrossRef]
  67. Fathy, D.; Wagreich, M.; Ntaflos, T.; Sami, M. Paleoclimatic variability in the southern Tethys, Egypt: Insights from the mineralogy and geochemistry of Upper Cretaceous lacustrine organic-rich deposits. Cretac. Res. 2021, 126, 104880. [Google Scholar] [CrossRef]
  68. Zhang, X.; Ji, X.; Han, X.; Wang, W.; Wang, X.; Li, S. Anomalously low silicate weathering in the North China Craton during the hydroclimatic crisis of the Oceanic Anoxic Event 1a interval. Sedimentology 2025, 72, 1205–1232. [Google Scholar] [CrossRef]
  69. Sawyer, E.W. The influence of source rock type, chemical weathering and sorting on the geochemistry of clastic sediments from the Quetico Metasedimentary Belt, Superior Province, Canada. Chem. Geol. 1986, 55, 77–95. [Google Scholar] [CrossRef]
  70. Huang, M.; Liu, Y.-n.; Chen, F.-r.; Tao, Y.; Sun, Y.-m. Correlations of chemical weathering indicators with major chemical constituents in sediments to obtain palaeoclimate information from Chaohu Lake, China. Sci. Rep. 2024, 14, 17258. [Google Scholar] [CrossRef] [PubMed]
  71. Jin, Z.; Wang, S.; Shen, J.; Zhang, E.; Li, F.; Ji, J.; Lu, X. Chemical weathering since the Little Ice Age recorded in lake sediments: A high-resolution proxy of past climate. Earth Surf. Process. Landf. 2001, 26, 775–782. [Google Scholar] [CrossRef]
  72. Zhang, X.; Li, S. A lacustrine record of the early Aptian climate change by oceanic anoxic event (OAE) 1a in the Jiaolai Basin, Eastern China. J. Asian Earth Sci. 2020, 203, 104537. [Google Scholar] [CrossRef]
  73. Duggen, S.; Croot, P.; Schacht, U.; Hoffmann, L. Subduction zone volcanic ash can fertilize the surface ocean and stimulate phytoplankton growth: Evidence from biogeochemical experiments and satellite data. Geophys. Res. Lett. 2007, 34, L01612. [Google Scholar] [CrossRef]
  74. Wang, Q. Chemical Sequence Stratigraphy and Shale Gas Sweet Spot Research of Wufeng Formation to Lower Member of Longmaxi Formation in Upper Yangtz Area. Ph.D. Thesis, China University of Geosciences (Beijing), Beijing, China, 2021. [Google Scholar]
  75. Taylor, S.R.; McLennan, S.M. The Continental Crust: Its Composition and Evolution An Examination of the Geochemical Record Preserved in Sedimentary Rocks; Blackwell Scientific Publications: Oxford, UK, 1985; p. 312. [Google Scholar]
  76. Tribovillard, N.; Algeo, T.J.; Lyons, T.; Riboulleau, A. Trace metals as paleoredox and paleoproductivity proxies: An update. Chem. Geol. 2006, 232, 12–32. [Google Scholar] [CrossRef]
  77. Boynton, W.V. Chapter 3—Cosmochemistry of the Rare Earth Elements: Meteorite Studies. In Developments in Geochemistry; Henderson, P., Ed.; Elsevier: Amsterdam, The Netherlands, 1984; Volume 2, pp. 63–114. [Google Scholar]
  78. McLennan, S.M. Rare earth elements in sedimentary rocks; influence of provenance and sedimentary processes. Rev. Miner. Geochem. 1989, 21, 169–200. [Google Scholar]
  79. Bhatia, M.R.; Crook, K.A.W. Trace element characteristics of graywackes and tectonic setting discrimination of sedimentary basins. Contrib. Mineral. Petrol. 1986, 92, 181–193. [Google Scholar] [CrossRef]
  80. Floyd, P.A.; Leveridge, B.E. Tectonic environment of the Devonian Gramscatho basin, south Cornwall: Framework mode and geochemical evidence from turbiditic sandstones. J. Geol. Soc. 1987, 144, 531–542. [Google Scholar] [CrossRef]
  81. McLennan, S.M. Relationships between the trace element composition of sedimentary rocks and upper continental crust. Geochem. Geophys. Geosyst. 2001, 2, 2000GC000109. [Google Scholar] [CrossRef]
  82. Khanchuk, A.I.; Kemkin, I.V.; Kruk, N.N. The Sikhote-Alin orogenic belt, Russian South East: Terranes and the formation of continental lithosphere based on geological and isotopic data. J. Asian Earth Sci. 2016, 120, 117–138. [Google Scholar] [CrossRef]
  83. Cogné, J.-P.; Kravchinsky, V.A.; Halim, N.; Hankard, F. Late Jurassic-Early Cretaceous closure of the Mongol-Okhotsk Ocean demonstrated by new Mesozoic palaeomagnetic results from the Trans-Baïkal area (SE Siberia). Geophys. J. Int. 2005, 163, 813–832. [Google Scholar] [CrossRef]
  84. Kravchinsky, V.A.; Cogné, J.-P.; Harbert, W.P.; Kuzmin, M.I. Evolution of the Mongol-Okhotsk Ocean as constrained by new palaeomagnetic data from the Mongol-Okhotsk suture zone, Siberia. Geophys. J. Int. 2002, 148, 34–57. [Google Scholar] [CrossRef]
  85. Van der Voo, R.; van Hinsbergen, D.J.J.; Domeier, M.; Spakman, W.; Torsvik, T.H.; Anderson, T.H.; Didenko, A.N.; Johnson, C.L.; Khanchuk, A.I.; MacDonald, J.H., Jr. Latest Jurassic–earliest Cretaceous closure of the Mongol-Okhotsk Ocean: A paleomagnetic and seismological-tomographic analysis. In Late Jurassic Margin of Laurasia–A Record of Faulting Accommodating Plate Rotation; Geological Society of America: Boulder, CO, USA, 2015; Volume 513, pp. 589–606. [Google Scholar]
  86. Zorin, Y.A. Geodynamics of the western part of the Mongolia–Okhotsk collisional belt, Trans-Baikal region (Russia) and Mongolia. Tectonophysics 1999, 306, 33–56. [Google Scholar] [CrossRef]
  87. Zhu, G.; Jiang, D.; Zhang, B.; Chen, Y. Destruction of the eastern North China Craton in a backarc setting: Evidence from crustal deformation kinematics. Gondwana Res. 2012, 22, 86–103. [Google Scholar] [CrossRef]
  88. Zhu, R.; Xu, Y.; Zhu, G.; Zhang, H.; Xia, Q.; Zheng, T. Destruction of the North China Craton. Sci. China Earth Sci. 2012, 55, 1565–1587. [Google Scholar] [CrossRef]
  89. Meng, Q.-R.; Zhou, Z.-H.; Zhu, R.-X.; Xu, Y.-G.; Guo, Z.-T. Cretaceous basin evolution in northeast Asia: Tectonic responses to the paleo-Pacific plate subduction. Natl. Sci. Rev. 2021, 9, nwab088. [Google Scholar] [CrossRef]
  90. Bhatia, M.R. Rare earth element geochemistry of Australian Paleozoic graywackes and mudrocks: Provenance and tectonic control. Sediment. Geol. 1985, 45, 97–113. [Google Scholar] [CrossRef]
  91. Taylor, S.R.; Rudnick, R.L.; McLennan, S.M.; Eriksson, K.A. Rare earth element patterns in Archean high-grade metasediments and their tectonic significance. Geochim. Cosmo Acta 1986, 50, 2267–2279. [Google Scholar] [CrossRef]
  92. Hayashi, K.-I.; Fujisawa, H.; Holland, H.D.; Ohmoto, H. Geochemistry of ∼1.9 Ga sedimentary rocks from northeastern Labrador, Canada. Geochim. Cosmo Acta 1997, 61, 4115–4137. [Google Scholar] [CrossRef] [PubMed]
  93. Algeo, T.J.; Hong, H.; Wang, C. The chemical index of alteration (CIA) and interpretation of ACNK diagrams. Chem. Geol. 2025, 671, 122474. [Google Scholar] [CrossRef]
  94. Panahi, A.; Young, G.M. A geochemical investigation into the provenance of the Neoproterozoic Port Askaig Tillite, Dalradian Supergroup, western Scotland. Precambrian Res. 1997, 85, 81–96. [Google Scholar] [CrossRef]
  95. Panahi, A.; Young, G.M.; Rainbird, R.H. Behavior of major and trace elements (including REE) during Paleoproterozoic pedogenesis and diagenetic alteration of an Archean granite near Ville Marie, Québec, Canada. Geochimica Cosmo Acta 2000, 64, 2199–2220. [Google Scholar] [CrossRef]
  96. Nesbitt, H.W.; Young, G.M. Prediction of some weathering trends of plutonic and volcanic rocks based on thermodynamic and kinetic considerations. Geochimica Cosmo Acta 1984, 48, 1523–1534. [Google Scholar] [CrossRef]
  97. Yang, D. Depositional Environment of the Muddy Shales in the Shahezi Formation, Changling Fault Depression. Master’s Thesis, China University of Petroleum (Beijing), Beijing, China, 2019. [Google Scholar]
  98. Wedepohl, K.H. Environmental influences on the chemical composition of shales and clays. Phys. Chem. Earth 1971, 8, 307–333. [Google Scholar] [CrossRef]
  99. McLennan, S.M.; Bock, B.; Hemming, S.R.; Hurowitz, J.A.; Lev, S.M.; McDaniel, D.K. The roles of provenance sedimentary processes in the geochemistry of sedimentary rocks. In Geochemistry of Sediments and Sedimentary Rocks: Evolutionary Considerations to Mineral Deposit-Forming Environments; Lentz, D.R., Ed.; Geological Association of Canada: Toronto, ON, Canada, 2003; GeoText 4 GeoText 4; pp. 7–38. [Google Scholar]
  100. van de Kamp, P.C. Potassium distribution and metasomatism in pelites and schists: How and when, relation to postdepositional events. J. Sediment. Res. 2016, 86, 683–711. [Google Scholar] [CrossRef]
  101. Zhang, B.; Wignall, P.B.; Yao, S.; Hu, W.; Liu, B. Collapsed upwelling and intensified euxinia in response to climate warming during the Capitanian (Middle Permian) mass extinction. Gondwana Res. 2021, 89, 31–46. [Google Scholar] [CrossRef]
  102. Li, C.; Yang, S. Is chemical index of alteration (CIA) a reliable proxy for chemical weathering in global drainage basins? Am. J. Sci. 2010, 310, 111–127. [Google Scholar] [CrossRef]
  103. White, A.F.; Blum, A.E. Effects of climate on chemical weathering in watersheds. Geochimica Cosmo Acta 1995, 59, 1729–1747. [Google Scholar] [CrossRef]
  104. Singer, A. The paleoclimatic interpretation of clay minerals in soils and weathering profiles. Earth Sci. Rev. 1980, 15, 303–326. [Google Scholar] [CrossRef]
  105. Harper, D.T.; Suarez, M.B.; Uglesich, J.; You, H.; Li, D.; Dodson, P. Aptian–Albian clumped isotopes from northwest China: Cool temperatures, variable atmospheric pCO2 and regional shifts in the hydrologic cycle. Clim. Past 2021, 17, 1607–1625. [Google Scholar] [CrossRef]
  106. Ludvigson, G.A.; Joeckel, R.M.; Murphy, L.R.; Stockli, D.F.; González, L.A.; Suarez, C.A.; Kirkland, J.I.; Al-Suwaidi, A. The emerging terrestrial record of Aptian-Albian global change. Cretac. Res. 2015, 56, 1–24. [Google Scholar] [CrossRef]
  107. Bonis, N.R.; Kürschner, W.M. Vegetation history, diversity patterns, and climate change across the Triassic/Jurassic boundary. Paleobiology 2012, 38, 240–264. [Google Scholar] [CrossRef]
  108. Wiggins, W.D.; Harris, P.M. Lithofacies, depositional cycles, and stratigraphy of the Lower Green River Formation, southwestern Uinta Basin, Utah. In Lacustrine Reservoirs and Depositional Systems; Lomando, A.J., Schreiber, B.C., Harris, P.M., Eds.; SEPM Society for Sedimentary Geology: Claremore, OK, USA, 1994; Volume 19, pp. 105–141. [Google Scholar]
  109. Yan, W.; Fan, T.; Wang, H.; Zhu, C.; Gao, Z.; Meng, X.; Sun, Y.; Yang, F. Micropaleontology and palaeoclimate during the early Cretaceous in the Lishu depression, Songliao basin, Northeast China. Geosci. Front. 2017, 8, 93–106. [Google Scholar] [CrossRef]
  110. Zhang, D.; Zheng, Y.; Zhang, S.; Zhang, J.; Huang, X.; Chen, S.; Sun, L. Early Cretaceous spore-pollen assemblages from the Shahezi Formation in Well SK-2 and their paleoclimate significance. Geol. Bull. China 2024, 43, 429–442, (In Chinese with English abstract). [Google Scholar]
  111. Fedo, C.M.; Young, G.M.; Nesbitt, H.W.; Hanchar, J.M. Potassic and sodic metasomatism in the Southern Province of the Canadian Shield: Evidence from the Paleoproterozoic Serpent Formation, Huronian Supergroup, Canada. Precambrian Res. 1997, 84, 17–36. [Google Scholar] [CrossRef]
  112. Glazner, A.F. Stratigraphy, structure, and potassic alteration of Miocene volcanic rocks in the Sleeping Beauty area, central Mojave Desert, California. Geol. Soc. Am. Bull. 1988, 100, 424–435. [Google Scholar] [CrossRef]
  113. Mensing, T.M.; Faure, G. Identification and age of neoformed Paleozoic feldspar (adularia) in a Precambrian basement core from Scioto County, Ohio, USA. Contrib. Mineral. Petrol. 1983, 82, 327–333. [Google Scholar] [CrossRef]
  114. Rafiei, M.; Kennedy, M. Weathering in a world without terrestrial life recorded in the Mesoproterozoic Velkerri Formation. Nat. Commun. 2019, 10, 3448. [Google Scholar] [CrossRef] [PubMed]
  115. Xu, X.-T.; Shao, L.-Y.; Lan, B.; Wang, S.; Hilton, J.; Qin, J.-Y.; Hou, H.-H.; Zhao, J. Continental chemical weathering during the Early Cretaceous Oceanic Anoxic Event (OAE1b): A case study from the Fuxin fluvio-lacustrine basin, Liaoning Province, NE China. J. Palaeogeogr. 2020, 9, 12. [Google Scholar] [CrossRef]
  116. Yan, D.; Chen, D.; Wang, Q.; Wang, J. Large-scale climatic fluctuations in the latest Ordovician on the Yangtze block, south China. Geology 2010, 38, 599–602. [Google Scholar] [CrossRef]
  117. Du, W.; Yang, W.; Li, X.; Shi, F.; Lin, R.; Wang, Y.; Zhang, D.; Chen, Y.; Sun, Z.; Zhao, F. Differential Reservoir-Forming Mechanisms of the Lower Paleozoic Wufeng-Longmaxi and Niutitang Marine Gas Shales in Northern Guizhou Province, SW China: Theories and Models. Energies 2022, 15, 5137. [Google Scholar] [CrossRef]
  118. Gao, P.; He, Z.L.; Li, S.J.; Lash, G.G.; Li, B.Y.; Huang, B.Y.; Yan, D.T. Volcanic and hydrothermal activities recorded in phosphate nodules from the Lower Cambrian Niutitang Formation black shales in South China. Palaeogeo Palaeoclim. Palaeoecol. 2018, 505, 381–397. [Google Scholar] [CrossRef]
  119. Wu, Y.; Tian, H.; Gong, D.; Li, T.; Zhou, Q. Paleo-environmental variation and its control on organic matter enrichment of black shales from shallow shelf to slope regions on the Upper Yangtze Platform during Cambrian Stage 3. Palaeogeo Palaeoclim. Palaeoecol. 2020, 545, 109653. [Google Scholar] [CrossRef]
  120. Pirajno, F. Effects of metasomatism on mineral systems and their host rocks: Alkali metasomatism, skarns, greisens, tourmalinites, rodingites, black-wall alteration and listvenites. In Metasomatism and the Chemical Transformation of Rock: The Role of Fluids in Terrestrial and Extraterrestrial Processes; Springer: Berlin/Heidelberg, Germany, 2013; pp. 203–251. [Google Scholar]
  121. Lei, Z.; Dashtgard, S.E.; Wang, J.; Li, M.; Feng, Q.; Yu, Q.; Zhao, A.; Du, L. Origin of chert in Lower Silurian Longmaxi Formation: Implications for tectonic evolution of Yangtze Block, South China. Palaeogeo Palaeoclim. Palaeoecol. 2019, 529, 53–66. [Google Scholar] [CrossRef]
  122. Qiu, Z.; Li, Y.; Xiong, W.; Fan, T.; Zhao, Q.; Zhang, Q.; Wang, Y.; Liu, W.; Liang, F.; Zhang, J.; et al. Revisiting paleoenvironmental changes on the Upper Yangtze Block during the Ordovician-Silurian transition: New insights from elemental geochemistry. Sediment. Geol. 2023, 450, 106377. [Google Scholar] [CrossRef]
  123. Awwiller, D.N. Illite/smectite formation and potassium mass transfer during burial diagenesis of mudrocks; a study from the Texas Gulf Coast Paleocene-Eocene. J. Sediment. Res. 1993, 63, 501–512. [Google Scholar]
  124. Huang, W.-L. The formation of illitic clays from kaolinite in KOH solution from 225°C to 350°C. Clays Clay Miner. 1993, 41, 645–654. [Google Scholar] [CrossRef]
  125. Lanson, B.; Beaufort, D.; Berger, G.; Baradat, J.; Lacharpagne, J.-C. Illitization of diagenetic kaolinite-to-dickite conversion series; late-stage diagenesis of the Lower Permian Rotliegend Sandstone reservoir, offshore of the Netherlands. J. Sediment. Res. 1996, 66, 501–518. [Google Scholar]
  126. McKinley, J.M.; Worden, R.H.; Ruffell, A.H. Smectite in sandstones: A review of the controls on occurrence and behaviour during diagenesis. In Clay Mineral Cements in Sandstones; Worden, R.H., Morad, S., Eds.; Blackwell Publishing: Oxford, UK, 1999; pp. 109–128. [Google Scholar]
  127. Putnis, A.; Austrheim, H. Fluid-induced processes: Metasomatism and metamorphism. Geofluids 2010, 10, 254–269. [Google Scholar] [CrossRef]
Figure 2. A measured section of the lacustrine-dominated interval from the JLYY1 borehole, illustrating the vertical variations in lithologies, facies associations, total organic carbon (TOC) content, hydrogen index (HI) values, Index of Compositional Variability (ICV), total carbonate content, stratal stacking pattern, sequence surfaces, and four depositional stages (TST-1 to HST-3) in the Shahezi Formation. The interpretation of facies association is adapted from Wang et al. (2025) [32].
Hydrology 12 00179 g002
Figure 3. Backscattered SEM images of a sublittoral lacustrine mudstone sample from the Shahezi Formation (JLYY1 borehole, 3166.52 m). The sample is identified as horizontally stratified, non-laminated, and with argillaceous mudstone lithofacies in Wang et al. (2025) [32]. (a,b) Thin-shelled bivalve fragments containing clay minerals, authigenic quartz, and pyrite framboids; (b) is an enlarged view of a region within (a), highlighting the occurrence of these minerals. (c) Close association of authigenic quartz, chlorite blades, altered plagioclase, calcite, and illite mineral matrix. (d) Detrital quartz silt floating within a mineral matrix composed of chlorite, illite, calcite, quartz, and organic matter particles.
Hydrology 12 00179 g003
Figure 4. Variations in enrichment factors (EFs) of the major-element oxides in a sequence stratigraphic framework (TST-1 to HST-3), calculated from the Shahezi Formation mudstones (JLYY1 borehole). (a) The distribution pattern of enrichment factors in TST-1 and HST-2; (b) the distribution pattern of enrichment factors in HST-1 and HST-2. The EF values are calculated by normalizing the oxide concentrations to their reference values of Post-Archaean Australian Shale (PAAS).
Hydrology 12 00179 g004
Figure 5. Rare earth element (REE) diagrams of the Shahezi Formation mudstones from the JLYY1 borehole, Lishu Rift Depression, illustrating the tectonic background and features of the protolith in the provenance area during the four depositional periods (TST-1 to HST-3). (a,b) La-Th-Sc and Th-Sc-Zr/10 ternary diagram, with base maps referenced from Bhatia and Crook (1986) [79]. (c) Hf versus La/Th diagram, with a base map referenced from Floyd and Leveridge (1987) [80]. (d) The distribution patterns of the chondrite-normalized REE concentrations in the Shahezi Formation mudstones, compared with those of the Upper Continental Crust (UCC, data referenced from McLennan (2001)) [81].
Hydrology 12 00179 g005
Figure 6. Stratigraphic variations in the chemical weathering indices from TST-1 to HST-3 within the lacustrine-dominated interval of the Shahezi Formation (JLYY1 borehole). This section includes the Chemical Index of Alteration (CIA and CIAcorr), Ln(Al2O3/Na2O), Weathering Index of Parker (WIP), Plagioclase Index of Alteration (PIA), Rb/Sr ratios, and z-scores for these weathering proxies. The z-scores were calculated to facilitate a comparison between datasets of different scales by normalizing the variables to a mean of 0 and a standard deviation of 1. Here, higher z-score values indicate more intense chemical weathering conditions. The z-scores of WIP and Rb/Sr were multiplied by −1 to align their trends with other proxies.
Hydrology 12 00179 g006
Figure 7. Backscattered SEM photomicrographs (ad) and EDS spectra (numbers 1 to 10) of marine mudstone samples from the Lower Silurian Longmaxi Formation in the Sichuan Basin, South China (He201 borehole, 4073.8 m). The circles marked by numbers 1 to 10 represent the locations of EDS point analysis. These samples have undergone potassium and barium metasomatism as a result of hydrothermal activity. All images illustrate the replacement of primary albite by neoformed K-feldspar and hyalophane, which occur at grain rims and along cleavage planes. Hyalophane (K,Ba)[(AlSi)4O8] represents a barium-rich potassium feldspar formed under low-temperature conditions. Mineral abbreviations: albite (Ab), K-feldspar (Kfs), chlorite (Chl), and hyalophane (Hya).
Hydrology 12 00179 g007
Figure 9. (a,b) Cross plots showing the relationship between the bulk-rock K2O content and Chemical Index of Alteration (CIA) values for the Shahezi and Longmaxi Formations. (c,d) Cross plots of %K2O versus corrected CIA values (CIAcorr) for the Shahezi and Longmaxi Formations. For the Shahezi Formation samples, the negative or insignificant correlation indicates that the breakdown of intraformational K-feldspar did not result in excess K2O addition to the bulk rock. In contrast, for the Longmaxi Formation samples, the positive correlation suggests that potassium addition, driven by hydrothermal activities and expressed through plagioclase replacement, can increase the bulk-rock K2O content. Major element data of the Longmaxi Formation are sourced from Wang (2021) [74].
Hydrology 12 00179 g009
Figure 10. Photomicrographs of a sublacustrine fan sample from the Shahezi Formation (JLYY1 borehole, 3122.05 m). This sample corresponds to the mud-rich conglomerate lithofacies identified by Wang et al. (2025) [32]. (ac) Backscattered SEM images showing abundant illite plates and altered plagioclase particles. Panels (b,c) are magnified views of areas within (a), highlighting the occurrence of authigenic illite and altered plagioclase (outlined by dashed yellow lines). Note the replacement of plagioclase by authigenic illite, likely controlled by cleavage. (d) Transmitted polarized light photomicrograph illustrating the close association between extensively altered plagioclase (indicated by dashed yellow lines) and the illite-rich mineral matrix. Mineral abbreviations: plagioclase (Pl), illite (Ill), calcite (Cal), and quartz (Qz).
Hydrology 12 00179 g010
Disclaimer/Publisher’s Note: The statements, opinions and data contained in all publications are solely those of the individual author(s) and contributor(s) and not of MDPI and/or the editor(s). MDPI and/or the editor(s) disclaim responsibility for any injury to people or property resulting from any ideas, methods, instructions or products referred to in the content.

