1. Introduction
The rapid unchecked growth of urbanization and industrialization is significantly deteriorating water quality in New Jersey, as these anthropogenic activities continue to degrade the environment and compromise water resources, transforming land use and landcover patterns throughout the region [
1]. This disturbing trend is documented by numerous studies indicating the decline in groundwater quality across the United States [
2,
3,
4,
5]. The complexities of groundwater pollution are multifaceted, encompassing both anthropogenic activities and uncontrollable natural events. Agricultural practices, while essential for food production, employ fertilizers that can compromise water resources. The application of deicing salts, another critical activity, has been heavily linked to salinization of groundwater resources [
2,
6]. Also, uncontrollable events such as heavy precipitation, flooding, and hurricanes can spread contaminants and worsen water resource degradation, particularly in urbanized regions like New Jersey. New Jersey’s aging combined sewer systems are susceptible to overflow during flooding events, resulting in the deterioration of groundwater quality [
2,
6]. The impacts of events such as flooding and hurricanes could result in the degradation of water resources in urbanized regions like New Jersey. New Jersey has aging combined sewer systems that combine storm water and municipal sewage in the same sewer line. During heavy flooding events, there is overflow from the overwhelmed sewer system through manholes, and these sewer effluents flow into important water resources. The infiltration of this effluent into groundwater leads to a decline in groundwater quality. This occurs through point and non-point pollution sources. Deicing salt application is a major contributor to groundwater salinization [
2,
6,
7]. Oyen and Ophori [
8,
9] revealed, in their studies on the spatiotemporal evaluation of groundwater, that the lower Passaic watershed experienced significant decline in freshwater quality when compared to many watersheds in northern New Jersey. Groundwater salinization driven by rising chloride concentrations may appear less urgent due to chloride’s secondary regulatory status (maximum contaminant level [MCL] = 250 mg/L [
10,
11]). However, widespread exceedances of this threshold have been documented [
2,
12], and the potential of this phenomenon to compromise water quality warrants significant concern [
6,
7,
10,
13,
14]. Also, increasing groundwater salinization has been shown to mobilize contaminants, including heavy metals [
15,
16], and poses a recurring challenge during remediation of organic compounds such as Trichloroethylene (TCE) [
17,
18].
Elevated salinity levels can facilitate the movement of contaminants from the soil matrix into groundwater. The presence of sodium ions in deicing salts can trigger cation exchange in soils, releasing heavy metals such as lead and zinc, which can then be transported to surface water and groundwater via runoff. A groundwater study done in Connecticut by McNaboe et al. [
19] revealed that highly saline groundwater had a high concentration of Radon (Rn). It was observed that sodium ion from deicing salts mobilizes Rn to the subsurface. Numerous studies conducted across the United States have closely associated deicing salt use and expansive impervious surface areas in urban environments to rising levels of groundwater salinity [
12,
13,
20]. Also, deicing salt applications have been linked to ecosystem degradation, as elevated salinity levels facilitate the increase of invasive species, thereby displacing native species from their habitats [
2,
20,
21].
An additional concern associated with high-salinity groundwater is the phenomenon of “salting out”, which involves a reduction in solubility of dissolved constituents in response to increased ionic strength within a solution [
22]. Newell et al. [
22] highlighted the complexities of remediating groundwater contaminated with per-and polyfluoroalkyl substances (PFAs), particularly in highly saline water resources. The salting-out effect process can lead to enhanced retention of PFAs in aquifer materials, rendering remediation efforts more challenging. This issue is more critical in regions characterized by fractured rock aquifers, such as the northern New Jersey hydrogeologic system. In fresh groundwater impacted with elevated salinity, PFAs become more persistent due to decreased solubility and increased sorption to aquifer materials. Following remediation of contaminated wells, contaminants trapped in aquifer pores are slowly re-introduced into the remediated wells, frustrating efforts of remediation [
17,
18].
The proliferation of anthropogenic activities has led to an increase in chloride availability in the environment, contributing to the salinization of freshwater resources [
2,
6]. The conservative properties of dissolved chlorides allow them to be resistant to degradation and sorption processes [
23], making them an effective tracer in hydrologic investigations of metals and contaminated organic compounds. The profound influence of deicing salts on groundwater salinization warrants increased attention and awareness. Despite their perceived benefits, these salts pose a significant threat to the environment.
Groundwater modeling tools such as MODFLOW and MODPATH offer a valuable tool for assessing the transport dynamics of chlorides within the groundwater systems. These groundwater models can quantify key parameters, such as travel distances and times, and identify potential contaminant point sources. By employing chloride as a surrogate for certain contaminants, the transport of these contaminants can be effectively modeled within the study area. By modeling the groundwater systems, these models facilitate informed management of subsurface resources [
24,
25,
26]. The accuracy of groundwater models is rigorously evaluated through a calibration process, where hydraulic parameters such as hydraulic heads and recharge rates are manually adjusted to match calculated and observed hydraulic properties. This approach has proven effective in numerous studies [
24,
26]. Additionally, statistical summaries like root mean square error (RMSE) and mean standard error (MSE) are employed to validate model performance. Low MSE and RMSE values typically suggest that a model has an adequate fit. Nevertheless, researchers must exercise caution when interpreting model results, as calibration data should adequately represent actual field conditions [
24].
Groundwater models are widely used to estimate aquifer properties across diverse geological settings and regions. Numerous groundwater modeling studies have been conducted in New Jersey [
25,
27,
28,
29], providing valuable insights into the understanding and effective management of groundwater systems. These studies are particularly relevant in northern New Jersey, where complex hydrogeological features prevail. Notably, Barry et al. [
27] employed the MODFLOW model to simulate groundwater flow in the Central Passaic River Basin (CPRB) of New Jersey, generating a detailed groundwater recharge map. Also, Ophori et al. [
12] developed a numerical model to simulate groundwater–surface water interaction during historical and recent pumping of groundwater at the CPRB. Serfes et al. [
29] employed chemical equilibrium modeling to evaluate arsenic mobilization from Pyrite in the Passaic and Lockatong Formations of the Newark Basin, New Jersey, building their study on earlier studies that suggest that arsenic contaminations in groundwater are closely associated with pyrite oxidation. Lewis-Brown et al. [
28] used groundwater modeling to assess groundwater contaminant transport in a fractured rock aquifer of New Jersey’s Lockatong Formation, estimating travel times and flow paths.
This current study develops a comprehensive numerical model to investigate the transport dynamics of deicing constituents (chloride particles) within the sedimentary rock framework of the Brunswick aquifer, with a particular emphasis on determining the flow regime, particle tracking, and evaluating the sources and discharge points of chloride ions.
Urbanized fractured-rock aquifers face growing threats from deicing salts, yet predicting contaminant travel times remains fraught with uncertainty. This study tackles this gap by asking (1) How quickly can chloride infiltrating at First Watchung Mountain (Montclair State University) reach critical discharge points? and (2) How do porosity variations control these timelines? Using MODFLOW/MODPATH, we quantify transport dynamics within the sedimentary rock framework of northern New Jersey’s Brunswick aquifer.
While previous studies have examined groundwater flow in the Passaic Basin [
27,
28], this study develops a numerical framework to quantify how fracture-network porosity controls contaminant transport timescales in a densely urbanized, salt-vulnerable setting. Our model uniquely integrates (1) site-specific hydraulic conductivity variations, (2) dual-porosity scenarios (0.2 vs. 0.4) to resolve discrepancies in prior travel-time estimates, and (3) backward particle tracking to identify municipal well recharge sources. These innovations provide a framework for predicting contaminant persistence in fractured-rock aquifers—a critical need for regions grappling with deicing salt impacts and long-term remediation challenges.
1.1. Study Area
The study area covers about 105 km
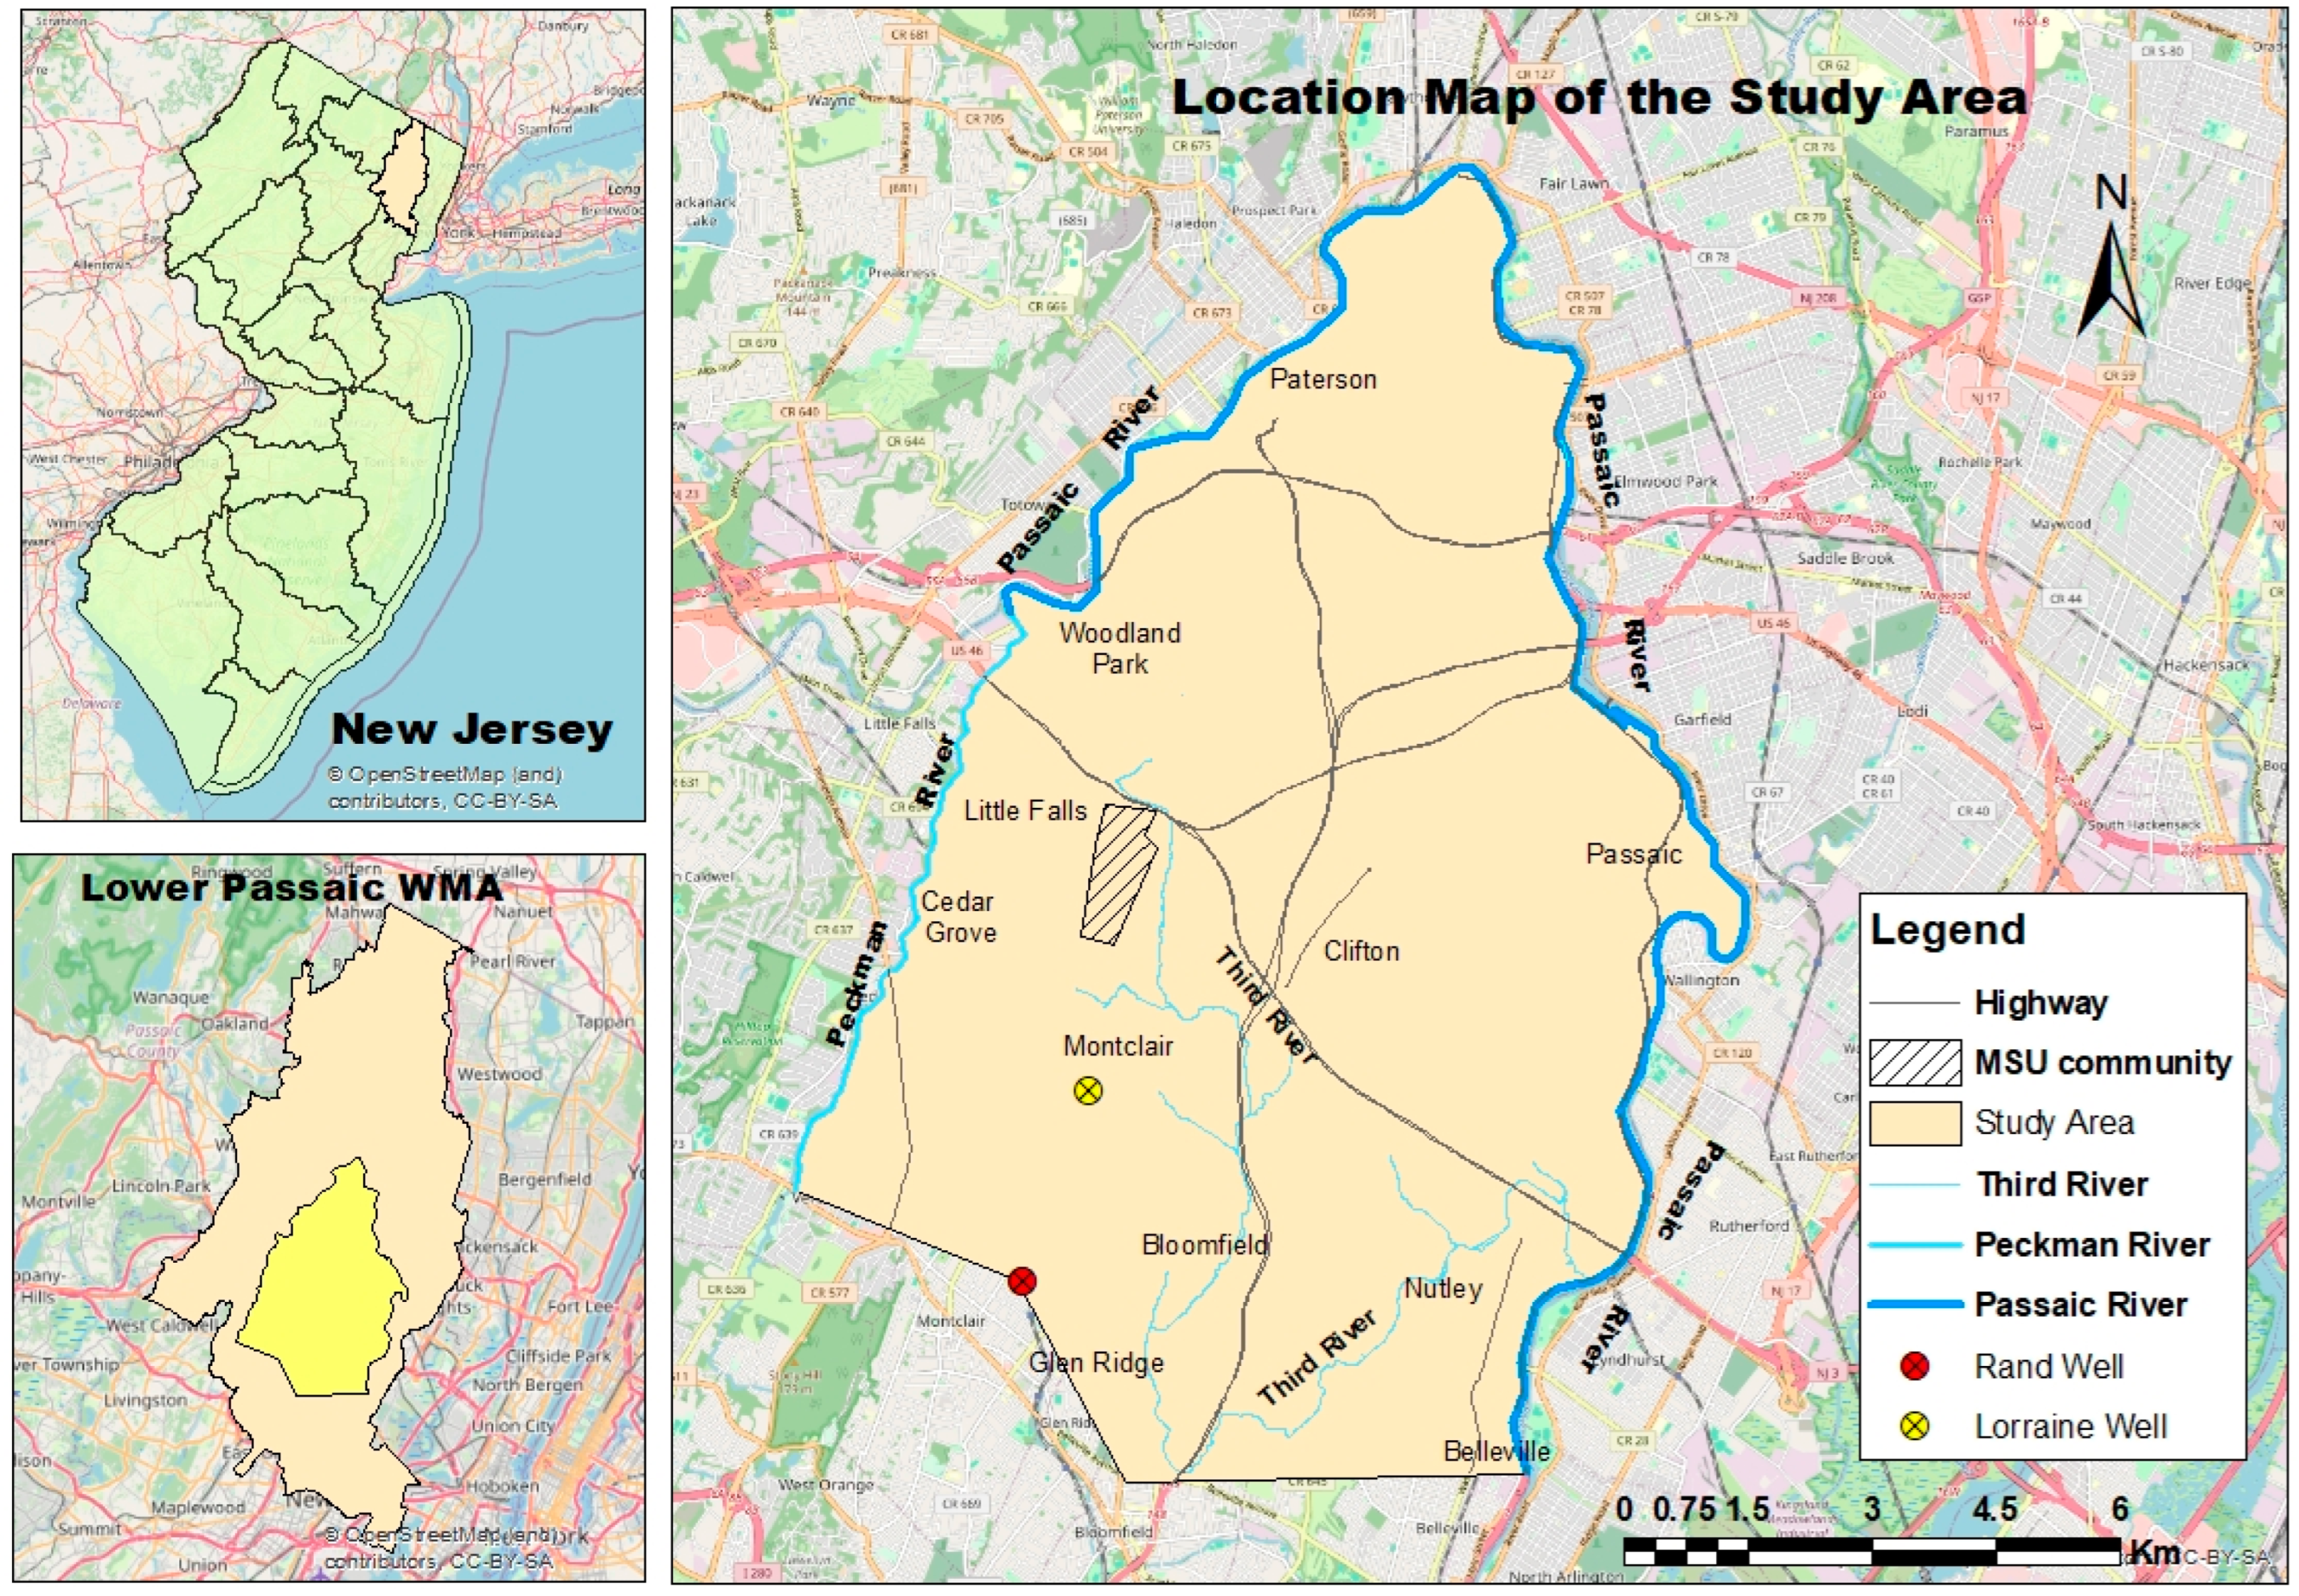
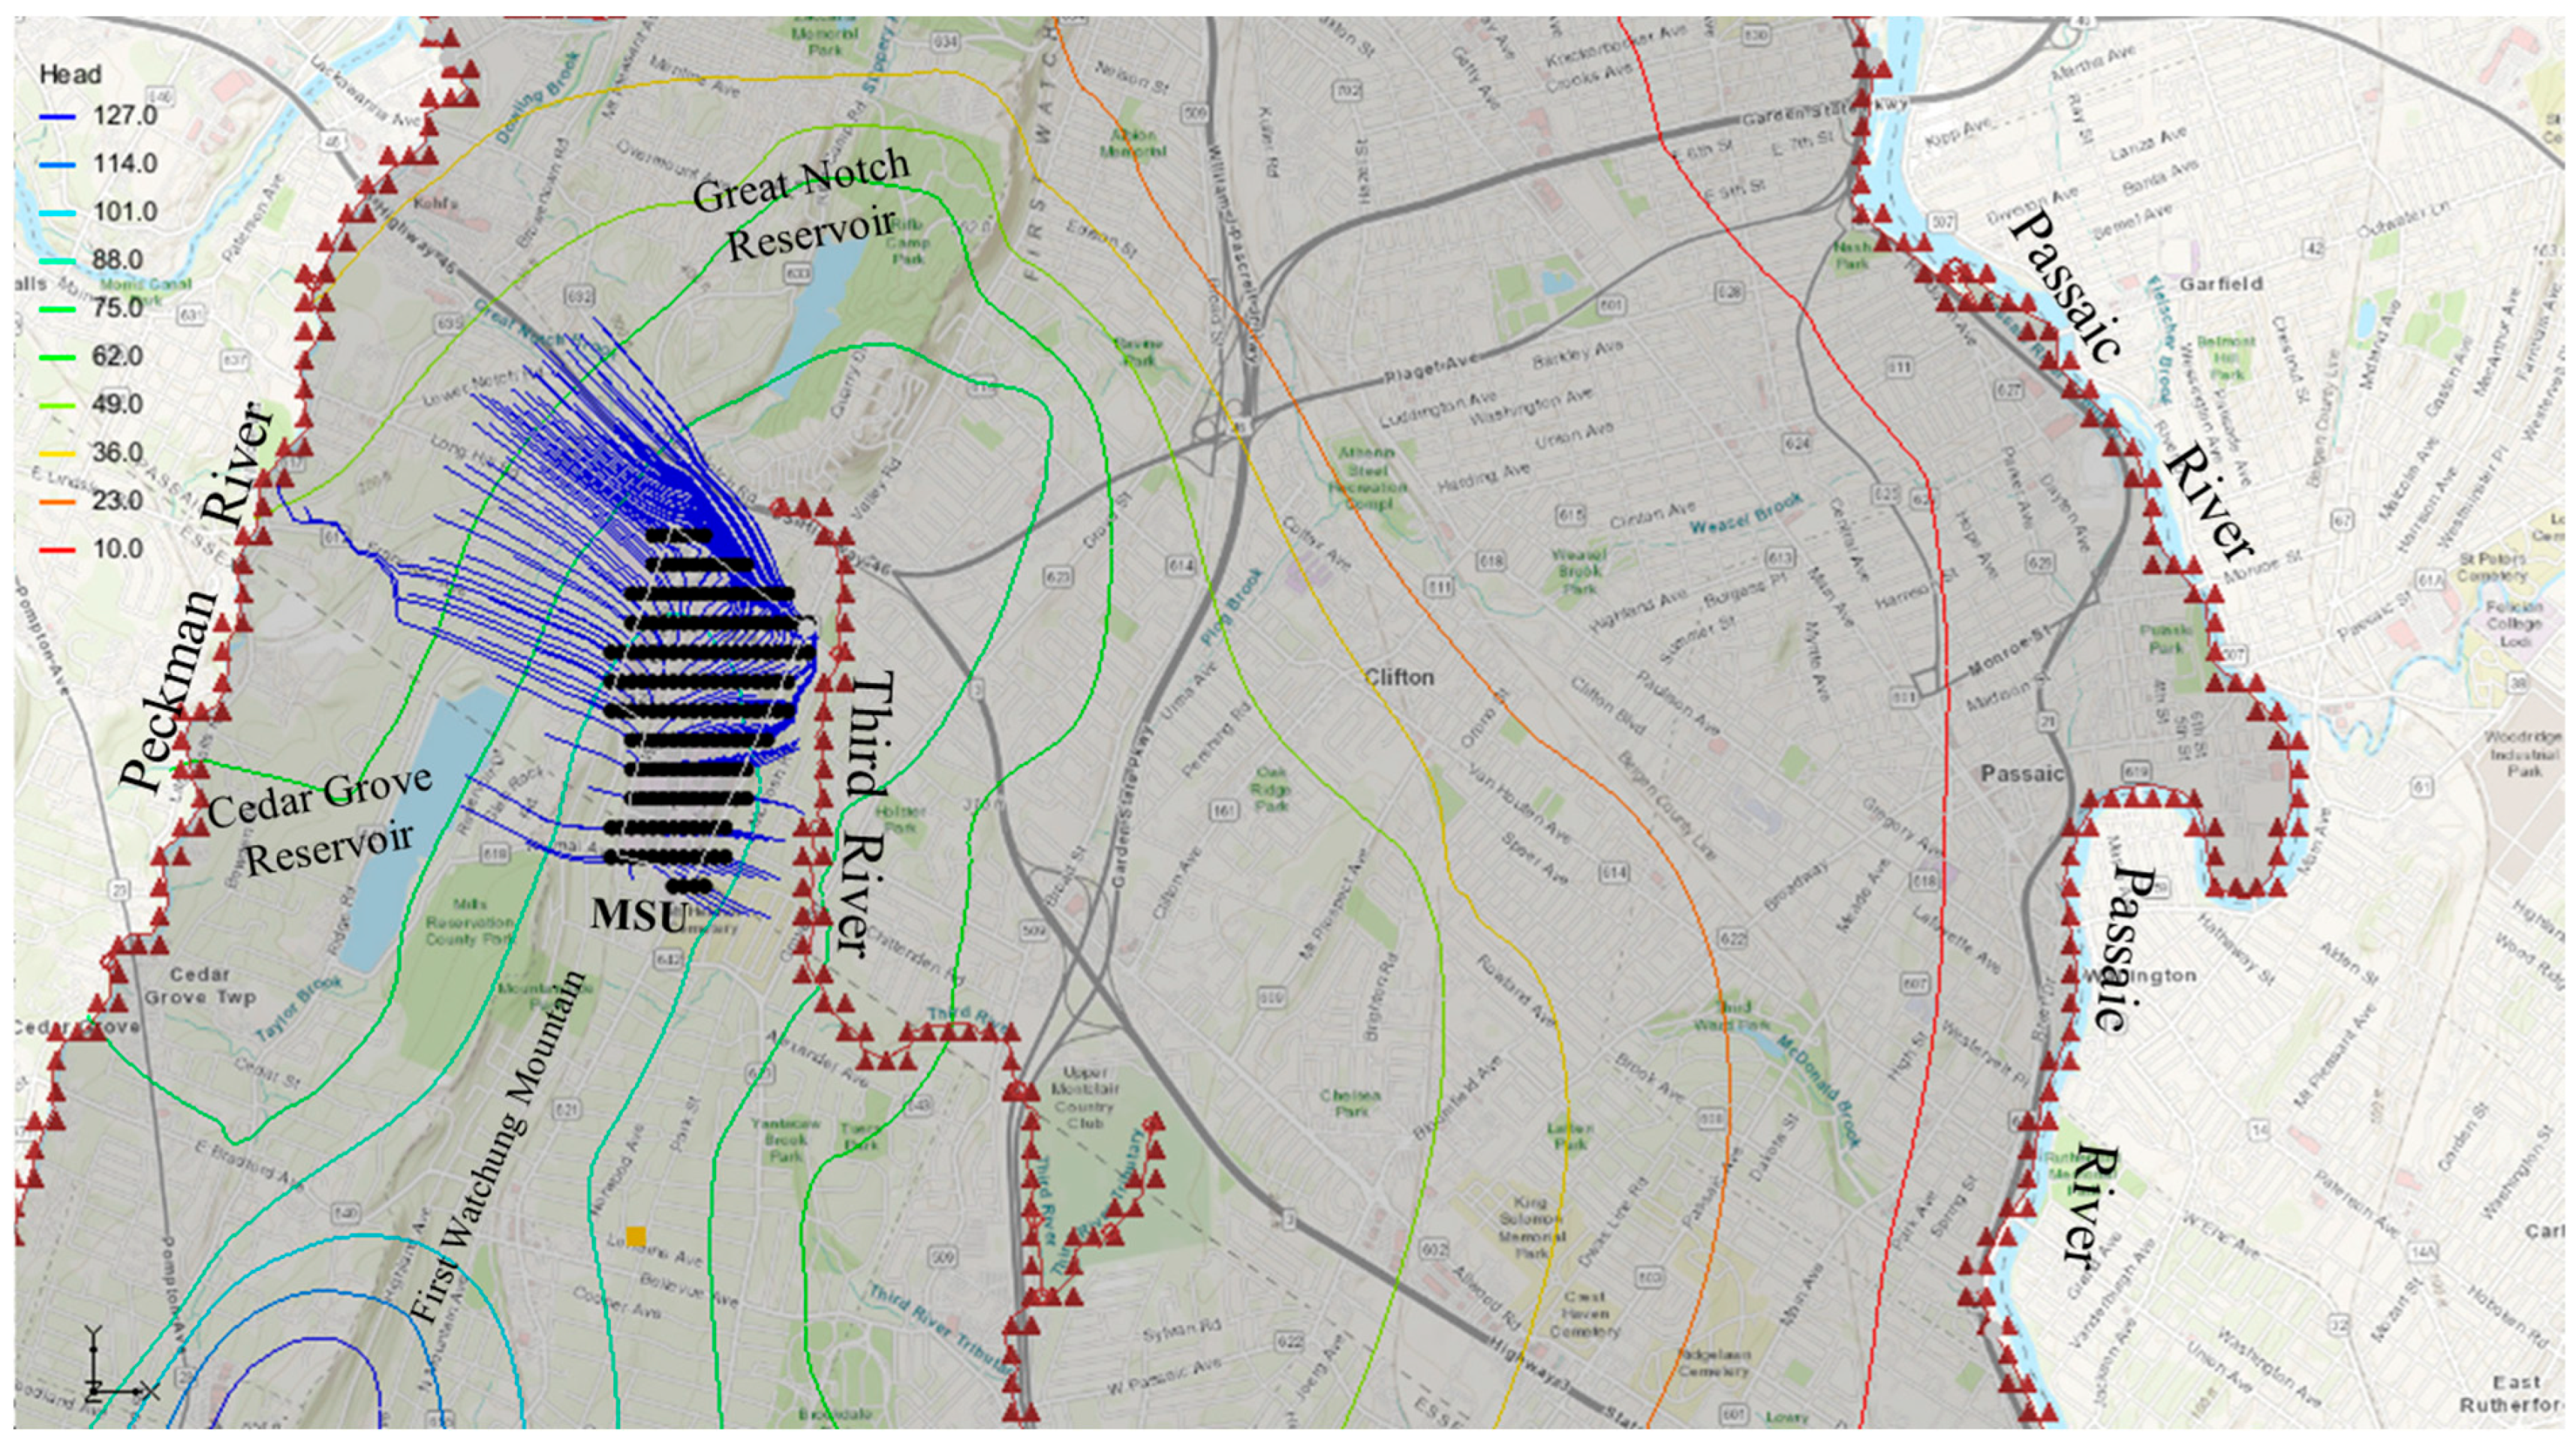
2, underlain by the Brunswick aquifer of the Newark Basin, within the Lower Passaic watershed in New Jersey. It is bounded by the Peckman River on the west, the Passaic River on the north and east, and the Upper Montclair community on the south. The study area (
Figure 1), which is mostly urbanized, has a commuter university community located in Montclair Township. The study area also covers parts of Clifton, Paterson, Cedar Grove, Little Falls, Glen Ridge, Bloomfield, Belleville, and Nutley (comprising both Essex and Passaic counties) of New Jersey. Montclair State University (MSU), a commuter university, is where over 20,000 students attend. Three municipal wells (Glenfield, Lorraine, and Rand wells) are located in Montclair Township and supply water to Montclair Township and nearby communities.
Of the three wells, two (Lorraine well and Rand well) are located within the study area. The study area serves as a microcosm of northern New Jersey, reflecting its “typical hydrogeological environment”. Within this area, the Montclair State University region, located on parts of the First Watchung Mountain, is identified as critically important, not only due to its geographic position on high topographic relief and its role as a primary recharge zone, but also because of the daily gathering of large groups of individuals within the university community, which can lead to heightened environmental impacts. While large populations are often associated with increased environmental contamination, significant measures are implemented to ensure hazard-free conditions as individuals gather in the university community. At times, these measures may have unintended negative consequences for the environment. One example is the application of deicing salts during snowy and icy conditions, which, while ensuring safety and normalcy, can pose environmental risks. These deicing salts (mostly chloride constituents) infiltrate into groundwater and thereby increase groundwater salinity. These attributes described in the university community and other considerations guided the selection of the study area. Another important consideration is the location of three public supply wells around the study area, of which one is indicated to be contaminated. In a 2022 water report, the three wells were rated to be highly susceptible to volatile organic compounds (VOCs), radionuclides, and inorganic contaminants, among others [
30]. Both the Glenfield and Lorraine wells currently run with attached carbon absorbers, while the Rand well does not run currently. According to Staff [
31], Montclair Township has secured federal government funds to rehabilitate the Rand municipal supply well, and to address concerns associated with elevated levels of perfluorooctane sulfonate (PFOS) and perchlorate contaminants. The supposed Rand well rehabilitation could be one reason why water reports from Montclair Water Bureau [
30] indicate that Rand well is not running.
1.2. Geologic Setting
The area is underlain by the Brunswick aquifer, an Early Mesozoic-age aquifer that forms part of the Newark Basin in New Jersey. Composed primarily of consolidated sedimentary and igneous rock units from the late Triassic and early Jurassic periods, the Brunswick aquifer serves as a true reflection and microcosm of northern New Jersey’s geology. Its complex geological history includes a variety of formations, such as the Passaic Formation, Orange Mountain Basalt, and Feltville Formation. The Passaic Formation primarily consists of red mudstone and siltstone, with lesser amounts of gray and black shale. It is notable for its fine-grained facies, which transition laterally into sandstone and conglomerate in the basin’s margins. This formation can reach a maximum thickness of about 11,800 feet, making it one of the most substantial units within the region. The Orange Mt. Basalt is mostly dark-green-gray to greenish-black basalt which is part of the series of “interlayered basalt and clastic sedimentary” rocks of early Jurassic age, with a layer thickness of up to 597 feet. It consists of several basalt flows that were fed by diabase sheets and dikes, which intruded and thermally metamorphosed older sedimentary deposits. The Feltville Formation is included in the sequence of sedimentary rocks that were deposited in a variety of environments, including fluvial-deltaic settings. It is interlayered with basalt flows, indicating a dynamic geological history. The Feltville Formation consists of interbedded brownish red to light-grayish-red, fine-to-coarse-grained stone, gray and black coarse siltstone, and silty mudstone. This formation reaches a layer thickness of about 510 feet [
32,
33,
34].
1.3. Hydrogeological Setting
The Brunswick aquifer is part of the fractured rock aquifer of Newark Basin; it consists of sandstone, conglomerate, siltstone, and shale. Fractures act as storage and conduits for groundwater in this aquifer, and water is usually fresh, non-corrosive, and calcium-bicarbonate dominated. The aquifer yields a median value of over 100 to 250 gallons per minute (gpm) [
35]. The aquifer displays heterogeneous characteristics, marked by spatial variations in permeability and transmissivity across different strata. Notably, deep formations exhibit low permeability (transmissivity less than 1 gpd/ft), whereas shallow formations can have high transmissivity (up to 30,000 gpd/ft). Groundwater flow within the aquifer is influenced by local topographic gradients and the stratigraphic arrangement of the units [
33]. The topography of the study area ranges from about 50 ft to 600 ft (15 m to 183 m). In the Brunswick aquifer, groundwater flows across various strata through fractures [
29]. Groundwater storage primarily occurs within extensive fracture networks, while long-distance transmission is facilitated by bedding parts and highly permeable units between confining beds. The Brunswick aquifer is characterized by a complex network of fractures that significantly influence its hydrogeological properties [
33]. These hydrogeologic features of the Brunswick aquifer present a system with varied hydrogeological properties, such as varied hydraulic conductivity and porosity for the aquifer formation and the water-bearing fractures (WBFs).
1.4. The Typical Hydrogeological Environment of Northern New Jersey
The characteristic features of the microcosm of the hydrogeologic environment of northern New Jersey may be summarized by its topography, climate, vegetation, geology, and land use. The topographic environment varies from the rolling hills of the piedmont region to the highlands and the Ridge and Valley provinces [
36]. There are regularly alternating topographic peaks and troughs that can be simplified to a local surface appearing sinusoidal. This surface could control the water table that determines the groundwater flow. Regional slopes measured from topographic maps having a scale of 1:250,000 average 0.02. The climate is humid continental with moderate cold, snowy winters and warm humid summers. The average annual precipitation is 40 inches, and freeze-free days range from 163 to 217 [
37]. Northern New Jersey is characterized by hardwood forest, with dominant trees like sugar maple, red maple, beech, yellow birch, sweet birch, and red oak, which play a role in the detention of surface runoff to recharge groundwater [
38]. Most of northern New Jersey is covered by the Newark Basin, which includes the Brunswick aquifer. The Newark Basin consists of conglomerates, siltstone, and shale. Prominent fractures are known to store and conduct groundwater in the basin. The Brunswick aquifer is of early Mesozoic age [
33]. It is a highly fractured aquifer of mainly sedimentary and igneous rock of the late Triassic and early Jurassic periods. It is a prolific aquifer with yields of up to 100 to 250 gallons per minute [
35]. The northeast part of northern New Jersey is highly urbanized. This urbanization has led to pollution due to the application of deicing salts on the urban roads during snowy and icy conditions [
12]. For the aforementioned reasons, the Montclair State University region and its environs is identified as a “typical environment” of northern New Jersey. It is an area in which the daily gathering of large groups of people can lead to significant environmental problems.
2. Conceptual Model Design and Calibration
This study applies the techniques of groundwater flow models to describe the groundwater flow conditions of the study area. The study employed the use of field observations and well data to develop a 3-D numerical groundwater flow model to simulate the groundwater flow conditions. A finite difference code, MODFLOW [
39] which is integrated in the Groundwater Modeling System (GMS), was used to execute the simulation of steady-state groundwater flow. Details on the application and concepts with regard to the theory of groundwater flow and the use of MODFLOW are found in Harbaugh et al. [
39]. This code is used to provide a conceptual model framework of the groundwater flow. The geologic map of the study area was imported using GIS tools within the GMS software and indicated as the base map used to develop a polygon layer for the model simulation. The model domain was built around this polygon layer. By the sides of the polygon are the rivers bounding the study area which were assigned general head boundary. The topographic map of the area (
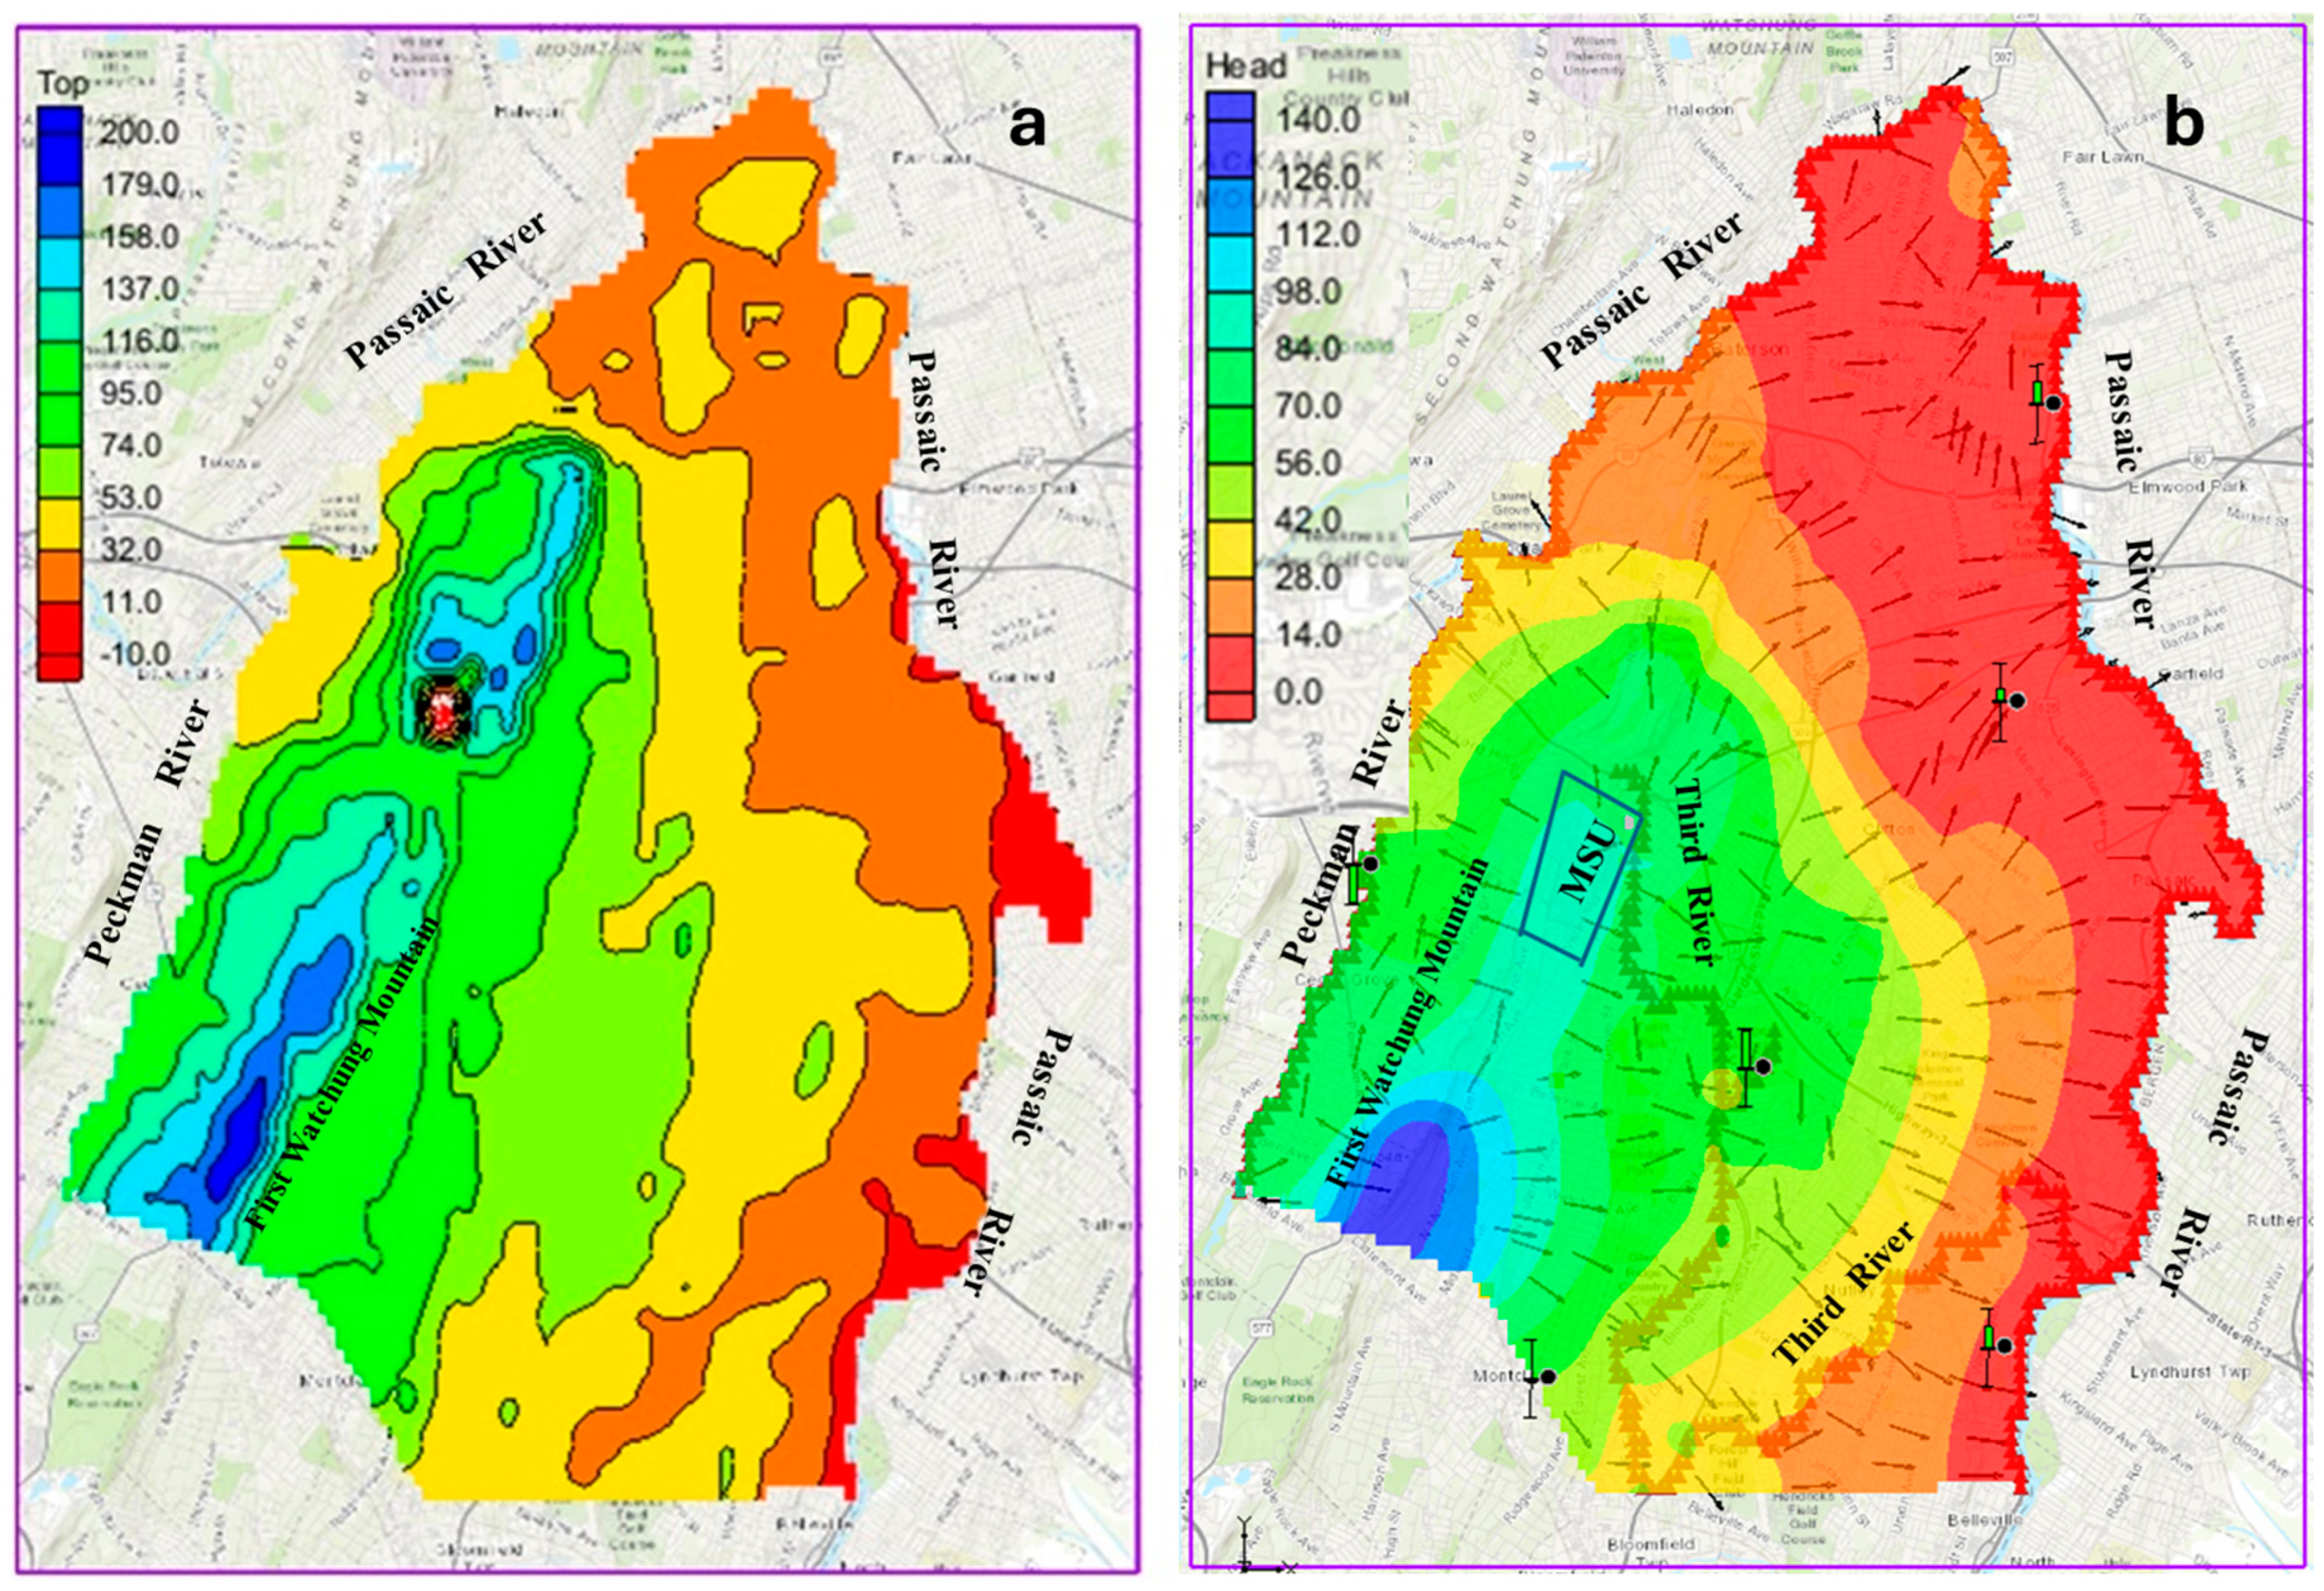
Figure 2a) was integrated to provide spatial elevation data for the ground surface at locations corresponding to the wells used in the study.
Within the model coverage, the study area was subdivided into zones based on hydraulic conductivity and recharge patterns, informed by land use, and the geology and topography of the area. The hydraulic conductivity values were assigned using the available observed data. If such data were unavailable, the standard literature ranges relevant to the study area’s geology informed the determination of the hydraulic conductivity values. The recharge was ascertained from precipitation in the study area, and the recharge values were varied based on the land use and land cover in the area. Anderson et al. [
24] indicated that spatial variations in recharge are highly influenced by not just precipitation but local topography, permeability, the water table, and several other hydrogeological properties and conditions. The model layers consisted of, from top to bottom, an unconsolidated water-bearing formation on the top surface to a no-flow boundary at the bottom bedrock layer. Since permeability in rocks has been determined to decrease with depth, the model assumes that the hydraulic conductivities of the rocks decrease with depth. The area is bounded by a small fracture filled with permeable materials on the west part of the study area. Well and water level data were integrated into coverage layers to serve as observational tools. The observed water level and elevation data, as well as the recharge and hydraulic conductivity values, were used to calibrate the hydraulic heads in the study area. The top elevation values were assigned as the starting heads for the top layer. The geology of the Brunswick aquifer has been extensively studied and documented [
5,
32,
33,
34]. Information from these studies guided the determination of the number of layers used in the simulation of the groundwater flow. The model consists of ten layers representing the Brunswick aquifer. The observation wells in the model are developed in varied geologic units, claystone, shale, siltstone, and sandstone.
After adequate representation of the groundwater system on the model coverages, a grid frame was constructed to facilitate the groundwater model. The MODFLOW model was set up with a 12,500 m by 17,500 m grid dimension, and the simulation was run under steady state conditions. The study area was divided into zones for hydraulic conductivities and recharge on the geological map (
Supplementary Materials, Figures S1 and S2). The divisions were advised by the land use, geology, and topography of the area. The groundwater flow across these boundaries was presumed infinitesimal. The river and stream networks were captured under the river coverage, and the stage of rivers was assigned based on the knowledge of the stream patterns in the area.
Source terms included recharge from precipitation, spatially distributed at 5–25% of annual rainfall [
40], with higher rates assigned to the First Watchung Mountain recharge zone. Contaminant sources (chloride particles) were introduced at MSU as point sources simulating deicing salt infiltration. Sinks comprised pumping municipal wells (Lorraine and Rand wells) and discharge areas—rivers (Peckman, Third, Passaic).
The calibrated groundwater flow simulation model indicates that groundwater heads in the study area range from about 140 m at high topographic reliefs, such as areas around the First Watchung mountain, to below 5 m at the Passaic River, east of the area (
Figure 2). The model was calibrated by adjusting hydraulic parameters to achieve a close match between simulated and observed hydraulic head values. Initial recharge values were modified using the local annual precipitation values [
37] to capture the spatial variability more effectively. Recharge values are typically 5–25% of the annual precipitation, and it is mostly dependent on the soil type and landcover [
40]. Initial recharge values in some of the portioned zones were reduced by an order of magnitude, as further adjustment resulted in spatially varied coverage across the study area. The calibrated model assumed a uniform recharge rate through the simulation period, with precipitation serving as the primary recharge mechanism. Hydrogeological properties reported in literature [
24,
27] guided the initial hydraulic conductivity values applied in the model, and the hydraulic conductivity values were manually adjusted during the calibration process. The hydraulic conductivity range obtained from the calibrated model in the study provides a good representation of the Brunswick aquifer and accurately models the study area. The calibrated hydraulic conductivity values closely match field-measured values of the aquifer [
41] and fall within the expected range for similar rock types reported in literature and studies in the region [
27]. The calibrated hydraulic conductivity values were within the range of 5.59 × 10
−6 to 1.96 × 10
−3 m/s.
Well data [
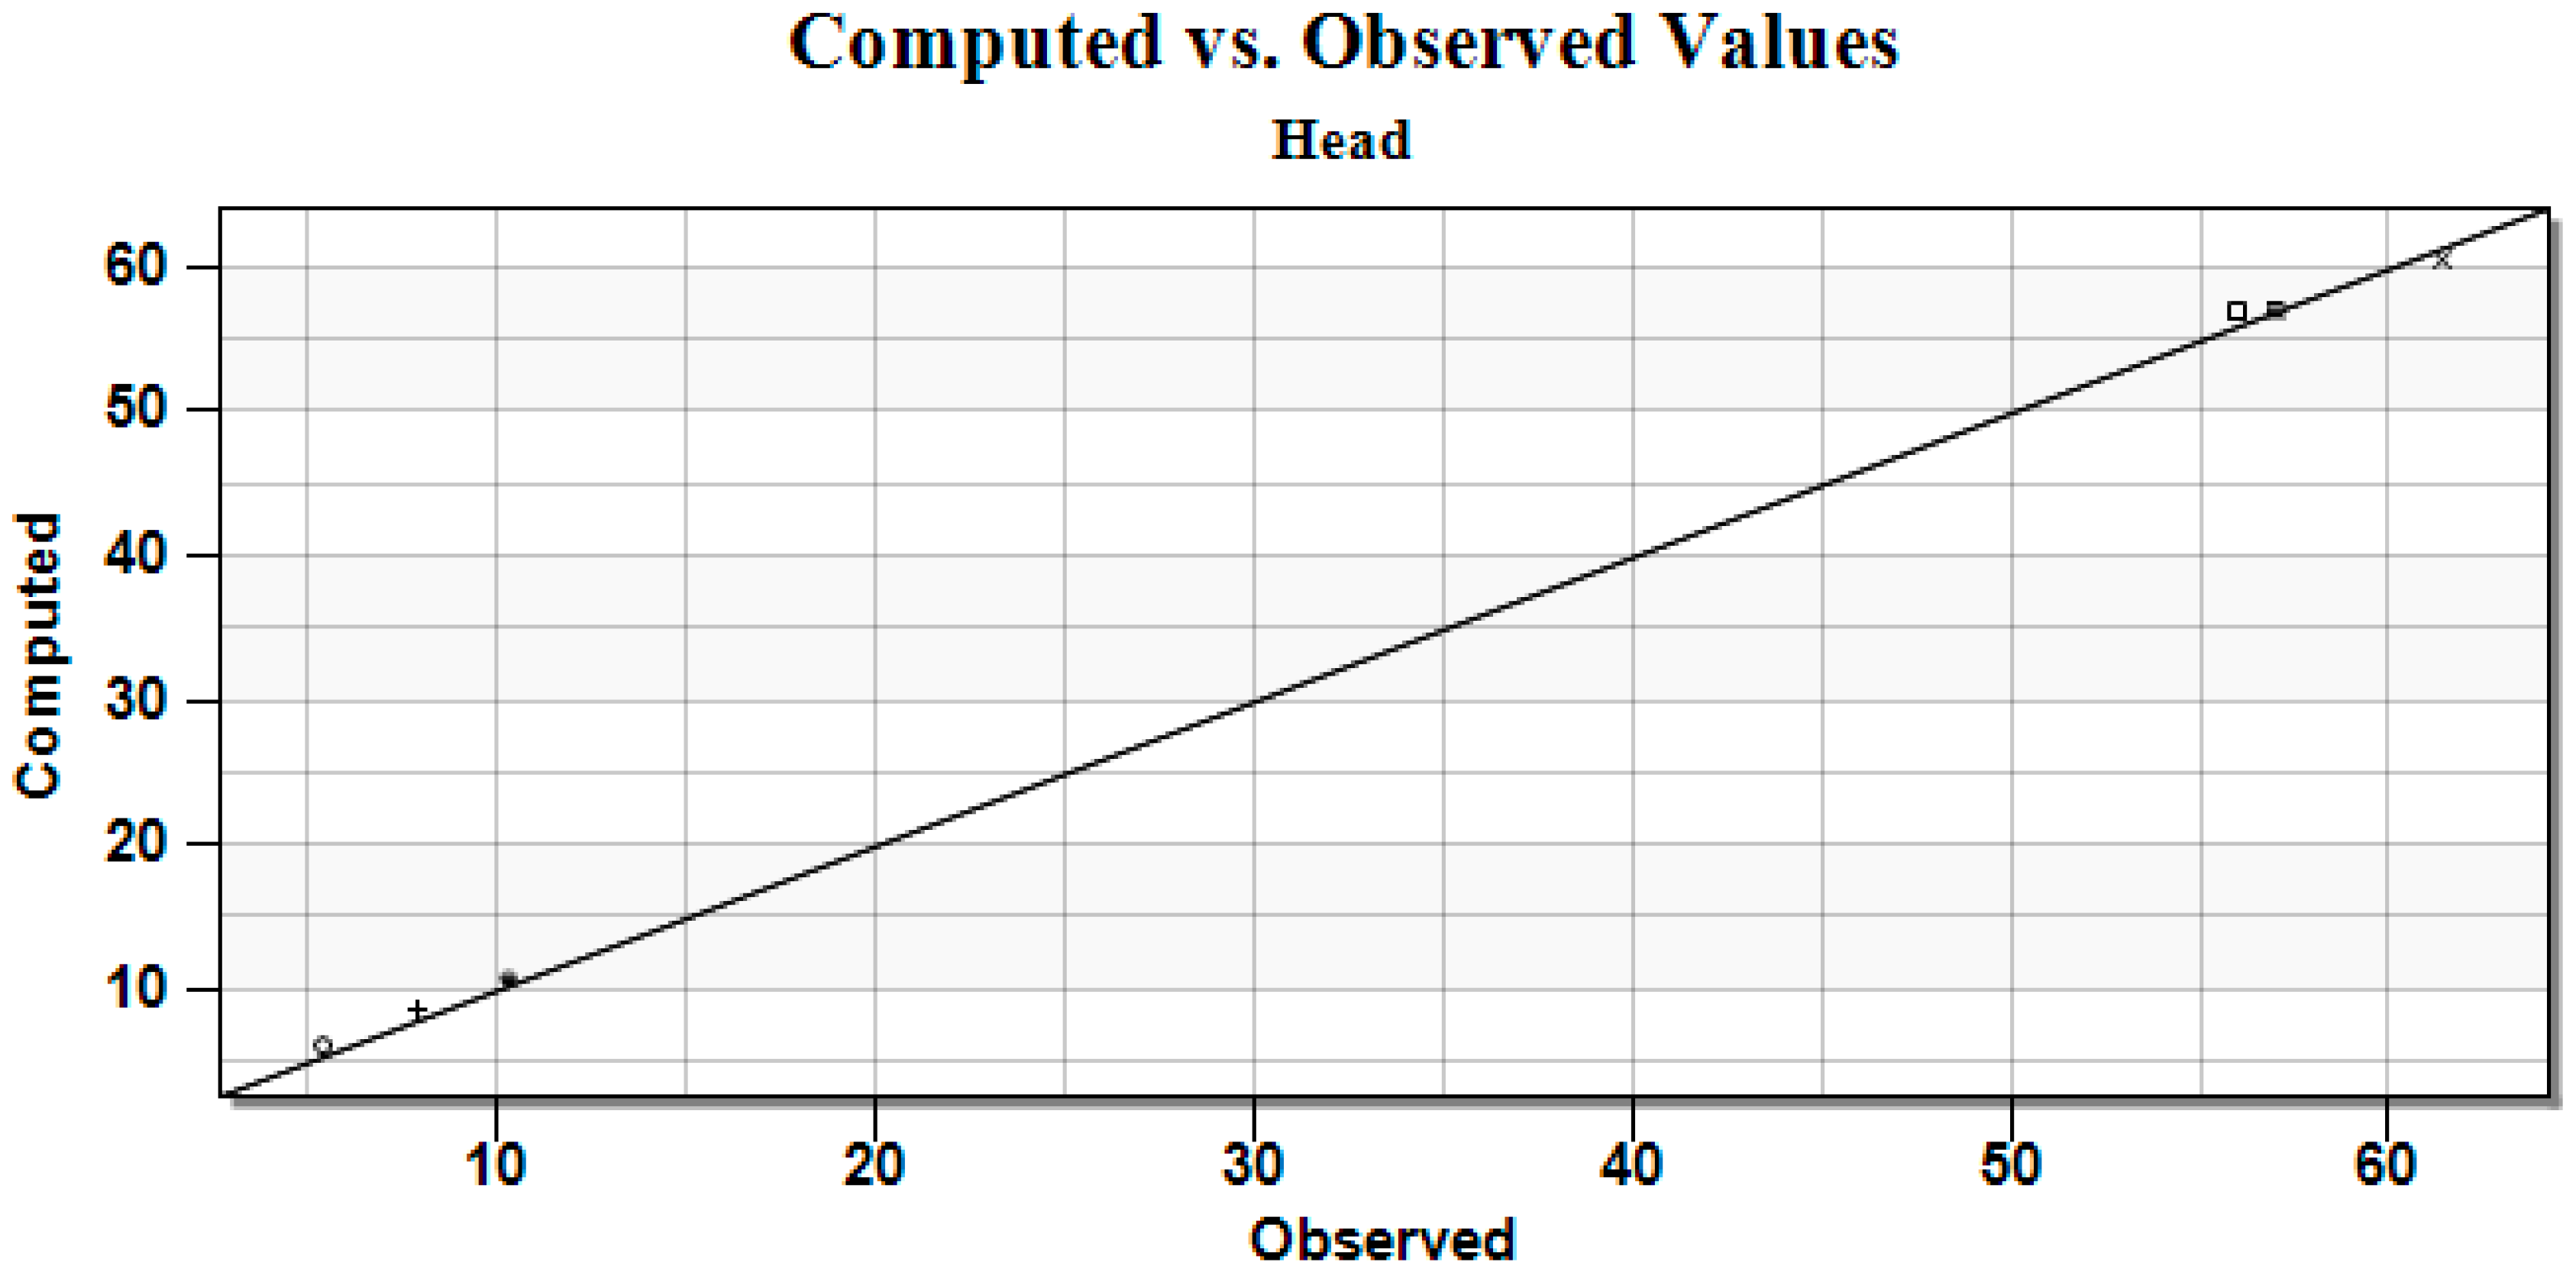
42] for six observation wells within the study area were used in the calibration of the model. A calibration target bar by the observational wells indicates the amount of error between the observed head and the calculated head. The calibration target bar is green when the error is within acceptable tolerance, while yellow- and red-colored bars show the error associated with the model calculated head is not within the acceptable tolerance. The trial-and-error method is used to adjust the hydraulic parameters targeting an adequately calibrated model until the measured head values closely match the observed heads, with minimal error, and effectively represent the study area. A plot (
Figure 3) of observed vs. calculated head provides a deeper visual understanding of the calibrated model.
A sensitivity analysis was performed to evaluate the robustness of the groundwater flow model in the face of minor changes in the aquifer’s hydraulic parameters. This investigation focused on the model’s sensitivity to certain changes in hydraulic conductivity and recharge values. A systematic approach was employed, wherein the data for each parameter were steadily varied, and the simulation repeated to quantify the resulting deviations in hydraulic heads. The RMSE was monitored after each sensitivity analysis run, to assess the model’s stability and deviation from the calibrated state.
The model’s sensitivity to hydraulic conductivity and recharge was tested by varying each parameter incrementally from 5% to 50% while keeping other parameters constant. Results showed that changes in hydraulic conductivity up to 10% indicate minimal deviation in heads (±1 m). At 20% variation, heads shifted moderately, falling within the yellow range (±2 m). Beyond 35% variation, there was noticeable deviation, with heads falling within the red range, and model errors increased sharply, indicating model instability. For the recharge parameter, variations up to 10% had little impact (±1 m). At 15% variation, some heads deviated, falling within the yellow range (±2 m). Beyond 30% variation, the calculated heads fell within the red region, showing that the model is not stable for 30% variations in the groundwater system’s recharge. The model proved more sensitive to hydraulic conductivity than to recharge when partitions were adjusted individually. However, simultaneous recharge adjustments across all partitions increased sensitivity beyond conductivity’s influence. The analysis demonstrated that these hydrogeological parameters were sensitive to variations beyond 15% (
Supplementary Materials, Table S1).
The calibrated model is presented in
Figure 2b. It reveals a close match between the observed and modeled groundwater heads. All the simulated heads in the wells aligned closely with field-observed values, indicating accurate model performance. The flow simulation reveals that all six monitoring wells were efficiently simulated to match the field-observed values (the wells had calibration target bars that indicated green colors). A plot of the observed hydraulic heads versus modeled hydraulic heads is shown in
Figure 3. This visual representation reveals a strong correlation between the observed and modeled heads, indicating a reasonably accurate representation of the groundwater flow system in the area. The model reveals that the highest hydraulic heads were in the western part of the study area, and the reverse was observed in the east of the study area, which has lower hydraulic heads. The model shows a diverging flow from the recharge area at high topographic reliefs to other parts of the study area (
Figure 2b).
In general, groundwater moves from the peak of the First Watchung Mountain in the southwest towards the west, north, and east of the study area. The velocity vectors reveal that groundwater moves from the southwest part of the study area westward towards the Peckman River, and from the southwest to the east and northeast to the Passaic River. The calibrated groundwater flow model indicates that a significant portion of the groundwater flow in the study area originates or passes through the First Watchung mountain area (
Figure 2b). This area serves as the primary recharge area for a significant part of the study area, including the two municipal wells that were investigated in this study. The boundary conditions used in the modeling indicate that inflow into the groundwater system enters as precipitation, by means of rainfall and/or snowfall, and outflow occurs mostly as streamflow through the Peckman River, the Third River, and the Passaic River.
Groundwater Flow Regime
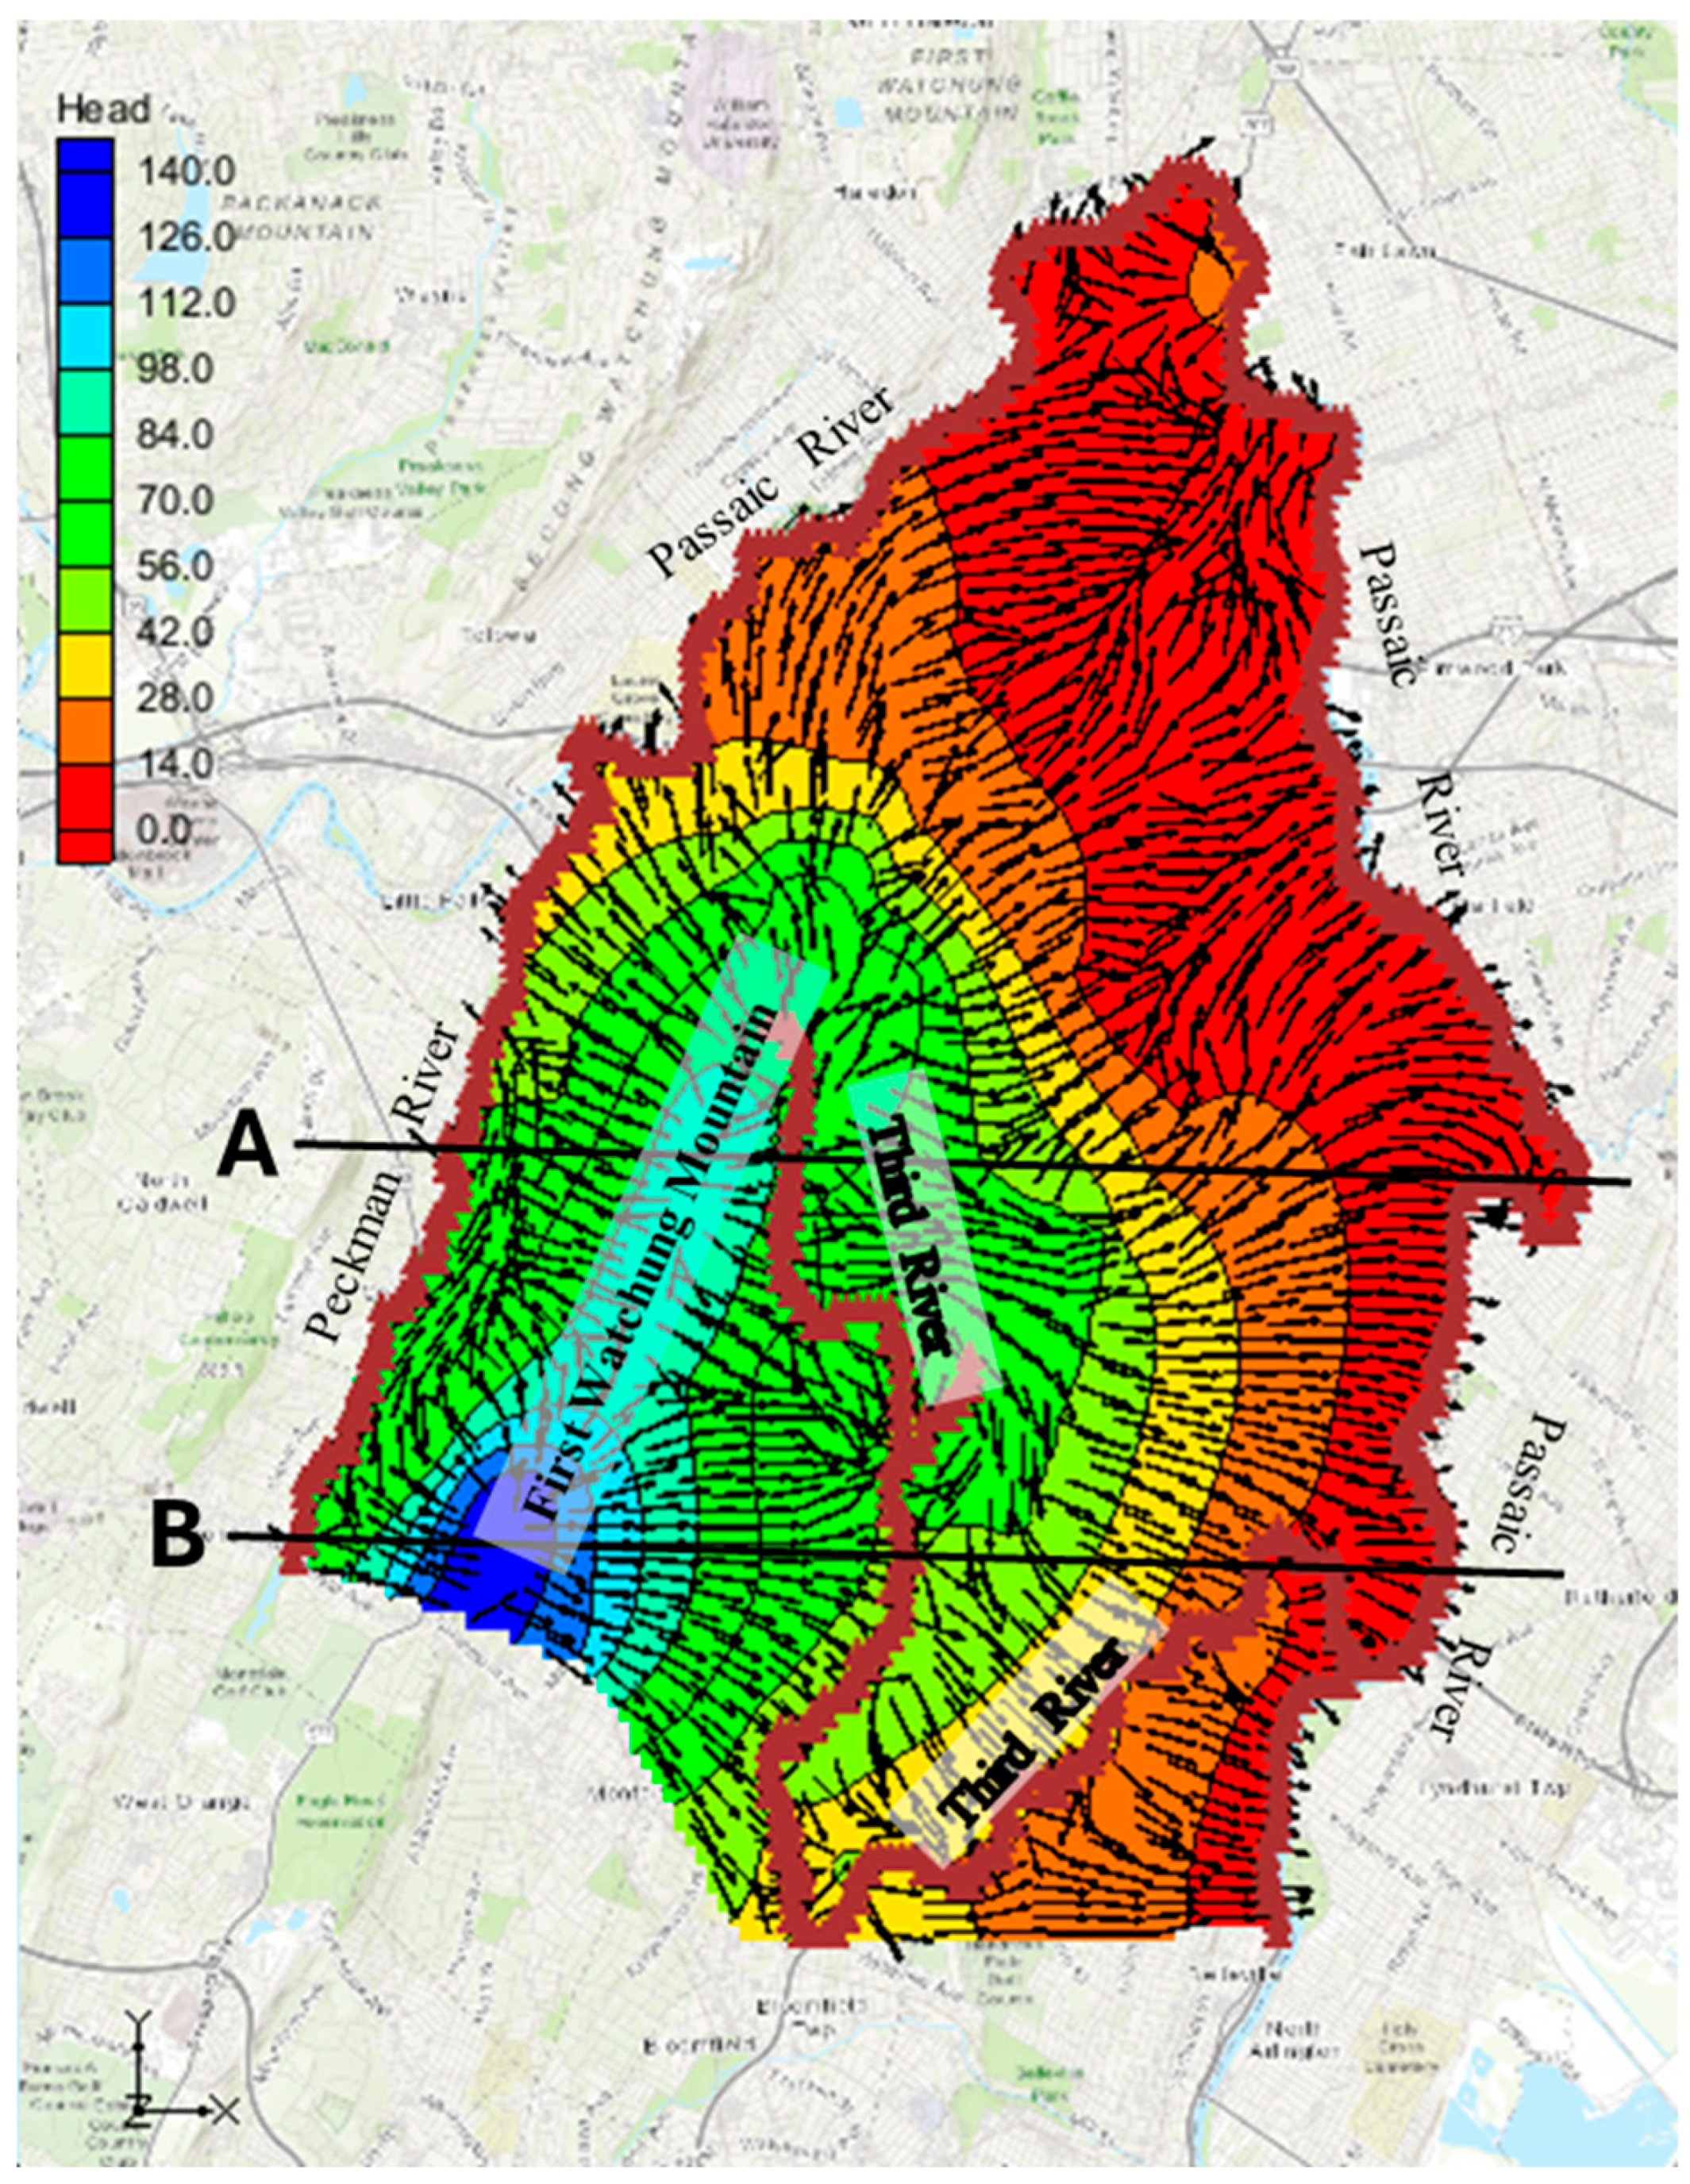
The study area is unique, characterized by multiple groundwater flow systems (
Figure 4,
Figure 5 and
Figure 6). The primary recharge area plays a vital role in sustaining the region’s water resources, with the highest hydraulic head values located around the First Watchung Mountain, aligning with its elevated topographic features. Tóth [
43] established a foundational framework for understanding groundwater flow systems, demonstrating that multiple flow systems can develop in regions with adequate recharge. Tóth [
43] categorized these systems by linking recharge and discharge areas, identifying three distinct types: local, intermediate, and regional. Local flow systems develop between nearby recharge and discharge zones, typically involving short flow paths. Intermediate flow systems originate in recharge areas but extend farther downstream, discharging at locations beyond the nearest discharge points. Regional flow systems, on the other hand, originate from large-scale recharge areas and extend to distant discharge locations, featuring significantly longer flow paths. This classification provides a clear structure for analyzing groundwater movement in various hydrological settings.
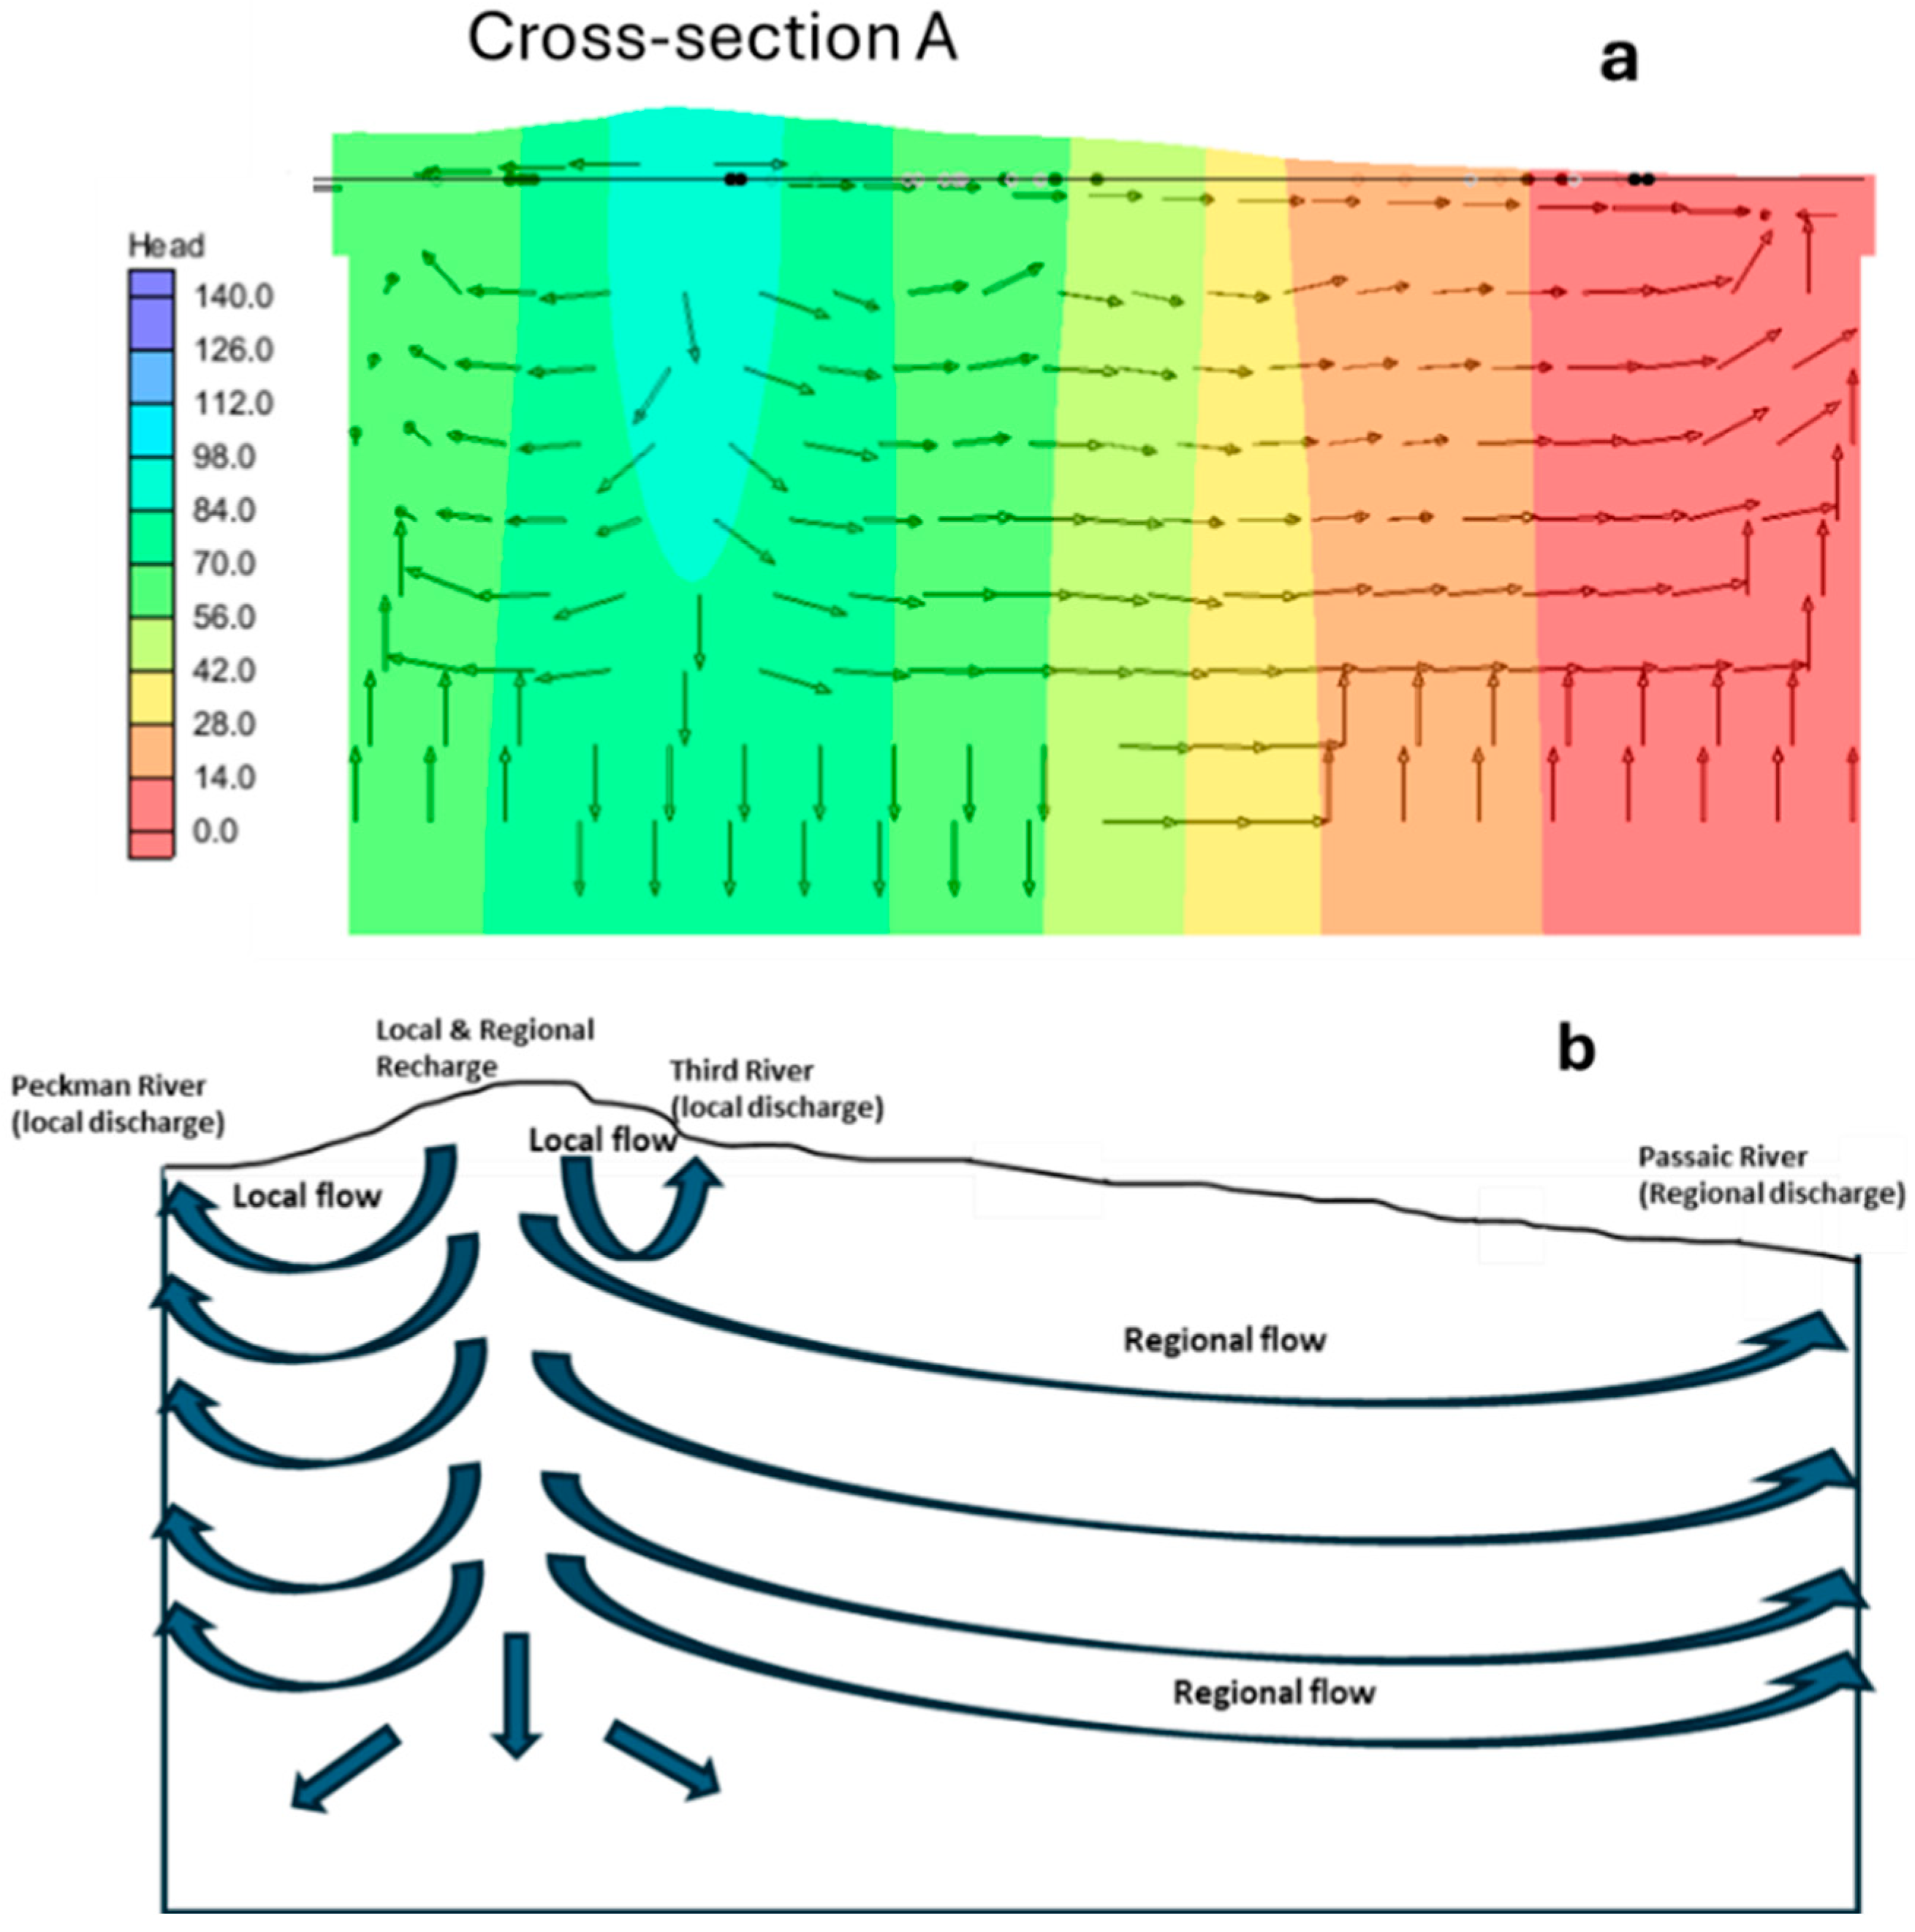
To better understand the diverse groundwater flow systems in the study area, two cross-sections (A and B, shown in
Figure 4,
Figure 5 and
Figure 6) were assessed. Cross-section A reveals both local and regional flow systems (
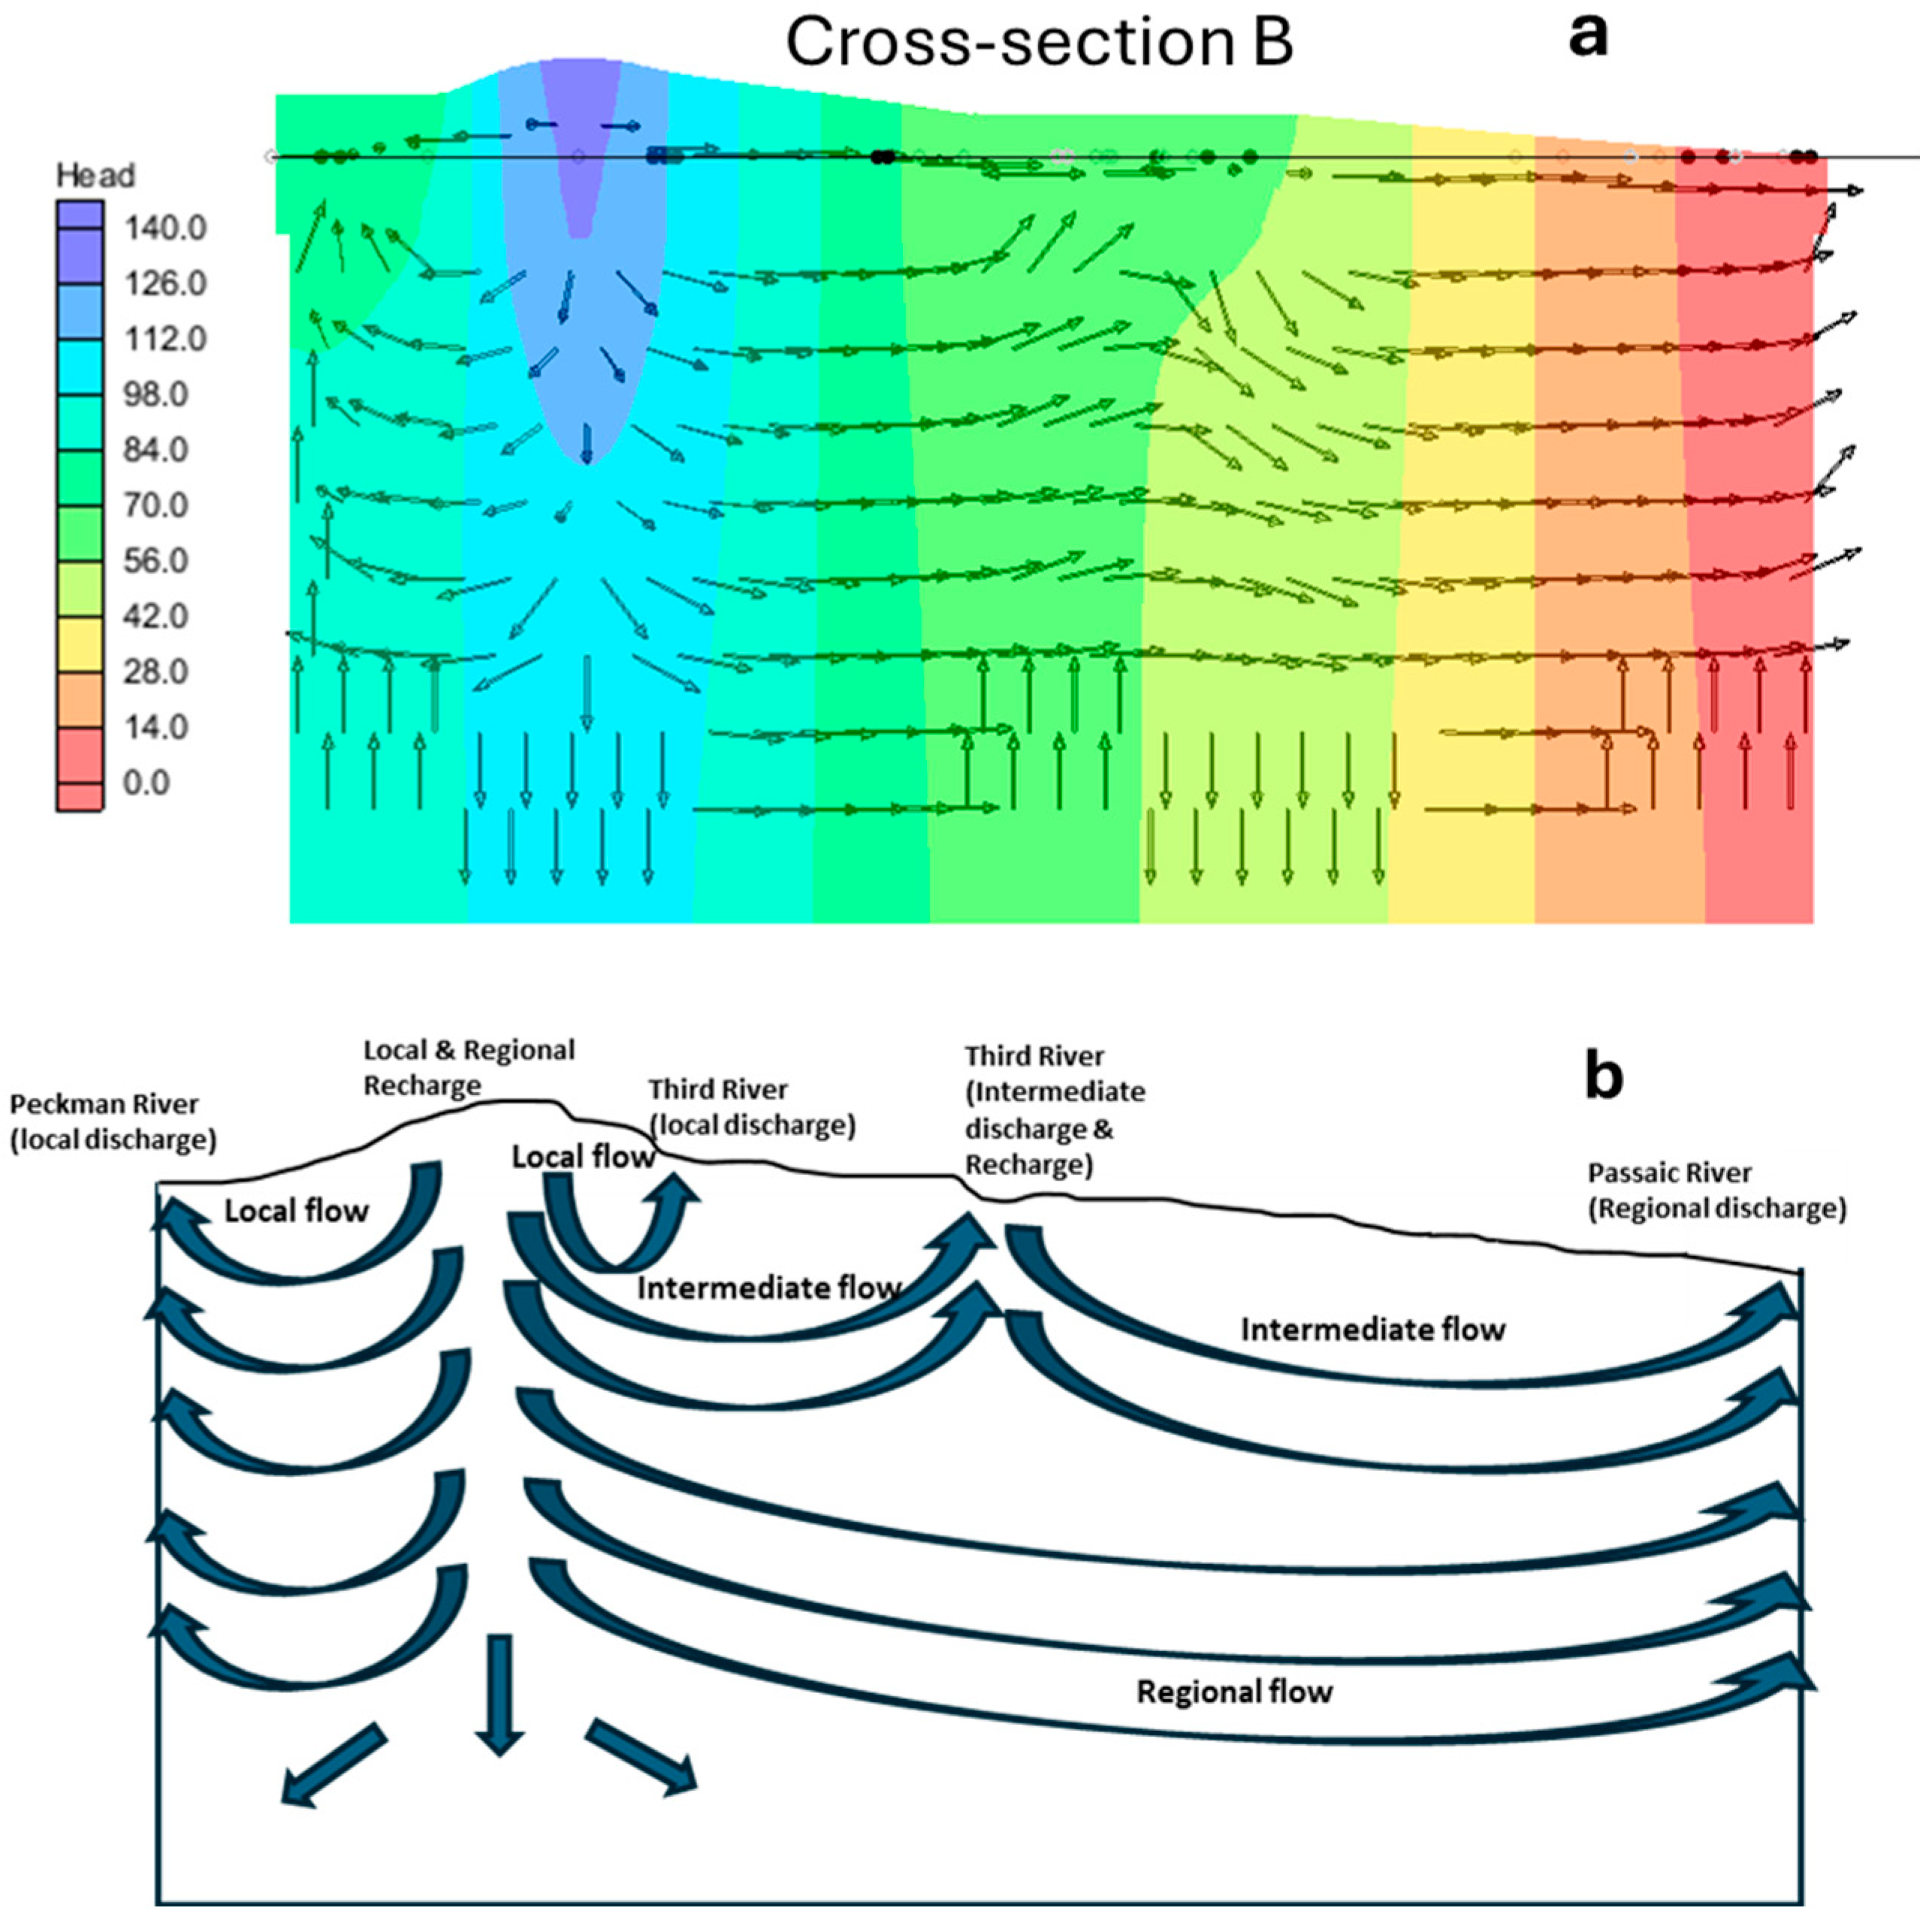
Figure 5). In the local flow system, groundwater moves from the recharge area near the First Watchung Mountain westward to the Peckman River and eastward to the Third River. The regional flow system, originating from the same recharge area, extends to the distant Passaic River. Cross-section B includes local, intermediate, and regional flow systems (
Figure 6). The local flow system similarly transports groundwater from the First Watchung Mountain recharge area to the nearby Peckman and Third Rivers. Intermediate flow systems, however, originate from the same recharge area but extend beyond local discharge points, reaching the midstream of the Third River but not the distant Passaic River. Additionally, intermediate systems recharge at the Third River and discharge at the Passaic River. The regional flow system, like in Cross-section A, flows from the First Watchung Mountain recharge area to the Passaic River. Schematics of the groundwater flow systems in Cross-sections A and B (
Figure 5b and
Figure 6b) further illustrate the multiple flow systems present in the study area, enhancing understanding of their dynamics.
3. Particle Tracking
Particle tracking analyzes groundwater flow paths and travel times and distances of advective contaminants. It uses hypothetical particles situated in certain locations to simulate solute movement, using the velocities from the groundwater flow models [
24]. A particle tracking model enables forward and backward tracking of particles in time, facilitating identification of water sources and contaminant sources. Particle tracking analysis also offers a valuable assessment of groundwater flow systems, as the model generates flow lines that clearly depict the types of flow systems present in a region. The model focuses solely on advective transport and does not consider the contaminants’ diffusion, dispersion, reactions, and degradation processes. The MODPATH code [
44] is used to execute particle tracking, delineating areas contributing water to wells and calculating the travel times and paths. According to Barry et al. [
27], particle tracking analysis is influenced by model boundary conditions, the hydraulic properties of the aquifer (hydraulic conductivity, porosity, etc.), and pumping well attributes (pumping rates and well depth). This implies that a pumping well can change the flow paths of particles. This study uses particle tracking to describe the aquifer flow patterns.
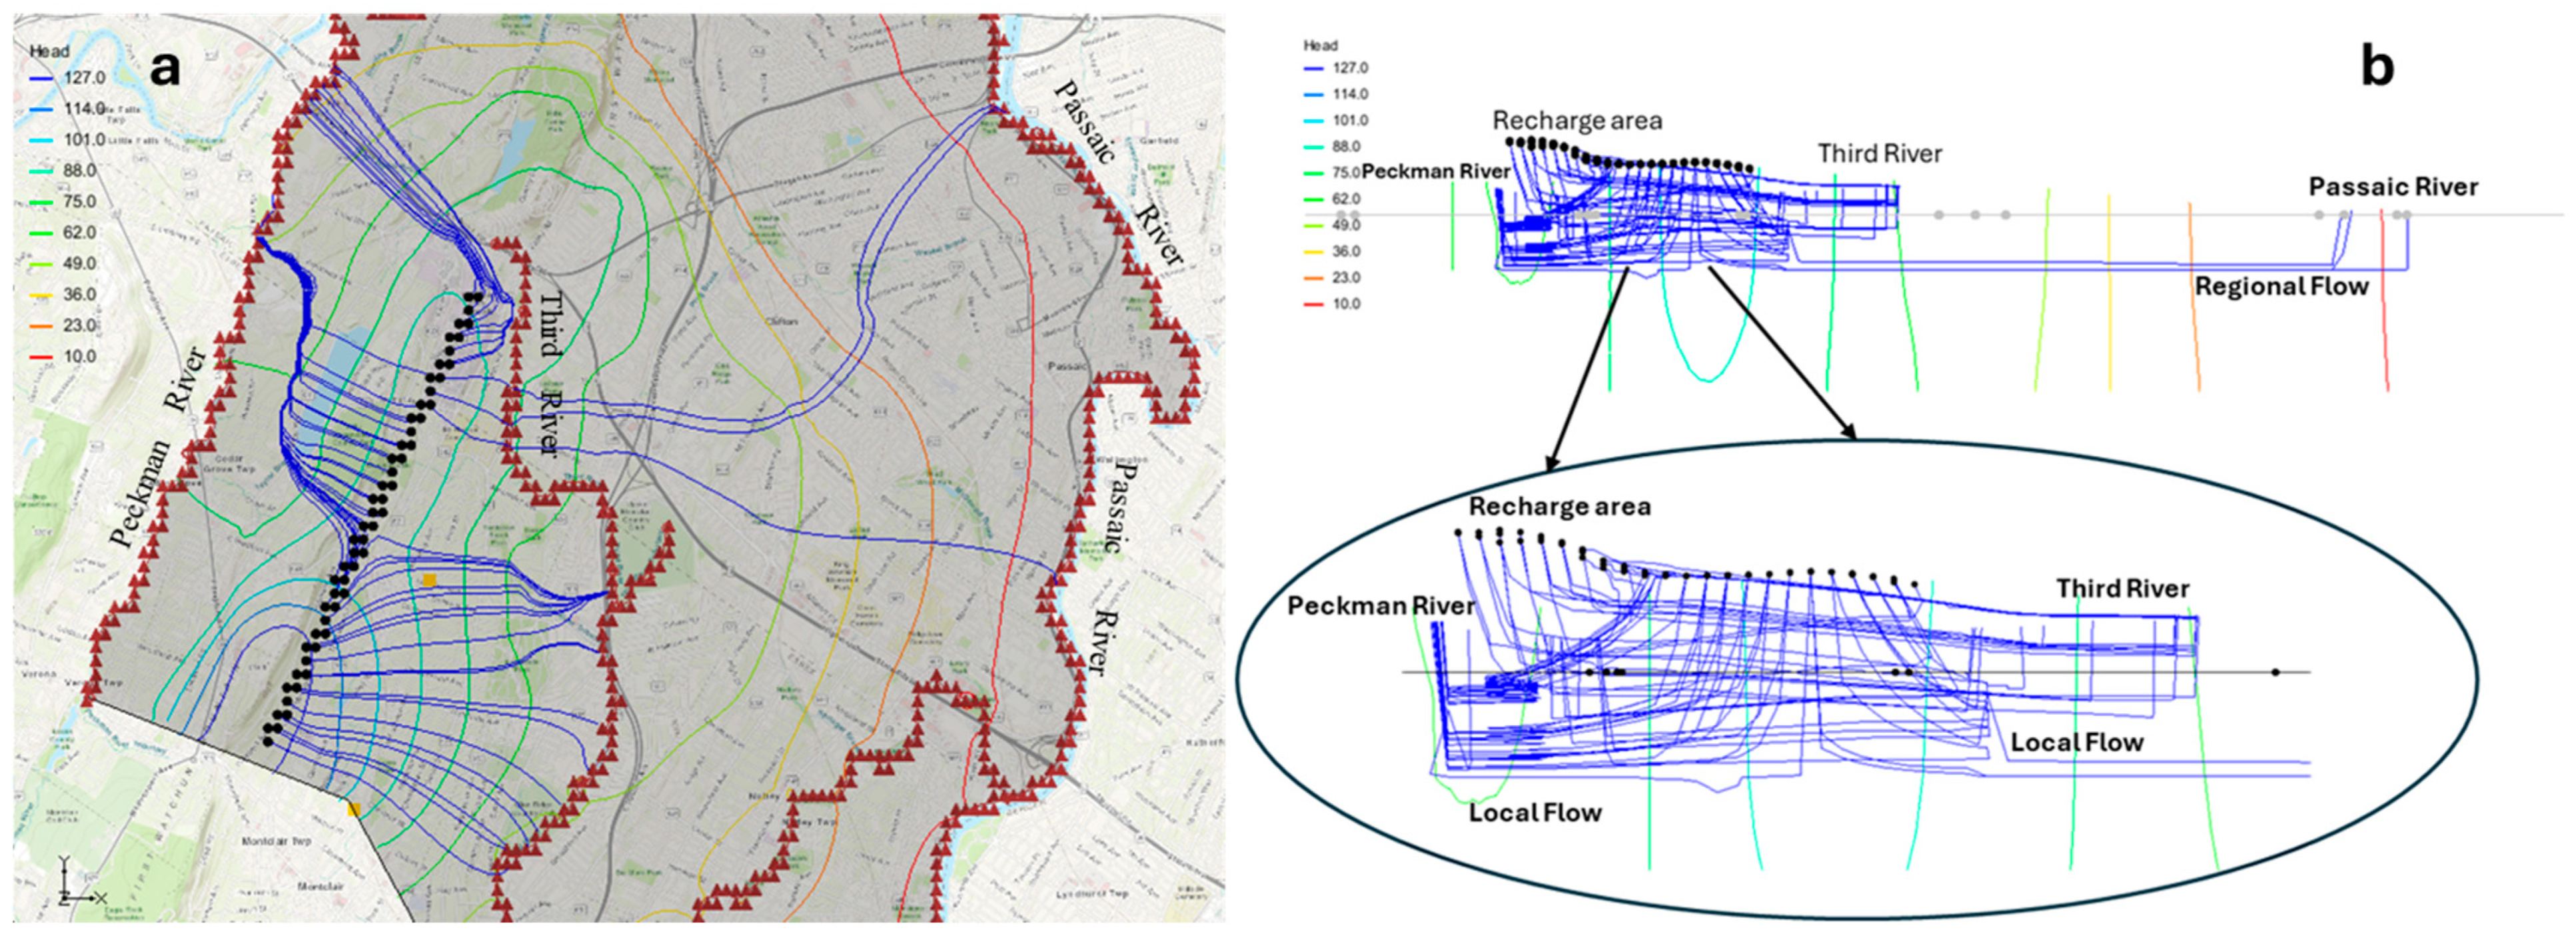
Particle tracking analysis was employed to evaluate groundwater flow systems and identify the types of flow systems in the study area. Particles were tracked in order to determine the transport characteristics of a conservative contaminant (chloride)’s movement through a “typical hydrogeologic environment” of northern New Jersey. Hypothetical particles were introduced into the recharge areas near the First Watchung Mountain. The analysis illustrates flow paths as particles travel from the recharge areas to discharge areas in the Peckman River, Third River, and Passaic River (
Figure 7). The cross-section of the particle tracking analysis reveals local flow systems, with particles moving toward the nearby Peckman and Third Rivers (
Figure 7b). Additionally, the analysis demonstrates regional flow systems, as particles move from the recharge areas to discharge points at the distant Passaic River. In the local flow systems, recharge and discharge zones are distributed intermittently across the basin. This indicates that drinking water sources that are closely located may have entirely different origins. Consequently, significant variations in chemical quality can be anticipated [
43]. As a result, contaminants in the Third River and Peckman River may originate from sources unrelated to the First Watchung Mountain.
The conservative nature of chloride makes it an ideal tracer in hydrologic investigations, facilitating accurate modeling of advective groundwater flow. This attribute enables chloride to serve as a reliable proxy for delineating contaminant pathways in groundwater systems. Due to its conservative nature, chloride ions typically do not undergo significant sorption in the aquifer. Instead, they may be retained in the immobile solution within the pores of the aquifer material, while solute transport continues in the mobile media of the fractures. Therefore, variability in aquifer porosity in a fractured rock system could result in varied impacts on particle paths, necessitating the need to use varied porosity values during the groundwater modeling process. For this reason, the particle tracking simulation employs two different porosity values to represent the Brunswick formation and the Brunswick fractured rock system.
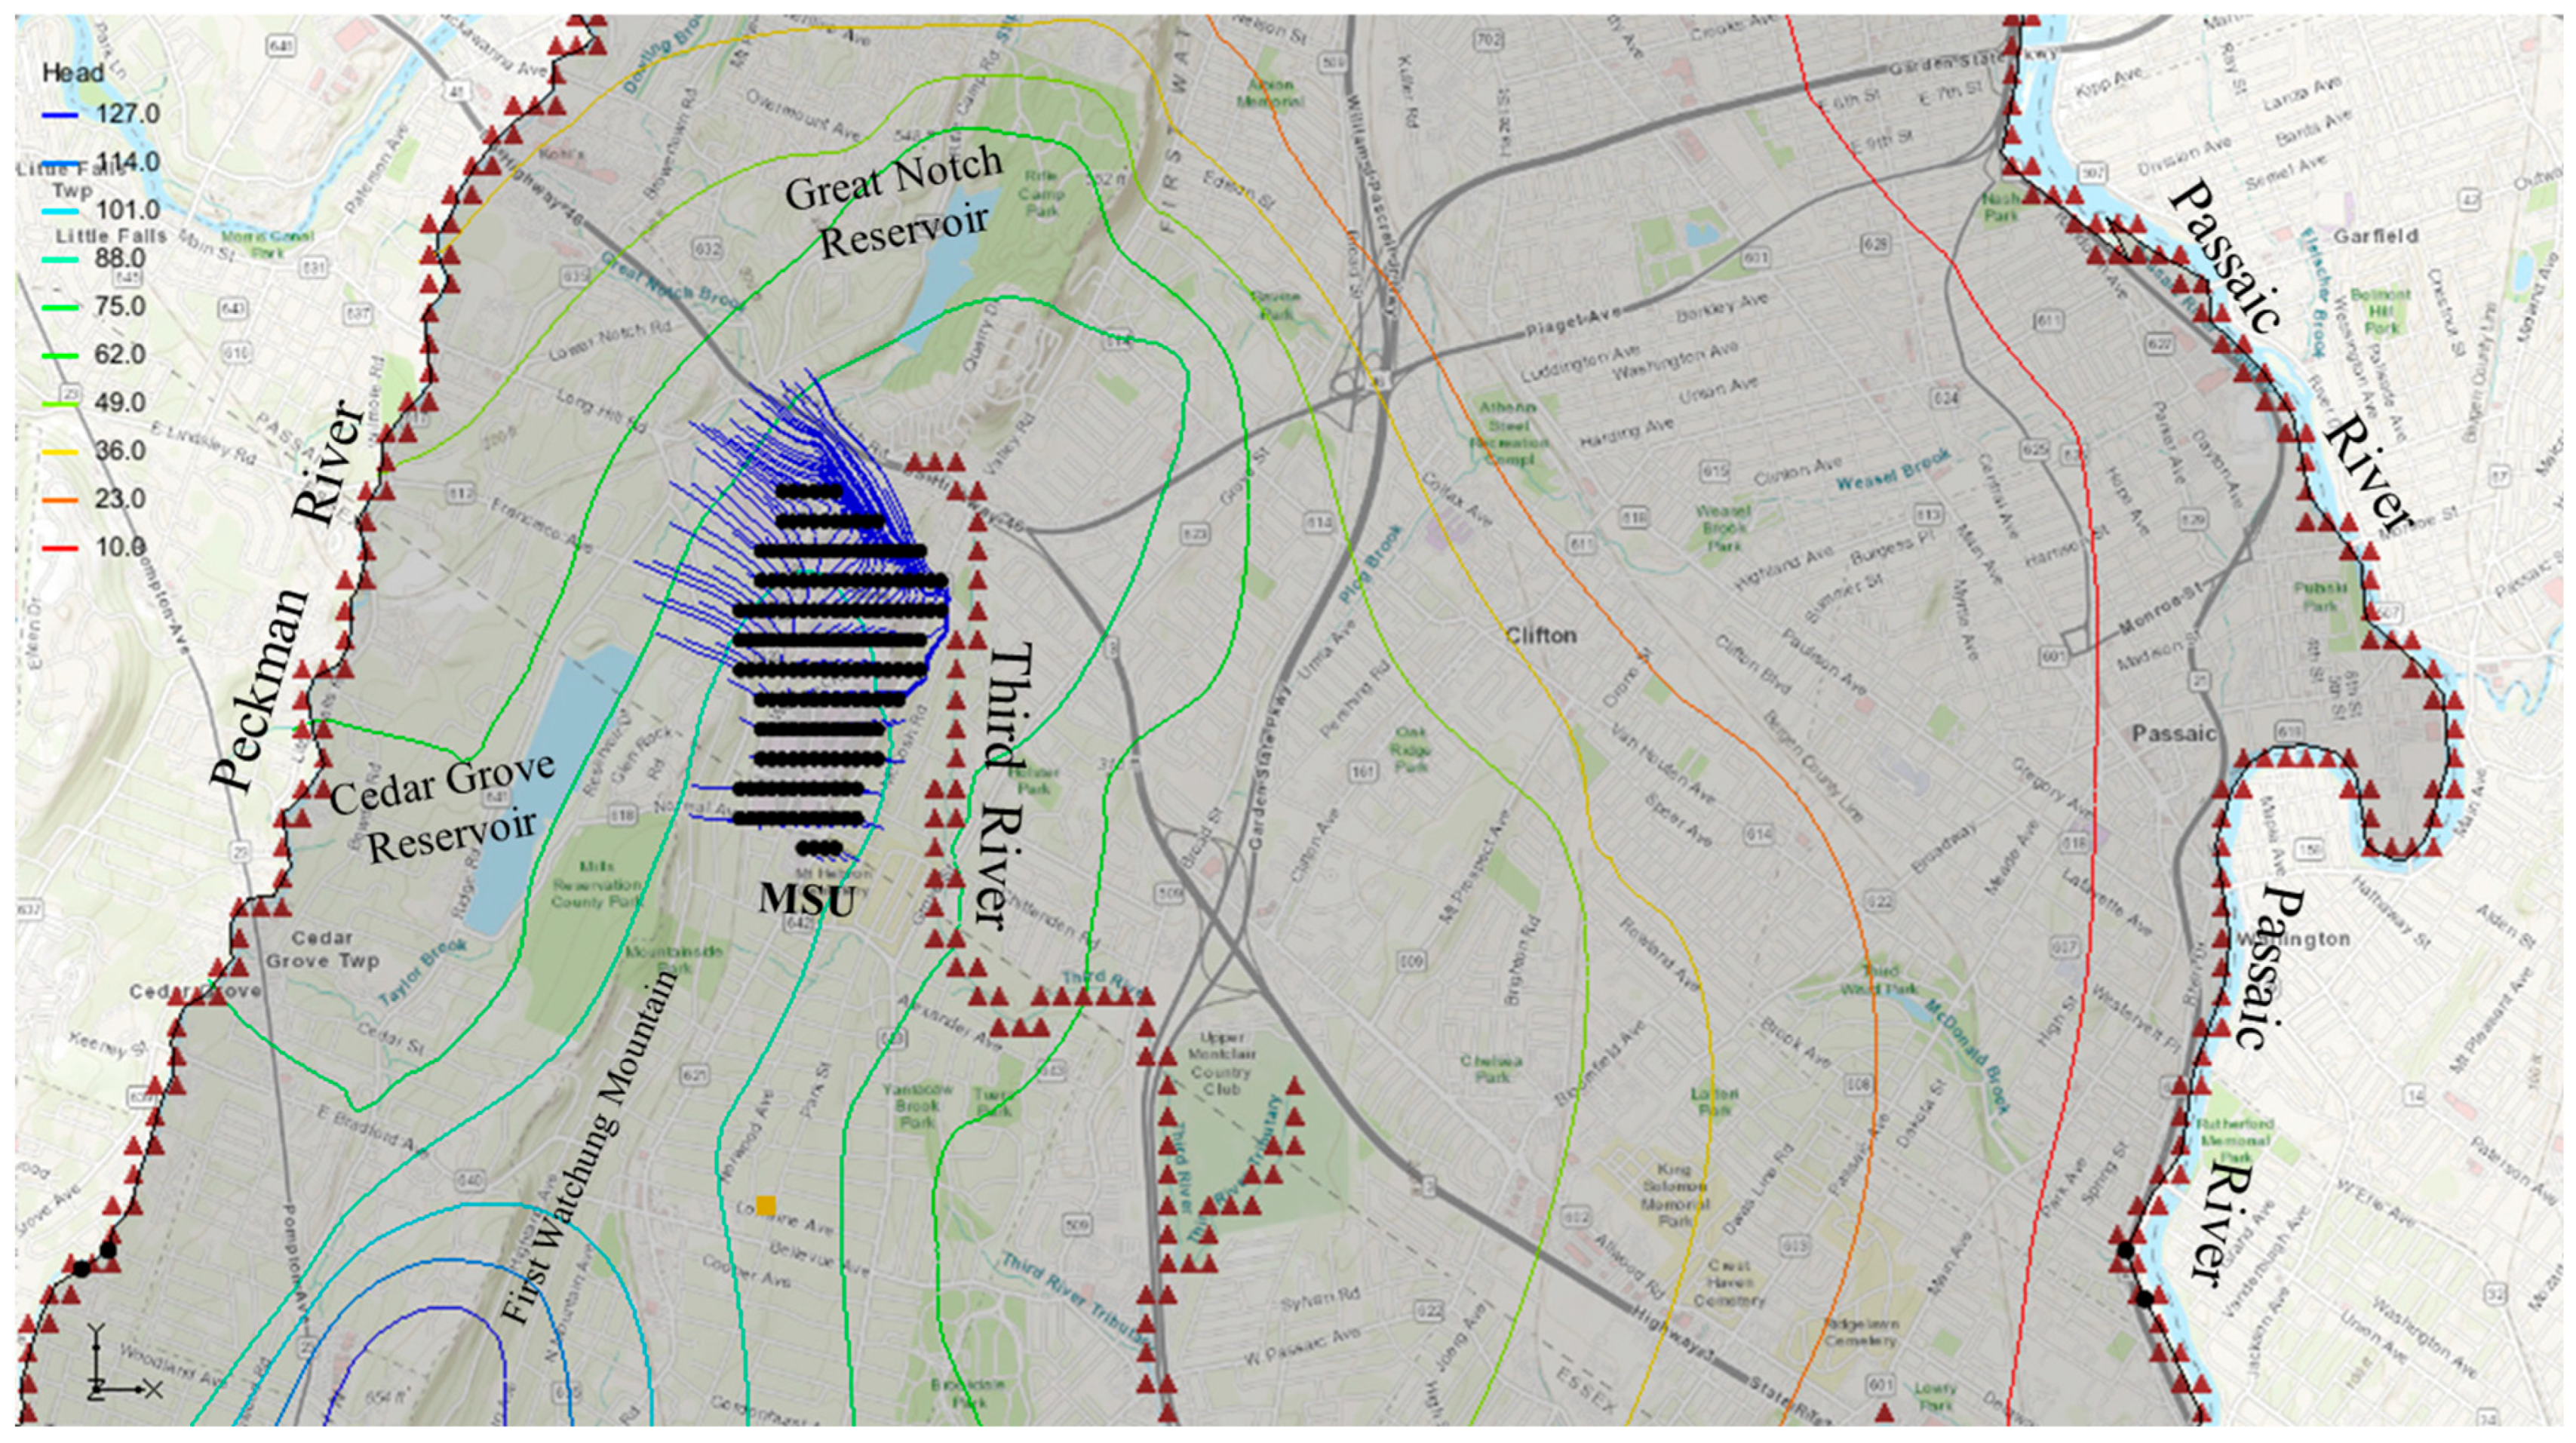
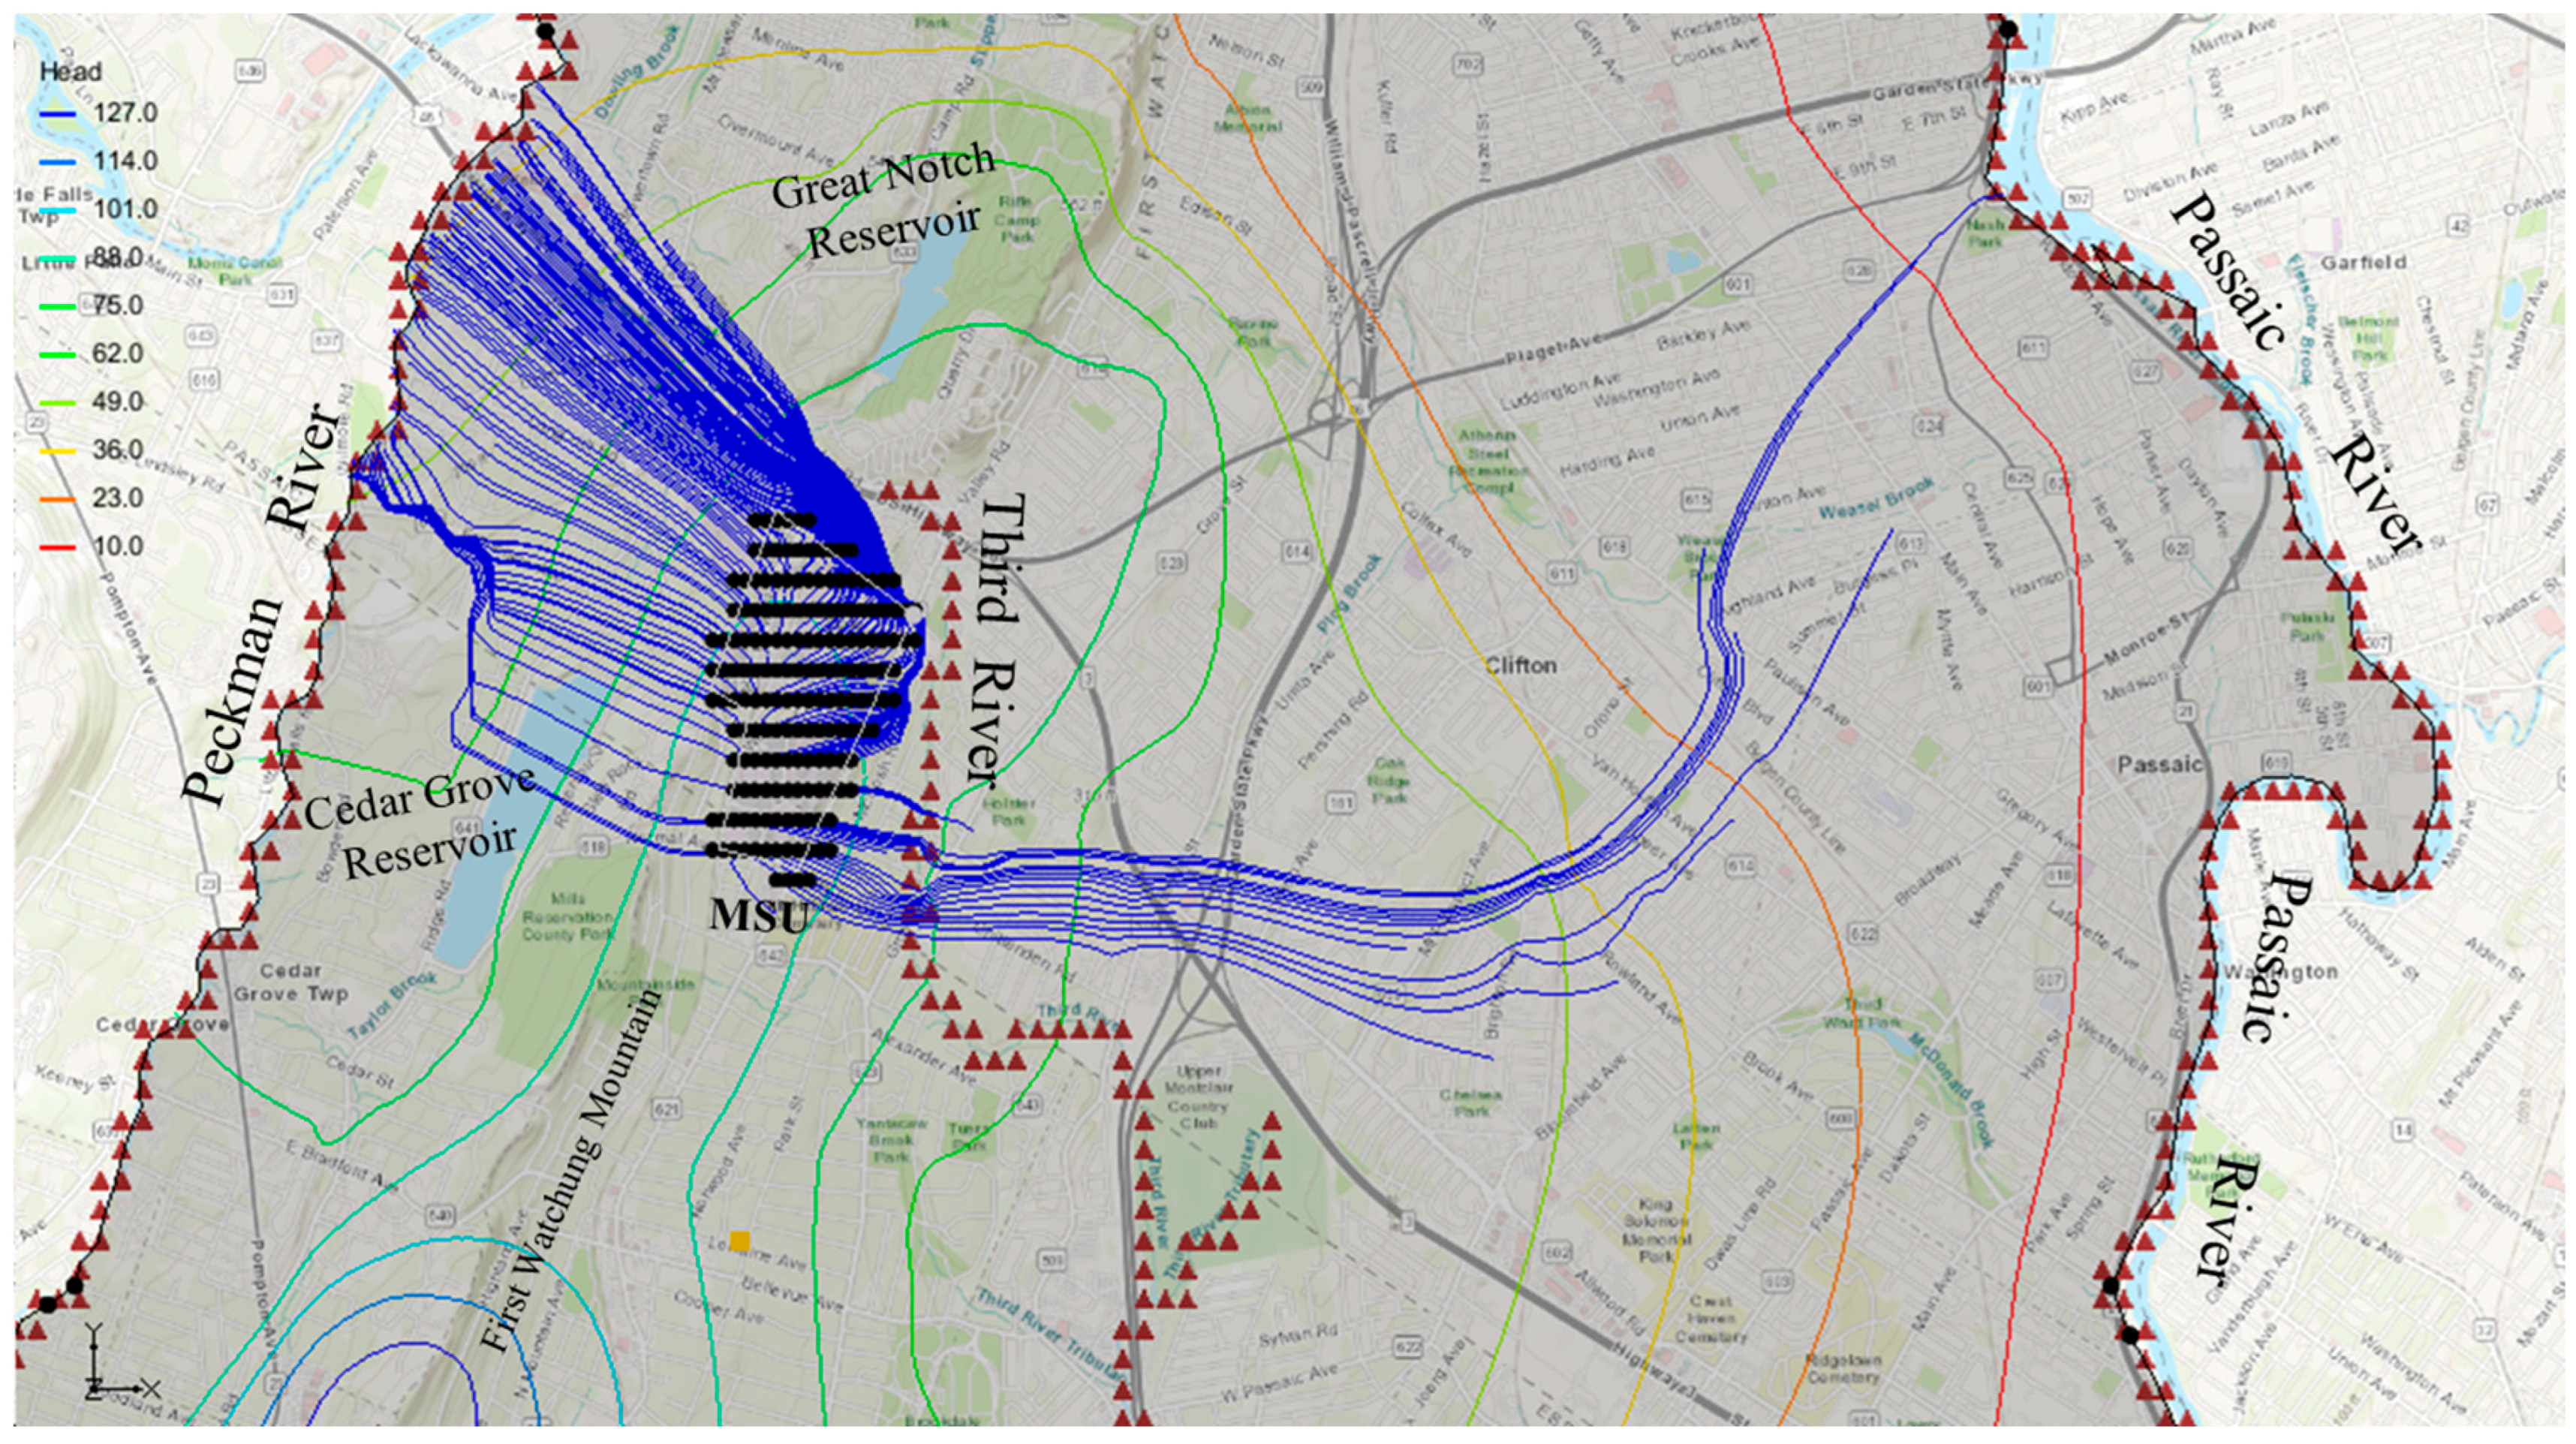
Travel paths, times, and distances of chloride particles from points of particle introduction to discharge points were determined using the MODPATH code. For this study, chloride particles were introduced at the Montclair State University community (MSU, a region identified as critically important) to conduct forward particle tracking from source to exit points. This is to simulate how chloride (possibly from deicing salts) may travel through a “typical hydrogeologic environment” of northern New Jersey. Particles were also located at municipal well locations for backward chloride tracking to determine possible sources of contaminants (e.g., deicing salts). Particles were placed strategically at MSU, and around the municipal wells, then respectively tracked forward for 1, 4, 8, 10, through 20 years of travel times from the university community. For the municipal wells, particles were tracked backward in time to their origin. About 59–200 particles were introduced to provide adequate capture of the hypothetical contaminant pathways. The forward and backward particle tracking models reveal the extent of particles’ travel and their associated travel times, paths, and distances. Porosity values for the groundwater system were set at 0.4 and 0.2, while the municipal wells were set to pump at 200 m3/s. The impact of variability of porosity on particle paths was observed. The particle tracking analysis revealed that particles introduced at MSU exited at surface water bodies, as discharge points, after a period of time. The porosity values of 0.4 and 0.2 resulted in distinctly varied particle movement.
The forward tracking analysis, utilizing a porosity value of 0.2, revealed that chloride particles from MSU reached the Third River, Cedar Grove reservoir, and the Peckman River within a 4-year travel time (
Figure 8). The particles traveling from MSU covered travel distances in local flow systems, ranging from 314–317 m (Third River), 815–822 m (Cedar Grove reservoir), and 2035 m (Peckman River). The forward analysis, based on a porosity value of 0.4 (
Figure 9), had particles that traveled shorter distances, of 141–150 m (Third River), 273–290 m (Cedar Grove reservoir), and 600 m (Peckman River) during the same time. The variation in travel distances signified potential travel of contaminants (possibly chloride from deicing salts) in different local flow systems of a typical hydrogeological environment in northern New Jersey.
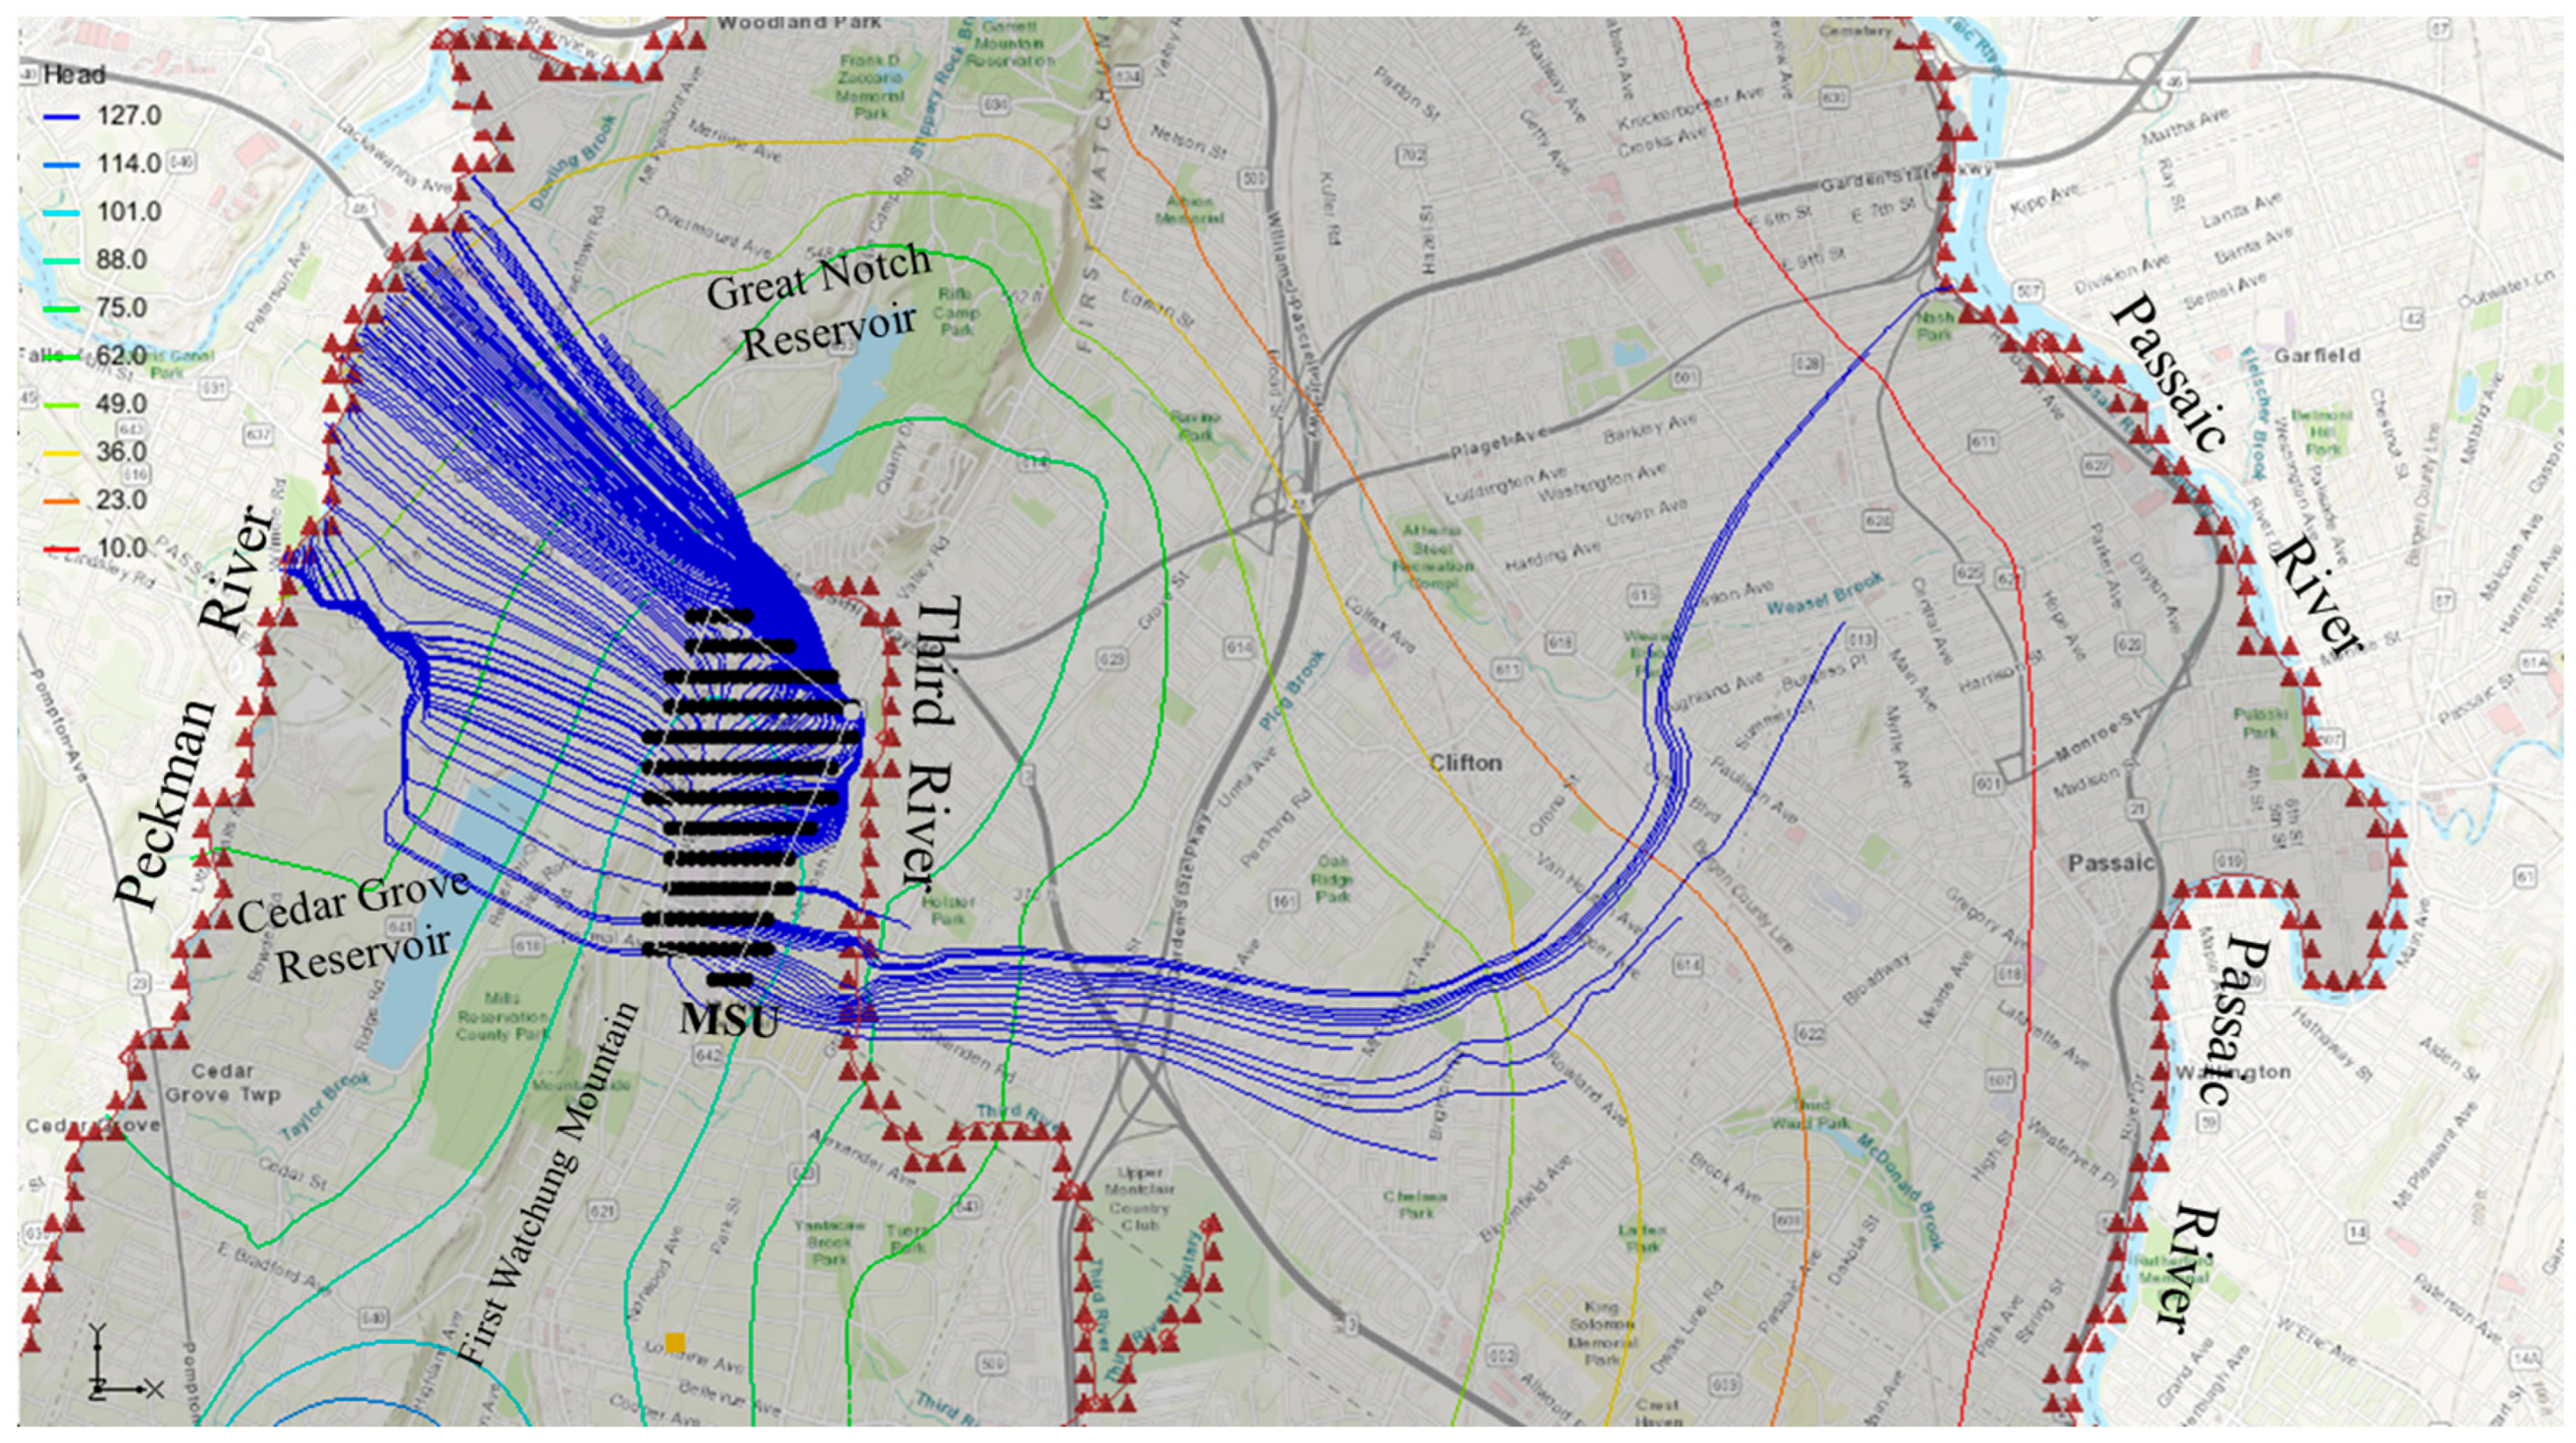
A forward particle tracking analysis was conducted to simulate the movement of chloride particles from MSU to the Passaic River. Using a porosity value of 0.2, the results indicated that the particles reached the river within a 10-year travel time, covering a distance of 7624 m (
Figure 10). On the contrary, the same analysis employing a porosity value of 0.4 revealed that the particles traveled 1040 m (
Figure 11), which is less than halfway to the Passaic River.
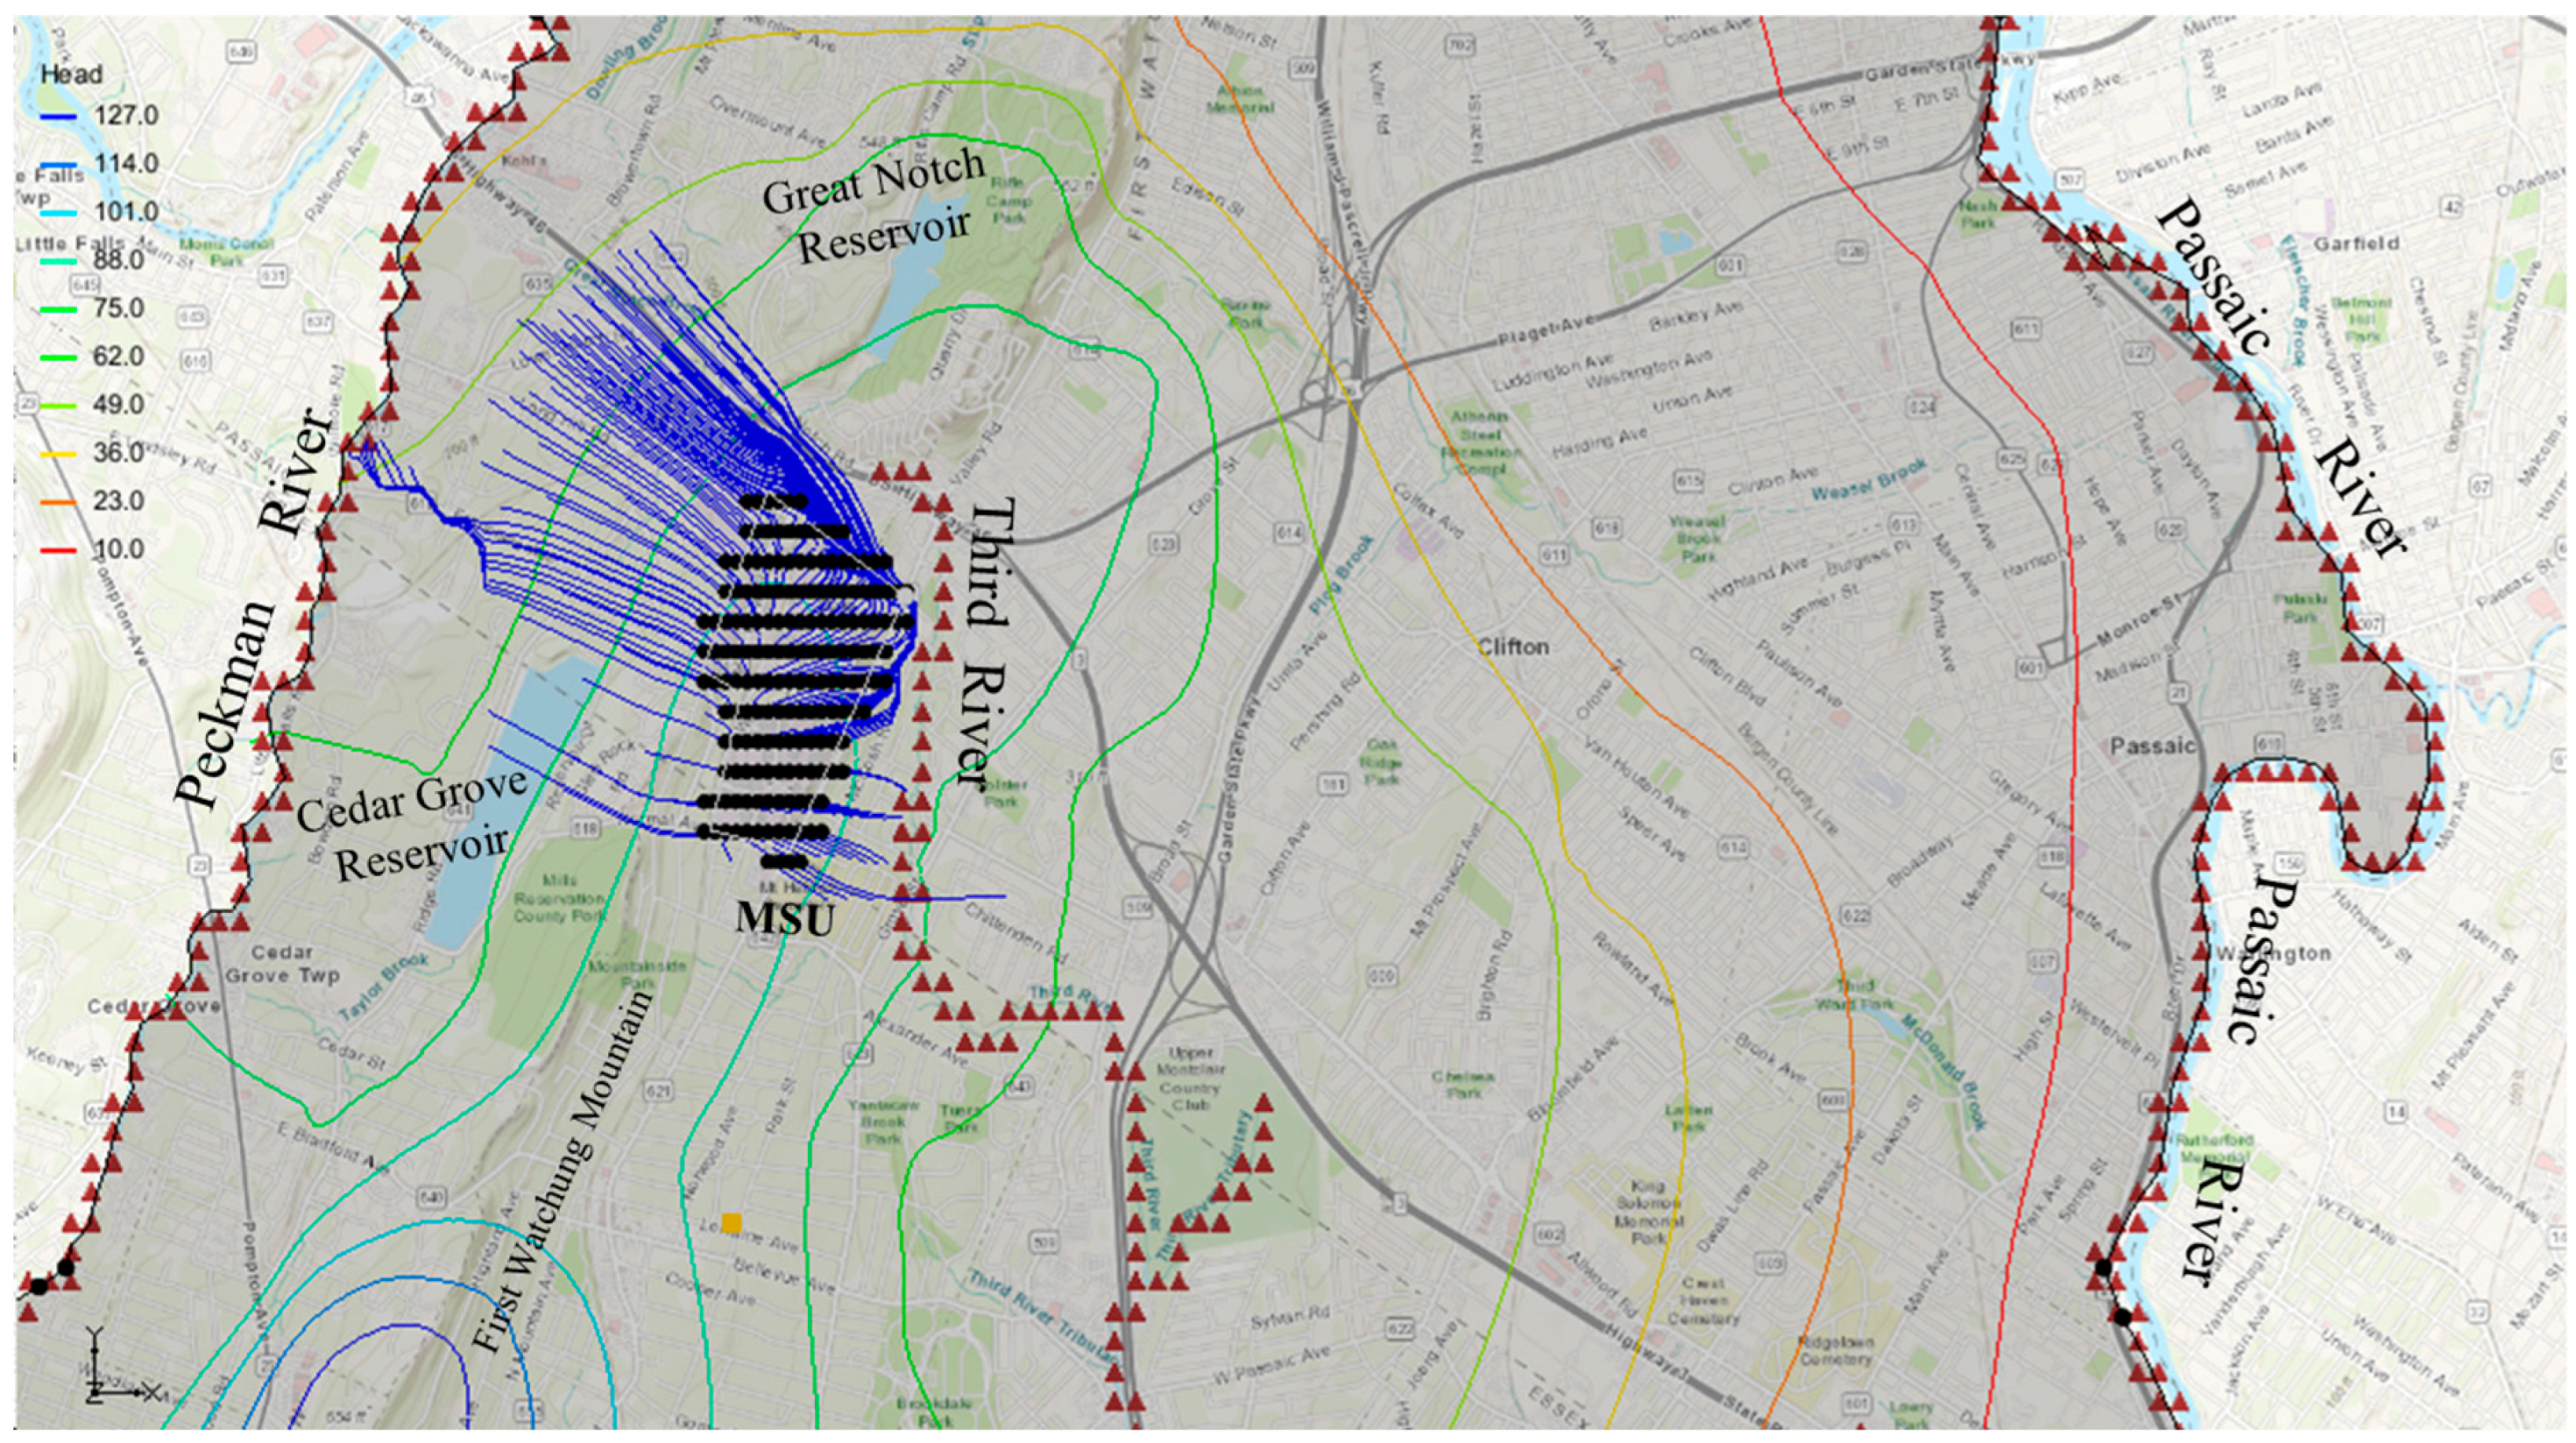
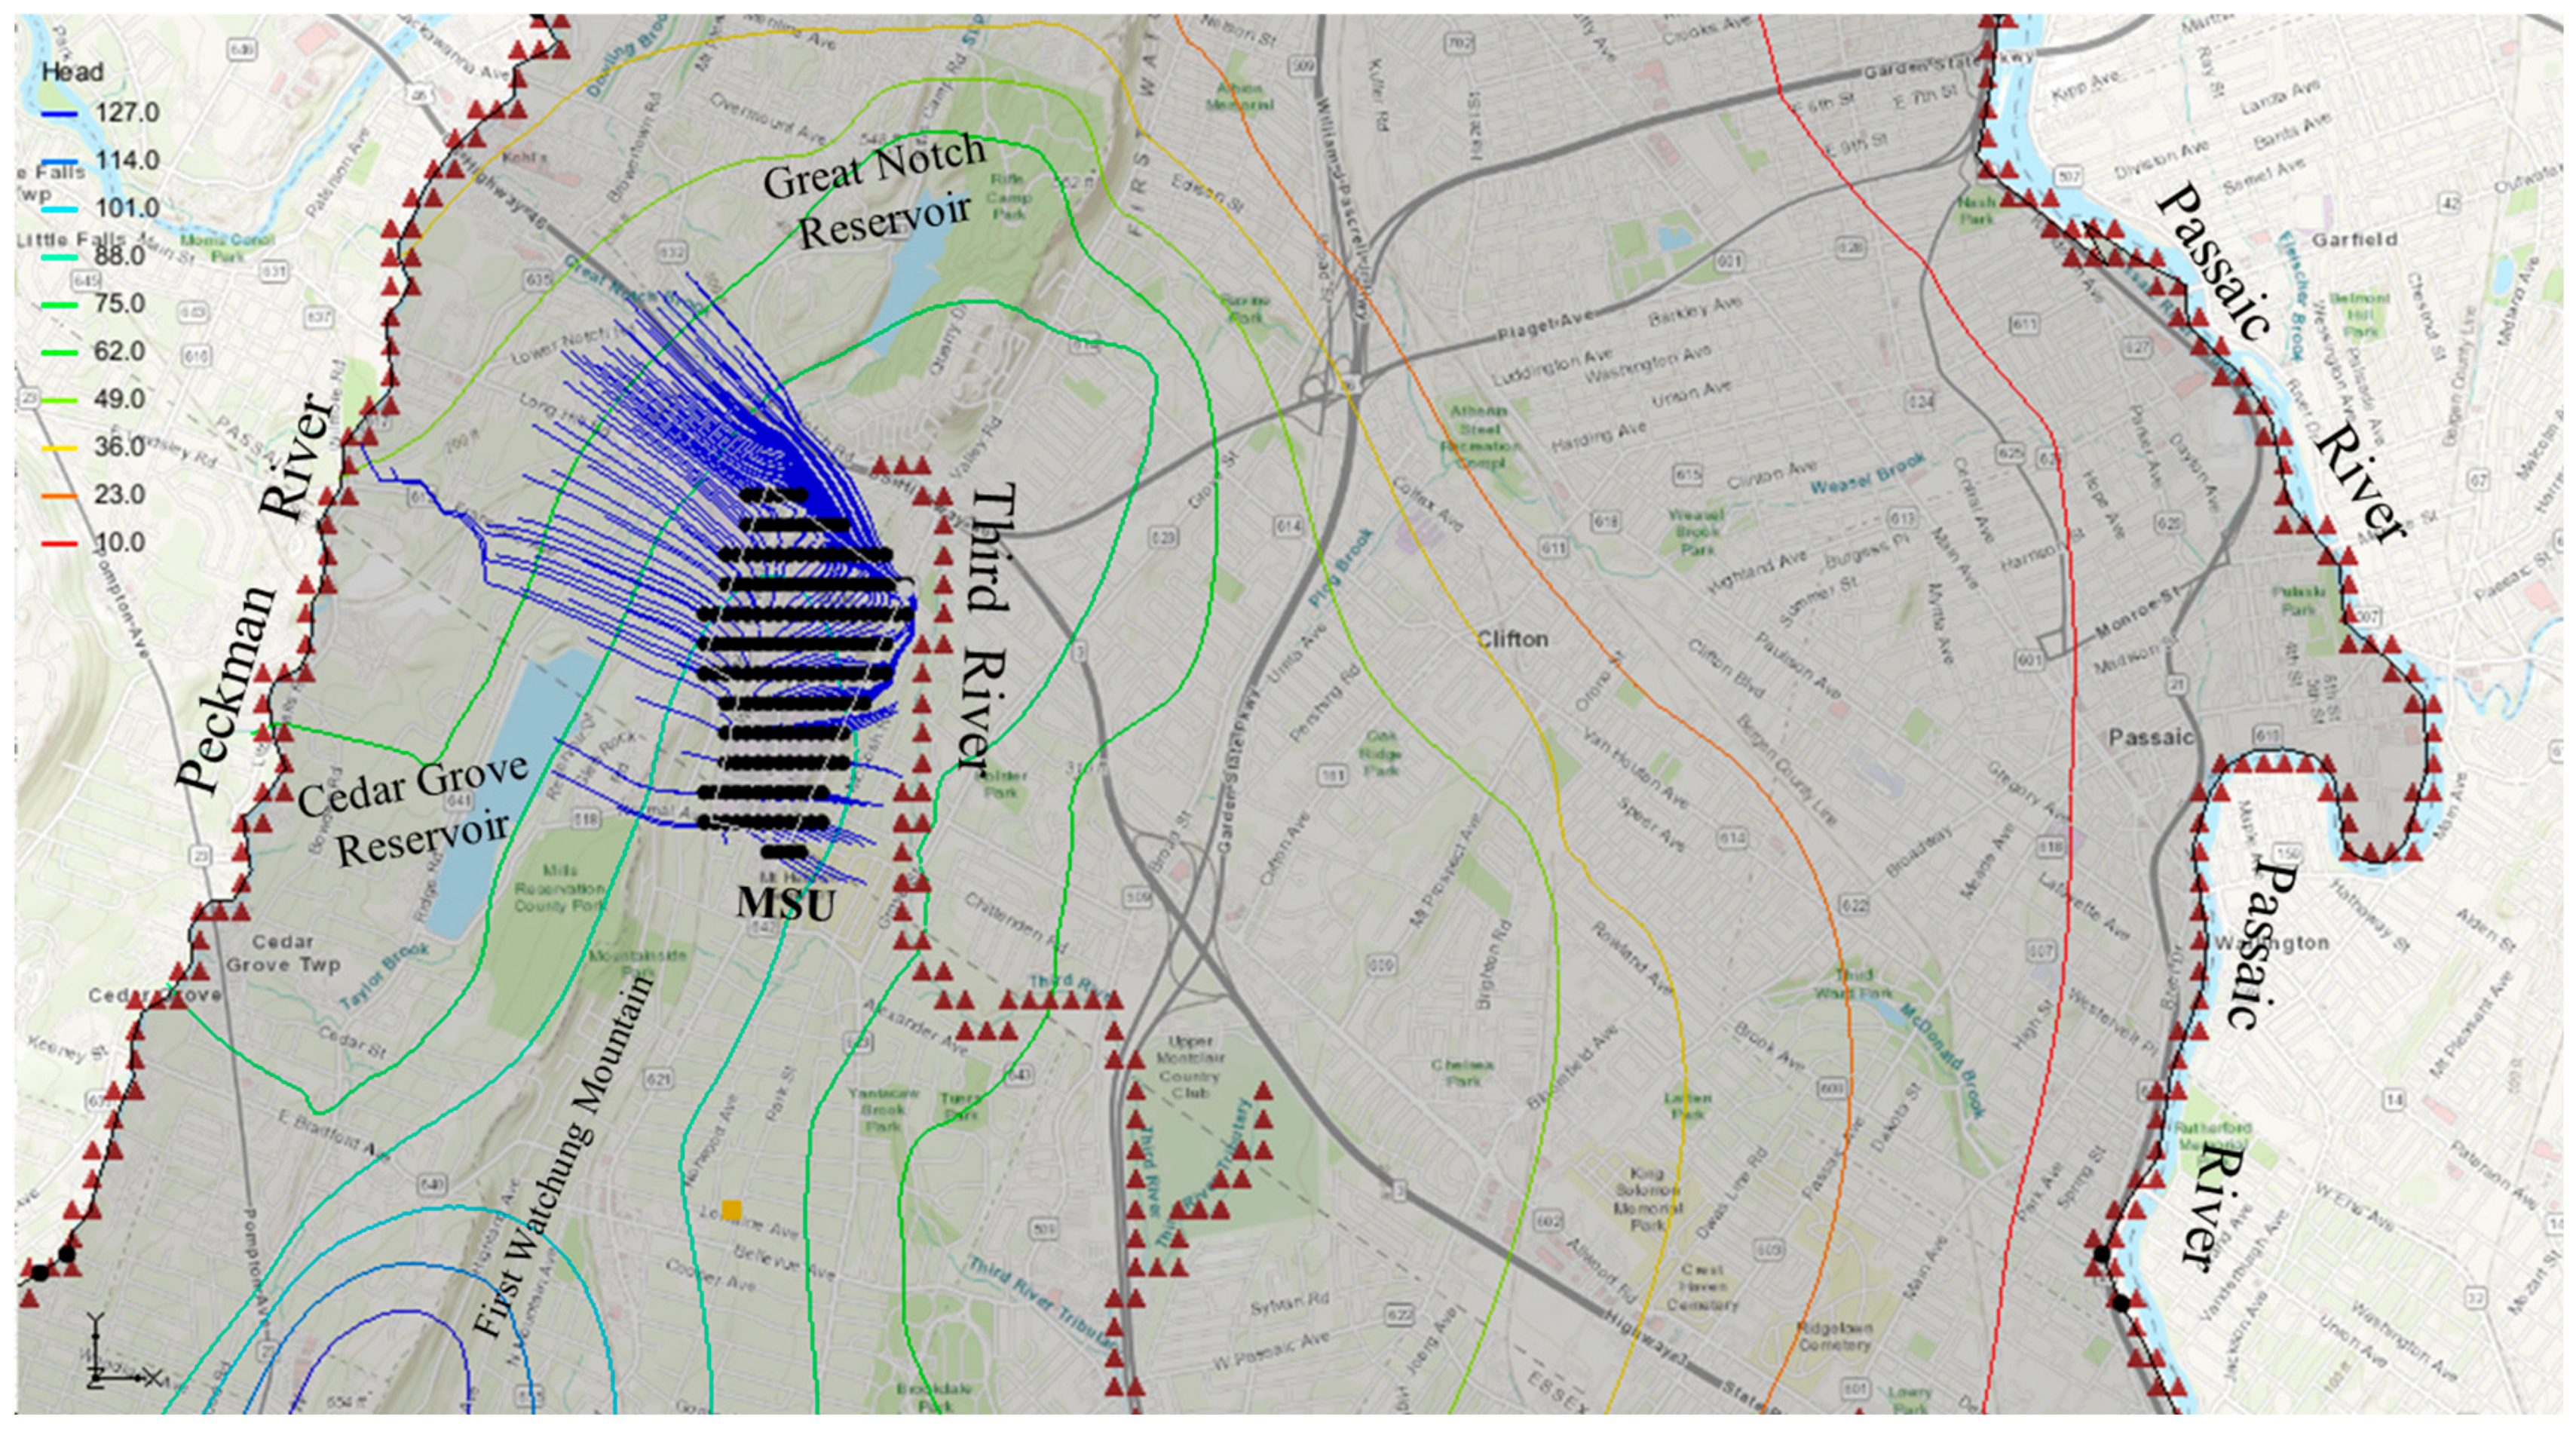
Utilizing a porosity value of 0.4, a forward particle tracking analysis demonstrated that chloride particles migrated to the areas around the Third River, Cedar Grove reservoir, and the Peckman River within an 8-year timeframe (
Figure 12). The particles from MSU traveled within the local flow system distances ranging from 315–318 m (Third River), 817–824 m (Cedar Grove reservoir), and 2038 m (Peckman River). After 20 years of travel, the forward particle tracking analysis revealed that chloride particles traveling within the regional flow system, through an aquifer of 0.4 porosity, arrived at the Passaic River (
Figure 13), with migrating distances of 7634 m from MSU.
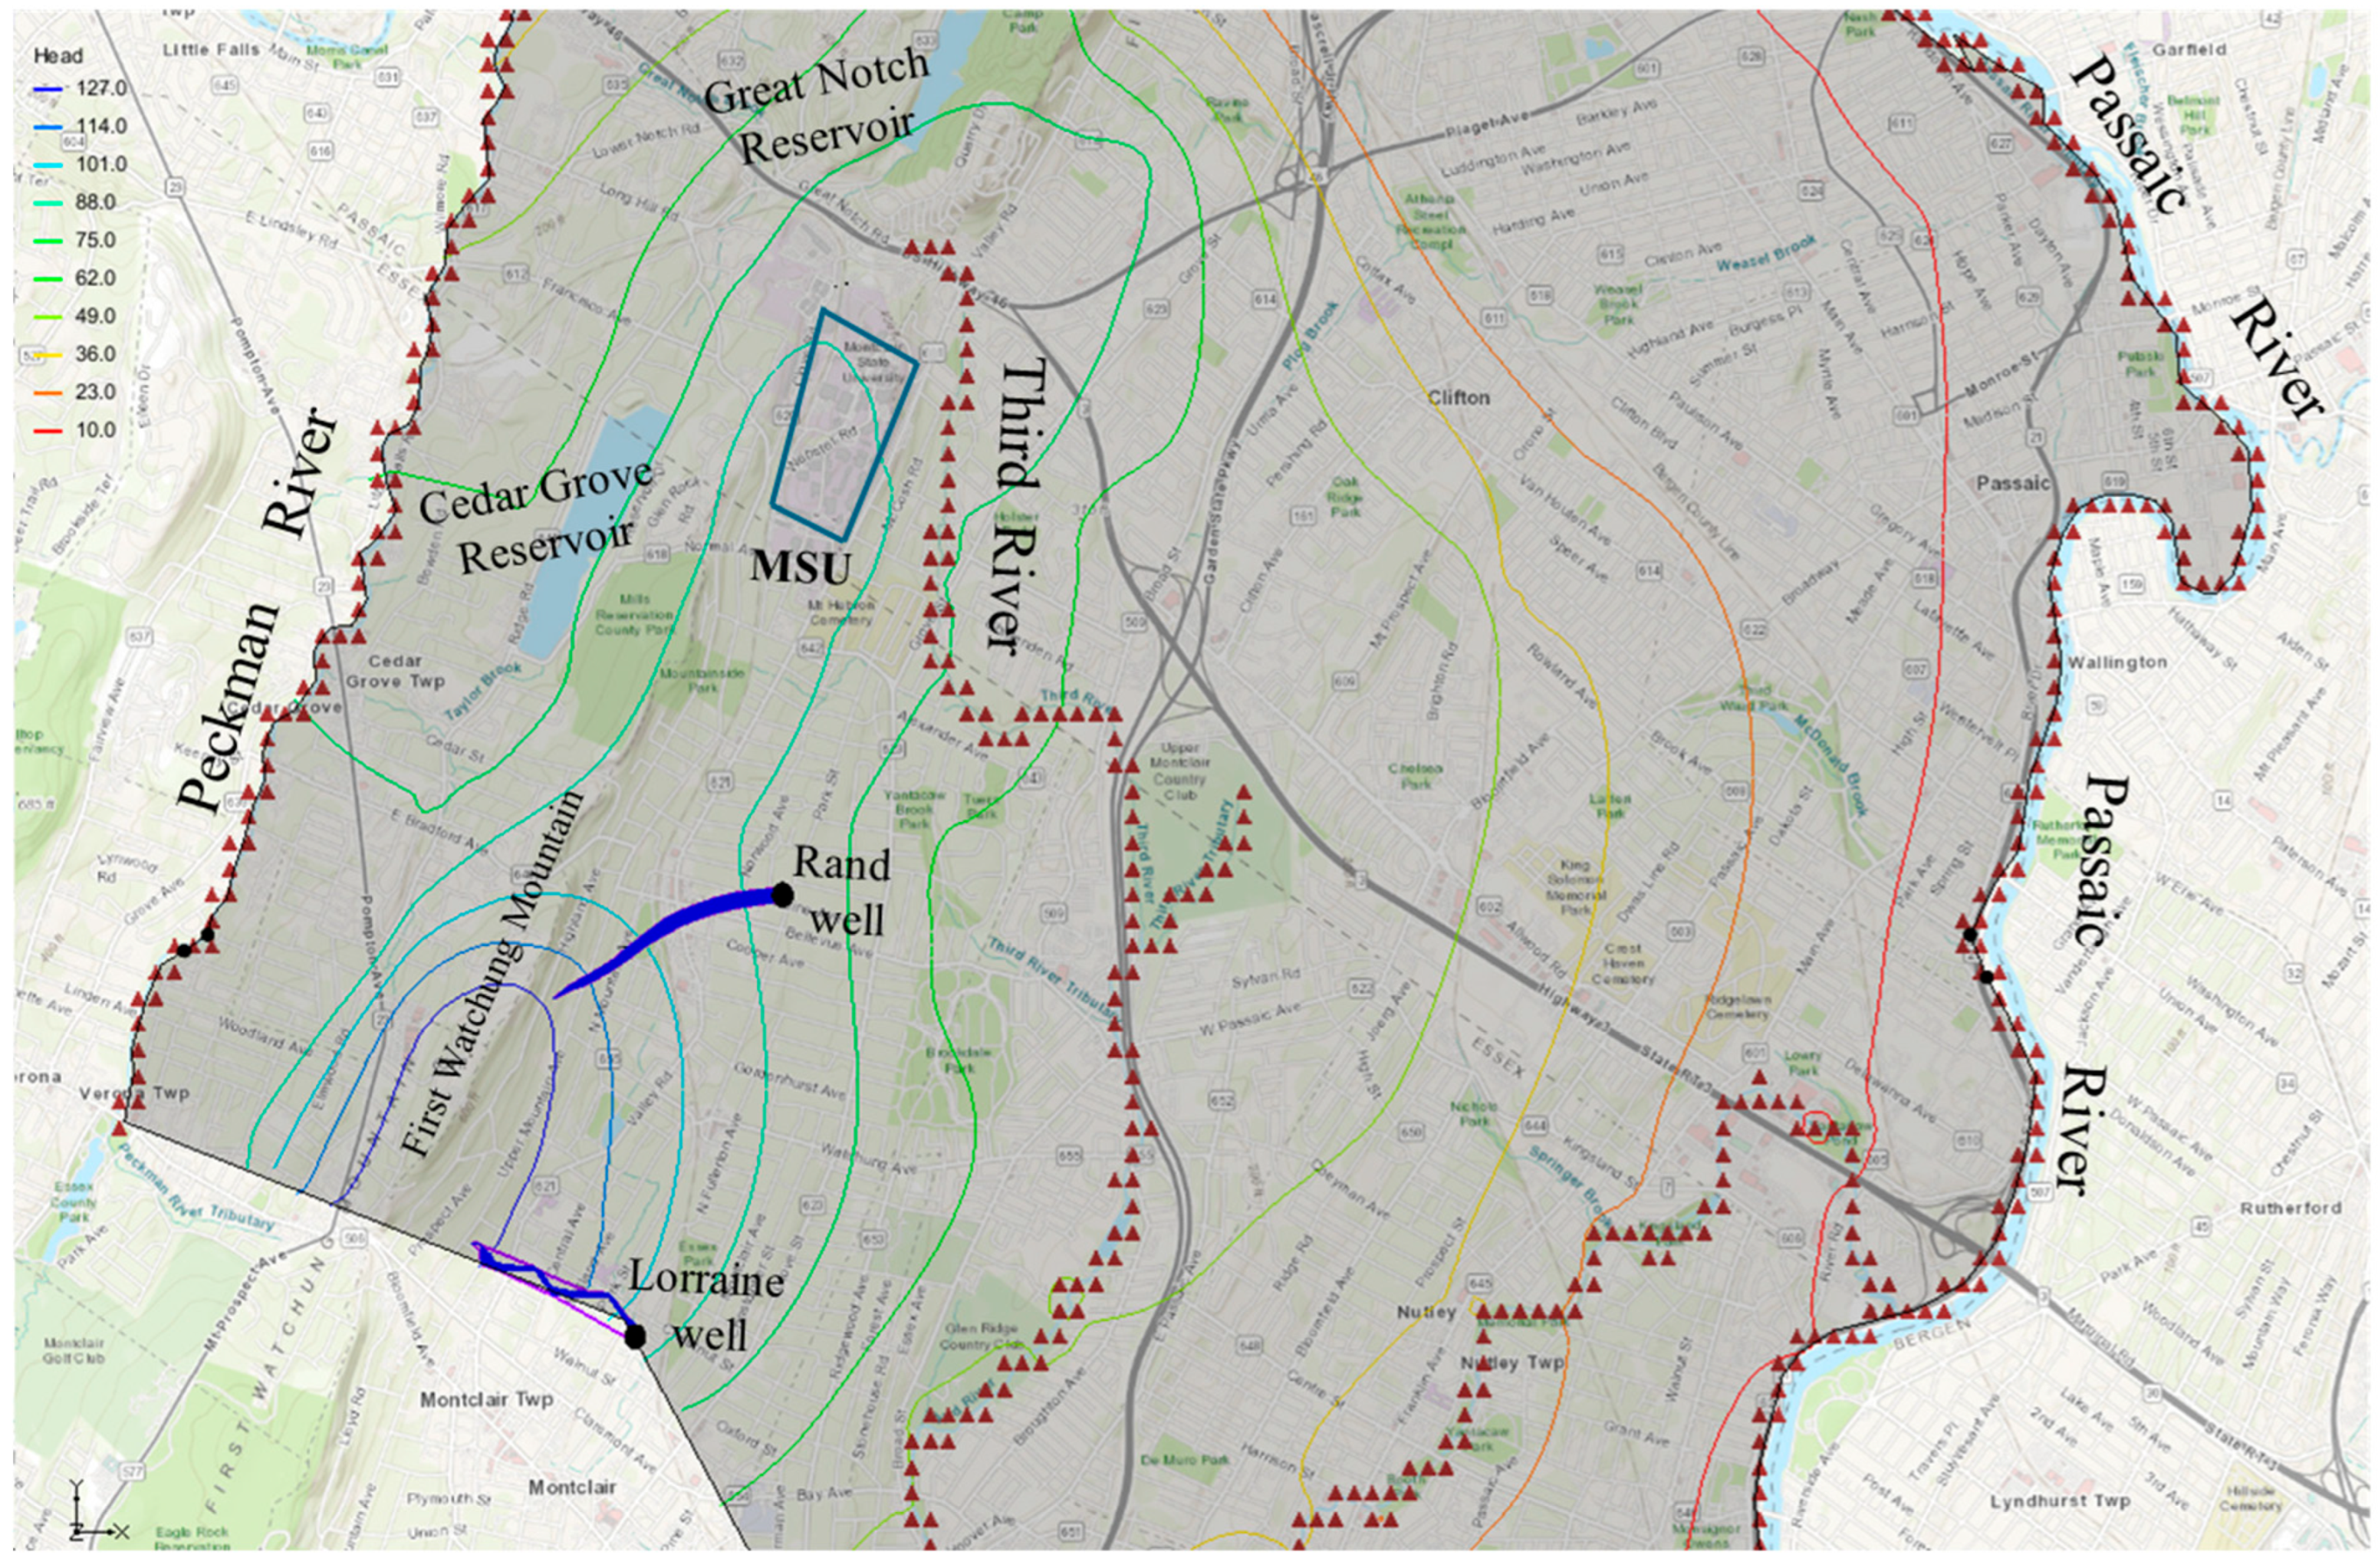
A backward particle tracking analysis was employed to investigate the movement of chloride particles from two Montclair Township municipal wells in order to determine areas contributing recharge waters to these wells, and also to identify potential contamination sources to the wells (
Figure 14). The results of this analysis, regardless of the porosity values used, revealed that the wells are recharged by water from the First Watchung Mountain. This water would possibly carry potential harmful contaminants to the municipal wells. The analysis revealed that water from MSU would not recharge the municipal wells, nor would it contribute contaminants through the groundwater transport process.
The arrival times of the chloride particles at reservoirs and surface water bodies varied with different porosity values. The tracking analysis revealed that chloride particles would arrive faster at the various discharge points with lower porosity values relative to higher values, corroborating studies from Lewis-Brown et al. [
28]. This analysis suggests that in fractured groundwater systems with geology like the Brunswick aquifer, contaminant travel would vary in distance and time as a result of the variation in aquifer properties (such as porosity). This could pose a threat to remediation processes, as some of the rock may hold back contaminants in their pores long after the bulk of the contaminants has been flushed in the mobile phase of transport.
The particle tracking analysis indicates that MSU will contribute neither recharge water nor contaminants to the municipal wells. However, contaminants could be carried in runoff to areas that directly recharge the municipal wells. There is a chance that contaminants that arrive at the Third River may interact with areas that directly recharge the municipal wells. Particles arriving at the Third River may be recharged to reach the Passaic River earlier than the 10-year and 20-year travel times that were predicted with aquifer porosities of 0.2 and 0.4, respectively. Since the Third River is a tributary of the Passaic River, it is plausible that chloride particles could migrate to the Passaic River within a 4-year timeframe via surface-water pathways. This tracking analysis does not account for processes such as runoff, which could potentially facilitate even shorter travel times to the Passaic River than the 10–20 years indicated by the tracking. This simulation also does not account for solute dispersion. Consequently, the travel times computed through particle tracking analysis do not represent the initial arrival of reactive solutes at rivers or wells. Rather, the analysis provides an approximation of how long it will take for the main cluster of particles (simulating conservative contaminants like chlorides from deicing salts) to reach discharge locations (rivers or wells). As indicated by Nicholson and Watt [
45], it is crucial to recognize that when a well is recharged from underlying water-bearing zones separated by a confining layer, the recharge area contributing to the well may not necessarily include the wellhead site. Nevertheless, this hypothetical groundwater transport study provides an elaborate understanding of the travel pathways, times, and distances of potential contaminants (like salts from deicing) in typical regional groundwater flow systems in northern New Jersey.
3.1. Implications for Contaminant Transport and Remediation
The heterogeneous nature of aquifer porosity values in fractured rock aquifers, particularly in systems like the Brunswick aquifer, creates distinct challenges for contaminant management. This heterogeneity leads to contaminant accumulation within aquifer material pores, where migration into the rock matrix significantly reduces particle mobility. Even after remediation efforts like well cleanup and flushing with clean water, these retained contaminants can gradually remobilize, undermining treatment effectiveness [
17]. Such persistence presents substantial groundwater management challenges, especially when compounded by salinization risks from deicing salt constituents like chloride [
2,
6,
12].
Particle tracking analyses provide critical insights into contaminant behavior within northern New Jersey’s characteristic “typical hydrogeological environment”. These studies reveal how chloride and similar contaminants move through local, intermediate, and regional groundwater systems, with transport characteristics that are highly varied between different flow regimes [
24,
28,
43]. Three key findings emerge from this study:
These results enable more targeted protection of critical water resources, including the Third River and Peckman River, through enhanced early detection capabilities and optimized intervention approaches [
12]. The demonstrated relationship between porosity and contaminant mobility particularly emphasizes the need for precise hydrogeological characterization in remediation planning.
3.2. Management Implications for Fractured-Rock Aquifer Protection
This study highlights two pressing management challenges with direct consequences for water protection. First, contaminants like chloride do not simply flow through fractured aquifers—they linger. Trapped in rock pores long after initial infiltration, they gradually release back into groundwater, undermining remediation efforts. Second, the First Watchung Mountain’s critical role as the region’s primary recharge area makes it disproportionately vulnerable; every deicing salt application here ripples through the entire groundwater system.
These insights demand targeted action:
Strategic Monitoring—Focus surveillance on the First Watchung recharge zone and key discharge points like the Third River, where our models show that contaminants arrive first (within 4 years). Prioritizing these early-warning areas allows faster response to salinity spikes.
Adaptive Remediation—Cleanup designs must account for the dual behavior of fractured rock. While pumps can flush contaminants from fractures, the surrounding matrix slowly releases stored pollutants—requiring longer treatment timelines and technologies tailored to porosity differences.
Recharge-Zone Safeguards—Reduce salt infiltration at its source by implementing protective buffers around high-recharge areas. Alternative deicers, application limits, and permeable surfaces can significantly cut chloride loading while maintaining winter safety.
Infrastructure Alignment—Groundwater flow maps should guide development. Avoiding disruption to natural flow paths—like siting new roads away from recharge zones—preserves the system’s natural resilience.
By matching management strategies to the aquifer’s unique system, we can better protect water supplies from both immediate contamination and long-term salinity buildup.
4. Conclusions
This study provides a comprehensive analysis of groundwater flow and contaminant transport dynamics in a “typical hydrogeological environment” of northern New Jersey, characterized by fractured-rock aquifers with complex porosity heterogeneity. Our integrated modeling approach, combining MODFLOW and MODPATH simulations, reveals three distinct but interconnected groundwater flow systems: (1) local systems discharging to the Peckman and Third Rivers within 4–8 years, (2) intermediate systems that terminate before reaching the regional discharge zone, and (3) regional systems requiring 10–20 years to reach the Passaic River. The First Watchung Mountain was identified as the dominant recharge source for both municipal wells and regional flow systems, highlighting its critical role in the area’s groundwater sustainability. Our findings demonstrate that chloride contaminants from urban sources like deicing salts can traverse these fractured systems surprisingly quickly, reaching sensitive discharge points in as little as four years under certain porosity conditions.
The stark contrast in transport times between low-porosity fractures (0.2) and higher-porosity zones (0.4) demonstrates the multifaceted behavior of contaminant movement through these geological formations. While fractures serve as rapid conduits, the surrounding rock matrix acts as both a temporary sink and potential long-term source of contamination through gradual remobilization. This dual behavior presents unique challenges for remediation efforts, particularly in urban areas where road salt application is a persistent pressure on groundwater quality. The particle tracking analysis provides particularly valuable insights, showing clear separation between pathways serving municipal wells and those discharging at surface waters—a distinction with important implications for targeted protection strategies.
Looking ahead, these findings open several promising avenues for further research. The clear influence of porosity on transport dynamics suggests that more detailed characterization of fracture networks could significantly improve predictive models. There is also compelling evidence that transient hydrological conditions and geochemical interactions deserve greater attention in future modeling efforts. Perhaps most importantly, this study establishes a methodological framework that can be adapted to other urbanized areas underlain by fractured-rock aquifers, where balancing water supply needs with quality protection remains an ongoing challenge. The lessons learned here in northern New Jersey’s complex hydrogeological environment may well inform groundwater management strategies in similar settings across the globe.


