
Impacts of Urbanization and Climate Variability on Groundwater Environment in a Basin Scale


Abstract
1. Introduction
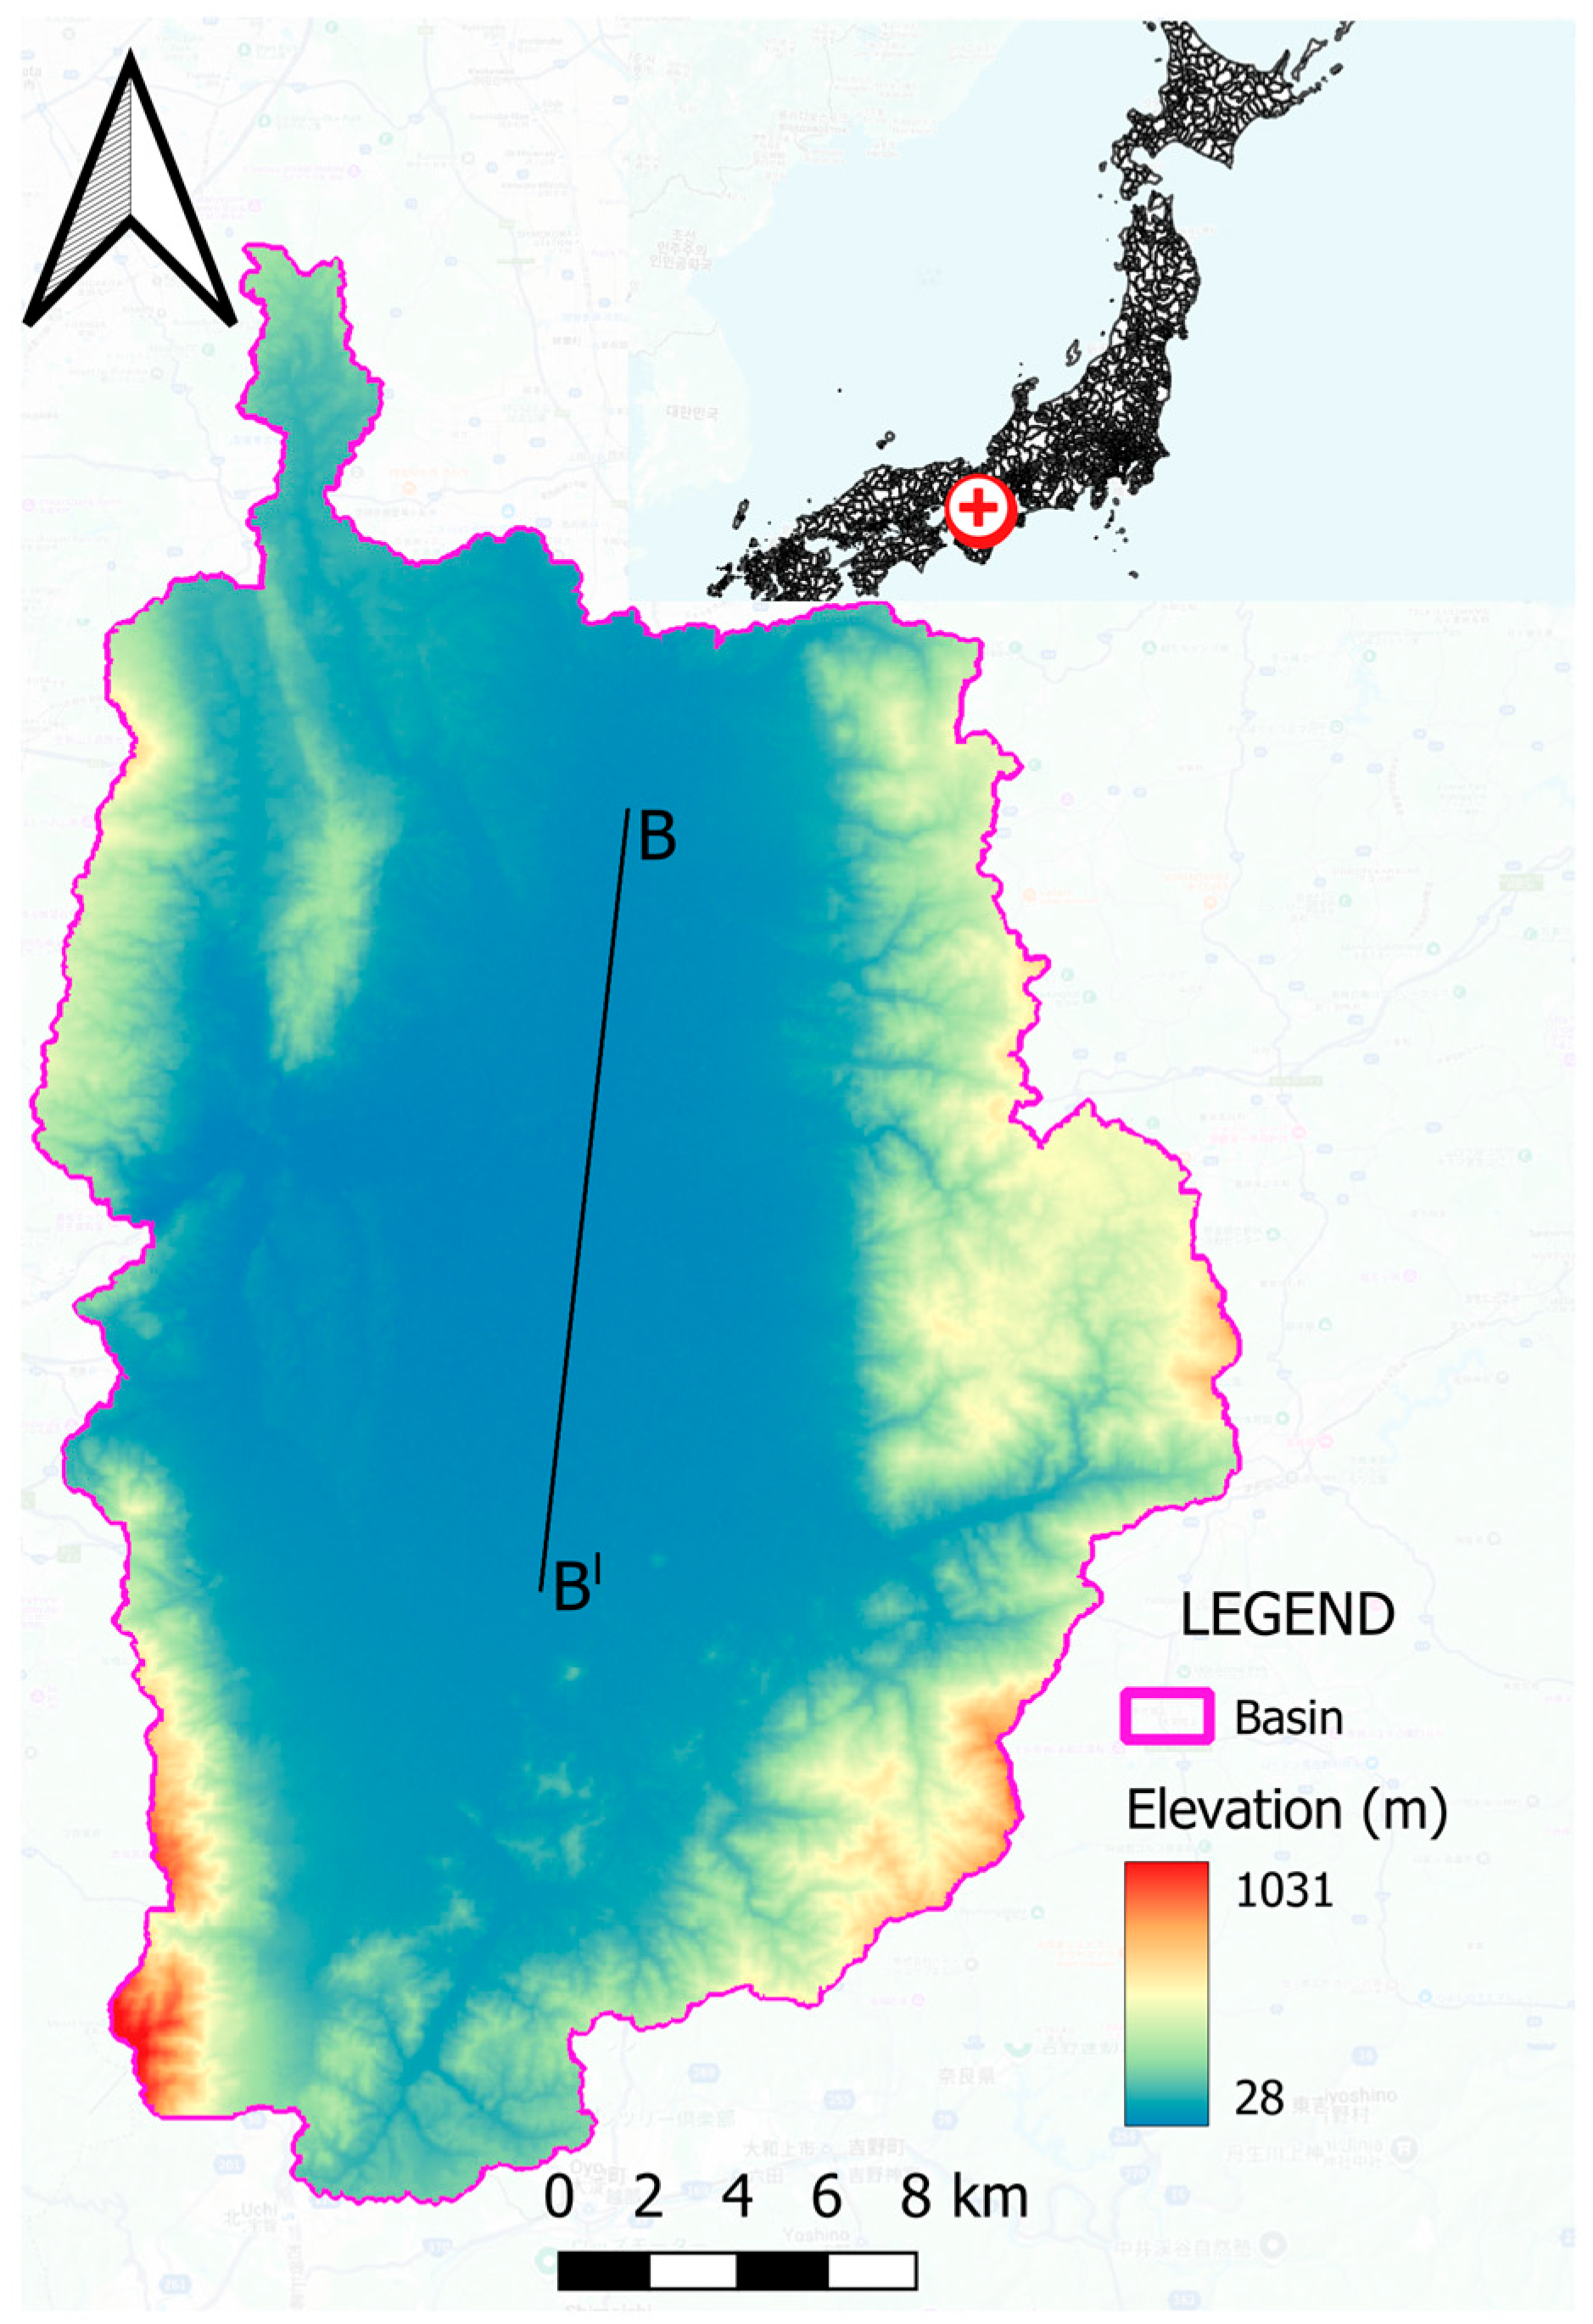
2. Study Area
2.1. Geography of Nara Basin
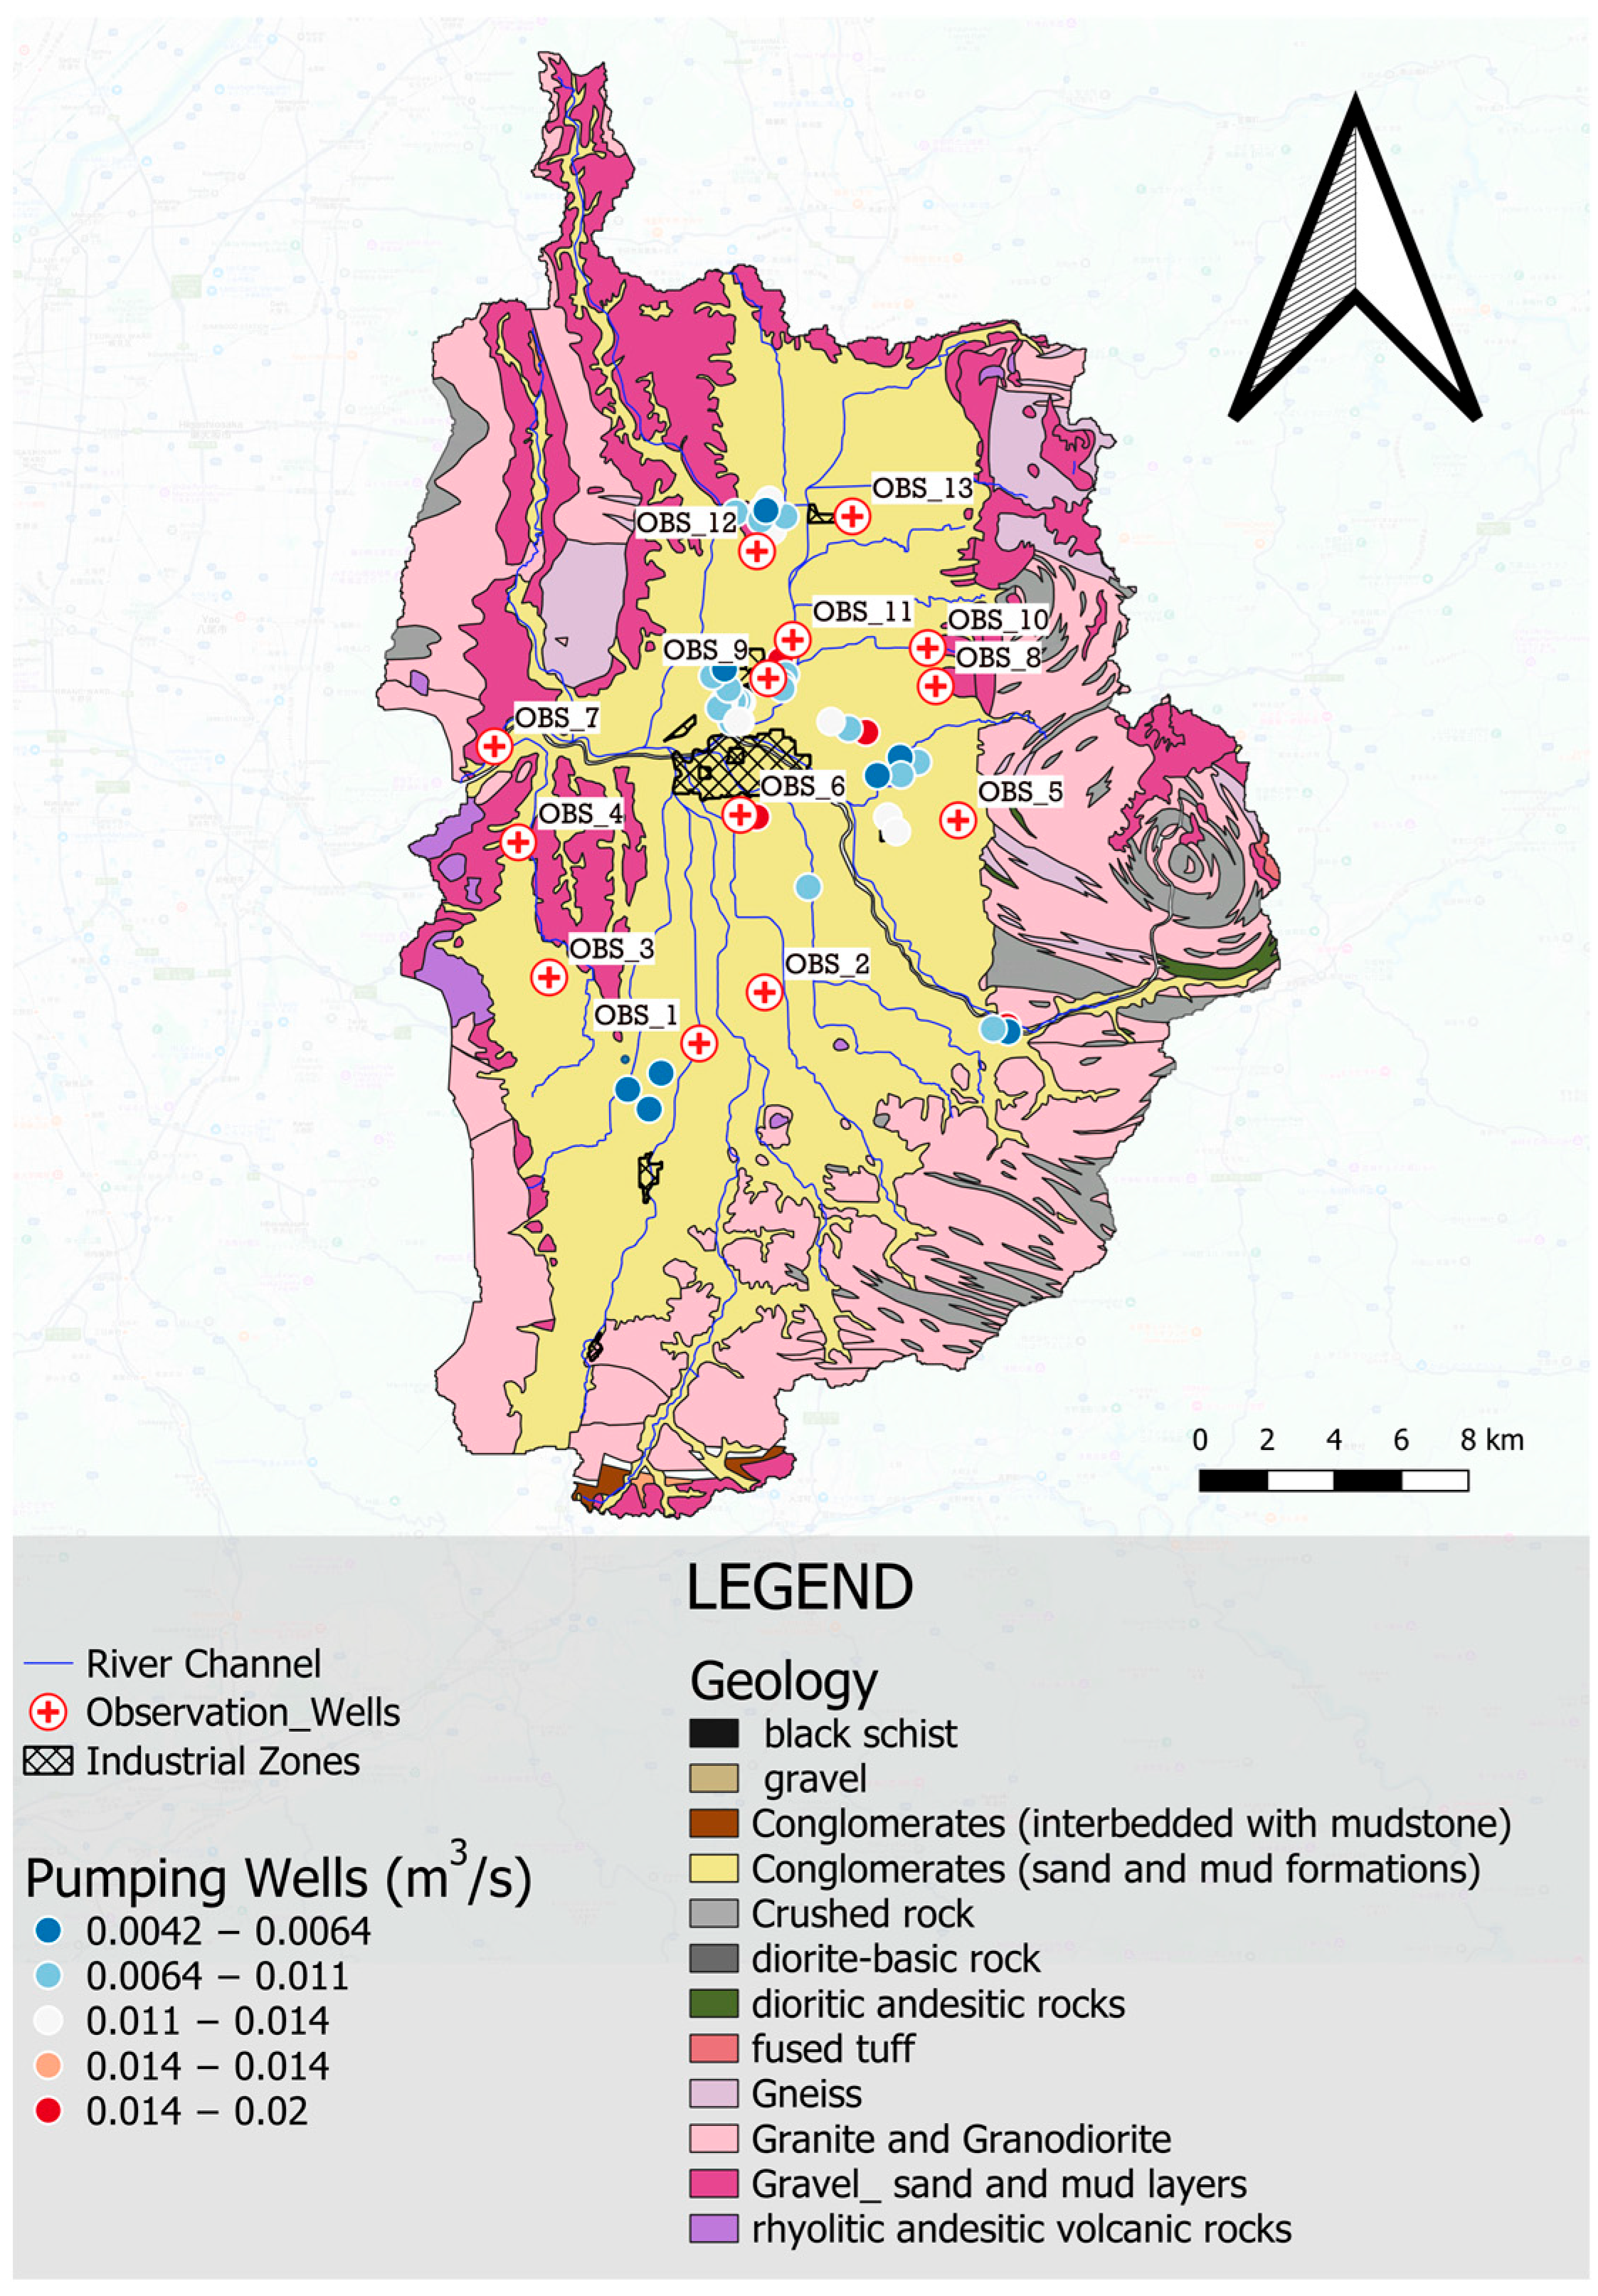
2.2. Hydrogeology of Nara Basin
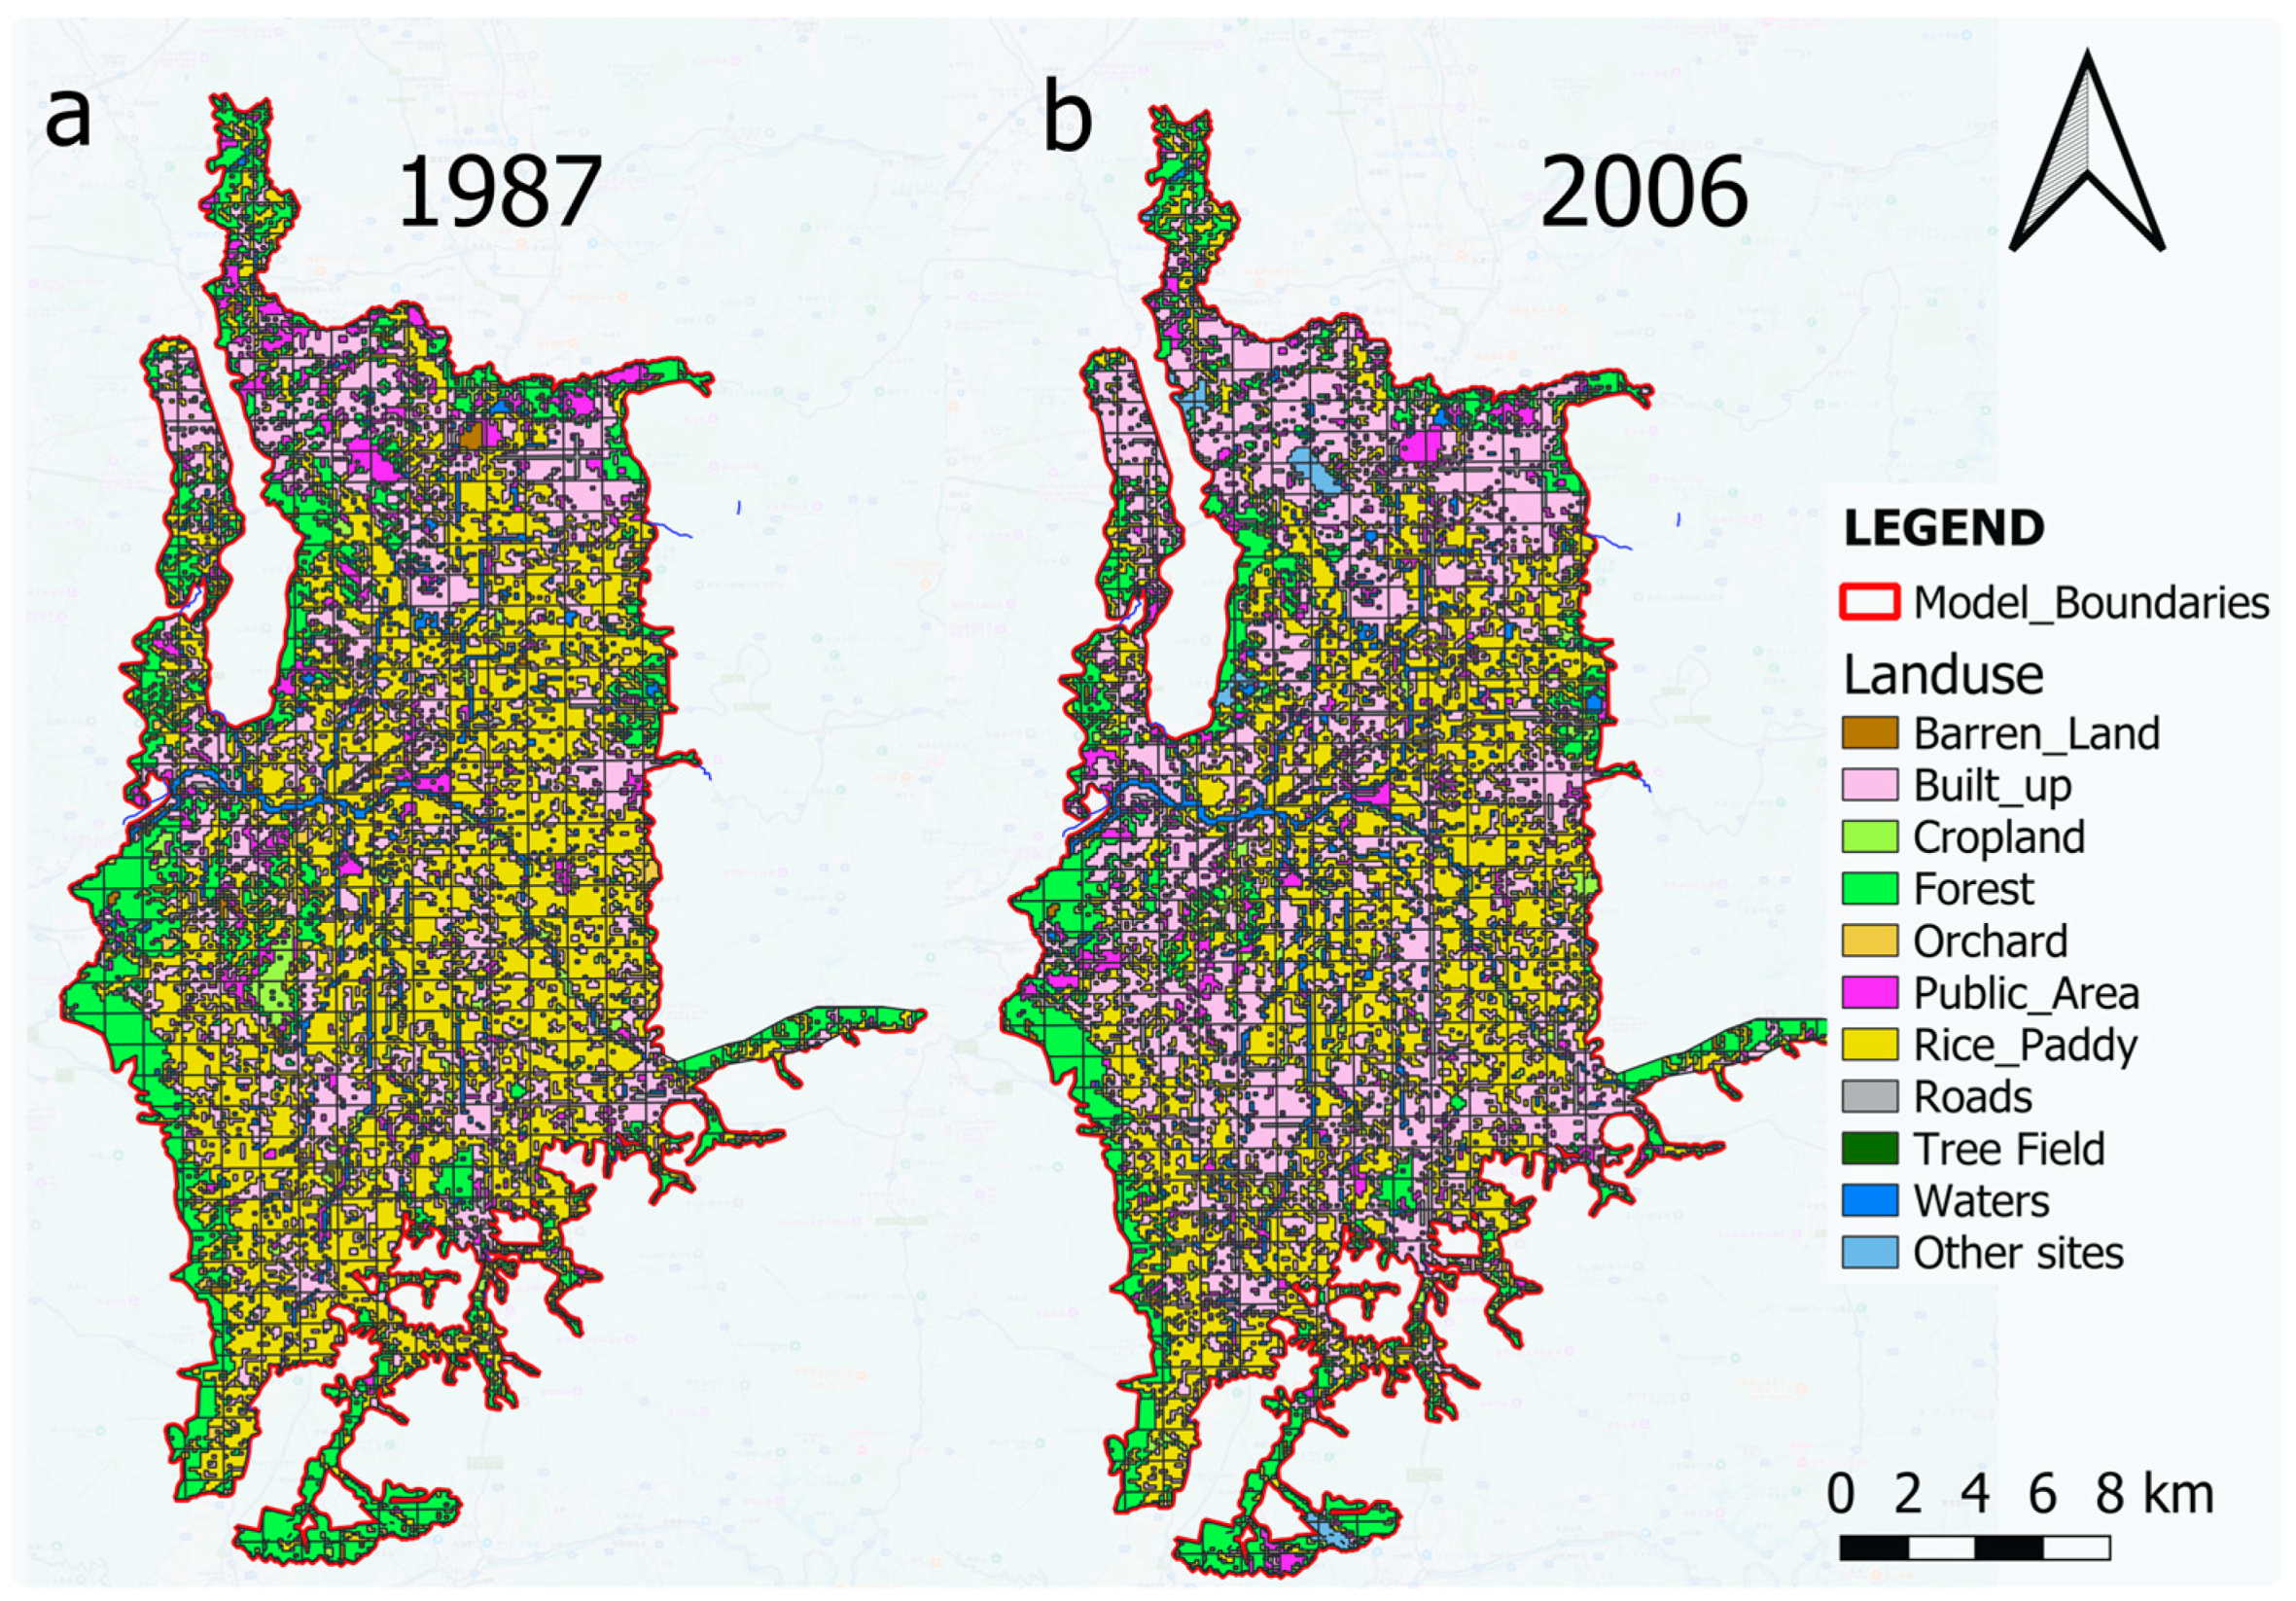
2.3. Land Use Classification of Nara Basin
3. Methods
3.1. Data Collection
3.2. Groundwater Flow Model
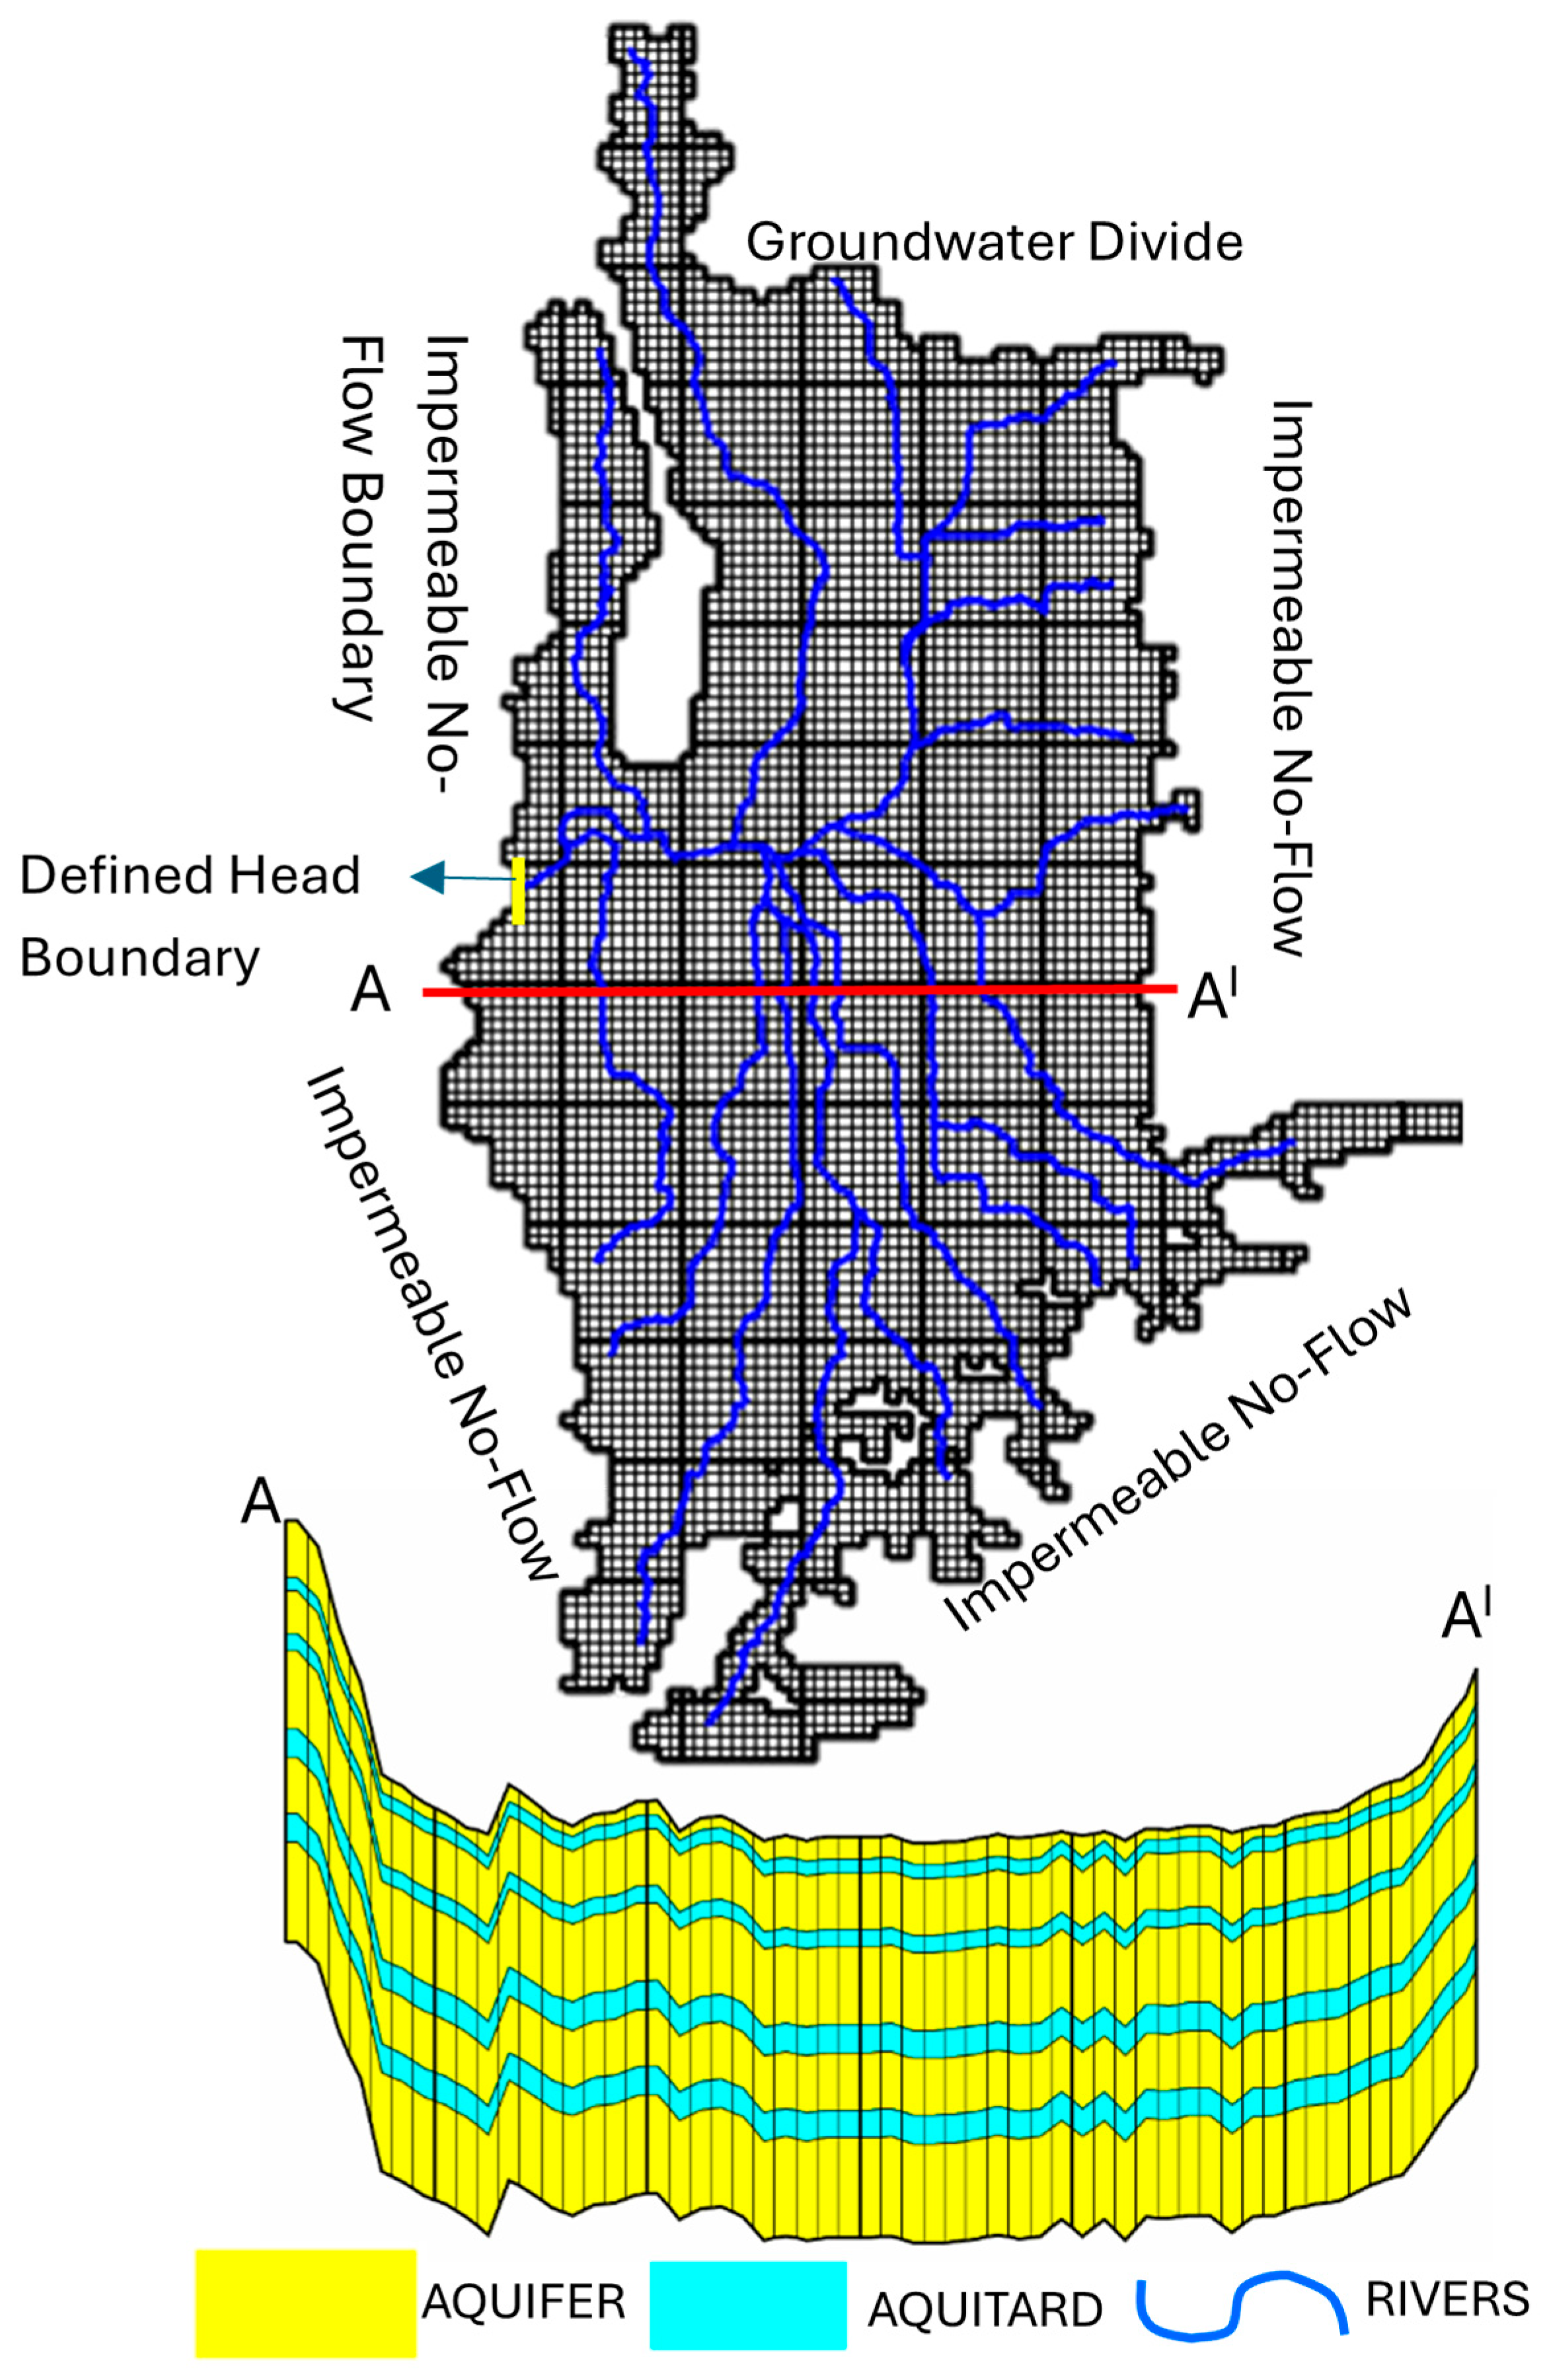
3.2.1. Conceptual Model of Nara Basin
3.2.2. Construction of the Numerical Model
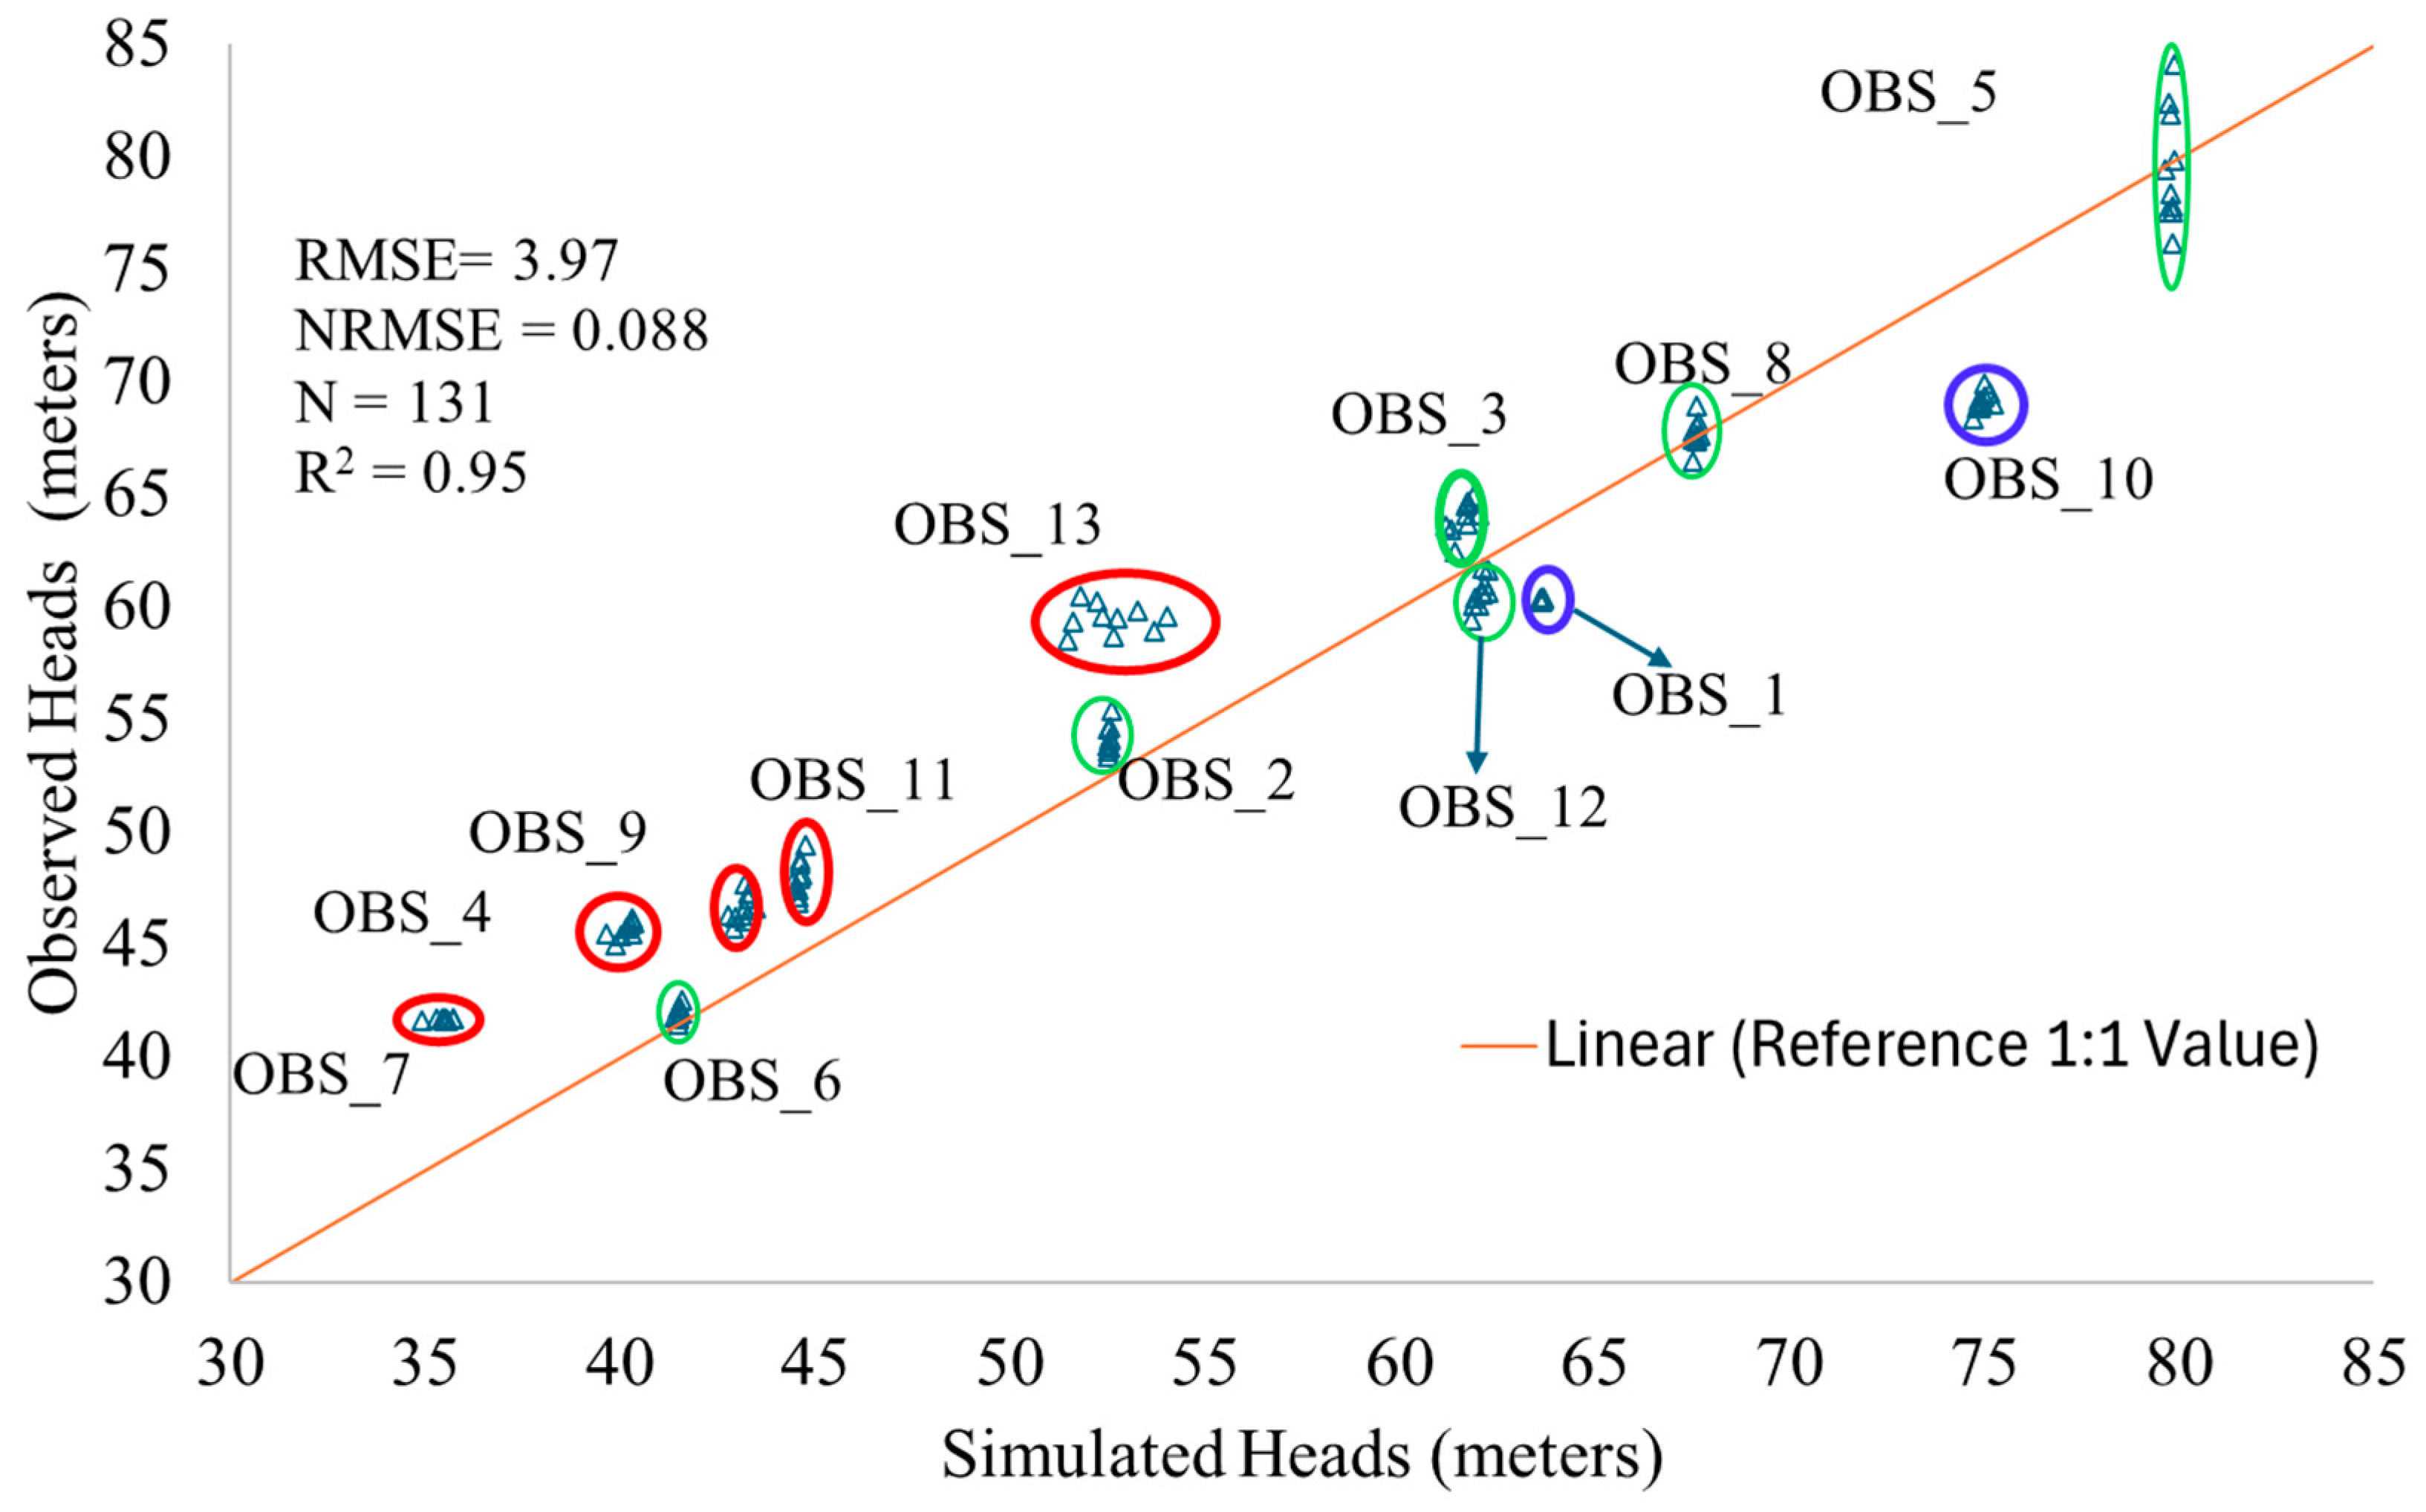
3.2.3. Model Calibration, Performance Evaluation and Sensitivity Analysis
3.2.4. Scenario Analysis for Varying Recharge Input
3.2.5. Evaluation of the Impacts of Climate Variability and Urbanization
4. Results and Discussion
4.1. Estimation of Hydraulic Heads
4.2. Scenario Analysis for the Impact of Varying Recharge Input on Hydraulic Heads
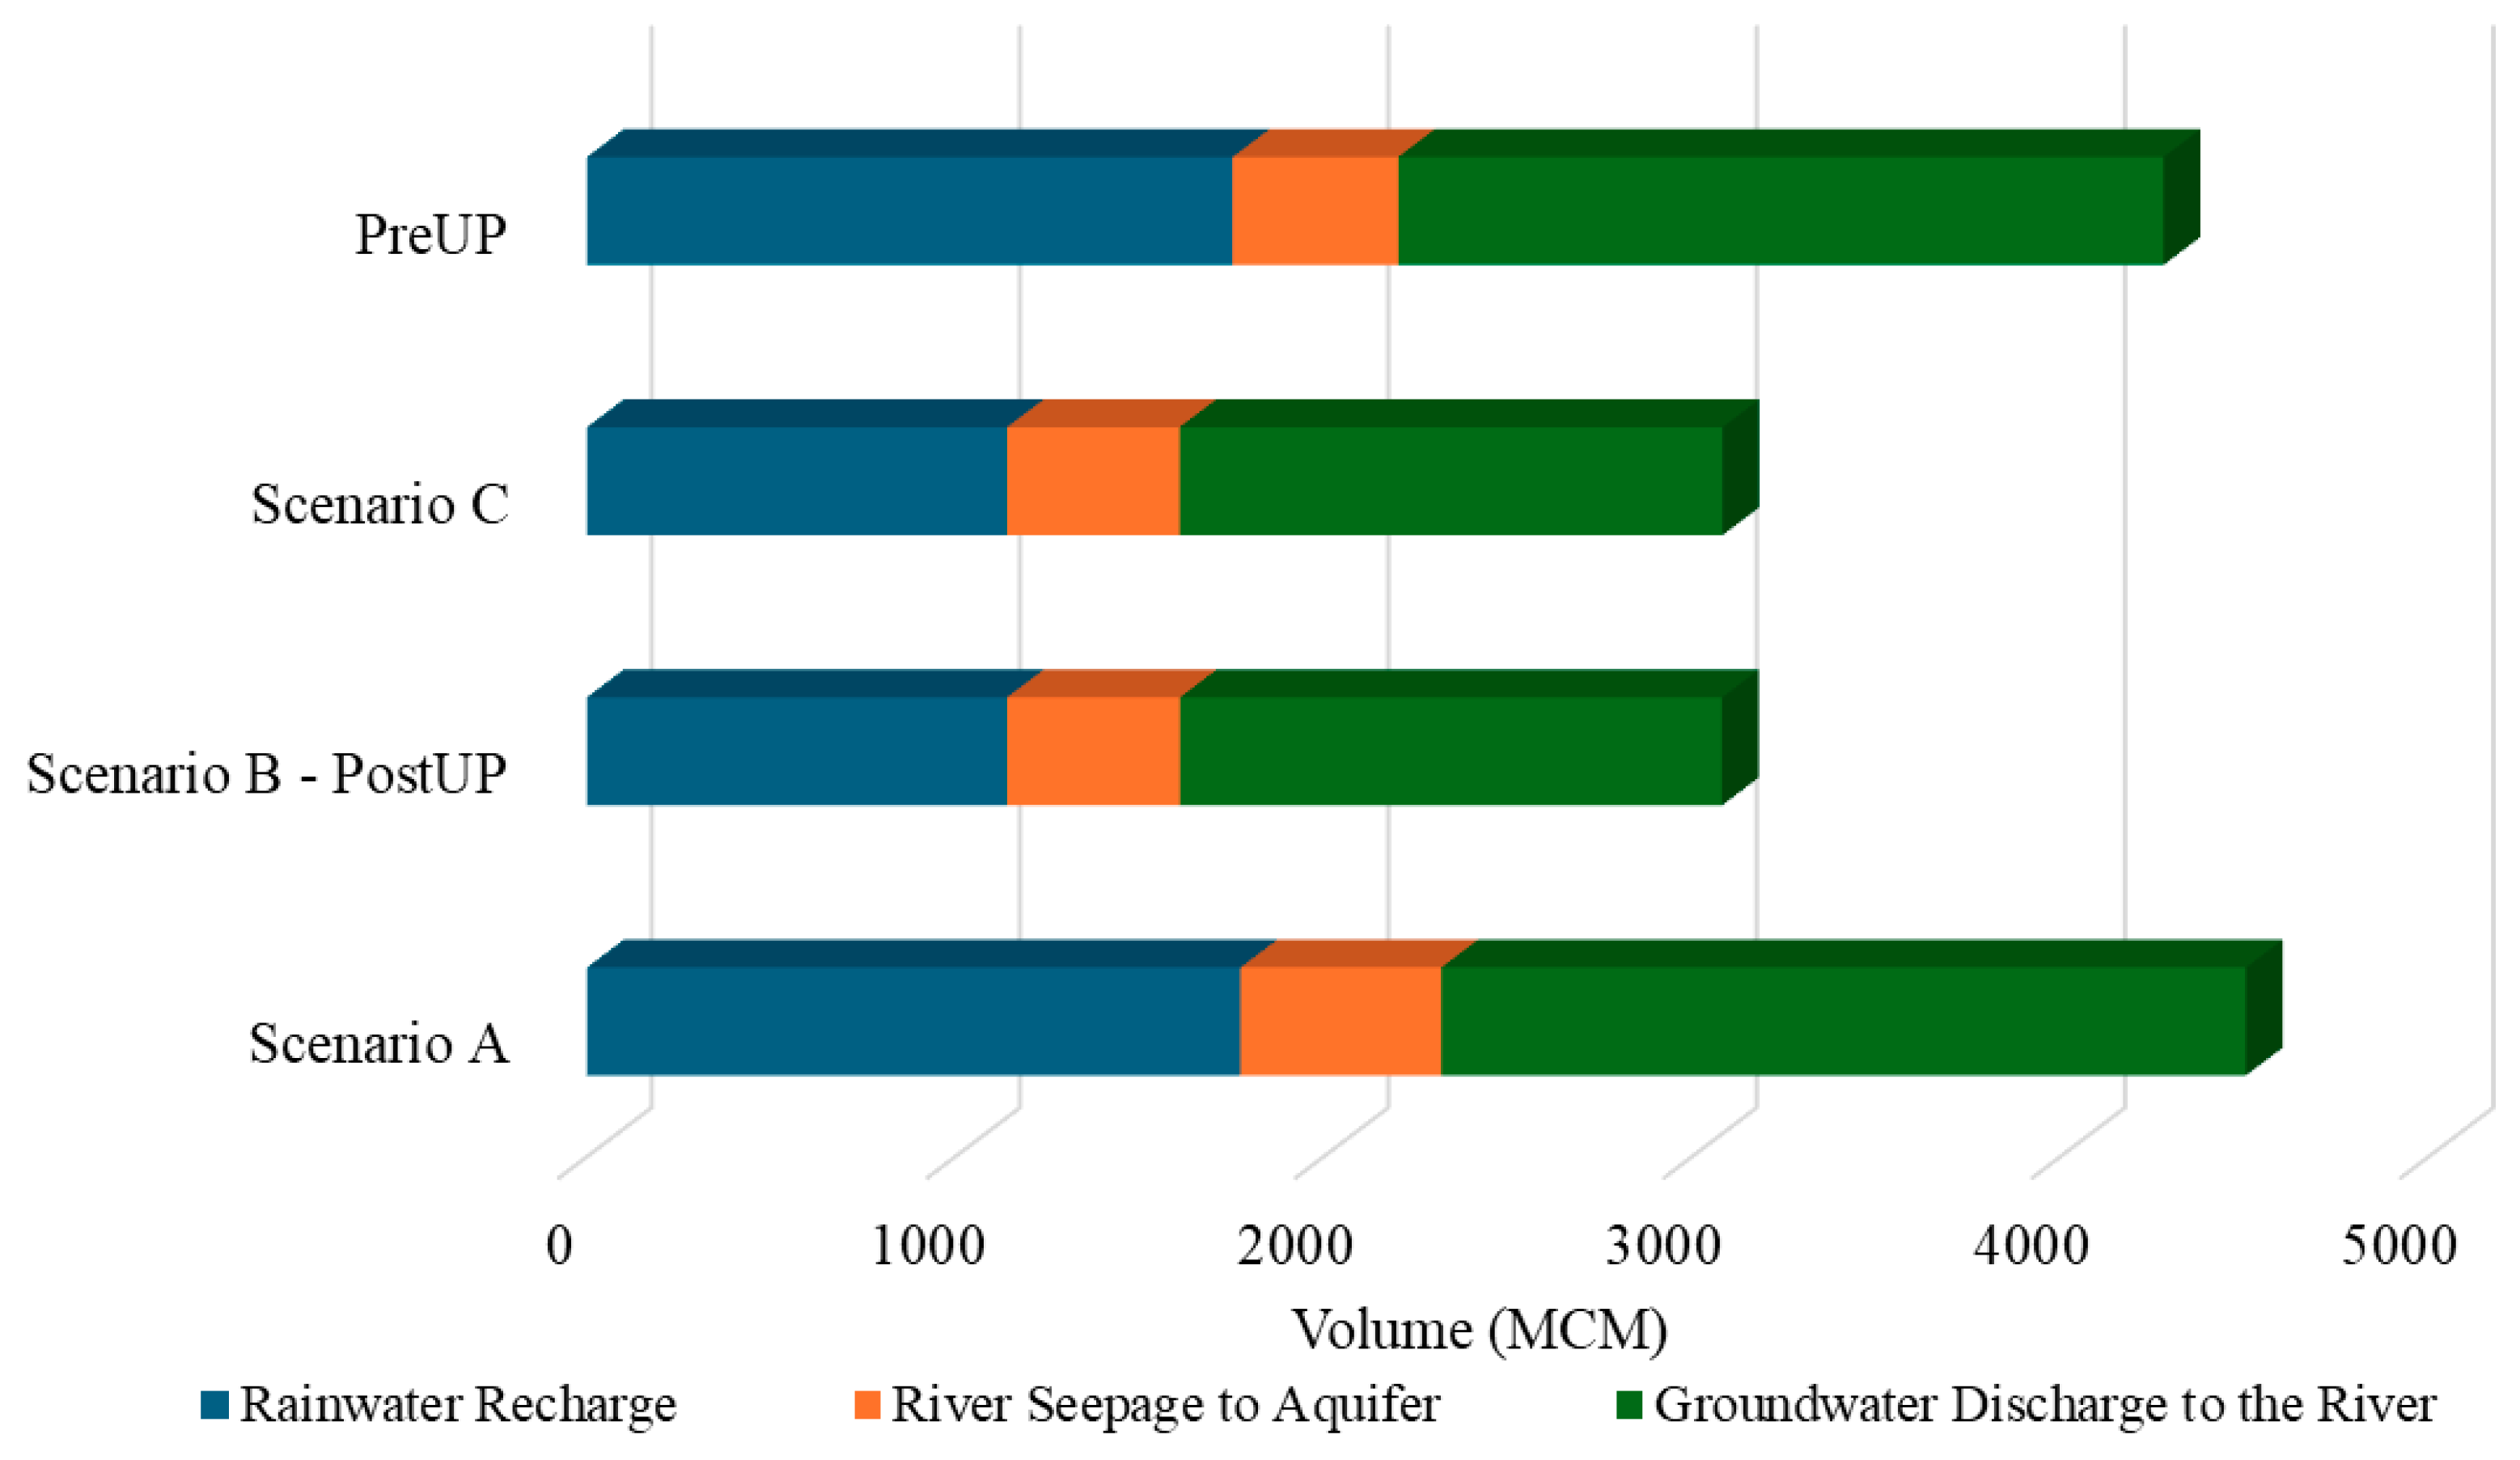
4.3. Impact of Recharge Input on Surface Water and Groundwater (SW-GW) Interactions
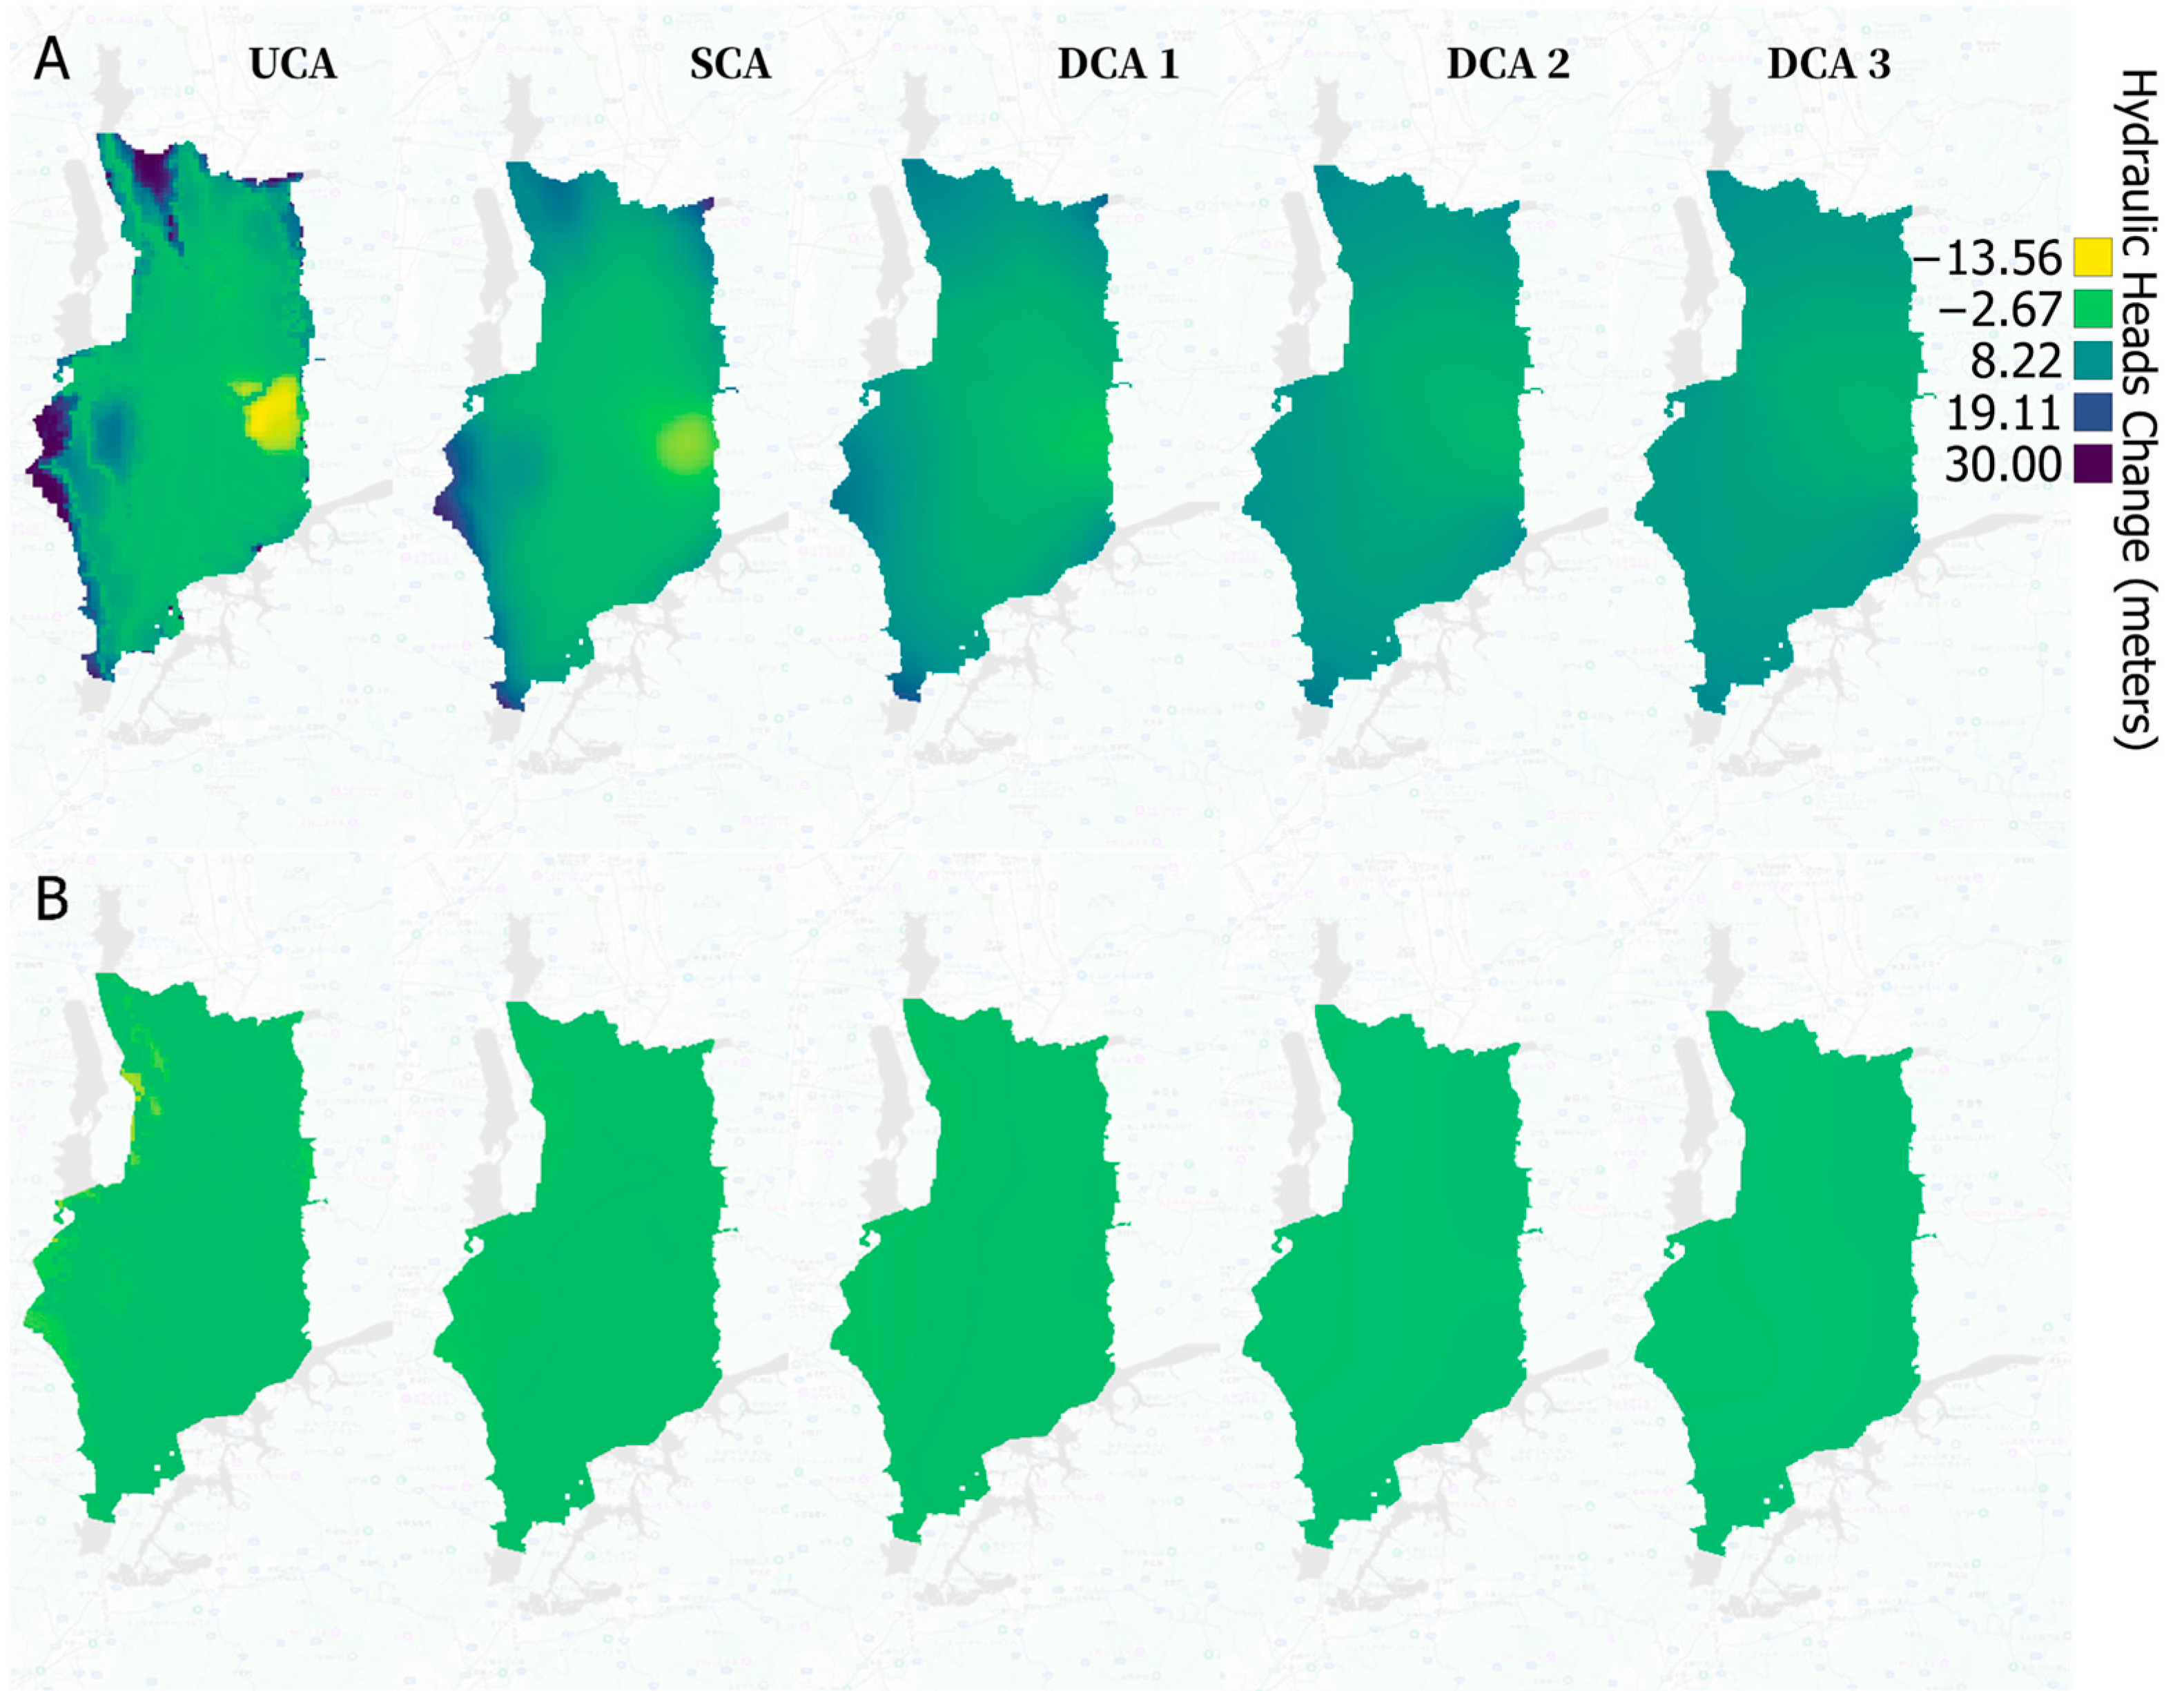
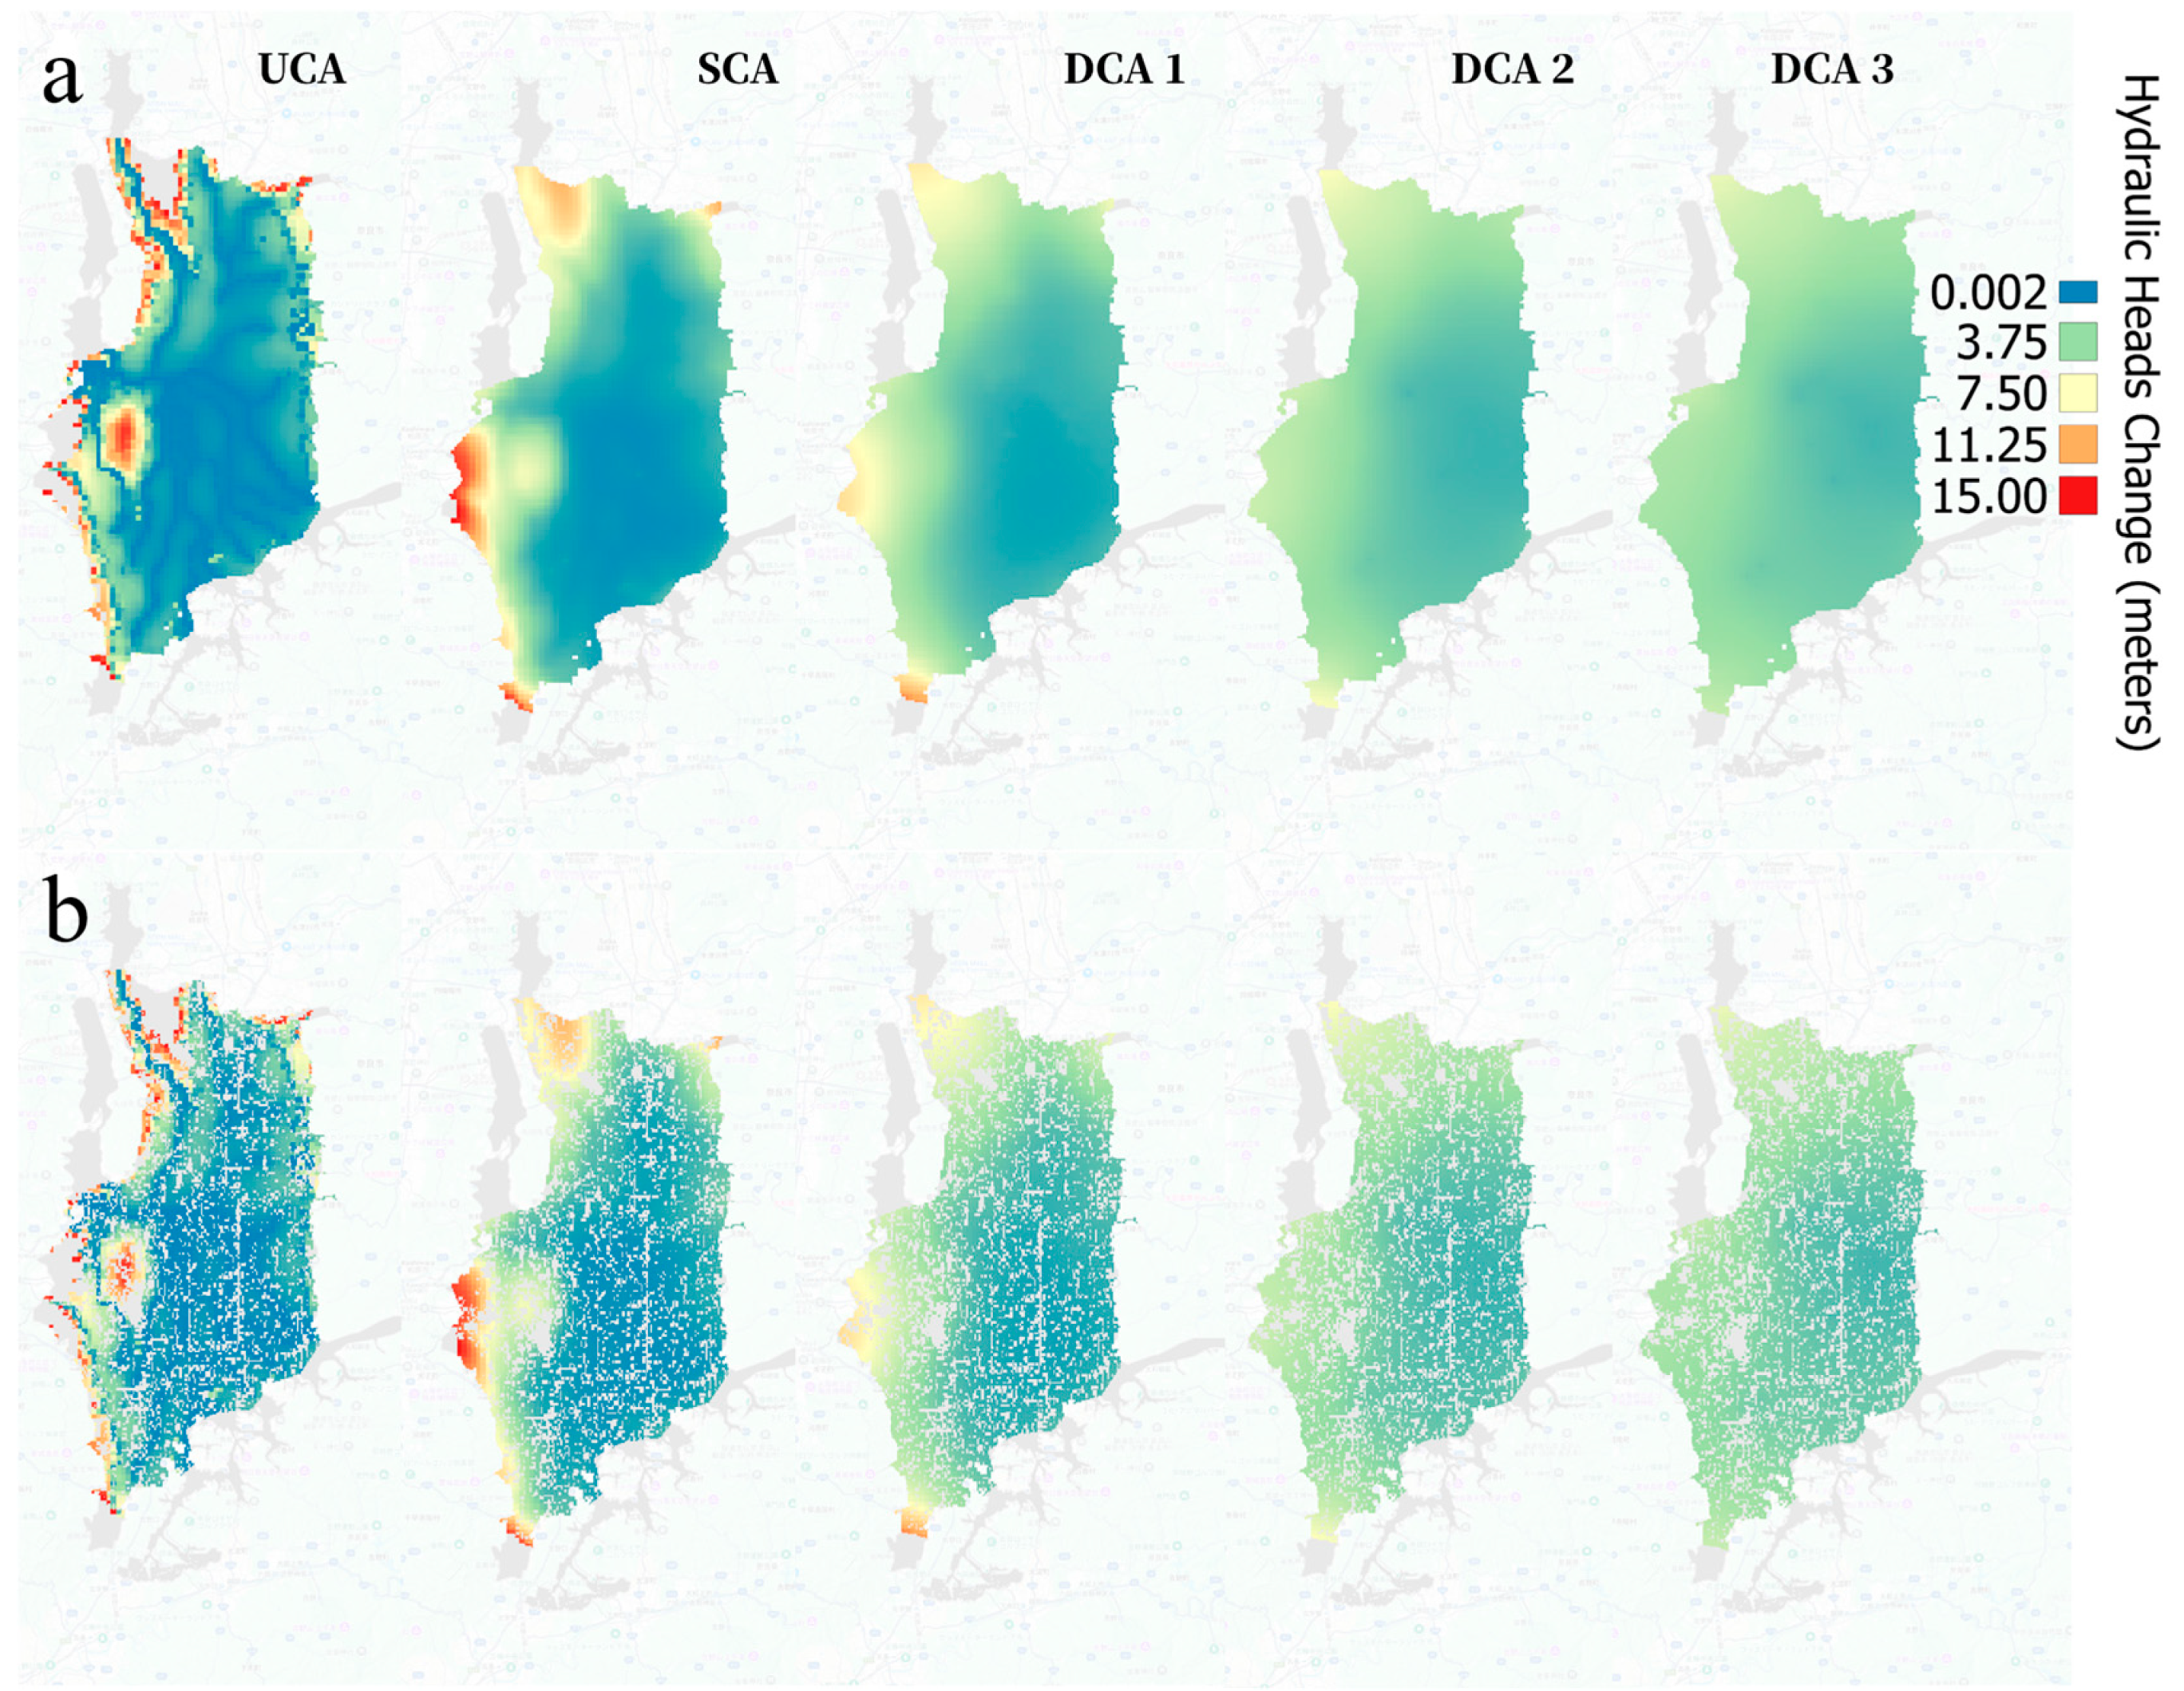
4.4. Effect of Climate Variability and Land Use Change on Hydraulic Heads and SW-GW Interactions
4.5. Limitations and Recommendations
5. Conclusions
Supplementary Materials
Author Contributions
Funding
Data Availability Statement
Acknowledgments
Conflicts of Interest
References
- Jafari, T.; Kiem, A.S.; Javadi, S.; Nakamura, T.; Nishida, K. Fully Integrated Numerical Simulation of Surface Water-Groundwater Interactions Using SWAT-MODFLOW with an Improved Calibration Tool. J. Hydrol. Reg. Stud. 2021, 35, 100822. [Google Scholar] [CrossRef]
- Yusuf, H.A.; Abidakun, O.J.; Makinde, S.B. Evapotranspiration Estimation Using Artificial Neural Network over South-Western Nigeria. J. Eng. Res. Rep. 2020, 17, 16–35. [Google Scholar] [CrossRef]
- World Bank World Population Prospects: 2024 Revision. Available online: https://data.worldbank.org/ (accessed on 14 April 2025).
- Seto, K.C.; Sánchez-Rodríguez, R.; Fragkias, M. The New Geography of Contemporary Urbanization and the Environment. Annu. Rev. Environ. Resour. 2010, 35, 167–194. [Google Scholar] [CrossRef]
- Angel, S.; Parent, J.; Civco, D.L.; Blei, A.; Potere, D. The Dimensions of Global Urban Expansion: Estimates and Projections for All Countries, 2000–2050. Prog. Plan. 2011, 75, 53–107. [Google Scholar] [CrossRef]
- Seto, K.C.; Fragkias, M.; Güneralp, B.; Reilly, M.K. A Meta-Analysis of Global Urban Land Expansion. PLoS ONE 2011, 6, e23777. [Google Scholar] [CrossRef]
- Grimm, N.B.; Faeth, S.H.; Golubiewski, N.E.; Redman, C.L.; Wu, J.; Bai, X.; Briggs, J.M. Global Change and the Ecology of Cities. Science 2008, 319, 756–760. [Google Scholar] [CrossRef]
- Seto, K.C.; Güneralp, B.; Hutyra, L.R. Global Forecasts of Urban Expansion to 2030 and Direct Impacts on Biodiversity an Carbon Pools. Proc. Natl. Acad. Sci. USA 2012, 109, 16083–16088. [Google Scholar] [CrossRef]
- Davamani, V.; John, J.E.; Poornachandhra, C.; Gopalakrishnan, B.; Arulmani, S.; Parameswari, E.; Santhosh, A.; Srinivasulu, A.; Lal, A.; Naidu, R. A Critical Review of Climate Change Impacts on Groundwater Resources: A Focus on the Current Status, Future Possibilities, and Role of Simulation Models. Atmosphere 2024, 15, 122. [Google Scholar] [CrossRef]
- Wang, K.; Onodera, S.; Saito, M.; Shimizu, Y. Long-Term Variations in Water Balance by Increase in Percent Imperviousness of Urban Regions. J. Hydrol. 2021, 602, 126767. [Google Scholar] [CrossRef]
- Jyrkama, M.I.; Sykes, J.F. The Impact of Climate Change on Spatially Varying Groundwater Recharge in the Grand River Watershed (Ontario). J. Hydrol. 2007, 338, 237–250. [Google Scholar] [CrossRef]
- Oki, T.; Kanae, S. Global Hydrological Cycles and World Water Resources. Science 2006, 313, 1068–1072. [Google Scholar] [CrossRef]
- Shao, G.; Guan, Y.; Zhang, D.; Yu, B.; Zhu, J. The Impacts of Climate Variability and Land Use Change on Streamflow in the Hailiutu River Basin. Water 2018, 10, 814. [Google Scholar] [CrossRef]
- Yoshioka, Y.; Nakamura, K.; Horino, H.; Kawashima, S. Numerical Assessments of the Impacts of Climate Change on Regional Groundwater Systems in a Paddy-Dominated Alluvial Fan. Paddy Water Environ. 2016, 14, 93–103. [Google Scholar] [CrossRef]
- Crosbie, R.S.; Scanlon, B.R.; Mpelasoka, F.S.; Reedy, R.C.; Gates, J.B.; Zhang, L. Potential Climate Change Effects on Groundwater Recharge in the High Plains Aquifer, USA. Water Resour. Res. 2013, 49, 3936–3951. [Google Scholar] [CrossRef]
- Goderniaux, P.; Brouyére, S.; Blenkinsop, S.; Burton, A.; Fowler, H.J.; Orban, P.; Dassargues, A. Modeling Climate Change Impacts on Groundwater Resources Using Transient Stochastic Climatic Scenarios. Water Resour. Res. 2011, 47, W12516. [Google Scholar] [CrossRef]
- Scibek, J.; Allen, D.M. Modeled Impacts of Predicted Climate Change on Recharge and Groundwater Levels. Water Resour. Res. 2006, 42, 11405. [Google Scholar] [CrossRef]
- Pulido-Velazquez, M.; Peña-Haro, S.; García-Prats, A.; Mocholi-Almudever, A.F.; Henriquez-Dole, L.; Macian-Sorribes, H.; Lopez-Nicolas, A. Integrated Assessment of the Impact of Climate and Land Use Changes on Groundwater Quantity and Quality in the Mancha Oriental System (Spain). Hydrol. Earth Syst. Sci. 2015, 19, 1677–1693. [Google Scholar] [CrossRef]
- Wang, K.; Onodera, S.; Saito, M.; Shimizu, Y.; Iwata, T. Effects of Forest Growth in Different Vegetation Communities on Forest Catchment Water Balance. Sci. Total Environ. 2022, 809, 151159. [Google Scholar] [CrossRef]
- Zhang, A.; Zhang, C.; Fu, G.; Wang, B.; Bao, Z.; Zheng, H. Assessments of Impacts of Climate Change and Human Activities on Runoff with SWAT for the Huifa River Basin, Northeast China. Water Resour. Manag. 2012, 26, 2199–2217. [Google Scholar] [CrossRef]
- Wang, K.; Onodera, S.; Saito, M.; Shimizu, Y. Assessment of Nitrogen Budget in Detailed Spatial Pattern Using High Precision Modeling Approach with Constructed Accurate Agricultural Behavior. Sci. Total Environ. 2024, 912, 169631. [Google Scholar] [CrossRef]
- Kimbi, S.B.; Onodera, S.; Wang, K.; Kaihotsu, I.; Shimizu, Y. Assessing the Impact of Urbanization and Climate Change on Hydrological Processes in a Suburban Catchment. Environments 2024, 11, 225. [Google Scholar] [CrossRef]
- Gebru, H.; Gebreyohannes, T.; Hagos, E.; Perilli, N. Hydrogeological Assessment and Steady-State Groundwater Flow Modeling for Groundwater Management in the Golina River Sub-Basin, Northern Ethiopia, Using MODFLOW 6. Water 2025, 17, 949. [Google Scholar] [CrossRef]
- Behera, A.K.; Pradhan, R.M.; Kumar, S.; Chakrapani, G.J.; Kumar, P. Assessment of Groundwater Flow Dynamics Using MODFLOW in Shallow Aquifer System of Mahanadi Delta (East Coast), India. Water 2022, 14, 611. [Google Scholar] [CrossRef]
- Narayana Loukika, K.; Keesara, V.R.; Buri, E.S.; Sridhar, V.; Ndehedehe, C.E.; Sarker, S.; Pramada, S.K. Spatiotemporal Variations of Surface and Groundwater Interactions under Climate and Land Use Land Cover Change Scenarios. Front. Water 2025, 6, 1516031. [Google Scholar] [CrossRef]
- Fiorese, G.D.; Balacco, G.; Bruno, G.; Nikolaidis, N. Hydrogeological Modelling of a Coastal Karst Aquifer Using an Integrated SWAT-MODFLOW Approach. Environ. Model. Softw. 2025, 183, 106249. [Google Scholar] [CrossRef]
- Langevin, C.D.; Hughes, J.D.; Banta, E.R.; Niswonger, R.G.; Panday, S.; Provost, A.M. Documentation for the MODFLOW 6 Groundwater Flow Model; US Geological Survey: Reston, VA, USA, 2017. [Google Scholar] [CrossRef]
- Fujinaga, K. Yamato Water Story_ In Search of Stable Water. J. Jpn. Soc. Irrig. Drain. Crop Sci. 1998, 66, 623–630. [Google Scholar] [CrossRef]
- Japan Meteorological Agency. Available online: https://www.jma.go.jp/jma/indexe.html (accessed on 17 April 2025).
- Pathak, D. Groundwater Flow Modeling in an Intermontane Basin. J. Nepal Geol. Soc. 2015, 49, 7–15. [Google Scholar] [CrossRef]
- Taniguchi, M. Analysing the Long Term Reduction in Groundwater Temperature Due to Pumping. Hydrol. Sci. J. 1995, 40, 407–421. [Google Scholar] [CrossRef]
- National Spatial Planning and Regional Policy Bureau, M. of J. National Groundwater Data Register Survey. Available online: https://nlftp.mlit.go.jp/kokjo/inspect/landclassification/water/f9_exp.html (accessed on 24 April 2025).
- Pathak, D. Hydrogeology of Shallow and Deep Aquifers in Nara Basin, West Japan. J. Nepal Geol. Soc. 2011, 43, 267–276. [Google Scholar] [CrossRef]
- Geospatial Information Authority of Japan National Land Digital Information Land Use 3rd Mesh Data. Available online: https://nlftp.mlit.go.jp/ksj/gml/datalist/KsjTmplt-L03-a-2021.html (accessed on 16 June 2025).
- Osaka Prefecture. History of Ikoma Forests. 2021. Available online: https://www.pref.osaka.lg.jp/o120160/chubunm/chubu_nm/ryokuti17.html (accessed on 23 May 2025).
- Nara Perfecture Trees’ Story in Nara. Available online: https://naranoki.pref.nara.jp/about/ (accessed on 16 April 2025).
- Pathak, D. Heat Flow and Vertical Groundwater Flux in Deep Fractured Basement Rock in Nara Basin, Southwest Japan. J. Nepal Geol. Soc. 2003, 28, 101–111. [Google Scholar] [CrossRef]
- Taniguchi, M. Estimated Recharge Rates from Groundwater Temperatures in the Nara Basin, Japan. Appl. Hydrogeol. 1994, 2, 7–14. [Google Scholar] [CrossRef]
- U.S Geological Survey, Shuttle Radar Topography Mission (SRTM). Available online: https://www.usgs.gov/centers/eros/science/usgs-eros-archive-digital-elevation-shuttle-radar-topography-mission-srtm-1?qt-science_center_objects=0#qt-science_center_objects (accessed on 23 May 2025).
- Ministry of Land, Infrastructure, Transport and Tourism, Japan. Land Classification Basic Survey 1:200,000. Available online: https://nlftp.mlit.go.jp/kokjo/inspect/landclassification/download.html (accessed on 21 April 2025).
- Nara Prefecture River Information System. Available online: http://www.kasen.pref.nara.jp/gispub/info/top/menu (accessed on 21 April 2025).
- Japan Aerospace Exploration Agency (JAXA) Earth Observation Research Center (EORC) High-Resolution Land-Use and Land-Cover Map of Japan [2014∼2016]. Available online: https://www.eorc.jaxa.jp/ALOS/en/dataset/lulc/lulc_v1803_e.htm (accessed on 21 April 2025).
- Nara Prefecture Waterworks Corporation Water Departments of Municipalities in Nara Prefecture. Available online: https://www.pref.nara.jp/6829.htm (accessed on 25 April 2025).
- Yamatotakada City Water Supply. Available online: https://www.city.yamatotakada.nara.jp/soshikikarasagasu/suidosomuka/jogesuido/index.html (accessed on 25 April 2025).
- Geospatial Information Authority of Japan National Land Information. Available online: https://www.kunijiban.pwri.go.jp/jp/ (accessed on 21 April 2025).
- Ministry of Land, Infrastructure, Transport and Tourism, Japan, Water Information System. Available online: https://www.river.go.jp/index (accessed on 23 May 2025).
- Doherty, J.E.; Hunt, R.J. Approaches to Highly Parameterized Inversion—A Guide to Using PEST for Groundwater-Model Calibration; Scientific Investigations Report; US Geological Survey: Reston, VA, USA, 2010. [Google Scholar] [CrossRef]
- Awan, U.K.; Tischbein, B.; Martius, C. Combining Hydrological Modeling and GIS Approaches to Determine the Spatial Distribution of Groundwater Recharge in an Arid Irrigation Scheme. Irrig. Sci. 2013, 31, 793–806. [Google Scholar] [CrossRef]
- Hartmann, A.; Gleeson, T.; Wada, Y.; Wagener, T. Enhanced Groundwater Recharge Rates and Altered Recharge Sensitivity to Climate Variability through Subsurface Heterogeneity. Proc. Natl. Acad. Sci. USA 2017, 114, 2842–2847. [Google Scholar] [CrossRef]
- Toure, A.; Diekkrüger, B.; Mariko, A. Impact of Climate Change on Groundwater Resources in the Klela Basin, Southern Mali. Hydrology 2016, 3, 17. [Google Scholar] [CrossRef]
- Cui, Y.; Liao, Z.; Wei, Y.; Xu, X.; Song, Y.; Liu, H. The Response of Groundwater Level to Climate Change and Human Activities in Baotou City, China. Water 2020, 12, 1078. [Google Scholar] [CrossRef]
- Rusli, S.R.; Bense, V.F.; Mustafa, S.M.T.; Weerts, A.H. The Impact of Future Changes in Climate Variables and Groundwater Abstraction on Basin-Scale Groundwater Availability. Hydrol. Earth Syst. Sci. 2024, 28, 5107–5131. [Google Scholar] [CrossRef]
- Nara Prefecture Waterworks Corporation History of Water. Available online: https://www.pref.nara.jp/7042.htm (accessed on 21 April 2025).


| Pervious Surfaces | Impervious Surfaces |
|---|---|
| Rice Paddy | Built-up (urban) |
| Croplands | Barren-Land (Rocks) |
| Orchards | Roads |
| Tree Fields | Public Area |
| Forest | Other sites |
Disclaimer/Publisher’s Note: The statements, opinions and data contained in all publications are solely those of the individual author(s) and contributor(s) and not of MDPI and/or the editor(s). MDPI and/or the editor(s) disclaim responsibility for any injury to people or property resulting from any ideas, methods, instructions or products referred to in the content. |
© 2025 by the authors. Licensee MDPI, Basel, Switzerland. This article is an open access article distributed under the terms and conditions of the Creative Commons Attribution (CC BY) license (https://creativecommons.org/licenses/by/4.0/).
Share and Cite
Abidakun, O.J.; Saito, M.; Onodera, S.-i.; Wang, K. Impacts of Urbanization and Climate Variability on Groundwater Environment in a Basin Scale. Hydrology 2025, 12, 173. https://doi.org/10.3390/hydrology12070173
Abidakun OJ, Saito M, Onodera S-i, Wang K. Impacts of Urbanization and Climate Variability on Groundwater Environment in a Basin Scale. Hydrology. 2025; 12(7):173. https://doi.org/10.3390/hydrology12070173
Chicago/Turabian StyleAbidakun, Olawale Joshua, Mitsuyo Saito, Shin-ichi Onodera, and Kunyang Wang. 2025. "Impacts of Urbanization and Climate Variability on Groundwater Environment in a Basin Scale" Hydrology 12, no. 7: 173. https://doi.org/10.3390/hydrology12070173
APA StyleAbidakun, O. J., Saito, M., Onodera, S.-i., & Wang, K. (2025). Impacts of Urbanization and Climate Variability on Groundwater Environment in a Basin Scale. Hydrology, 12(7), 173. https://doi.org/10.3390/hydrology12070173